Mc Lean County Investment Properties for Sale
Browse homes for sale and investment properties in Mc Lean County. Refine your search by price, property type, or more.
Best cash flowing properties in Mc Lean County
Active
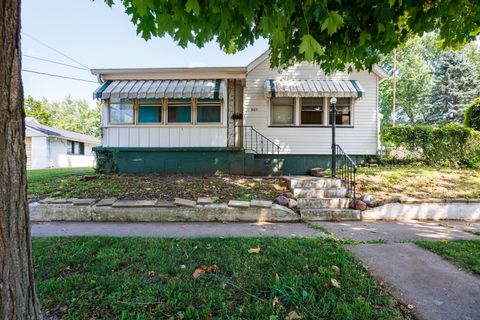
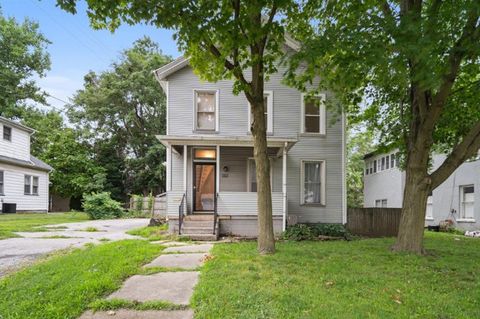
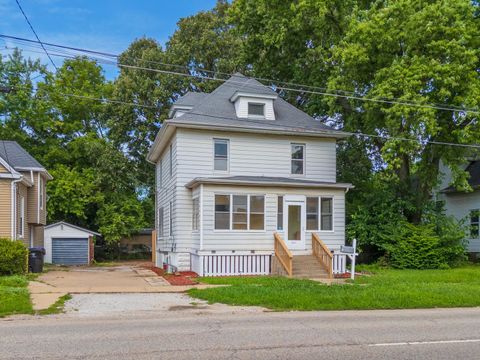
$95,000
2
bds
|
2
ba
|
1,985
sqft
|
built
1900
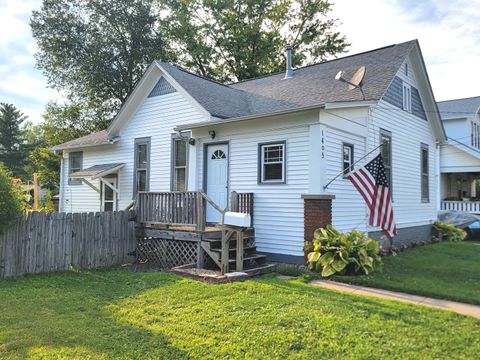
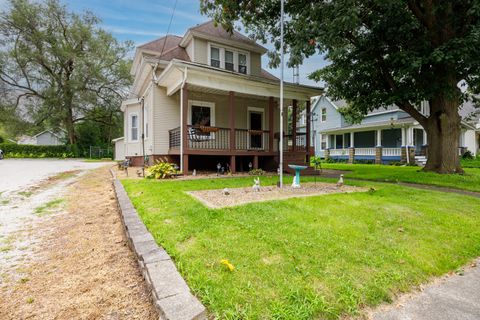
807 N Western Ave, Bloomington, IL 61701
$585
Cash flow
32.1%
Cash-on-Cash Return
13.1%
Cap rate
1.9%
Rent to Value Ratio
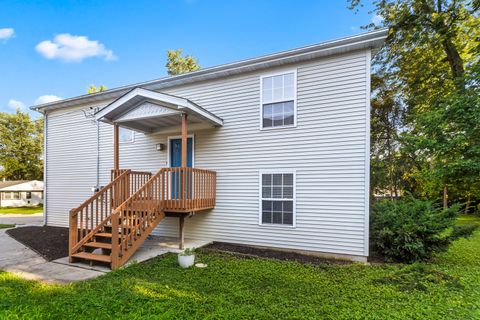
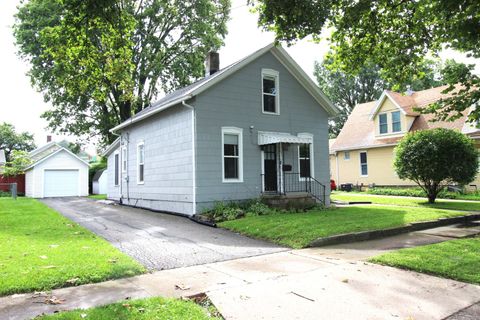
Active
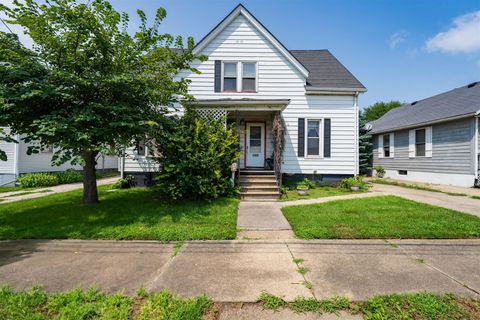
$110,000
4
bds
|
1
ba
|
1,451
sqft
|
built
1900
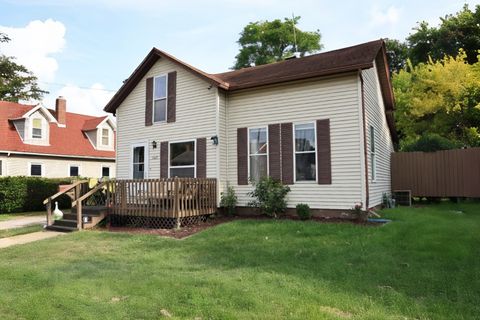
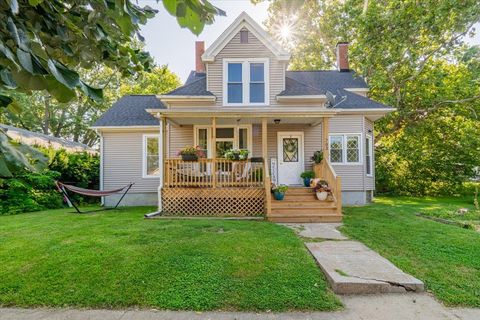
1405 W Mulberry St, Bloomington, IL 61701
$561
Cash flow
26.6%
Cash-on-Cash Return
11.8%
Cap rate
1.5%
Rent to Value Ratio
131 out of 145 properties for sale in Mc Lean County
Limited Results Shown
Create a free account, or log in to reveal all property listings and enjoy the complete experience.
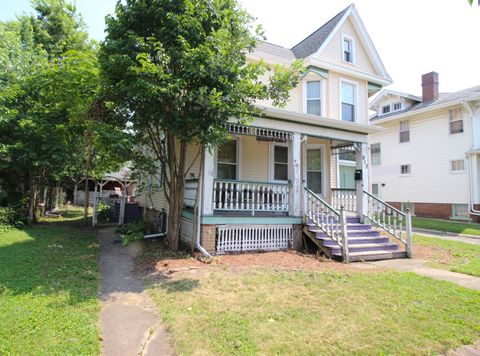
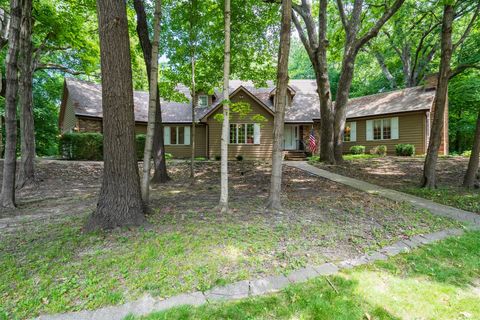
Active
$149,900
3
bds
|
2
ba
|
1,512
sqft
|
built
1897
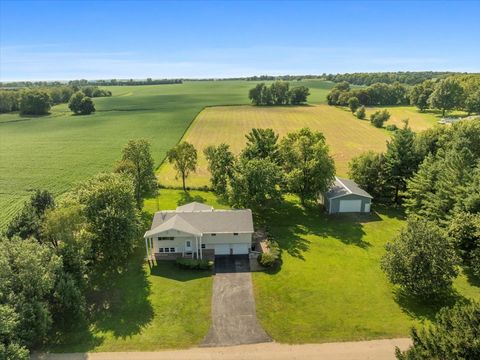
912 S Madison St, Bloomington, IL 61701
$395
Cash flow
13.7%
Cash-on-Cash Return
8.8%
Cap rate
1.3%
Rent to Value Ratio
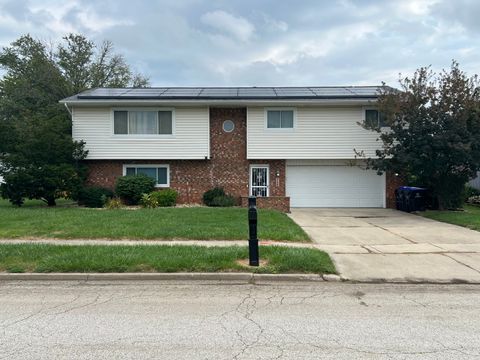
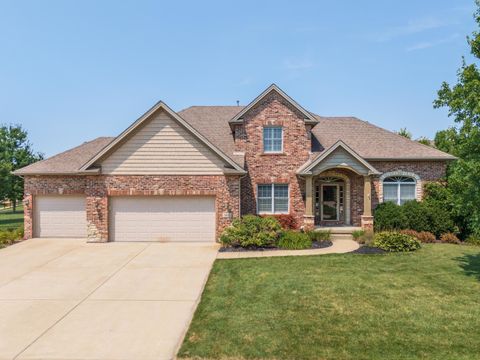
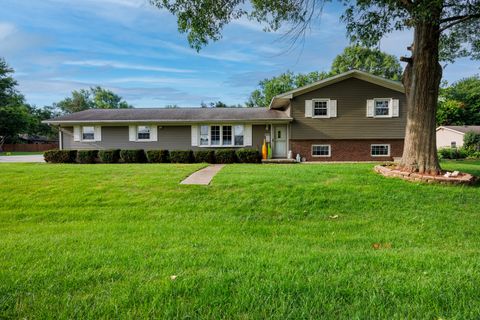
Active
$259,900
4
bds
|
2
ba
|
2,368
sqft
|
built
1977
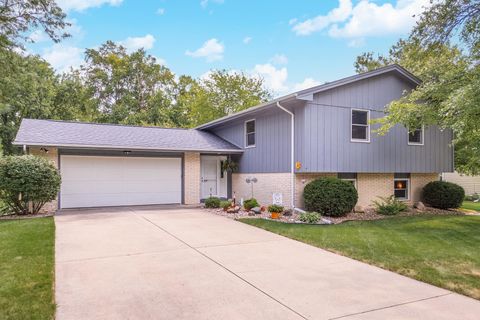
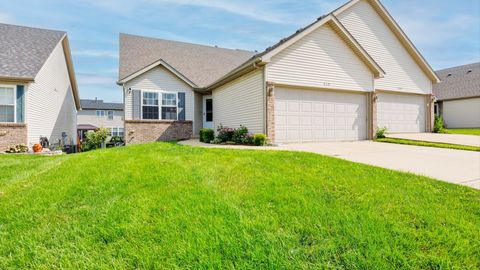
1120 Andover St, Bloomington, IL 61704
$-184
Cash flow
-3.7%
Cash-on-Cash Return
4.8%
Cap rate
0.8%
Rent to Value Ratio
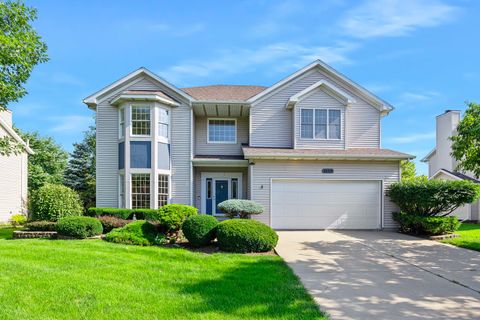
Active
$410,000
4
bds
|
4
ba
|
4,093
sqft
|
built
1991
37322 Comanche Dr, Saybrook, IL 61770
$-827
Cash flow
-10.5%
Cash-on-Cash Return
3.3%
Cap rate
0.5%
Rent to Value Ratio
Active
$325,000
4
bds
|
4
ba
|
2,075
sqft
|
built
1996
411 Wildberry Dr, Normal, IL 61761
$-157
Cash flow
-2.5%
Cash-on-Cash Return
5.1%
Cap rate
0.8%
Rent to Value Ratio
Active
$415,000
2
bds
|
3
ba
|
3,374
sqft
|
built
2000
2803 Spangle Rd, Bloomington, IL 61705
$-780
Cash flow
-9.8%
Cash-on-Cash Return
3.4%
Cap rate
0.7%
Rent to Value Ratio
Active
$285,000
3
bds
|
3
ba
|
2,385
sqft
|
built
1970
3609 Grampp Rd, Shirley, IL 61772
$-380
Cash flow
-7.0%
Cash-on-Cash Return
4.1%
Cap rate
0.7%
Rent to Value Ratio
Active
$297,500
4
bds
|
3
ba
|
2,332
sqft
|
built
1977
314 N Bone Dr, Normal, IL 61761
$-577
Cash flow
-10.1%
Cash-on-Cash Return
3.4%
Cap rate
0.6%
Rent to Value Ratio
Active
$124,900
2
bds
|
1
ba
|
1,920
sqft
|
built
1925
1405 S Center St, Bloomington, IL 61701
$209
Cash flow
8.7%
Cash-on-Cash Return
7.7%
Cap rate
1.1%
Rent to Value Ratio
Active
$250,000
3
bds
|
2
ba
|
1,911
sqft
|
built
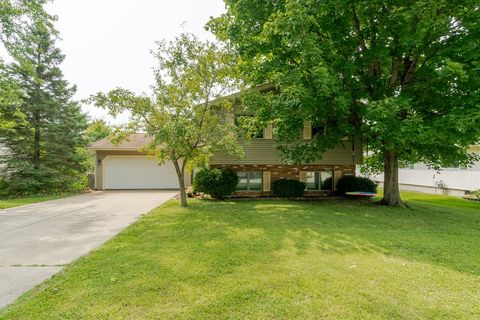
1989
2207 Woodhavens Dr, Bloomington, IL 61701
$-74
Cash flow
-1.5%
Cash-on-Cash Return
5.3%
Cap rate
0.9%
Rent to Value Ratio
Active
$189,000
3
bds
|
2
ba
|
1,500
sqft
|
built
1925
1105 E Washington St, Bloomington, IL 61701
$77
Cash flow
2.1%
Cash-on-Cash Return
6.2%
Cap rate
1.0%
Rent to Value Ratio
Active
$165,000
3
bds
|
2
ba
|
2,412
sqft
|
built
1925
1403 S Madison St, Bloomington, IL 61701
$346
Cash flow
10.9%
Cash-on-Cash Return
8.2%
Cap rate
1.2%
Rent to Value Ratio
Active
$365,000
4
bds
|
4
ba
|
2,942
sqft
|
built
1994
50 Prenzler Dr, Bloomington, IL 61704
$-674
Cash flow
-9.6%
Cash-on-Cash Return
3.5%
Cap rate
0.7%
Rent to Value Ratio
Active
$409,000
3
bds
|
4
ba
|
3,555
sqft
|
built
2011
2610 Shepard Rd, Normal, IL 61761
$-702
Cash flow
-9.0%
Cash-on-Cash Return
3.6%
Cap rate
0.7%
Rent to Value Ratio
Active
$359,900
4
bds
|
3
ba
|
2,680
sqft
|
built
1996
32 Hodgehaven Cir, Bloomington, IL 61704
$-448
Cash flow
-6.5%
Cash-on-Cash Return
4.2%
Cap rate
0.8%
Rent to Value Ratio
Active
$180,000
3
bds
|
2
ba
|
1,946
sqft
|
built
1925
1310 W Olive St, Bloomington, IL 61701
$427
Cash flow
12.4%
Cash-on-Cash Return
8.5%
Cap rate
1.2%
Rent to Value Ratio
Active
$164,000
4
bds
|
1
ba
|
2,569
sqft
|
built
1920
703 N Evans St, Bloomington, IL 61701
$216
Cash flow
6.9%
Cash-on-Cash Return
7.3%
Cap rate
1.0%
Rent to Value Ratio
Active
$315,000
5
bds
|
3
ba
|
2,452
sqft
|
built
1975
13310 Tango Rd, Bloomington, IL 61705
$-403
Cash flow
-6.7%
Cash-on-Cash Return
4.1%
Cap rate
0.6%
Rent to Value Ratio
Active
$270,000
3
bds
|
3
ba
|
1,751
sqft
|
built
2004
440 Beechwood Ct, Normal, IL 61761
$-160
Cash flow
-3.1%
Cash-on-Cash Return
5.0%
Cap rate
0.9%
Rent to Value Ratio
Active
$199,900
4
bds
|
2
ba
|
2,672
sqft
|
built
1960
308 S Grove St, Normal, IL 61761
$85
Cash flow
2.2%
Cash-on-Cash Return
6.2%
Cap rate
1.0%
Rent to Value Ratio
Active
$375,000
4
bds
|
3
ba
|
3,418
sqft
|
built
1992
1418 Ironwood Cc Dr, Normal, IL 61761
$-477
Cash flow
-6.6%
Cash-on-Cash Return
4.2%
Cap rate
0.7%
Rent to Value Ratio
Active
$347,500
4
bds
|
4
ba
|
2,496
sqft
|
built
1984
5 Gloucester Cir, Bloomington, IL 61704
$-450
Cash flow
-6.8%
Cash-on-Cash Return
4.1%
Cap rate
0.7%
Rent to Value Ratio
Active
$125,000
3
bds
|
2
ba
|
1,242
sqft
|
built
1979
602 S Mercer Ave, Bloomington, IL 61701
$144
Cash flow
6.0%
Cash-on-Cash Return
7.1%
Cap rate
1.4%
Rent to Value Ratio
Active
$359,900
2
bds
|
2
ba
|
3,302
sqft
|
built
2011
3903 Dunloe Pl, Bloomington, IL 61704
$-475
Cash flow
-6.9%
Cash-on-Cash Return
4.1%
Cap rate
0.8%
Rent to Value Ratio
Active
$475,000
4
bds
|
4
ba
|
4,180
sqft
|
built
1998
503 Ironwood Cc Dr, Normal, IL 61761
$-867
Cash flow
-9.5%
Cash-on-Cash Return
3.5%
Cap rate
0.7%
Rent to Value Ratio
Active
$379,000
2
bds
|
2
ba
|
3,394
sqft
|
built
2007
1713 Dunraven Rd, Bloomington, IL 61704
$-939
Cash flow
-12.9%
Cash-on-Cash Return
2.7%
Cap rate
0.6%
Rent to Value Ratio
Active
$439,900
5
bds
|
4
ba
|
4,730
sqft
|
built
2002
3105 Sable Oaks Rd, Bloomington, IL 61704
$-843
Cash flow
-10.0%
Cash-on-Cash Return
3.4%
Cap rate
0.7%
Rent to Value Ratio
Active
$149,900
3
bds
|
2
ba
|
1,740
sqft
|
built
1925
707 S Center St, Bloomington, IL 61701
$407
Cash flow
14.2%
Cash-on-Cash Return
8.9%
Cap rate
1.3%
Rent to Value Ratio
Active
$232,500
4
bds
|
2
ba
|
1,671
sqft
|
built
2003
203 Keiser Ave, Normal, IL 61761
$-230
Cash flow
-5.2%
Cash-on-Cash Return
4.5%
Cap rate
0.8%
Rent to Value Ratio
Active
$465,000
4
bds
|
5
ba
|
4,075
sqft
|
built
1990
14 Bent Tree Ln, Towanda, IL 61776
$-820
Cash flow
-9.2%
Cash-on-Cash Return
3.6%
Cap rate
0.7%
Rent to Value Ratio
Active
$549,500
4
bds
|
4
ba
|
4,079
sqft
|
built
2010
1411 Watersound Way, Bloomington, IL 61705
$-1,511
Cash flow
-14.3%
Cash-on-Cash Return
2.4%
Cap rate
0.6%
Rent to Value Ratio
Active
$184,900
4
bds
|
2
ba
|
3,424
sqft
|
built
1925
1011 S Center St, Bloomington, IL 61701
$192
Cash flow
5.4%
Cash-on-Cash Return
6.9%
Cap rate
1.0%
Rent to Value Ratio
Active
$174,000
3
bds
|
1
ba
|
1,313
sqft
|
built
1910
1213 N Madison St, Bloomington, IL 61701
$258
Cash flow
7.7%
Cash-on-Cash Return
7.5%
Cap rate
1.1%
Rent to Value Ratio
Active
$240,000
3
bds
|
3
ba
|
1,728
sqft
|
built
1974
408 W Randolph St, Heyworth, IL 61745
$-69
Cash flow
-1.5%
Cash-on-Cash Return
5.3%
Cap rate
0.8%
Rent to Value Ratio
Active
$365,000
4
bds
|
3
ba
|
3,800
sqft
|
built
1992
1600 Ironwood Cc Dr, Normal, IL 61761
$-108
Cash flow
-1.5%
Cash-on-Cash Return
5.3%
Cap rate
0.9%
Rent to Value Ratio
Active
$295,000
1
bds
|
3
ba
|
2,120
sqft
|
built
2024
221 Cassidy Rd, Normal, IL 61761
$-402
Cash flow
-7.1%
Cash-on-Cash Return
4.0%
Cap rate
0.7%
Rent to Value Ratio
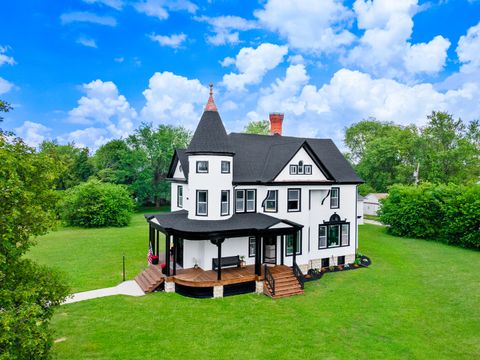
Active
$398,000
4
bds
|
2
ba
|
6,120
sqft
|
built
1899
732 E Cemetery Ave, Chenoa, IL 61726
$-374
Cash flow
-4.9%
Cash-on-Cash Return
4.5%
Cap rate
0.7%
Rent to Value Ratio
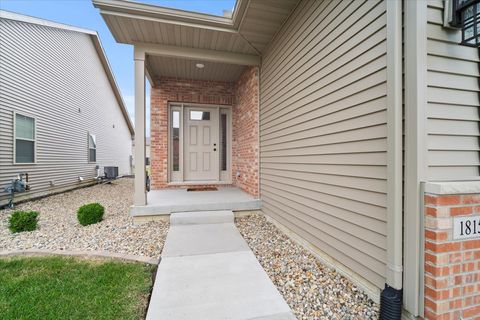
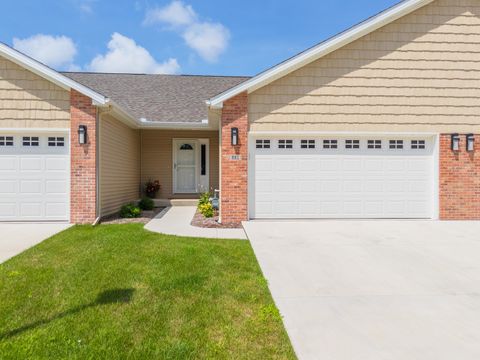
Active
$295,000
2
bds
|
2
ba
|
2,512
sqft
|
built
2022
1815 Glenbridge Rd, Bloomington, IL 61704
$53
Cash flow
0.9%
Cash-on-Cash Return
5.9%
Cap rate
0.9%
Rent to Value Ratio
Active
$369,000
3
bds
|
2
ba
|
3,560
sqft
|
built
2007
2402 Treeline Dr, Bloomington, IL 61704
$-392
Cash flow
-5.5%
Cash-on-Cash Return
4.4%
Cap rate
0.8%
Rent to Value Ratio