Peoria County Investment Properties for Sale
Browse homes for sale and investment properties in Peoria County. Refine your search by price, property type, or more.
Best cash flowing properties in Peoria County
Active
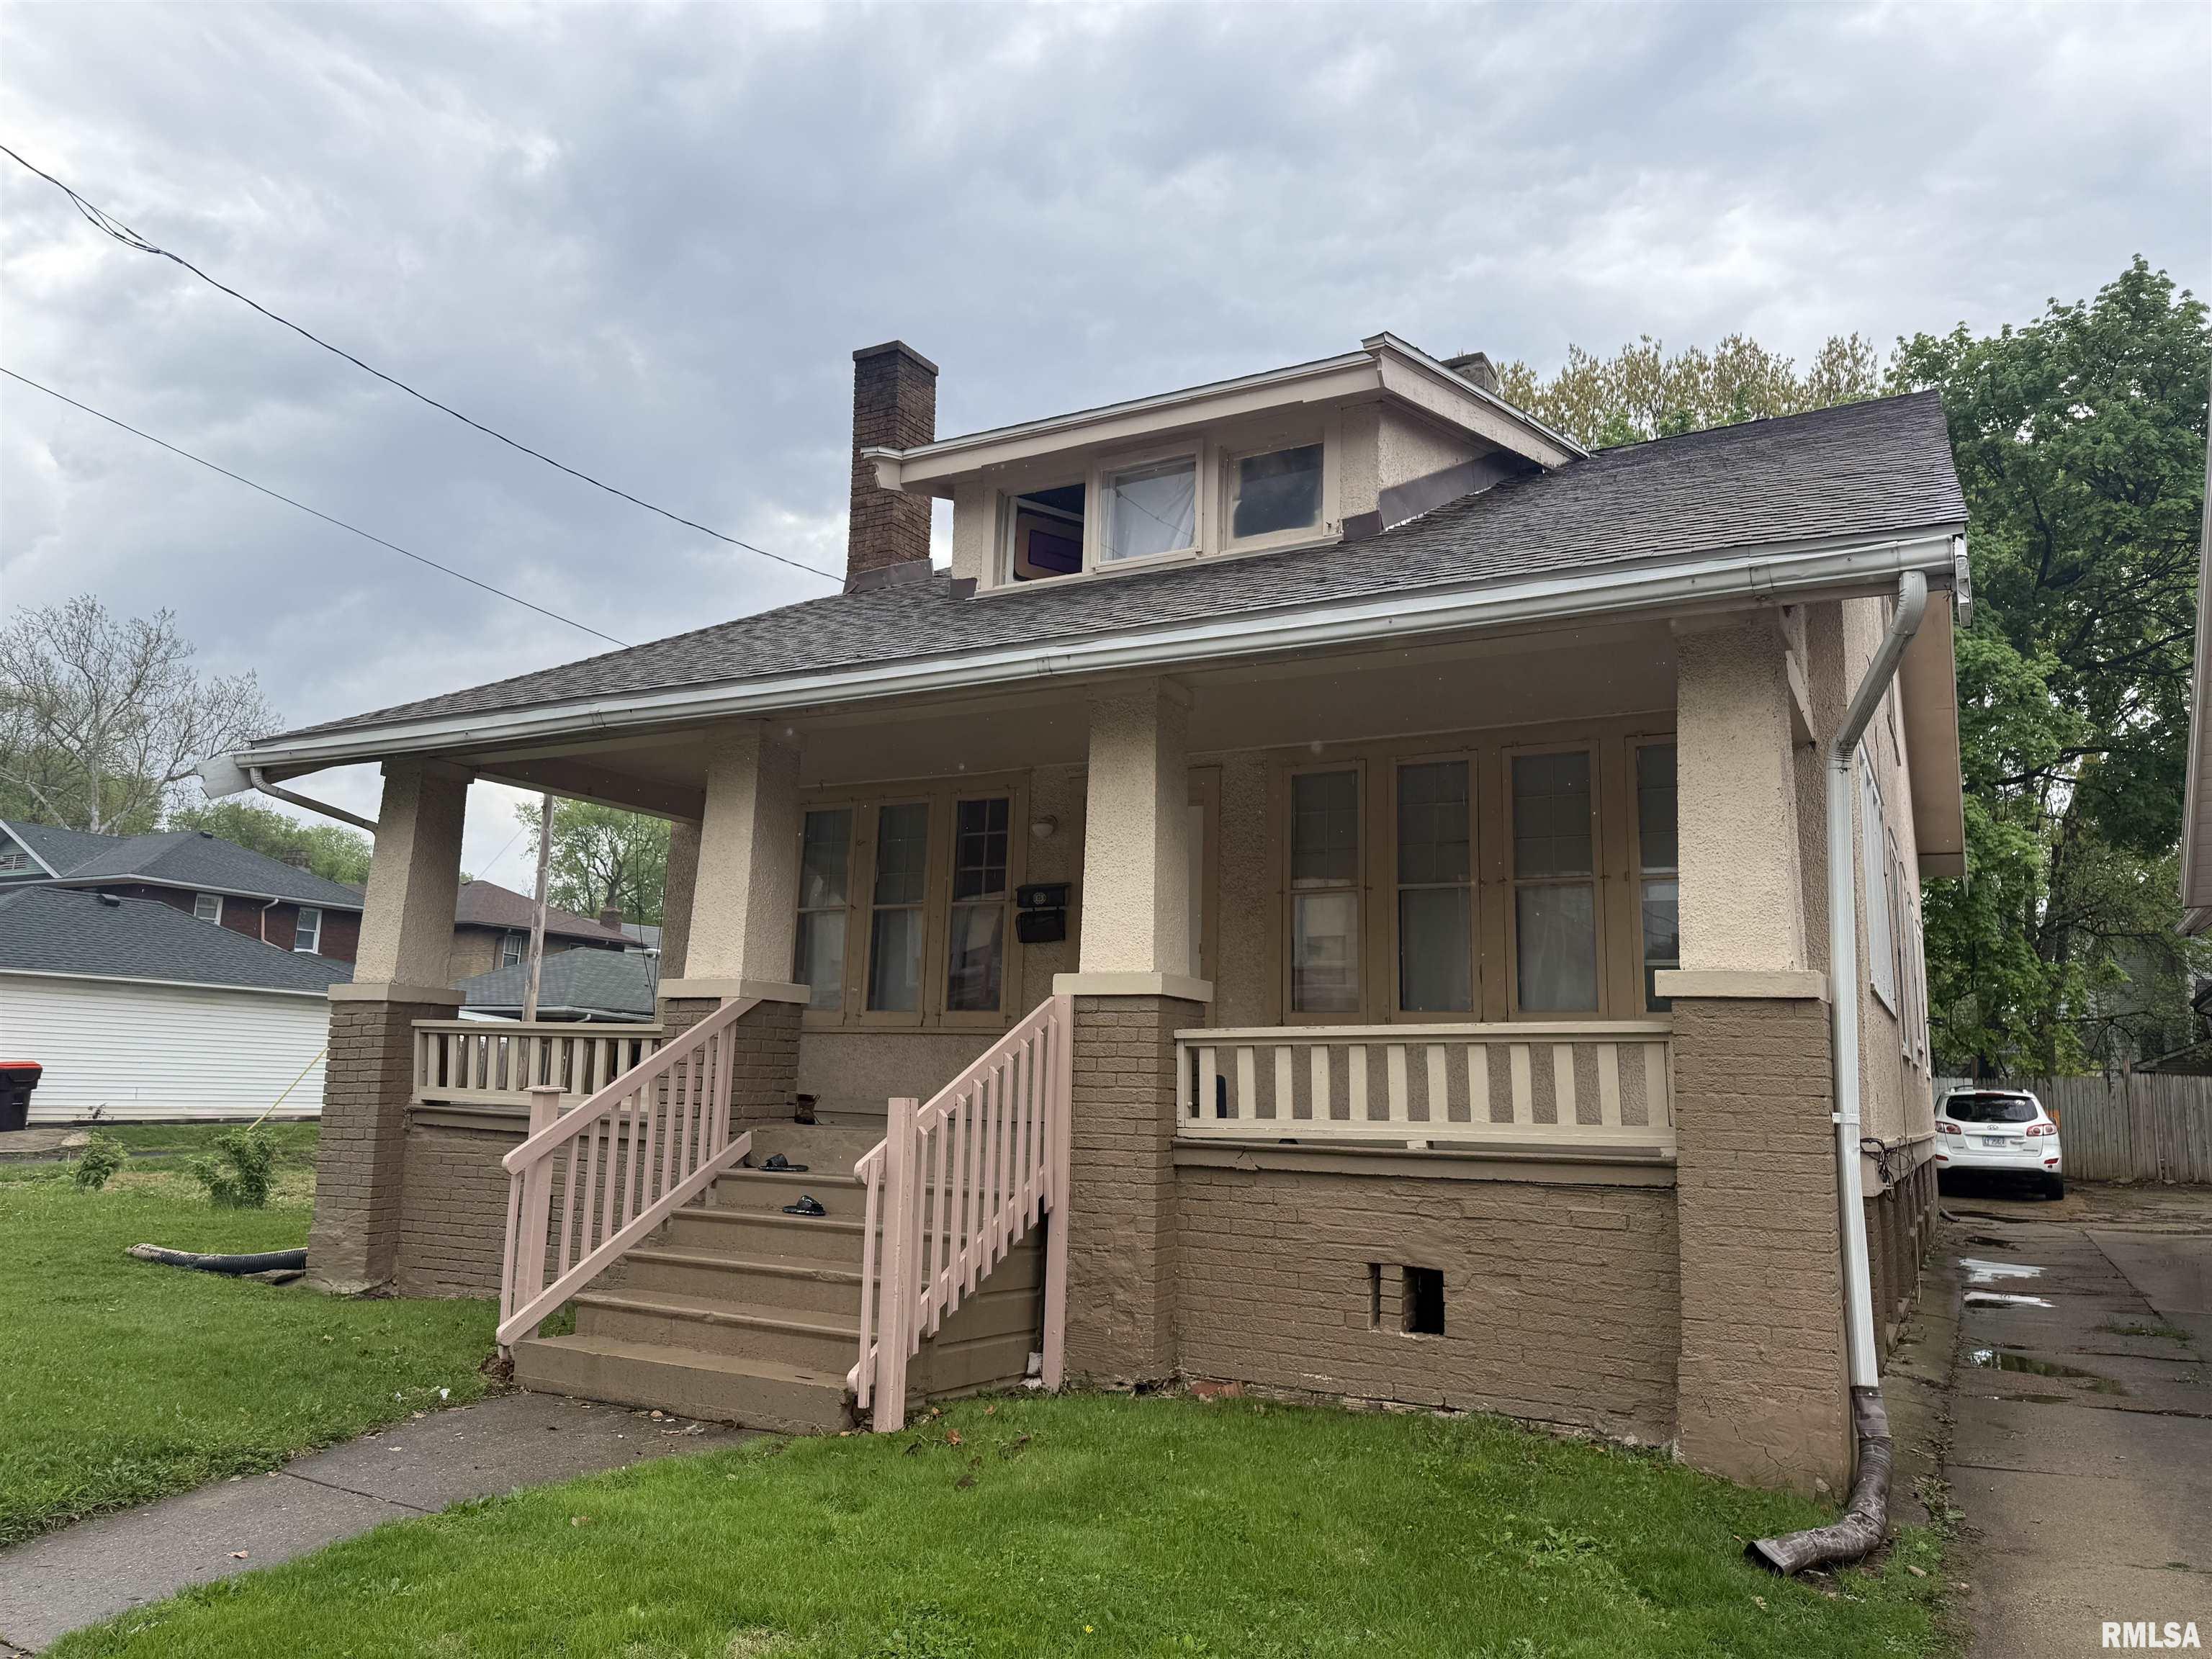
$59,990
4
bds
|
2
ba
|
1,260
sqft
|
built
1912
814 W Columbia Ter, Peoria, IL 61606
$933
Cash flow
18.1%
Cash-on-Cash Return
18.7%
Cap rate
2.7%
Rent to Value Ratio

Active
$35,000
2
bds
|
1
ba
|
1,056
sqft
|
built
1910
1415 S Greenlawn St, Peoria, IL 61602
$861
Cash flow
28.7%
Cash-on-Cash Return
29.5%
Cap rate
3.7%
Rent to Value Ratio
170 out of 229 properties for sale in Peoria County
Limited Results Shown
Create a free account, or log in to reveal all property listings and enjoy the complete experience.
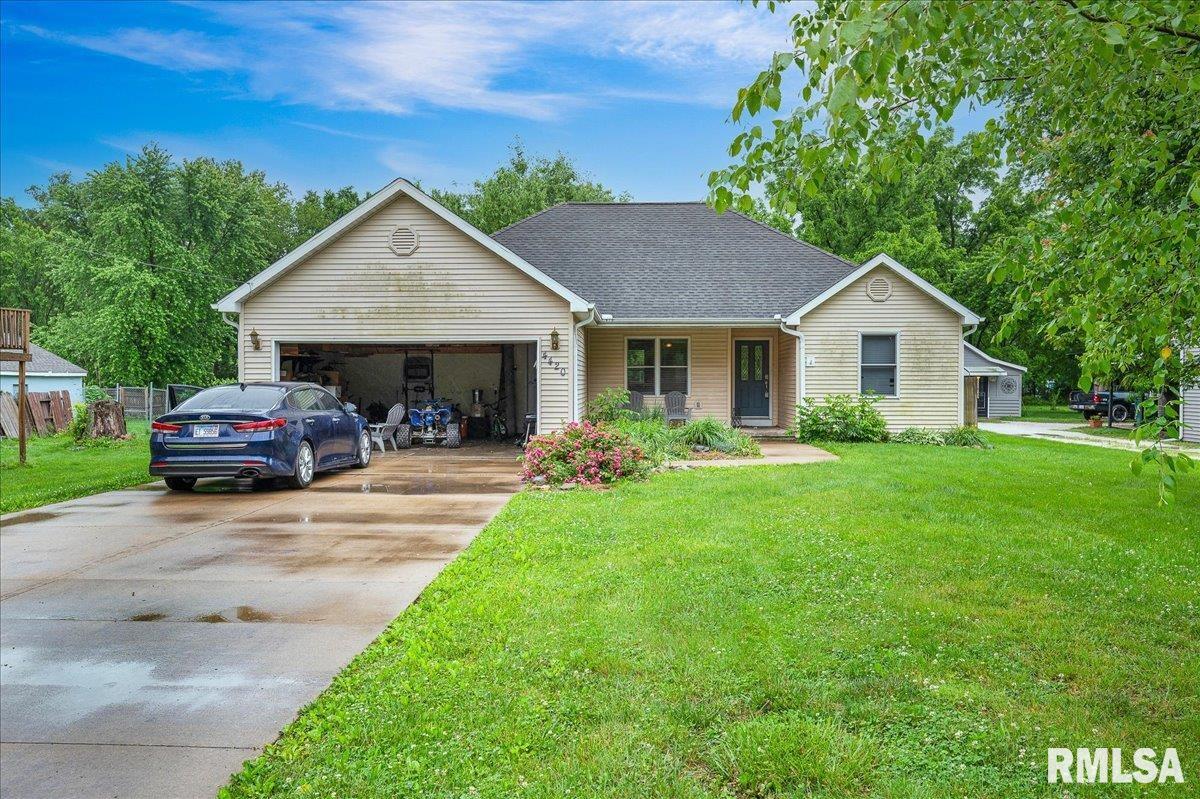
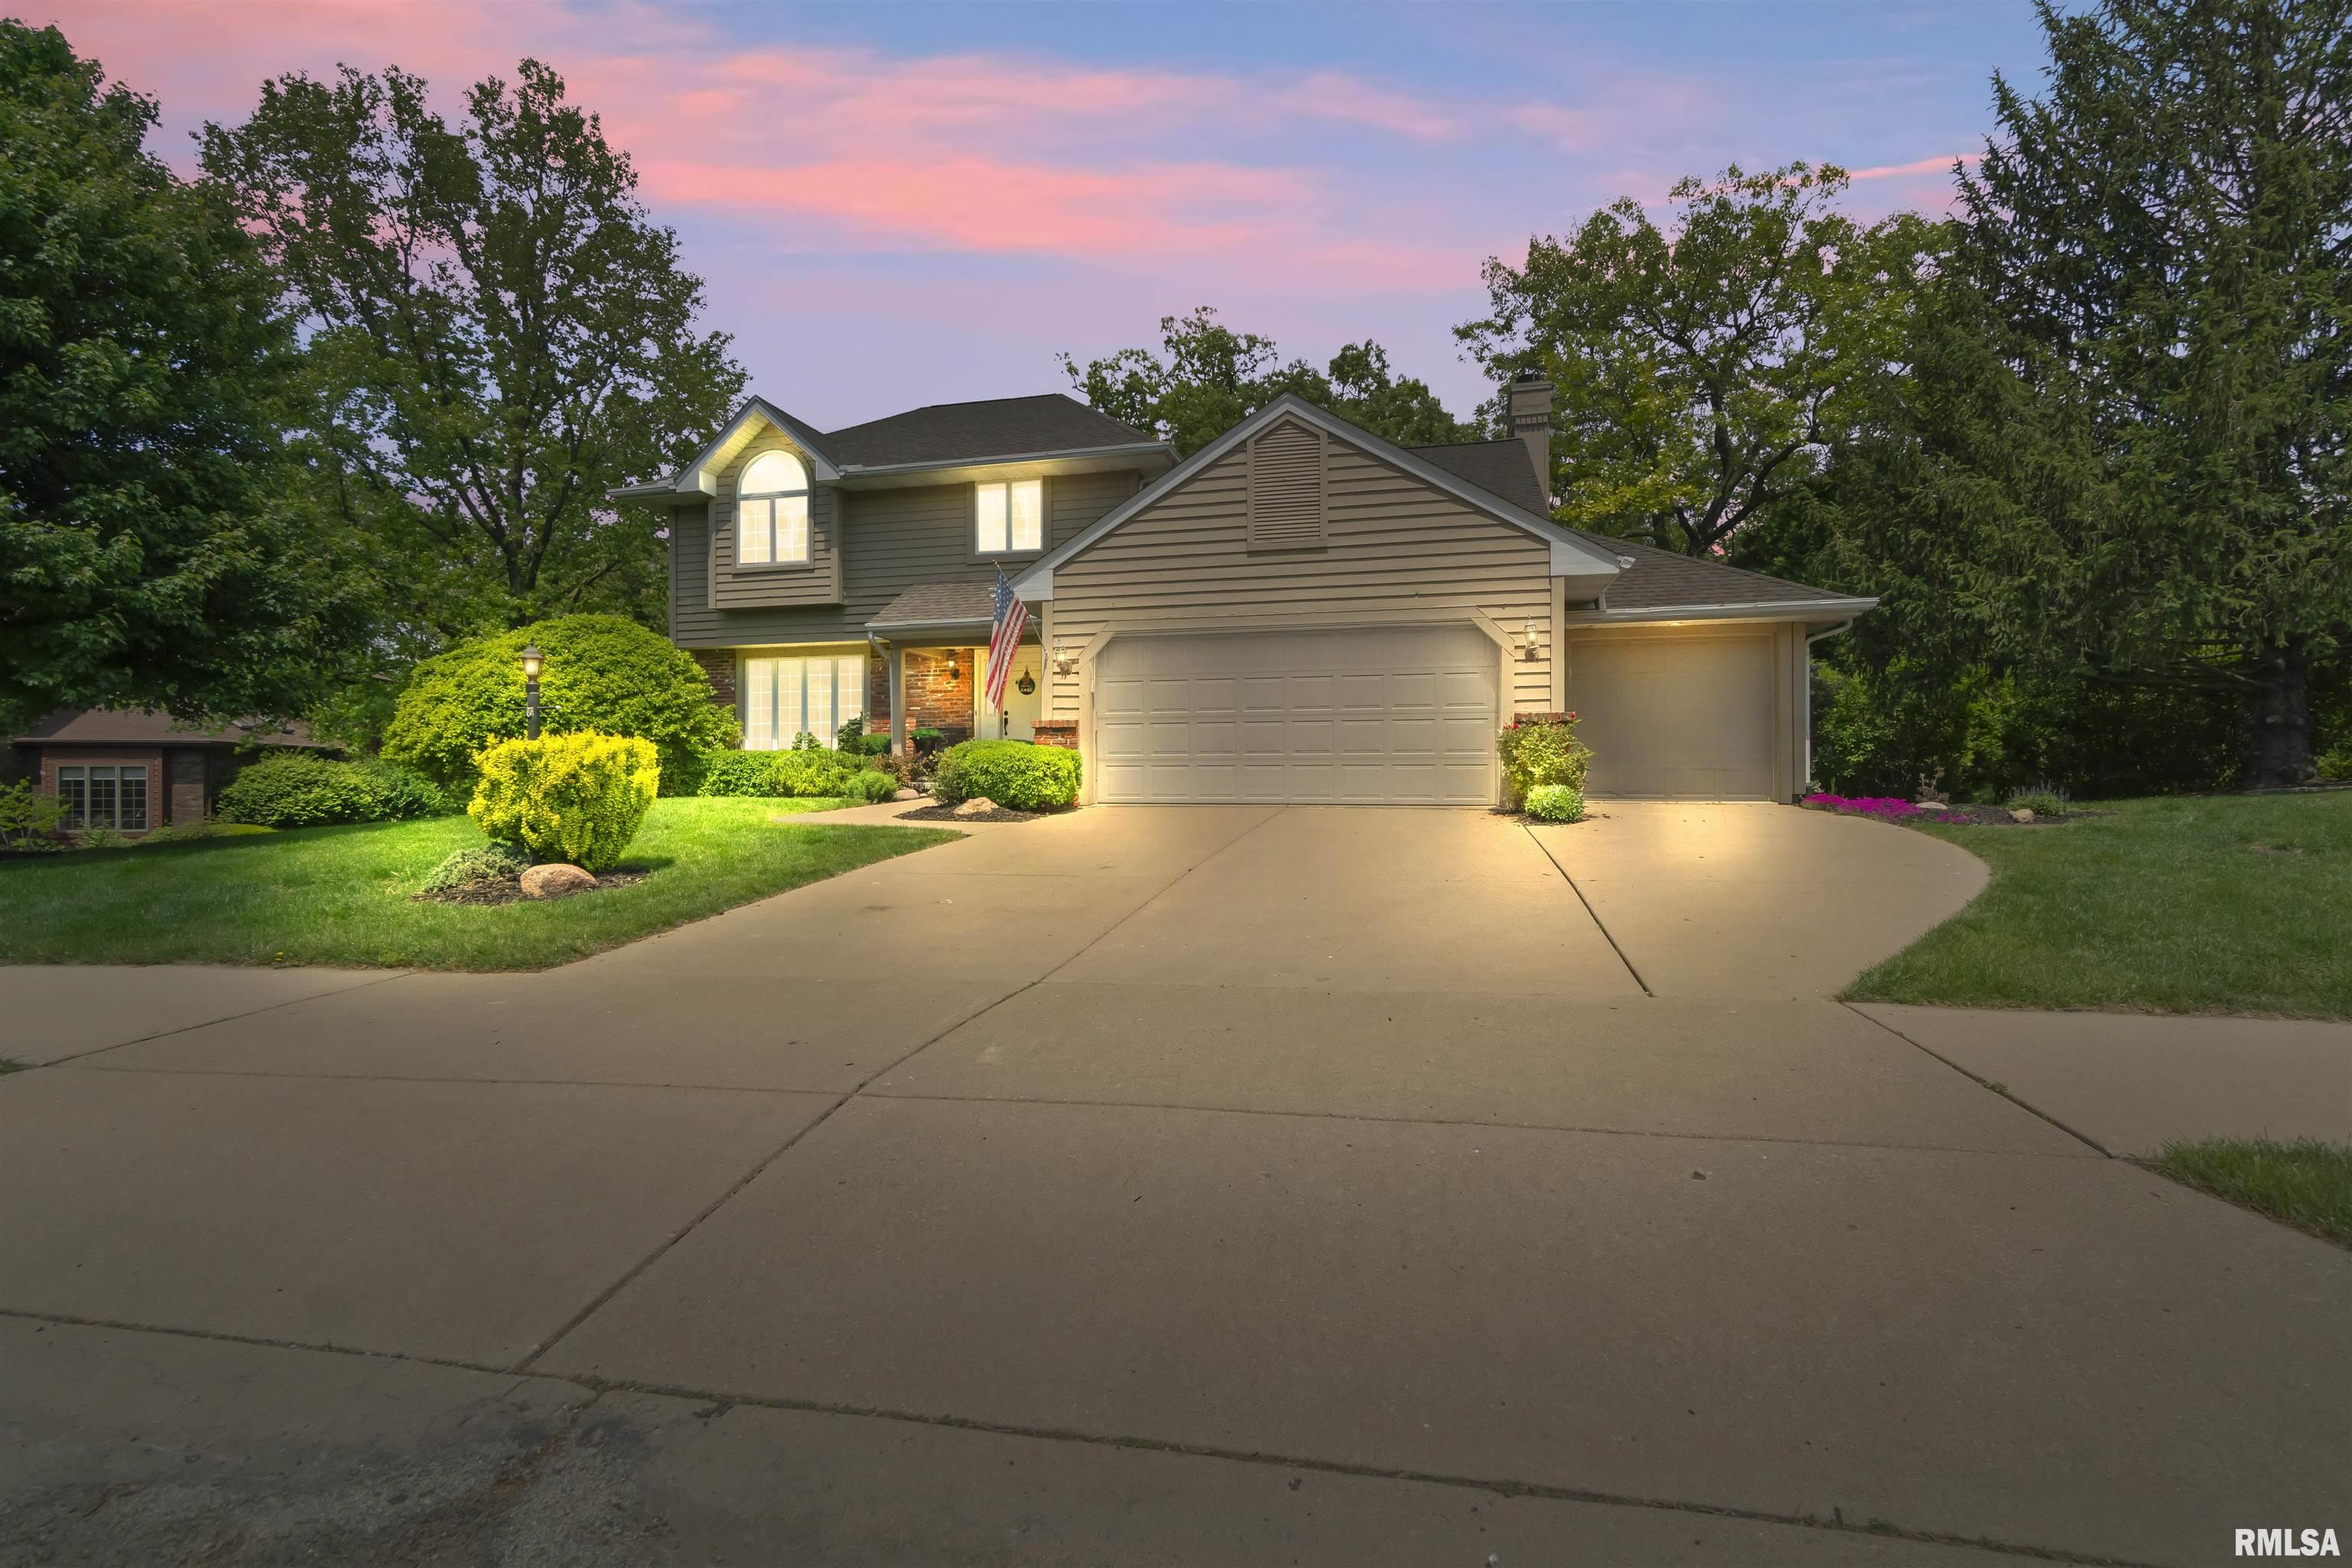
Active
$234,900
5
bds
|
3
ba
|
2,324
sqft
|
built
2009
4420 W Prairie Ln, Peoria, IL 61604
$-64
Cash flow
-1.4%
Cash-on-Cash Return
6.0%
Cap rate
1.0%
Rent to Value Ratio
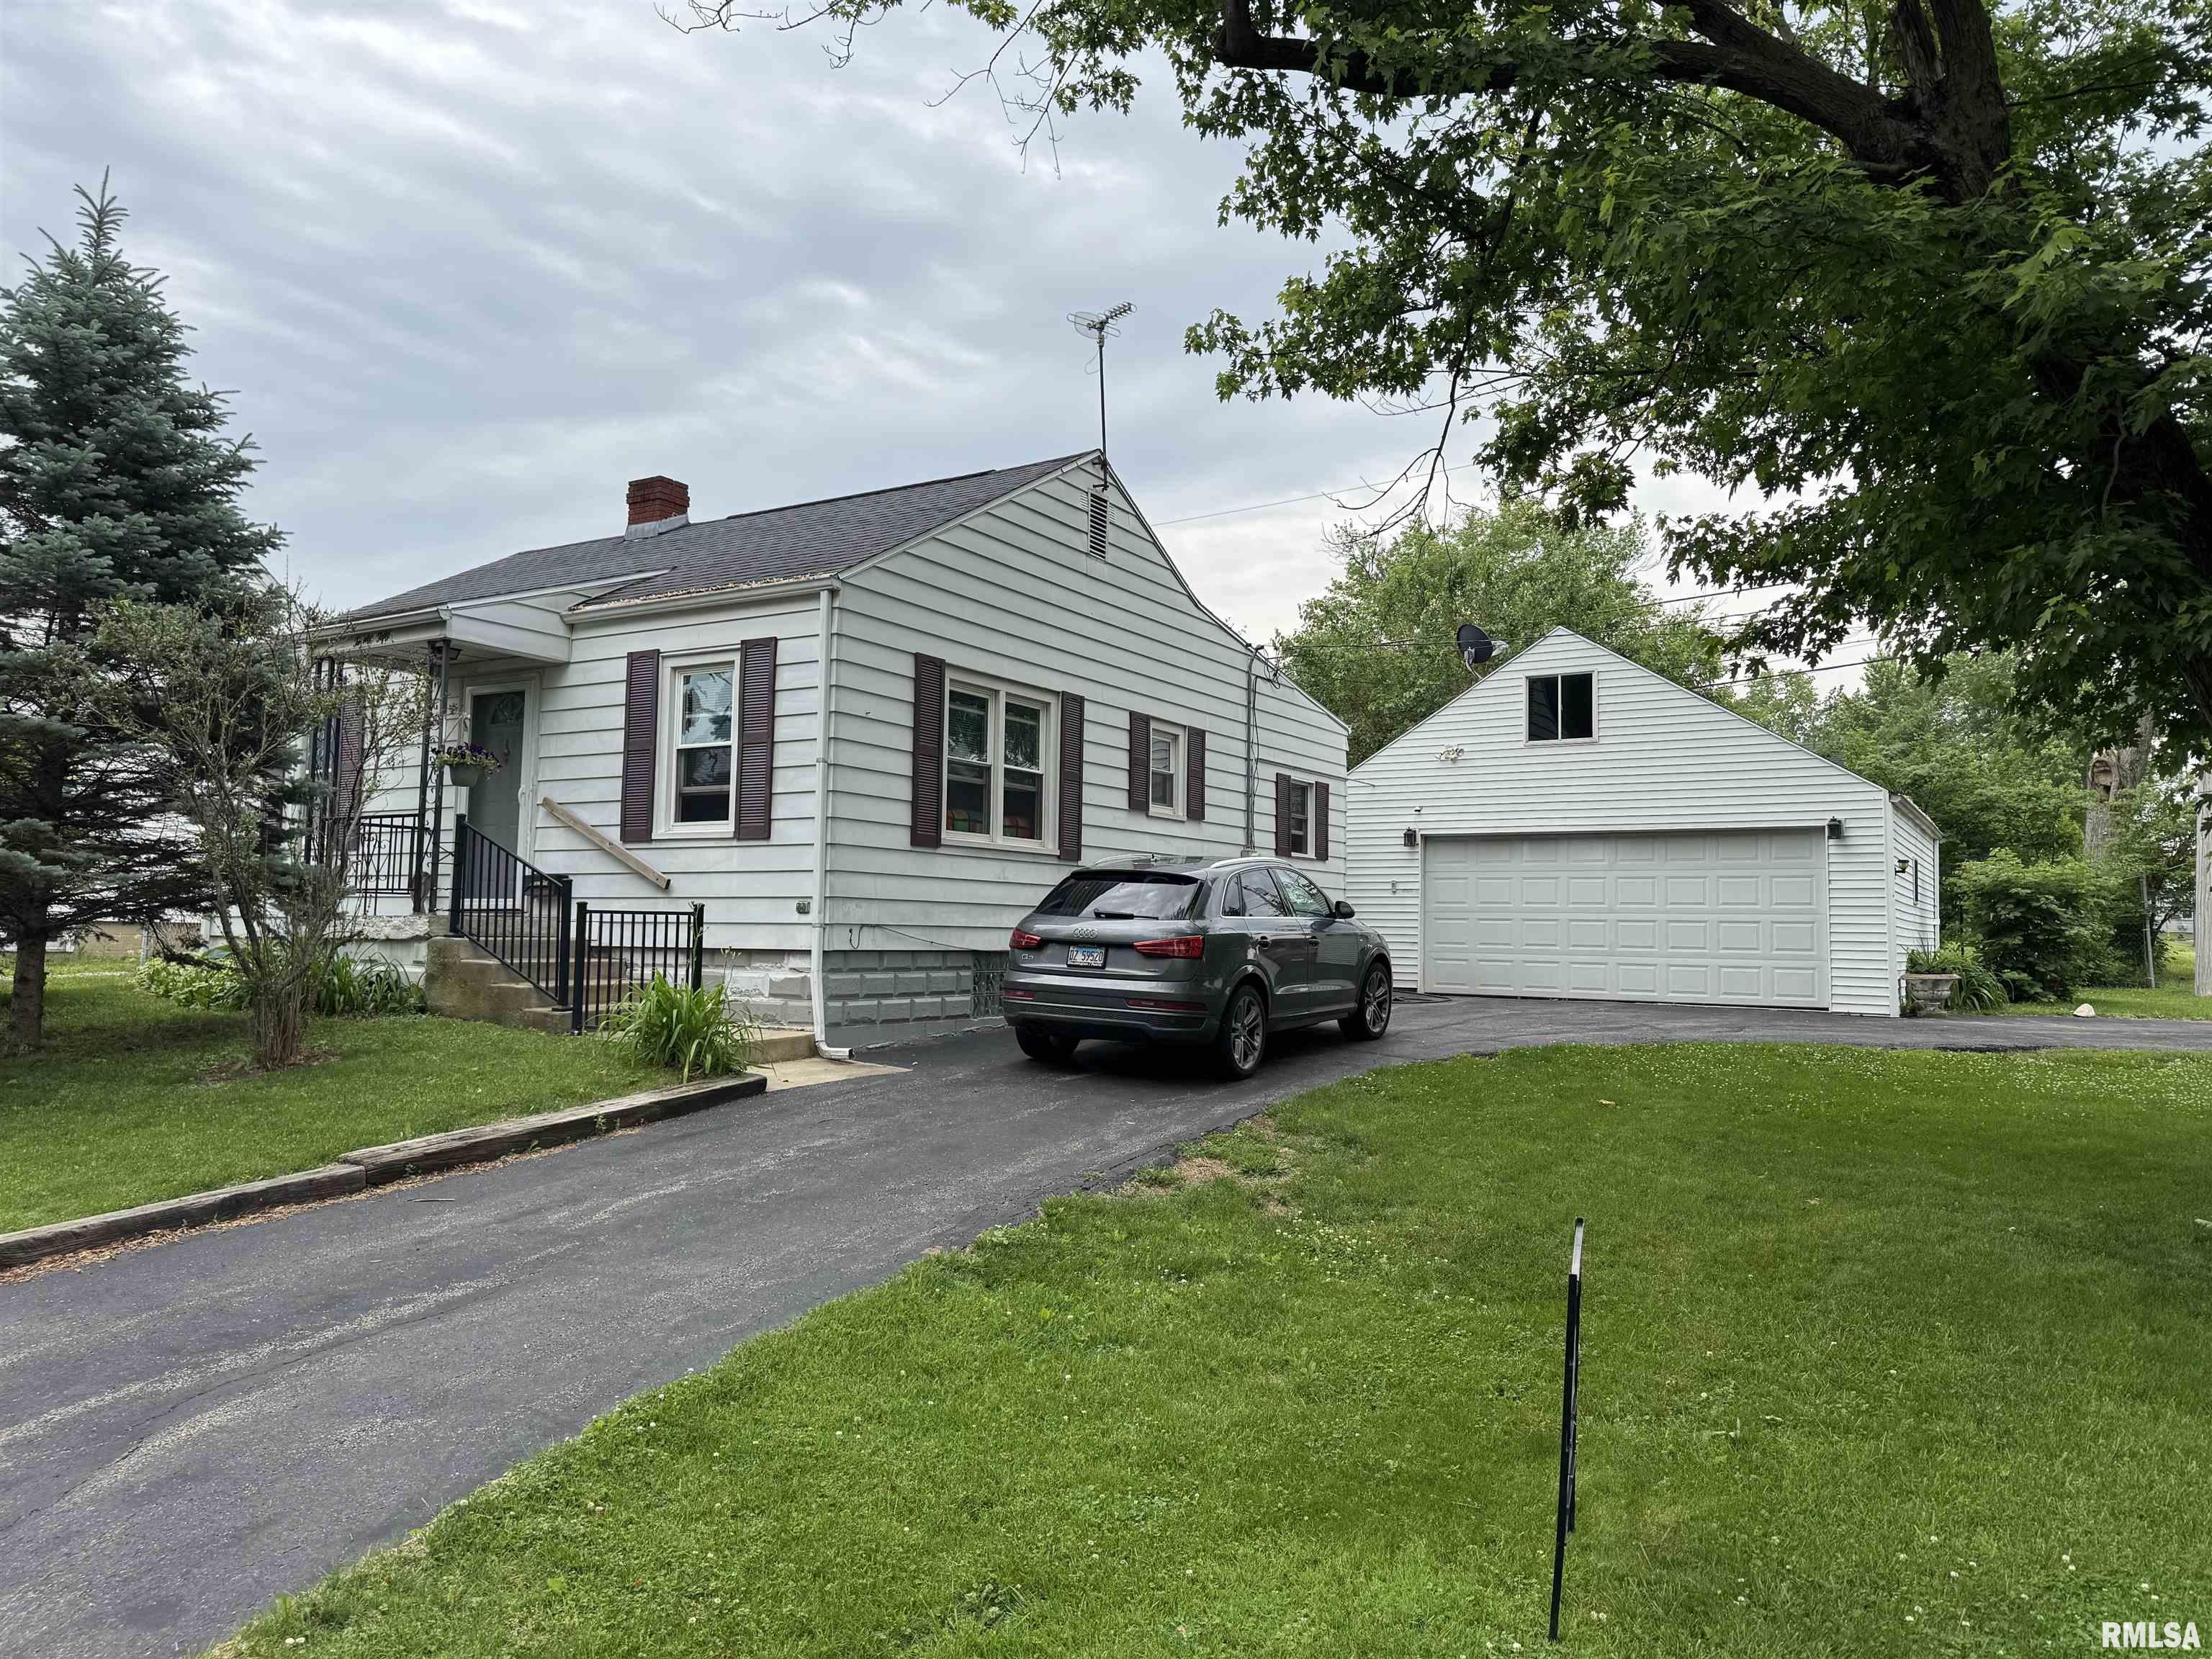
Active
$99,900
2
bds
|
2
ba
|
752
sqft
|
built
1946
2050 W Wilson Ave, Peoria, IL 61604
$73
Cash flow
3.8%
Cash-on-Cash Return
7.2%
Cap rate
1.1%
Rent to Value Ratio
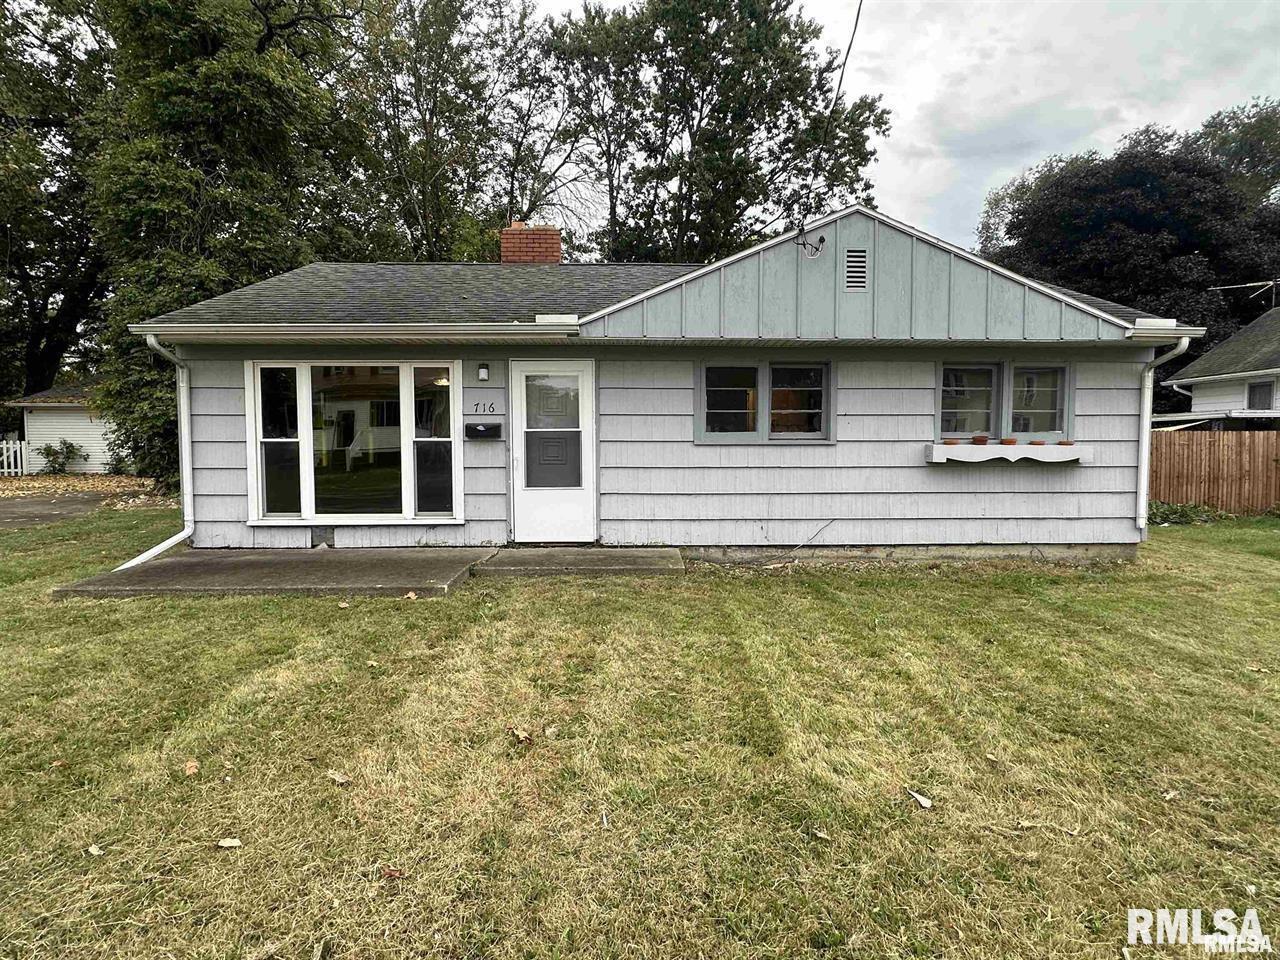
Active
$68,900
3
bds
|
1
ba
|
864
sqft
|
built
1946
716 W Nebraska Ave, Peoria, IL 61604
$587
Cash flow
9.9%
Cash-on-Cash Return
10.2%
Cap rate
1.5%
Rent to Value Ratio
Active
$225,000
4
bds
|
3
ba
|
2,483
sqft
|
built
1909
1614 W Columbia Ter, Peoria, IL 61606
$-234
Cash flow
-5.4%
Cash-on-Cash Return
5.0%
Cap rate
0.8%
Rent to Value Ratio
Active
$199,900
4
bds
|
2
ba
|
1,597
sqft
|
built
1955
1518 W Shenandoah Dr, Peoria, IL 61614
$-393
Cash flow
-10.3%
Cash-on-Cash Return
3.9%
Cap rate
0.7%
Rent to Value Ratio
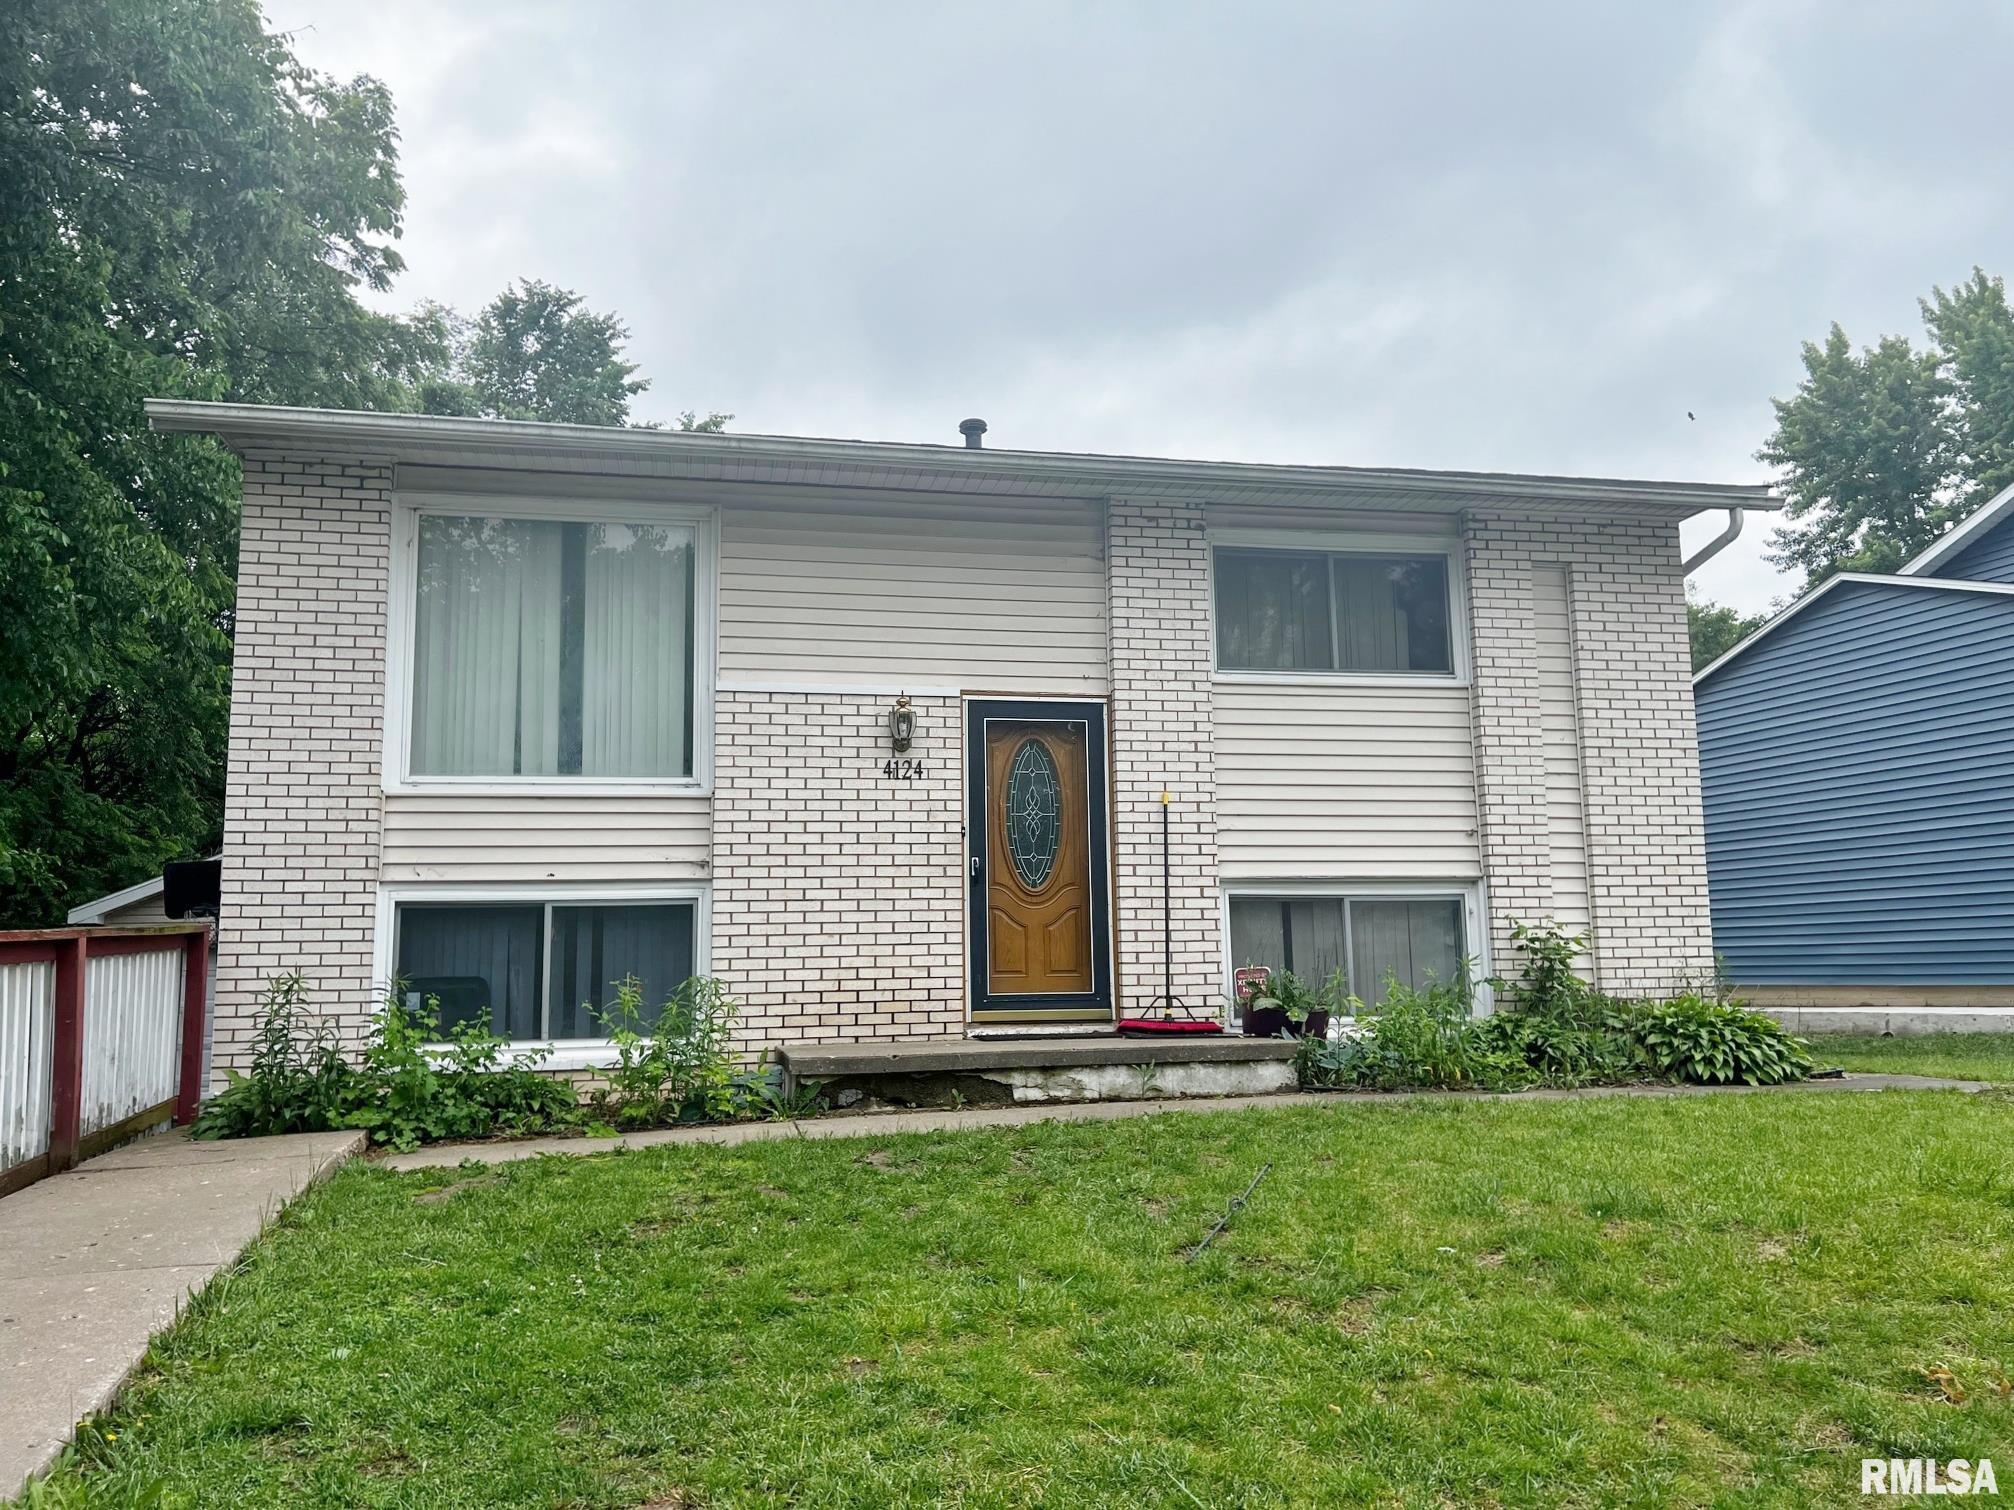
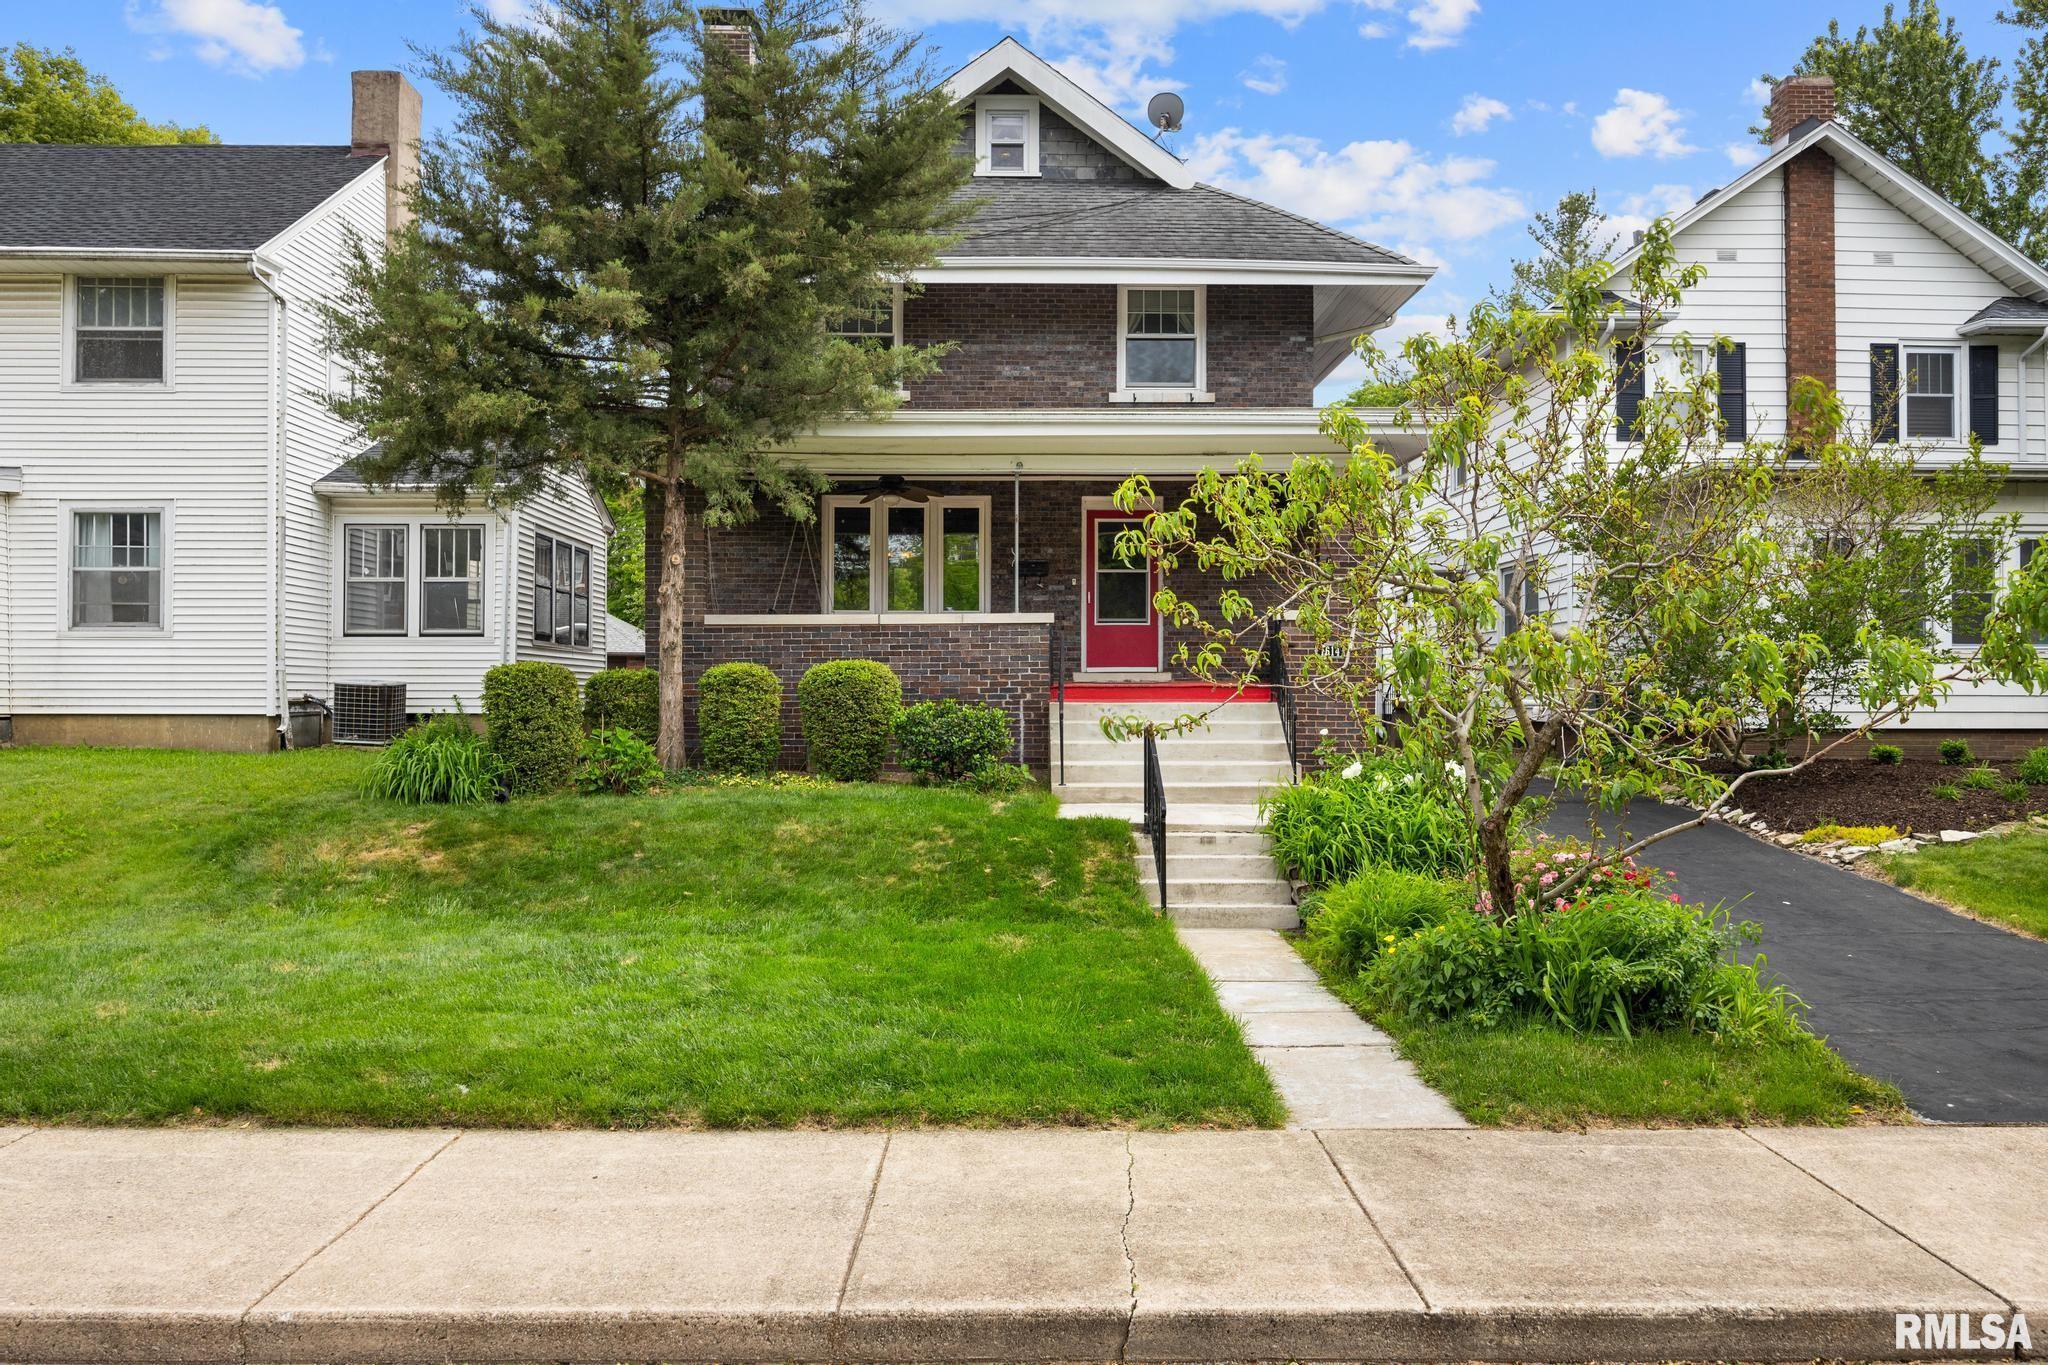
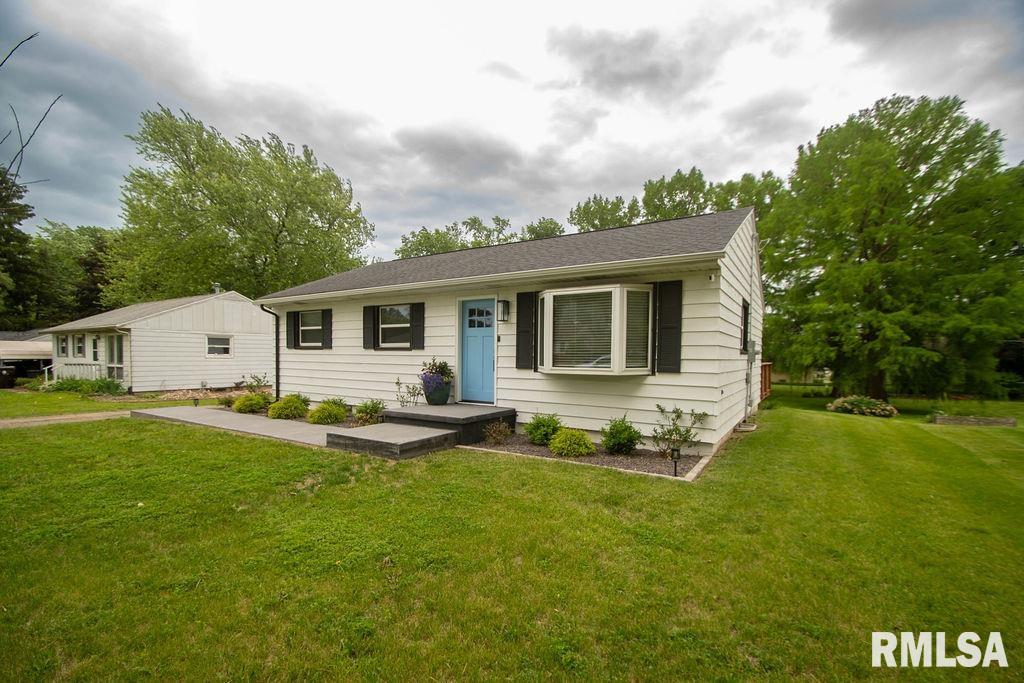
Active
$114,900
4
bds
|
2
ba
|
1,550
sqft
|
built
1972
4124 W Courtland St, Peoria, IL 61615
$137
Cash flow
6.2%
Cash-on-Cash Return
7.7%
Cap rate
1.2%
Rent to Value Ratio

Active
$585,000
5
bds
|
4
ba
|
3,541
sqft
|
built
2018
11306 N Joseph St, Dunlap, IL 61525
$-1,952
Cash flow
-17.4%
Cash-on-Cash Return
2.3%
Cap rate
0.5%
Rent to Value Ratio
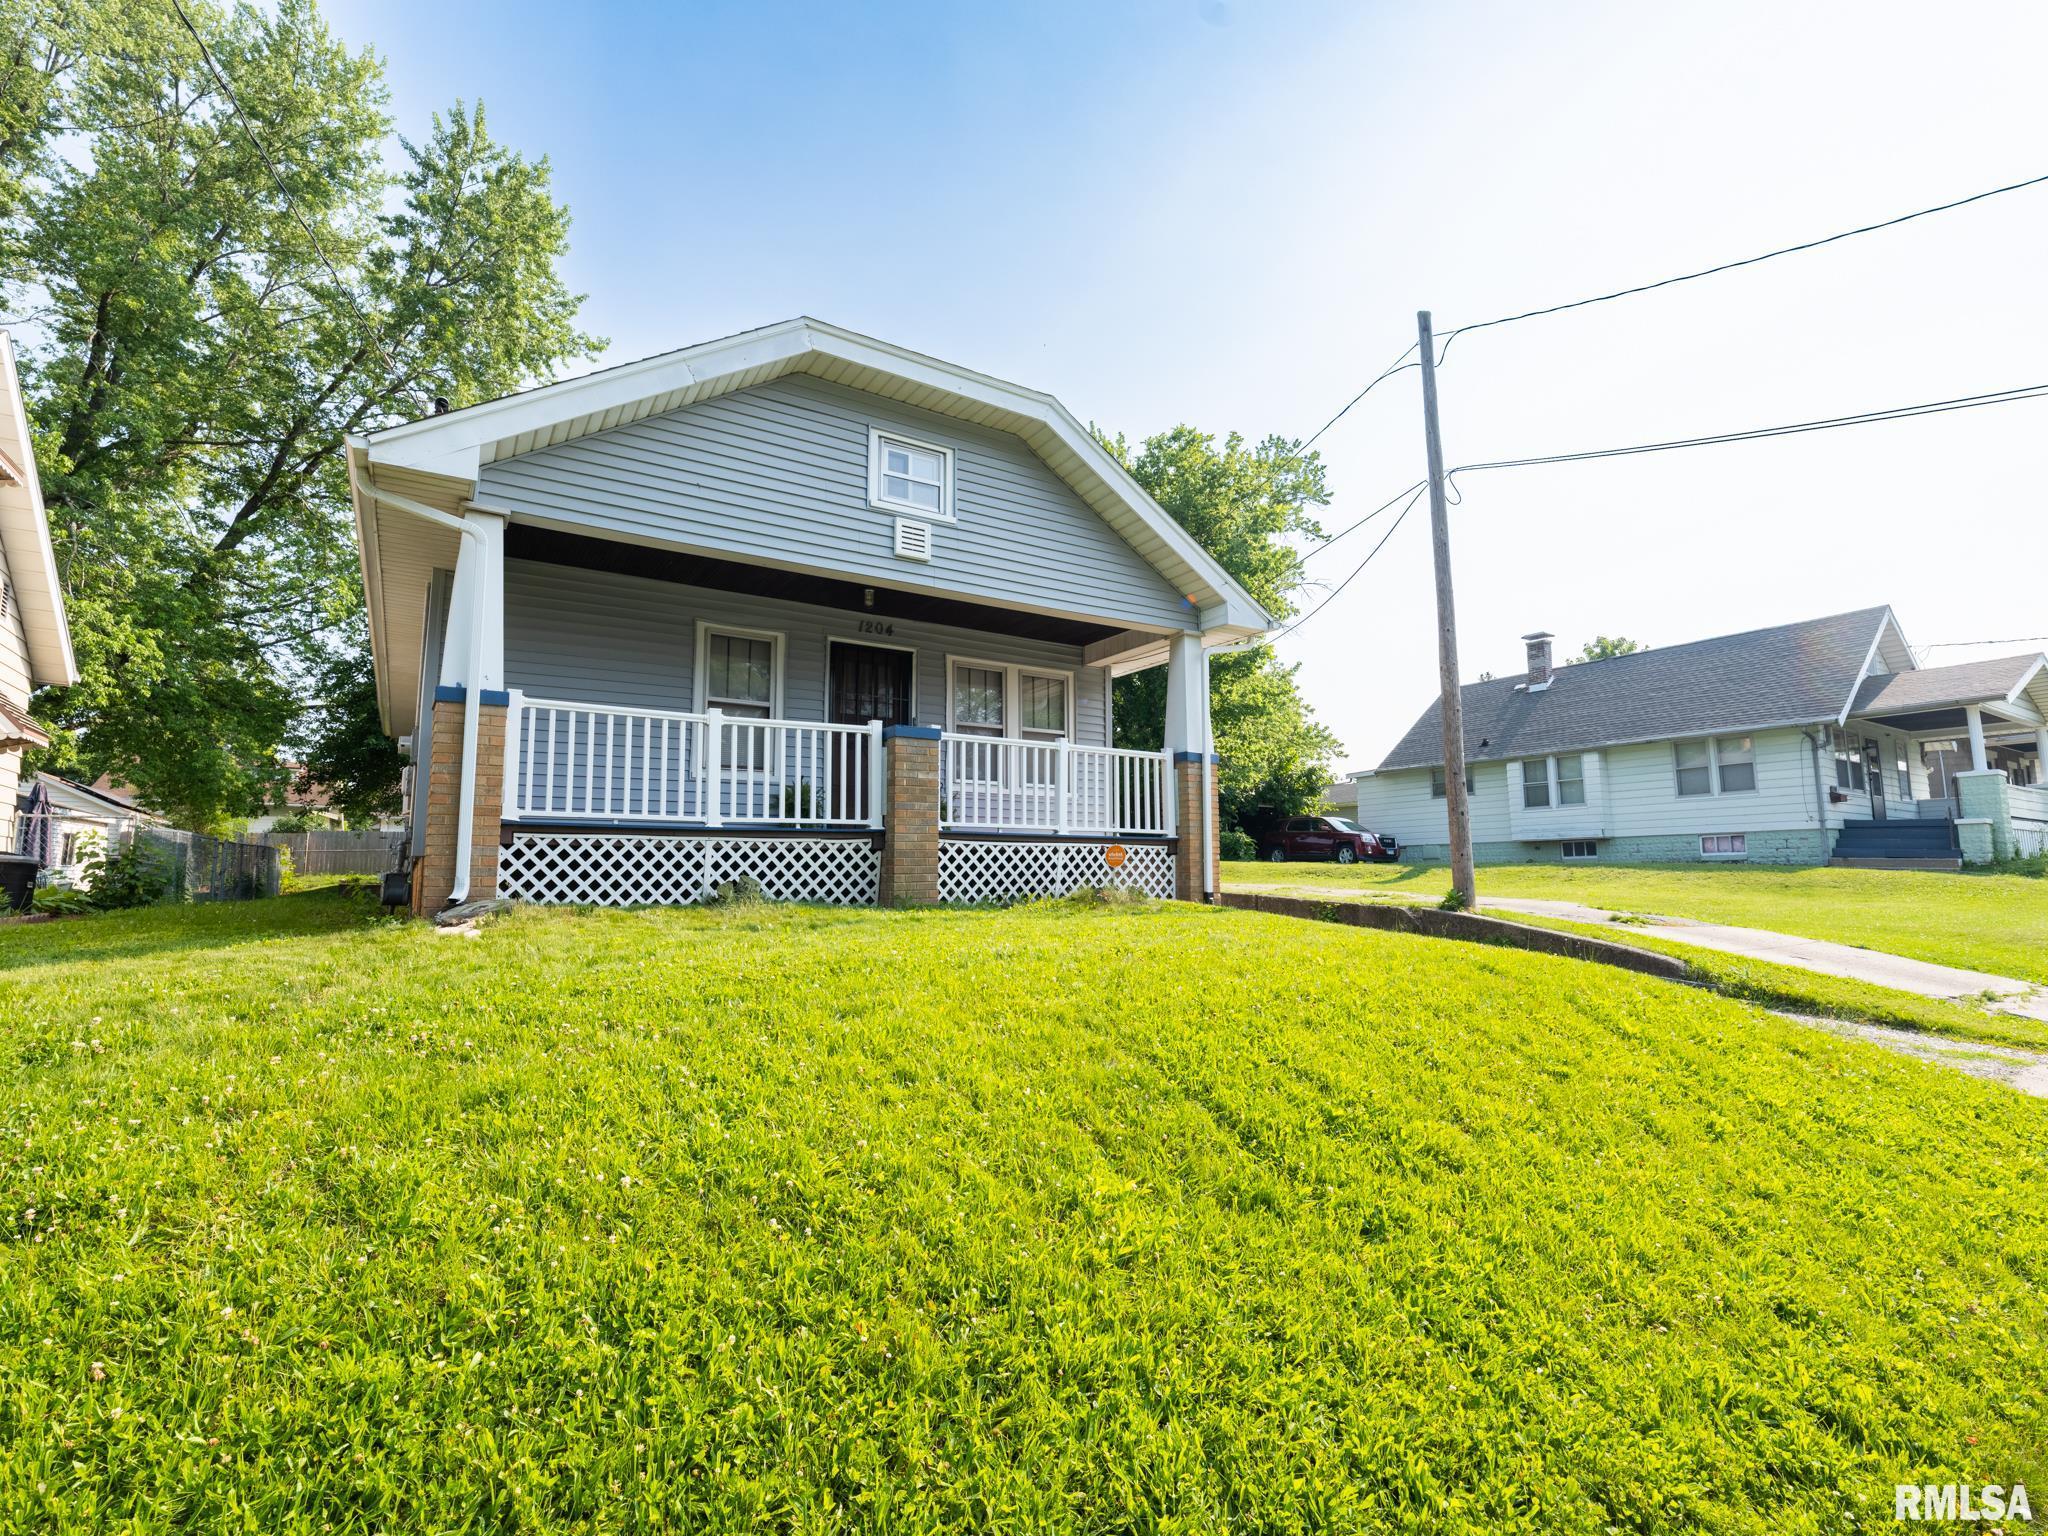
Active
$79,900
2
bds
|
1
ba
|
864
sqft
|
built
1930
1204 W Gift Ave, Peoria, IL 61604
$230
Cash flow
15.0%
Cash-on-Cash Return
9.7%
Cap rate
1.5%
Rent to Value Ratio
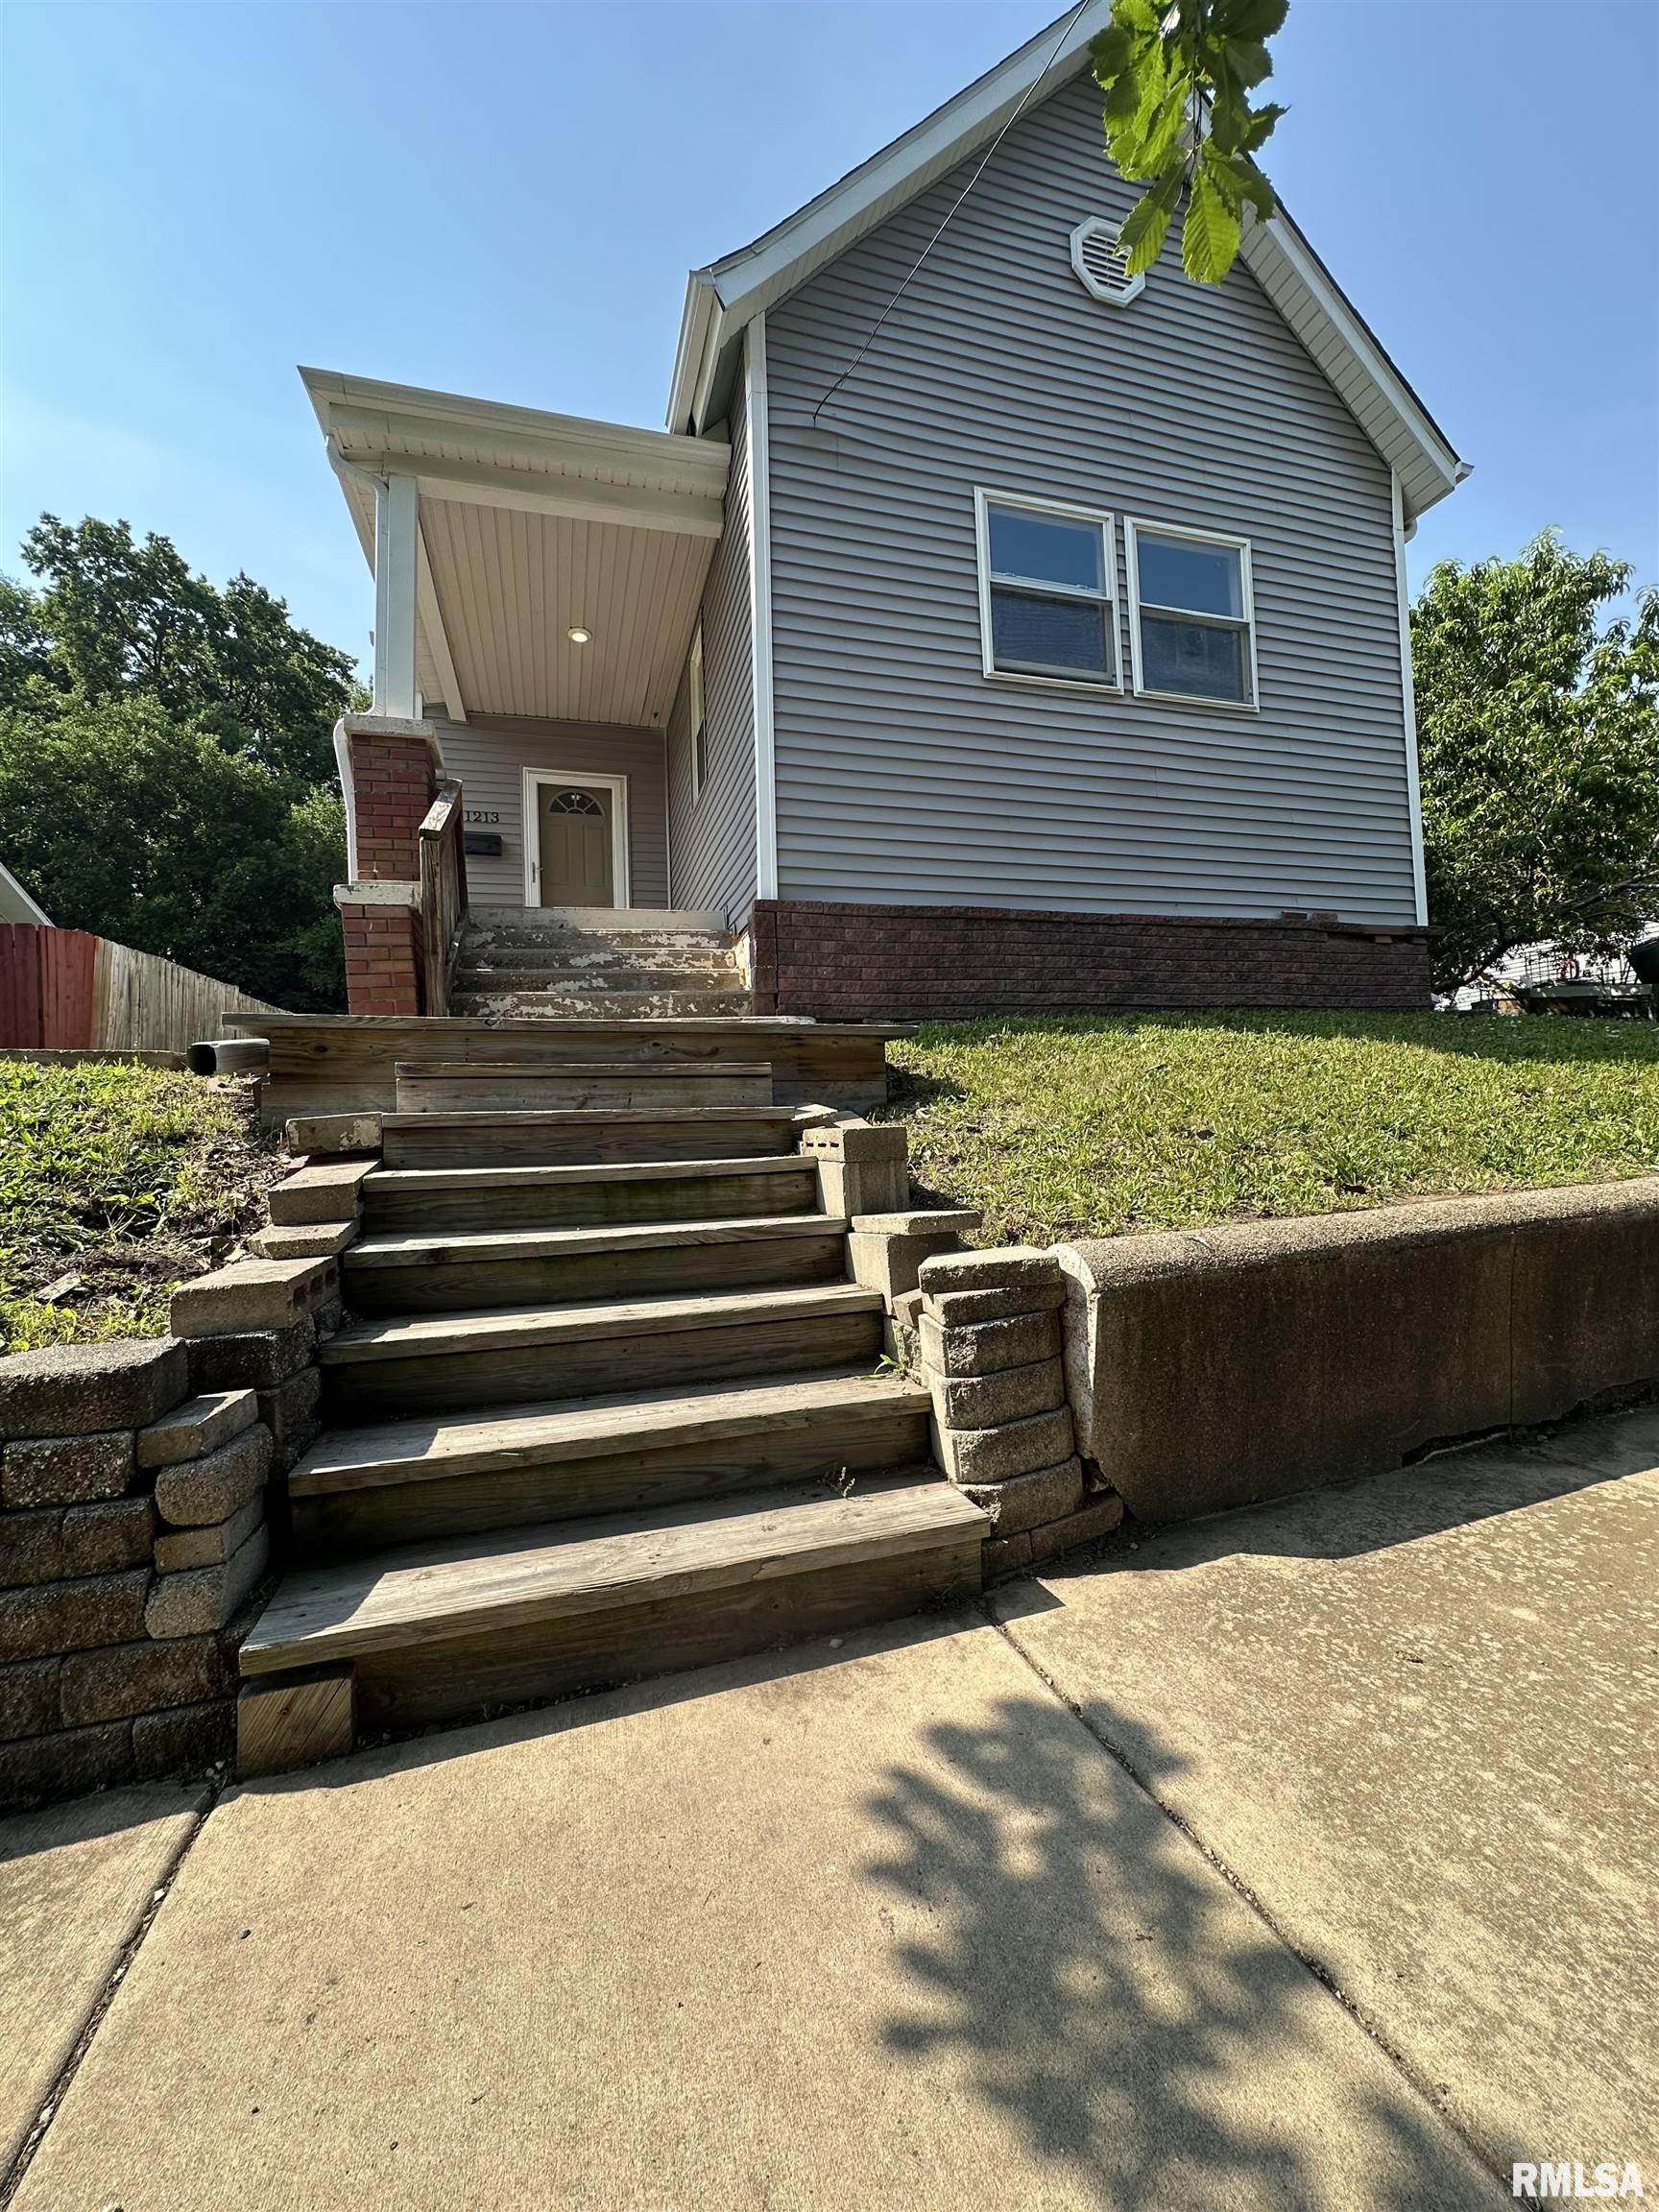
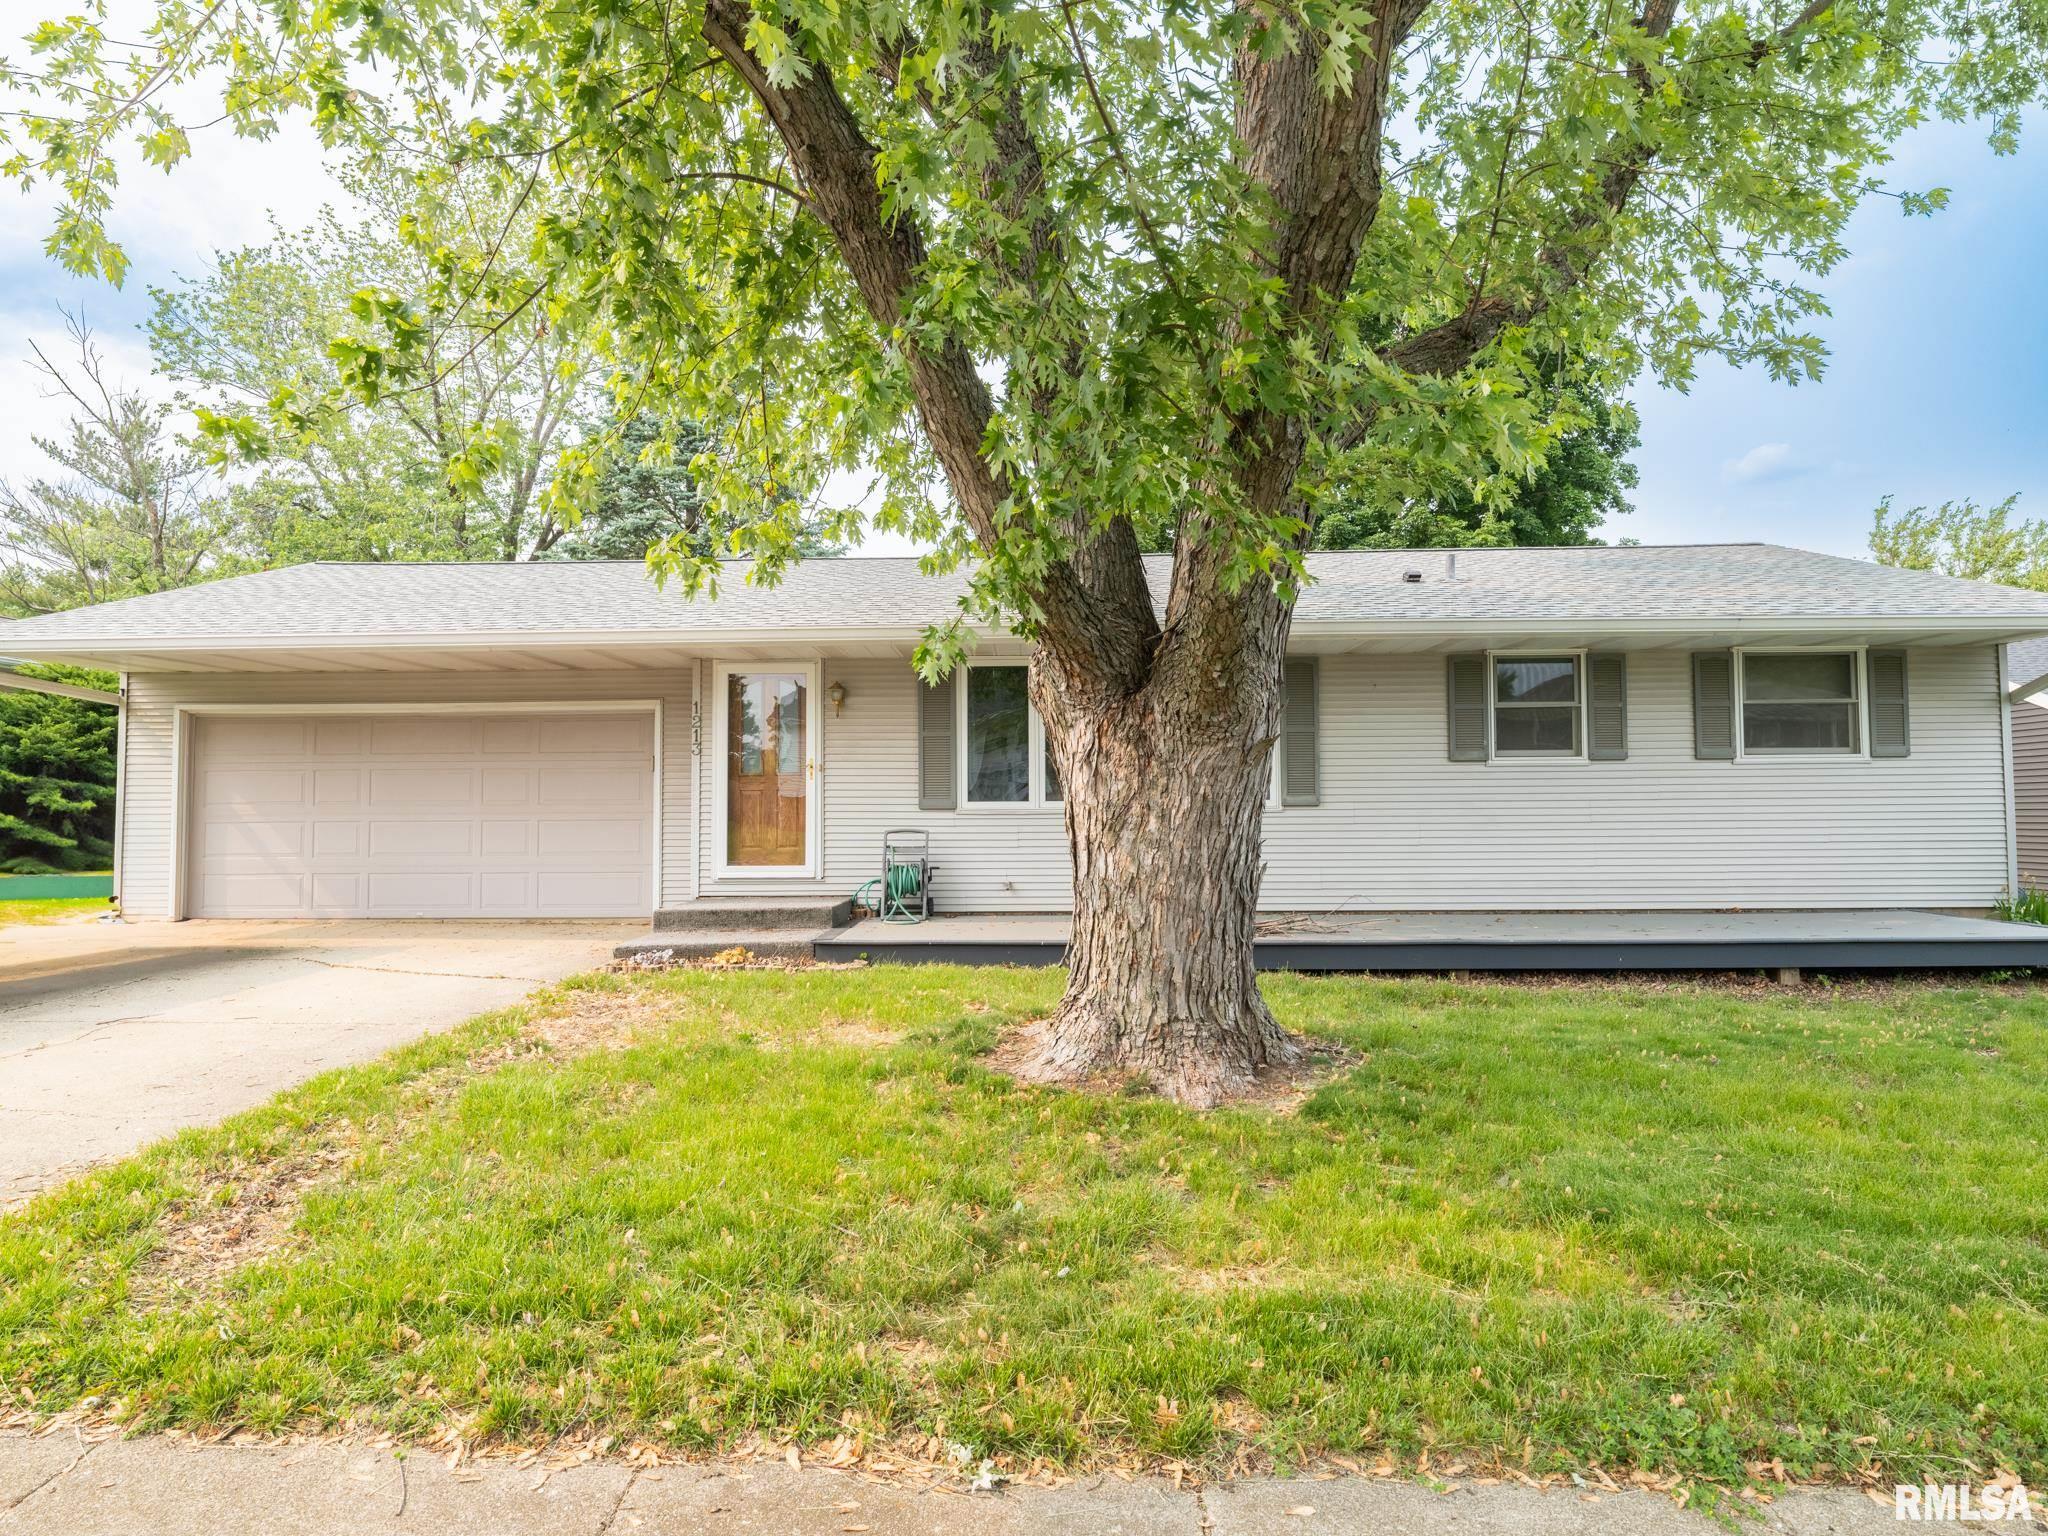
Active
$92,000
4
bds
|
1
ba
|
1,302
sqft
|
built
1930
1213 NE Glendale Ave, Peoria, IL 61603
$279
Cash flow
15.8%
Cash-on-Cash Return
9.9%
Cap rate
1.3%
Rent to Value Ratio
Active
$84,900
2
bds
|
1
ba
|
912
sqft
|
built
1963
3201 W Sylvan Ln, Peoria, IL 61615
$211
Cash flow
13.0%
Cash-on-Cash Return
9.3%
Cap rate
1.5%
Rent to Value Ratio
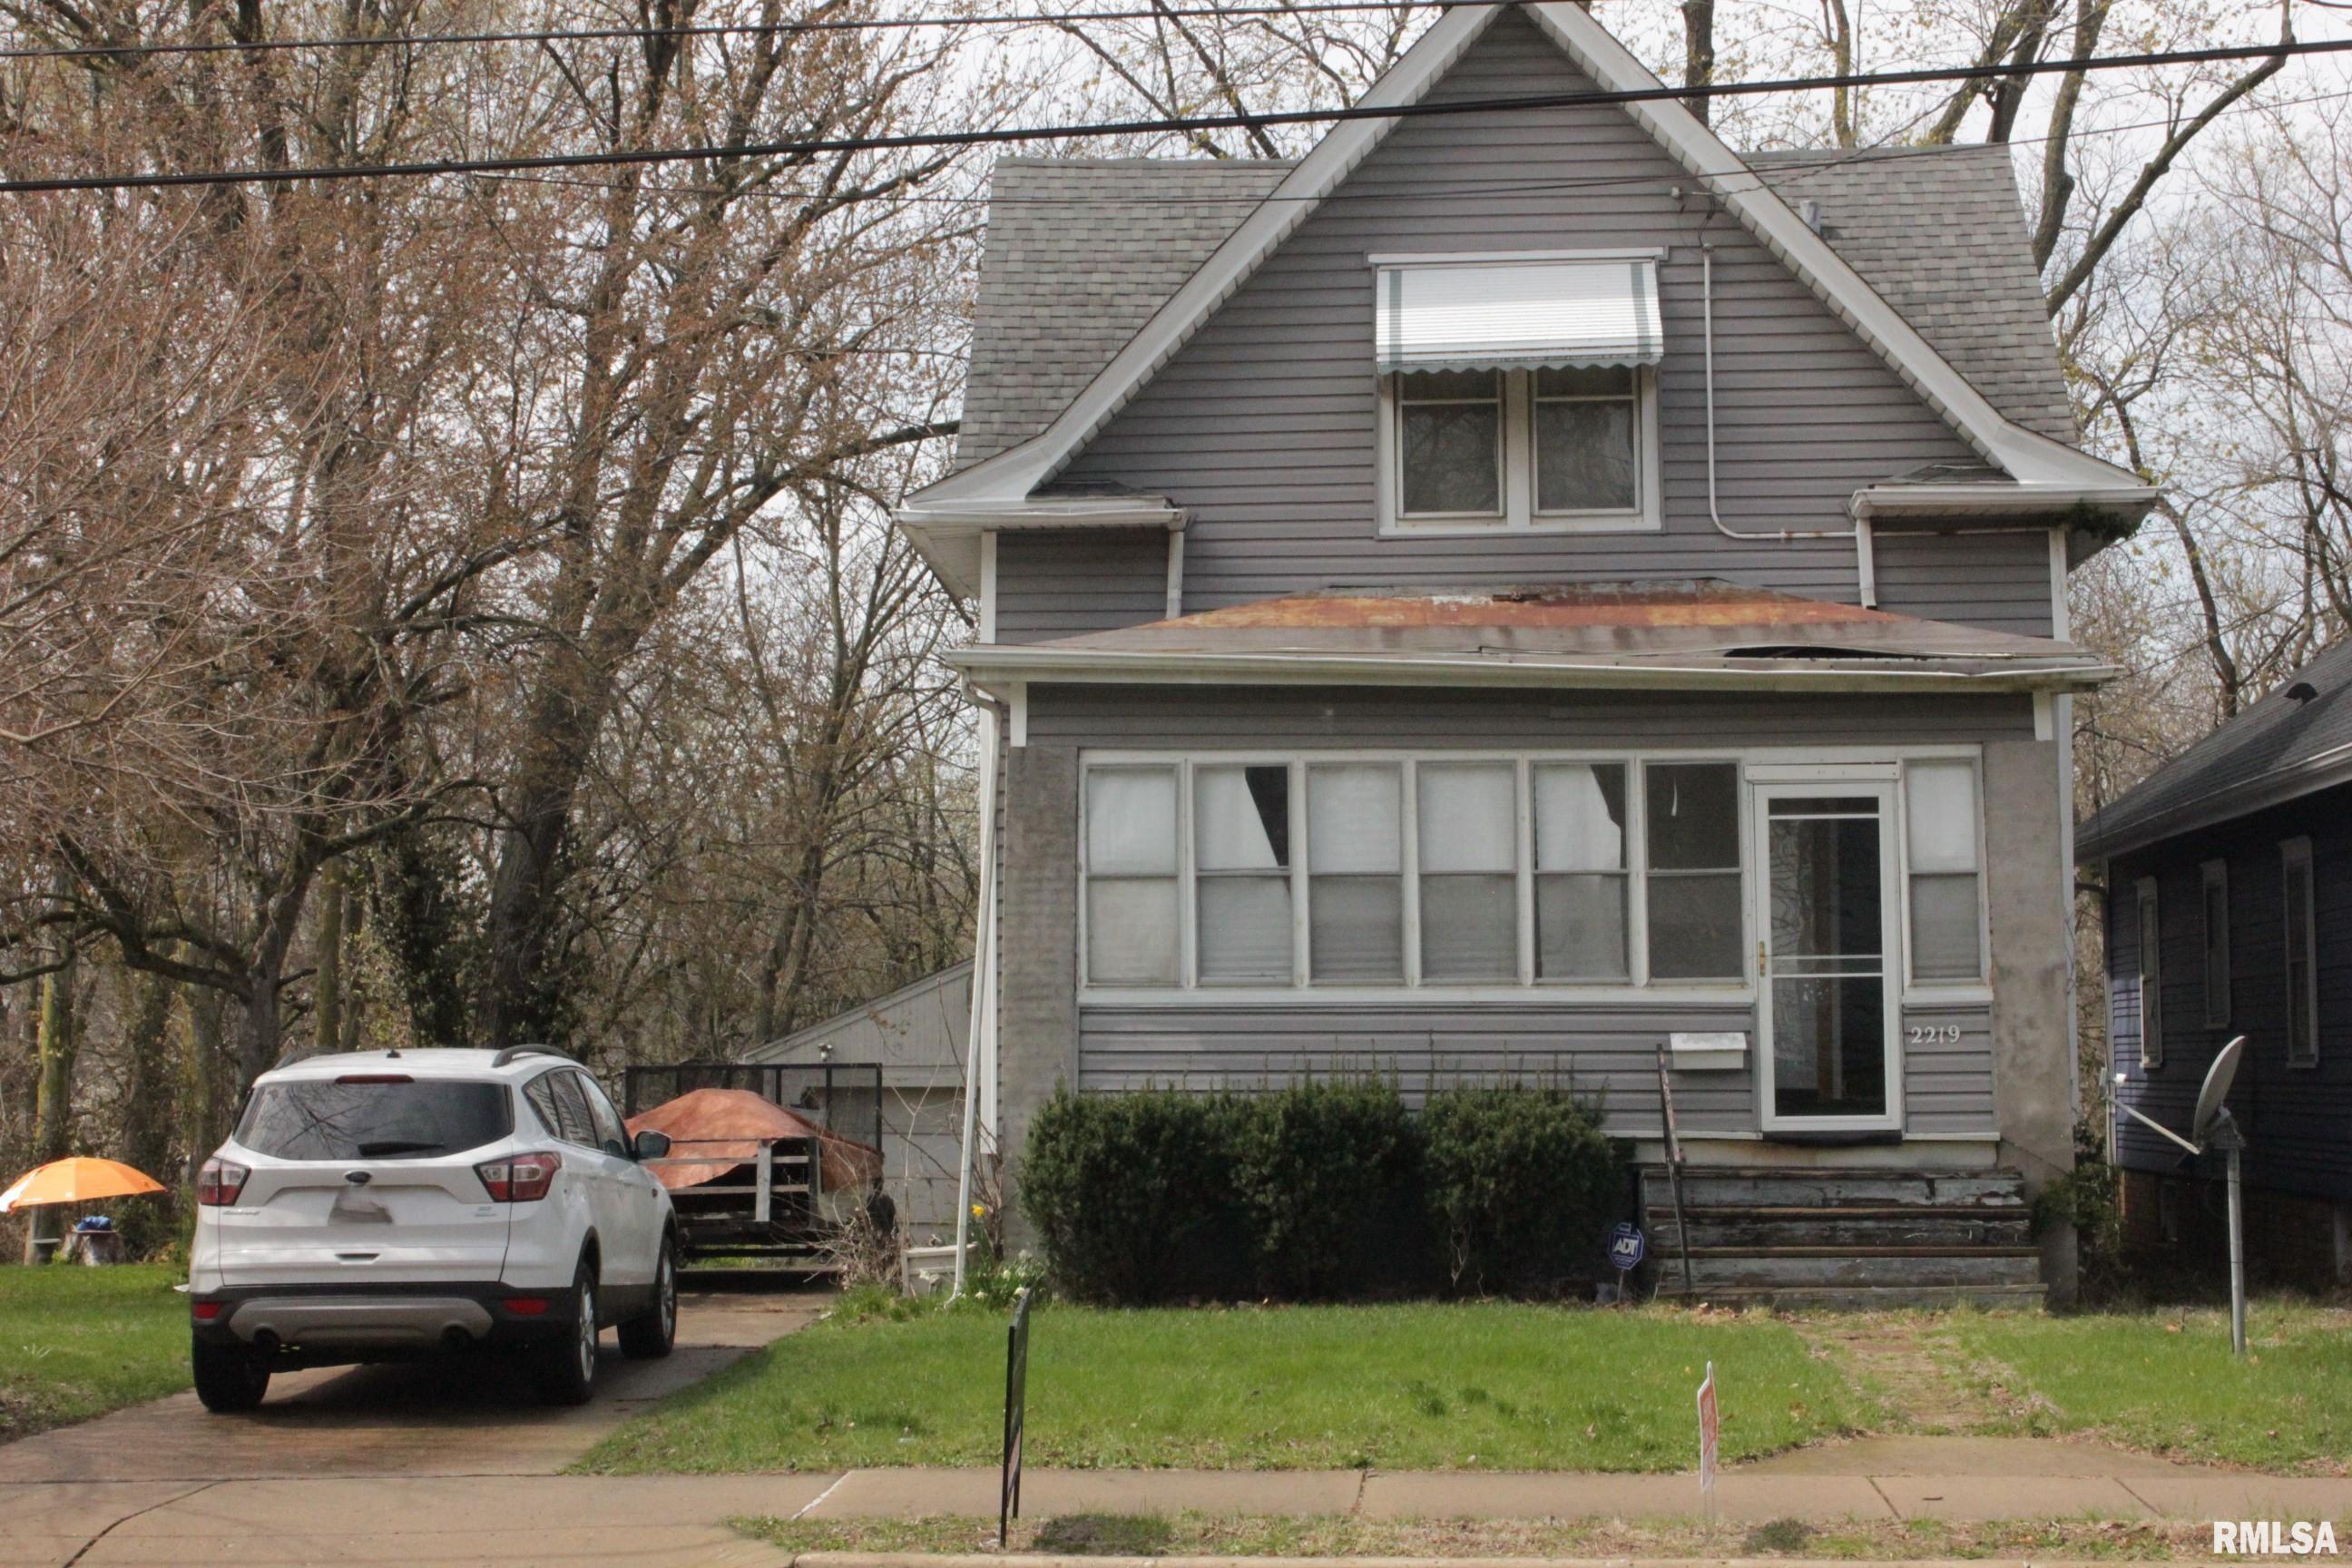
Active
$70,000
3
bds
|
1
ba
|
1,322
sqft
|
built
1910
2219 N North St, Peoria, IL 61604
$529
Cash flow
8.8%
Cash-on-Cash Return
9.1%
Cap rate
1.4%
Rent to Value Ratio
Active
$41,000
3
bds
|
1
ba
|
912
sqft
|
built
1900
2316 W Wiswall St, Peoria, IL 61605
$599
Cash flow
17.0%
Cash-on-Cash Return
17.5%
Cap rate
2.4%
Rent to Value Ratio
Active
$350,000
6
bds
|
3
ba
|
896
sqft
|
built
1954
4221 N Galena Rd, Peoria, IL 61614
$-1,803
Cash flow
-26.9%
Cash-on-Cash Return
0.1%
Cap rate
0.4%
Rent to Value Ratio

Active
$49,000
3
bds
|
1
ba
|
1,216
sqft
|
built
1914
200 E Thrush Ave, Peoria, IL 61603
$651
Cash flow
15.5%
Cash-on-Cash Return
15.9%
Cap rate
2.2%
Rent to Value Ratio
Active
$80,000
3
bds
|
2
ba
|
1,498
sqft
|
built
1916
1607 N Bigelow St, Peoria, IL 61604
$234
Cash flow
15.3%
Cash-on-Cash Return
9.8%
Cap rate
1.5%
Rent to Value Ratio
Active
$119,900
4
bds
|
2
ba
|
1,958
sqft
|
built
1950
2505 N Hilltop Ct, Peoria, IL 61604
$16
Cash flow
0.7%
Cash-on-Cash Return
6.5%
Cap rate
1.1%
Rent to Value Ratio
Active
$45,000
2
bds
|
1
ba
|
728
sqft
|
built
1925
2304 W Malone St, Peoria, IL 61605
$408
Cash flow
10.6%
Cash-on-Cash Return
10.9%
Cap rate
1.6%
Rent to Value Ratio
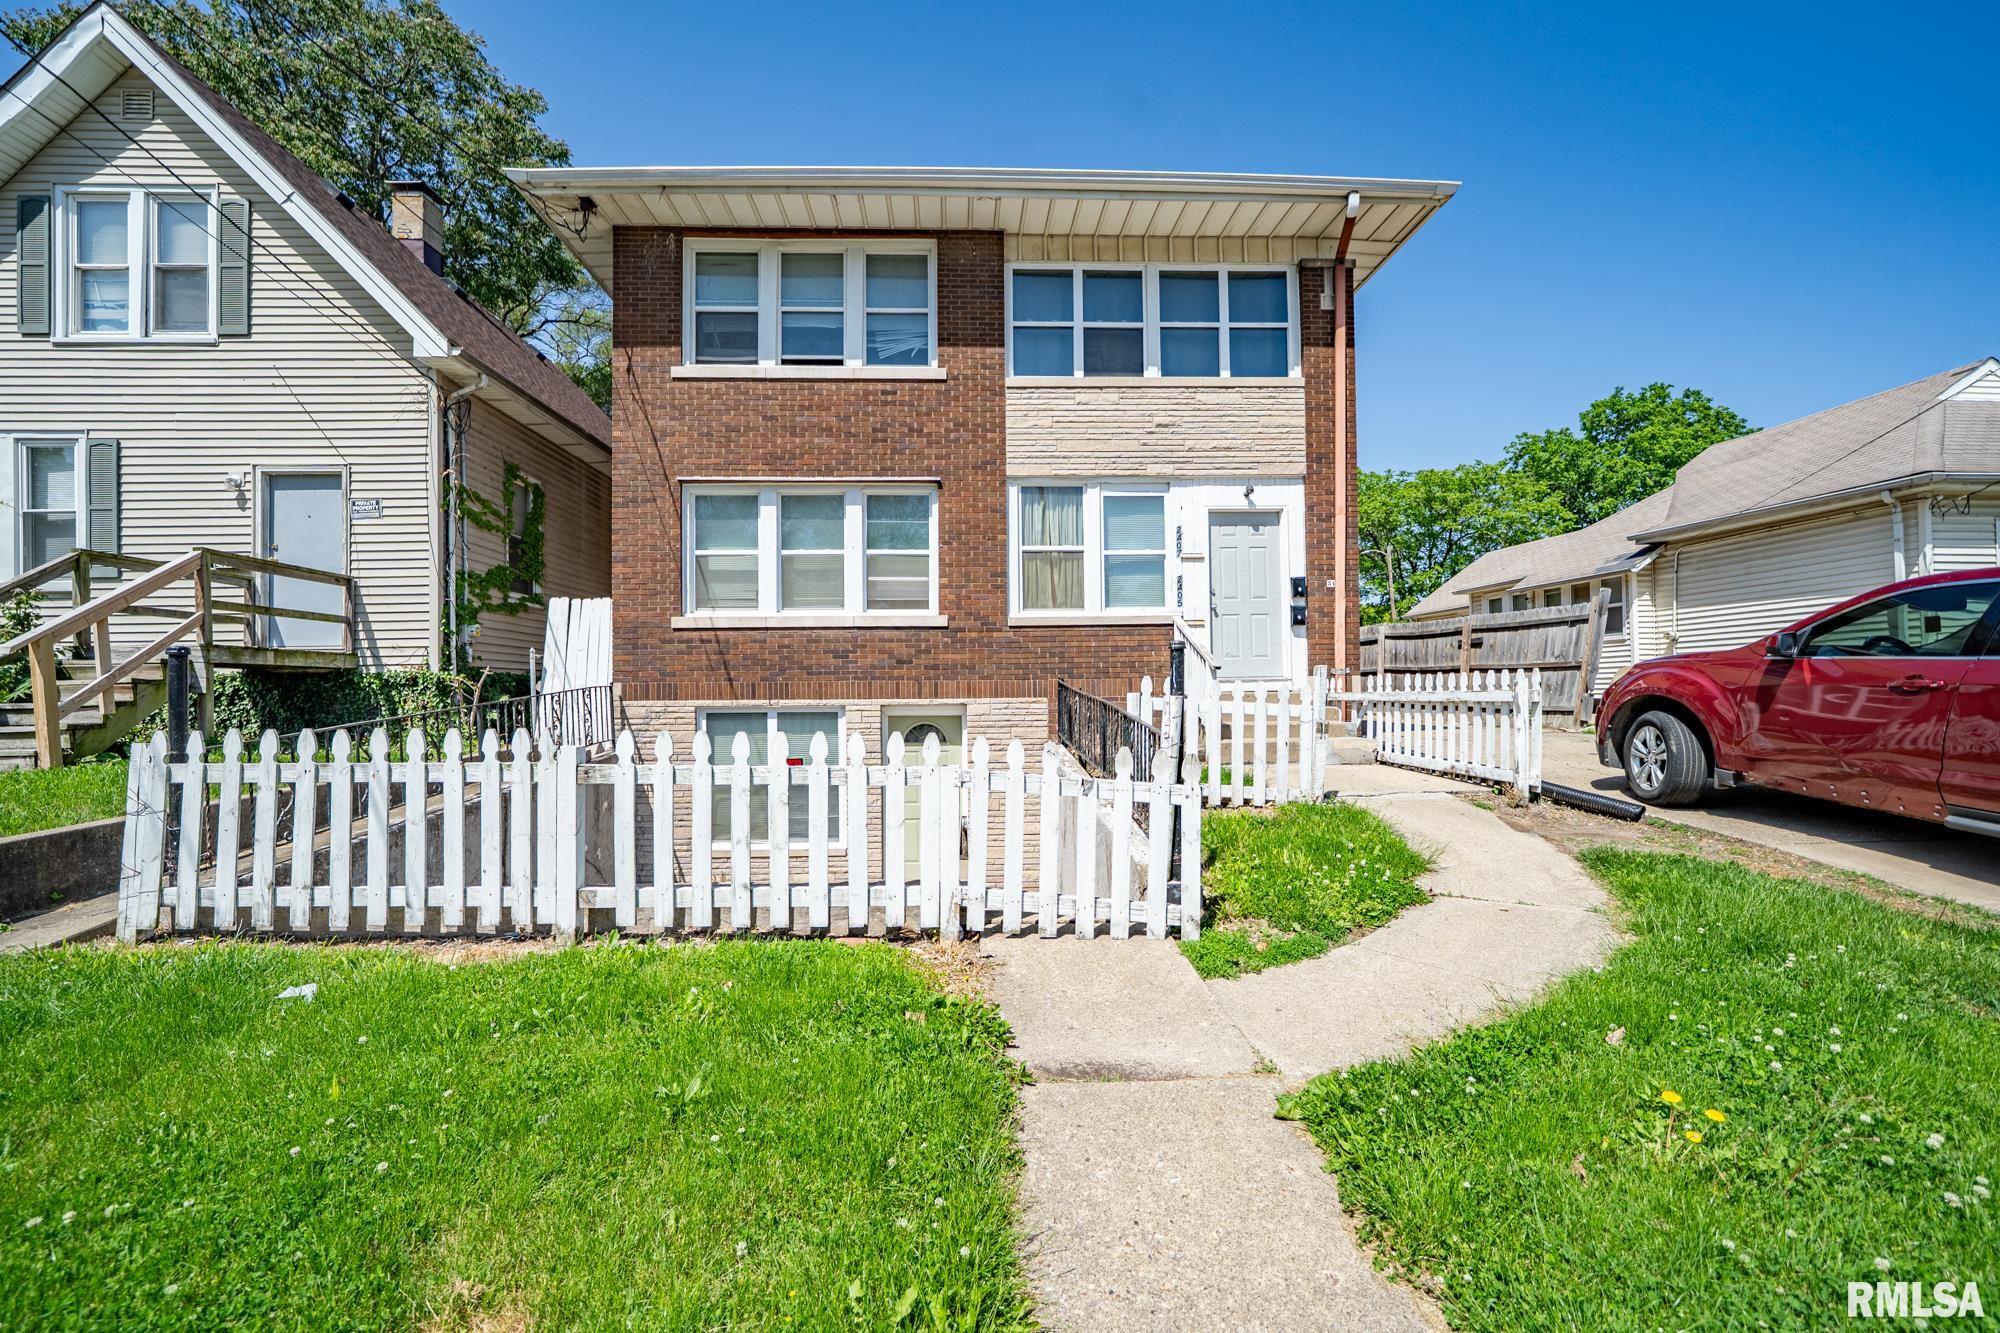
Active
$239,900
bds
|
0
ba
|
0
sqft
|
built
1925
2405 N Sheridan Rd, Peoria, IL 61604
$-330
Cash flow
-7.2%
Cash-on-Cash Return
4.6%
Cap rate
0.7%
Rent to Value Ratio
Active
$35,000
2
bds
|
1
ba
|
1,056
sqft
|
built
1910
1415 S Greenlawn St, Peoria, IL 61602
$861
Cash flow
28.7%
Cash-on-Cash Return
29.5%
Cap rate
3.7%
Rent to Value Ratio

Active
$185,000
3
bds
|
2
ba
|
2,338
sqft
|
built
1972
4726 N Ridgelawn Pl, Peoria, IL 61615
$-113
Cash flow
-3.2%
Cash-on-Cash Return
5.6%
Cap rate
1.0%
Rent to Value Ratio
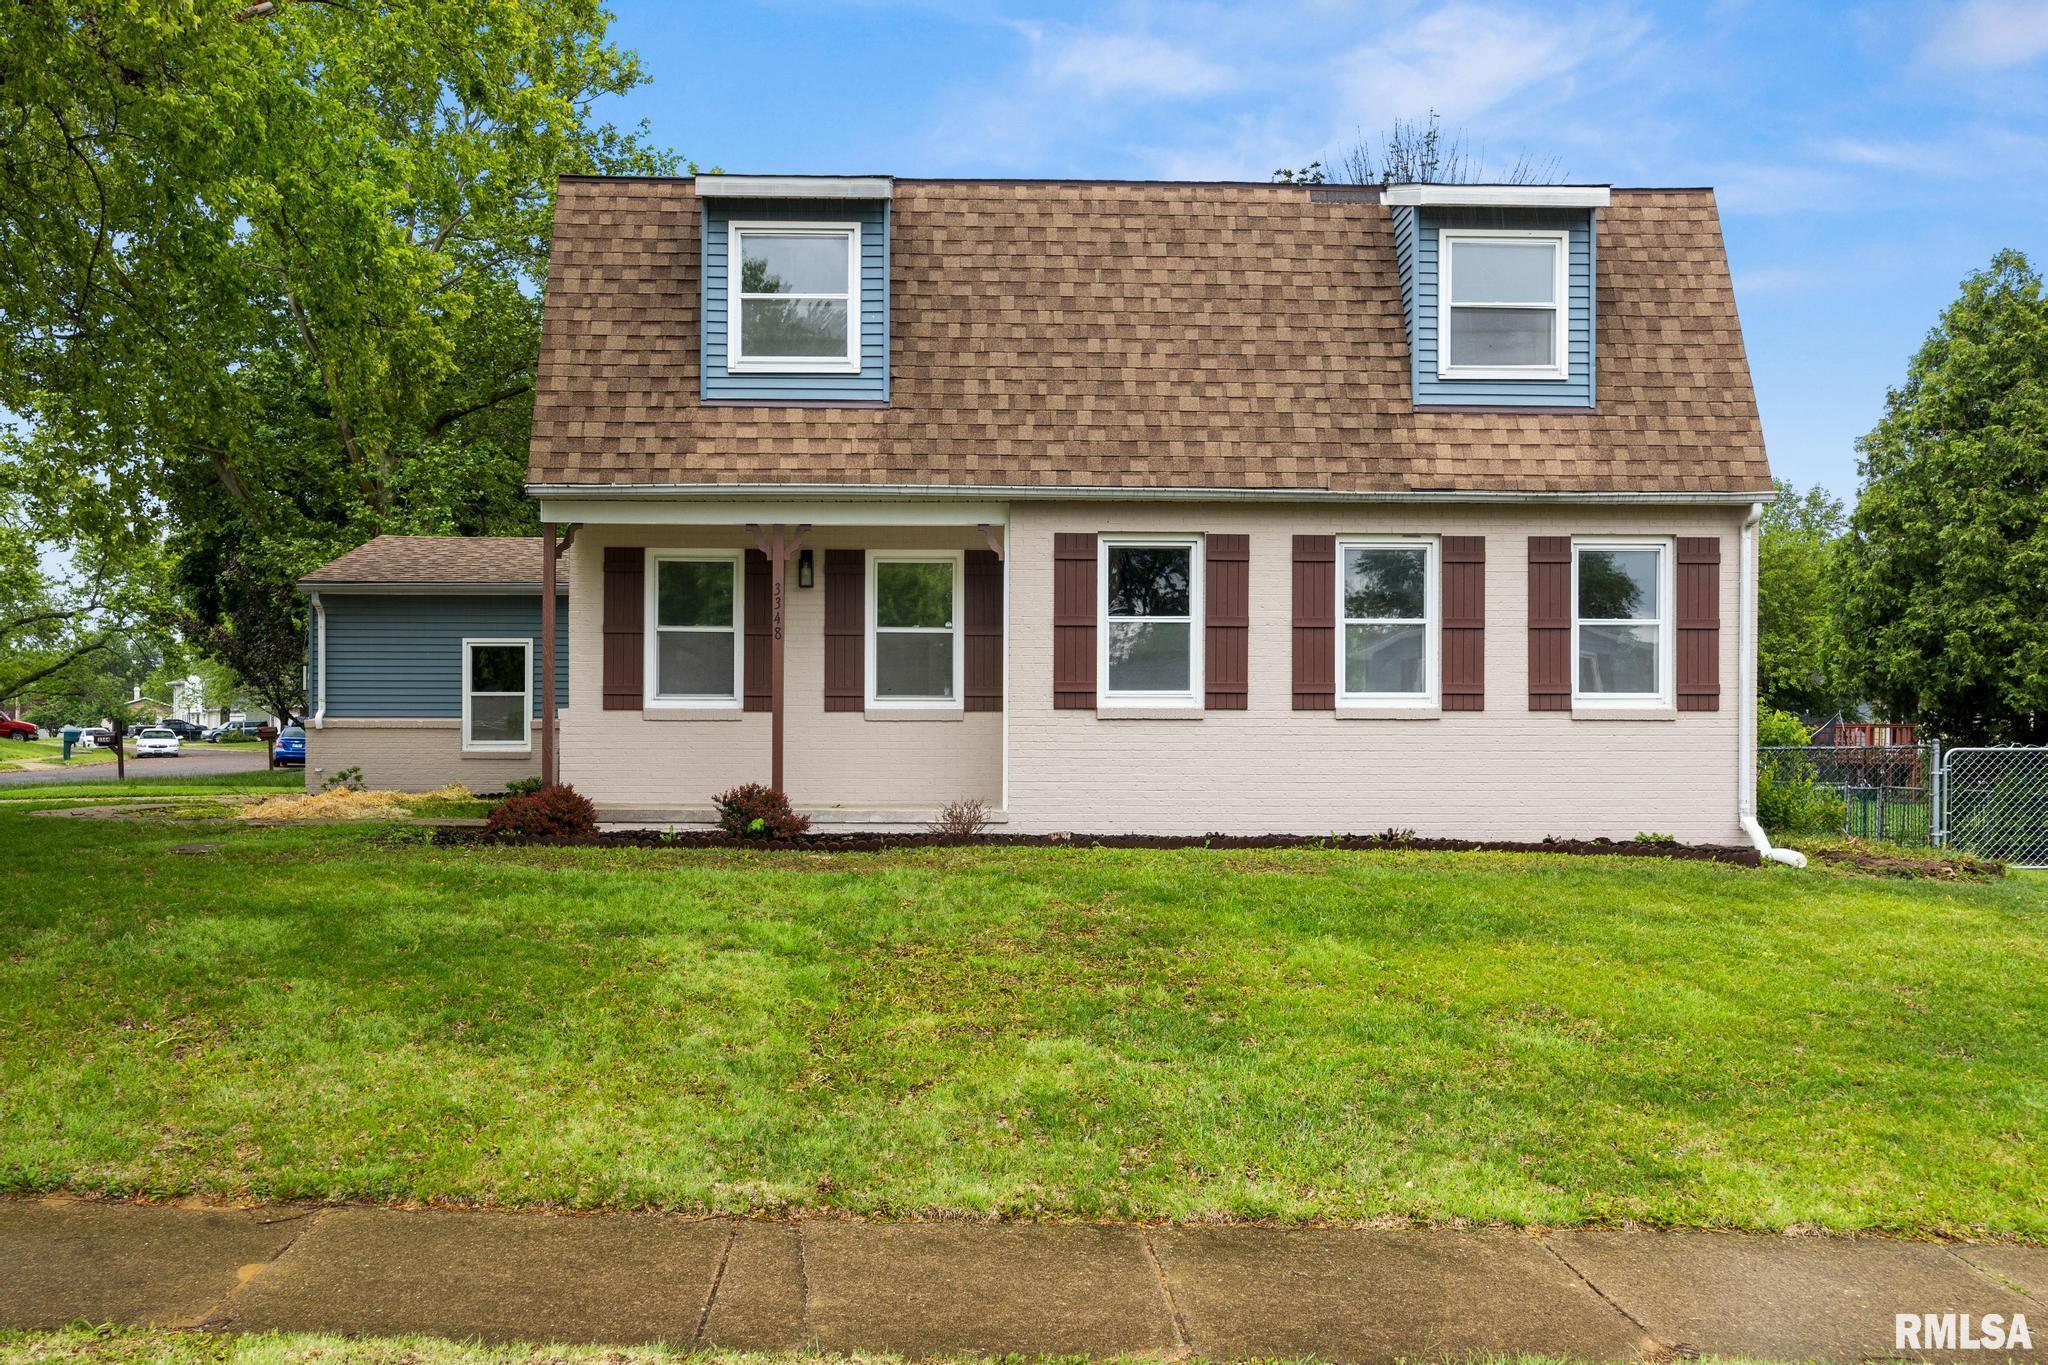
Active
$244,900
3
bds
|
4
ba
|
2,700
sqft
|
built
1975
3348 W Lisa Ln, Peoria, IL 61615
$-550
Cash flow
-11.7%
Cash-on-Cash Return
3.6%
Cap rate
0.6%
Rent to Value Ratio
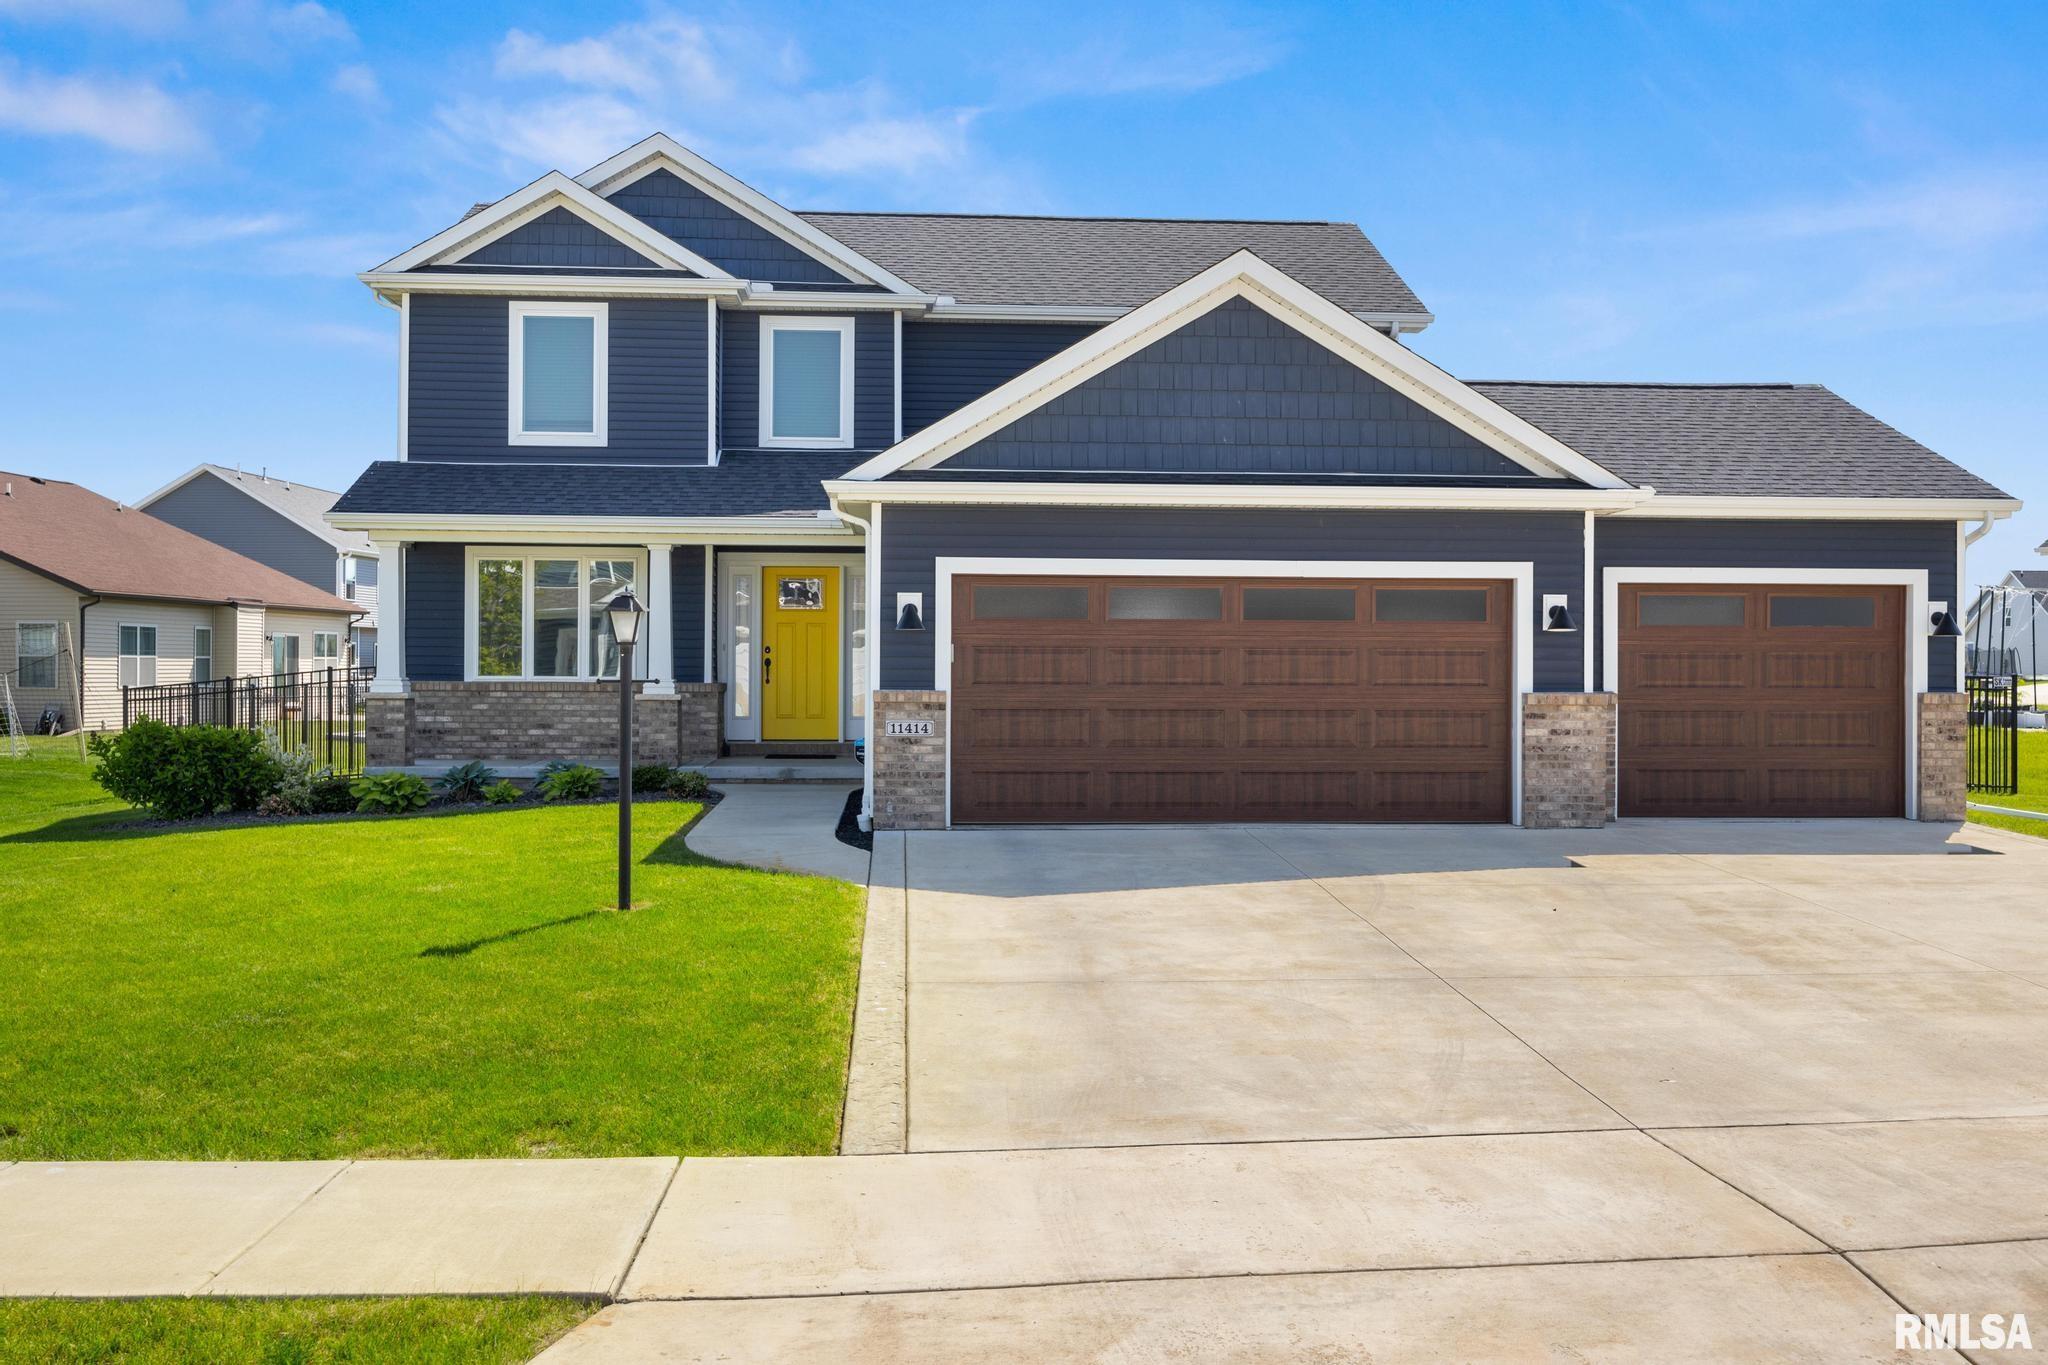
Active
$469,000
4
bds
|
4
ba
|
2,429
sqft
|
built
2020
11414 N Joseph St, Dunlap, IL 61525
$-1,726
Cash flow
-19.2%
Cash-on-Cash Return
1.9%
Cap rate
0.5%
Rent to Value Ratio
Active
$59,990
4
bds
|
2
ba
|
1,260
sqft
|
built
1912
814 W Columbia Ter, Peoria, IL 61606
$933
Cash flow
18.1%
Cash-on-Cash Return
18.7%
Cap rate
2.7%
Rent to Value Ratio
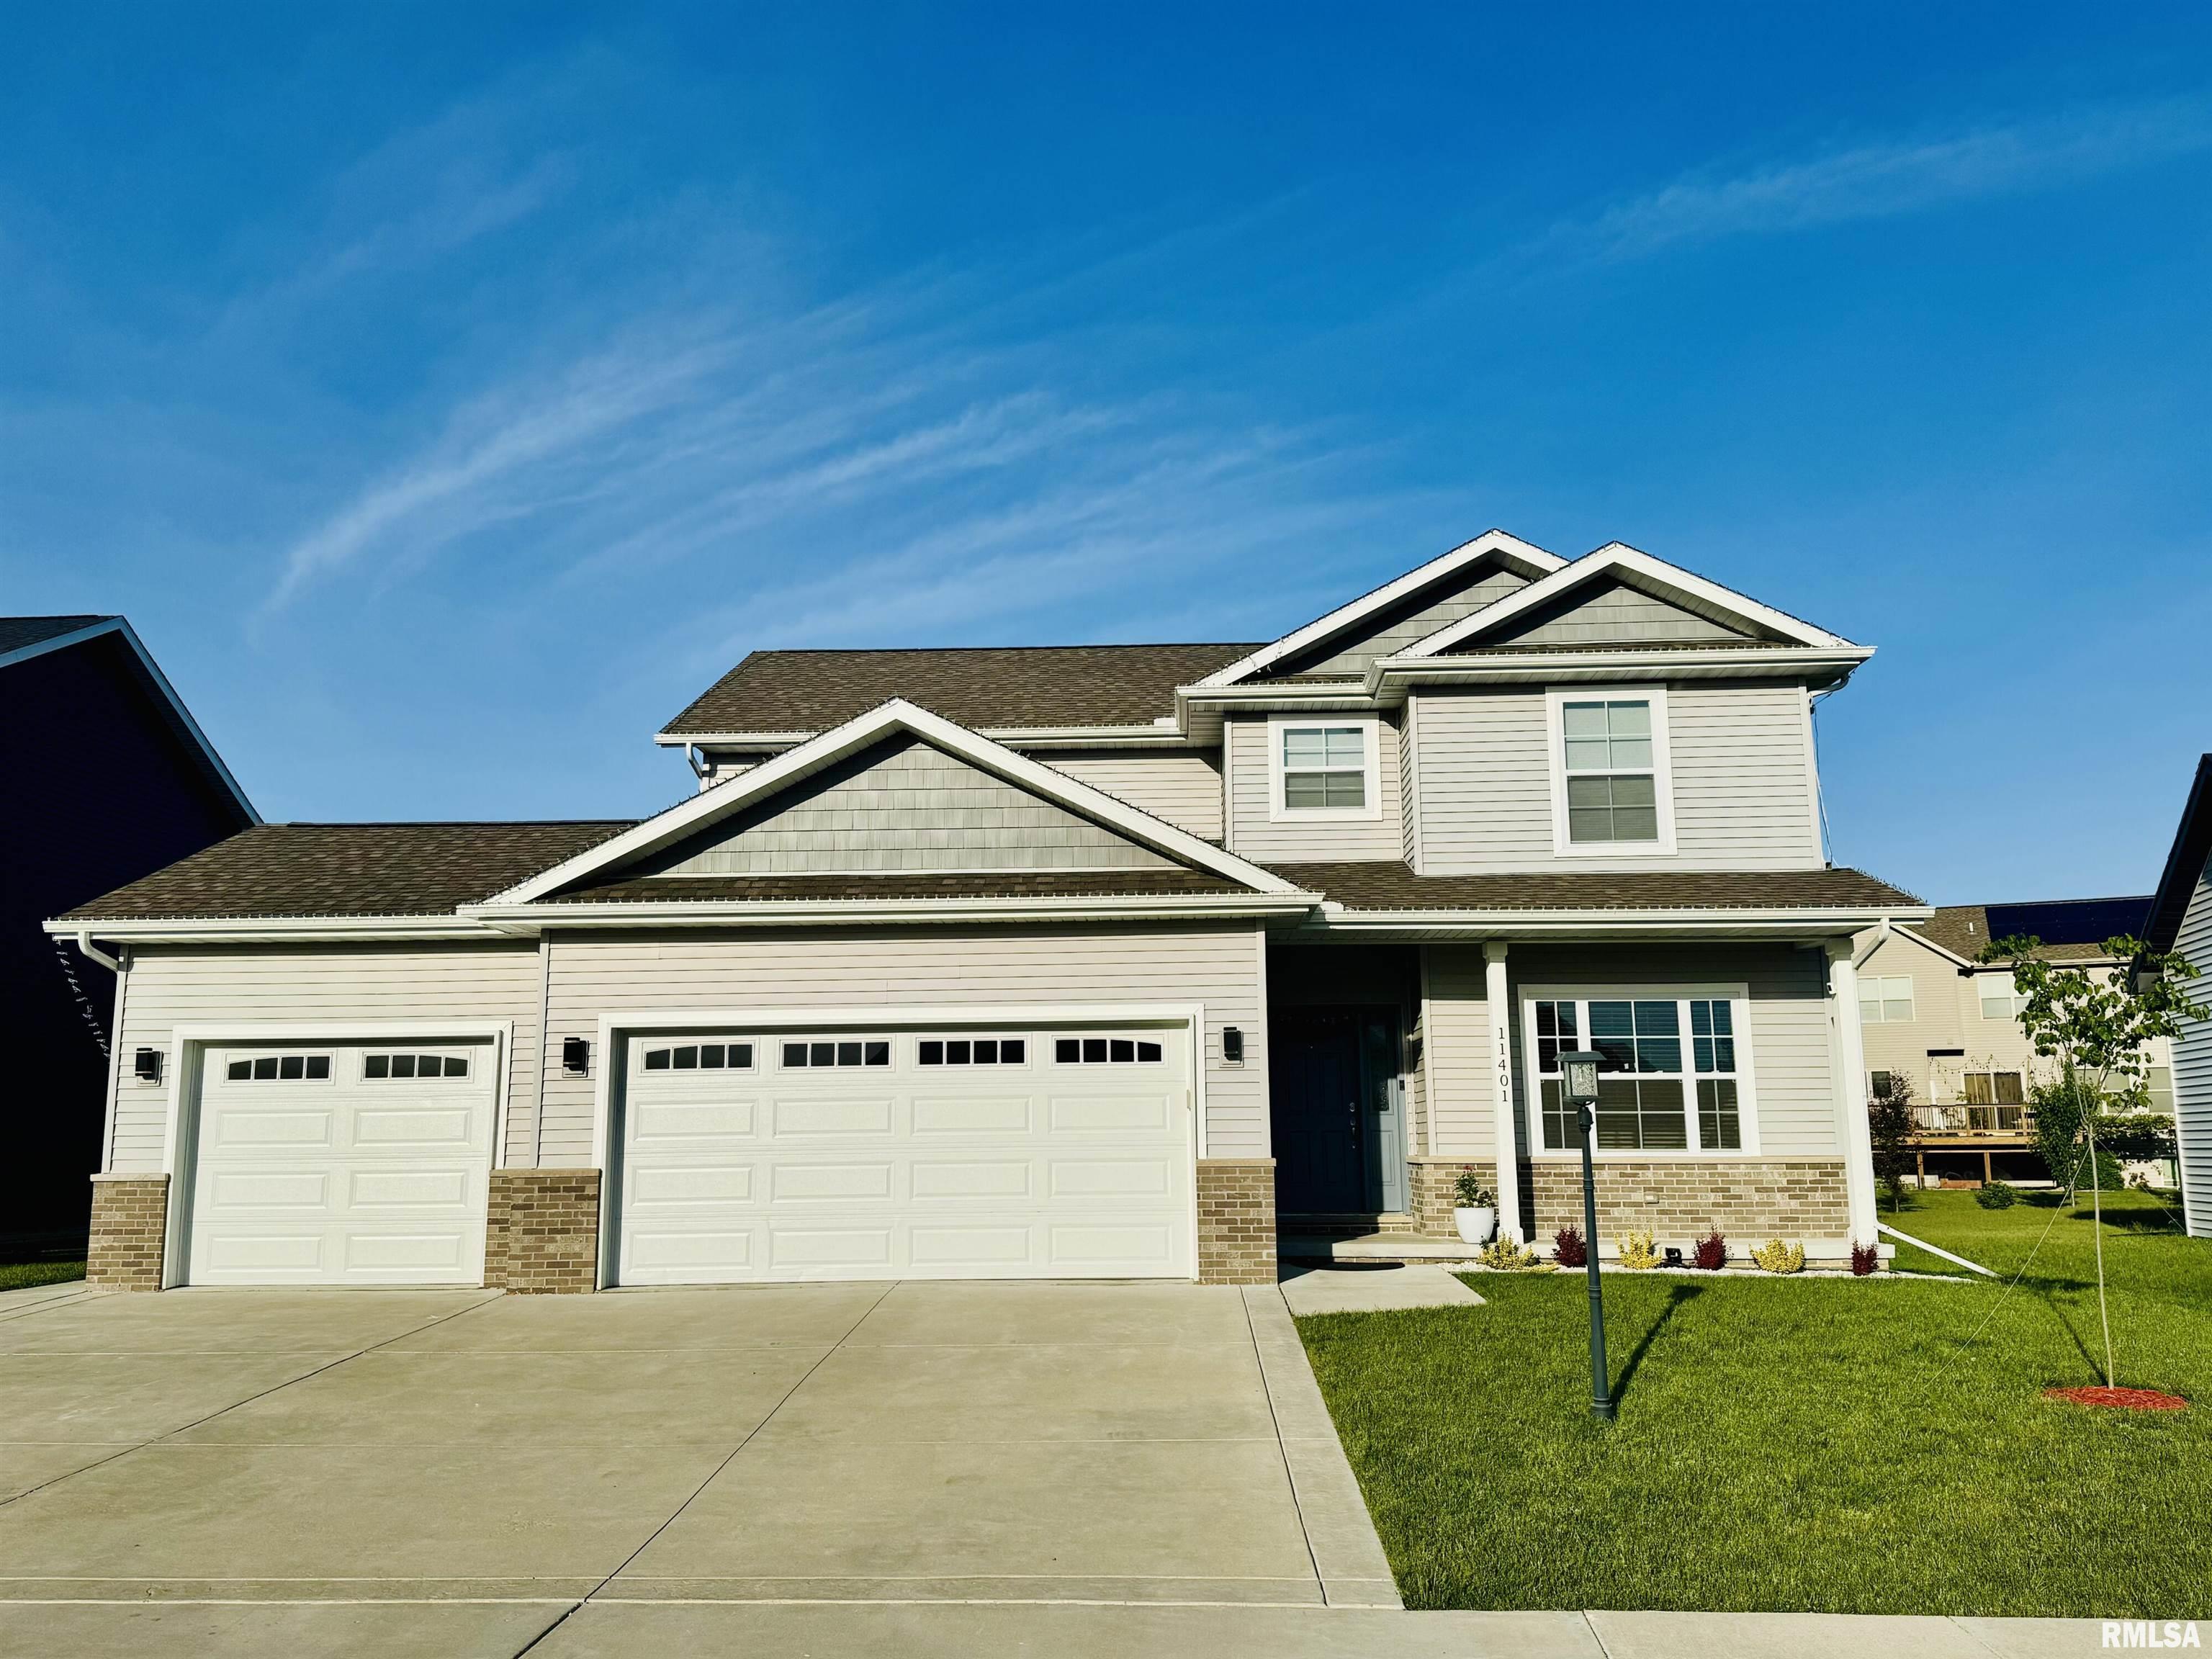
Active
$549,900
5
bds
|
4
ba
|
3,132
sqft
|
built
2022
11401 N Joseph St, Dunlap, IL 61525
$-1,907
Cash flow
-18.1%
Cash-on-Cash Return
2.1%
Cap rate
0.5%
Rent to Value Ratio
Active
$219,900
3
bds
|
2
ba
|
2,240
sqft
|
built
1974
1213 W Pine St, Chillicothe, IL 61523
$-413
Cash flow
-9.8%
Cash-on-Cash Return
4.0%
Cap rate
0.7%
Rent to Value Ratio

Active
$325,000
4
bds
|
5
ba
|
3,686
sqft
|
built
1920
1404 N Santa Fe Ave, Chillicothe, IL 61523
$-679
Cash flow
-10.9%
Cash-on-Cash Return
3.8%
Cap rate
0.7%
Rent to Value Ratio
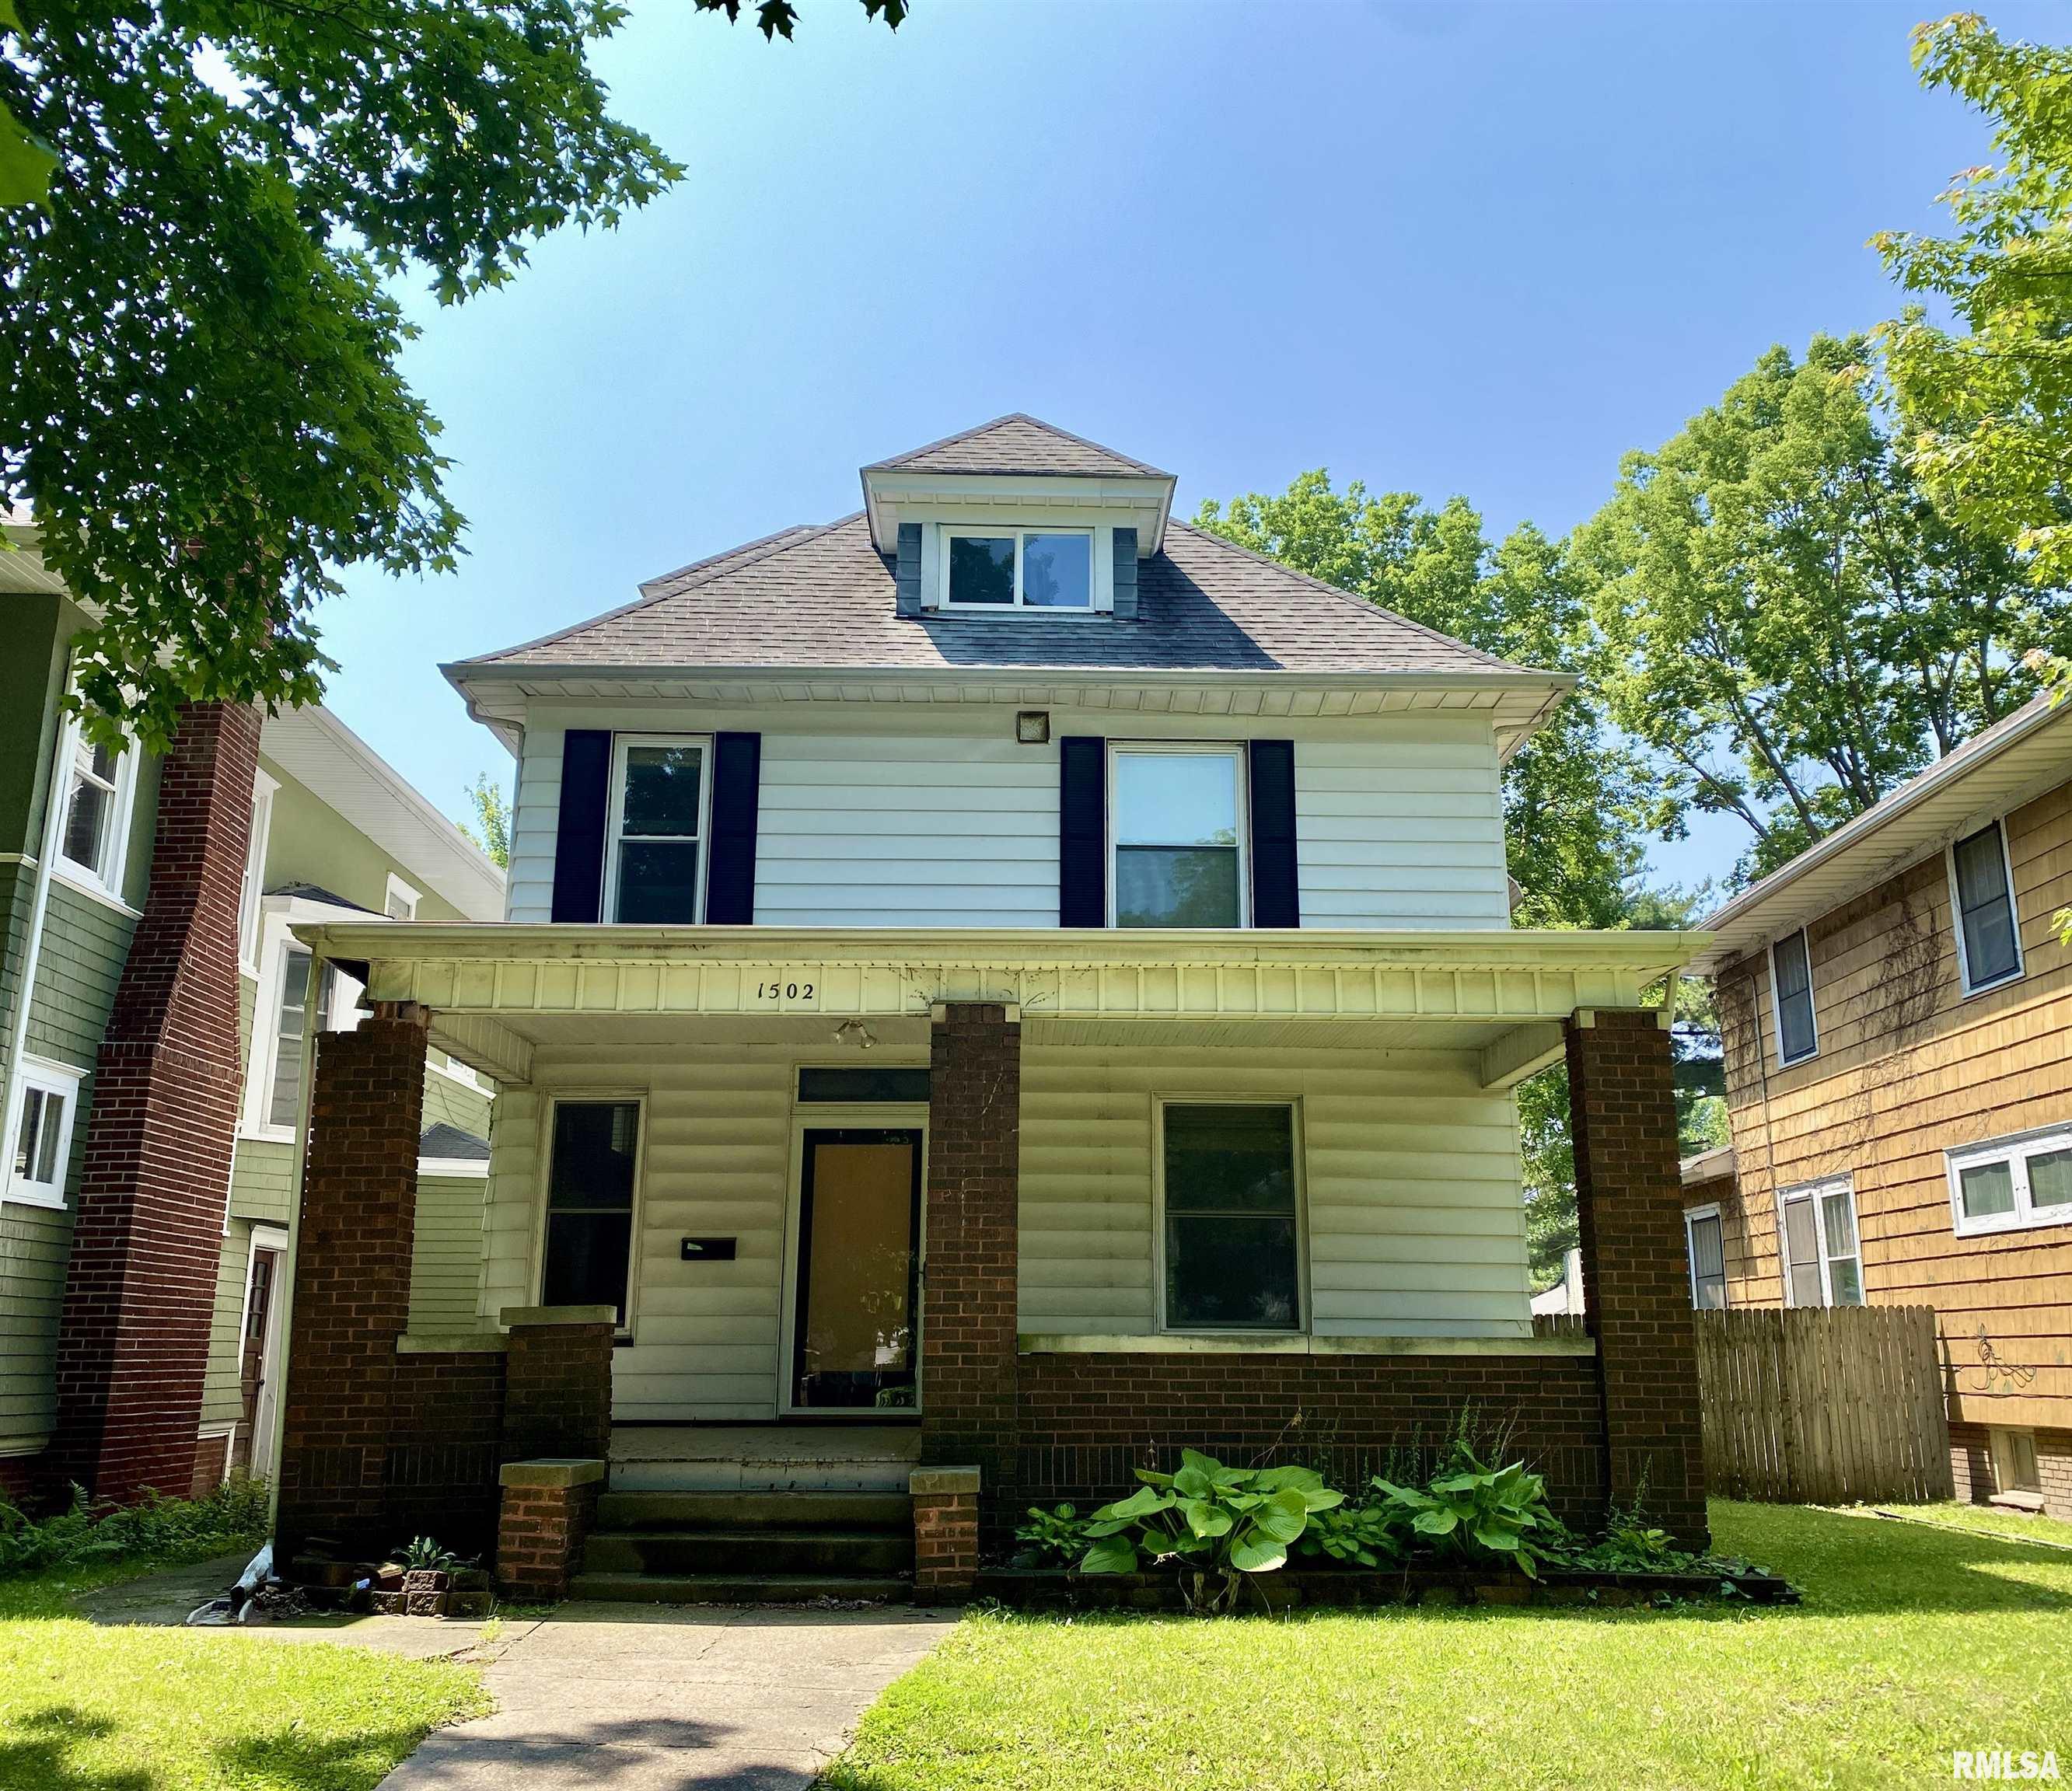
Active
$160,000
4
bds
|
2
ba
|
1,508
sqft
|
built
1912
1502 W Columbia Ter, Peoria, IL 61606
$20
Cash flow
0.7%
Cash-on-Cash Return
6.4%
Cap rate
1.1%
Rent to Value Ratio

Active
$355,000
5
bds
|
4
ba
|
3,124
sqft
|
built
2002
2331 W Molly Ln, Dunlap, IL 61525
$-737
Cash flow
-10.8%
Cash-on-Cash Return
3.8%
Cap rate
0.7%
Rent to Value Ratio

Active
$74,900
4
bds
|
1
ba
|
1,246
sqft
|
built
1931
1917 N Broadway St, Peoria, IL 61604
$765
Cash flow
11.9%
Cash-on-Cash Return
12.3%
Cap rate
1.7%
Rent to Value Ratio
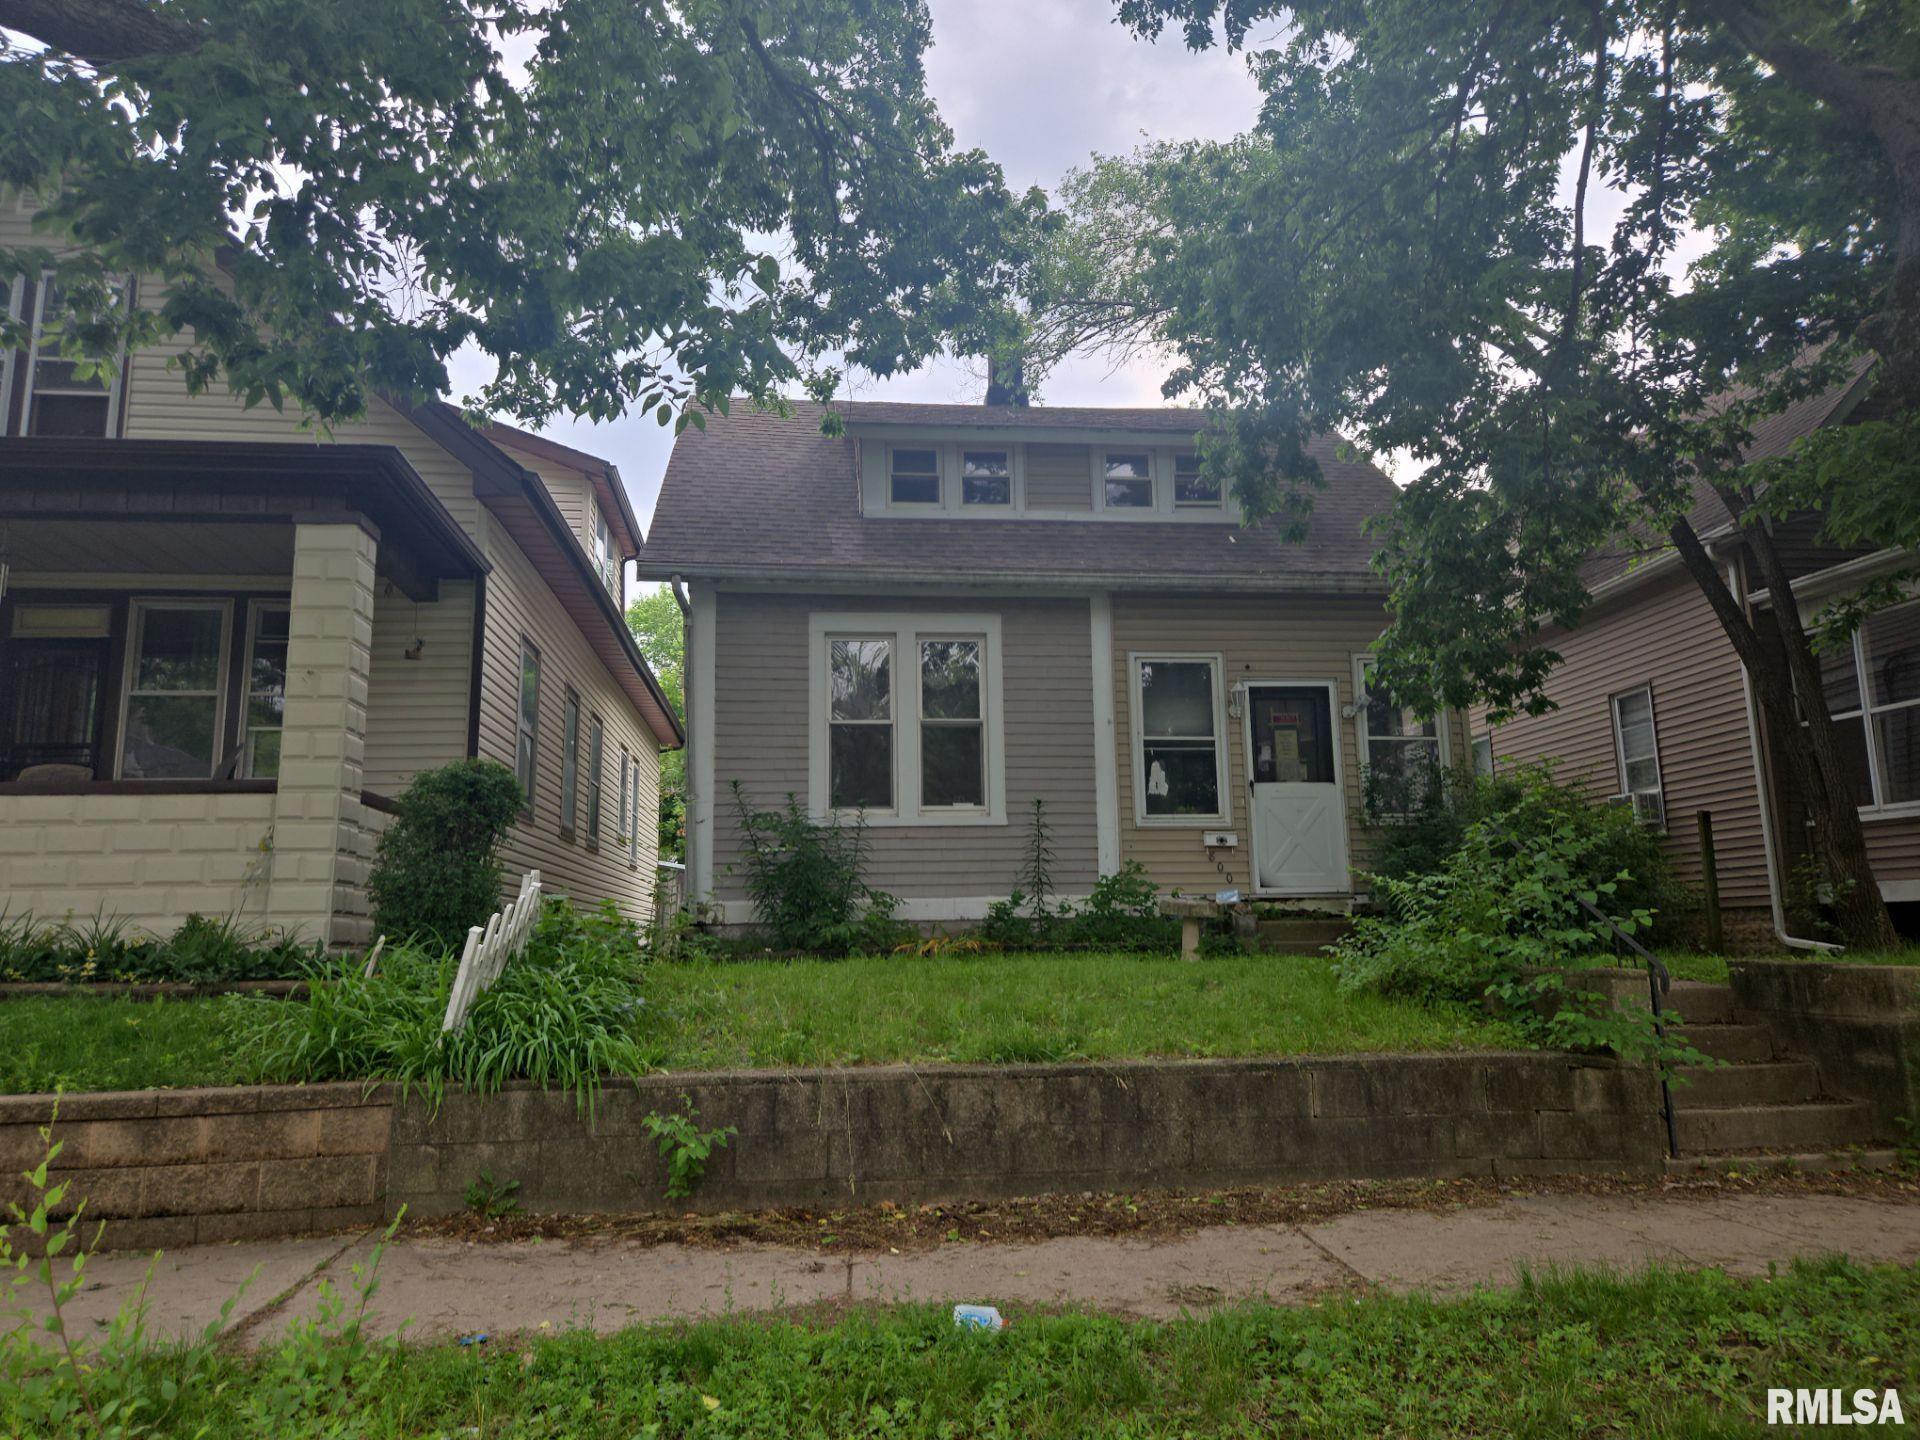
Active
$33,900
2
bds
|
1
ba
|
944
sqft
|
built
1900
800 S Greenlawn Ave, Peoria, IL 61605
$668
Cash flow
23.0%
Cash-on-Cash Return
23.6%
Cap rate
3.2%
Rent to Value Ratio
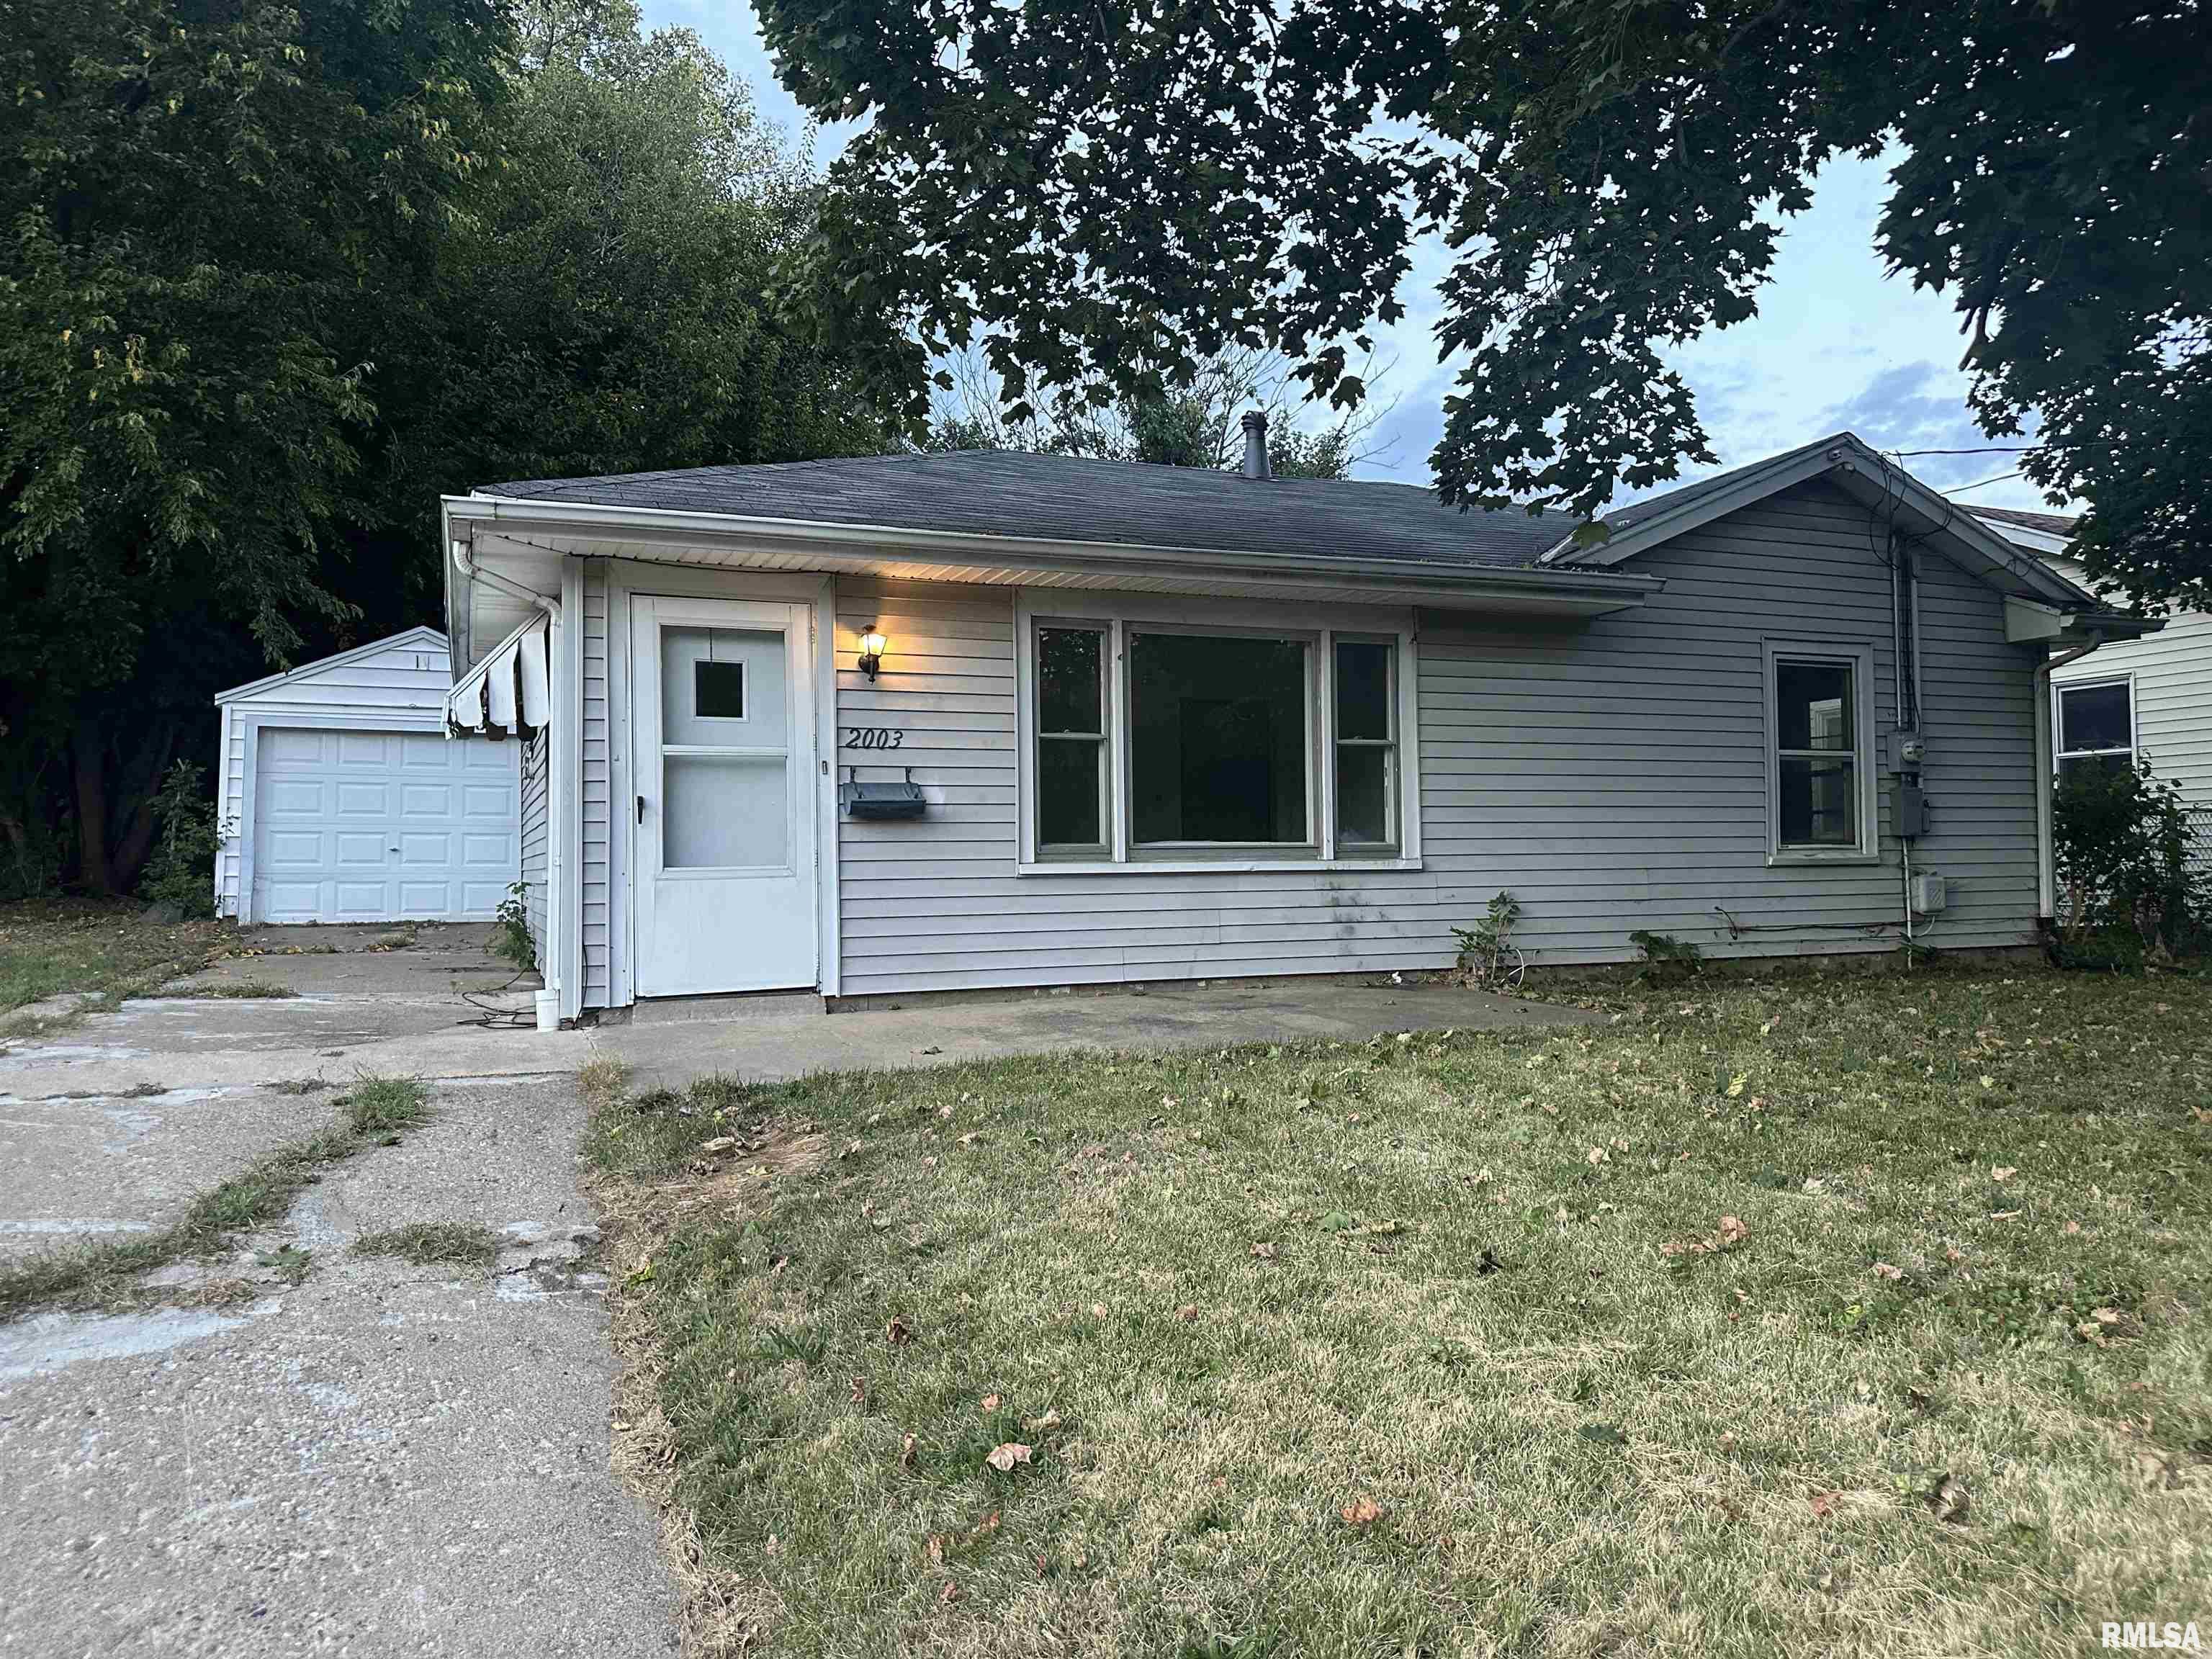
Active
$65,000
2
bds
|
1
ba
|
748
sqft
|
built
1955
2003 W Martin St, Peoria, IL 61605
$536
Cash flow
9.6%
Cash-on-Cash Return
9.9%
Cap rate
1.4%
Rent to Value Ratio
Active
$299,900
3
bds
|
4
ba
|
3,028
sqft
|
built
1990
6410 N Live Oak Ct, Peoria, IL 61615
$-654
Cash flow
-11.4%
Cash-on-Cash Return
3.7%
Cap rate
0.8%
Rent to Value Ratio
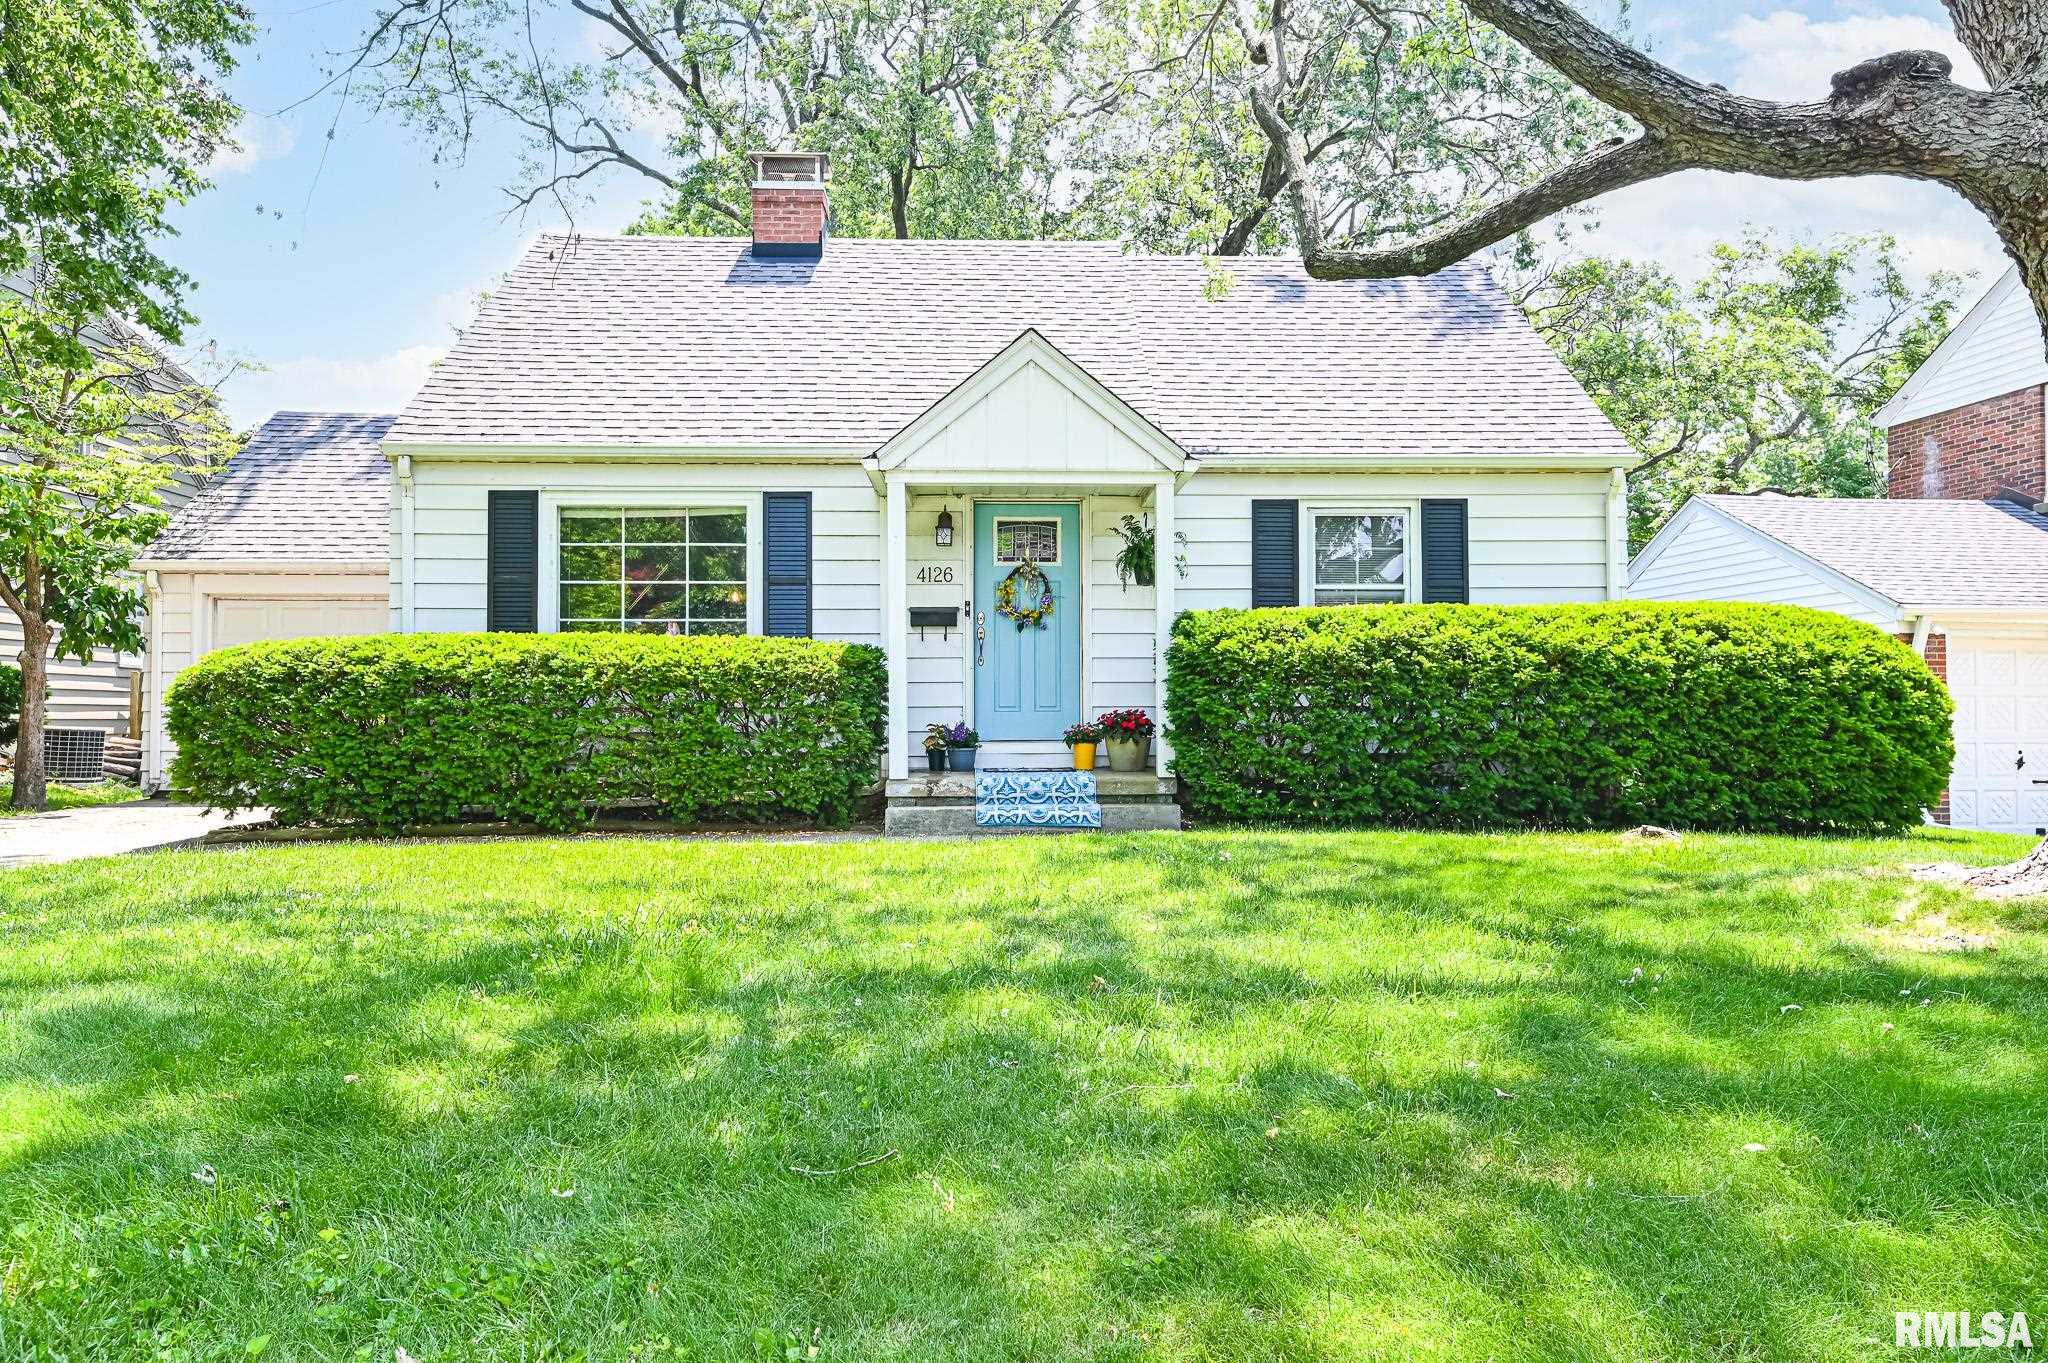
Active
$179,900
3
bds
|
2
ba
|
1,872
sqft
|
built
1949
4126 N Chelsea Pl, Peoria, IL 61614
$-192
Cash flow
-5.6%
Cash-on-Cash Return
5.0%
Cap rate
0.9%
Rent to Value Ratio
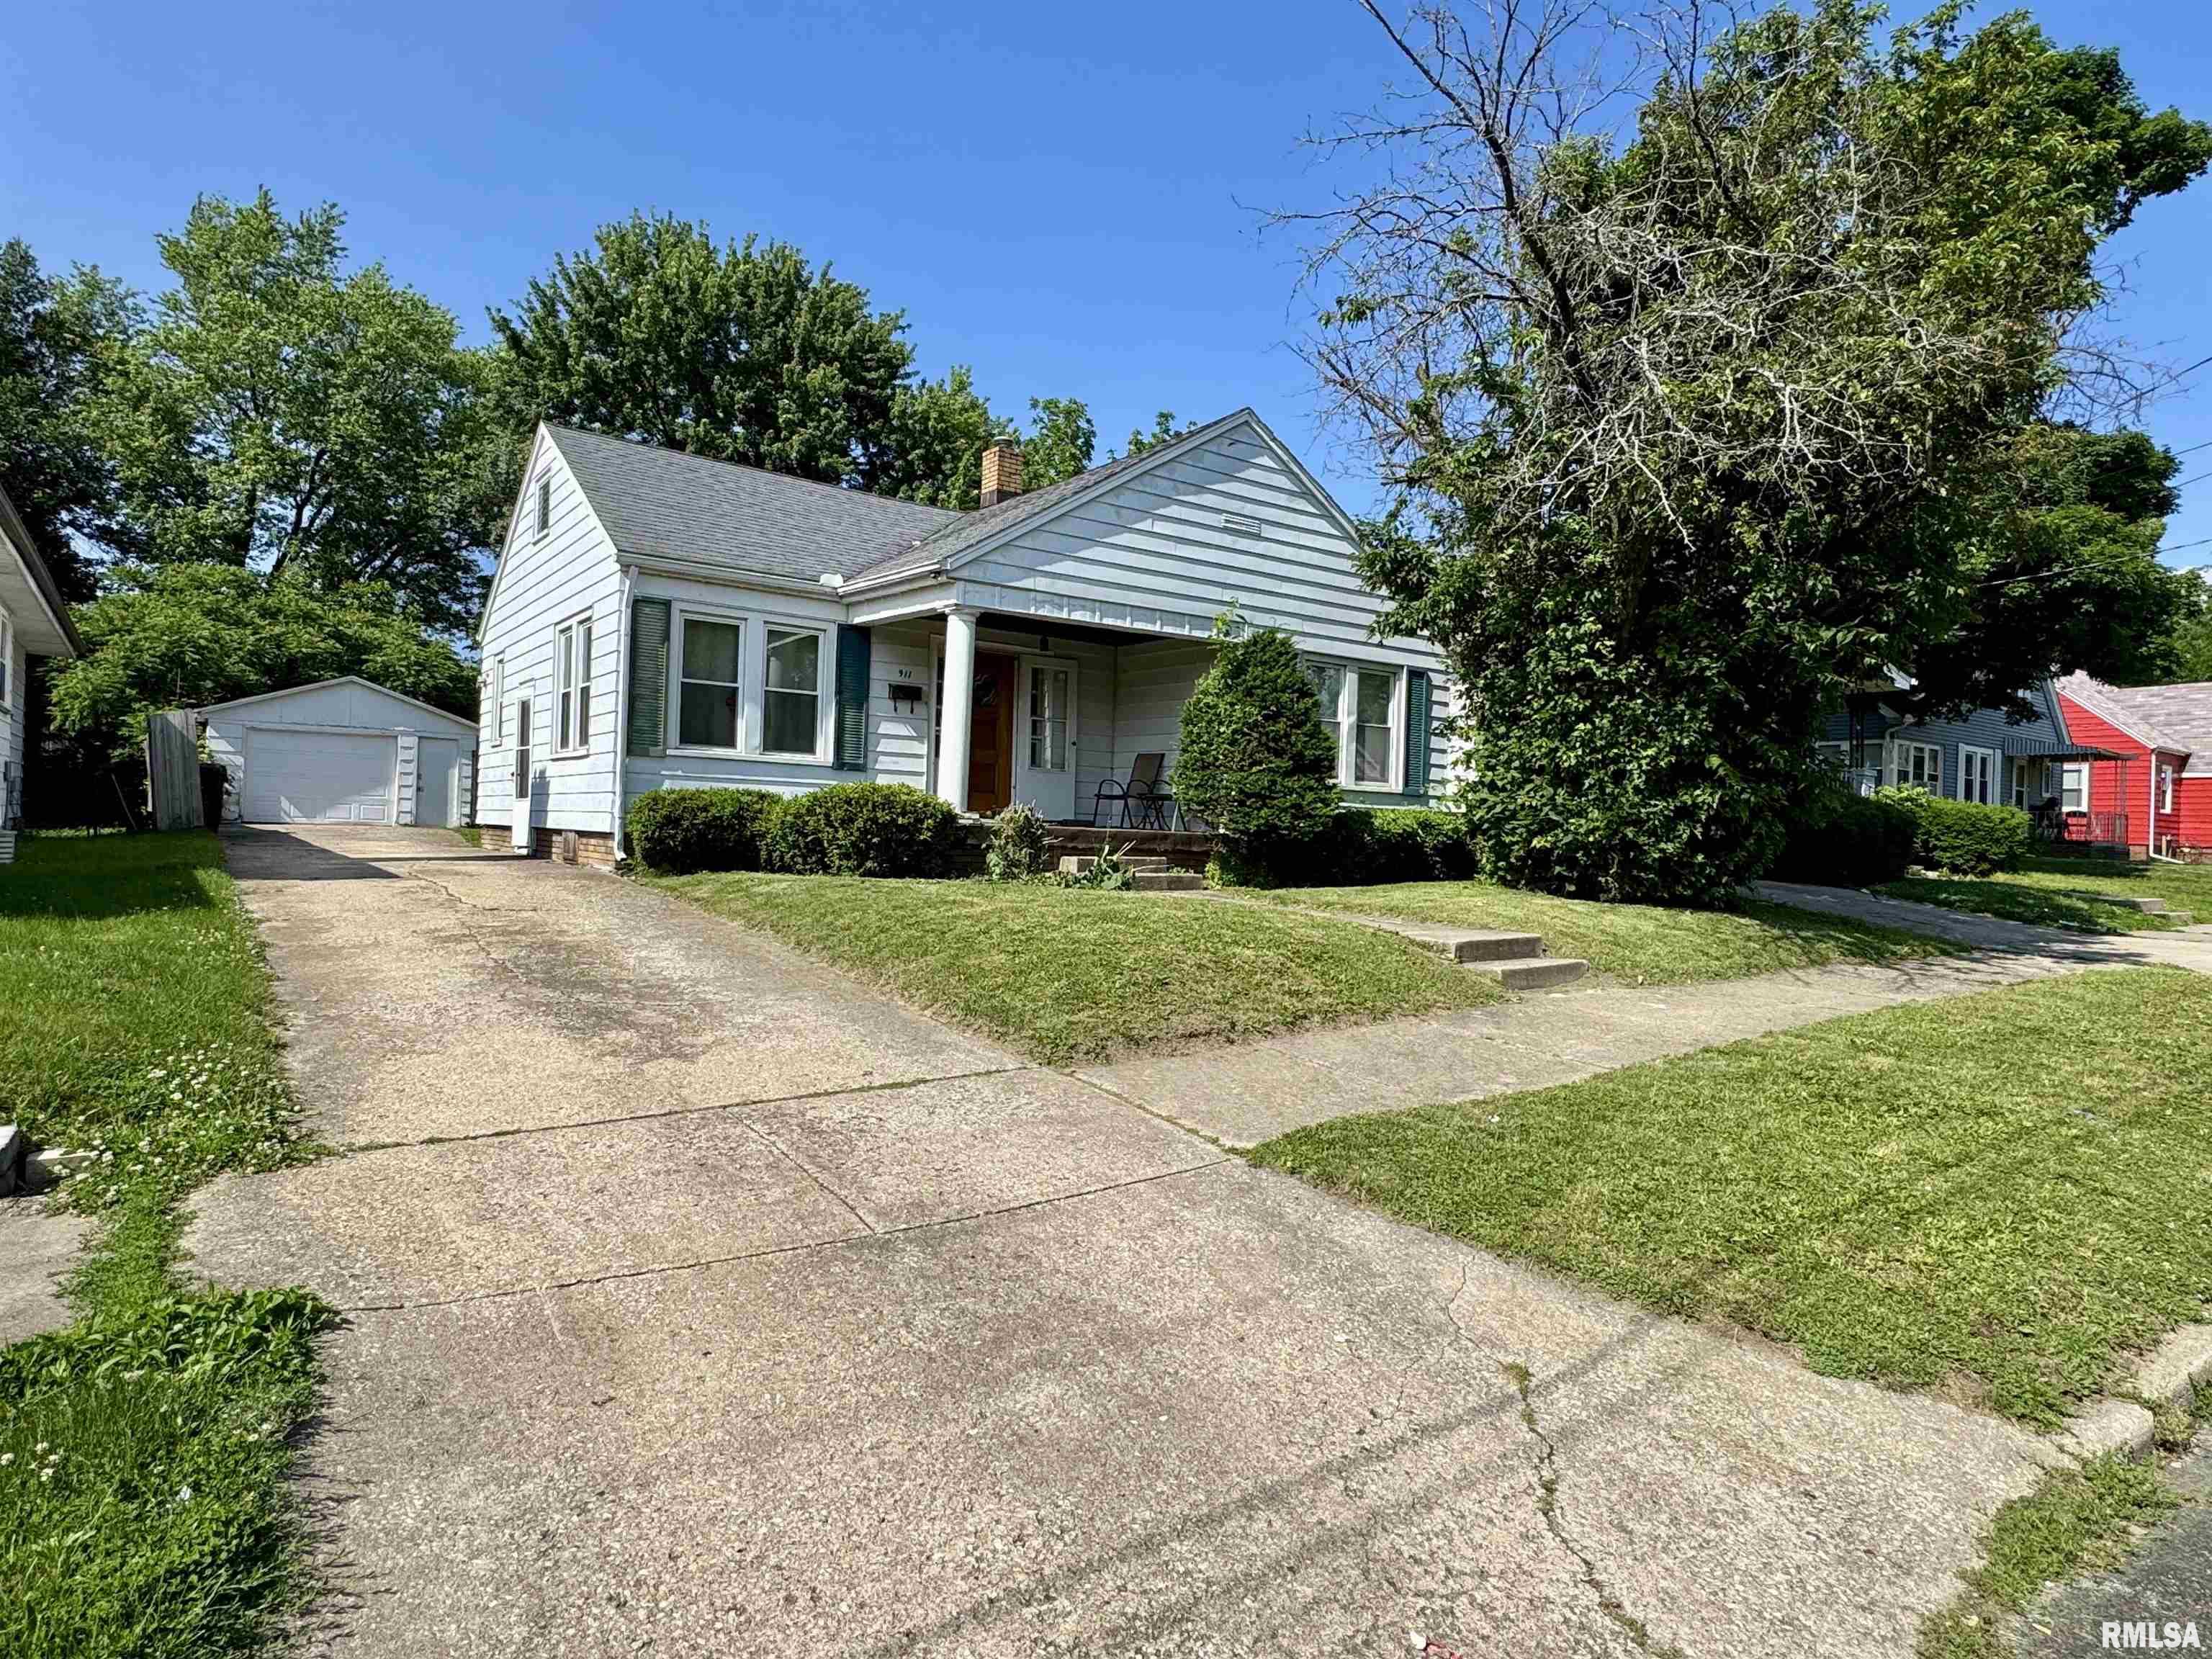
Active
$49,900
2
bds
|
1
ba
|
801
sqft
|
built
1930
911 W Gift Ave, Peoria, IL 61604
$703
Cash flow
16.4%
Cash-on-Cash Return
16.9%
Cap rate
2.4%
Rent to Value Ratio
Active
$48,500
2
bds
|
1
ba
|
1,080
sqft
|
built
1930
1832 N Missouri Ave, Peoria, IL 61603
$602
Cash flow
14.5%
Cash-on-Cash Return
14.9%
Cap rate
2.1%
Rent to Value Ratio
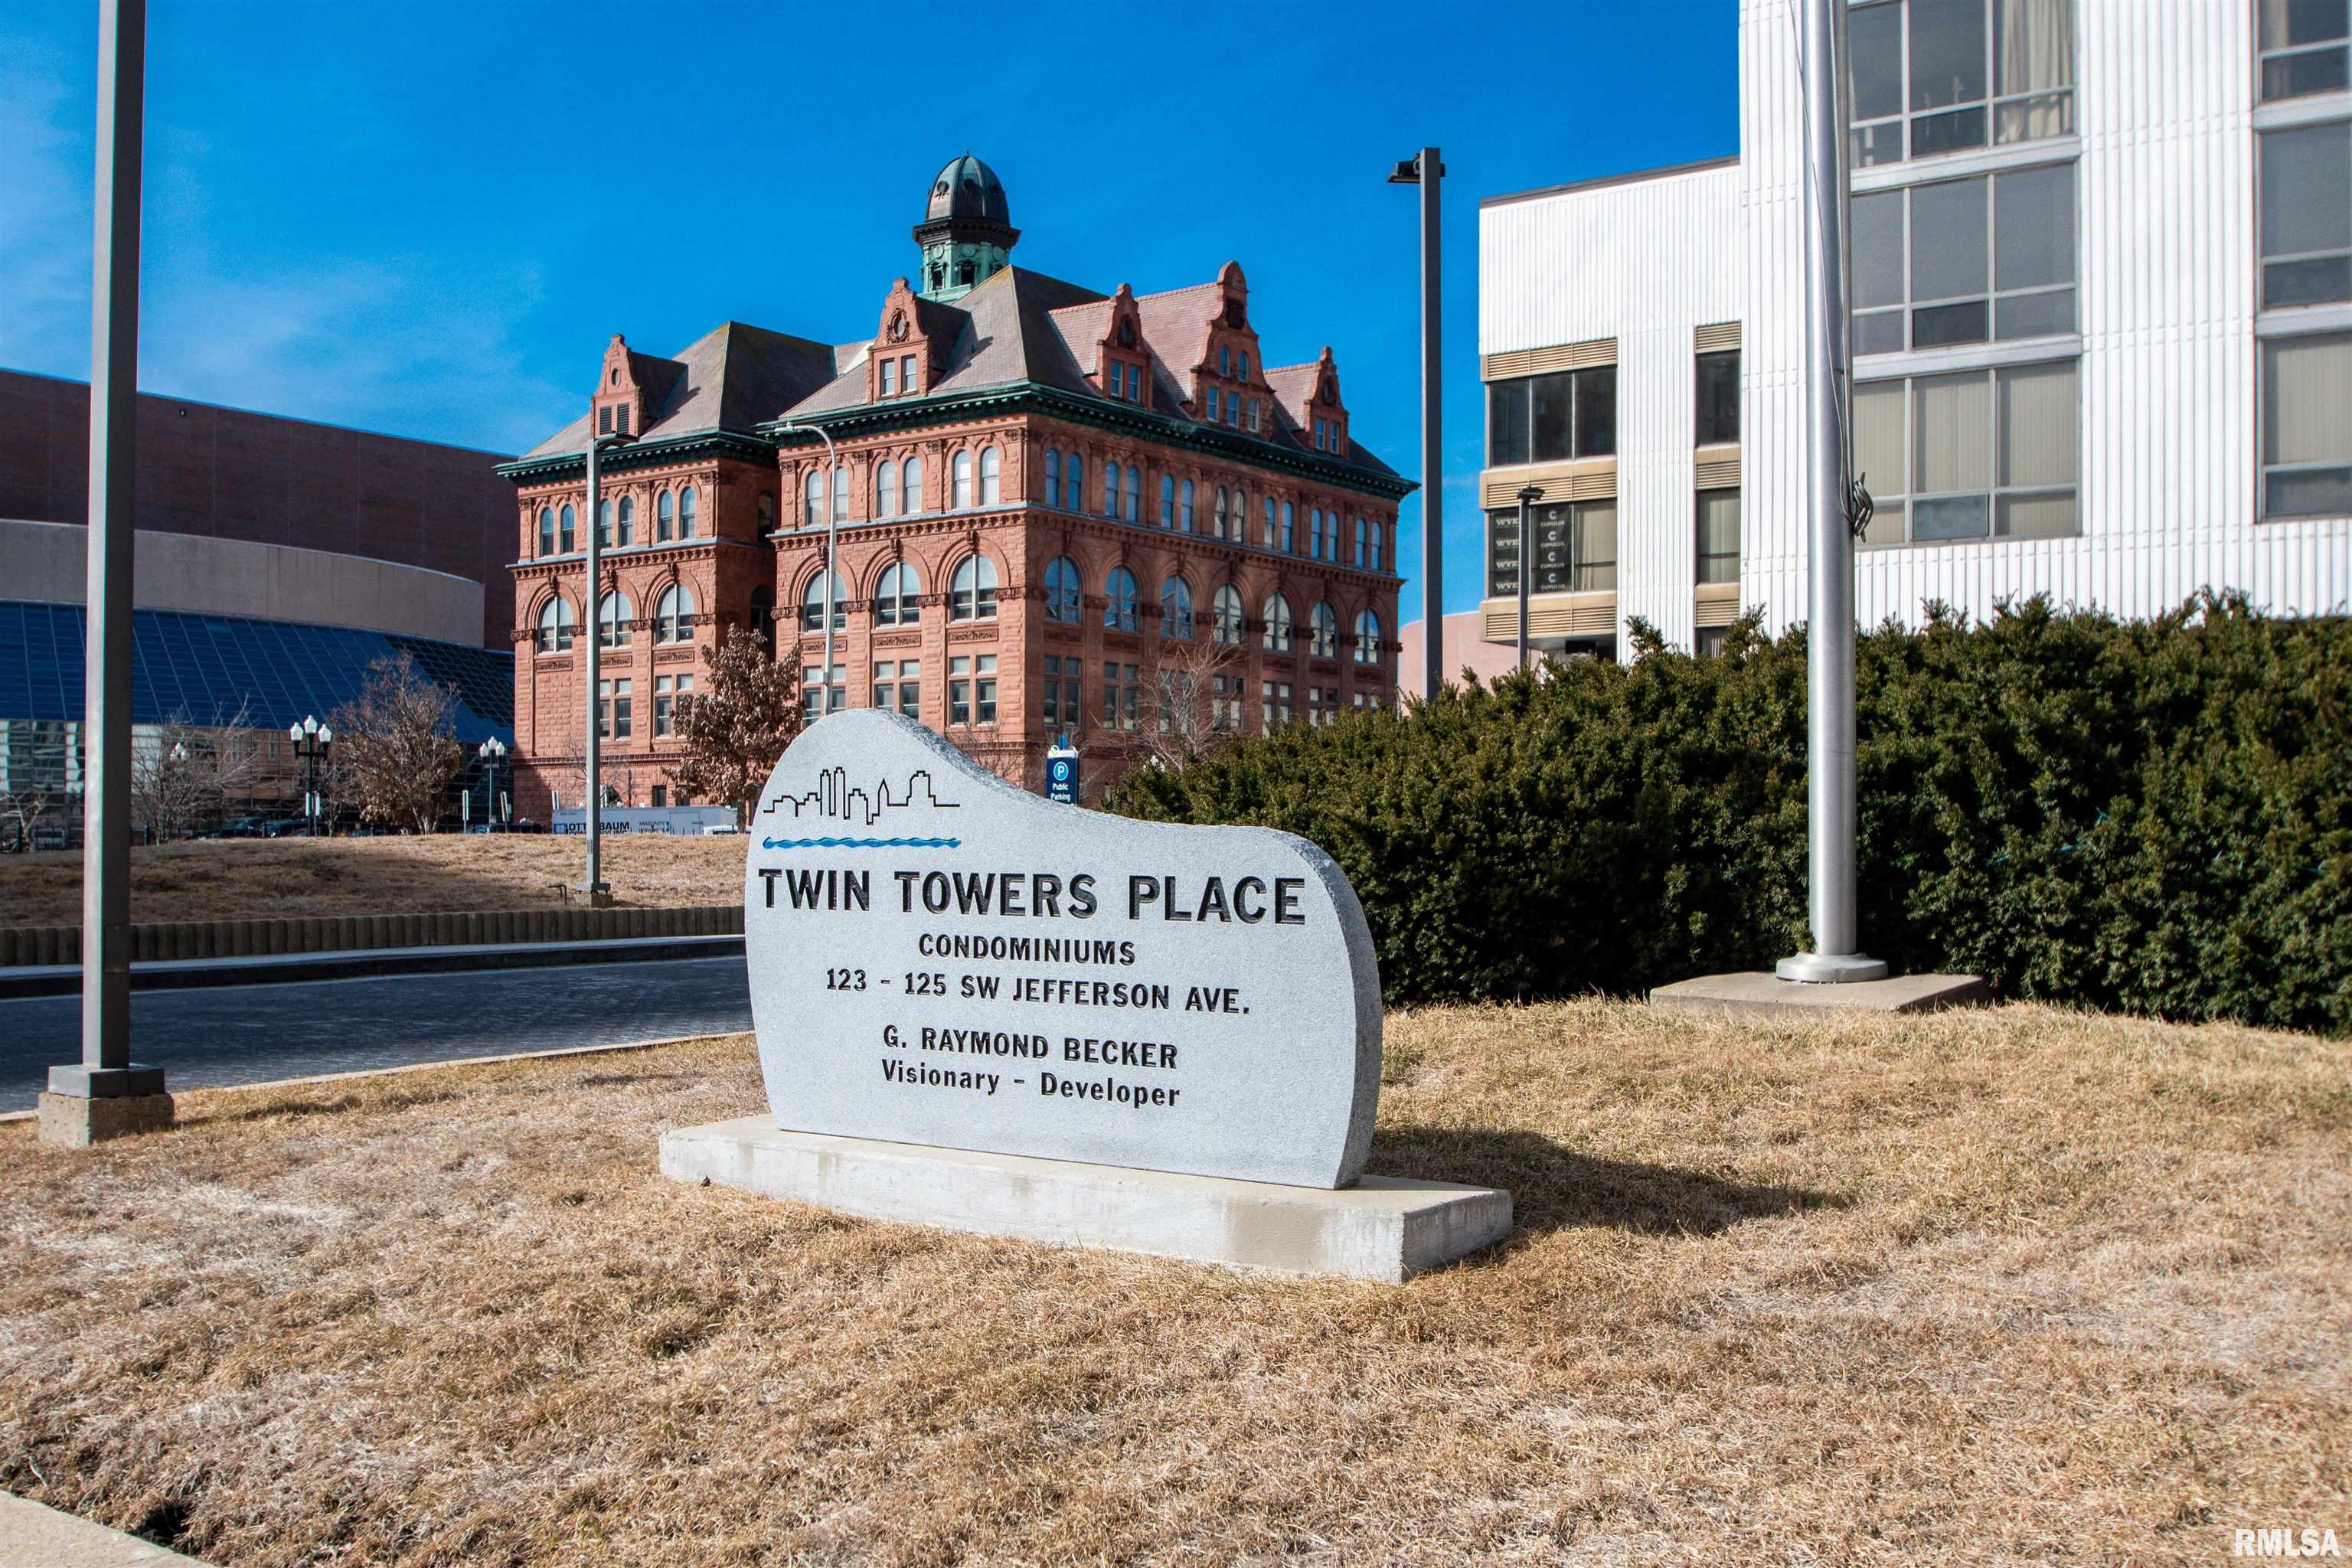
Active
$76,900
2
bds
|
1
ba
|
868
sqft
|
built
1984
123 SW Jefferson Ave, Peoria, IL 61602
$225
Cash flow
15.3%
Cash-on-Cash Return
9.8%
Cap rate
1.6%
Rent to Value Ratio
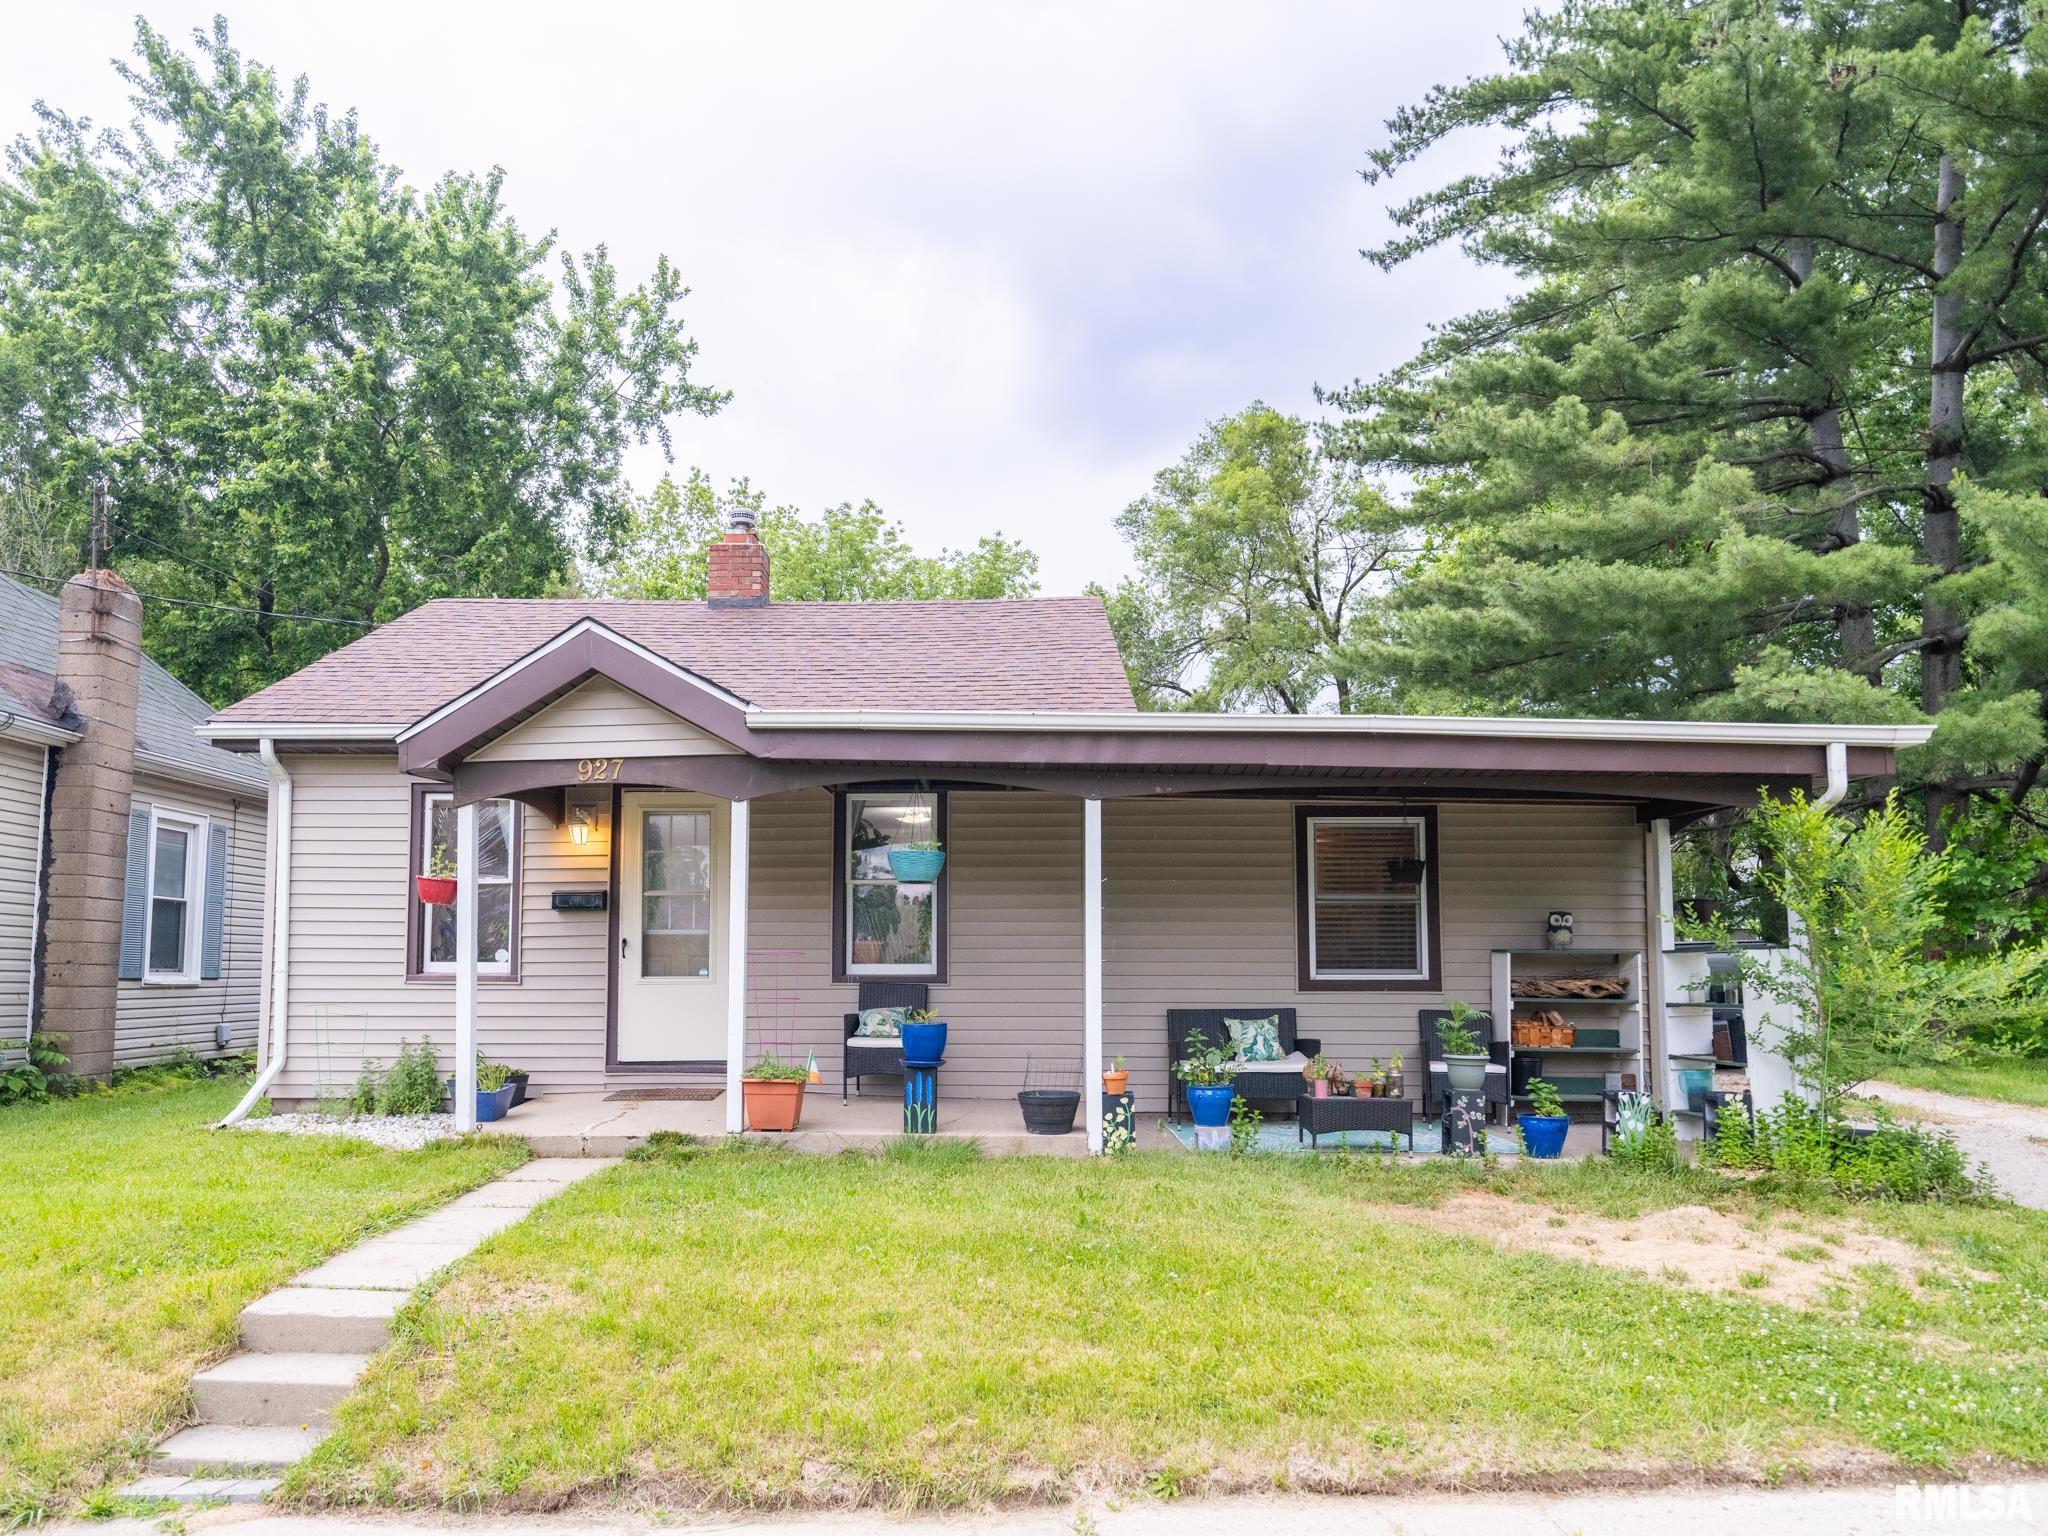
Active
$64,000
2
bds
|
1
ba
|
836
sqft
|
built
1924
1017 W Brons Ave, Peoria, IL 61604
$511
Cash flow
9.3%
Cash-on-Cash Return
9.6%
Cap rate
1.4%
Rent to Value Ratio
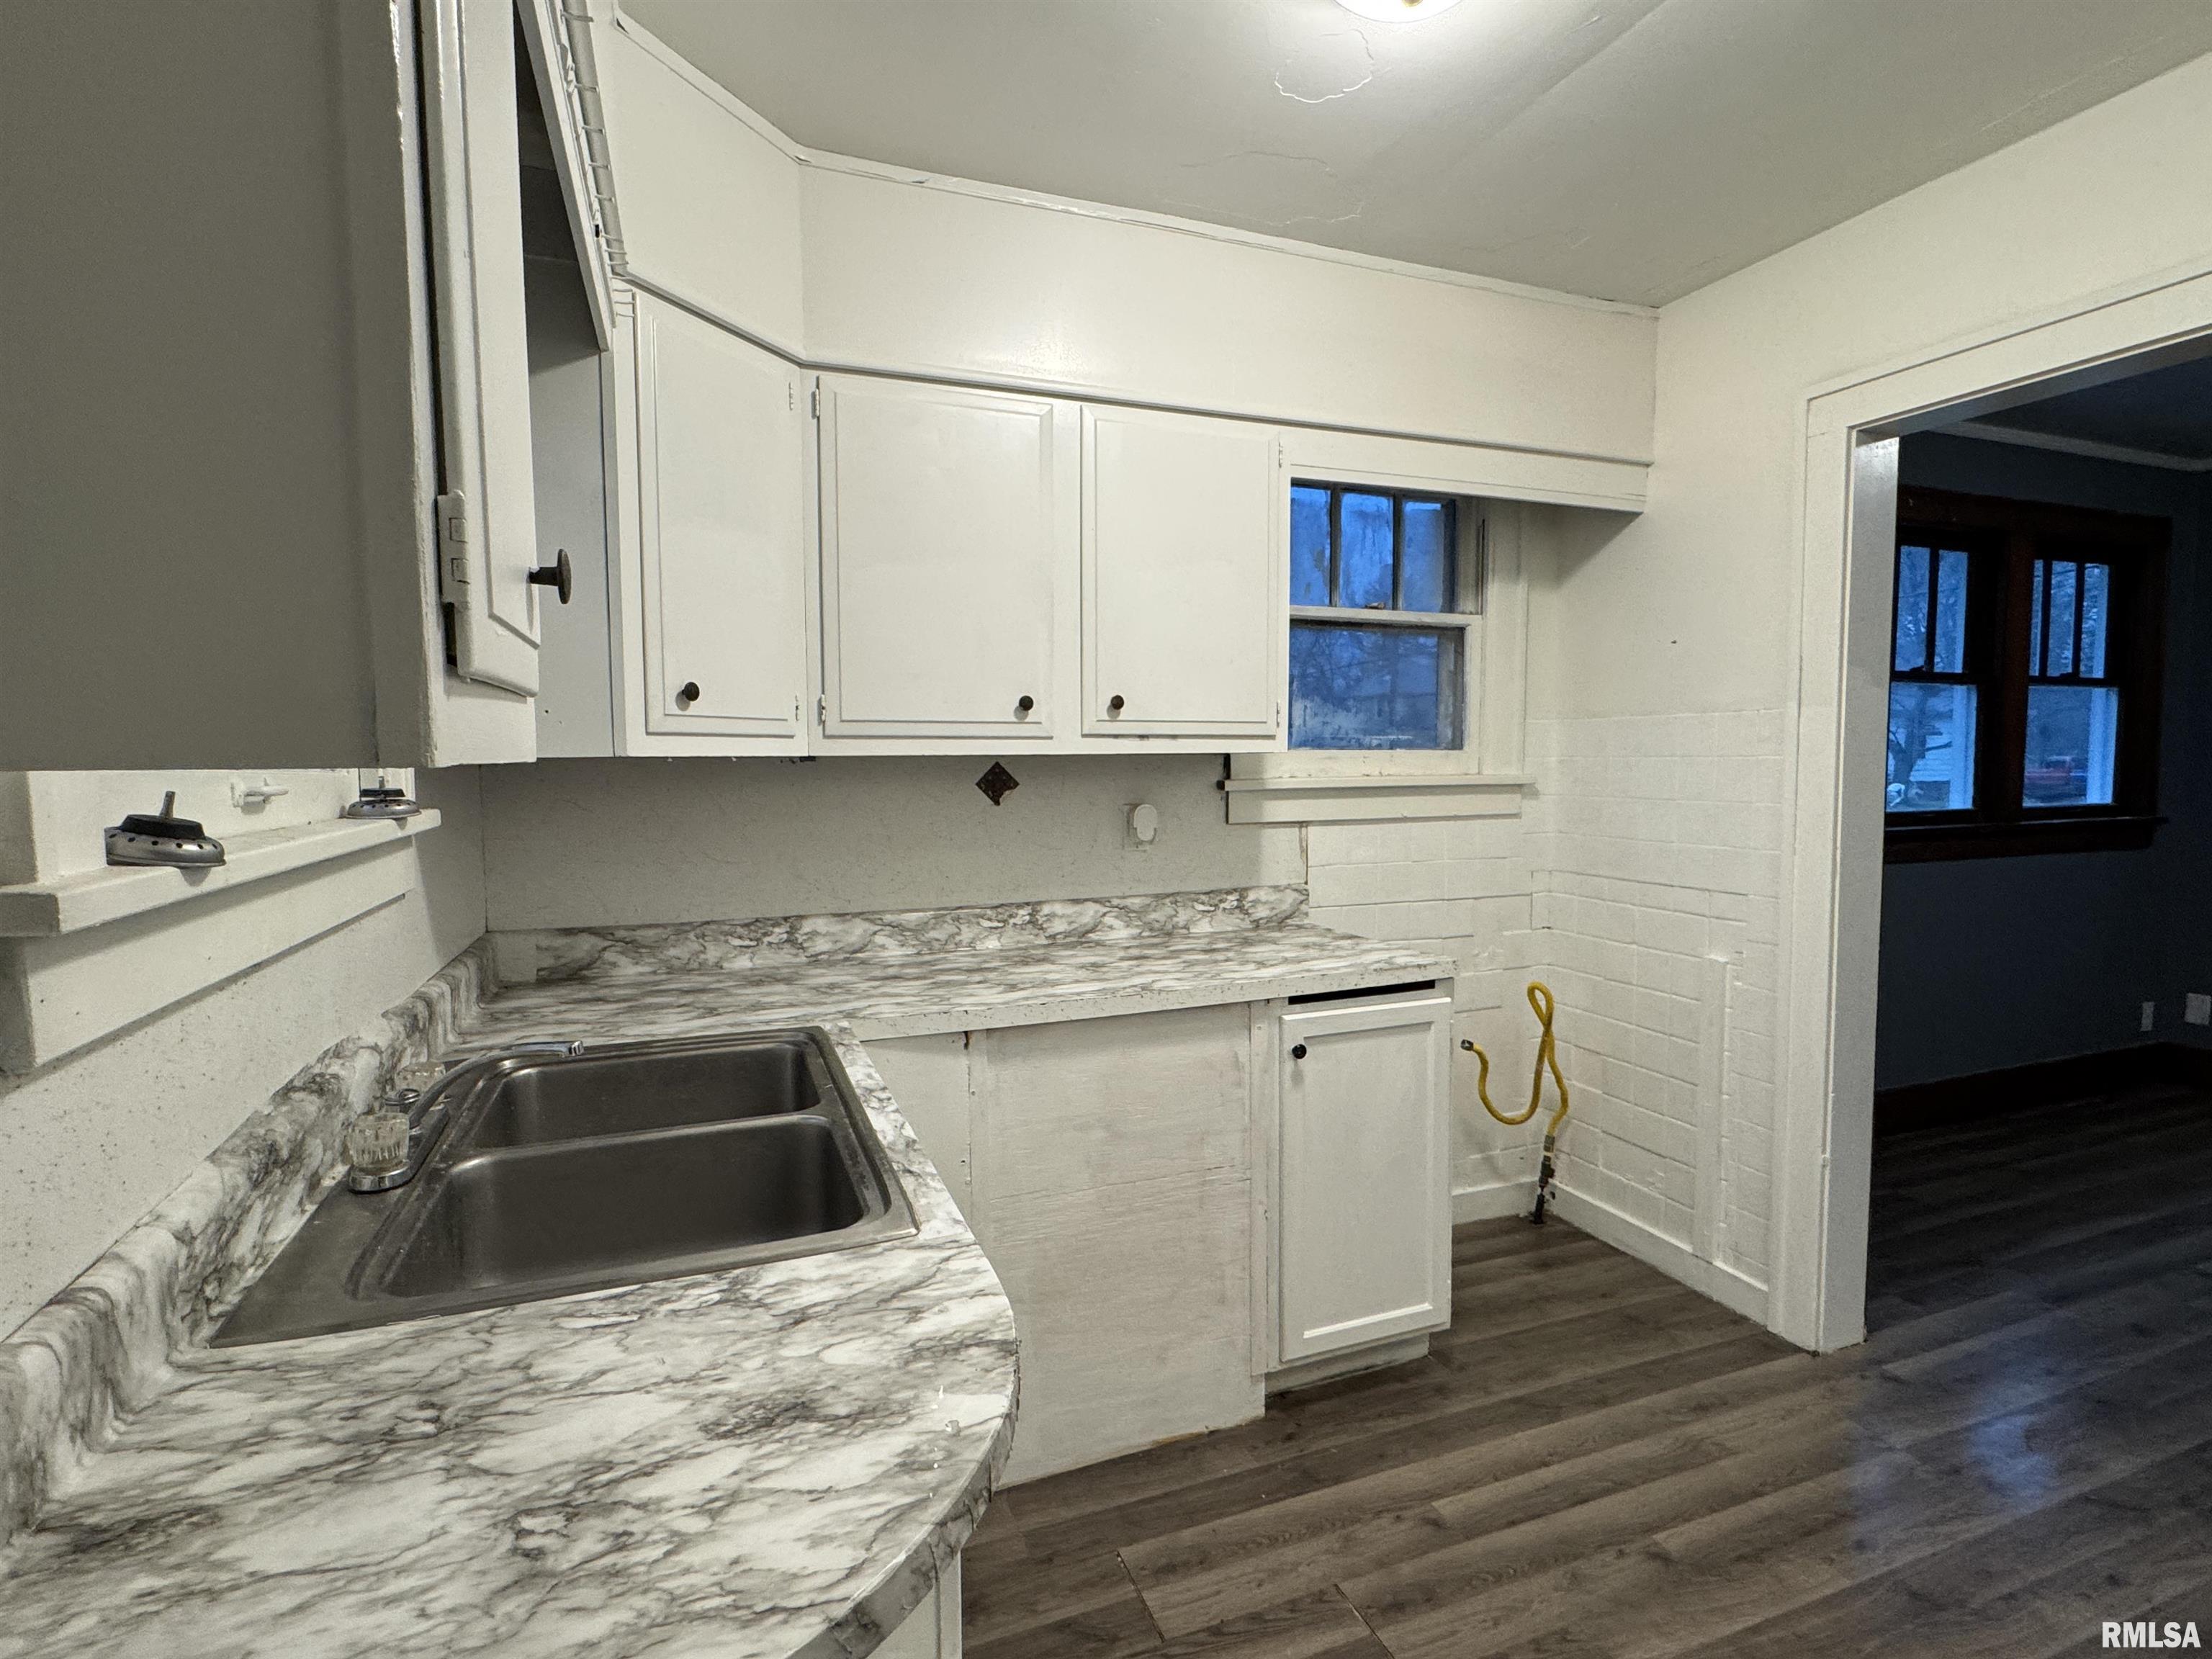
Active
$69,900
3
bds
|
2
ba
|
1,112
sqft
|
built
1936
927 W Brons Ave, Peoria, IL 61604
$788
Cash flow
13.1%
Cash-on-Cash Return
13.5%
Cap rate
1.9%
Rent to Value Ratio
Active
$130,000
5
bds
|
0
ba
|
0
sqft
|
built
1930
2826 NE Madison Ave, Peoria, IL 61603
$55
Cash flow
2.2%
Cash-on-Cash Return
6.8%
Cap rate
1.1%
Rent to Value Ratio
Active
$259,900
3
bds
|
2
ba
|
1,700
sqft
|
built
1977
6403 N Talisman Ter, Peoria, IL 61615
$-646
Cash flow
-13.0%
Cash-on-Cash Return
3.3%
Cap rate
0.7%
Rent to Value Ratio