Peoria County Investment Properties for Sale
Browse homes for sale and investment properties in Peoria County. Refine your search by price, property type, or more.
Best cash flowing properties in Peoria County

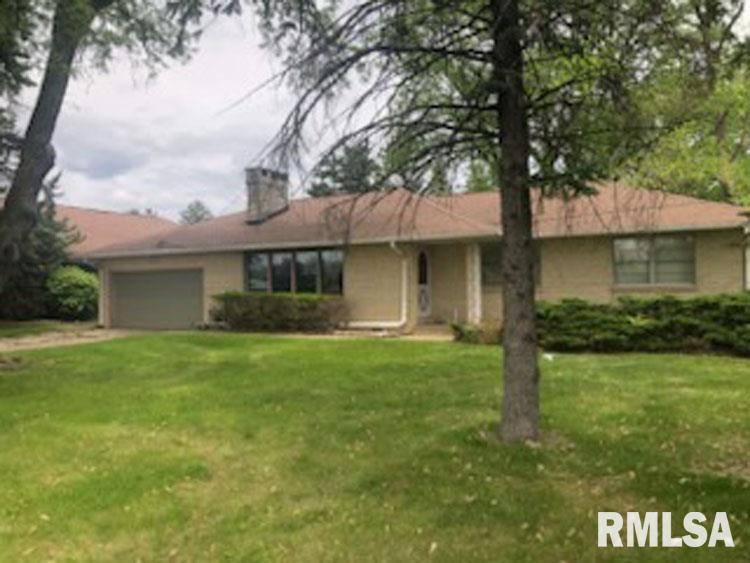
Active
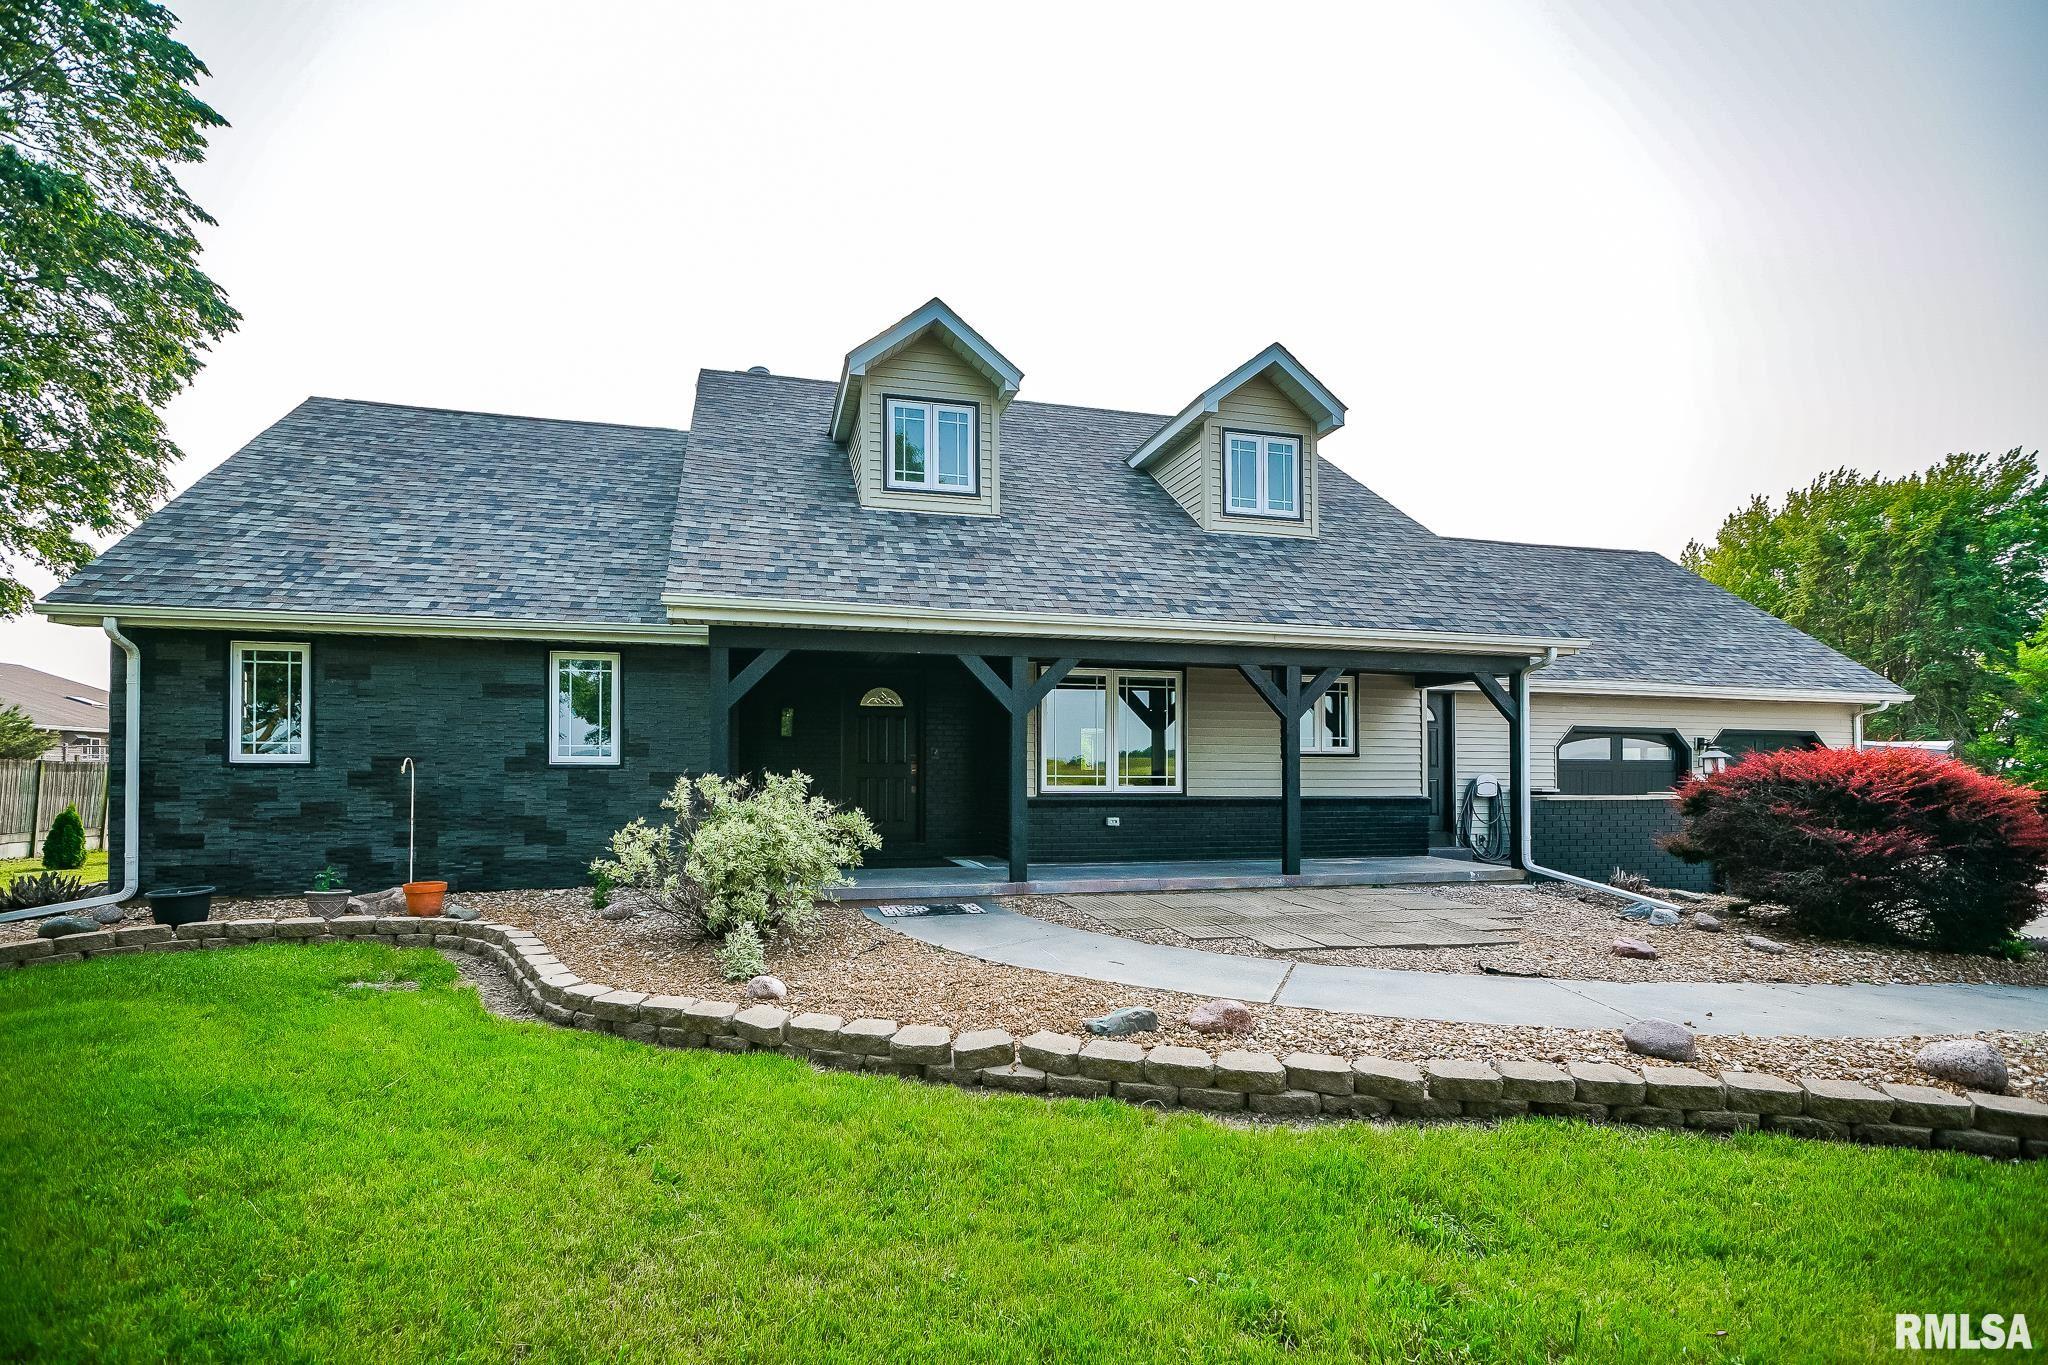
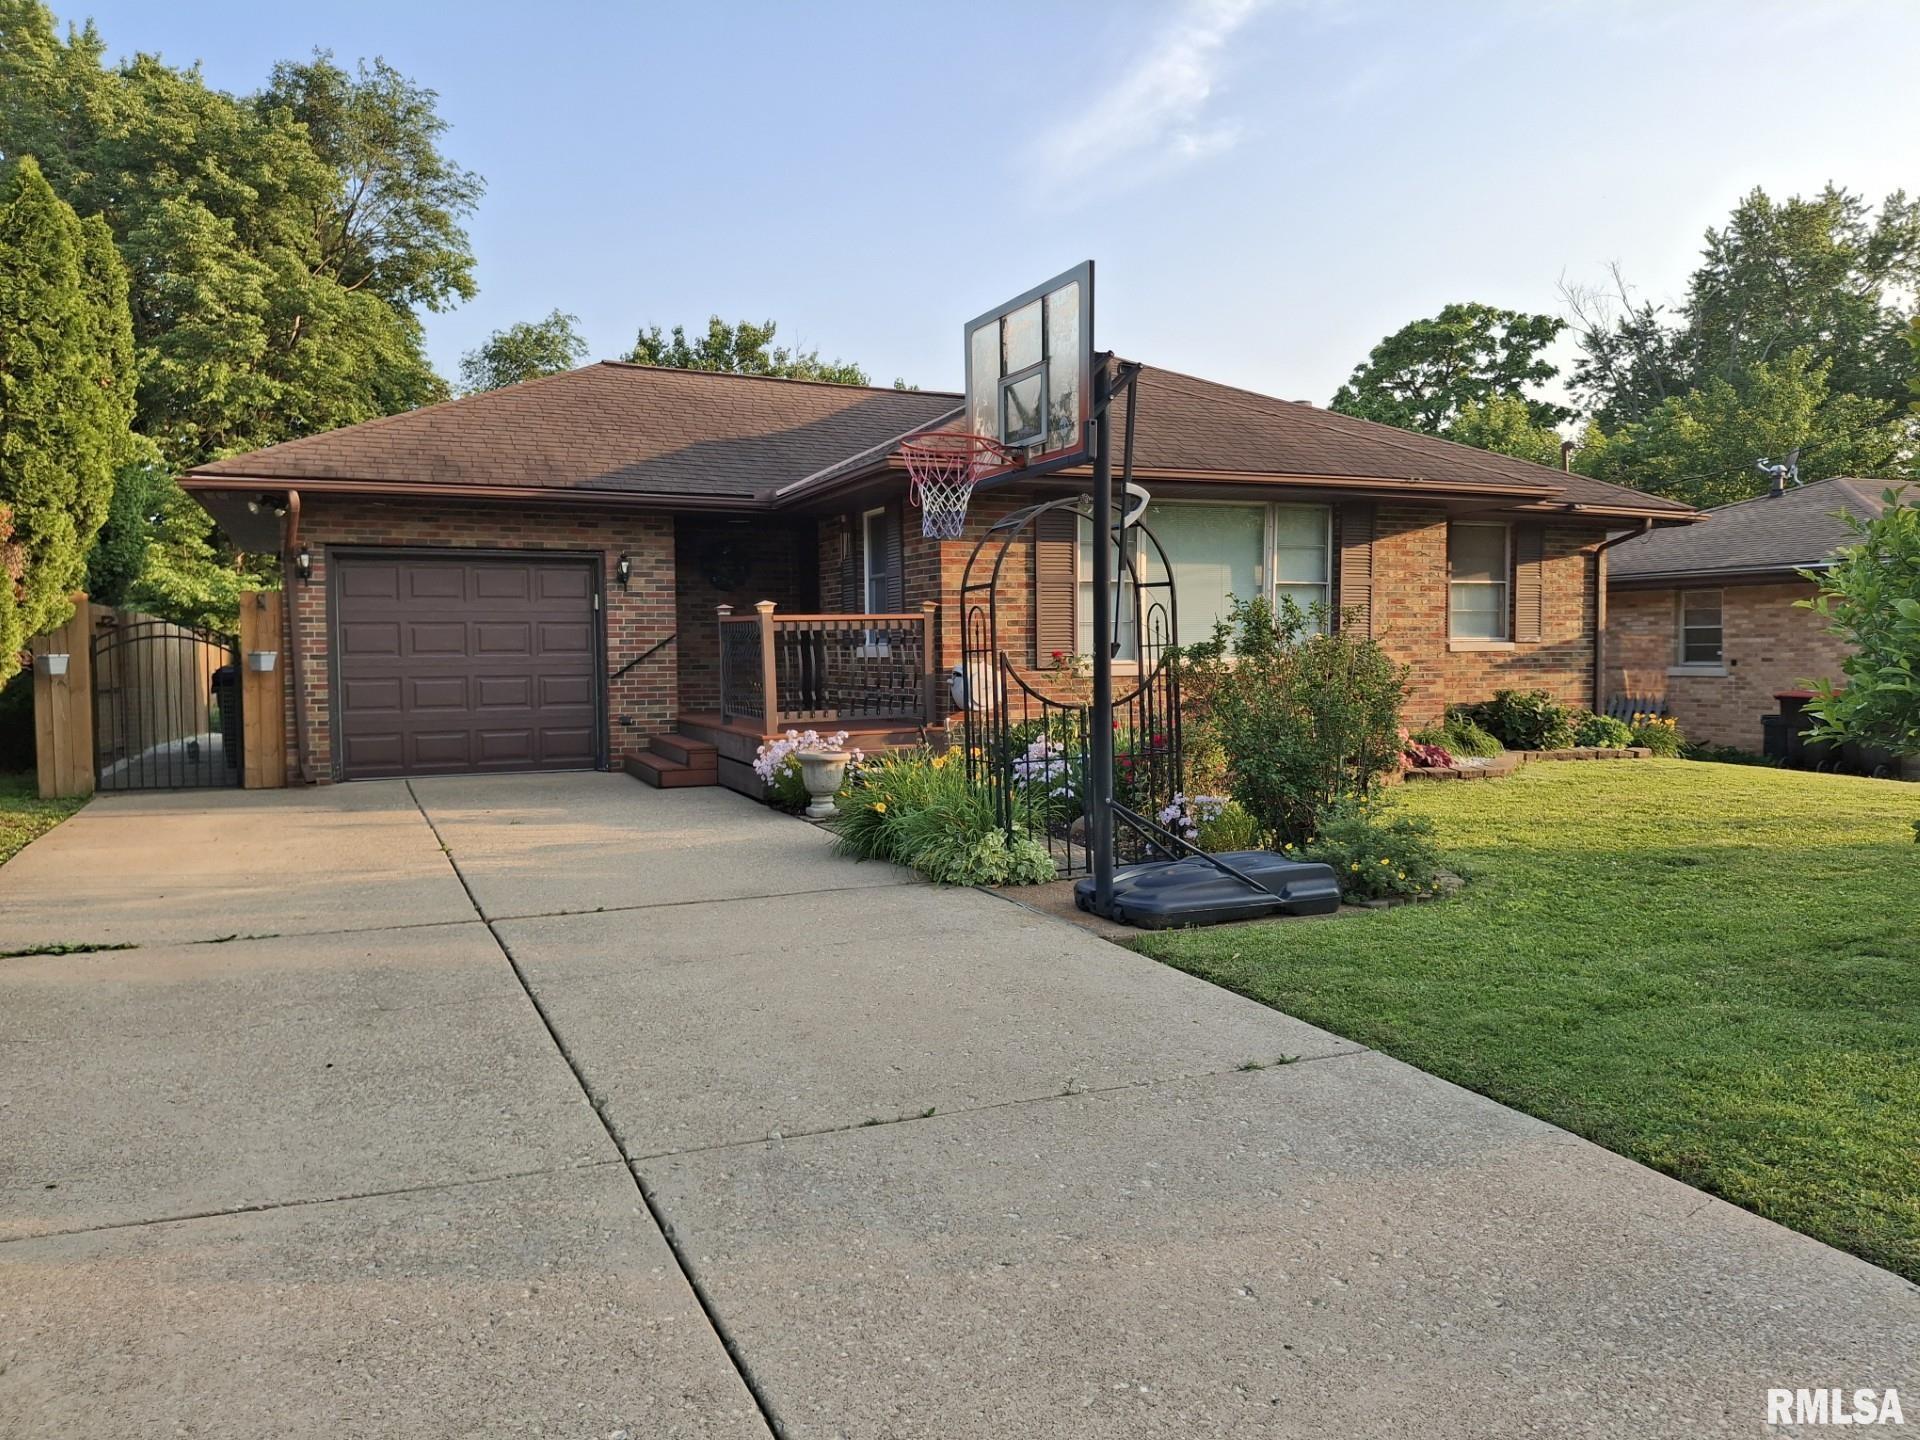
$69,500
3
bds
|
0
ba
|
1,108
sqft
|
built
1949
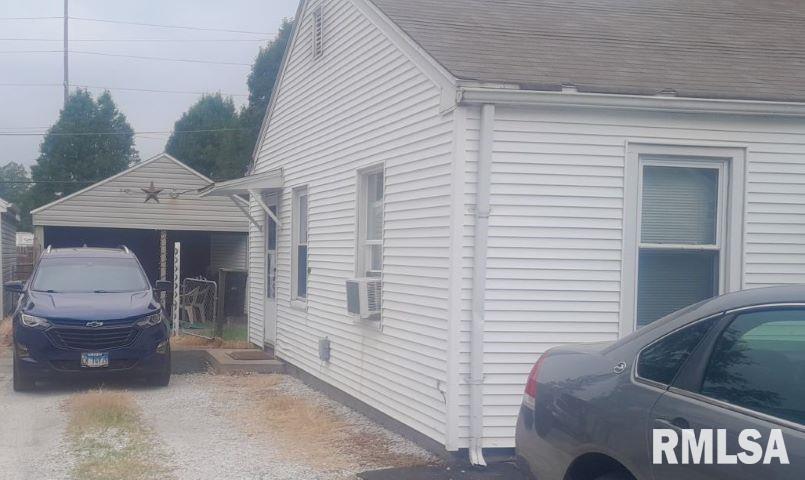
9915 N Blacksoil Ln, Peoria, IL 61615
$1,033
Cash flow
17.3%
Cash-on-Cash Return
17.8%
Cap rate
2.3%
Rent to Value Ratio
Active
$34,900
2
bds
|
1
ba
|
1,026
sqft
|
built
1906
801 S Warren St, Peoria, IL 61605
$856
Cash flow
28.6%
Cash-on-Cash Return
29.4%
Cap rate
3.7%
Rent to Value Ratio
169 out of 228 properties for sale in Peoria County
Limited Results Shown
Create a free account, or log in to reveal all property listings and enjoy the complete experience.
Active
$29,000
3
bds
|
1
ba
|
1,500
sqft
|
built
1906
2324 W Wiswall St, Peoria, IL 61605
$640
Cash flow
25.7%
Cash-on-Cash Return
26.5%
Cap rate
3.4%
Rent to Value Ratio
Active
$169,900
4
bds
|
4
ba
|
2,904
sqft
|
built
1974
4327 W Tara Cir, Peoria, IL 61615
$191
Cash flow
5.9%
Cash-on-Cash Return
7.0%
Cap rate
1.2%
Rent to Value Ratio
Active
$34,900
2
bds
|
1
ba
|
1,026
sqft
|
built
1906
801 S Warren St, Peoria, IL 61605
$856
Cash flow
28.6%
Cash-on-Cash Return
29.4%
Cap rate
3.7%
Rent to Value Ratio
Active
$63,500
2
bds
|
1
ba
|
1,366
sqft
|
built
1920
1216 E Corrington Ave, Peoria, IL 61603
$829
Cash flow
15.2%
Cash-on-Cash Return
15.7%
Cap rate
2.2%
Rent to Value Ratio

Active
$260,000
5
bds
|
4
ba
|
2,741
sqft
|
built
1915
949 NE Glen Oak Ave, Peoria, IL 61603
$-90
Cash flow
-1.8%
Cash-on-Cash Return
5.3%
Cap rate
1.0%
Rent to Value Ratio
Active
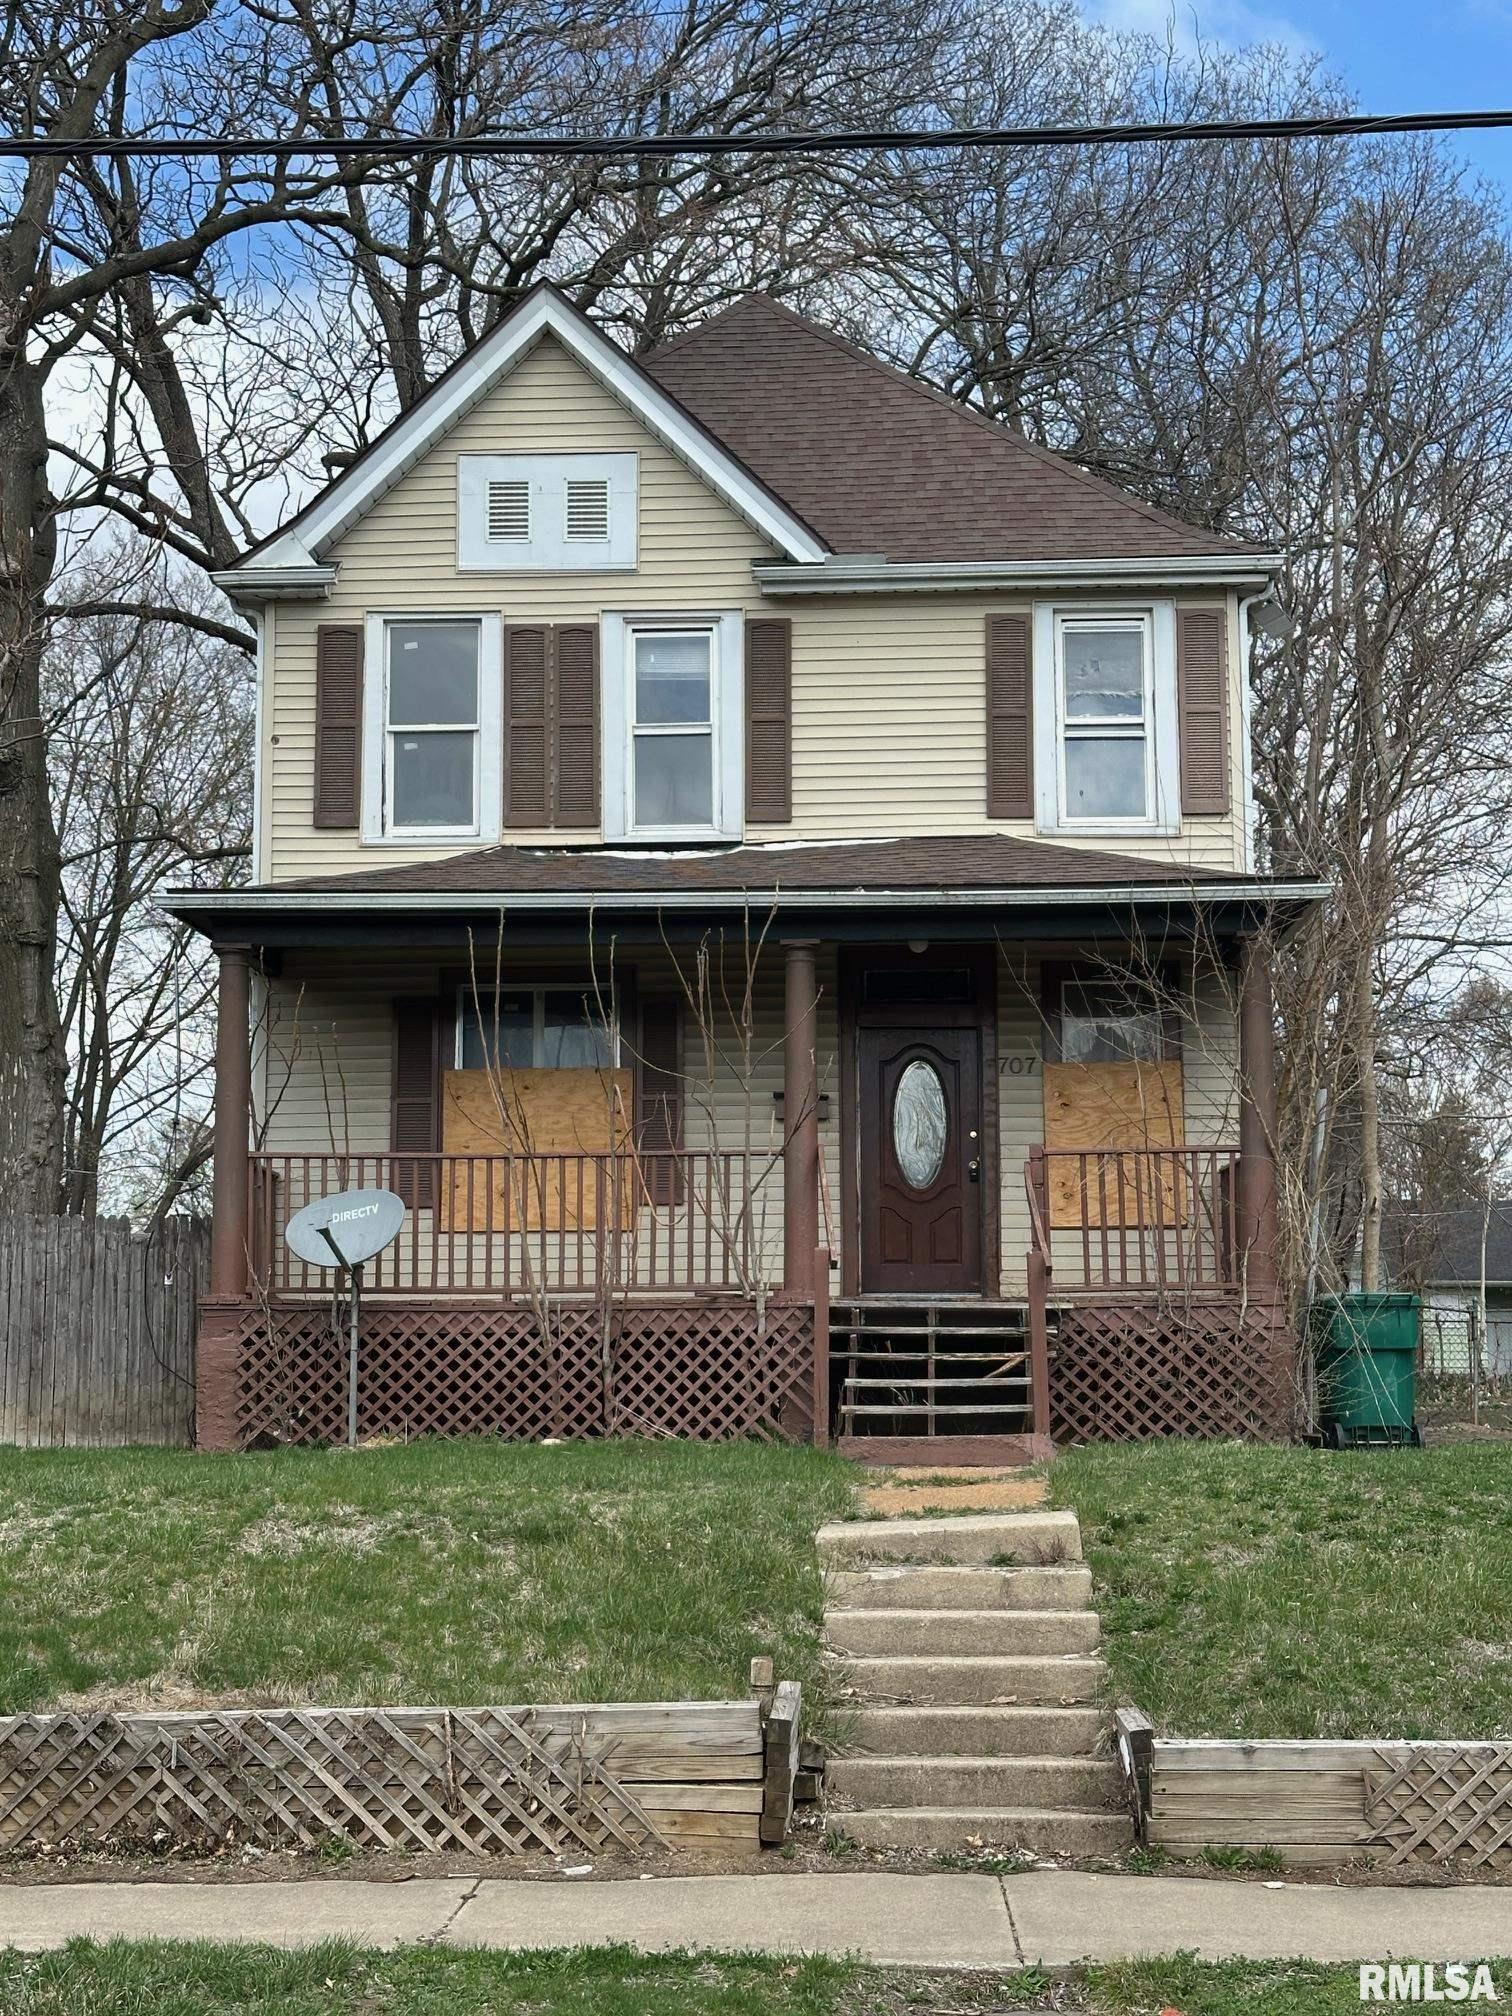
$49,000
3
bds
|
1
ba
|
1,476
sqft
|
built
1925
707 E Ravine Ave, Peoria, IL 61603
$829
Cash flow
19.7%
Cash-on-Cash Return
20.3%
Cap rate
2.7%
Rent to Value Ratio
Active
$69,000
3
bds
|
1
ba
|
1,284
sqft
|
built
1920
1001 W Brons Ave, Peoria, IL 61604
$568
Cash flow
9.6%
Cash-on-Cash Return
9.9%
Cap rate
1.4%
Rent to Value Ratio
Active
$409,900
6
bds
|
4
ba
|
4,122
sqft
|
built
1890
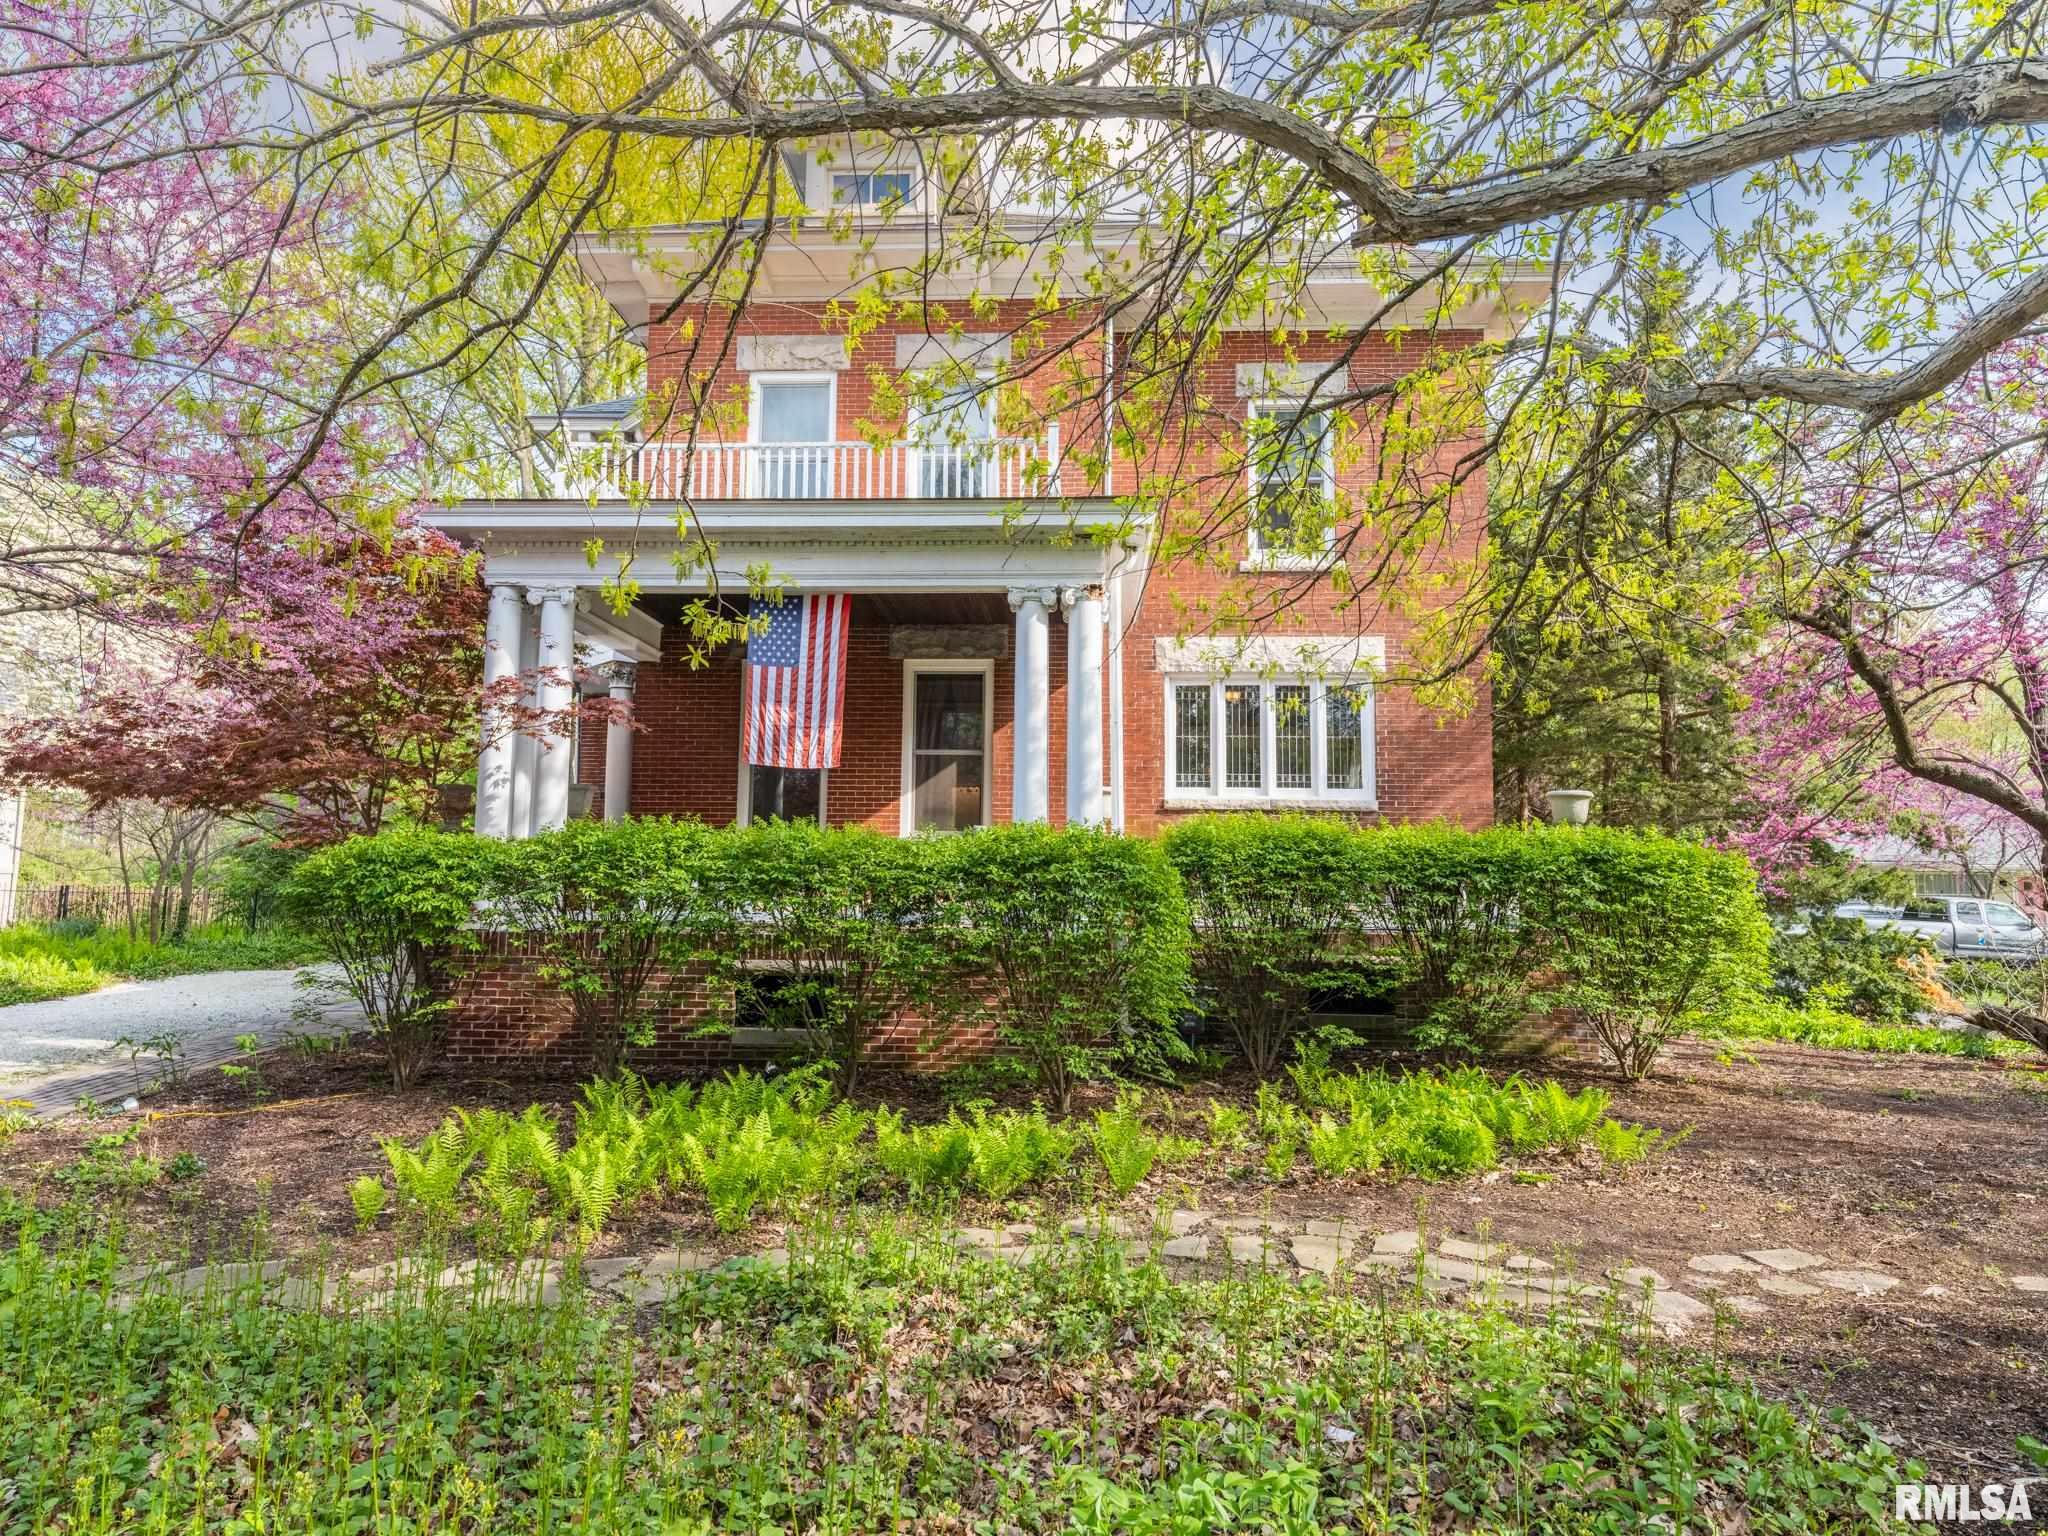
1536 W Moss Ave, Peoria, IL 61606
$-700
Cash flow
-8.9%
Cash-on-Cash Return
3.6%
Cap rate
0.7%
Rent to Value Ratio
Active
$45,000
1
bds
|
1
ba
|
440
sqft
|
built
1948
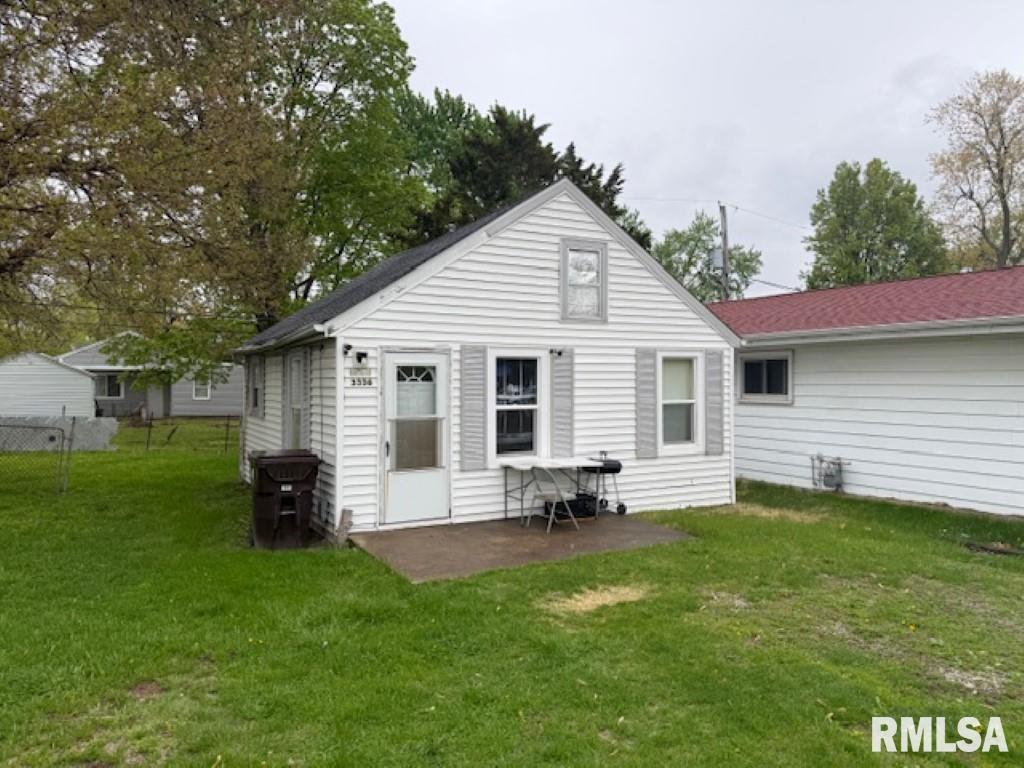
3336 N Sterling Ave, Peoria, IL 61604
$322
Cash flow
8.3%
Cash-on-Cash Return
8.6%
Cap rate
1.3%
Rent to Value Ratio
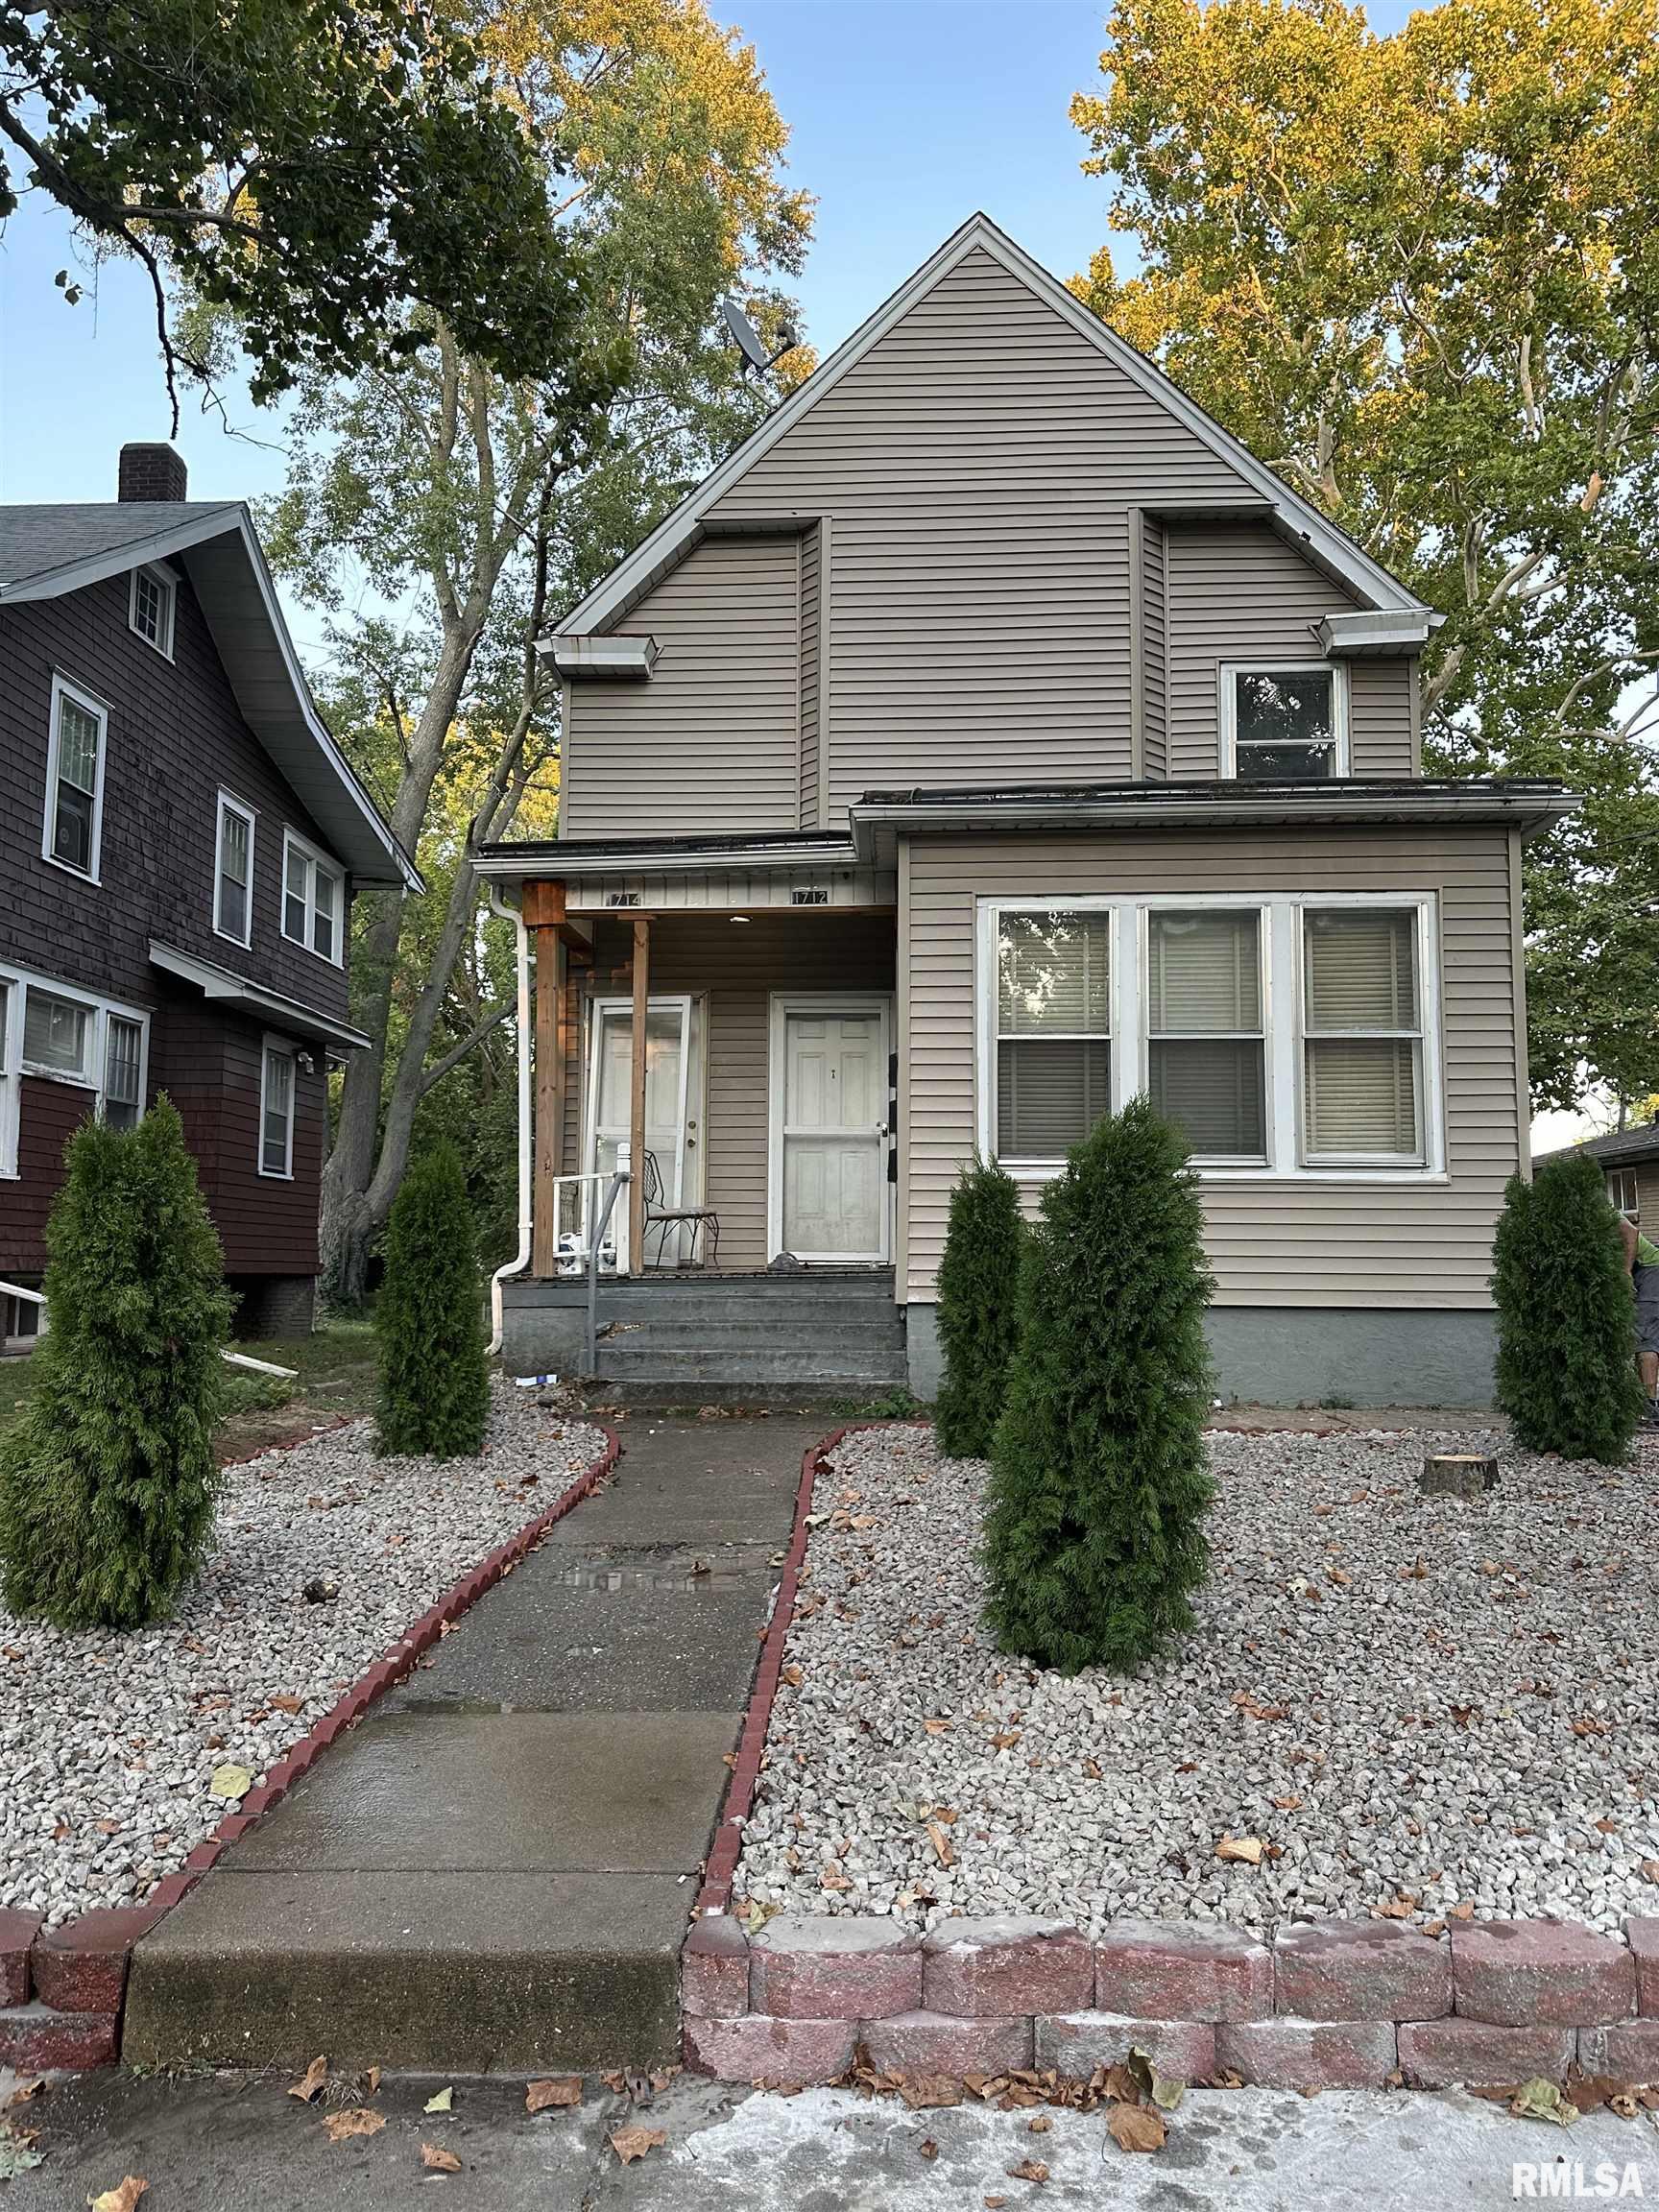
Active
$115,000
4
bds
|
3
ba
|
2,178
sqft
|
built
1930
1712 N Bigelow St, Peoria, IL 61604
$294
Cash flow
13.3%
Cash-on-Cash Return
8.7%
Cap rate
1.1%
Rent to Value Ratio
Active
$475,000
4
bds
|
4
ba
|
4,512
sqft
|
built
1987
9701 Cherrybark Ct, Peoria, IL 61615
$-1,588
Cash flow
-17.4%
Cash-on-Cash Return
1.7%
Cap rate
0.6%
Rent to Value Ratio

Active
$69,900
2
bds
|
1
ba
|
816
sqft
|
built
1926
718 W Corrington Ave, Peoria, IL 61604
$528
Cash flow
8.8%
Cash-on-Cash Return
9.1%
Cap rate
1.4%
Rent to Value Ratio
Active
$74,900
2
bds
|
1
ba
|
896
sqft
|
built
1984
125 SW Jefferson Ave, Peoria, IL 61602
$362
Cash flow
5.6%
Cash-on-Cash Return
5.8%
Cap rate
1.2%
Rent to Value Ratio
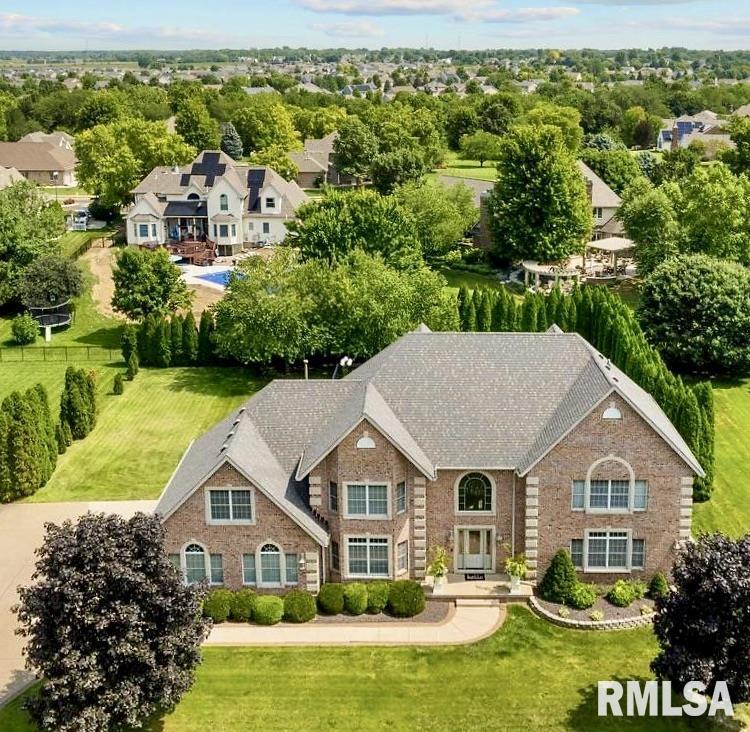
Active
$725,000
5
bds
|
5
ba
|
4,929
sqft
|
built
1994
119 W Greystone Ct, Dunlap, IL 61525
$-2,524
Cash flow
-18.2%
Cash-on-Cash Return
1.5%
Cap rate
0.5%
Rent to Value Ratio

Active
$259,900
2
bds
|
2
ba
|
1,786
sqft
|
built
2005
11525 N Brooklyn Pl, Dunlap, IL 61525
$-322
Cash flow
-6.5%
Cash-on-Cash Return
4.2%
Cap rate
0.8%
Rent to Value Ratio
Active
$499,900
4
bds
|
7
ba
|
4,731
sqft
|
built
1978
9825 N Route 91, Peoria, IL 61615
$-1,246
Cash flow
-13.0%
Cash-on-Cash Return
2.7%
Cap rate
0.5%
Rent to Value Ratio
Pending
$239,900
3
bds
|
3
ba
|
2,650
sqft
|
built
1977
7214 N Whippoorwill Ln, Peoria, IL 61614
$-191
Cash flow
-4.2%
Cash-on-Cash Return
4.7%
Cap rate
0.8%
Rent to Value Ratio
Active
$979,900
5
bds
|
6
ba
|
7,544
sqft
|
built
1999
1112 W Cedar Hills Dr, Dunlap, IL 61525
$-4,315
Cash flow
-23.0%
Cash-on-Cash Return
0.4%
Cap rate
0.3%
Rent to Value Ratio
Active
$389,000
4
bds
|
4
ba
|
3,196
sqft
|
built
1956
486 E High Point Dr, Peoria, IL 61614
$-732
Cash flow
-9.8%
Cash-on-Cash Return
3.4%
Cap rate
0.7%
Rent to Value Ratio
Active under contract
$179,999
3
bds
|
2
ba
|
2,324
sqft
|
built
1956
2604 W Kansas St, Peoria, IL 61604
$-9
Cash flow
-0.3%
Cash-on-Cash Return
5.6%
Cap rate
0.9%
Rent to Value Ratio
Active
$290,000
2
bds
|
2
ba
|
1,540
sqft
|
built
1990
5200 N Knoxville Ave, Peoria, IL 61614
$-581
Cash flow
-10.5%
Cash-on-Cash Return
3.3%
Cap rate
0.6%
Rent to Value Ratio

Active
$65,000
4
bds
|
1
ba
|
1,324
sqft
|
built
1915
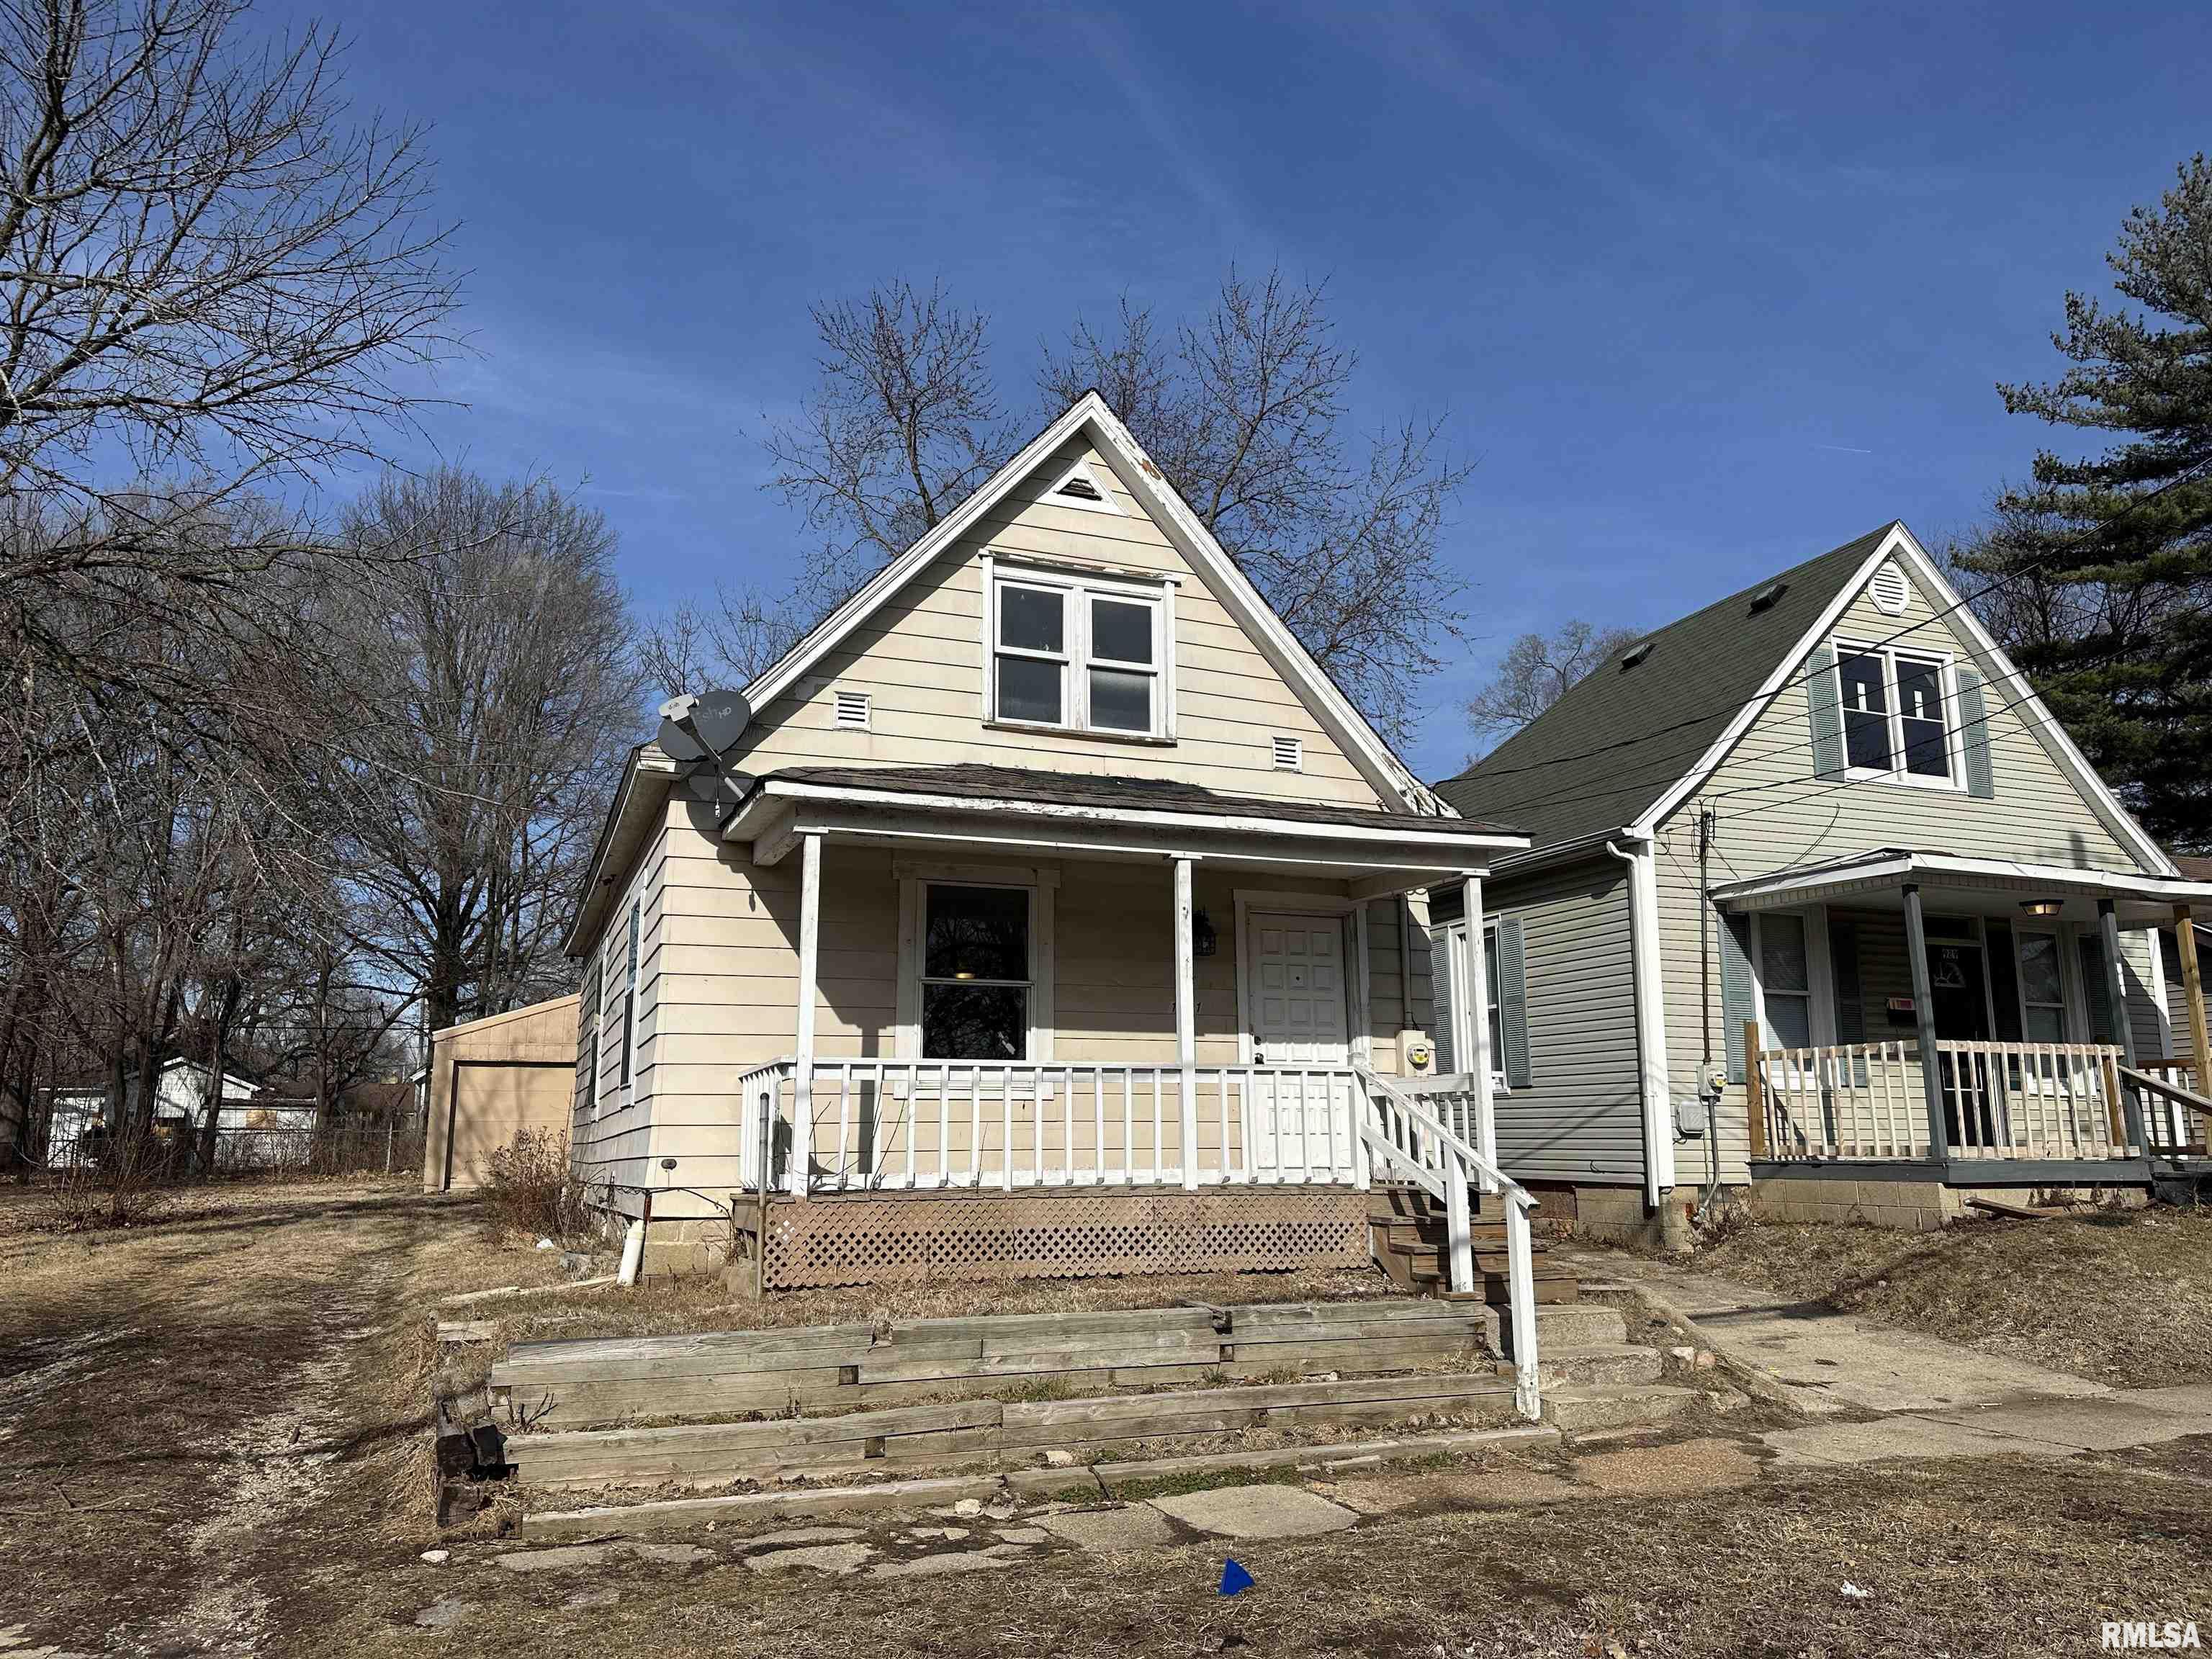
2005 W Antoinette St, Peoria, IL 61605
$761
Cash flow
13.6%
Cash-on-Cash Return
14.0%
Cap rate
1.8%
Rent to Value Ratio
Active
$360,000
4
bds
|
3
ba
|
3,541
sqft
|
built
1966
202 W Wolf Rd, Peoria, IL 61614
$-601
Cash flow
-8.7%
Cash-on-Cash Return
3.7%
Cap rate
0.7%
Rent to Value Ratio
Active
$90,990
2
bds
|
1
ba
|
1,023
sqft
|
built
1973
6831 N Frostwood Pkwy, Peoria, IL 61615
$229
Cash flow
13.1%
Cash-on-Cash Return
8.7%
Cap rate
1.3%
Rent to Value Ratio
Active
$69,500
3
bds
|
0
ba
|
1,108
sqft
|
built
1949
9915 N Blacksoil Ln, Peoria, IL 61615
$1,033
Cash flow
17.3%
Cash-on-Cash Return
17.8%
Cap rate
2.3%
Rent to Value Ratio
Active
$53,900
2
bds
|
1
ba
|
676
sqft
|
built
1965
3329 N Stanley St, Peoria, IL 61604
$482
Cash flow
10.4%
Cash-on-Cash Return
10.7%
Cap rate
1.7%
Rent to Value Ratio
Active
$799,000
4
bds
|
7
ba
|
7,667
sqft
|
built
2001
3113 W Summerbend Ct, Peoria, IL 61615
$-3,699
Cash flow
-24.2%
Cash-on-Cash Return
0.1%
Cap rate
0.4%
Rent to Value Ratio

Active
$899,000
4
bds
|
5
ba
|
8,577
sqft
|
built
1997
200 W Ravinwoods Rd, Peoria, IL 61615
$-5,449
Cash flow
-31.6%
Cash-on-Cash Return
-1.6%
Cap rate
0.3%
Rent to Value Ratio
Active
$41,800
2
bds
|
1
ba
|
904
sqft
|
built
1949
873 S Kim Moor Rd, Peoria, IL 61605
$644
Cash flow
17.9%
Cash-on-Cash Return
18.5%
Cap rate
2.9%
Rent to Value Ratio

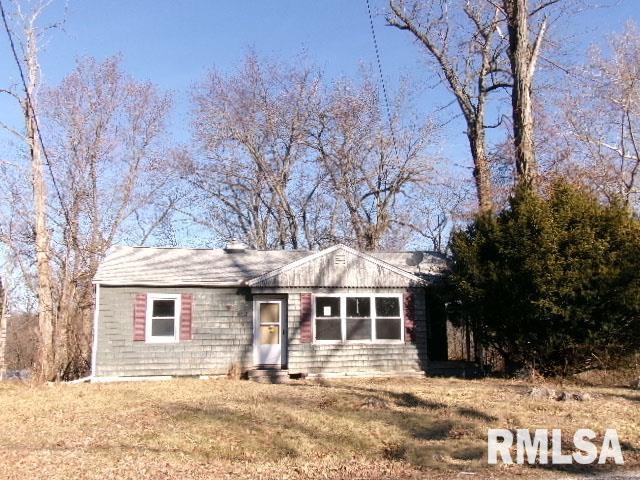
Active
$14,900
3
bds
|
1
ba
|
864
sqft
|
built
1920
2502 W Malone St, Peoria, IL 61605
$794
Cash flow
62.1%
Cash-on-Cash Return
63.9%
Cap rate
8.1%
Rent to Value Ratio
Active
$75,000
3
bds
|
1
ba
|
1,276
sqft
|
built
1912
1114 N Garfield Ave, Peoria, IL 61606
$479
Cash flow
33.3%
Cash-on-Cash Return
13.3%
Cap rate
1.7%
Rent to Value Ratio
Active
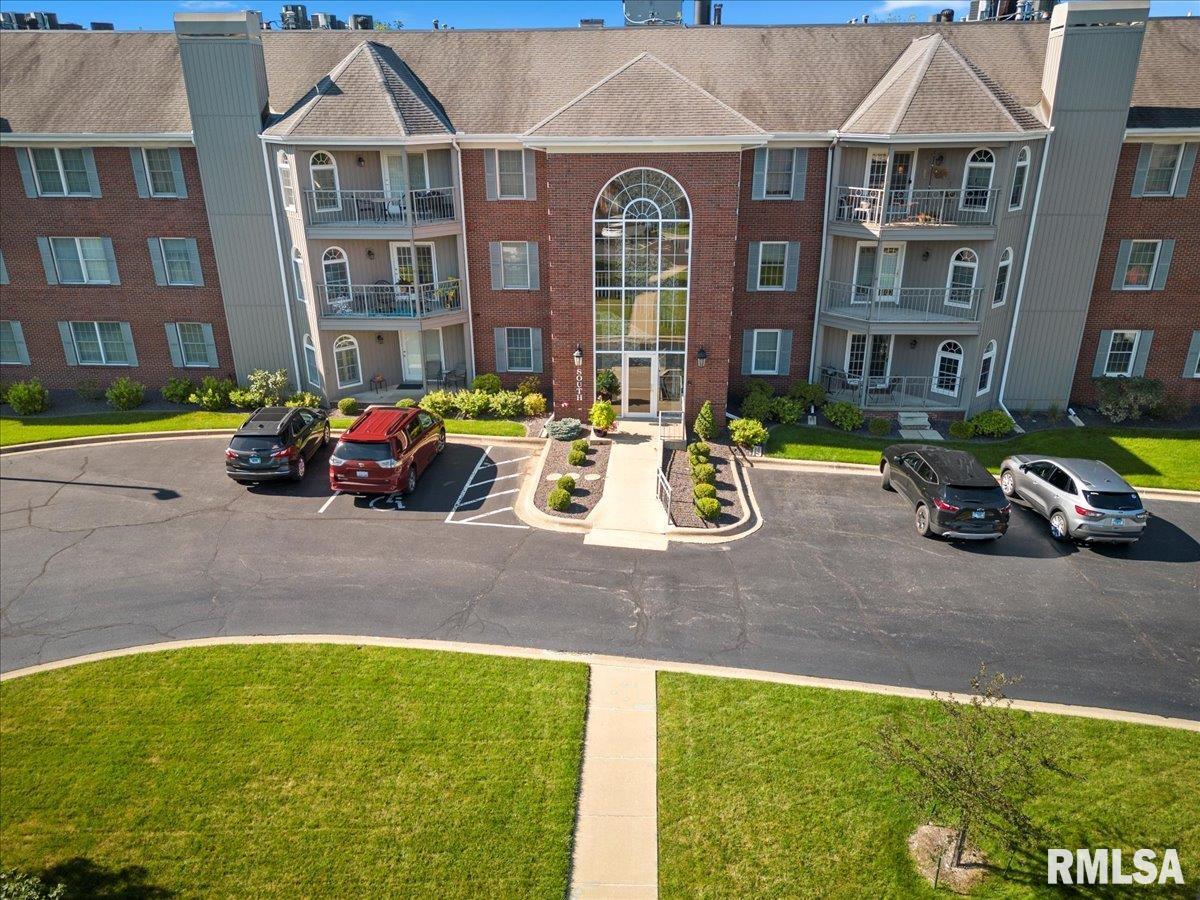
$135,000
2
bds
|
2
ba
|
1,171
sqft
|
built
1984
125 SW Jefferson Street, Peoria, IL 61602
n/a
Cash flow
n/a
Cash-on-Cash Return
n/a
Cap rate
n/a
Rent to Value Ratio
Active
$59,900
2
bds
|
1
ba
|
780
sqft
|
built
1970
3623 N Sterling Avenue, Peoria, IL 61604
n/a
Cash flow
n/a
Cash-on-Cash Return
n/a
Cap rate
n/a
Rent to Value Ratio

Active
$229,000
bds
|
0
ba
|
0
sqft
|
built
1940
919 W 3 Rd Ave, Peoria, IL 61605
n/a
Cash flow
n/a
Cash-on-Cash Return
n/a
Cap rate
n/a
Rent to Value Ratio
Active
$80,000
1
bds
|
2
ba
|
1,199
sqft
|
built
1984
125 SW Jefferson Avenue, Peoria, IL 61602
n/a
Cash flow
n/a
Cash-on-Cash Return
n/a
Cap rate
n/a
Rent to Value Ratio
Active
$40,000
2
bds
|
1
ba
|
748
sqft
|
built
1921
910 W Virginia Ave, Peoria, IL 61604
$617
Cash flow
18.0%
Cash-on-Cash Return
18.5%
Cap rate
2.8%
Rent to Value Ratio
Active
$259,900
3
bds
|
2
ba
|
1,433
sqft
|
built
1957
5004 N University St, Peoria, IL 61614
$-404
Cash flow
-8.1%
Cash-on-Cash Return
3.8%
Cap rate
0.7%
Rent to Value Ratio
Active
$129,900
2
bds
|
2
ba
|
1,880
sqft
|
built
1998
3802 W Richwoods Blvd, Peoria, IL 61615
$94
Cash flow
3.8%
Cash-on-Cash Return
6.5%
Cap rate
1.1%
Rent to Value Ratio

Active
$237,500
2
bds
|
2
ba
|
1,541
sqft
|
built
1990
5200 N Knoxville Ave, Peoria, IL 61614
$-242
Cash flow
-5.3%
Cash-on-Cash Return
4.5%
Cap rate
0.8%
Rent to Value Ratio
Active
$259,900
4
bds
|
2
ba
|
1,945
sqft
|
built
1977
1529 W Richmar Rd, Peoria, IL 61615
$-376
Cash flow
-7.5%
Cash-on-Cash Return
3.9%
Cap rate
0.7%
Rent to Value Ratio