Illinois Investment Properties for Sale
Browse homes for sale and investment properties in Illinois. Refine your search by price, property type, or more.
Best cash flowing properties in Illinois
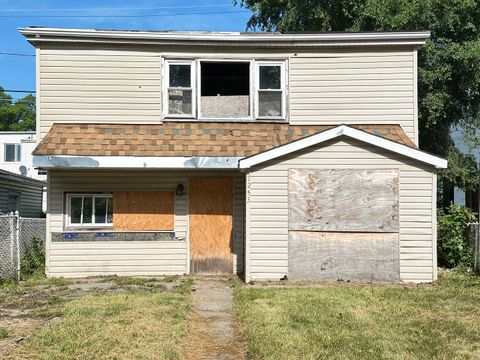
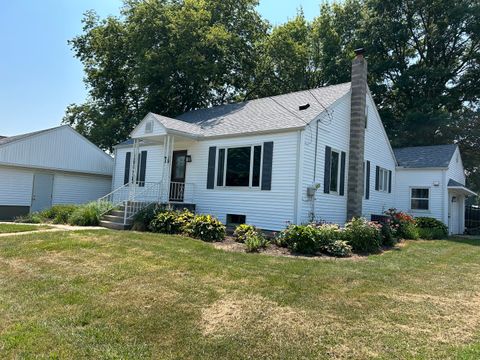
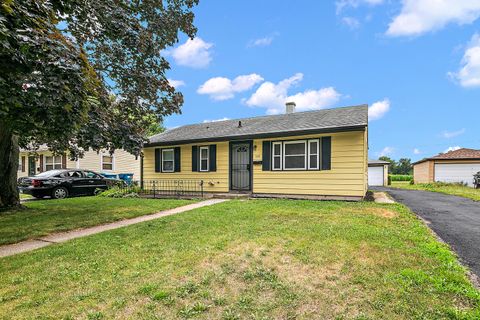
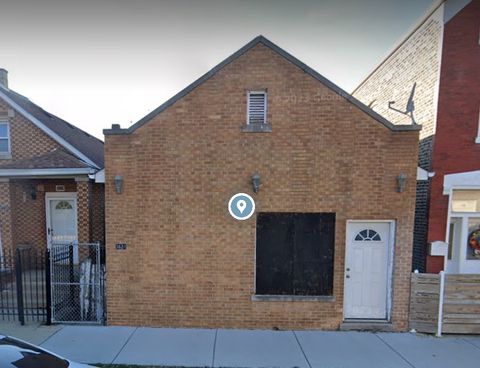
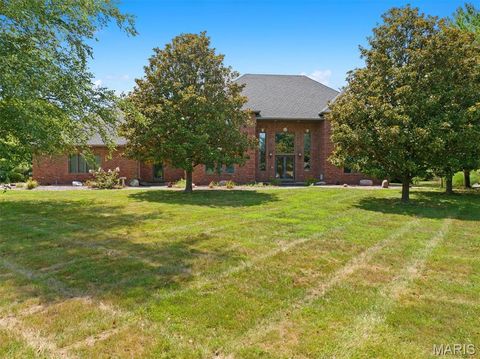
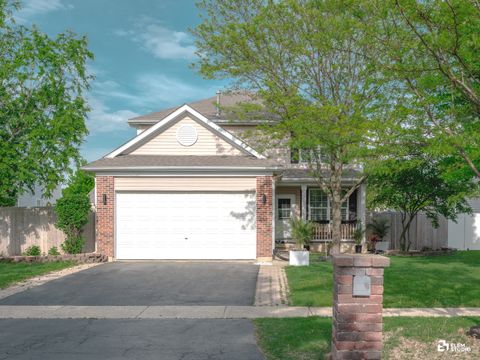
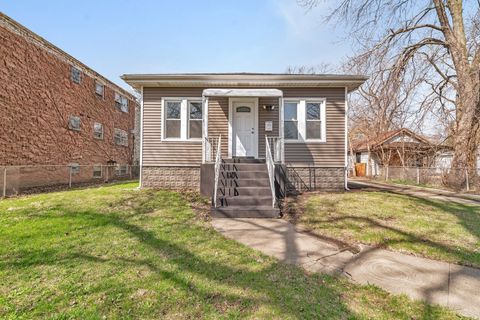
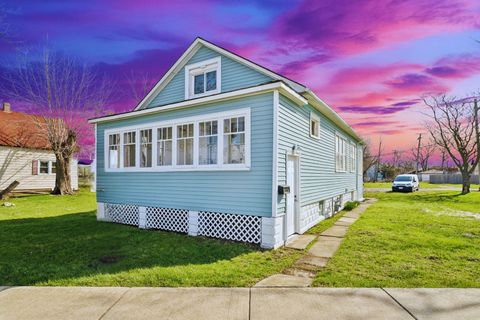
Active
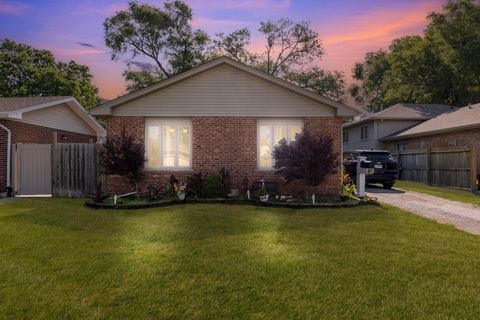
$60,000
4
bds
|
1
ba
|
864
sqft
|
built
1948
7253 S Prairie Ave, Chicago, IL 60619
$937
Cash flow
18.2%
Cash-on-Cash Return
18.7%
Cap rate
2.7%
Rent to Value Ratio
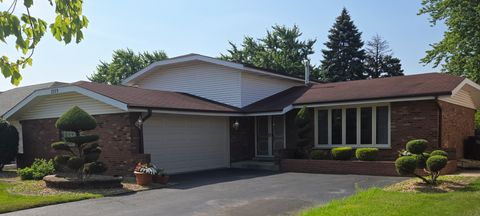
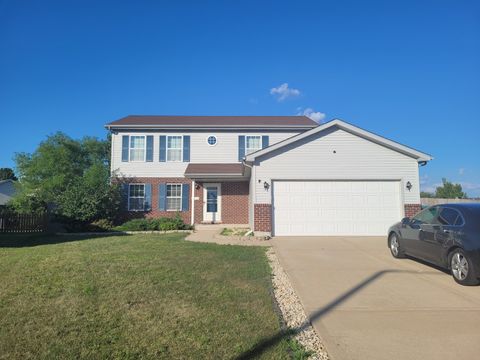
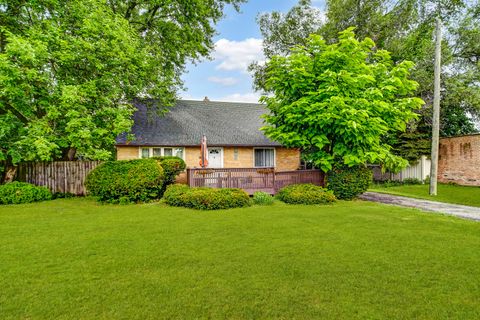
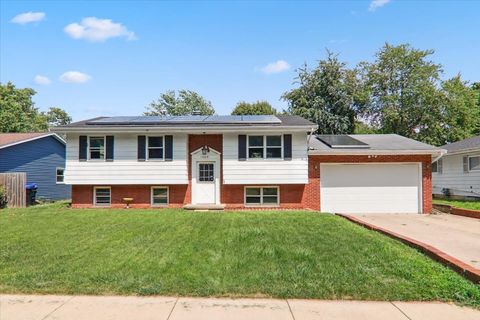
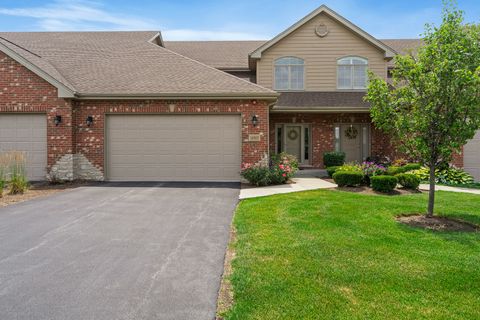
Active
$294,000
4
bds
|
2
ba
|
1,384
sqft
|
built
1976
2029 E 171st Pl, South Holland, IL 60473
$479
Cash flow
8.5%
Cash-on-Cash Return
7.6%
Cap rate
1.0%
Rent to Value Ratio
9,142 out of 13,351 properties for sale in Illinois
Limited Results Shown
Create a free account, or log in to reveal all property listings and enjoy the complete experience.
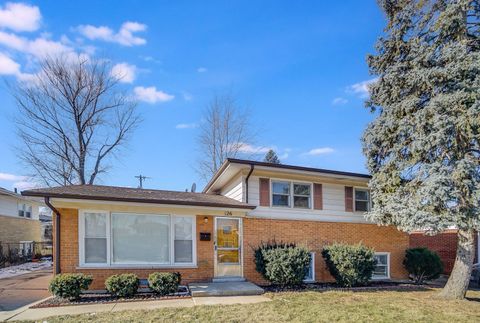
Active
$460,000
2
bds
|
3
ba
|
1,909
sqft
|
built
2015
2903 Henley Ln, Naperville, IL 60540
$-730
Cash flow
-8.3%
Cash-on-Cash Return
3.8%
Cap rate
0.8%
Rent to Value Ratio
Active
$550,000
2
bds
|
2
ba
|
1,932
sqft
|
built
1978
1401 Burr Oak Rd, Hinsdale, IL 60521
$-1,751
Cash flow
-16.6%
Cash-on-Cash Return
1.9%
Cap rate
0.7%
Rent to Value Ratio
Active
$220,000
3
bds
|
2
ba
|
1,500
sqft
|
built
1947
211 N Taylor St, Cherry, IL 61317
$-409
Cash flow
-9.7%
Cash-on-Cash Return
3.4%
Cap rate
0.6%
Rent to Value Ratio
Active
$385,000
4
bds
|
3
ba
|
1,973
sqft
|
built
2014
1112 Kim Ct, Joliet, IL 60431
$-668
Cash flow
-9.1%
Cash-on-Cash Return
3.6%
Cap rate
0.7%
Rent to Value Ratio
Active
$729,900
5
bds
|
4
ba
|
3,930
sqft
|
built
2005
3129 N Oconto Ave, Chicago, IL 60707
$-774
Cash flow
-5.5%
Cash-on-Cash Return
4.4%
Cap rate
0.7%
Rent to Value Ratio
Active
$399,500
4
bds
|
3
ba
|
0
sqft
|
built
1915
1911 S 49th Ave, Cicero, IL 60804
$-1,523
Cash flow
-19.9%
Cash-on-Cash Return
1.1%
Cap rate
0.5%
Rent to Value Ratio
Active
$144,000
3
bds
|
1
ba
|
1,011
sqft
|
built
1952
729 N Webster Cir W, Kankakee, IL 60901
$62
Cash flow
2.2%
Cash-on-Cash Return
6.2%
Cap rate
1.0%
Rent to Value Ratio
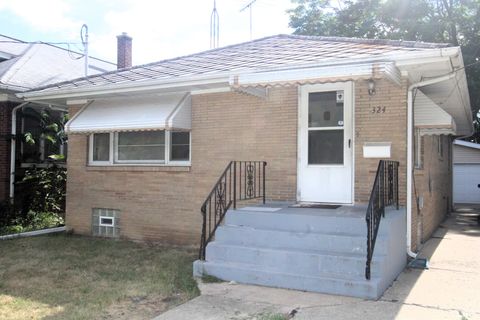
Active
$175,000
2
bds
|
1
ba
|
960
sqft
|
built
1953
324 Illinois St, Joliet, IL 60436
$100
Cash flow
3.0%
Cash-on-Cash Return
6.4%
Cap rate
1.0%
Rent to Value Ratio
Active
$283,000
1
bds
|
1
ba
|
840
sqft
|
built
1962
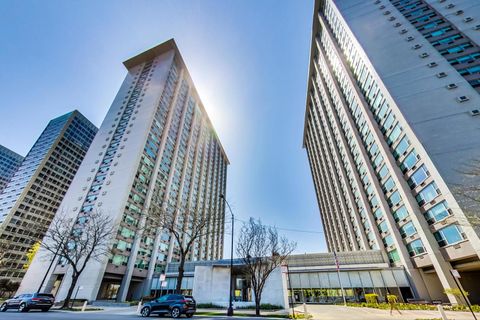
1300 N Astor St, Chicago, IL 60610
$-1,126
Cash flow
-20.8%
Cash-on-Cash Return
0.9%
Cap rate
0.8%
Rent to Value Ratio
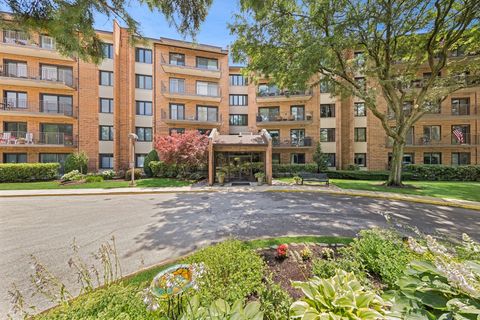
Active
$330,000
2
bds
|
2
ba
|
1,512
sqft
|
built
1979
601 Lake Hinsdale Dr, Willowbrook, IL 60527
$-385
Cash flow
-6.1%
Cash-on-Cash Return
4.3%
Cap rate
0.8%
Rent to Value Ratio
Active
$300,000
4
bds
|
2
ba
|
0
sqft
|
built
1888
3624 S Paulina St, Chicago, IL 60609
$-252
Cash flow
-4.4%
Cash-on-Cash Return
4.7%
Cap rate
0.7%
Rent to Value Ratio
Active
$295,000
3
bds
|
2
ba
|
1,031
sqft
|
built
1958
7912 S 85th Ave, Justice, IL 60458
$-265
Cash flow
-4.7%
Cash-on-Cash Return
4.6%
Cap rate
0.8%
Rent to Value Ratio
Active
$215,000
3
bds
|
2
ba
|
1,432
sqft
|
built
1948
1080 E Bluff St, Marseilles, IL 61341
$80
Cash flow
1.9%
Cash-on-Cash Return
6.1%
Cap rate
0.8%
Rent to Value Ratio
Active
$280,000
4
bds
|
3
ba
|
1,320
sqft
|
built
1919
15355 7th Ave, Phoenix, IL 60426
$-745
Cash flow
-13.9%
Cash-on-Cash Return
2.5%
Cap rate
0.6%
Rent to Value Ratio
Active
$259,900
3
bds
|
2
ba
|
1,354
sqft
|
built
2001
14801 S Harrison Ave, Posen, IL 60469
$38
Cash flow
0.8%
Cash-on-Cash Return
5.9%
Cap rate
1.0%
Rent to Value Ratio
Active
$452,300
3
bds
|
2
ba
|
2,360
sqft
|
built
1929
6928 Pershing Rd, Berwyn, IL 60402
$-719
Cash flow
-8.3%
Cash-on-Cash Return
3.8%
Cap rate
0.8%
Rent to Value Ratio
Active
$645,000
3
bds
|
3
ba
|
0
sqft
|
built
1990
2819 S Quinn St, Chicago, IL 60608
$-1,148
Cash flow
-9.3%
Cash-on-Cash Return
3.5%
Cap rate
0.5%
Rent to Value Ratio
Active
$264,950
1
bds
|
1
ba
|
860
sqft
|
built
1965
260 E Chestnut St, Chicago, IL 60611
$-943
Cash flow
-18.6%
Cash-on-Cash Return
1.4%
Cap rate
0.8%
Rent to Value Ratio
Active
$799,999
5
bds
|
6
ba
|
7,857
sqft
|
built
1994
517 E Waters Edge Dr, Belleville, IL 62221
$-2,338
Cash flow
-15.2%
Cash-on-Cash Return
2.2%
Cap rate
0.6%
Rent to Value Ratio
Active
$175,000
4
bds
|
2
ba
|
1,862
sqft
|
built
1967
1209 Gettysburg Dr, Bloomington, IL 61704
$74
Cash flow
2.2%
Cash-on-Cash Return
6.2%
Cap rate
1.0%
Rent to Value Ratio
Active
$135,000
1
bds
|
1
ba
|
700
sqft
|
built
1968
7234 W North Ave, Elmwood Park, IL 60707
$-376
Cash flow
-14.5%
Cash-on-Cash Return
2.3%
Cap rate
1.0%
Rent to Value Ratio
Active
$139,500
1
bds
|
1
ba
|
800
sqft
|
built
1969
7061 N Kedzie Ave, Chicago, IL 60645
$163
Cash flow
6.1%
Cash-on-Cash Return
7.1%
Cap rate
1.4%
Rent to Value Ratio
Active
$427,000
4
bds
|
4
ba
|
2,380
sqft
|
built
2005
424 Grape Vine Trl, Oswego, IL 60543
$-528
Cash flow
-6.5%
Cash-on-Cash Return
4.2%
Cap rate
0.7%
Rent to Value Ratio
Active
$224,900
2
bds
|
1
ba
|
1,100
sqft
|
built
1927
400 Ridge Ave, Evanston, IL 60202
$-386
Cash flow
-9.0%
Cash-on-Cash Return
3.6%
Cap rate
0.9%
Rent to Value Ratio
Active
$165,000
2
bds
|
2
ba
|
900
sqft
|
built
1978
931 W Arquilla Dr, Glenwood, IL 60425
$263
Cash flow
8.3%
Cash-on-Cash Return
7.6%
Cap rate
1.2%
Rent to Value Ratio
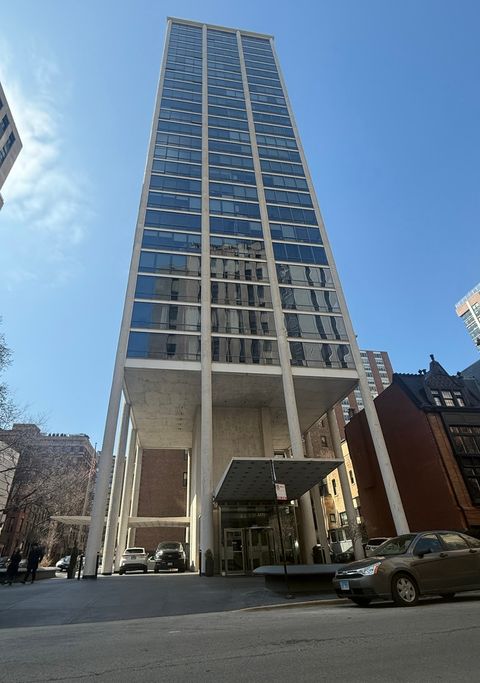
Active
$499,000
3
bds
|
2
ba
|
1,761
sqft
|
built
1966
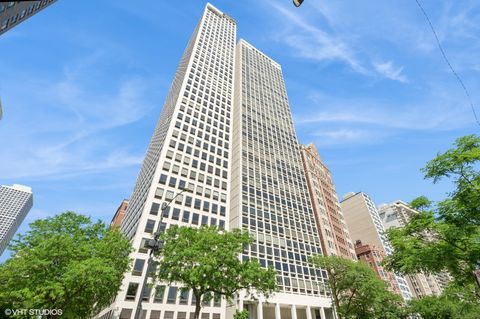
1440 N Lake Shore Dr, Chicago, IL 60610
$-3,058
Cash flow
-32.0%
Cash-on-Cash Return
-1.7%
Cap rate
0.7%
Rent to Value Ratio
Active
$150,000
2
bds
|
2
ba
|
1,300
sqft
|
built
1909
13916 S Dearborn St, Riverdale, IL 60827
$180
Cash flow
6.3%
Cash-on-Cash Return
7.1%
Cap rate
1.2%
Rent to Value Ratio
Active
$230,000
3
bds
|
2
ba
|
1,070
sqft
|
built
1964
126 N Floyd Ln, Chicago Heights, IL 60411
$222
Cash flow
5.0%
Cash-on-Cash Return
6.8%
Cap rate
1.0%
Rent to Value Ratio
Active
$317,500
3
bds
|
3
ba
|
2,744
sqft
|
built
1968
874 Hillandale Dr, Antioch, IL 60002
$-352
Cash flow
-5.8%
Cash-on-Cash Return
4.4%
Cap rate
0.8%
Rent to Value Ratio
Active
$325,000
6
bds
|
2
ba
|
0
sqft
|
built
1901
515 George Ave, Waukegan, IL 60085
$-725
Cash flow
-11.6%
Cash-on-Cash Return
3.0%
Cap rate
0.6%
Rent to Value Ratio
Active
$173,000
0
bds
|
1
ba
|
0
sqft
|
built
1960
3600 N Lake Shore Dr, Chicago, IL 60613
$-357
Cash flow
-10.8%
Cash-on-Cash Return
3.2%
Cap rate
0.9%
Rent to Value Ratio

Active
$199,000
5
bds
|
3
ba
|
0
sqft
|
built
1890
320 W Saint Paul St, Spring Valley, IL 61362
$-374
Cash flow
-9.8%
Cash-on-Cash Return
3.4%
Cap rate
0.6%
Rent to Value Ratio
Active
$1,099,000
4
bds
|
3
ba
|
2,412
sqft
|
built
1942
1596 Palatine Rd, Inverness, IL 60067
$-3,726
Cash flow
-17.7%
Cash-on-Cash Return
1.6%
Cap rate
0.4%
Rent to Value Ratio
Active
$675,000
2
bds
|
3
ba
|
2,090
sqft
|
built
1970
1110 N Lake Shore Dr, Chicago, IL 60611
$-3,362
Cash flow
-26.0%
Cash-on-Cash Return
-0.3%
Cap rate
0.7%
Rent to Value Ratio
Active
$215,000
5
bds
|
2
ba
|
1,916
sqft
|
built
1946
428 W Williams St, Kankakee, IL 60901
$-9
Cash flow
-0.2%
Cash-on-Cash Return
5.6%
Cap rate
0.9%
Rent to Value Ratio
Active
$140,000
2
bds
|
1
ba
|
803
sqft
|
built
1942
15211 Vincennes Rd, Harvey, IL 60426
$34
Cash flow
1.3%
Cash-on-Cash Return
6.0%
Cap rate
1.1%
Rent to Value Ratio
Active
$449,900
3
bds
|
3
ba
|
1,950
sqft
|
built
2018
14903 S Preserve Dr, Lockport, IL 60441
$-792
Cash flow
-9.2%
Cash-on-Cash Return
3.6%
Cap rate
0.8%
Rent to Value Ratio

Active
$1,699,999
4
bds
|
4
ba
|
4,150
sqft
|
built
1919
2715 Reese Ave, Evanston, IL 60201
$-6,665
Cash flow
-20.5%
Cash-on-Cash Return
1.0%
Cap rate
0.2%
Rent to Value Ratio