Illinois Investment Properties for Sale
Browse homes for sale and investment properties in Illinois. Refine your search by price, property type, or more.
Best cash flowing properties in Illinois
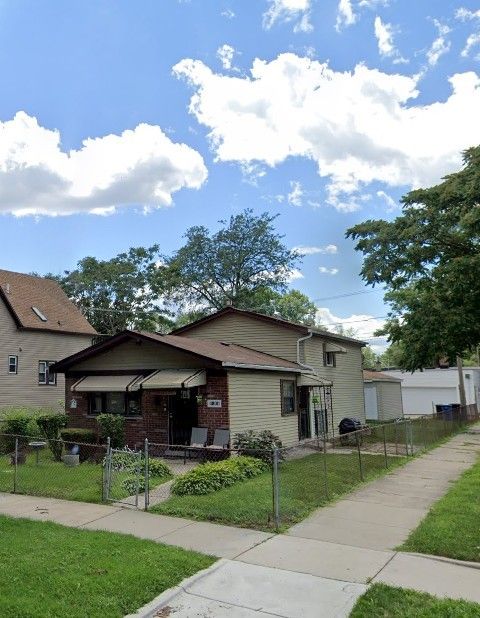
Active
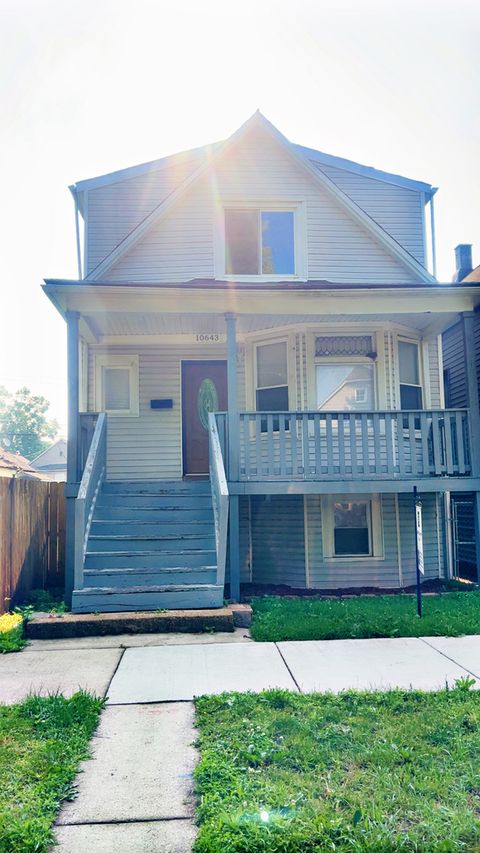
$205,000
6
bds
|
2
ba
|
2,100
sqft
|
built
1908
10643 S Calhoun Ave, Chicago, IL 60617
$900
Cash flow
22.9%
Cash-on-Cash Return
10.9%
Cap rate
1.4%
Rent to Value Ratio
Active
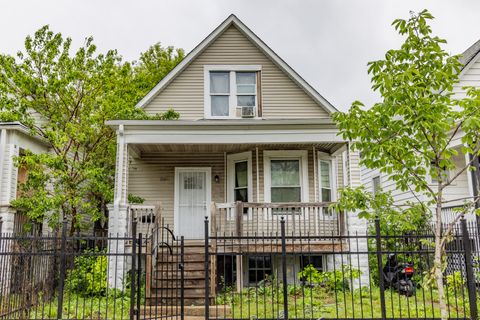
$135,000
3
bds
|
2
ba
|
1,079
sqft
|
built
1913
1508 W 72nd St, Chicago, IL 60636
$800
Cash flow
30.9%
Cash-on-Cash Return
12.8%
Cap rate
1.6%
Rent to Value Ratio
7,852 out of 11,727 properties for sale in Illinois
Limited Results Shown
Create a free account, or log in to reveal all property listings and enjoy the complete experience.
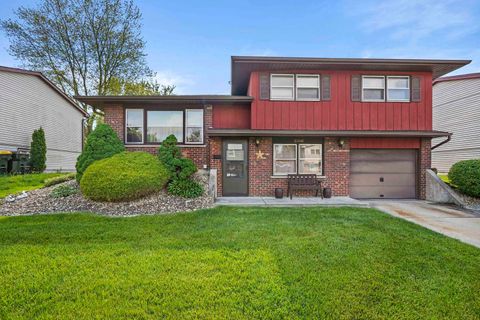
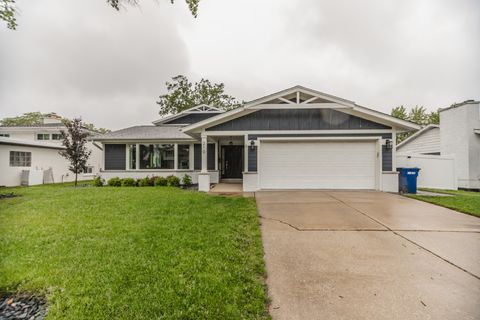
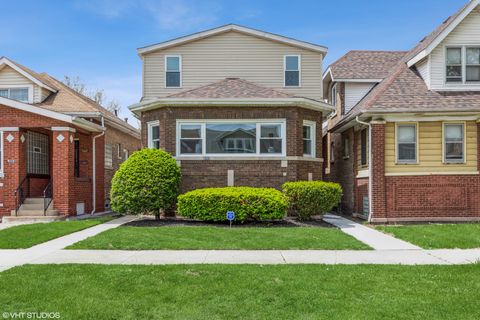
Active
$505,000
4
bds
|
3
ba
|
4,168
sqft
|
built
1978
43389 N Oakcrest Ln, Zion, IL 60099
$-713
Cash flow
-7.4%
Cash-on-Cash Return
4.0%
Cap rate
0.8%
Rent to Value Ratio
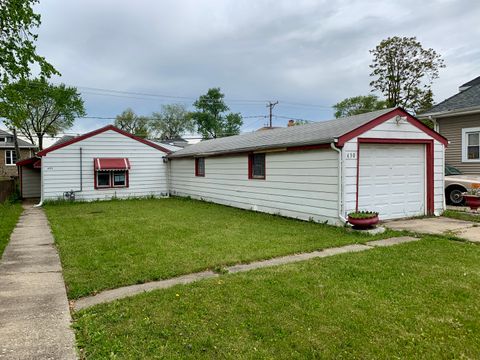
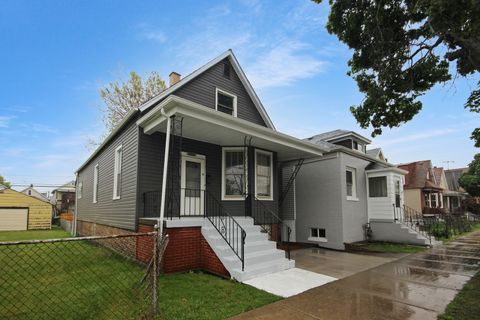
Active
$275,000
3
bds
|
2
ba
|
1,667
sqft
|
built
1919
4821 W 24th St, Cicero, IL 60804
$-310
Cash flow
-5.9%
Cash-on-Cash Return
4.3%
Cap rate
0.8%
Rent to Value Ratio
Active
$259,000
3
bds
|
2
ba
|
1,150
sqft
|
built
1978
15240 Woodlawn Ave, Dolton, IL 60419
$-318
Cash flow
-6.4%
Cash-on-Cash Return
4.2%
Cap rate
0.8%
Rent to Value Ratio
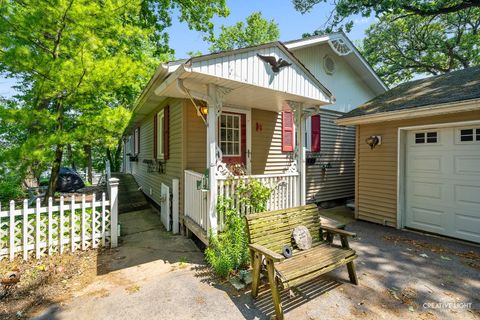
Active
$285,000
4
bds
|
2
ba
|
1,318
sqft
|
built
1936
318 David Ct, Island Lake, IL 60042
$-435
Cash flow
-8.0%
Cash-on-Cash Return
3.8%
Cap rate
0.7%
Rent to Value Ratio
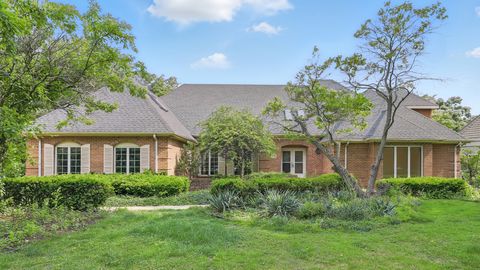
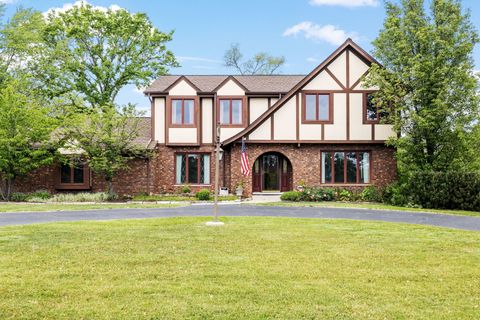
Active
$484,900
4
bds
|
3
ba
|
2,500
sqft
|
built
2000
2825 Centurion Ln, New Lenox, IL 60451
$-655
Cash flow
-7.0%
Cash-on-Cash Return
4.1%
Cap rate
0.7%
Rent to Value Ratio
Active
$229,000
3
bds
|
2
ba
|
1,650
sqft
|
built
1971
522 E Algonquin Rd, Schaumburg, IL 60173
$-397
Cash flow
-9.0%
Cash-on-Cash Return
3.6%
Cap rate
1.0%
Rent to Value Ratio
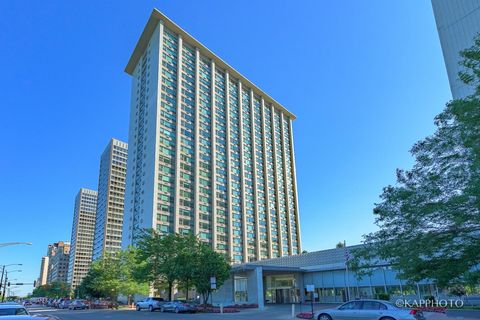
Active
$165,900
0
bds
|
1
ba
|
530
sqft
|
built
1969
1340 N Dearborn St, Chicago, IL 60610
$-399
Cash flow
-12.5%
Cash-on-Cash Return
2.8%
Cap rate
1.0%
Rent to Value Ratio
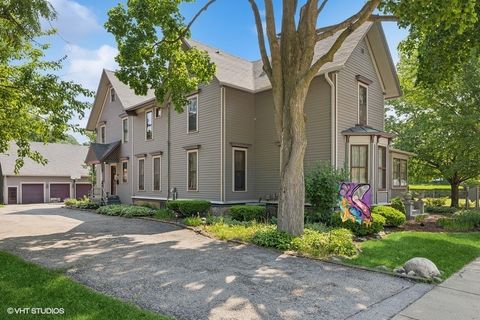
Active
$550,000
6
bds
|
5
ba
|
3,437
sqft
|
built
1886
314 Washington St, Algonquin, IL 60102
$-887
Cash flow
-8.4%
Cash-on-Cash Return
3.7%
Cap rate
0.7%
Rent to Value Ratio
Active
$215,000
3
bds
|
2
ba
|
1,052
sqft
|
built
1971
20048 Orchard Ave, Lynwood, IL 60411
$343
Cash flow
8.3%
Cash-on-Cash Return
7.6%
Cap rate
1.0%
Rent to Value Ratio
Active
$220,000
3
bds
|
2
ba
|
969
sqft
|
built
1973
11800 S Peoria St, Chicago, IL 60643
$338
Cash flow
8.0%
Cash-on-Cash Return
7.5%
Cap rate
0.9%
Rent to Value Ratio
Active
$360,000
2
bds
|
3
ba
|
1,579
sqft
|
built
2021
13926 S Addison Trl, Homer Glen, IL 60491
$-750
Cash flow
-10.9%
Cash-on-Cash Return
3.2%
Cap rate
0.8%
Rent to Value Ratio
Active
$262,800
3
bds
|
2
ba
|
2,081
sqft
|
built
1959
3355 202nd St, Lynwood, IL 60411
$282
Cash flow
5.6%
Cash-on-Cash Return
7.0%
Cap rate
1.0%
Rent to Value Ratio
Active
$589,900
3
bds
|
4
ba
|
2,193
sqft
|
built
2017
1604 Kassen Ave, Mahomet, IL 61853
$-1,441
Cash flow
-12.7%
Cash-on-Cash Return
2.7%
Cap rate
0.6%
Rent to Value Ratio
Active
$274,900
3
bds
|
2
ba
|
1,162
sqft
|
built
1958
3743 E 112th St, Chicago, IL 60617
$217
Cash flow
4.1%
Cash-on-Cash Return
6.6%
Cap rate
0.8%
Rent to Value Ratio
Active
$1,490,000
4
bds
|
5
ba
|
6,081
sqft
|
built
1985
812 Saint Stephens Grn, Oak Brook, IL 60523
$-3,984
Cash flow
-14.0%
Cash-on-Cash Return
2.5%
Cap rate
0.4%
Rent to Value Ratio
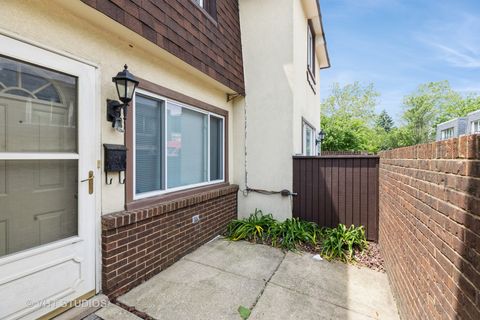
Active
$225,000
2
bds
|
2
ba
|
988
sqft
|
built
1968
4037 Fitzjames Walk, Oak Lawn, IL 60453
$-294
Cash flow
-6.8%
Cash-on-Cash Return
4.1%
Cap rate
0.8%
Rent to Value Ratio
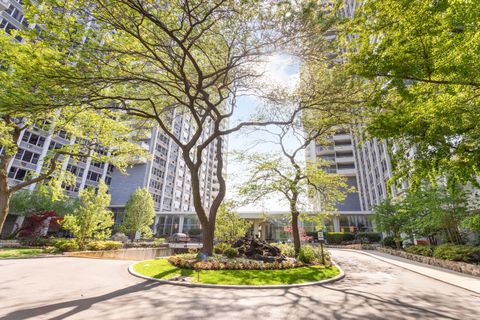
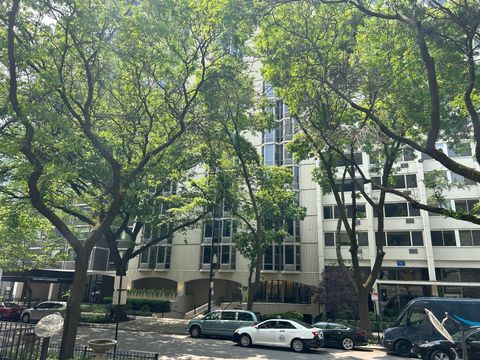
Active
$215,500
1
bds
|
1
ba
|
900
sqft
|
built
1962
4250 N Marine Dr, Chicago, IL 60613
$-630
Cash flow
-15.3%
Cash-on-Cash Return
2.2%
Cap rate
0.9%
Rent to Value Ratio
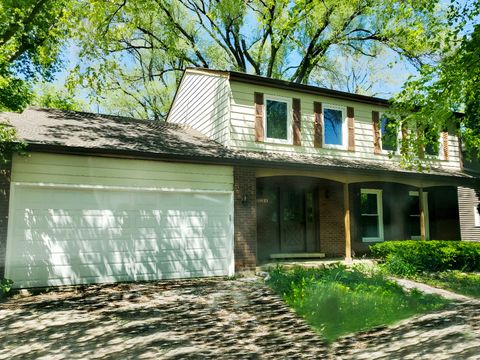
Active
$329,900
4
bds
|
3
ba
|
1,975
sqft
|
built
1979
6111 Pingree Rd, Crystal Lake, IL 60014
$-902
Cash flow
-14.3%
Cash-on-Cash Return
2.4%
Cap rate
0.7%
Rent to Value Ratio
Active
$1,199,900
5
bds
|
3
ba
|
3,000
sqft
|
built
1960
210 51st Pl, Western Springs, IL 60558
$-3,716
Cash flow
-16.2%
Cash-on-Cash Return
2.0%
Cap rate
0.4%
Rent to Value Ratio
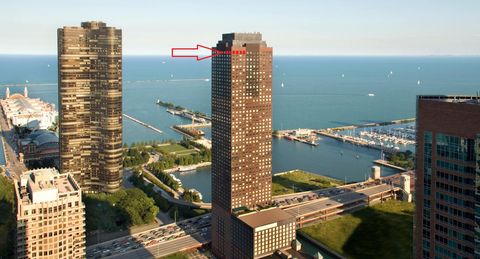
Active
$179,000
bds
|
1
ba
|
550
sqft
|
built
1960
3600 N Lake Shore Dr, Chicago, IL 60613
$-282
Cash flow
-8.2%
Cash-on-Cash Return
3.8%
Cap rate
1.0%
Rent to Value Ratio
Active
$559,900
2
bds
|
3
ba
|
2,400
sqft
|
built
1983
437 Holiday Dr, Somonauk, IL 60552
$-1,484
Cash flow
-13.8%
Cash-on-Cash Return
2.5%
Cap rate
0.3%
Rent to Value Ratio
Active
$124,000
3
bds
|
2
ba
|
1,016
sqft
|
built
1947
430 23rd Ave, Bellwood, IL 60104
$391
Cash flow
16.5%
Cash-on-Cash Return
9.5%
Cap rate
1.6%
Rent to Value Ratio
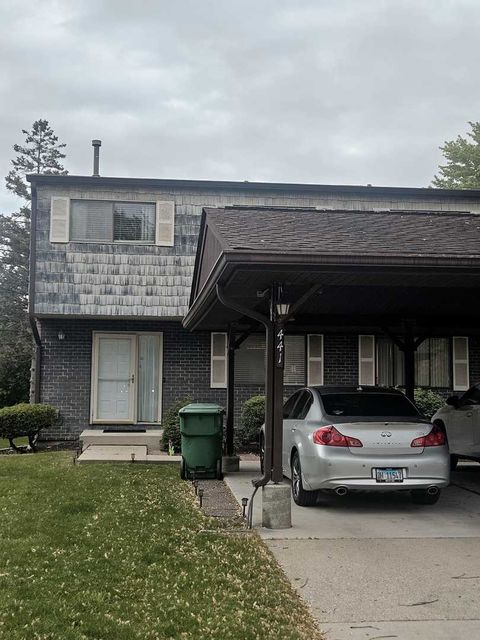
Active
$314,900
3
bds
|
3
ba
|
1,500
sqft
|
built
1978
441 Commanche Trl, Wheeling, IL 60090
$-235
Cash flow
-3.9%
Cash-on-Cash Return
4.8%
Cap rate
0.9%
Rent to Value Ratio
Active
$785,000
3
bds
|
3
ba
|
1,980
sqft
|
built
1991
474 N Lake Shore Dr, Chicago, IL 60611
$-4,979
Cash flow
-33.1%
Cash-on-Cash Return
-1.9%
Cap rate
0.4%
Rent to Value Ratio
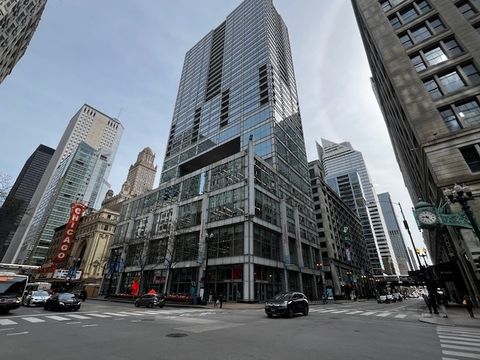
Active
$254,900
1
bds
|
1
ba
|
850
sqft
|
built
2008
8 E Randolph St, Chicago, IL 60601
$-1,008
Cash flow
-20.6%
Cash-on-Cash Return
0.9%
Cap rate
1.0%
Rent to Value Ratio
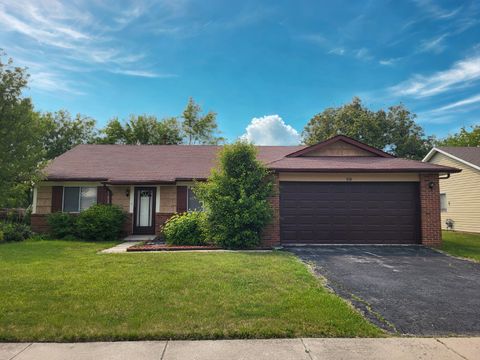
Active
$233,000
3
bds
|
2
ba
|
1,356
sqft
|
built
1976
50 Oakhurst Rd, Matteson, IL 60443
$172
Cash flow
3.9%
Cash-on-Cash Return
6.6%
Cap rate
1.1%
Rent to Value Ratio
Active
$264,900
4
bds
|
1
ba
|
1,552
sqft
|
built
1925
8222 S Saint Lawrence Ave, Chicago, IL 60619
$119
Cash flow
2.3%
Cash-on-Cash Return
6.2%
Cap rate
0.9%
Rent to Value Ratio
Active
$200,000
3
bds
|
2
ba
|
1,200
sqft
|
built
2005
6528 S University Ave, Chicago, IL 60637
$191
Cash flow
5.0%
Cash-on-Cash Return
6.8%
Cap rate
1.2%
Rent to Value Ratio
Active
$200,000
3
bds
|
2
ba
|
2,200
sqft
|
built
1883
9711 S Avenue N, Chicago, IL 60617
$9
Cash flow
0.2%
Cash-on-Cash Return
5.7%
Cap rate
0.8%
Rent to Value Ratio
Active
$599,900
4
bds
|
4
ba
|
4,062
sqft
|
built
1982
60 Romiga Ln, Palos Park, IL 60464
$-439
Cash flow
-3.8%
Cash-on-Cash Return
4.8%
Cap rate
0.9%
Rent to Value Ratio
Active
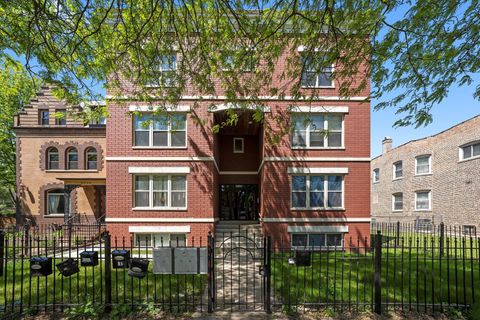
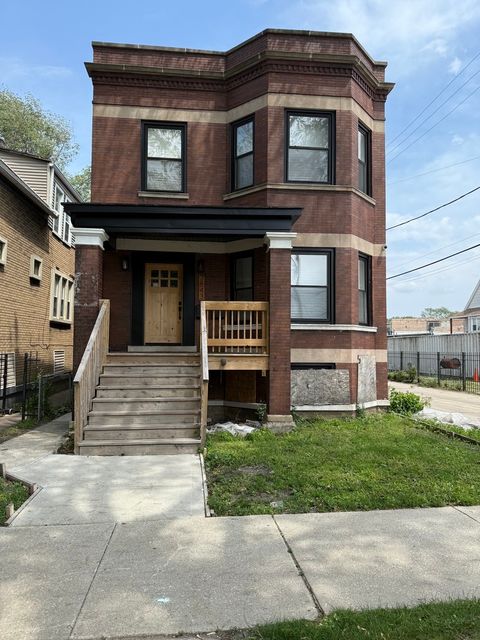
$385,000
7
bds
|
2
ba
|
0
sqft
|
built
1912
7843 S Marquette Ave, Chicago, IL 60649
$-533
Cash flow
-7.2%
Cash-on-Cash Return
4.0%
Cap rate
0.6%
Rent to Value Ratio
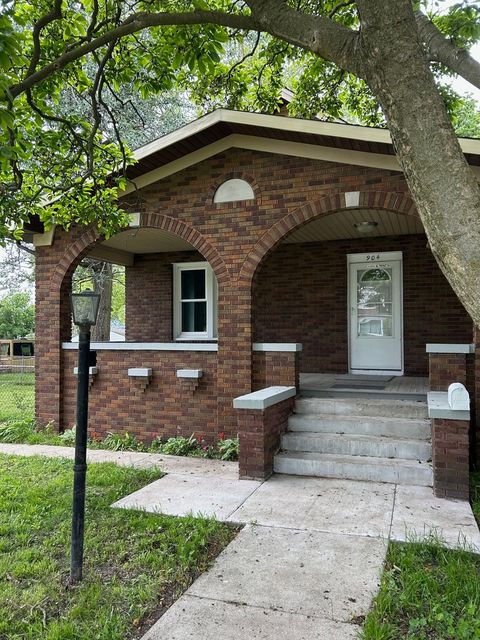
Active
$170,000
2
bds
|
2
ba
|
975
sqft
|
built
1914
904 Johnson St, Streator, IL 61364
$-390
Cash flow
-12.0%
Cash-on-Cash Return
2.9%
Cap rate
0.6%
Rent to Value Ratio
Active
$499,000
5
bds
|
4
ba
|
0
sqft
|
built
1908
3645 S Wood St, Chicago, IL 60609
$-1,208
Cash flow
-12.6%
Cash-on-Cash Return
2.8%
Cap rate
0.5%
Rent to Value Ratio
Active
$209,900
2
bds
|
2
ba
|
1,007
sqft
|
built
1968
1015 Deerfield Rd, Deerfield, IL 60015
$-249
Cash flow
-6.2%
Cash-on-Cash Return
4.3%
Cap rate
1.1%
Rent to Value Ratio
Active
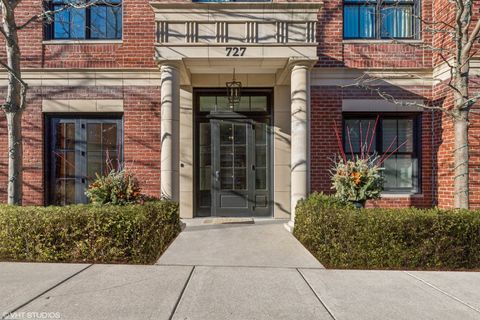
$3,950,000
3
bds
|
5
ba
|
4,600
sqft
|
built
2020
727 N Mc Kinley Rd, Lake Forest, IL 60045
$-20,477
Cash flow
-27.0%
Cash-on-Cash Return
-0.5%
Cap rate
0.1%
Rent to Value Ratio
Active
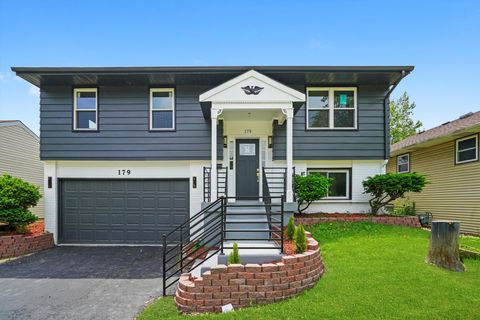
$430,000
4
bds
|
2
ba
|
1,523
sqft
|
built
1970
179 Glen Hill Dr, Glendale Heights, IL 60139
$-890
Cash flow
-10.8%
Cash-on-Cash Return
3.2%
Cap rate
0.6%
Rent to Value Ratio
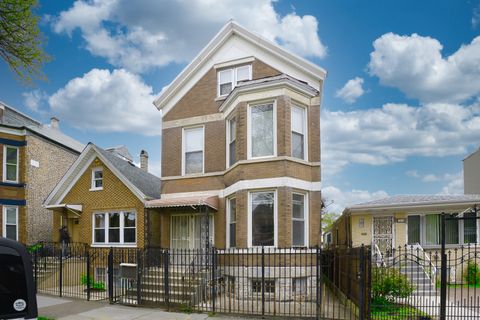
Active
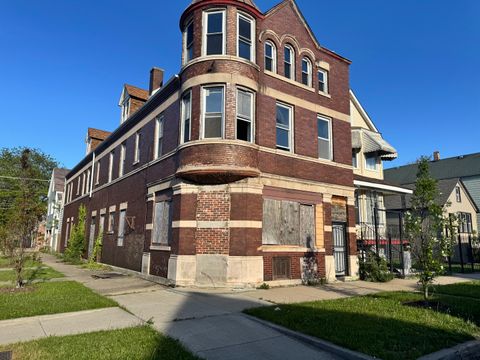
$229,000
10
bds
|
5
ba
|
0
sqft
|
built
1912
8401 S Brandon Ave, Chicago, IL 60617
$-536
Cash flow
-12.2%
Cash-on-Cash Return
2.9%
Cap rate
0.5%
Rent to Value Ratio
Active
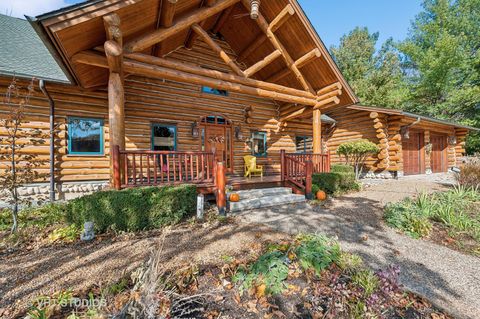
$1,275,000
4
bds
|
3
ba
|
5,500
sqft
|
built
2002
2317 Paulson Rd, Harvard, IL 60033
$-2,349
Cash flow
-9.6%
Cash-on-Cash Return
3.5%
Cap rate
0.5%
Rent to Value Ratio