Illinois Investment Properties for Sale
Browse homes for sale and investment properties in Illinois. Refine your search by price, property type, or more.
Best cash flowing properties in Illinois
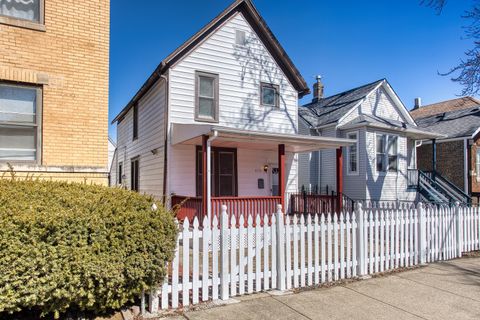
Active
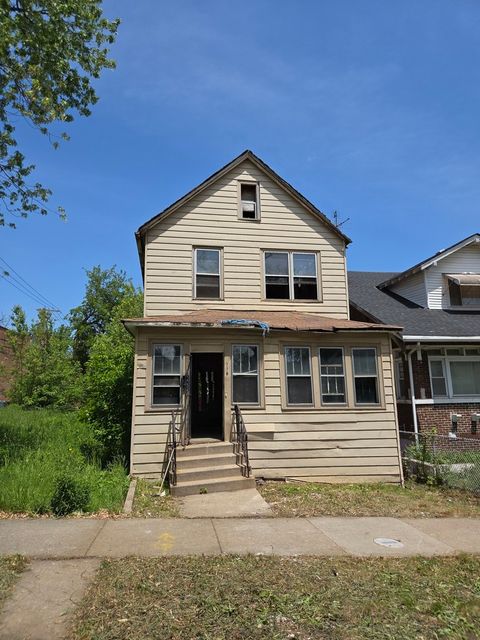
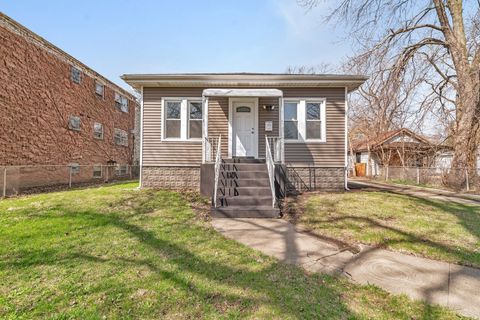
$57,900
5
bds
|
2
ba
|
1,600
sqft
|
built
1900
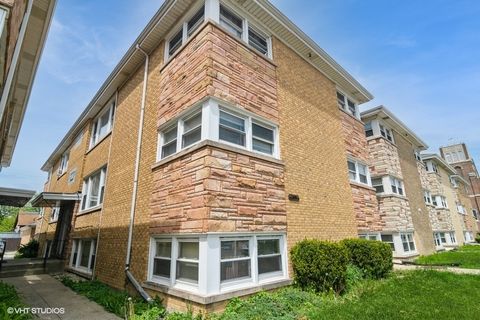
116 E 118th Pl, Chicago, IL 60628
$1,311
Cash flow
26.4%
Cash-on-Cash Return
27.2%
Cap rate
3.3%
Rent to Value Ratio
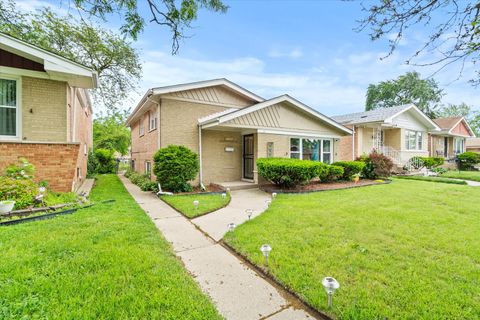
Active
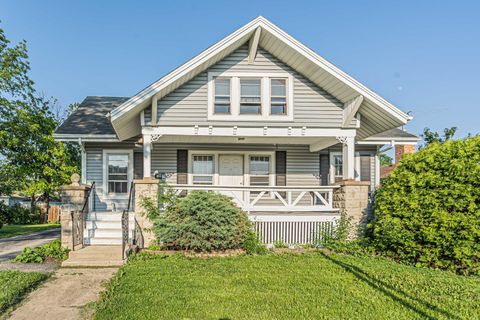
$205,000
3
bds
|
2
ba
|
1,191
sqft
|
built
1962
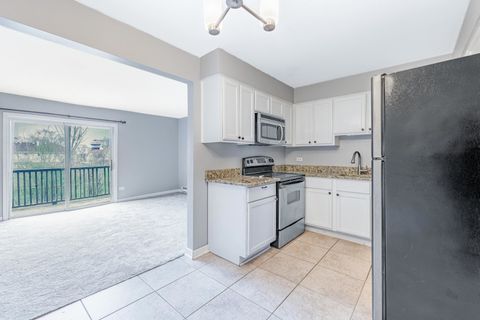
14427 Kenwood Ave, Dolton, IL 60419
$253
Cash flow
6.4%
Cash-on-Cash Return
7.2%
Cap rate
1.2%
Rent to Value Ratio
9,457 out of 13,469 properties for sale in Illinois
Limited Results Shown
Create a free account, or log in to reveal all property listings and enjoy the complete experience.
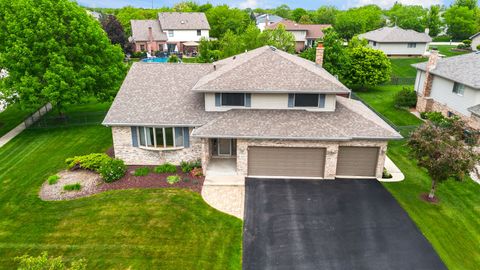
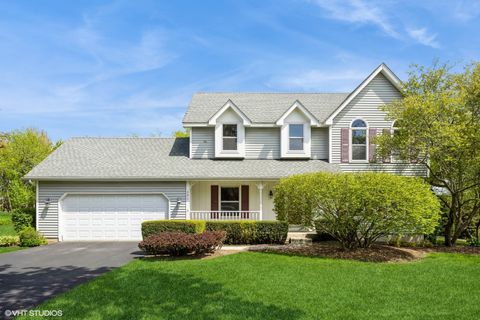
Active
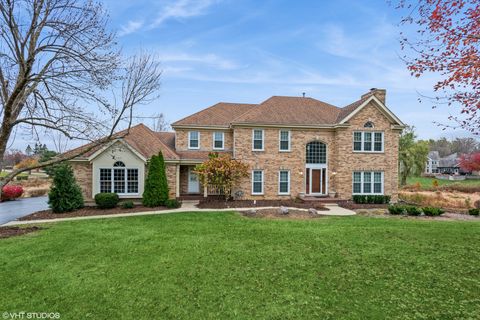
$499,900
3
bds
|
3
ba
|
2,700
sqft
|
built
2000
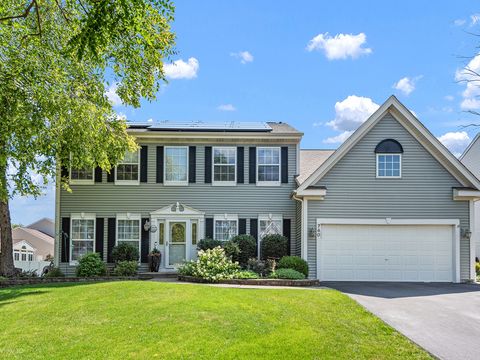
2807 Southwind Dr, New Lenox, IL 60451
$-1,320
Cash flow
-13.8%
Cash-on-Cash Return
2.5%
Cap rate
0.6%
Rent to Value Ratio
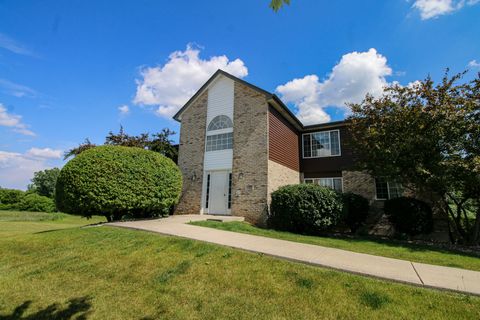
Active
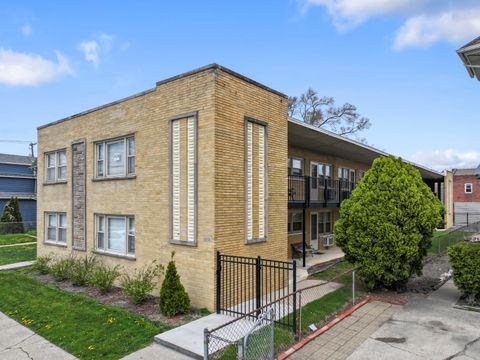
$210,000
2
bds
|
1
ba
|
1,105
sqft
|
built
1997
1429 Berta Dr, Crest Hill, IL 60403
$-401
Cash flow
-10.0%
Cash-on-Cash Return
3.4%
Cap rate
0.8%
Rent to Value Ratio
Active
$135,000
1
bds
|
1
ba
|
0
sqft
|
built
1962
2642 N Harlem Ave, Elmwood Park, IL 60707
$-112
Cash flow
-4.3%
Cash-on-Cash Return
4.7%
Cap rate
1.0%
Rent to Value Ratio
Active
$124,900
2
bds
|
2
ba
|
1,000
sqft
|
built
1971
4309 W Park Lane Dr, Alsip, IL 60803
$-32
Cash flow
-1.3%
Cash-on-Cash Return
5.4%
Cap rate
1.3%
Rent to Value Ratio
Active
$539,900
4
bds
|
4
ba
|
3,238
sqft
|
built
2000
740 Dalton Ln, Bolingbrook, IL 60490
$-1,347
Cash flow
-13.0%
Cash-on-Cash Return
2.7%
Cap rate
0.6%
Rent to Value Ratio
Active
$399,000
7
bds
|
3
ba
|
0
sqft
|
built
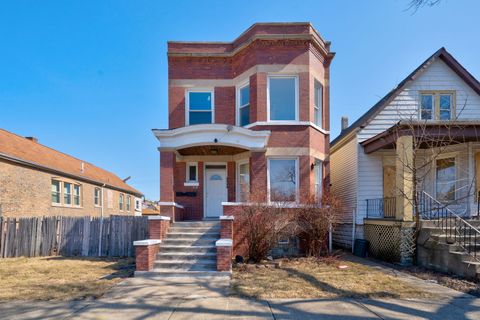
1913
7131 S Carpenter St, Chicago, IL 60621
$-657
Cash flow
-8.6%
Cash-on-Cash Return
3.7%
Cap rate
0.5%
Rent to Value Ratio
Active
$389,000
3
bds
|
4
ba
|
1,772
sqft
|
built
1980
1022 Oakview Dr, Wheaton, IL 60187
$-1,151
Cash flow
-15.4%
Cash-on-Cash Return
2.1%
Cap rate
0.6%
Rent to Value Ratio
Active
$1,200,000
4
bds
|
4
ba
|
0
sqft
|
built
1910
519 N Elmwood Ave, Oak Park, IL 60302
$-4,716
Cash flow
-20.5%
Cash-on-Cash Return
1.0%
Cap rate
0.5%
Rent to Value Ratio
Active
$274,900
3
bds
|
1
ba
|
0
sqft
|
built
1962
5124 W 32nd Pl, Cicero, IL 60804
$-294
Cash flow
-5.6%
Cash-on-Cash Return
4.4%
Cap rate
0.8%
Rent to Value Ratio
Active
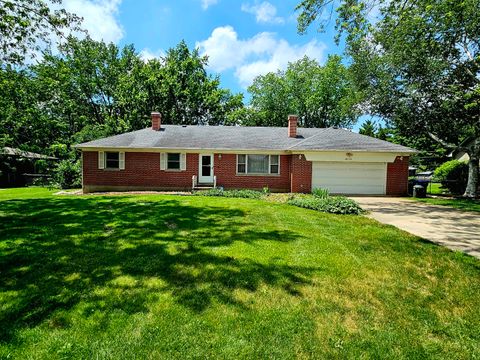
$424,900
3
bds
|
2
ba
|
1,600
sqft
|
built
1961
8341 Crawford Ave, Skokie, IL 60076
$-842
Cash flow
-10.3%
Cash-on-Cash Return
3.3%
Cap rate
0.7%
Rent to Value Ratio
Active
$379,000
3
bds
|
2
ba
|
1,242
sqft
|
built
1963
3N736 Locust Ave, West Chicago, IL 60185
$-331
Cash flow
-4.6%
Cash-on-Cash Return
4.6%
Cap rate
0.7%
Rent to Value Ratio
Active
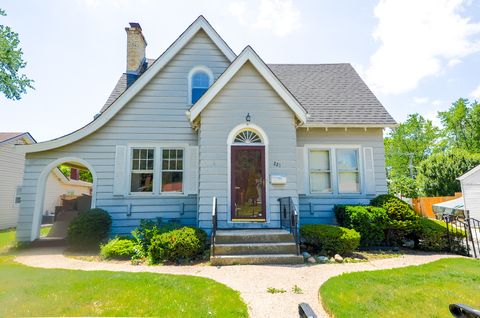
$379,990
4
bds
|
2
ba
|
1,662
sqft
|
built
1929
221 W Courtland St, Mundelein, IL 60060
$-595
Cash flow
-8.2%
Cash-on-Cash Return
3.8%
Cap rate
0.7%
Rent to Value Ratio
Active
$694,900
5
bds
|
4
ba
|
2,586
sqft
|
built
1973
415 Honey Locust Ln, Willowbrook, IL 60527
$-801
Cash flow
-6.0%
Cash-on-Cash Return
4.3%
Cap rate
0.6%
Rent to Value Ratio
Active
$189,900
2
bds
|
2
ba
|
1,000
sqft
|
built
1990
10528 Ridge Cove Dr, Chicago Ridge, IL 60415
$-308
Cash flow
-8.5%
Cash-on-Cash Return
3.7%
Cap rate
0.8%
Rent to Value Ratio
Active
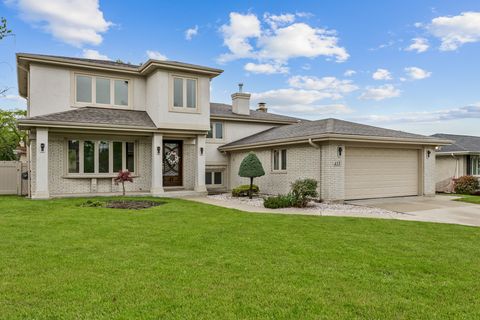
$485,000
3
bds
|
4
ba
|
2,228
sqft
|
built
1989
321 Greens View Dr, Algonquin, IL 60102
$-1,115
Cash flow
-12.0%
Cash-on-Cash Return
2.9%
Cap rate
0.6%
Rent to Value Ratio
Active
$895,000
3
bds
|
2
ba
|
1,945
sqft
|
built
1942
811 Redwood Ln, Glenview, IL 60025
$-1,976
Cash flow
-11.5%
Cash-on-Cash Return
3.0%
Cap rate
0.6%
Rent to Value Ratio
Active
$475,000
3
bds
|
2
ba
|
1,500
sqft
|
built
1891
4170 W Cornelia Ave, Chicago, IL 60641
$-1,296
Cash flow
-14.2%
Cash-on-Cash Return
2.4%
Cap rate
0.5%
Rent to Value Ratio
Active
$474,300
3
bds
|
2
ba
|
2,360
sqft
|
built
1929
6928 Pershing Rd, Berwyn, IL 60402
$-824
Cash flow
-9.1%
Cash-on-Cash Return
3.6%
Cap rate
0.8%
Rent to Value Ratio
Active
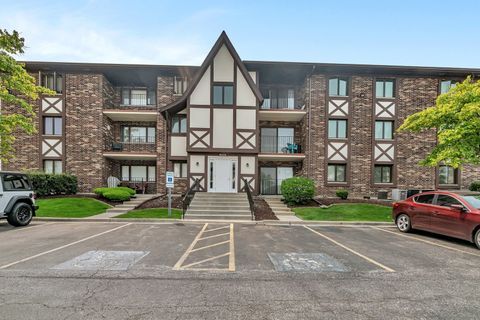
$139,500
1
bds
|
1
ba
|
800
sqft
|
built
1969
7061 N Kedzie Ave, Chicago, IL 60645
$163
Cash flow
6.1%
Cash-on-Cash Return
7.1%
Cap rate
1.4%
Rent to Value Ratio
Active
$244,500
2
bds
|
2
ba
|
1,280
sqft
|
built
1996
1506 Cottonwood Trl, Yorkville, IL 60560
$-197
Cash flow
-4.2%
Cash-on-Cash Return
4.7%
Cap rate
0.9%
Rent to Value Ratio
Active
$399,900
3
bds
|
4
ba
|
2,394
sqft
|
built
1992
17503 W Stillwater Ct, Gurnee, IL 60031
$-982
Cash flow
-12.8%
Cash-on-Cash Return
2.7%
Cap rate
0.8%
Rent to Value Ratio
Active
$428,000
3
bds
|
3
ba
|
1,830
sqft
|
built
1982
851 Sutton Ct, Lincolnshire, IL 60069
$-541
Cash flow
-6.6%
Cash-on-Cash Return
4.2%
Cap rate
0.8%
Rent to Value Ratio
Active
$345,000
2
bds
|
2
ba
|
1,800
sqft
|
built
2006
8300 Callie Ave, Morton Grove, IL 60053
$-761
Cash flow
-11.5%
Cash-on-Cash Return
3.0%
Cap rate
0.8%
Rent to Value Ratio
Active
$325,000
2
bds
|
2
ba
|
1,300
sqft
|
built
2005
701 W Rand Rd, Arlington Heights, IL 60004
$-607
Cash flow
-9.7%
Cash-on-Cash Return
3.4%
Cap rate
0.8%
Rent to Value Ratio
Active
$389,000
4
bds
|
2
ba
|
1,658
sqft
|
built
1947
500 N Irving Ave, Hillside, IL 60162
$37
Cash flow
0.5%
Cash-on-Cash Return
5.8%
Cap rate
0.9%
Rent to Value Ratio
Active
$230,000
3
bds
|
2
ba
|
1,070
sqft
|
built
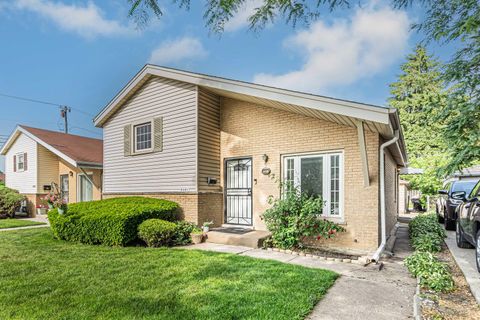
1964
126 N Floyd Ln, Chicago Heights, IL 60411
$222
Cash flow
5.0%
Cash-on-Cash Return
6.8%
Cap rate
1.0%
Rent to Value Ratio
Active
$150,000
2
bds
|
2
ba
|
1,300
sqft
|
built
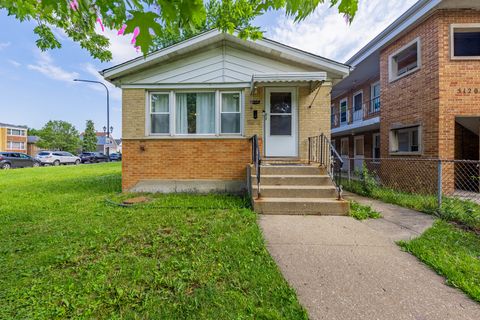
1909
13916 S Dearborn St, Riverdale, IL 60827
$180
Cash flow
6.3%
Cash-on-Cash Return
7.1%
Cap rate
1.2%
Rent to Value Ratio
Active
$349,000
4
bds
|
1
ba
|
1,378
sqft
|
built
1930
193 May St, Bensenville, IL 60106
$-461
Cash flow
-6.9%
Cash-on-Cash Return
4.1%
Cap rate
0.7%
Rent to Value Ratio
Active
$925,000
5
bds
|
5
ba
|
3,972
sqft
|
built
1992
625 Fielding Place Ct, Barrington, IL 60010
$-2,064
Cash flow
-11.6%
Cash-on-Cash Return
3.0%
Cap rate
0.6%
Rent to Value Ratio
Active
$78,400
1
bds
|
1
ba
|
600
sqft
|
built
1961
2336 Union St, Blue Island, IL 60406
$-288
Cash flow
-19.2%
Cash-on-Cash Return
1.3%
Cap rate
1.3%
Rent to Value Ratio

Active
$1,750,000
4
bds
|
4
ba
|
4,150
sqft
|
built
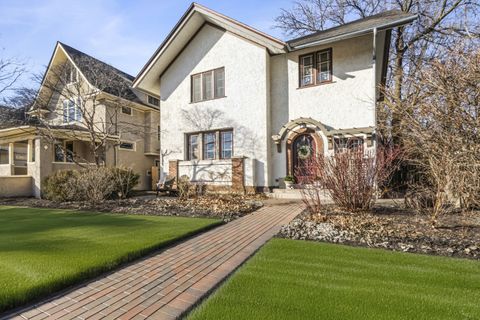
1919
2715 Reese Ave, Evanston, IL 60201
$-6,902
Cash flow
-20.6%
Cash-on-Cash Return
0.9%
Cap rate
0.2%
Rent to Value Ratio
Active
$685,000
2
bds
|
3
ba
|
2,274
sqft
|
built
1972
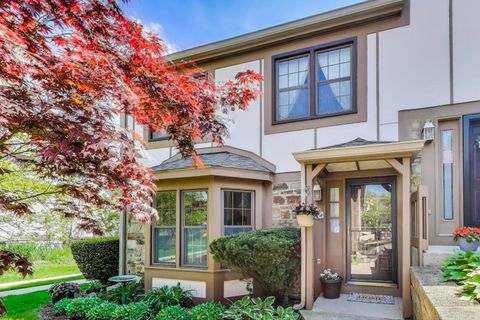
186 Briarwood Loop, Oak Brook, IL 60523
$-1,511
Cash flow
-11.5%
Cash-on-Cash Return
3.0%
Cap rate
0.6%
Rent to Value Ratio
Active
$475,000
4
bds
|
3
ba
|
2,364
sqft
|
built
1979
2N672 Valewood Rd, West Chicago, IL 60185
$-799
Cash flow
-8.8%
Cash-on-Cash Return
3.7%
Cap rate
0.7%
Rent to Value Ratio
Active
$498,000
5
bds
|
3
ba
|
2,576
sqft
|
built
1987
2080 Maplewood Cir, Naperville, IL 60563
$-428
Cash flow
-4.5%
Cash-on-Cash Return
4.6%
Cap rate
0.7%
Rent to Value Ratio
Active
$535,000
4
bds
|
3
ba
|
2,994
sqft
|
built
2004
1855 Apple Valley Dr, Wauconda, IL 60084
$-1,168
Cash flow
-11.4%
Cash-on-Cash Return
3.1%
Cap rate
0.7%
Rent to Value Ratio
Active
$425,000
3
bds
|
2
ba
|
1,364
sqft
|
built
1963
20772 N Elizabeth Ave, Prairie View, IL 60069
$-813
Cash flow
-10.0%
Cash-on-Cash Return
3.4%
Cap rate
0.7%
Rent to Value Ratio
Active
$785,000
4
bds
|
4
ba
|
0
sqft
|
built
2004
1215 W 33rd St, Chicago, IL 60608
$-1,876
Cash flow
-12.5%
Cash-on-Cash Return
2.8%
Cap rate
0.5%
Rent to Value Ratio
Active
$2,999,000
7
bds
|
6
ba
|
4,880
sqft
|
built
1901
330 Abbotsford Rd, Kenilworth, IL 60043
$-13,138
Cash flow
-22.9%
Cash-on-Cash Return
0.4%
Cap rate
0.3%
Rent to Value Ratio