Illinois Investment Properties for Sale
Browse homes for sale and investment properties in Illinois. Refine your search by price, property type, or more.
Best cash flowing properties in Illinois
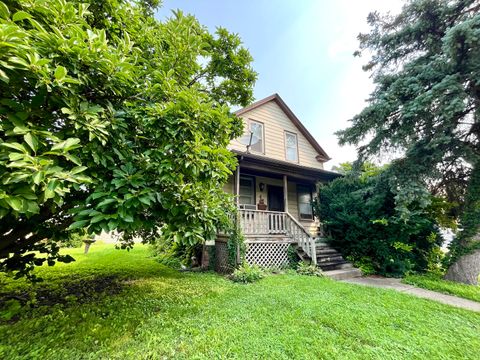
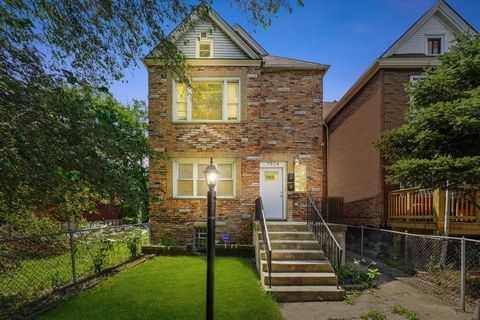
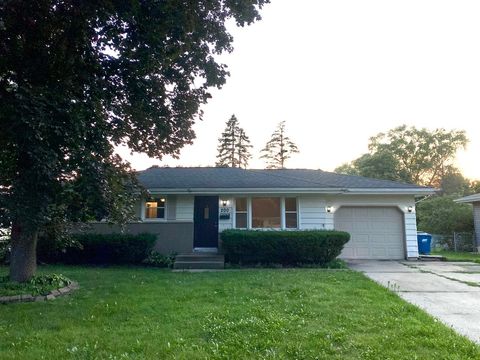
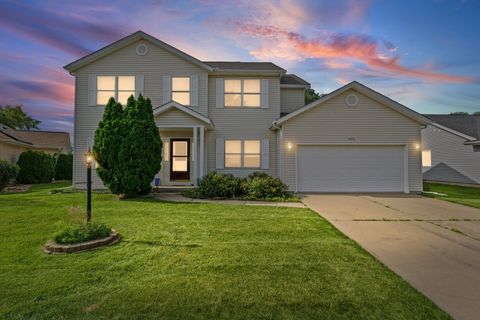
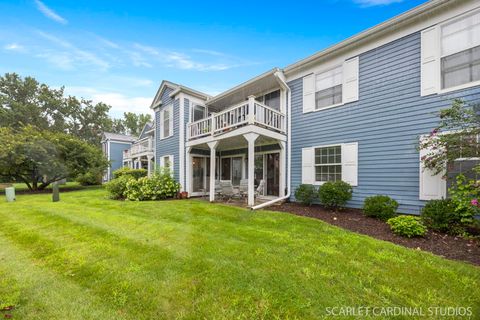
Active
$199,900
4
bds
|
2
ba
|
1,056
sqft
|
built
1903
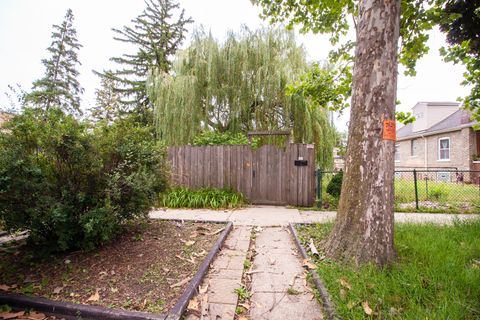
8034 42nd St, Lyons, IL 60534
$503
Cash flow
13.1%
Cash-on-Cash Return
8.7%
Cap rate
1.2%
Rent to Value Ratio
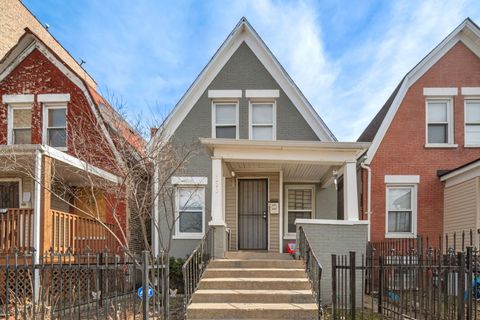
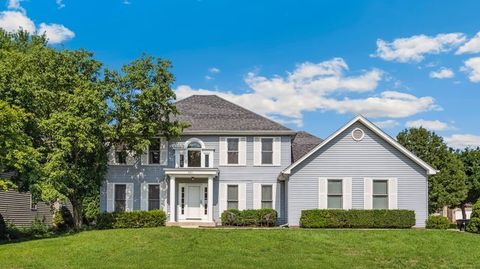
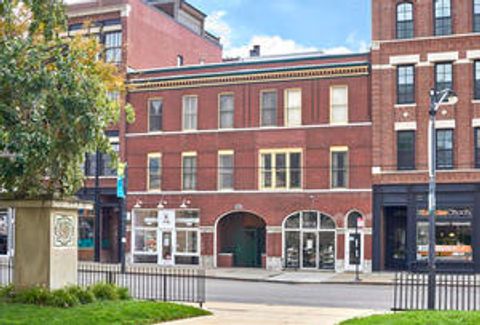
Active
$172,000
3
bds
|
2
ba
|
0
sqft
|
built
1898
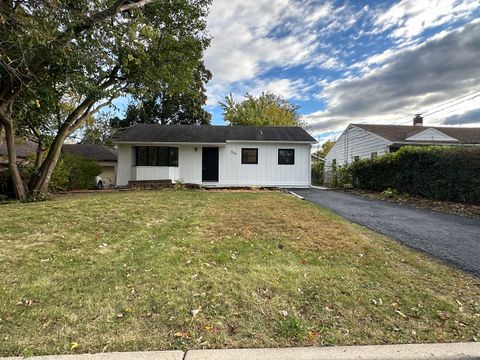
1223 S Keeler Ave, Chicago, IL 60623
$357
Cash flow
10.8%
Cash-on-Cash Return
8.2%
Cap rate
1.0%
Rent to Value Ratio
7,520 out of 11,269 properties for sale in Illinois
Limited Results Shown
Create a free account, or log in to reveal all property listings and enjoy the complete experience.
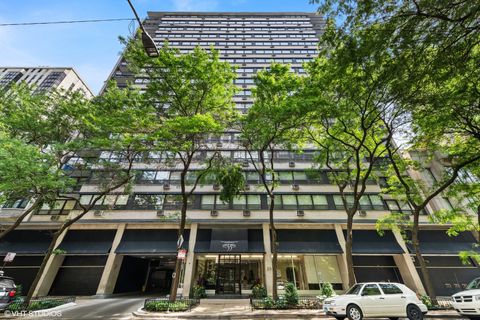
Active
$245,000
1
bds
|
1
ba
|
850
sqft
|
built
1961
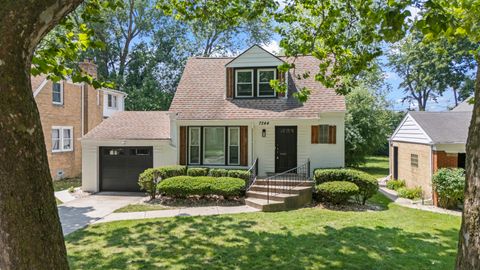
33 E Cedar St, Chicago, IL 60611
$-1,105
Cash flow
-23.5%
Cash-on-Cash Return
0.3%
Cap rate
1.0%
Rent to Value Ratio
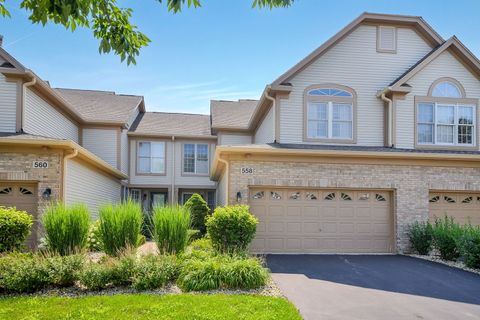
Active
$425,000
2
bds
|
3
ba
|
1,829
sqft
|
built
1995
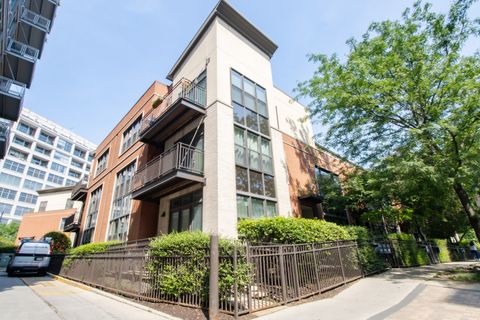
558 Harlowe Ln, Naperville, IL 60565
$-807
Cash flow
-9.9%
Cash-on-Cash Return
3.4%
Cap rate
0.8%
Rent to Value Ratio
Active
$349,900
3
bds
|
2
ba
|
1,496
sqft
|
built
1913
5441 N Linder Ave, Chicago, IL 60630
$41
Cash flow
0.6%
Cash-on-Cash Return
5.8%
Cap rate
0.9%
Rent to Value Ratio
Active
$269,900
3
bds
|
2
ba
|
1,746
sqft
|
built
1950
225 Pleasure Dr, Mundelein, IL 60060
$300
Cash flow
5.8%
Cash-on-Cash Return
7.0%
Cap rate
1.0%
Rent to Value Ratio
Active
$548,500
4
bds
|
2
ba
|
1,462
sqft
|
built
1951
7244 N Kilpatrick Ave, Lincolnwood, IL 60712
$-1,093
Cash flow
-10.4%
Cash-on-Cash Return
3.3%
Cap rate
0.6%
Rent to Value Ratio
Active
$340,000
2
bds
|
1
ba
|
900
sqft
|
built
2004
906 N Larrabee St, Chicago, IL 60610
$-413
Cash flow
-6.3%
Cash-on-Cash Return
4.2%
Cap rate
0.8%
Rent to Value Ratio
Active
$369,900
6
bds
|
2
ba
|
0
sqft
|
built
1888
7924 S Lowe Ave, Chicago, IL 60620
$-708
Cash flow
-10.0%
Cash-on-Cash Return
3.4%
Cap rate
0.4%
Rent to Value Ratio
Active
$639,000
5
bds
|
4
ba
|
3,930
sqft
|
built
2002
2198 Kemmerer Ln, Bolingbrook, IL 60490
$-1,599
Cash flow
-13.1%
Cash-on-Cash Return
2.7%
Cap rate
0.5%
Rent to Value Ratio
Active
$380,000
2
bds
|
2
ba
|
1,536
sqft
|
built
1989
21008 W Hazelnut Ln, Plainfield, IL 60544
$-726
Cash flow
-10.0%
Cash-on-Cash Return
3.4%
Cap rate
0.7%
Rent to Value Ratio
Active
$600,000
4
bds
|
4
ba
|
4,732
sqft
|
built
2006
343 Copper Springs Ln, Elgin, IL 60124
$-1,471
Cash flow
-12.8%
Cash-on-Cash Return
2.7%
Cap rate
0.6%
Rent to Value Ratio
Active
$327,000
3
bds
|
2
ba
|
1,001
sqft
|
built
1967
200 Patrick Dr, South Elgin, IL 60177
$-293
Cash flow
-4.7%
Cash-on-Cash Return
4.6%
Cap rate
0.8%
Rent to Value Ratio
Active
$1,300,000
5
bds
|
6
ba
|
5,720
sqft
|
built
1990
2509 Astor Ct, Glenview, IL 60026
$-3,554
Cash flow
-14.3%
Cash-on-Cash Return
2.4%
Cap rate
0.5%
Rent to Value Ratio
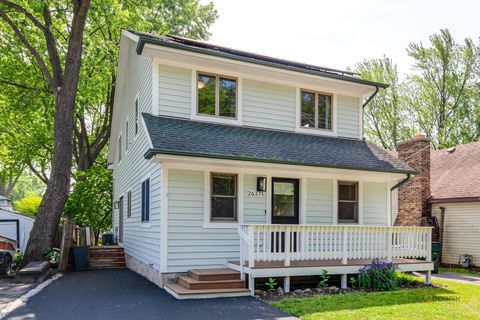
Active
$389,000
3
bds
|
2
ba
|
1,848
sqft
|
built
2001
26371 N Elmwood Ave, Mundelein, IL 60060
$-232
Cash flow
-3.1%
Cash-on-Cash Return
5.0%
Cap rate
0.9%
Rent to Value Ratio
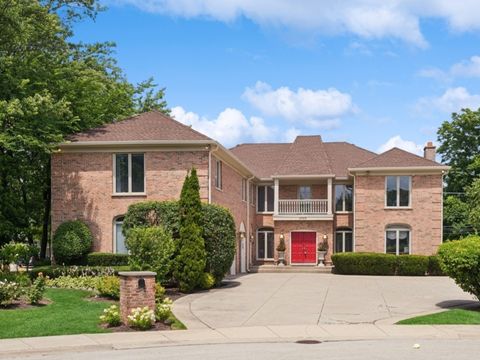
Active
$1,380,000
5
bds
|
4
ba
|
3,750
sqft
|
built
1977
1424 E Jonquil Cir, Arlington Heights, IL 60004
$-4,580
Cash flow
-17.3%
Cash-on-Cash Return
1.7%
Cap rate
0.3%
Rent to Value Ratio
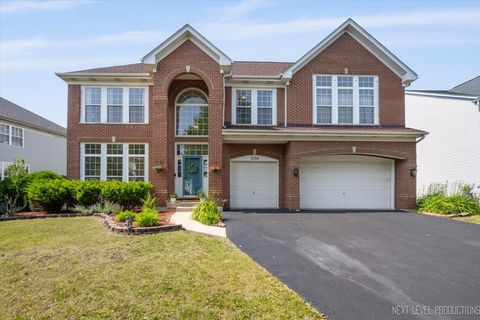
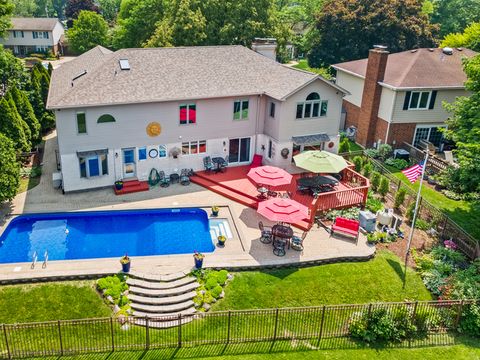
Active
$599,900
4
bds
|
4
ba
|
3,080
sqft
|
built
2006
9299 Lee Hill Rd, Newark, IL 60541
$-2,079
Cash flow
-18.1%
Cash-on-Cash Return
1.5%
Cap rate
0.4%
Rent to Value Ratio
Active
$899,000
4
bds
|
4
ba
|
2,781
sqft
|
built
1908
400 S Green St, Chicago, IL 60607
$-2,101
Cash flow
-12.2%
Cash-on-Cash Return
2.9%
Cap rate
0.9%
Rent to Value Ratio
Active
$389,900
4
bds
|
3
ba
|
2,021
sqft
|
built
1991
1159 Spring Creek Rd, Elgin, IL 60120
$-378
Cash flow
-5.1%
Cash-on-Cash Return
4.5%
Cap rate
0.8%
Rent to Value Ratio
Active
$330,000
2
bds
|
2
ba
|
1,264
sqft
|
built
1945
3121 N Normandy Ave, Chicago, IL 60634
$-89
Cash flow
-1.4%
Cash-on-Cash Return
5.4%
Cap rate
0.9%
Rent to Value Ratio
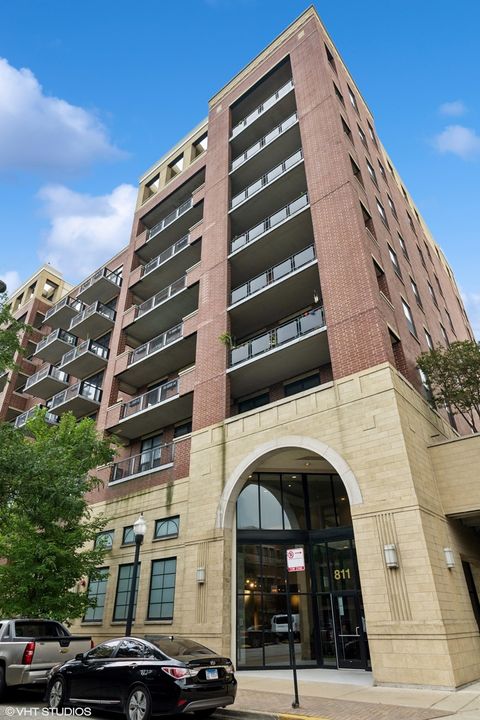
Active
$235,000
1
bds
|
1
ba
|
700
sqft
|
built
2003
811 W 15th Pl, Chicago, IL 60608
$-380
Cash flow
-8.4%
Cash-on-Cash Return
3.7%
Cap rate
0.8%
Rent to Value Ratio

Active
$689,900
4
bds
|
4
ba
|
4,240
sqft
|
built
1990
11734 Glen Eagles Ln, Belvidere, IL 61008
$-2,167
Cash flow
-16.4%
Cash-on-Cash Return
1.9%
Cap rate
0.5%
Rent to Value Ratio
Active
$315,000
4
bds
|
2
ba
|
2,300
sqft
|
built
1924
13621 S Homan Ave, Robbins, IL 60472
$5
Cash flow
0.1%
Cash-on-Cash Return
5.7%
Cap rate
0.7%
Rent to Value Ratio
Active
$310,000
2
bds
|
3
ba
|
1,700
sqft
|
built
2008
3410 Cameron Dr, Elgin, IL 60124
$-308
Cash flow
-5.2%
Cash-on-Cash Return
4.5%
Cap rate
0.8%
Rent to Value Ratio
Active
$725,000
5
bds
|
3
ba
|
4,913
sqft
|
built
1873
740 W State St, Sycamore, IL 60178
$-2,962
Cash flow
-21.3%
Cash-on-Cash Return
0.8%
Cap rate
0.4%
Rent to Value Ratio
Active
$695,000
4
bds
|
4
ba
|
3,225
sqft
|
built
1988
37 Seneca Ave W, Hawthorn Woods, IL 60047
$-1,829
Cash flow
-13.7%
Cash-on-Cash Return
2.5%
Cap rate
0.6%
Rent to Value Ratio

Active
$280,000
4
bds
|
2
ba
|
2,502
sqft
|
built
1914
10151 S Avenue M, Chicago, IL 60617
$-174
Cash flow
-3.2%
Cash-on-Cash Return
4.9%
Cap rate
0.6%
Rent to Value Ratio
Active
$160,000
1
bds
|
1
ba
|
824
sqft
|
built
1913
508 Madison St, Oak Park, IL 60302
$44
Cash flow
1.4%
Cash-on-Cash Return
6.0%
Cap rate
1.1%
Rent to Value Ratio
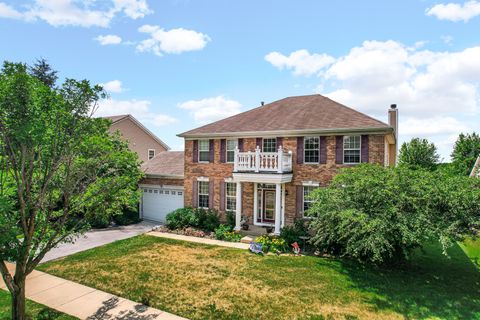
Active
$359,000
5
bds
|
3
ba
|
2,220
sqft
|
built
1973
530 Cottonwood Cir, Bolingbrook, IL 60440
$-491
Cash flow
-7.1%
Cash-on-Cash Return
4.0%
Cap rate
0.8%
Rent to Value Ratio
Active
$199,999
2
bds
|
1
ba
|
1,000
sqft
|
built
1979
8511 W Catherine Ave, Chicago, IL 60656
$-254
Cash flow
-6.6%
Cash-on-Cash Return
4.2%
Cap rate
0.9%
Rent to Value Ratio
Active
$365,000
4
bds
|
3
ba
|
2,686
sqft
|
built
1998
4103 Crail Rd, Champaign, IL 61822
$-416
Cash flow
-5.9%
Cash-on-Cash Return
4.3%
Cap rate
0.8%
Rent to Value Ratio
Active
$534,900
4
bds
|
3
ba
|
2,498
sqft
|
built
1995
661 Waterbury Dr, Aurora, IL 60504
$-1,072
Cash flow
-10.5%
Cash-on-Cash Return
3.3%
Cap rate
0.7%
Rent to Value Ratio
Active
$545,000
3
bds
|
4
ba
|
3,179
sqft
|
built
1989
16212 Hamilton Ave, Tinley Park, IL 60477
$-905
Cash flow
-8.7%
Cash-on-Cash Return
3.7%
Cap rate
0.6%
Rent to Value Ratio
Active
$449,777
4
bds
|
3
ba
|
2,188
sqft
|
built
1991
2138 Green Bridge Ln, Hanover Park, IL 60133
$-685
Cash flow
-7.9%
Cash-on-Cash Return
3.8%
Cap rate
0.7%
Rent to Value Ratio
Active
$294,900
3
bds
|
2
ba
|
1,250
sqft
|
built
1984
2148 Sunderland Ct, Naperville, IL 60565
$-377
Cash flow
-6.7%
Cash-on-Cash Return
4.1%
Cap rate
0.8%
Rent to Value Ratio

Active
$99,000
4
bds
|
2
ba
|
2,166
sqft
|
built
1950
719 S Grace St, Marissa, IL 62257
$30
Cash flow
1.6%
Cash-on-Cash Return
6.0%
Cap rate
1.1%
Rent to Value Ratio
Active
$799,900
3
bds
|
2
ba
|
2,200
sqft
|
built
1892
1013 W Webster Ave, Chicago, IL 60614
$-1,488
Cash flow
-9.7%
Cash-on-Cash Return
3.4%
Cap rate
0.7%
Rent to Value Ratio
Active
$410,000
4
bds
|
4
ba
|
2,334
sqft
|
built
2006
818 N Edgewater Ln, Shorewood, IL 60404
$-496
Cash flow
-6.3%
Cash-on-Cash Return
4.2%
Cap rate
0.8%
Rent to Value Ratio
Active
$1,365,000
5
bds
|
6
ba
|
4,090
sqft
|
built
1988
87 Windmill Rd, Orland Park, IL 60467
$-1,309
Cash flow
-5.0%
Cash-on-Cash Return
4.5%
Cap rate
0.7%
Rent to Value Ratio
Active
$1,499,999
4
bds
|
6
ba
|
2,583
sqft
|
built
2003
840 S Madison St, Hinsdale, IL 60521
$-5,408
Cash flow
-18.8%
Cash-on-Cash Return
1.4%
Cap rate
0.3%
Rent to Value Ratio