Illinois Investment Properties for Sale
Browse homes for sale and investment properties in Illinois. Refine your search by price, property type, or more.
Best cash flowing properties in Illinois
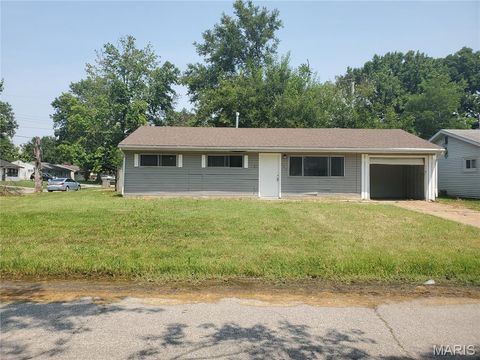
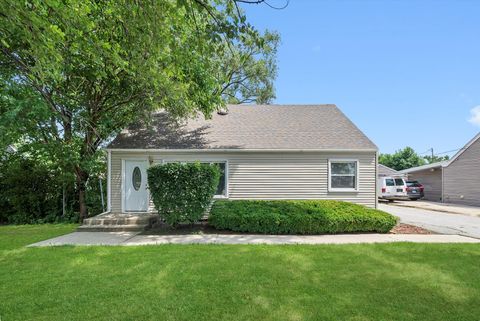
Active
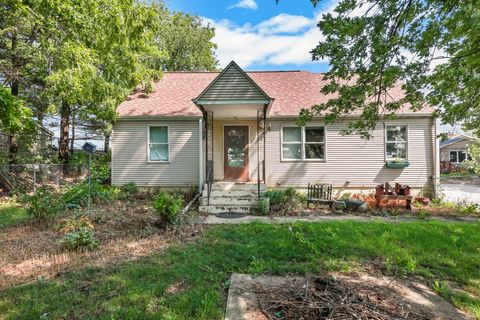
$45,000
4
bds
|
1
ba
|
1,152
sqft
|
built
1958
111 Lazarcheff Dr, Cahokia, IL 62206
$815
Cash flow
21.1%
Cash-on-Cash Return
21.7%
Cap rate
3.1%
Rent to Value Ratio
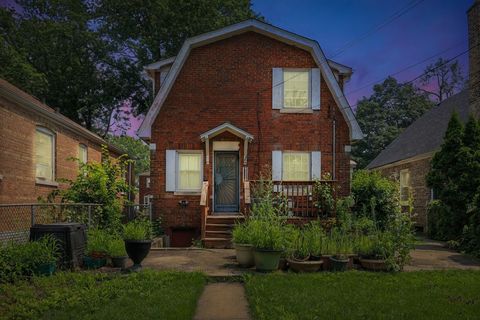
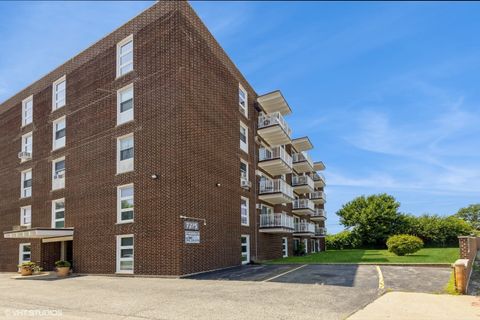
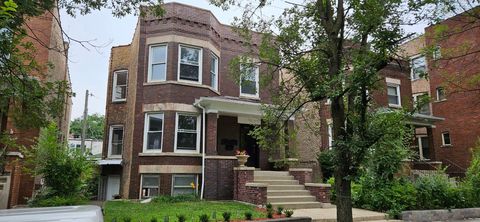
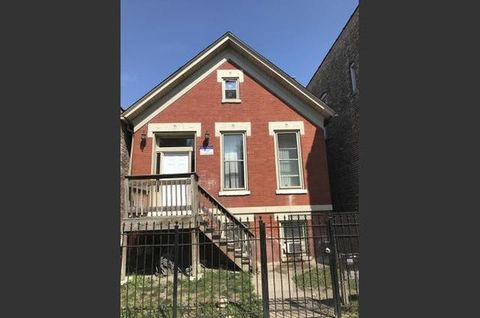
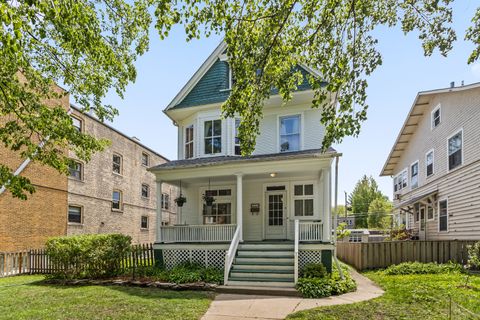
Active
$159,000
2
bds
|
2
ba
|
1,364
sqft
|
built
1940
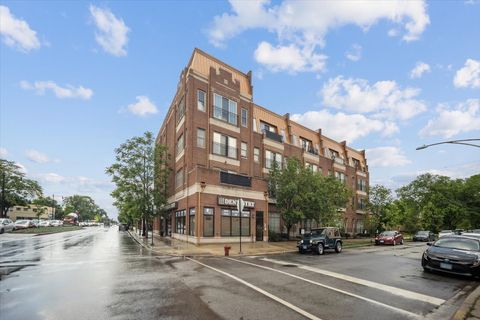
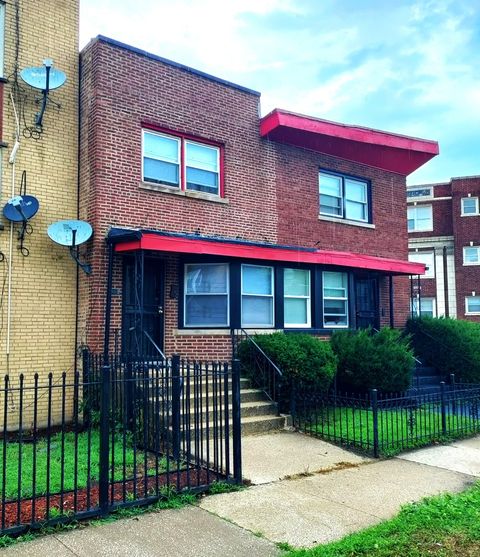
12220 S La Salle St, Chicago, IL 60628
$683
Cash flow
22.4%
Cash-on-Cash Return
10.8%
Cap rate
1.4%
Rent to Value Ratio
7,918 out of 11,798 properties for sale in Illinois
Limited Results Shown
Create a free account, or log in to reveal all property listings and enjoy the complete experience.
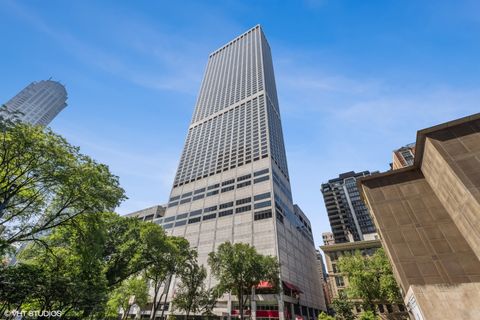
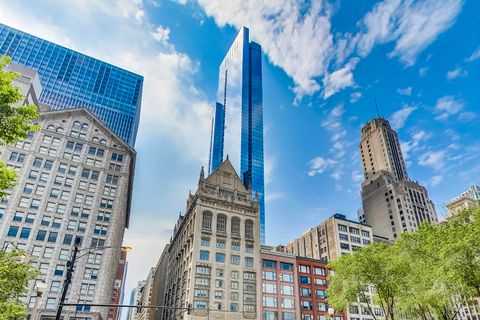
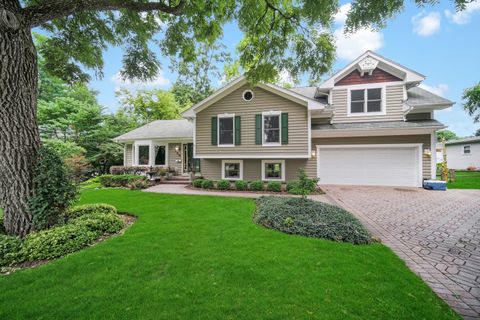
Active
$2,095,000
3
bds
|
4
ba
|
2,754
sqft
|
built
1975
180 E Pearson St, Chicago, IL 60611
$-7,732
Cash flow
-19.3%
Cash-on-Cash Return
1.2%
Cap rate
0.5%
Rent to Value Ratio
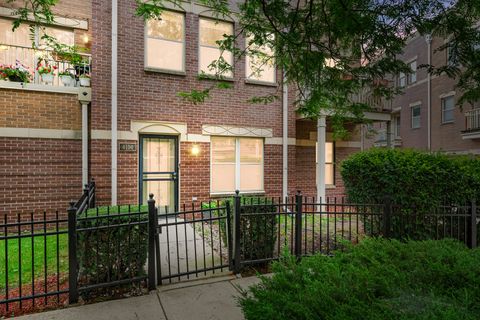
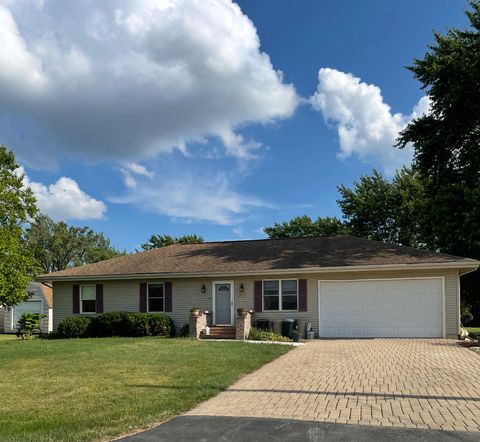
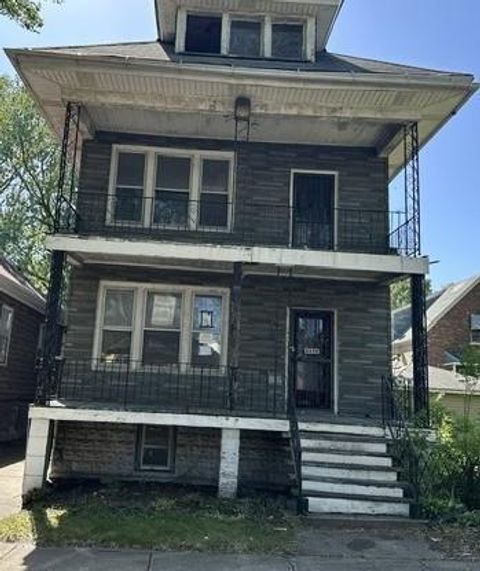
Active
$384,900
3
bds
|
2
ba
|
2,200
sqft
|
built
2008
4114 Maryland Ave, Chicago, IL 60653
$-213
Cash flow
-2.9%
Cash-on-Cash Return
5.0%
Cap rate
0.8%
Rent to Value Ratio
Active
$259,999
2
bds
|
2
ba
|
1,221
sqft
|
built
1968
7225 W Higgins Ave, Chicago, IL 60656
$-211
Cash flow
-4.2%
Cash-on-Cash Return
4.7%
Cap rate
0.8%
Rent to Value Ratio
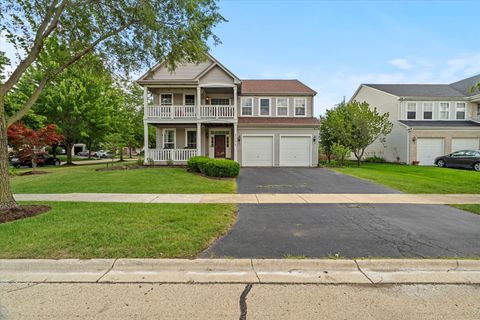
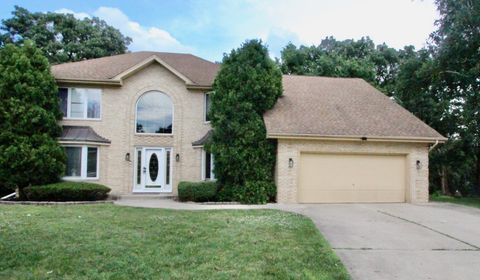
Active
$549,999
4
bds
|
3
ba
|
3,073
sqft
|
built
2005
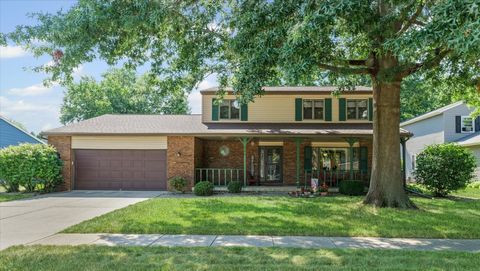
1314 Danhof Dr, Bolingbrook, IL 60490
$-1,273
Cash flow
-12.1%
Cash-on-Cash Return
2.9%
Cap rate
0.6%
Rent to Value Ratio
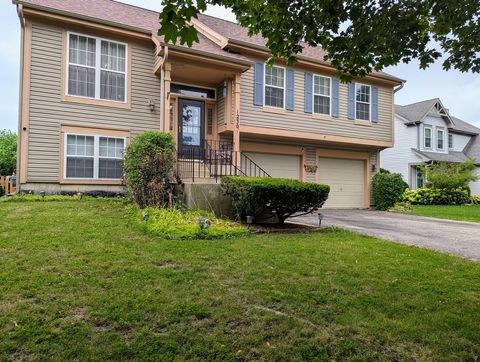
Active
$384,990
4
bds
|
3
ba
|
2,060
sqft
|
built
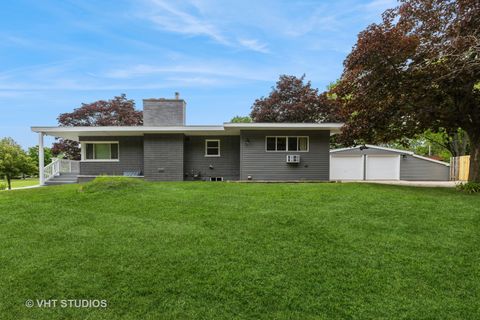
1992
1230 Spring Creek Rd, Elgin, IL 60120
$-437
Cash flow
-5.9%
Cash-on-Cash Return
4.3%
Cap rate
0.8%
Rent to Value Ratio
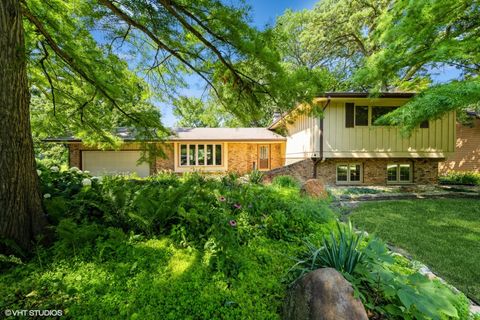
Active
$395,000
3
bds
|
3
ba
|
2,375
sqft
|
built
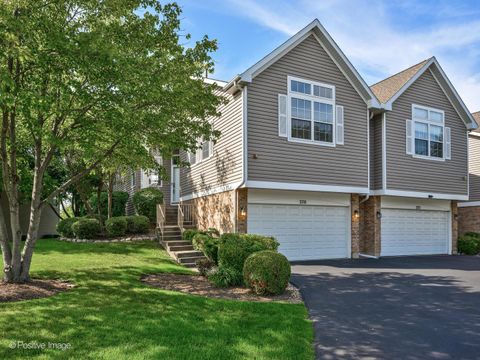
1968
6123 S Kilkenny Dr, Crystal Lake, IL 60014
$-1,033
Cash flow
-13.6%
Cash-on-Cash Return
2.5%
Cap rate
0.5%
Rent to Value Ratio
Active
$310,000
2
bds
|
2
ba
|
0
sqft
|
built
1974
580 Green Bay Rd, Glencoe, IL 60022
$-478
Cash flow
-8.0%
Cash-on-Cash Return
3.8%
Cap rate
0.8%
Rent to Value Ratio
Active
$499,900
3
bds
|
3
ba
|
1,843
sqft
|
built
1942
14 Mohawk Dr, Clarendon Hills, IL 60514
$-806
Cash flow
-8.4%
Cash-on-Cash Return
3.7%
Cap rate
0.7%
Rent to Value Ratio
Active
$209,000
3
bds
|
2
ba
|
1,551
sqft
|
built
1916
209 S Chestnut St, Pesotum, IL 61863
$64
Cash flow
1.6%
Cash-on-Cash Return
6.0%
Cap rate
0.9%
Rent to Value Ratio
Active
$2,299,000
5
bds
|
6
ba
|
4,978
sqft
|
built
2007
1329 Glenwood Ave, Glenview, IL 60025
$-8,550
Cash flow
-19.4%
Cash-on-Cash Return
1.2%
Cap rate
0.3%
Rent to Value Ratio
Active
$825,000
6
bds
|
4
ba
|
4,338
sqft
|
built
1992
3205 W Southmor Rd, Morris, IL 60450
$-780
Cash flow
-4.9%
Cash-on-Cash Return
4.5%
Cap rate
0.7%
Rent to Value Ratio
Active
$160,000
1
bds
|
1
ba
|
0
sqft
|
built
1971
8810 Briar Ct, Des Plaines, IL 60016
$144
Cash flow
4.7%
Cash-on-Cash Return
6.8%
Cap rate
1.1%
Rent to Value Ratio
Active
$140,000
3
bds
|
1
ba
|
925
sqft
|
built
1955
4119 Betty Dr, Belleville, IL 62226
$-36
Cash flow
-1.3%
Cash-on-Cash Return
5.4%
Cap rate
0.9%
Rent to Value Ratio
Active
$650,000
3
bds
|
4
ba
|
2,850
sqft
|
built
1981
601 S Saint Cecilia Dr, Mount Prospect, IL 60056
$-1,234
Cash flow
-9.9%
Cash-on-Cash Return
3.4%
Cap rate
0.6%
Rent to Value Ratio
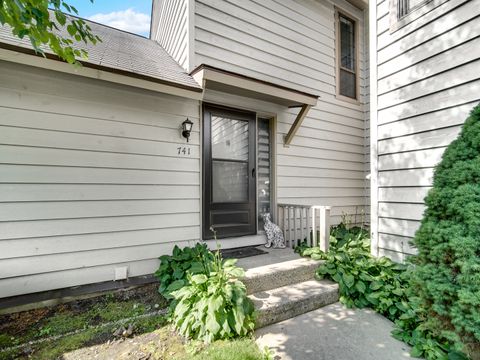
Active
$215,000
3
bds
|
1
ba
|
1,162
sqft
|
built
1976
741 Colby Ct, Gurnee, IL 60031
$-618
Cash flow
-15.0%
Cash-on-Cash Return
2.2%
Cap rate
0.8%
Rent to Value Ratio
Active
$649,000
7
bds
|
3
ba
|
0
sqft
|
built
1913
5015 W Montrose Ave, Chicago, IL 60641
$-2,274
Cash flow
-18.3%
Cash-on-Cash Return
1.5%
Cap rate
0.3%
Rent to Value Ratio
Active
$325,000
8
bds
|
5
ba
|
0
sqft
|
built
1967
349 Yates Ave, Calumet City, IL 60409
$-1,683
Cash flow
-27.0%
Cash-on-Cash Return
-0.5%
Cap rate
0.5%
Rent to Value Ratio
Active
$519,000
5
bds
|
3
ba
|
2,970
sqft
|
built
1991
6 Alleghany Ct, Bolingbrook, IL 60440
$-1,174
Cash flow
-11.8%
Cash-on-Cash Return
3.0%
Cap rate
0.7%
Rent to Value Ratio
Active
$729,999
2
bds
|
2
ba
|
1,500
sqft
|
built
2009
60 E Monroe St, Chicago, IL 60603
$-3,164
Cash flow
-22.6%
Cash-on-Cash Return
0.5%
Cap rate
0.6%
Rent to Value Ratio
Active
$279,500
7
bds
|
3
ba
|
0
sqft
|
built
1903
3502 W Lake St, Chicago, IL 60624
$-98
Cash flow
-1.8%
Cash-on-Cash Return
5.3%
Cap rate
0.7%
Rent to Value Ratio
Active
$325,000
3
bds
|
2
ba
|
1,305
sqft
|
built
1954
9417 S 78th Ave, Hickory Hills, IL 60457
$-139
Cash flow
-2.2%
Cash-on-Cash Return
5.2%
Cap rate
0.9%
Rent to Value Ratio
Active
$375,000
3
bds
|
2
ba
|
1,450
sqft
|
built
2005
451 Turner Rd, Aurora, IL 60505
$-463
Cash flow
-6.4%
Cash-on-Cash Return
4.2%
Cap rate
0.7%
Rent to Value Ratio
Active
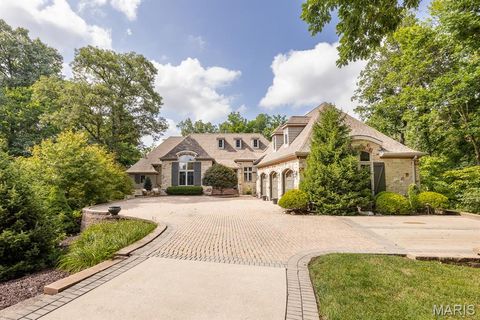
$1,250,000
6
bds
|
6
ba
|
6,446
sqft
|
built
1998
21 Raven Oak Dr, Shiloh, IL 62221
$-3,260
Cash flow
-13.6%
Cash-on-Cash Return
2.5%
Cap rate
0.5%
Rent to Value Ratio
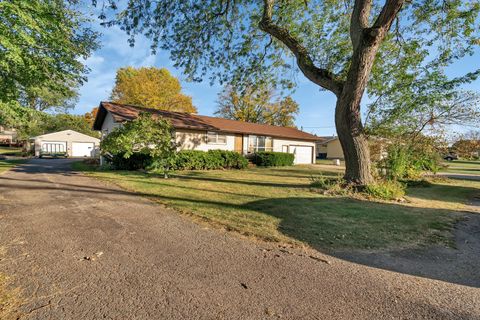
Active
$299,900
4
bds
|
3
ba
|
1,928
sqft
|
built
1962
515 4th St, Earlville, IL 60518
$-516
Cash flow
-9.0%
Cash-on-Cash Return
3.6%
Cap rate
0.6%
Rent to Value Ratio
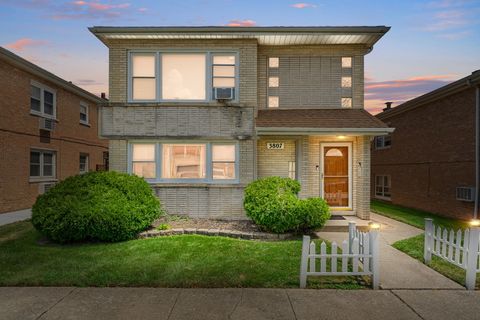
Active
$529,900
6
bds
|
2
ba
|
0
sqft
|
built
1963
3807 Scoville Ave, Berwyn, IL 60402
$-1,994
Cash flow
-19.6%
Cash-on-Cash Return
1.2%
Cap rate
0.4%
Rent to Value Ratio
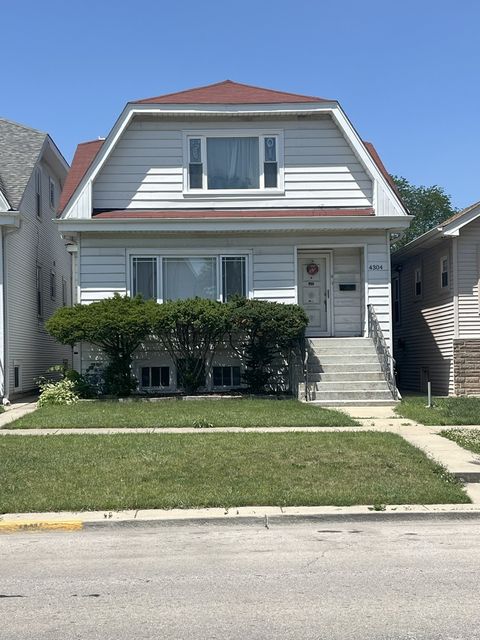
Active
$374,900
4
bds
|
2
ba
|
2,400
sqft
|
built
1927
4304 N Oriole Ave, Norridge, IL 60706
$-993
Cash flow
-13.8%
Cash-on-Cash Return
2.5%
Cap rate
0.7%
Rent to Value Ratio
Active
$335,000
4
bds
|
3
ba
|
2,656
sqft
|
built
1987
905 Fawn Dr, Mahomet, IL 61853
$-453
Cash flow
-7.1%
Cash-on-Cash Return
4.1%
Cap rate
0.7%
Rent to Value Ratio
Active
$354,900
4
bds
|
2
ba
|
2,113
sqft
|
built
1958
900 Shiloh Blvd, Zion, IL 60099
$-815
Cash flow
-12.0%
Cash-on-Cash Return
2.9%
Cap rate
0.6%
Rent to Value Ratio
Active
$479,000
3
bds
|
3
ba
|
0
sqft
|
built
1996
270 Prairie View Ln, Wheeling, IL 60090
$-776
Cash flow
-8.5%
Cash-on-Cash Return
3.7%
Cap rate
0.7%
Rent to Value Ratio
Active
$429,000
2
bds
|
2
ba
|
1,710
sqft
|
built
2004
1600 N New England Ave, Chicago, IL 60707
$-382
Cash flow
-4.6%
Cash-on-Cash Return
4.6%
Cap rate
0.8%
Rent to Value Ratio
Active
$135,000
2
bds
|
1
ba
|
980
sqft
|
built
1954
2430 E 73rd St, Chicago, IL 60649
$377
Cash flow
14.6%
Cash-on-Cash Return
9.0%
Cap rate
1.2%
Rent to Value Ratio
Active
$259,900
3
bds
|
3
ba
|
1,285
sqft
|
built
1969
15739 Ingleside Ave, Dolton, IL 60419
$261
Cash flow
5.2%
Cash-on-Cash Return
6.9%
Cap rate
1.1%
Rent to Value Ratio
Active
$369,000
3
bds
|
2
ba
|
1,310
sqft
|
built
1961
1060 Warwick Ln, Elk Grove Village, IL 60007
$-538
Cash flow
-7.6%
Cash-on-Cash Return
3.9%
Cap rate
0.7%
Rent to Value Ratio
Active
$504,900
4
bds
|
3
ba
|
2,889
sqft
|
built
2004
304 Claridge Cir, Bolingbrook, IL 60440
$-1,256
Cash flow
-13.0%
Cash-on-Cash Return
2.7%
Cap rate
0.7%
Rent to Value Ratio
Active
$182,000
2
bds
|
1
ba
|
934
sqft
|
built
1960
180 E US Route 6, Morris, IL 60450
$35
Cash flow
1.0%
Cash-on-Cash Return
5.9%
Cap rate
0.9%
Rent to Value Ratio
Active
$699,000
4
bds
|
1
ba
|
1,900
sqft
|
built
1897
714 Seward St, Evanston, IL 60202
$-1,470
Cash flow
-11.0%
Cash-on-Cash Return
3.2%
Cap rate
0.6%
Rent to Value Ratio
Active
$429,900
4
bds
|
2
ba
|
1,352
sqft
|
built
2001
154 Easton Ave, West Chicago, IL 60185
$-775
Cash flow
-9.4%
Cash-on-Cash Return
3.5%
Cap rate
0.7%
Rent to Value Ratio
Active
$95,000
4
bds
|
2
ba
|
0
sqft
|
built
1918
8606 S Saginaw Ave, Chicago, IL 60617
$616
Cash flow
33.8%
Cash-on-Cash Return
13.5%
Cap rate
1.9%
Rent to Value Ratio