Illinois Investment Properties for Sale
Browse homes for sale and investment properties in Illinois. Refine your search by price, property type, or more.
Best cash flowing properties in Illinois
Active
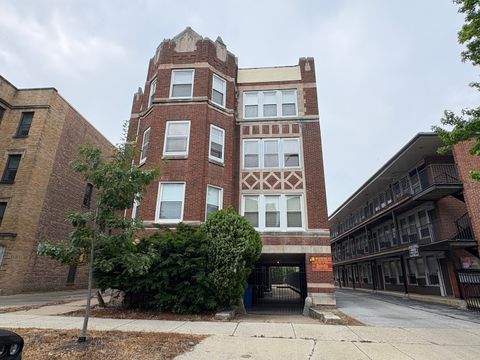
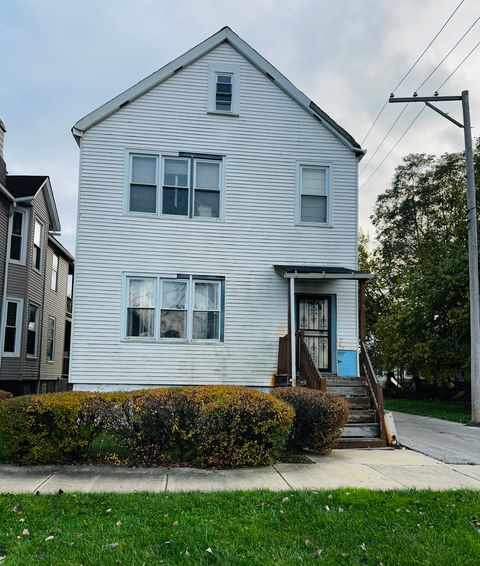
$42,500
3
bds
|
2
ba
|
1,150
sqft
|
built
1922
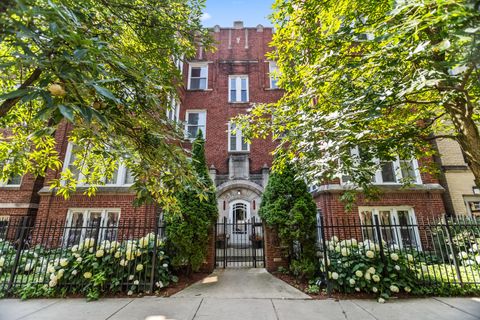
6836 S Crandon Ave, Chicago, IL 60649
$1,005
Cash flow
27.5%
Cash-on-Cash Return
28.4%
Cap rate
3.5%
Rent to Value Ratio
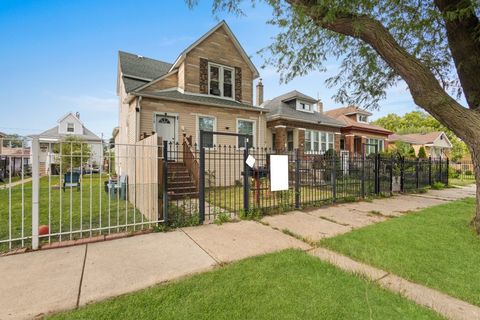
Active
$80,000
8
bds
|
3
ba
|
0
sqft
|
built
1900
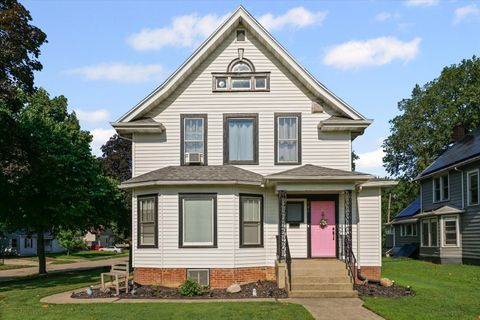
6835 S May St, Chicago, IL 60621
$966
Cash flow
63.0%
Cash-on-Cash Return
20.2%
Cap rate
2.5%
Rent to Value Ratio
7,261 out of 11,246 properties for sale in Illinois
Limited Results Shown
Create a free account, or log in to reveal all property listings and enjoy the complete experience.
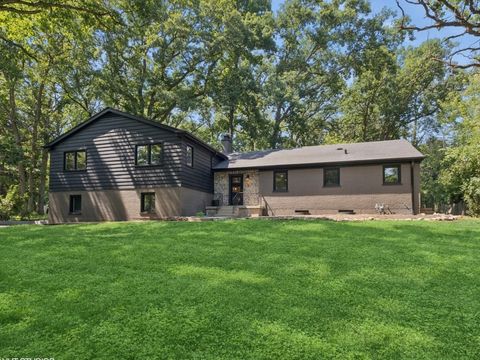
Active
$699,000
4
bds
|
3
ba
|
3,338
sqft
|
built
1959
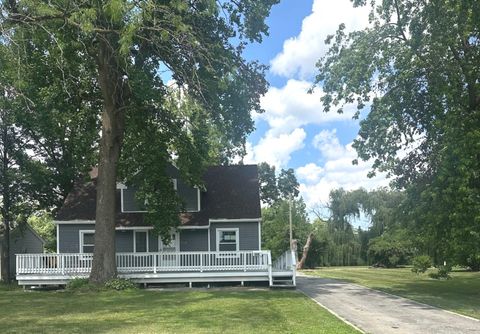
600 Eton Dr, North Barrington, IL 60010
$-1,852
Cash flow
-13.8%
Cash-on-Cash Return
2.5%
Cap rate
0.4%
Rent to Value Ratio
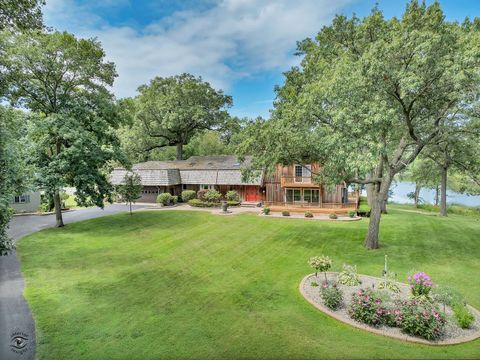
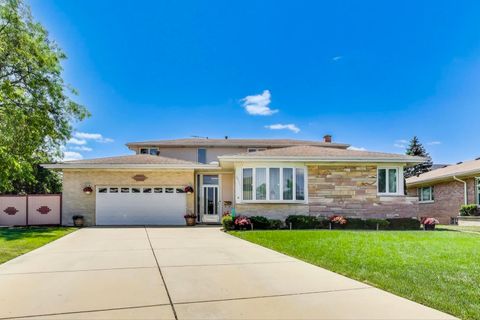
Active
$549,900
4
bds
|
4
ba
|
3,944
sqft
|
built
864 Ash Dr, Saint Anne, IL 60964
$-1,140
Cash flow
-10.8%
Cash-on-Cash Return
3.2%
Cap rate
0.7%
Rent to Value Ratio
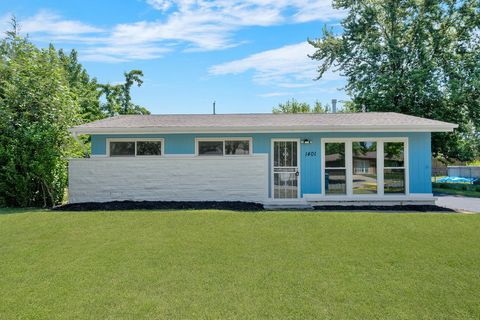
Active
$219,900
4
bds
|
2
ba
|
1,389
sqft
|
built
1960
1401 Stanley Blvd, Calumet City, IL 60409
$-137
Cash flow
-3.3%
Cash-on-Cash Return
4.9%
Cap rate
0.9%
Rent to Value Ratio
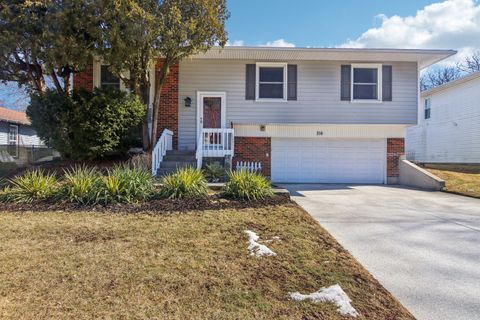
Active
$371,900
3
bds
|
2
ba
|
1,755
sqft
|
built
1972
316 Bedford Rd, Bolingbrook, IL 60440
$-360
Cash flow
-5.1%
Cash-on-Cash Return
4.5%
Cap rate
0.8%
Rent to Value Ratio
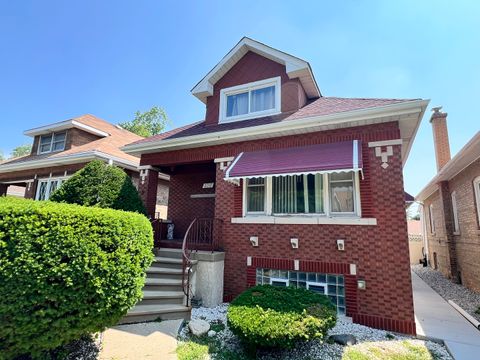
Active
$310,000
3
bds
|
2
ba
|
1,624
sqft
|
built
1928
2715 Oak Park Ave, Berwyn, IL 60402
$-339
Cash flow
-5.7%
Cash-on-Cash Return
4.4%
Cap rate
0.9%
Rent to Value Ratio
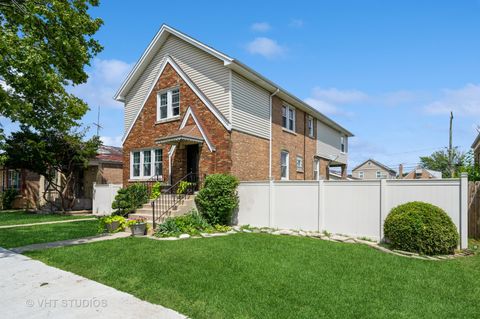
Active
$524,900
4
bds
|
3
ba
|
2,510
sqft
|
built
1942
5643 S Meade Ave, Chicago, IL 60638
$-1,266
Cash flow
-12.6%
Cash-on-Cash Return
2.8%
Cap rate
0.5%
Rent to Value Ratio
Active
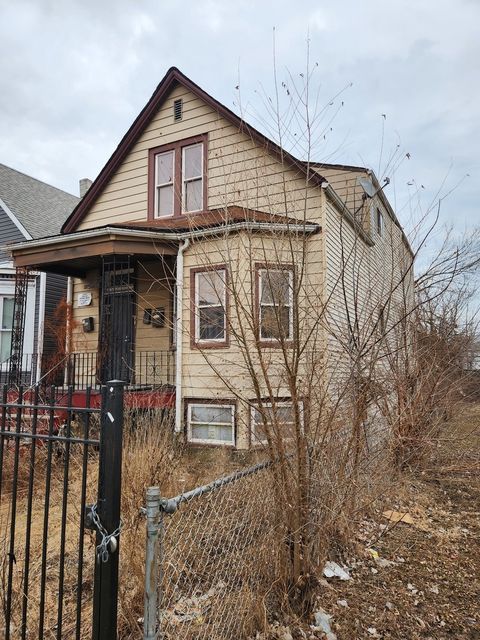
$89,999
6
bds
|
2
ba
|
0
sqft
|
built
1865
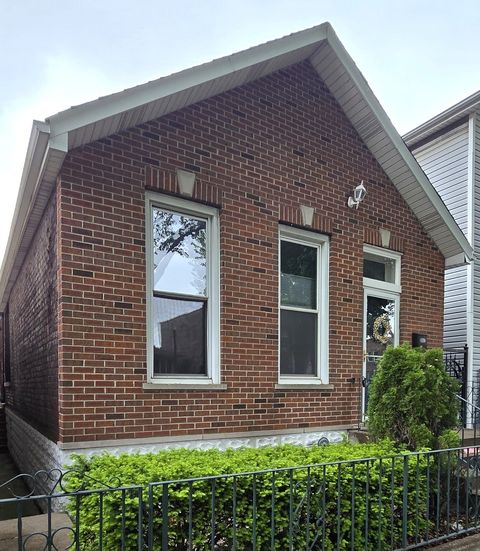
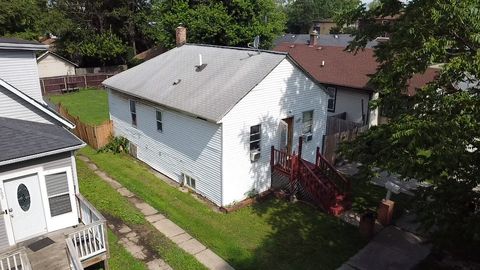
347 W 59th Pl, Chicago, IL 60621
$602
Cash flow
34.9%
Cash-on-Cash Return
13.7%
Cap rate
1.8%
Rent to Value Ratio
Active
$315,000
3
bds
|
2
ba
|
1,400
sqft
|
built
1929
7426 S Oakley Ave, Chicago, IL 60636
$-270
Cash flow
-4.5%
Cash-on-Cash Return
4.7%
Cap rate
0.6%
Rent to Value Ratio
Active
$547,000
5
bds
|
3
ba
|
2,550
sqft
|
built
1985
4901 Emerson Ave, Rolling Meadows, IL 60067
$-775
Cash flow
-7.4%
Cash-on-Cash Return
4.0%
Cap rate
0.7%
Rent to Value Ratio
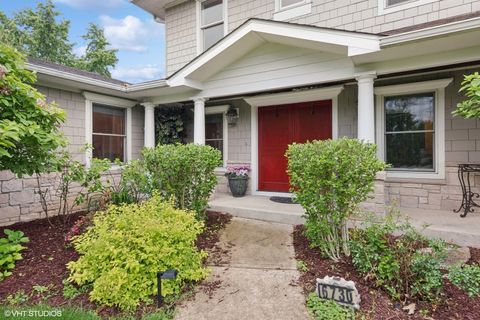
Active
$1,399,000
5
bds
|
6
ba
|
4,299
sqft
|
built
1956
6730 S Madison St, Willowbrook, IL 60527
$-4,484
Cash flow
-16.7%
Cash-on-Cash Return
1.8%
Cap rate
0.3%
Rent to Value Ratio
Active
$355,000
3
bds
|
2
ba
|
2,000
sqft
|
built
1919
1633 W Estes Ave, Chicago, IL 60626
$-610
Cash flow
-9.0%
Cash-on-Cash Return
3.6%
Cap rate
0.7%
Rent to Value Ratio
Active
$235,000
4
bds
|
2
ba
|
2,226
sqft
|
built
1932
501 N Prospect Ave, Champaign, IL 61820
$-83
Cash flow
-1.8%
Cash-on-Cash Return
5.3%
Cap rate
0.9%
Rent to Value Ratio
Active
$385,000
3
bds
|
2
ba
|
1,276
sqft
|
built
1888
3708 S Emerald Ave, Chicago, IL 60609
$-142
Cash flow
-1.9%
Cash-on-Cash Return
5.2%
Cap rate
0.8%
Rent to Value Ratio
Active
$120,000
2
bds
|
2
ba
|
1,400
sqft
|
built
1918
498 Harrison Ave, Calumet City, IL 60409
$-1
Cash flow
0.0%
Cash-on-Cash Return
5.7%
Cap rate
1.3%
Rent to Value Ratio
Active
$659,900
4
bds
|
4
ba
|
2,887
sqft
|
built
1985
1012 Hobson Dr, Buffalo Grove, IL 60089
$-2,131
Cash flow
-16.8%
Cash-on-Cash Return
1.8%
Cap rate
0.5%
Rent to Value Ratio
Active
$429,000
3
bds
|
2
ba
|
1,560
sqft
|
built
1970
9719 S 81st Ave, Palos Hills, IL 60465
$-604
Cash flow
-7.3%
Cash-on-Cash Return
4.0%
Cap rate
0.7%
Rent to Value Ratio
Active
$710,000
4
bds
|
3
ba
|
3,367
sqft
|
built
1983
8714 W 123rd St, Palos Park, IL 60464
$-957
Cash flow
-7.0%
Cash-on-Cash Return
4.1%
Cap rate
0.7%
Rent to Value Ratio

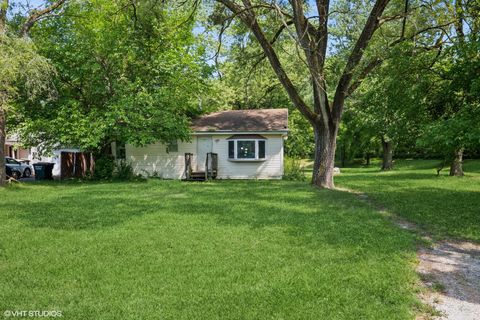
Active
$170,000
4
bds
|
3
ba
|
1,920
sqft
|
built
1920
722 E Bennington St, Toluca, IL 61369
$100
Cash flow
3.1%
Cash-on-Cash Return
6.4%
Cap rate
0.9%
Rent to Value Ratio
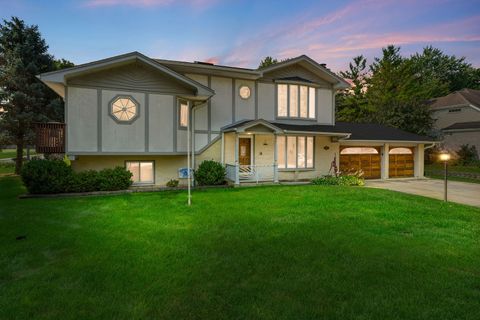
Active
$750,000
4
bds
|
3
ba
|
2,703
sqft
|
built
1996
1681 Harris Dr, Aurora, IL 60502
$-1,959
Cash flow
-13.6%
Cash-on-Cash Return
2.5%
Cap rate
0.5%
Rent to Value Ratio
Active
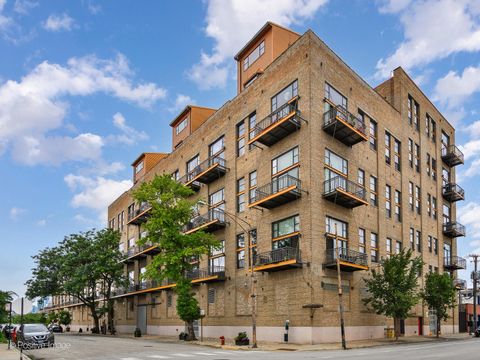
$635,000
3
bds
|
3
ba
|
0
sqft
|
built
2001
1540 N Claremont Ave, Chicago, IL 60622
$-1,639
Cash flow
-13.5%
Cash-on-Cash Return
2.6%
Cap rate
0.5%
Rent to Value Ratio
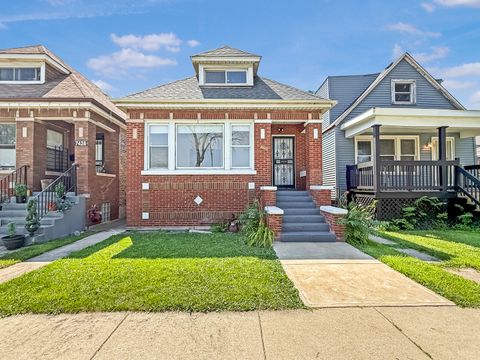
Active
$239,700
3
bds
|
2
ba
|
1,699
sqft
|
built
1928
16929 Wood St, Hazel Crest, IL 60429
$203
Cash flow
4.4%
Cash-on-Cash Return
6.7%
Cap rate
1.0%
Rent to Value Ratio

Active
$215,000
3
bds
|
2
ba
|
2,300
sqft
|
built
1925
6727 S Merrill Ave, Chicago, IL 60649
$-422
Cash flow
-10.2%
Cash-on-Cash Return
3.3%
Cap rate
1.0%
Rent to Value Ratio
Active
$195,000
2
bds
|
1
ba
|
1,000
sqft
|
built
1979
8749 W Summerdale Ave, Chicago, IL 60656
$-151
Cash flow
-4.0%
Cash-on-Cash Return
4.8%
Cap rate
0.9%
Rent to Value Ratio
Active
$100,000
2
bds
|
2
ba
|
1,100
sqft
|
built
1971
100 Park Ave, Calumet City, IL 60409
$479
Cash flow
25.0%
Cash-on-Cash Return
11.4%
Cap rate
1.8%
Rent to Value Ratio
Active
$180,000
3
bds
|
1
ba
|
1,166
sqft
|
built
1953
3636 172nd St, Lansing, IL 60438
$-265
Cash flow
-7.7%
Cash-on-Cash Return
3.9%
Cap rate
0.9%
Rent to Value Ratio
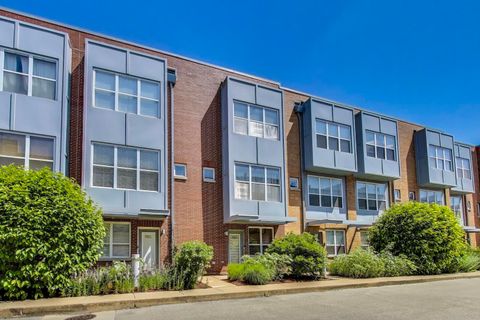
Active
$295,000
3
bds
|
3
ba
|
1,919
sqft
|
built
1983
315 Leverette St, Thornton, IL 60476
$69
Cash flow
1.2%
Cash-on-Cash Return
6.0%
Cap rate
1.1%
Rent to Value Ratio
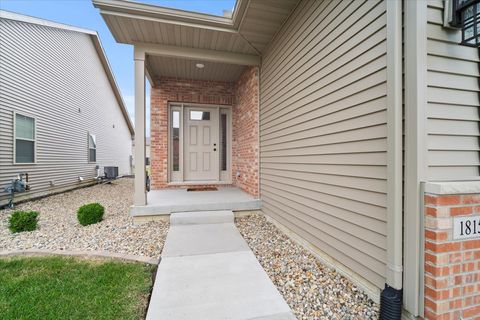
Active
$295,000
2
bds
|
2
ba
|
2,512
sqft
|
built
2022
1815 Glenbridge Rd, Bloomington, IL 61704
$53
Cash flow
0.9%
Cash-on-Cash Return
5.9%
Cap rate
0.9%
Rent to Value Ratio
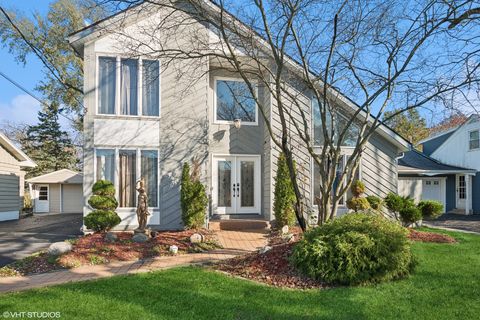
Active
$475,000
2
bds
|
2
ba
|
1,900
sqft
|
built
2000
3209 N Drake Ave, Chicago, IL 60618
$-692
Cash flow
-7.6%
Cash-on-Cash Return
3.9%
Cap rate
0.7%
Rent to Value Ratio
Active
$310,000
4
bds
|
2
ba
|
1,880
sqft
|
built
1953
568 Riverview Dr, South Holland, IL 60473
$-132
Cash flow
-2.2%
Cash-on-Cash Return
5.2%
Cap rate
0.8%
Rent to Value Ratio
Active
$327,500
5
bds
|
3
ba
|
1,852
sqft
|
built
1865
3710 W 60th Pl, Chicago, IL 60629
$-204
Cash flow
-3.2%
Cash-on-Cash Return
4.9%
Cap rate
0.8%
Rent to Value Ratio
Active
$795,000
5
bds
|
4
ba
|
4,752
sqft
|
built
1959
8021 W Rascher Ave, Chicago, IL 60656
$-1,870
Cash flow
-12.3%
Cash-on-Cash Return
2.9%
Cap rate
0.5%
Rent to Value Ratio
Active
$389,900
2
bds
|
2
ba
|
1,342
sqft
|
built
1909
2545 S Dearborn St, Chicago, IL 60616
$-976
Cash flow
-13.1%
Cash-on-Cash Return
2.7%
Cap rate
0.7%
Rent to Value Ratio
Active
$285,000
3
bds
|
3
ba
|
1,448
sqft
|
built
2001
1703 Waters Edge Dr, Minooka, IL 60447
$-439
Cash flow
-8.0%
Cash-on-Cash Return
3.8%
Cap rate
0.8%
Rent to Value Ratio

Active
$219,900
2
bds
|
1
ba
|
1,344
sqft
|
built
1952
817 Old Route 47, Monticello, IL 61856
$-53
Cash flow
-1.3%
Cash-on-Cash Return
5.4%
Cap rate
0.8%
Rent to Value Ratio
Active
$274,000
2
bds
|
2
ba
|
1,131
sqft
|
built
1973
6565 Main St, Downers Grove, IL 60516
$-300
Cash flow
-5.7%
Cash-on-Cash Return
4.4%
Cap rate
0.9%
Rent to Value Ratio
Active
$399,900
3
bds
|
3
ba
|
1,864
sqft
|
built
2006
3427 Bradbury Cir, Aurora, IL 60504
$-844
Cash flow
-11.0%
Cash-on-Cash Return
3.1%
Cap rate
0.7%
Rent to Value Ratio
Active
$270,000
3
bds
|
3
ba
|
1,619
sqft
|
built
2007
1028 Heron Cir, Joliet, IL 60431
$-426
Cash flow
-8.2%
Cash-on-Cash Return
3.8%
Cap rate
0.9%
Rent to Value Ratio
Active
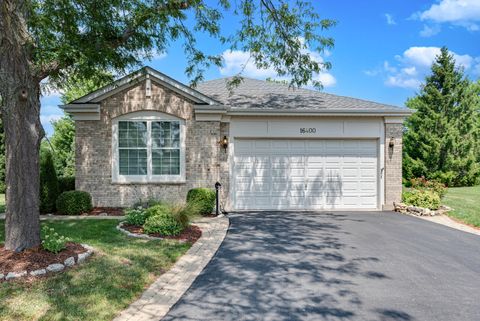
$367,000
2
bds
|
2
ba
|
2,092
sqft
|
built
2004
16400 Grandwood Lake Dr, Crest Hill, IL 60403
$-889
Cash flow
-12.6%
Cash-on-Cash Return
2.8%
Cap rate
0.6%
Rent to Value Ratio