Indiana Investment Properties for Sale
Browse homes for sale and investment properties in Indiana. Refine your search by price, property type, or more.
Best cash flowing properties in Indiana
Active
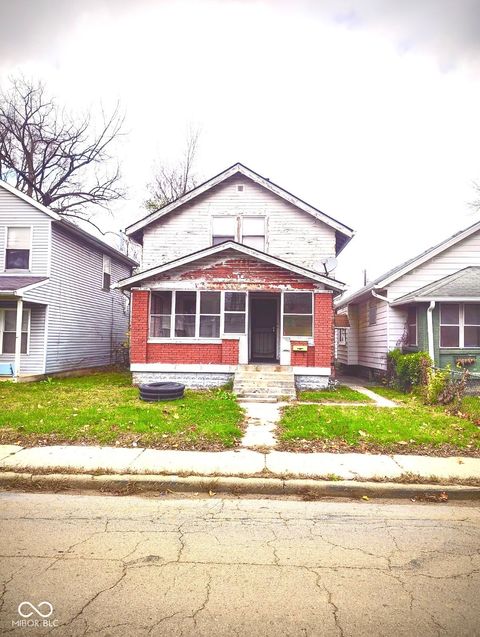
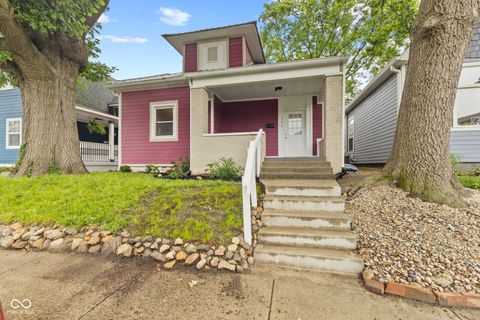
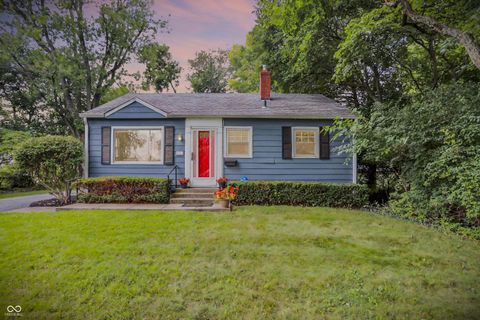
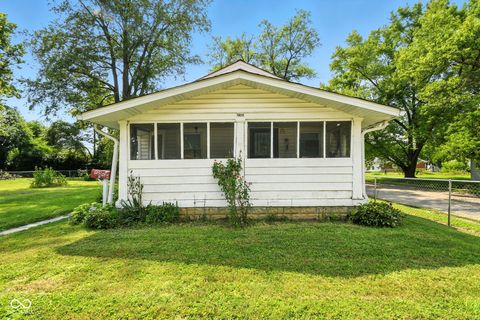
$87,500
2
bds
|
1
ba
|
1,232
sqft
|
built
1955
1166 W 29th St, Indianapolis, IN 46208
$587
Cash flow
35.0%
Cash-on-Cash Return
14.2%
Cap rate
1.7%
Rent to Value Ratio
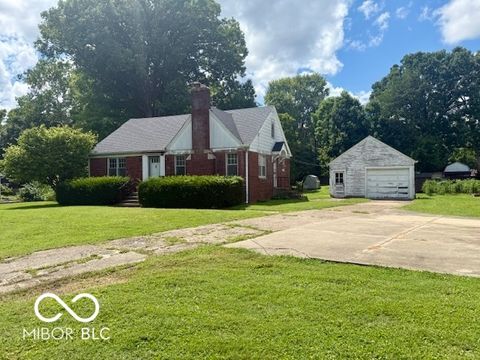
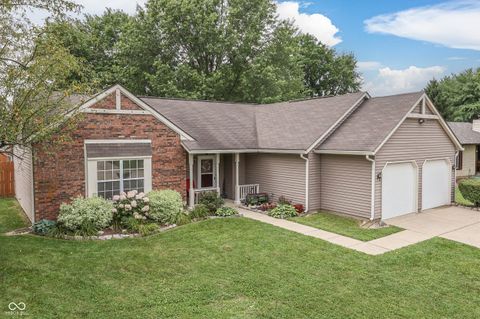
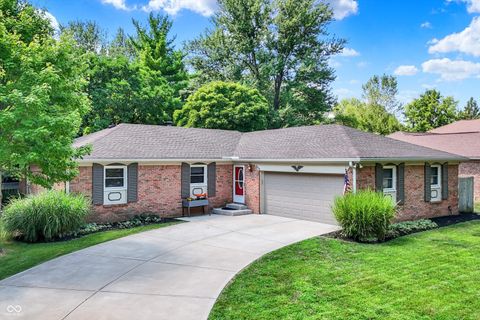
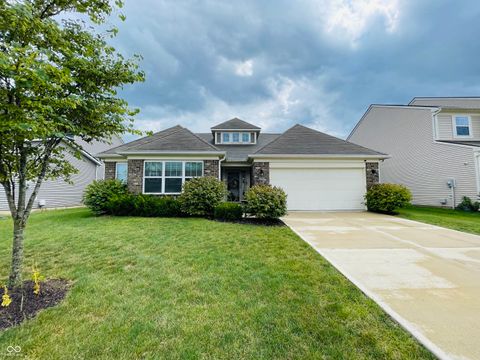
Active
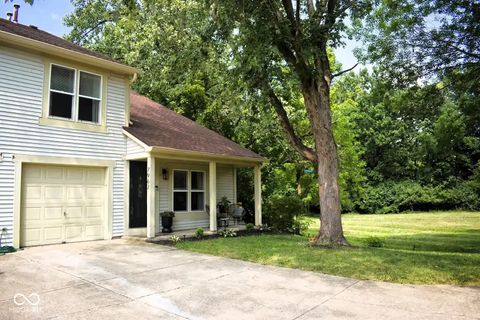
$160,000
2
bds
|
1
ba
|
1,167
sqft
|
built
1940
5606 Shelby St, Indianapolis, IN 46227
$215
Cash flow
7.0%
Cash-on-Cash Return
7.8%
Cap rate
0.9%
Rent to Value Ratio
3,610 out of 4,456 properties for sale in Indiana
Limited Results Shown
Create a free account, or log in to reveal all property listings and enjoy the complete experience.
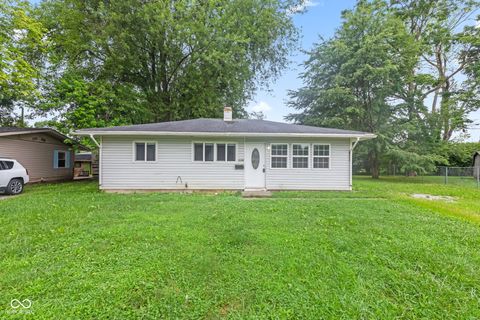
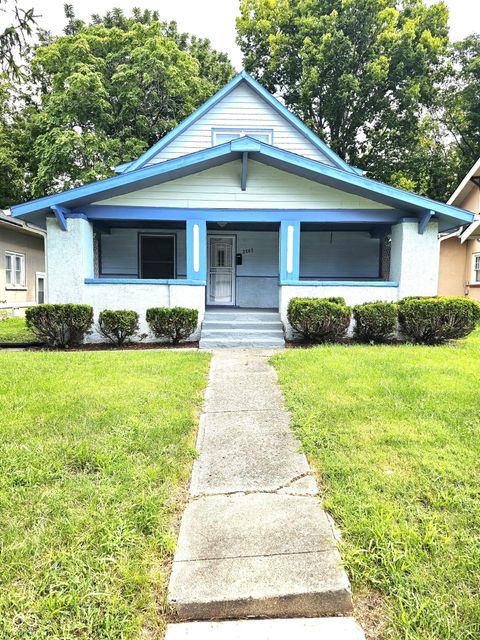
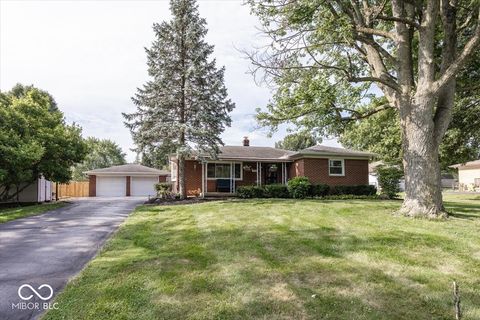
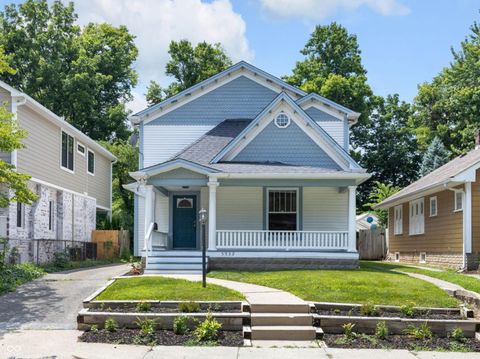
Active
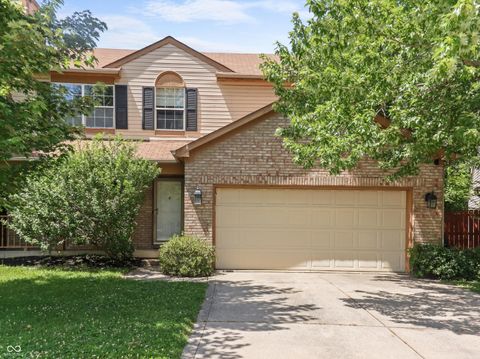
$185,000
3
bds
|
1
ba
|
900
sqft
|
built
1955
3148 Keswick Rd, Indianapolis, IN 46222
$-51
Cash flow
-1.4%
Cash-on-Cash Return
5.8%
Cap rate
0.7%
Rent to Value Ratio
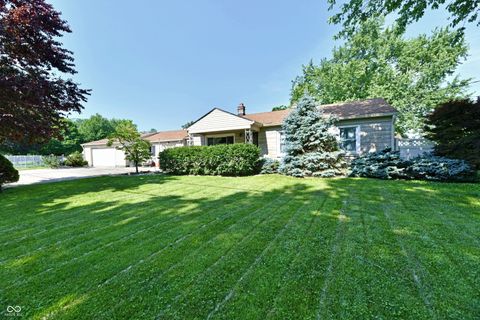
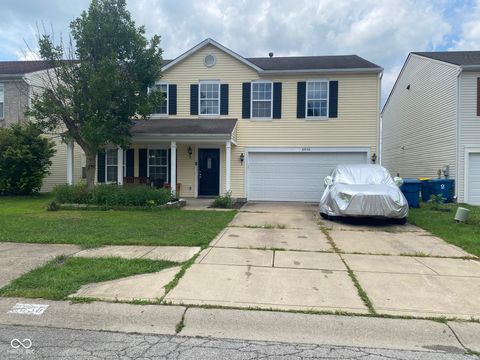
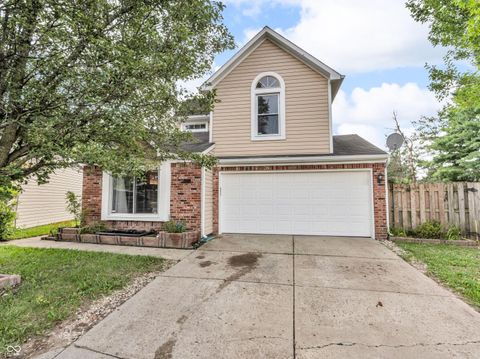
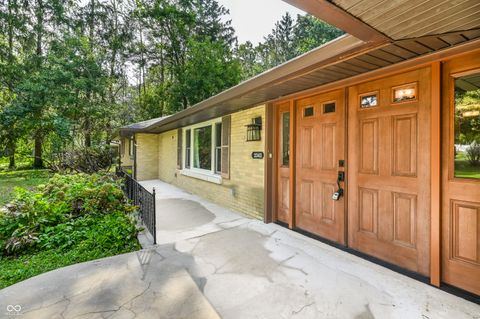
Active
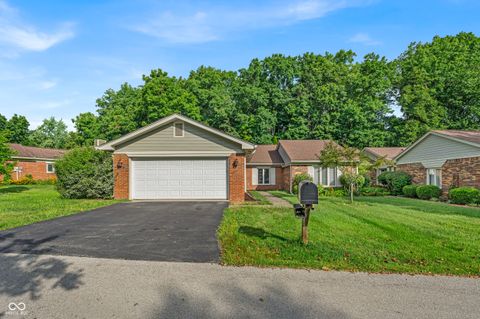
$260,000
4
bds
|
2
ba
|
1,732
sqft
|
built
1952
4020 S Lynhurst Dr, Indianapolis, IN 46221
$48
Cash flow
1.0%
Cash-on-Cash Return
6.4%
Cap rate
0.8%
Rent to Value Ratio
Active
$264,900
3
bds
|
2
ba
|
1,208
sqft
|
built
1909
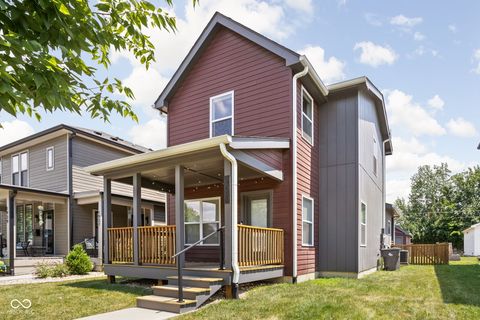
734 Parkway Ave, Indianapolis, IN 46203
$23
Cash flow
0.5%
Cash-on-Cash Return
6.3%
Cap rate
0.8%
Rent to Value Ratio
Active
$163,000
2
bds
|
1
ba
|
1,179
sqft
|
built
1983
7962 Valley Farms Ct, Indianapolis, IN 46214
$51
Cash flow
1.6%
Cash-on-Cash Return
6.5%
Cap rate
1.0%
Rent to Value Ratio
Active
$279,000
3
bds
|
3
ba
|
2,284
sqft
|
built
1995
5626 Prince Woods Cir, Indianapolis, IN 46224
$-139
Cash flow
-2.6%
Cash-on-Cash Return
5.5%
Cap rate
0.7%
Rent to Value Ratio
Active
$285,000
2
bds
|
3
ba
|
1,926
sqft
|
built
1978
5228 Greenwillow Rd, Indianapolis, IN 46226
$-633
Cash flow
-11.6%
Cash-on-Cash Return
3.5%
Cap rate
0.7%
Rent to Value Ratio
Active
$299,900
3
bds
|
1
ba
|
864
sqft
|
built
1949
6224 Norwaldo Ave, Indianapolis, IN 46220
$-156
Cash flow
-2.7%
Cash-on-Cash Return
5.5%
Cap rate
0.7%
Rent to Value Ratio
Active
$269,999
3
bds
|
2
ba
|
1,500
sqft
|
built
1985
7556 Gunyon Ct, Indianapolis, IN 46237
$-141
Cash flow
-2.7%
Cash-on-Cash Return
5.5%
Cap rate
0.7%
Rent to Value Ratio

Active
$450,000
3
bds
|
3
ba
|
2,340
sqft
|
built
1940
4629 Cornelius Ave, Indianapolis, IN 46208
$-373
Cash flow
-4.3%
Cash-on-Cash Return
5.2%
Cap rate
0.6%
Rent to Value Ratio
Active
$254,900
4
bds
|
3
ba
|
2,048
sqft
|
built
1940
3565 Evergreen Ave, Indianapolis, IN 46205
$-409
Cash flow
-8.4%
Cash-on-Cash Return
4.2%
Cap rate
0.5%
Rent to Value Ratio
Active
$290,000
3
bds
|
3
ba
|
2,340
sqft
|
built
2000
6656 Sonesta Dr, Indianapolis, IN 46217
$-265
Cash flow
-4.8%
Cash-on-Cash Return
5.1%
Cap rate
0.6%
Rent to Value Ratio
Active
$230,000
3
bds
|
2
ba
|
1,200
sqft
|
built
1998
6042 Rocky River Dr, Indianapolis, IN 46221
$-92
Cash flow
-2.1%
Cash-on-Cash Return
5.7%
Cap rate
0.7%
Rent to Value Ratio
Active
$220,000
4
bds
|
2
ba
|
2,483
sqft
|
built
1962
1140 N Gibson Ave, Indianapolis, IN 46219
$115
Cash flow
2.7%
Cash-on-Cash Return
6.8%
Cap rate
0.8%
Rent to Value Ratio
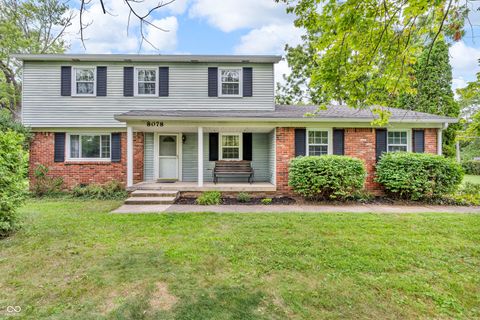
Active
$315,000
5
bds
|
3
ba
|
2,258
sqft
|
built
1969
8078 Charlecot Dr, Indianapolis, IN 46268
$-96
Cash flow
-1.6%
Cash-on-Cash Return
5.8%
Cap rate
0.7%
Rent to Value Ratio
Active
$320,000
3
bds
|
3
ba
|
1,871
sqft
|
built
1976
9177 Budd Run Dr, Indianapolis, IN 46250
$-259
Cash flow
-4.2%
Cash-on-Cash Return
5.2%
Cap rate
0.6%
Rent to Value Ratio
Active
$125,000
3
bds
|
1
ba
|
960
sqft
|
built
1930
2860 Eastern Ave, Indianapolis, IN 46218
$188
Cash flow
7.8%
Cash-on-Cash Return
7.9%
Cap rate
1.0%
Rent to Value Ratio

Active
$195,000
3
bds
|
2
ba
|
1,344
sqft
|
built
1965
2823 S Irwin St, Indianapolis, IN 46203
$105
Cash flow
2.8%
Cash-on-Cash Return
6.8%
Cap rate
0.8%
Rent to Value Ratio
Active
$335,000
3
bds
|
2
ba
|
2,343
sqft
|
built
1972
3039 Amherst St, Indianapolis, IN 46268
$-182
Cash flow
-2.8%
Cash-on-Cash Return
5.5%
Cap rate
0.7%
Rent to Value Ratio
Active
$225,000
3
bds
|
1
ba
|
1,164
sqft
|
built
1958
4909 W Markwood Ave, Indianapolis, IN 46221
$-49
Cash flow
-1.1%
Cash-on-Cash Return
5.9%
Cap rate
0.7%
Rent to Value Ratio
Active
$239,900
3
bds
|
2
ba
|
1,477
sqft
|
built
1991
4955 Peony Pl, Indianapolis, IN 46254
$-27
Cash flow
-0.6%
Cash-on-Cash Return
6.0%
Cap rate
0.8%
Rent to Value Ratio
Active
$197,500
2
bds
|
3
ba
|
1,216
sqft
|
built
2003
8155 River Mist Ln, Indianapolis, IN 46237
$-225
Cash flow
-5.9%
Cash-on-Cash Return
4.8%
Cap rate
0.8%
Rent to Value Ratio

Active
$225,000
3
bds
|
3
ba
|
2,252
sqft
|
built
2008
4240 Arches Ct, Indianapolis, IN 46235
$201
Cash flow
4.7%
Cash-on-Cash Return
7.2%
Cap rate
0.9%
Rent to Value Ratio
Active
$199,000
3
bds
|
2
ba
|
1,599
sqft
|
built
1940
3510 N Tacoma Ave, Indianapolis, IN 46218
$-122
Cash flow
-3.2%
Cash-on-Cash Return
5.4%
Cap rate
0.7%
Rent to Value Ratio

Active
$265,000
3
bds
|
3
ba
|
1,590
sqft
|
built
1997
5142 Hickory Lake Dr, Indianapolis, IN 46235
$-7
Cash flow
-0.1%
Cash-on-Cash Return
6.1%
Cap rate
0.8%
Rent to Value Ratio

Active
$194,900
3
bds
|
3
ba
|
1,950
sqft
|
built
1998
6139 Robinwood Dr, Indianapolis, IN 46237
$-36
Cash flow
-1.0%
Cash-on-Cash Return
5.9%
Cap rate
0.9%
Rent to Value Ratio
Active
$673,900
4
bds
|
3
ba
|
2,549
sqft
|
built
1990
7304 E Stop 11 Rd, Indianapolis, IN 46259
$-1,727
Cash flow
-13.4%
Cash-on-Cash Return
3.1%
Cap rate
0.4%
Rent to Value Ratio
Active
$185,000
3
bds
|
1
ba
|
1,064
sqft
|
built
1963
2701 Sangster Ave, Indianapolis, IN 46218
$-189
Cash flow
-5.3%
Cash-on-Cash Return
4.9%
Cap rate
0.6%
Rent to Value Ratio
Active
$259,000
3
bds
|
2
ba
|
1,506
sqft
|
built
2010
5406 Bombay Dr, Indianapolis, IN 46239
$21
Cash flow
0.4%
Cash-on-Cash Return
6.2%
Cap rate
0.8%
Rent to Value Ratio

Active
$362,000
3
bds
|
2
ba
|
1,650
sqft
|
built
1955
1302 Laurel St, Indianapolis, IN 46203
$-957
Cash flow
-13.8%
Cash-on-Cash Return
3.0%
Cap rate
0.4%
Rent to Value Ratio
Active
$275,000
3
bds
|
2
ba
|
1,592
sqft
|
built
1900
2161 N Meridian St, Indianapolis, IN 46202
$-59
Cash flow
-1.1%
Cash-on-Cash Return
5.9%
Cap rate
0.9%
Rent to Value Ratio
Active
$210,000
3
bds
|
2
ba
|
1,792
sqft
|
built
1910
305 S Emerson Ave, Indianapolis, IN 46219
$28
Cash flow
0.7%
Cash-on-Cash Return
6.3%
Cap rate
0.8%
Rent to Value Ratio

Active
$389,900
3
bds
|
3
ba
|
2,280
sqft
|
built
2017
5832 Buskirk Dr, Indianapolis, IN 46216
$-389
Cash flow
-5.2%
Cash-on-Cash Return
4.9%
Cap rate
0.6%
Rent to Value Ratio

Active
$345,000
4
bds
|
3
ba
|
2,240
sqft
|
built
2020
5150 Arling Dr, Indianapolis, IN 46237
$-221
Cash flow
-3.3%
Cash-on-Cash Return
5.4%
Cap rate
0.7%
Rent to Value Ratio
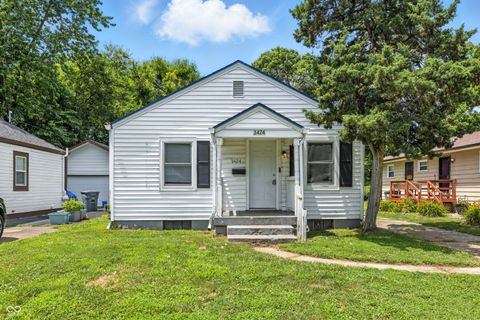
Active
$119,900
2
bds
|
1
ba
|
720
sqft
|
built
1941
3424 Orchard Ave, Indianapolis, IN 46218
$145
Cash flow
6.3%
Cash-on-Cash Return
7.6%
Cap rate
0.9%
Rent to Value Ratio
Active
$333,000
4
bds
|
3
ba
|
2,302
sqft
|
built
2017
10451 Pintail Ln, Indianapolis, IN 46239
$-119
Cash flow
-1.9%
Cash-on-Cash Return
5.7%
Cap rate
0.7%
Rent to Value Ratio
Active
$599,900
4
bds
|
4
ba
|
2,470
sqft
|
built
2020
1935 Cornell Ave, Indianapolis, IN 46202
$-865
Cash flow
-7.5%
Cash-on-Cash Return
4.4%
Cap rate
0.5%
Rent to Value Ratio
Active
$465,000
4
bds
|
3
ba
|
2,024
sqft
|
built
1910
5932 Broadway St, Indianapolis, IN 46220
$-450
Cash flow
-5.0%
Cash-on-Cash Return
5.0%
Cap rate
0.6%
Rent to Value Ratio
Active
$384,900
3
bds
|
3
ba
|
2,608
sqft
|
built
1959
3343 Devereaux Dr, Indianapolis, IN 46228
$-385
Cash flow
-5.2%
Cash-on-Cash Return
4.9%
Cap rate
0.6%
Rent to Value Ratio