United States Investment Properties for Sale
Browse homes for sale and investment properties in United States. Refine your search by price, property type, or more.
Best cash flowing properties in United States
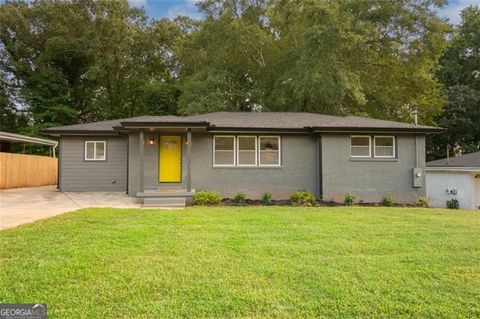
Active
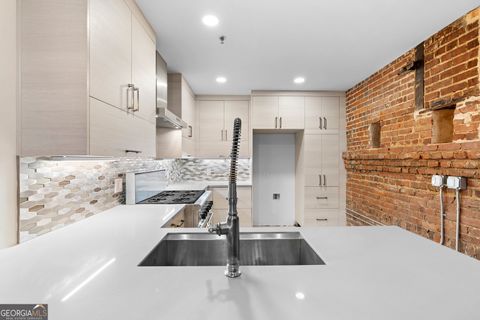
$2,750
4
bds
|
0
ba
|
0
sqft
|
built
1956
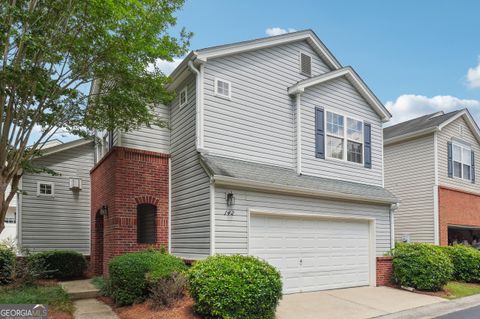
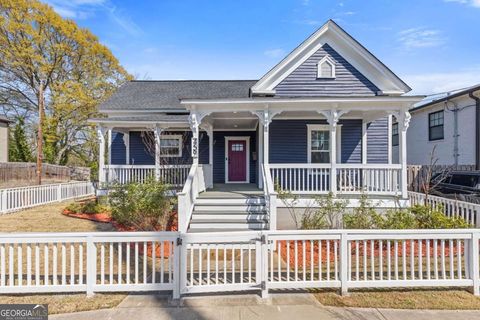
2658 Miriam Ln, Decatur, GA 30032
$1,508
Cash flow
638.8%
Cash-on-Cash Return
658.0%
Cap rate
101.8%
Rent to Value Ratio
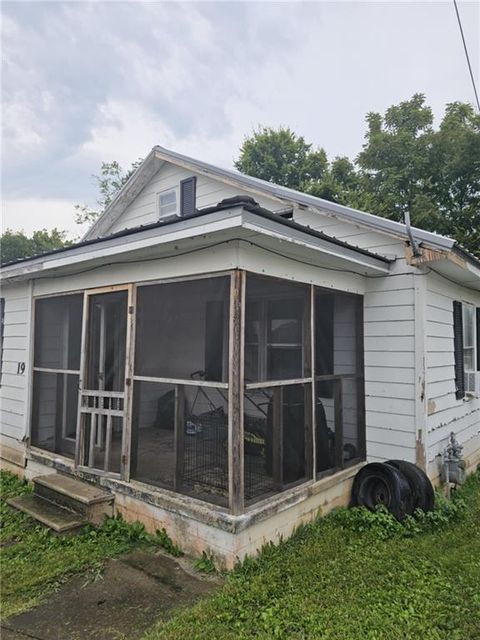
Active
$79,000
2
bds
|
1
ba
|
0
sqft
|
built
1900
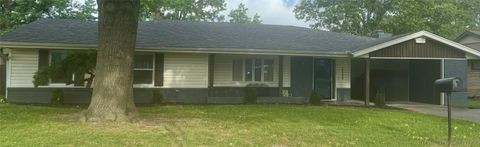
19 Williams St, Aragon, GA 30104
$322
Cash flow
21.3%
Cash-on-Cash Return
11.0%
Cap rate
1.4%
Rent to Value Ratio
10,000 out of 303,785 properties for sale in United States
Limited Results Shown
Create a free account, or log in to reveal all property listings and enjoy the complete experience.
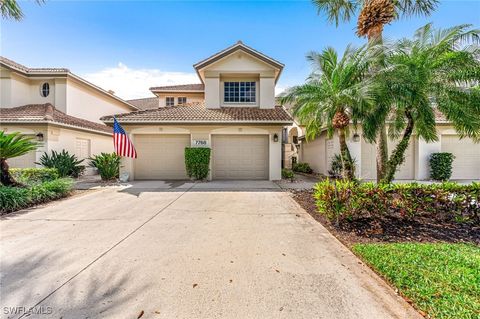
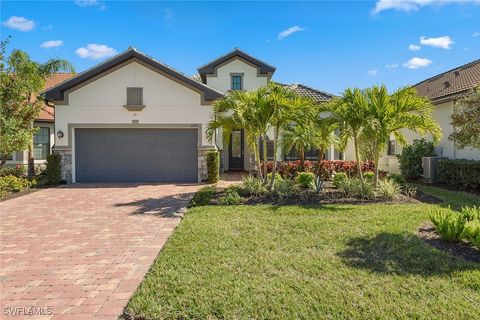
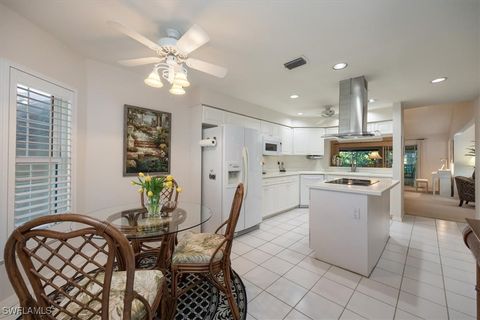
Active
$382,700
3
bds
|
2
ba
|
1,867
sqft
|
built
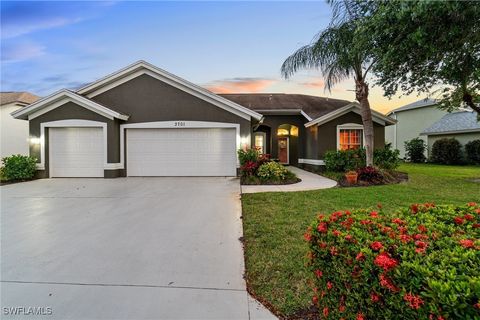
1995
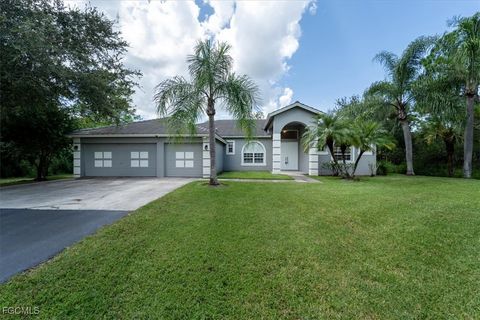
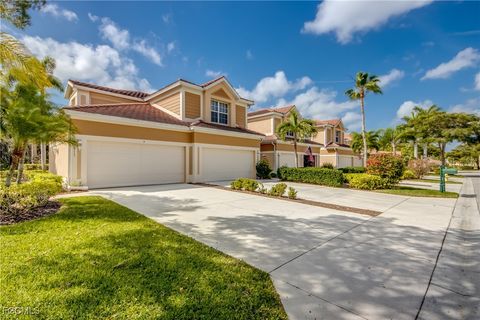
7768 Gardner Dr, Naples, FL 34109
$-467
Cash flow
-6.4%
Cash-on-Cash Return
4.7%
Cap rate
0.7%
Rent to Value Ratio
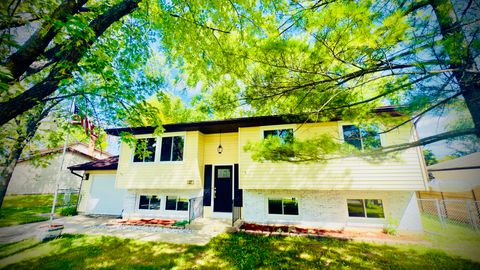
Active
$389,900
3
bds
|
2
ba
|
1,556
sqft
|
built
1973
527 Northgate Rd, Lindenhurst, IL 60046
$-812
Cash flow
-10.9%
Cash-on-Cash Return
3.2%
Cap rate
0.6%
Rent to Value Ratio
Active
$799,000
4
bds
|
2
ba
|
0
sqft
|
built
1910
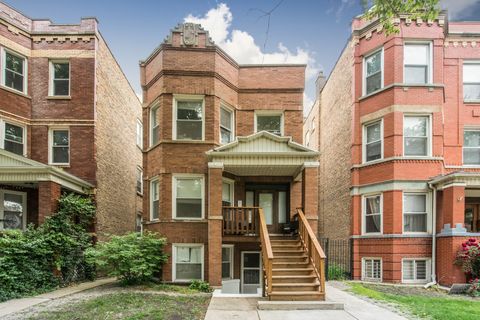
3080 N Davlin Ct, Chicago, IL 60618
$-2,418
Cash flow
-15.8%
Cash-on-Cash Return
2.0%
Cap rate
0.4%
Rent to Value Ratio

Active
$290,000
4
bds
|
3
ba
|
0
sqft
|
built
1999
221 Turtle Cv, Carrollton, GA 30116
$-412
Cash flow
-7.4%
Cash-on-Cash Return
4.4%
Cap rate
0.7%
Rent to Value Ratio
Active
$1,675,000
3
bds
|
2
ba
|
1,772
sqft
|
built
1934
16 Point Rd, Bayport, MN 55003
$-6,151
Cash flow
-19.2%
Cash-on-Cash Return
1.3%
Cap rate
0.2%
Rent to Value Ratio
Active
$725,000
4
bds
|
4.5
ba
|
4,262
sqft
|
built
2021
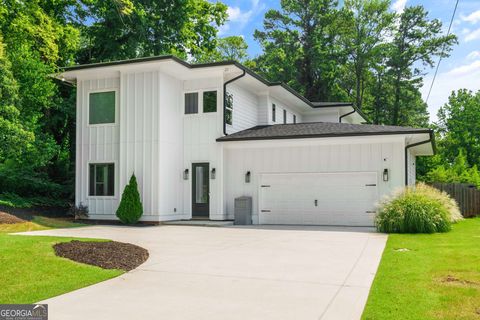
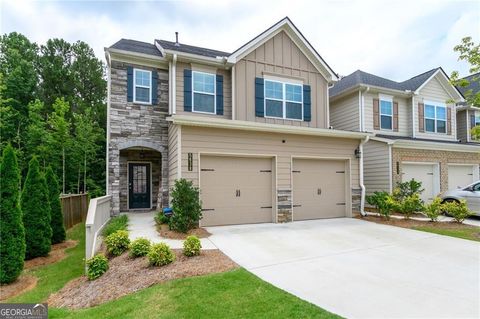
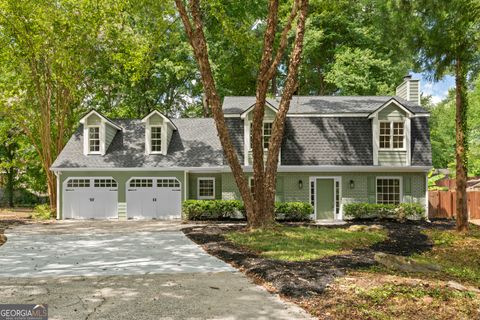
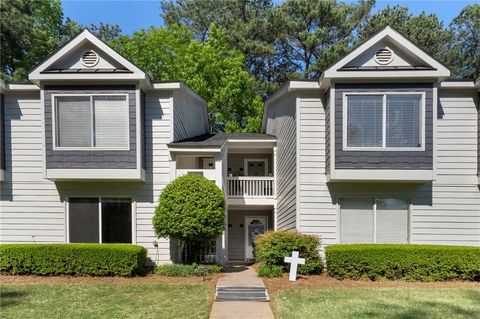
1520 Columbia Dr, Decatur, GA 30032
$-1,336
Cash flow
-9.6%
Cash-on-Cash Return
3.9%
Cap rate
0.7%
Rent to Value Ratio
Active
$464,000
4
bds
|
3
ba
|
2,711
sqft
|
built
1963
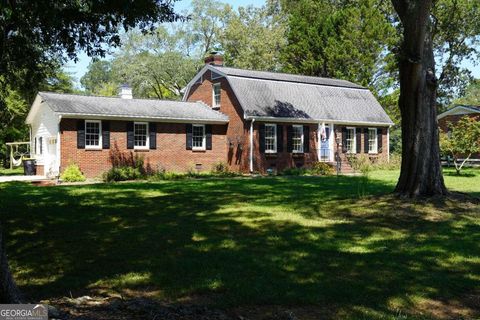
227 W Lakeshore Dr SE, Rome, GA 30161
$-1,144
Cash flow
-12.9%
Cash-on-Cash Return
3.2%
Cap rate
0.6%
Rent to Value Ratio
Active
$679,999
5
bds
|
2
ba
|
1,428
sqft
|
built
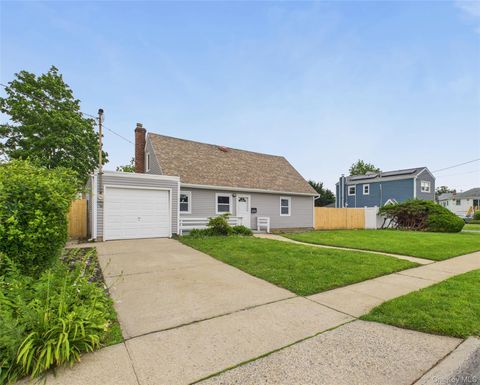
1950
1057 Washington St, Baldwin, NY 11510
$-1,711
Cash flow
-13.1%
Cash-on-Cash Return
3.0%
Cap rate
0.6%
Rent to Value Ratio
Active
$329,900
3
bds
|
2.5
ba
|
1,274
sqft
|
built
2003
142 Swanee Ln, Woodstock, GA 30188
$-468
Cash flow
-7.4%
Cash-on-Cash Return
4.4%
Cap rate
0.6%
Rent to Value Ratio
Active
$569,000
3
bds
|
2
ba
|
1,447
sqft
|
built
1994
3701 Bali Ln, Estero, FL 33928
$-1,036
Cash flow
-9.5%
Cash-on-Cash Return
4.0%
Cap rate
0.6%
Rent to Value Ratio
Active
$299,900
3
bds
|
3
ba
|
2,595
sqft
|
built
1957
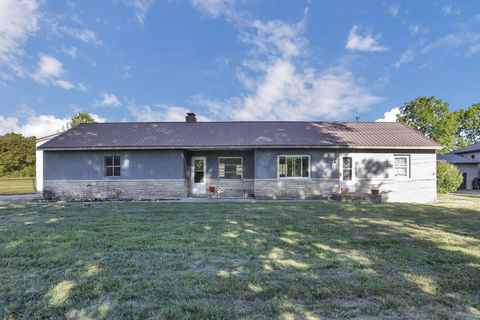
1335 N Mc Farland Pl, Claremore, OK 74017
$-386
Cash flow
-6.7%
Cash-on-Cash Return
4.1%
Cap rate
0.6%
Rent to Value Ratio

Active
$214,900
2
bds
|
1
ba
|
0
sqft
|
built
1920
1591 Jonesboro Rd SE, Atlanta, GA 30315
$108
Cash flow
2.6%
Cash-on-Cash Return
6.8%
Cap rate
0.9%
Rent to Value Ratio
Active
$345,000
3
bds
|
2.5
ba
|
0
sqft
|
built
2020
5638 Berney Cir, Powder Springs, GA 30127
$-539
Cash flow
-8.2%
Cash-on-Cash Return
4.3%
Cap rate
0.7%
Rent to Value Ratio
Active
$539,000
2
bds
|
2
ba
|
1,232
sqft
|
built
2017
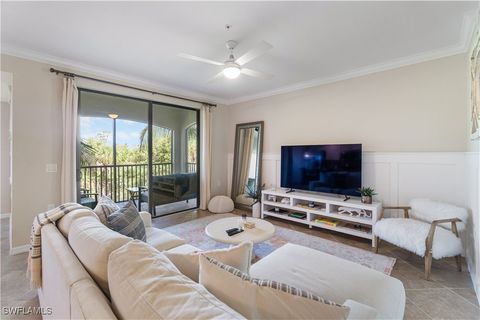
9834 Giaveno Cir, Naples, FL 34113
$-1,115
Cash flow
-10.8%
Cash-on-Cash Return
3.7%
Cap rate
0.7%
Rent to Value Ratio
Active
$799,900
3
bds
|
3
ba
|
1,940
sqft
|
built
1981
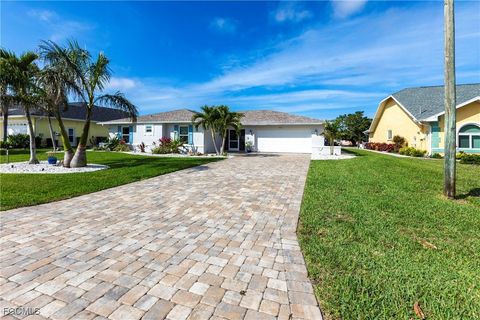
4912 SW 11th Ave, Cape Coral, FL 33914
$-2,760
Cash flow
-18.0%
Cash-on-Cash Return
2.0%
Cap rate
0.4%
Rent to Value Ratio

Active
$395,000
3
bds
|
4
ba
|
0
sqft
|
built
1887
818 Cannon Ave, Bentonia, MS 39040
$106
Cash flow
1.4%
Cash-on-Cash Return
6.0%
Cap rate
0.8%
Rent to Value Ratio
Active
$240,000
2
bds
|
1
ba
|
960
sqft
|
built
1954
5636 Old Logan Rd SE, Lancaster, OH 43130
$-189
Cash flow
-4.1%
Cash-on-Cash Return
4.7%
Cap rate
0.7%
Rent to Value Ratio
Active
$569,900
4
bds
|
2.5
ba
|
2,697
sqft
|
built
1979
2743 Saddle Ridge Lake Dr, Marietta, GA 30062
$-1,135
Cash flow
-10.4%
Cash-on-Cash Return
3.8%
Cap rate
0.5%
Rent to Value Ratio
Active
$375,000
5
bds
|
3.5
ba
|
3,124
sqft
|
built
1973
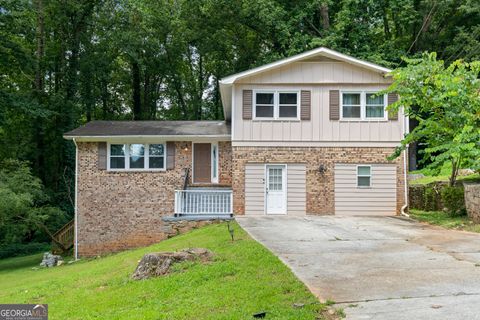
811 Corundum Ct, Stone Mountain, GA 30083
$-982
Cash flow
-13.7%
Cash-on-Cash Return
3.0%
Cap rate
0.5%
Rent to Value Ratio
Active
$773,900
3
bds
|
2
ba
|
1,852
sqft
|
built
2004
1161 16th St NE, Naples, FL 34120
$-1,437
Cash flow
-9.7%
Cash-on-Cash Return
3.9%
Cap rate
0.6%
Rent to Value Ratio

Active
$175,000
3
bds
|
1
ba
|
0
sqft
|
built
1950
372 Second St, Forest Park, GA 30297
$-225
Cash flow
-6.7%
Cash-on-Cash Return
4.6%
Cap rate
0.7%
Rent to Value Ratio
Active
$469,900
4
bds
|
3
ba
|
2,253
sqft
|
built
2021
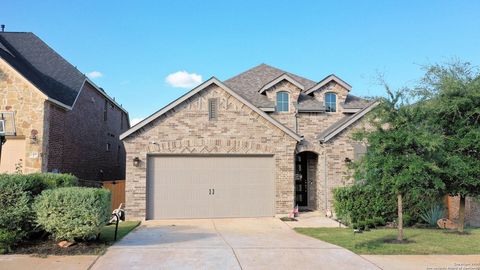
244 Heartleaf Rd, San Marcos, TX 78666
$-1,076
Cash flow
-11.9%
Cash-on-Cash Return
2.9%
Cap rate
0.7%
Rent to Value Ratio

Active
$77,000
1
bds
|
1
ba
|
490
sqft
|
built
1964
31831 Grand River Ave, Farmington, MI 48336
$-176
Cash flow
-11.9%
Cash-on-Cash Return
3.4%
Cap rate
1.2%
Rent to Value Ratio
Active
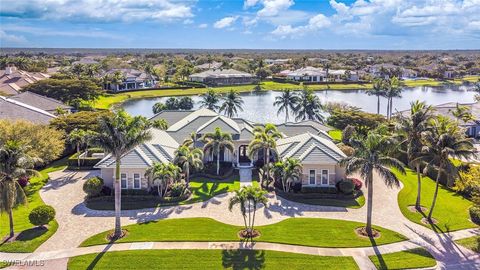
$3,999,000
5
bds
|
6
ba
|
4,758
sqft
|
built
2013
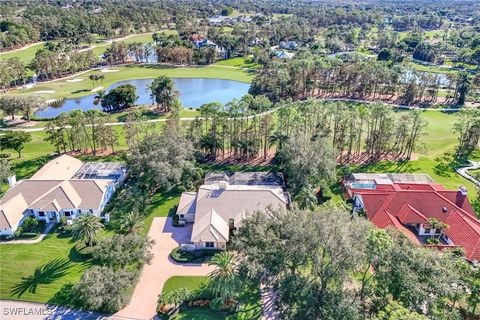
5923 Sunnyslope Dr, Naples, FL 34119
$-17,122
Cash flow
-22.3%
Cash-on-Cash Return
1.0%
Cap rate
0.2%
Rent to Value Ratio
Active
$650,000
2
bds
|
2
ba
|
2,800
sqft
|
built
1945
490 Marietta St NW, Atlanta, GA 30313
$-1,749
Cash flow
-14.0%
Cash-on-Cash Return
2.9%
Cap rate
0.7%
Rent to Value Ratio
Active
$299,000
3
bds
|
2
ba
|
1,176
sqft
|
built
1940
81 Maple Ave, Thornville, OH 43076
$-339
Cash flow
-5.9%
Cash-on-Cash Return
4.3%
Cap rate
0.6%
Rent to Value Ratio

Active
$260,000
2
bds
|
2
ba
|
1,279
sqft
|
built
1990
13141 Whitehaven Ln, Fort Myers, FL 33966
$-216
Cash flow
-4.3%
Cash-on-Cash Return
5.2%
Cap rate
0.8%
Rent to Value Ratio

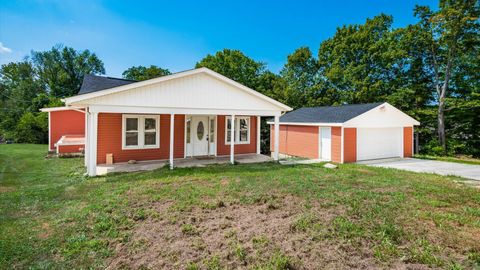
Active
$399,000
4
bds
|
2
ba
|
1,871
sqft
|
built
1984
7326 State Route 19, Mount Gilead, OH 43338
$-1,346
Cash flow
-17.6%
Cash-on-Cash Return
1.6%
Cap rate
0.4%
Rent to Value Ratio
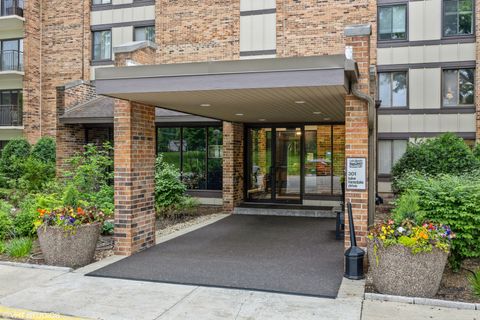
Active
$299,900
2
bds
|
2
ba
|
1,264
sqft
|
built
1974
301 Lake Hinsdale Dr, Willowbrook, IL 60527
$-822
Cash flow
-14.3%
Cash-on-Cash Return
2.4%
Cap rate
0.8%
Rent to Value Ratio
Active
$279,900
2
bds
|
2
ba
|
0
sqft
|
built
1982
111 Fair Haven Way SE, Smyrna, GA 30080
$-1,012
Cash flow
-18.9%
Cash-on-Cash Return
1.8%
Cap rate
0.5%
Rent to Value Ratio
Active
$2,695,000
4
bds
|
6
ba
|
3,900
sqft
|
built
1988
4556 Pond Apple Dr N, Naples, FL 34119
$-8,491
Cash flow
-16.4%
Cash-on-Cash Return
2.4%
Cap rate
0.4%
Rent to Value Ratio
Active
$275,000
2
bds
|
2
ba
|
1,688
sqft
|
built
2006
13011 Sandy Key Bnd, North Fort Myers, FL 33903
$-773
Cash flow
-14.7%
Cash-on-Cash Return
2.8%
Cap rate
0.7%
Rent to Value Ratio

Active
$425,000
3
bds
|
3
ba
|
1,964
sqft
|
built
2007
509 Truman Ave, Lehigh Acres, FL 33972
$-401
Cash flow
-4.9%
Cash-on-Cash Return
5.0%
Cap rate
0.7%
Rent to Value Ratio
Active
$450,000
3
bds
|
2.5
ba
|
1,698
sqft
|
built
1940
459 James P Brawley Dr NW, Atlanta, GA 30318
$-1,187
Cash flow
-13.8%
Cash-on-Cash Return
3.0%
Cap rate
0.5%
Rent to Value Ratio
Active
$1,295,000
3
bds
|
3
ba
|
2,131
sqft
|
built
2021
2720 Amaranda Ct, Naples, FL 34114
$-1,963
Cash flow
-7.9%
Cash-on-Cash Return
4.3%
Cap rate
0.6%
Rent to Value Ratio
Active
$495,000
2
bds
|
3
ba
|
2,085
sqft
|
built
1996
203 Via Perignon, Naples, FL 34119
$-862
Cash flow
-9.1%
Cash-on-Cash Return
4.1%
Cap rate
0.6%
Rent to Value Ratio
Active
$325,000
2
bds
|
2
ba
|
912
sqft
|
built
1996
2038 Britley Park Xing, Woodstock, GA 30189
$-776
Cash flow
-12.5%
Cash-on-Cash Return
3.3%
Cap rate
0.5%
Rent to Value Ratio
Active
$430,000
2
bds
|
3
ba
|
1,740
sqft
|
built
2001
3275 Lenox Rd NE, Atlanta, GA 30324
$-1,522
Cash flow
-18.5%
Cash-on-Cash Return
1.9%
Cap rate
0.7%
Rent to Value Ratio