United States Investment Properties for Sale
Browse homes for sale and investment properties in United States. Refine your search by price, property type, or more.
Best cash flowing properties in United States
Active
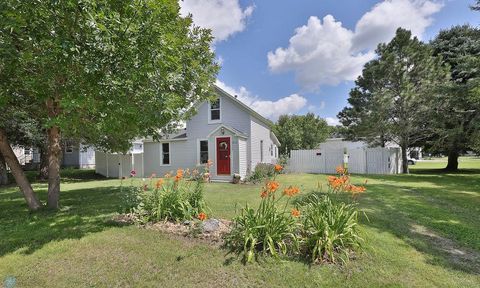
$139,000
2
bds
|
1
ba
|
832
sqft
|
built
1920
812 4th St SE, Barnesville, MN 56514
$223
Cash flow
8.4%
Cash-on-Cash Return
7.6%
Cap rate
1.0%
Rent to Value Ratio
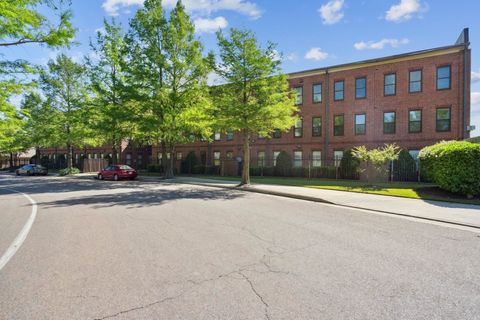
Active
$109,000
1
bds
|
1
ba
|
0
sqft
|
built
2006
720 Litty Ct, Memphis, TN 38103
$68
Cash flow
3.3%
Cash-on-Cash Return
6.4%
Cap rate
1.0%
Rent to Value Ratio
10,000 out of 305,373 properties for sale in United States
Limited Results Shown
Create a free account, or log in to reveal all property listings and enjoy the complete experience.
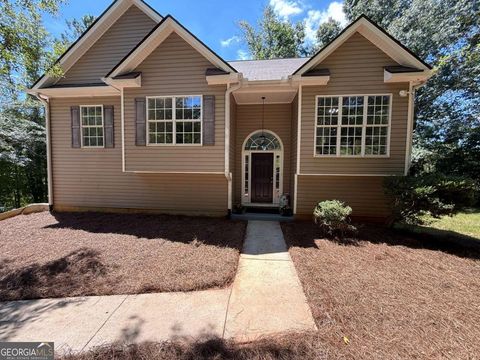
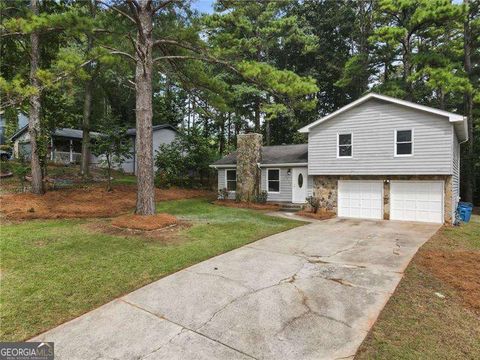
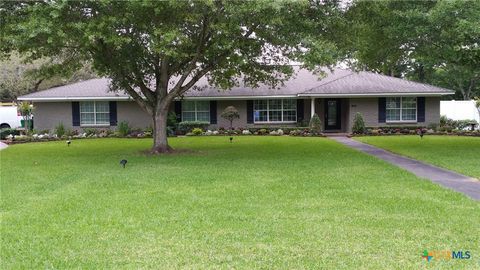
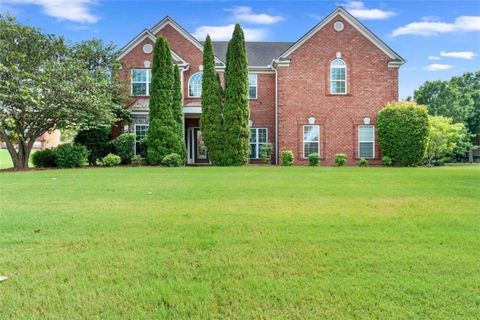
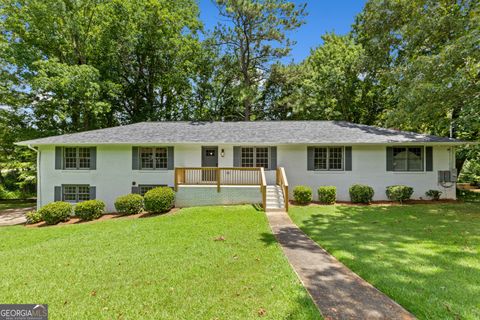
Active
$350,000
5
bds
|
3
ba
|
1,944
sqft
|
built
2002
25 Birch Ridge Ct, Newnan, GA 30265
$-438
Cash flow
-6.5%
Cash-on-Cash Return
4.6%
Cap rate
0.6%
Rent to Value Ratio
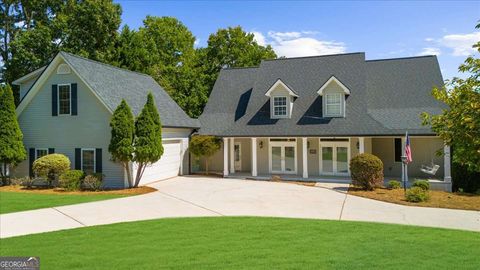
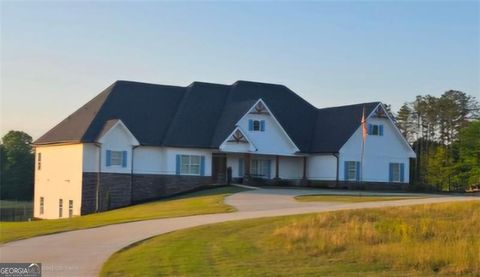
Active
$1,050,000
4
bds
|
2.5
ba
|
3,748
sqft
|
built
1997
3593 Duckett Mill Rd, Gainesville, GA 30506
$-2,564
Cash flow
-12.7%
Cash-on-Cash Return
3.2%
Cap rate
0.5%
Rent to Value Ratio
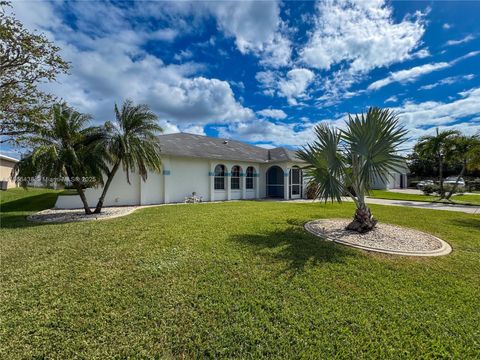
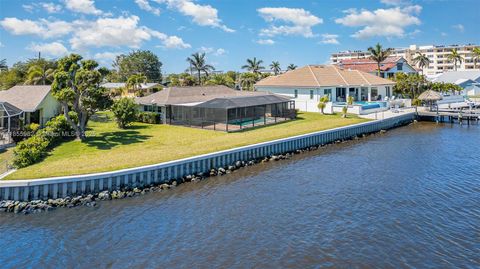
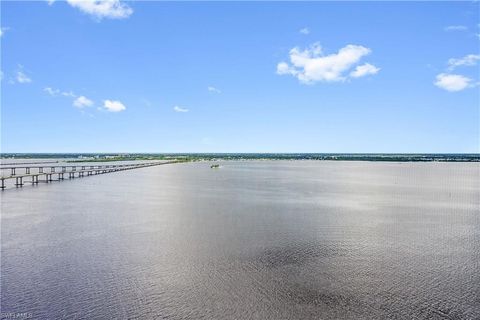
Active
$330,000
3
bds
|
2
ba
|
2,023
sqft
|
built
1998
1403 SE 8th Pl, Cape Coral, FL 33990
$-96
Cash flow
-1.5%
Cash-on-Cash Return
5.8%
Cap rate
0.8%
Rent to Value Ratio
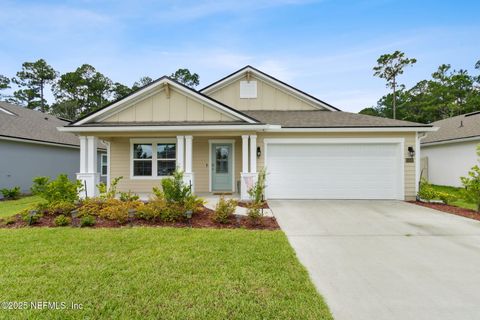
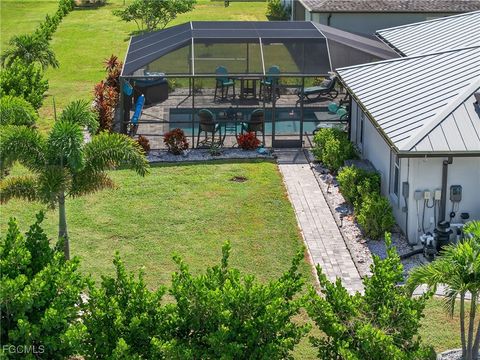
Active
$370,000
3
bds
|
2
ba
|
1,701
sqft
|
built
2023
65688 Edgewater Dr, Yulee, FL 32097
$-748
Cash flow
-10.5%
Cash-on-Cash Return
3.7%
Cap rate
0.7%
Rent to Value Ratio
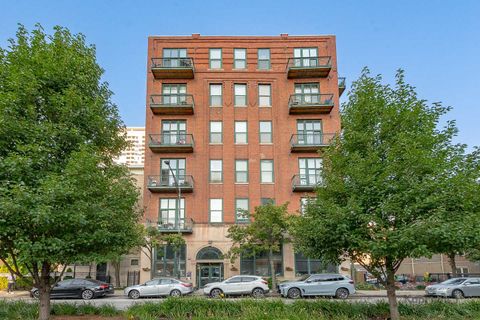
Active
$329,995
1
bds
|
2
ba
|
1,100
sqft
|
built
1905
1632 S Indiana Ave, Chicago, IL 60616
$-700
Cash flow
-11.1%
Cash-on-Cash Return
3.1%
Cap rate
0.8%
Rent to Value Ratio
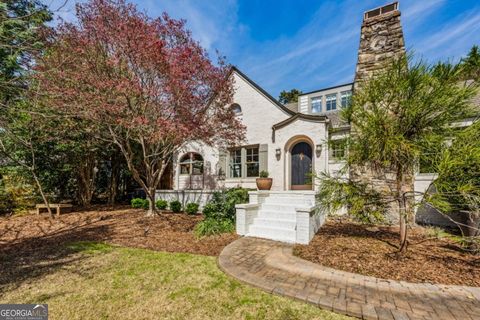
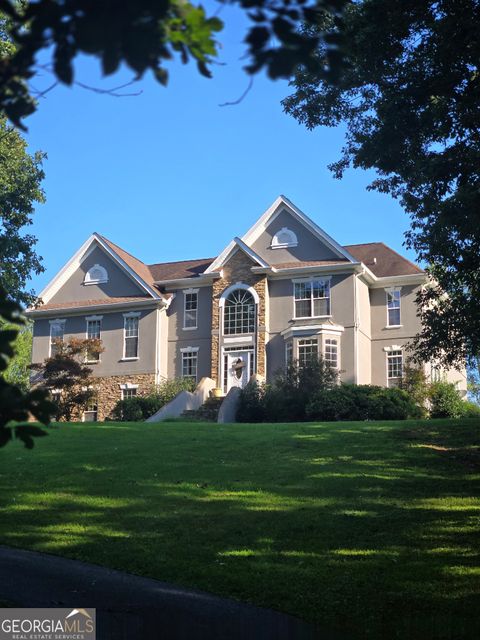
Active
$1,595,000
6
bds
|
5
ba
|
6,140
sqft
|
built
1929
1666 Johnson Rd NE, Atlanta, GA 30306
$-5,843
Cash flow
-19.1%
Cash-on-Cash Return
1.8%
Cap rate
0.4%
Rent to Value Ratio
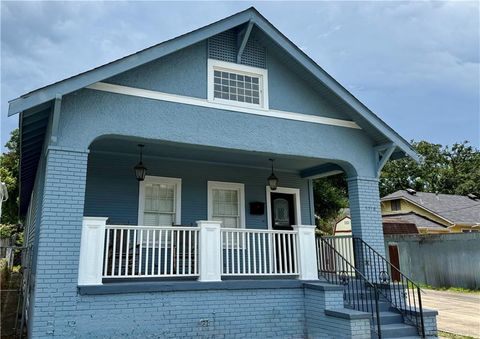
Active
$650,000
3
bds
|
2
ba
|
2,000
sqft
|
built
1925
7518 Zimpel St, New Orleans, LA 70118
$-385
Cash flow
-3.1%
Cash-on-Cash Return
5.0%
Cap rate
0.6%
Rent to Value Ratio
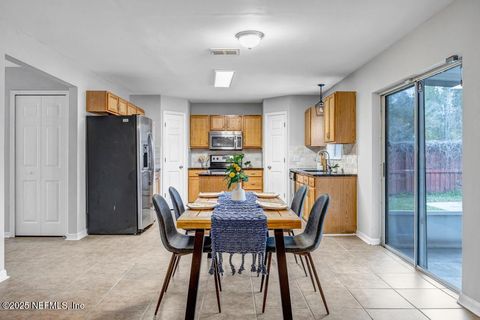
Active
$369,900
5
bds
|
3
ba
|
2,946
sqft
|
built
2005
7193 Rutland Ct, Jacksonville, FL 32219
$-483
Cash flow
-6.8%
Cash-on-Cash Return
4.6%
Cap rate
0.7%
Rent to Value Ratio
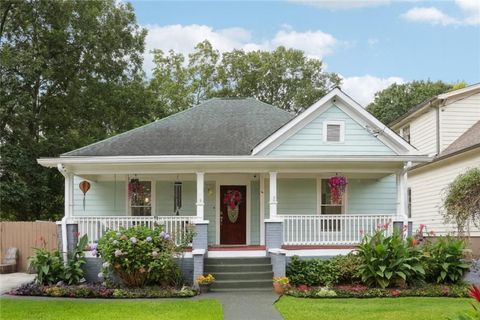
Active
$449,500
4
bds
|
3
ba
|
2,293
sqft
|
built
1920
1292 Eubanks Ave, Atlanta, GA 30344
$-680
Cash flow
-7.9%
Cash-on-Cash Return
4.3%
Cap rate
0.6%
Rent to Value Ratio
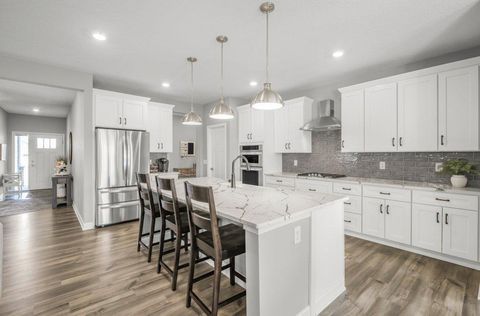
Active
$599,900
3
bds
|
3
ba
|
3,269
sqft
|
built
2022
5201 Ramier Ave NE, Otsego, MN 55374
$-1,089
Cash flow
-9.5%
Cash-on-Cash Return
3.5%
Cap rate
0.6%
Rent to Value Ratio
Active
$219,900
3
bds
|
2
ba
|
0
sqft
|
built
1984
7356 Caribou Trl, Riverdale, GA 30296
$-192
Cash flow
-4.6%
Cash-on-Cash Return
5.1%
Cap rate
0.8%
Rent to Value Ratio

Active
$330,000
4
bds
|
2
ba
|
0
sqft
|
built
1958
4786 Bartlett Rd, Forest Park, GA 30297
$-702
Cash flow
-11.1%
Cash-on-Cash Return
3.6%
Cap rate
0.5%
Rent to Value Ratio

Active
$500,000
4
bds
|
3
ba
|
2,532
sqft
|
built
1947
2206 Morton Ave, Saint Joseph, MI 49085
$-1,233
Cash flow
-12.9%
Cash-on-Cash Return
3.2%
Cap rate
0.6%
Rent to Value Ratio
Active
$1,500,000
2
bds
|
0
ba
|
0
sqft
|
built
1971
1750 Sandy Cir, Cape Coral, FL 33904
$-6,672
Cash flow
-23.2%
Cash-on-Cash Return
0.8%
Cap rate
0.2%
Rent to Value Ratio
Active
$1,500,000
5
bds
|
6
ba
|
7,100
sqft
|
built
2021
433 Clover Dr, Social Circle, GA 30025
$-6,680
Cash flow
-23.2%
Cash-on-Cash Return
0.8%
Cap rate
0.2%
Rent to Value Ratio
Active
$799,000
3
bds
|
3.5
ba
|
2,888
sqft
|
built
1997
257 Mason Rd SE, Calhoun, GA 30701
$-2,539
Cash flow
-16.6%
Cash-on-Cash Return
2.3%
Cap rate
0.4%
Rent to Value Ratio
Active
$375,000
3
bds
|
2
ba
|
2,204
sqft
|
built
2021
229 Blue Oak Blvd, San Marcos, TX 78666
$-1,008
Cash flow
-14.0%
Cash-on-Cash Return
2.5%
Cap rate
0.6%
Rent to Value Ratio
Active
$294,990
4
bds
|
2
ba
|
1,695
sqft
|
built
2017
128 Field Rdg, New Braunfels, TX 78130
$-154
Cash flow
-2.7%
Cash-on-Cash Return
5.1%
Cap rate
0.6%
Rent to Value Ratio
Active
$299,900
3
bds
|
2
ba
|
1,664
sqft
|
built
2019
6968 New Dale Rd, Rex, GA 30273
$-396
Cash flow
-6.9%
Cash-on-Cash Return
4.6%
Cap rate
0.7%
Rent to Value Ratio
Active
$360,000
2
bds
|
1
ba
|
693
sqft
|
built
1961
3968 Mont Blanc Way, Mount Charleston, NV 89124
$-517
Cash flow
-7.5%
Cash-on-Cash Return
4.0%
Cap rate
0.5%
Rent to Value Ratio
Active
$375,000
4
bds
|
3
ba
|
2,482
sqft
|
built
2019
548 Long Leaf Dr, New Braunfels, TX 78130
$-257
Cash flow
-3.6%
Cash-on-Cash Return
4.9%
Cap rate
0.6%
Rent to Value Ratio
Active
$850,000
5
bds
|
3
ba
|
3,518
sqft
|
built
1960
2101 Meadow Ln, El Campo, TX 77437
$-3,790
Cash flow
-23.3%
Cash-on-Cash Return
0.3%
Cap rate
0.3%
Rent to Value Ratio
Active
$419,000
3
bds
|
2
ba
|
1,571
sqft
|
built
2007
2743 1st St, Fort Myers, FL 33916
$-1,127
Cash flow
-14.0%
Cash-on-Cash Return
2.9%
Cap rate
0.5%
Rent to Value Ratio
Active
$465,000
3
bds
|
2
ba
|
1,628
sqft
|
built
2022
25459 Estrada Cir, Punta Gorda, FL 33955
$-1,254
Cash flow
-14.1%
Cash-on-Cash Return
2.9%
Cap rate
0.5%
Rent to Value Ratio
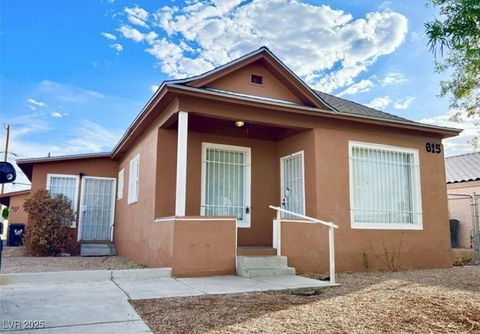
Active
$650,000
3
bds
|
0
ba
|
2,680
sqft
|
built
1942
615 Harrison Ave, Las Vegas, NV 89106
$-2,042
Cash flow
-16.4%
Cash-on-Cash Return
1.9%
Cap rate
0.2%
Rent to Value Ratio
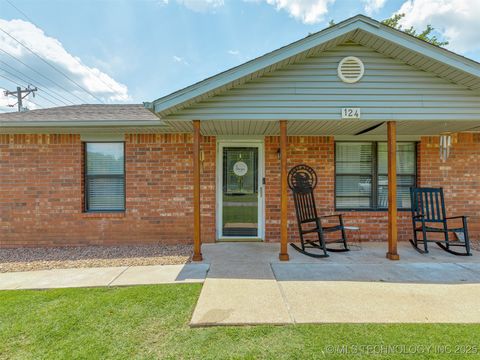
Active
$205,000
3
bds
|
2
ba
|
1,377
sqft
|
built
1994
124 S 5th Ave, Stroud, OK 74079
$-125
Cash flow
-3.2%
Cash-on-Cash Return
4.9%
Cap rate
0.7%
Rent to Value Ratio
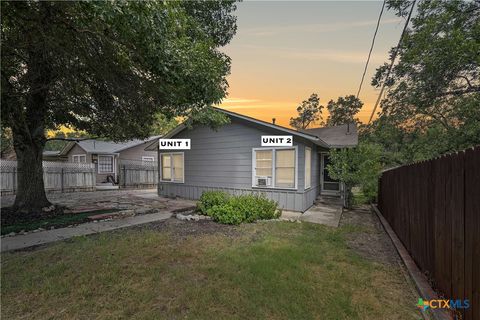
Active
$310,000
2
bds
|
2
ba
|
1,191
sqft
|
built
1948
640 Lee St, New Braunfels, TX 78130
$-750
Cash flow
-12.6%
Cash-on-Cash Return
2.8%
Cap rate
0.5%
Rent to Value Ratio
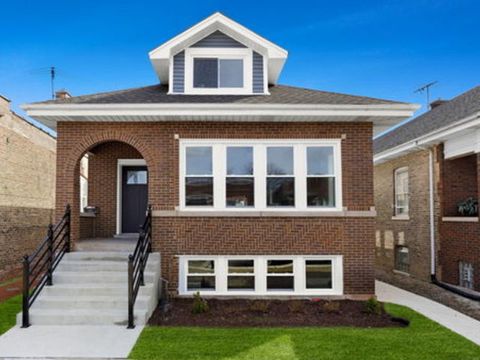
Active
$449,000
3
bds
|
2
ba
|
3,600
sqft
|
built
1918
2407 S 60th Ct, Cicero, IL 60804
$-603
Cash flow
-7.0%
Cash-on-Cash Return
4.1%
Cap rate
0.5%
Rent to Value Ratio
Active
$520,000
4
bds
|
3
ba
|
3,279
sqft
|
built
2006
4201 Donington Way, Hampton, GA 30228
$-1,643
Cash flow
-16.5%
Cash-on-Cash Return
2.4%
Cap rate
0.5%
Rent to Value Ratio
Active
$399,900
3
bds
|
3
ba
|
1,912
sqft
|
built
1974
3061 Balearic Dr SE, Marietta, GA 30067
$-1,140
Cash flow
-14.9%
Cash-on-Cash Return
2.7%
Cap rate
0.6%
Rent to Value Ratio
Active
$1,790,000
7
bds
|
8
ba
|
4,905
sqft
|
built
1996
1210 Whispering Woods Trl, New Braunfels, TX 78132
$-6,895
Cash flow
-20.1%
Cash-on-Cash Return
1.1%
Cap rate
0.2%
Rent to Value Ratio
Active
$1,275,000
4
bds
|
6
ba
|
3,932
sqft
|
built
2022
541 Cantera Rdg, New Braunfels, TX 78132
$-1,716
Cash flow
-7.0%
Cash-on-Cash Return
4.1%
Cap rate
0.5%
Rent to Value Ratio
Active
$449,000
3
bds
|
3
ba
|
2,571
sqft
|
built
2012
4902 Brooklyn Ln, Eagan, MN 55123
$-1,080
Cash flow
-12.5%
Cash-on-Cash Return
2.8%
Cap rate
0.6%
Rent to Value Ratio
Active
$374,900
3
bds
|
3
ba
|
1,550
sqft
|
built
1900
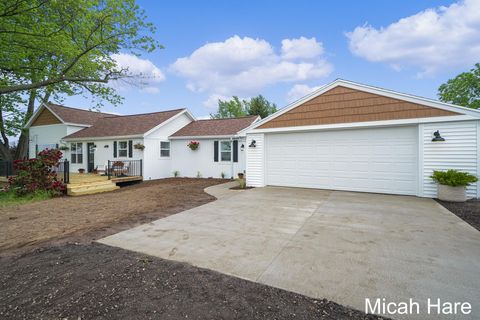
3054 Sehler St, Conklin, MI 49403
$-678
Cash flow
-9.4%
Cash-on-Cash Return
4.0%
Cap rate
0.5%
Rent to Value Ratio
Active
$750,000
8
bds
|
5.5
ba
|
4,640
sqft
|
built
1979
530 Shay Dr SW, Marietta, GA 30060
$-2,637
Cash flow
-18.3%
Cash-on-Cash Return
1.9%
Cap rate
0.3%
Rent to Value Ratio
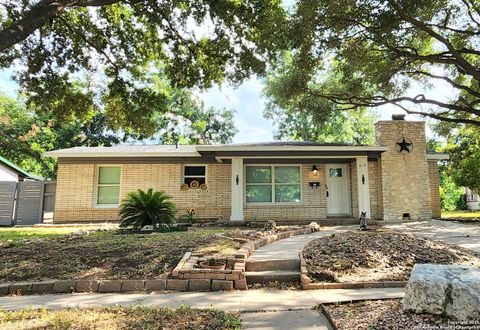
Active
$285,000
4
bds
|
2
ba
|
1,340
sqft
|
built
1954
618 Storeywood Dr, San Antonio, TX 78213
$-668
Cash flow
-12.2%
Cash-on-Cash Return
2.9%
Cap rate
0.6%
Rent to Value Ratio
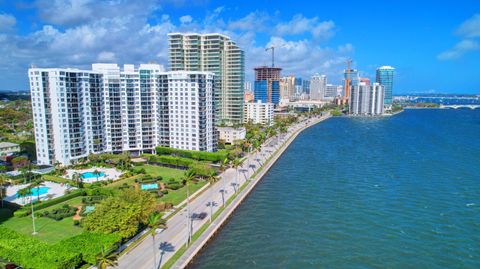
Active
$799,000
2
bds
|
2
ba
|
1,350
sqft
|
built
1973
1701 S Flagler Dr, West Palm Beach, FL 33401
$-2,895
Cash flow
-18.9%
Cash-on-Cash Return
1.8%
Cap rate
0.7%
Rent to Value Ratio
Active
$274,900
3
bds
|
2
ba
|
1,086
sqft
|
built
1959
3051 Wilce Ave, Columbus, OH 43202
$-203
Cash flow
-3.9%
Cash-on-Cash Return
4.8%
Cap rate
0.7%
Rent to Value Ratio