Indiana Investment Properties for Sale
Browse homes for sale and investment properties in Indiana. Refine your search by price, property type, or more.
Best cash flowing properties in Indiana
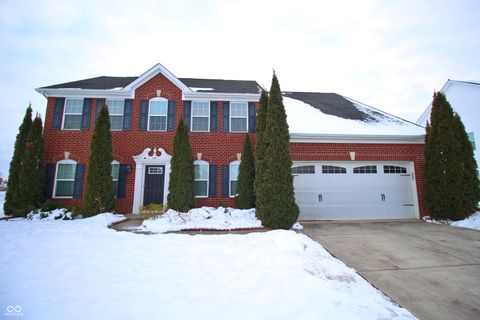
Active
$924,900
4
bds
|
6
ba
|
5,611
sqft
|
built
1970
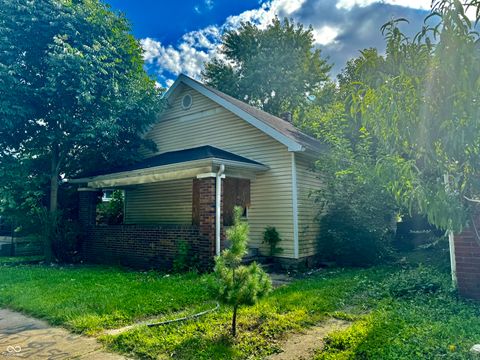
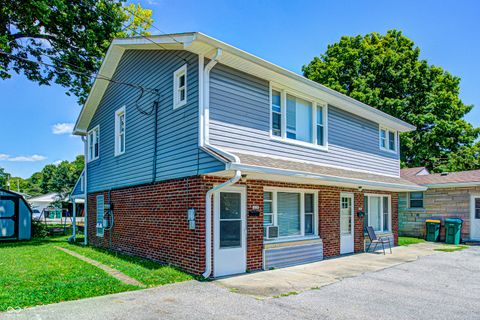
4339 Royal Pine Blvd, Indianapolis, IN 46250
$764
Cash flow
4.3%
Cash-on-Cash Return
7.1%
Cap rate
0.9%
Rent to Value Ratio

Active
$254,900
5
bds
|
2
ba
|
4,147
sqft
|
built
1890
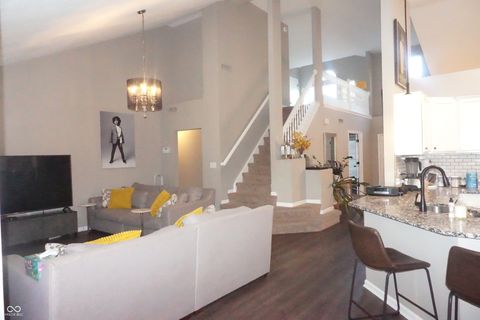
214 S Howard St, Oxford, IN 47971
$626
Cash flow
12.8%
Cash-on-Cash Return
9.1%
Cap rate
1.1%
Rent to Value Ratio
3,523 out of 4,356 properties for sale in Indiana
Limited Results Shown
Create a free account, or log in to reveal all property listings and enjoy the complete experience.
Active
$285,000
4
bds
|
2
ba
|
1,610
sqft
|
built
1975
745 W Banta Rd, Indianapolis, IN 46217
$-242
Cash flow
-4.4%
Cash-on-Cash Return
5.1%
Cap rate
0.6%
Rent to Value Ratio

Active
$270,000
3
bds
|
3
ba
|
1,938
sqft
|
built
1950
1641 Iowa St, Indianapolis, IN 46203
$-3
Cash flow
-0.1%
Cash-on-Cash Return
6.1%
Cap rate
0.7%
Rent to Value Ratio
Active
$222,500
4
bds
|
1
ba
|
1,864
sqft
|
built
1898
410 E Plum St, Frankton, IN 46044
$33
Cash flow
0.8%
Cash-on-Cash Return
6.3%
Cap rate
0.8%
Rent to Value Ratio

Active
$515,000
4
bds
|
3
ba
|
3,401
sqft
|
built
1992
12082 Old Stone Dr, Indianapolis, IN 46236
$-813
Cash flow
-8.2%
Cash-on-Cash Return
4.3%
Cap rate
0.5%
Rent to Value Ratio
Active
$179,900
2
bds
|
1
ba
|
1,158
sqft
|
built
1958
220 Monroe St, Indianapolis, IN 46229
$-163
Cash flow
-4.7%
Cash-on-Cash Return
5.1%
Cap rate
0.6%
Rent to Value Ratio
Active
$400,000
5
bds
|
3
ba
|
2,560
sqft
|
built
2013
1169 Richmond Ln, Greenwood, IN 46143
$-357
Cash flow
-4.7%
Cash-on-Cash Return
5.1%
Cap rate
0.6%
Rent to Value Ratio
Active
$249,000
3
bds
|
2
ba
|
1,132
sqft
|
built
2007
4195 Knollwood Ct, Franklin, IN 46131
$-103
Cash flow
-2.2%
Cash-on-Cash Return
5.7%
Cap rate
0.7%
Rent to Value Ratio

Active
$159,900
2
bds
|
1
ba
|
900
sqft
|
built
1950
3723 N Olney St, Indianapolis, IN 46218
$9
Cash flow
0.3%
Cash-on-Cash Return
6.2%
Cap rate
0.8%
Rent to Value Ratio

Active
$85,000
2
bds
|
1
ba
|
1,041
sqft
|
built
1925
3610 Robson St, Indianapolis, IN 46201
$324
Cash flow
19.9%
Cash-on-Cash Return
10.7%
Cap rate
1.3%
Rent to Value Ratio

Active
$340,000
2
bds
|
2
ba
|
1,713
sqft
|
built
1920
1344 Barth Ave, Indianapolis, IN 46203
$190
Cash flow
2.9%
Cash-on-Cash Return
6.8%
Cap rate
0.8%
Rent to Value Ratio
Active
$450,000
3
bds
|
3
ba
|
2,932
sqft
|
built
1991
7305 W Saint Andrews Ave, Yorktown, IN 47396
$-524
Cash flow
-6.1%
Cash-on-Cash Return
4.7%
Cap rate
0.6%
Rent to Value Ratio
Active
$265,000
3
bds
|
2
ba
|
1,720
sqft
|
built
1946
1601 Southern Ave, Beech Grove, IN 46107
$-115
Cash flow
-2.3%
Cash-on-Cash Return
5.6%
Cap rate
0.7%
Rent to Value Ratio

Active
$209,900
3
bds
|
2
ba
|
1,038
sqft
|
built
1942
1641 Deloss St, Indianapolis, IN 46201
$-178
Cash flow
-4.4%
Cash-on-Cash Return
5.1%
Cap rate
0.6%
Rent to Value Ratio
Active
$239,900
2
bds
|
3
ba
|
1,549
sqft
|
built
1983
4635 Stansbury Ct, Indianapolis, IN 46254
$-244
Cash flow
-5.3%
Cash-on-Cash Return
4.9%
Cap rate
0.8%
Rent to Value Ratio
Active
$679,900
4
bds
|
3
ba
|
4,386
sqft
|
built
1992
1066 N Dogwood Way, Greenfield, IN 46140
$-1,569
Cash flow
-12.0%
Cash-on-Cash Return
3.4%
Cap rate
0.4%
Rent to Value Ratio

Active
$185,000
0
bds
|
0
ba
|
0
sqft
|
built
1900
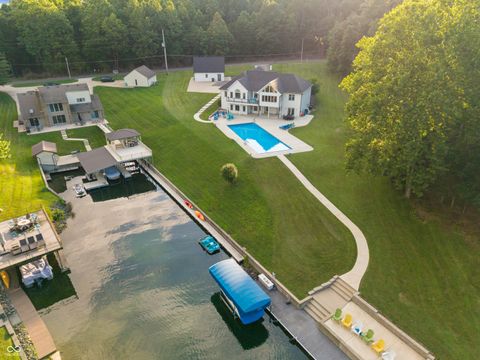
221 S State Ave, Indianapolis, IN 46201
$-258
Cash flow
-7.3%
Cash-on-Cash Return
4.5%
Cap rate
0.5%
Rent to Value Ratio
Active
$925,000
5
bds
|
5
ba
|
6,466
sqft
|
built
2005
1104 W Greencastle Rd, Mooresville, IN 46158
$-1,357
Cash flow
-7.7%
Cash-on-Cash Return
4.4%
Cap rate
0.5%
Rent to Value Ratio
Active
$164,000
2
bds
|
1
ba
|
978
sqft
|
built
1930
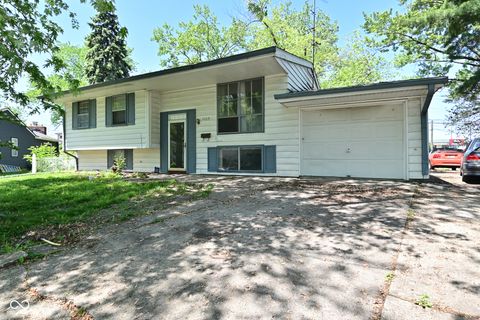
205 N Jackson St, Greencastle, IN 46135
$57
Cash flow
1.8%
Cash-on-Cash Return
6.6%
Cap rate
0.8%
Rent to Value Ratio
Active
$114,900
2
bds
|
1
ba
|
1,008
sqft
|
built
1911
642 N Oxford St, Indianapolis, IN 46201
$101
Cash flow
4.6%
Cash-on-Cash Return
7.2%
Cap rate
0.9%
Rent to Value Ratio
Active
$344,900
3
bds
|
3
ba
|
2,553
sqft
|
built
1999
6422 Hollingsworth Dr, Indianapolis, IN 46268
$-135
Cash flow
-2.0%
Cash-on-Cash Return
5.7%
Cap rate
0.7%
Rent to Value Ratio

Active
$220,000
5
bds
|
3
ba
|
4,430
sqft
|
built
1890
538 W Taylor St, Kokomo, IN 46901
$253
Cash flow
6.0%
Cash-on-Cash Return
7.5%
Cap rate
0.9%
Rent to Value Ratio

Active
$524,900
4
bds
|
3
ba
|
3,325
sqft
|
built
1992
4416 Lakeshore Dr, Kokomo, IN 46901
$-882
Cash flow
-8.8%
Cash-on-Cash Return
4.1%
Cap rate
0.5%
Rent to Value Ratio
Active
$1,990,000
4
bds
|
4
ba
|
4,378
sqft
|
built
2007
5181 S Poplar Dr, Columbus, IN 47201
$-5,919
Cash flow
-15.5%
Cash-on-Cash Return
2.6%
Cap rate
0.3%
Rent to Value Ratio
Active
$205,000
4
bds
|
2
ba
|
2,034
sqft
|
built
1962
3668 Chatsbee Ct, Indianapolis, IN 46224
$192
Cash flow
4.9%
Cash-on-Cash Return
7.3%
Cap rate
0.9%
Rent to Value Ratio
Active
$245,000
2
bds
|
0
ba
|
0
sqft
|
built
1950
312 Short St, Plainfield, IN 46168
$-496
Cash flow
-10.6%
Cash-on-Cash Return
3.7%
Cap rate
0.4%
Rent to Value Ratio
Active
$130,000
2
bds
|
1
ba
|
1,434
sqft
|
built
1906
52 Home Ave, Terre Haute, IN 47803
$438
Cash flow
17.6%
Cash-on-Cash Return
10.2%
Cap rate
1.2%
Rent to Value Ratio

Active
$244,900
3
bds
|
1
ba
|
2,092
sqft
|
built
1956
2445 S Bolton Ave, Indianapolis, IN 46203
$-151
Cash flow
-3.2%
Cash-on-Cash Return
5.4%
Cap rate
0.7%
Rent to Value Ratio
Active
$265,000
3
bds
|
2
ba
|
1,370
sqft
|
built
1965
2630 Wedgewood Dr, Columbus, IN 47203
$-184
Cash flow
-3.6%
Cash-on-Cash Return
5.3%
Cap rate
0.6%
Rent to Value Ratio

Active
$299,000
4
bds
|
3
ba
|
2,783
sqft
|
built
1937
1618 Villa Ave, Indianapolis, IN 46203
$-14
Cash flow
-0.2%
Cash-on-Cash Return
6.1%
Cap rate
0.7%
Rent to Value Ratio
Active
$600,000
2
bds
|
1
ba
|
2,500
sqft
|
built
1984
15123 E 196th St, Noblesville, IN 46060
$-1,141
Cash flow
-9.9%
Cash-on-Cash Return
3.9%
Cap rate
0.5%
Rent to Value Ratio

Active
$194,900
3
bds
|
2
ba
|
1,650
sqft
|
built
1920
1018 Jefferson Ave, Indianapolis, IN 46201
$106
Cash flow
2.8%
Cash-on-Cash Return
6.8%
Cap rate
0.8%
Rent to Value Ratio
Active
$309,900
3
bds
|
2
ba
|
1,752
sqft
|
built
1994
959 Harvest Ridge Dr, Avon, IN 46123
$-228
Cash flow
-3.8%
Cash-on-Cash Return
5.3%
Cap rate
0.6%
Rent to Value Ratio
Active
$425,000
3
bds
|
3
ba
|
2,007
sqft
|
built
2021
2720 Guilford Ave, Indianapolis, IN 46205
$-38
Cash flow
-0.5%
Cash-on-Cash Return
6.0%
Cap rate
0.7%
Rent to Value Ratio
Active
$288,000
3
bds
|
2
ba
|
1,504
sqft
|
built
2015
1056 Hilltop Commons Blvd, Whiteland, IN 46184
$-308
Cash flow
-5.6%
Cash-on-Cash Return
4.9%
Cap rate
0.6%
Rent to Value Ratio
Active
$379,900
3
bds
|
4
ba
|
2,728
sqft
|
built
2020
8266 Glacier Ridge Dr, Fishers, IN 46038
$-164
Cash flow
-2.3%
Cash-on-Cash Return
5.6%
Cap rate
0.7%
Rent to Value Ratio

Active
$249,900
2
bds
|
2
ba
|
1,500
sqft
|
built
1974
102 Knoll Ct, Noblesville, IN 46062
$-552
Cash flow
-11.5%
Cash-on-Cash Return
3.5%
Cap rate
0.7%
Rent to Value Ratio

Active
$75,000
3
bds
|
1
ba
|
1,201
sqft
|
built
1925
1203 E 27th St, Anderson, IN 46016
$513
Cash flow
35.7%
Cash-on-Cash Return
14.4%
Cap rate
1.7%
Rent to Value Ratio
Active
$218,700
3
bds
|
4
ba
|
1,716
sqft
|
built
1983
8054 Harvest Ln, Indianapolis, IN 46256
$398
Cash flow
9.5%
Cash-on-Cash Return
8.3%
Cap rate
1.0%
Rent to Value Ratio