Indiana Investment Properties for Sale
Browse homes for sale and investment properties in Indiana. Refine your search by price, property type, or more.
Best cash flowing properties in Indiana

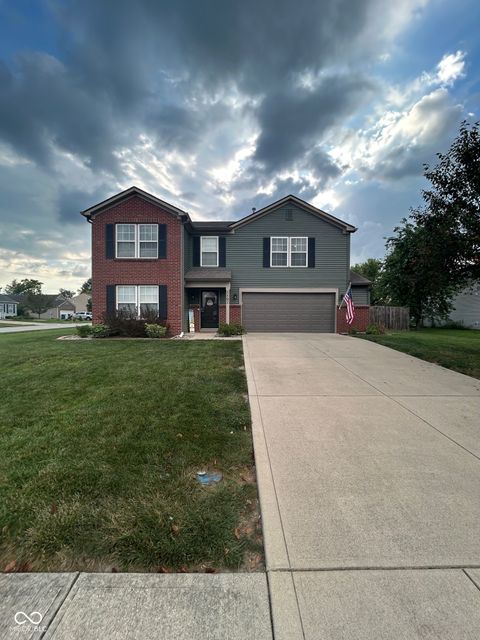
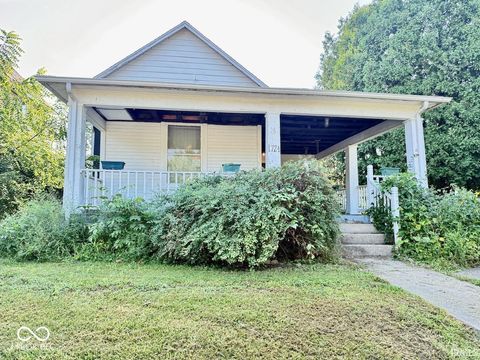
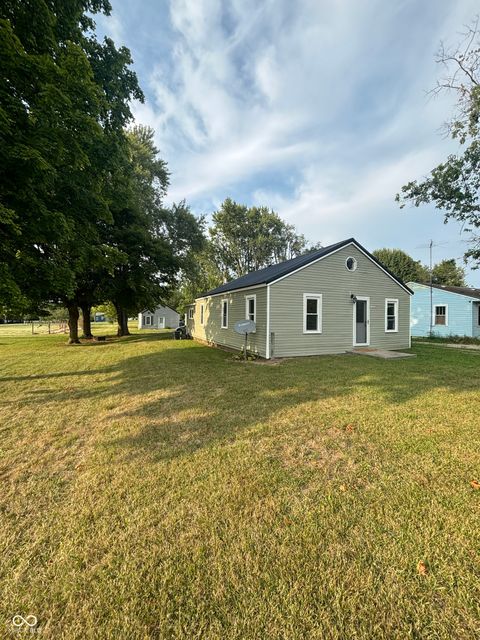
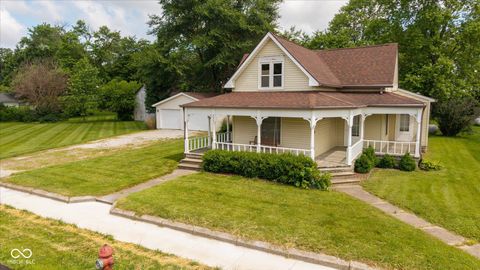
Active
$229,000
4
bds
|
4
ba
|
3,628
sqft
|
built
1849
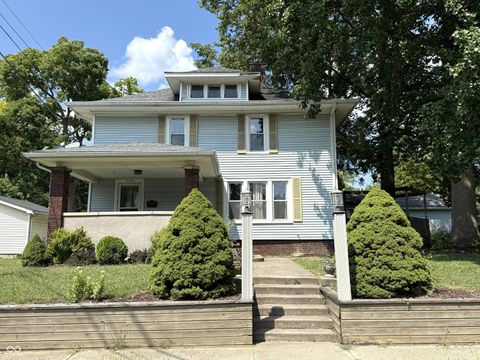
311 W 8th St, Anderson, IN 46016
$828
Cash flow
18.9%
Cash-on-Cash Return
10.5%
Cap rate
1.3%
Rent to Value Ratio

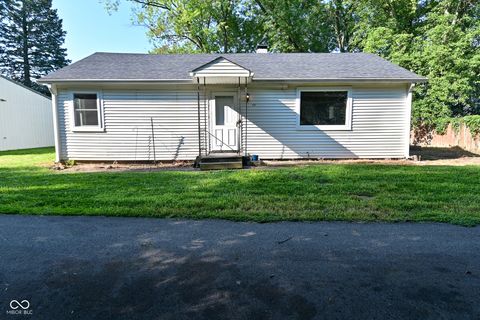
Active
$68,000
2
bds
|
1
ba
|
1,554
sqft
|
built
1885
2016 Jefferson St, Anderson, IN 46016
$828
Cash flow
14.2%
Cash-on-Cash Return
14.6%
Cap rate
1.8%
Rent to Value Ratio
3,610 out of 4,456 properties for sale in Indiana
Limited Results Shown
Create a free account, or log in to reveal all property listings and enjoy the complete experience.
Active
$324,900
4
bds
|
3
ba
|
2,678
sqft
|
built
2004
5502 Breaburn Rd, Bargersville, IN 46106
$-171
Cash flow
-2.7%
Cash-on-Cash Return
5.5%
Cap rate
0.7%
Rent to Value Ratio
Active
$180,000
3
bds
|
2
ba
|
1,801
sqft
|
built
1972
6408 Rosalind Ln, Anderson, IN 46013
$251
Cash flow
7.3%
Cash-on-Cash Return
7.8%
Cap rate
0.9%
Rent to Value Ratio

Active
$55,000
1
bds
|
1
ba
|
480
sqft
|
built
1940
1711 E Lynn St, Anderson, IN 46016
$414
Cash flow
8.8%
Cash-on-Cash Return
9.0%
Cap rate
1.1%
Rent to Value Ratio
Active
$225,000
2
bds
|
2
ba
|
2,168
sqft
|
built
1956
901 Fremont Dr, Anderson, IN 46012
$-187
Cash flow
-4.3%
Cash-on-Cash Return
5.2%
Cap rate
0.6%
Rent to Value Ratio
Active
$214,000
2
bds
|
2
ba
|
1,414
sqft
|
built
1997
1015 Plaza Dr, Martinsville, IN 46151
$-306
Cash flow
-7.5%
Cash-on-Cash Return
4.4%
Cap rate
0.7%
Rent to Value Ratio
Active
$395,000
3
bds
|
2
ba
|
2,060
sqft
|
built
2016
6752 Shooting Star Dr, Whitestown, IN 46075
$-345
Cash flow
-4.6%
Cash-on-Cash Return
5.1%
Cap rate
0.6%
Rent to Value Ratio

Active
$117,000
3
bds
|
1
ba
|
864
sqft
|
built
1950
710 Henry St, Anderson, IN 46016
$298
Cash flow
13.3%
Cash-on-Cash Return
9.2%
Cap rate
1.1%
Rent to Value Ratio

Active
$419,900
5
bds
|
3
ba
|
2,760
sqft
|
built
2022
47 Lively Pl, Cicero, IN 46034
$-400
Cash flow
-5.0%
Cash-on-Cash Return
5.0%
Cap rate
0.6%
Rent to Value Ratio
Active
$285,000
3
bds
|
2
ba
|
1,504
sqft
|
built
1961
1226 E 600 N, Alexandria, IN 46001
$-356
Cash flow
-6.5%
Cash-on-Cash Return
4.6%
Cap rate
0.6%
Rent to Value Ratio
Active
$445,000
5
bds
|
3
ba
|
2,708
sqft
|
built
2019
7264 W Beyers Ct, New Palestine, IN 46163
$-381
Cash flow
-4.5%
Cash-on-Cash Return
5.1%
Cap rate
0.6%
Rent to Value Ratio

Active
$204,900
4
bds
|
2
ba
|
2,073
sqft
|
built
1953
9945 N 125 W, Fortville, IN 46040
$468
Cash flow
11.9%
Cash-on-Cash Return
8.9%
Cap rate
1.1%
Rent to Value Ratio
Active
$350,000
3
bds
|
2
ba
|
1,598
sqft
|
built
2012
4627 Belair Cir, Plainfield, IN 46168
$-433
Cash flow
-6.5%
Cash-on-Cash Return
4.7%
Cap rate
0.6%
Rent to Value Ratio

Active
$624,900
5
bds
|
4
ba
|
3,999
sqft
|
built
1974
3425 S Garrison Chapel Rd, Bloomington, IN 47403
$-717
Cash flow
-6.0%
Cash-on-Cash Return
4.8%
Cap rate
0.6%
Rent to Value Ratio
Active
$489,900
4
bds
|
3
ba
|
4,228
sqft
|
built
2022
2659 Dorset Dr, Plainfield, IN 46168
$-337
Cash flow
-3.6%
Cash-on-Cash Return
5.3%
Cap rate
0.7%
Rent to Value Ratio
Active
$299,000
2
bds
|
2
ba
|
1,360
sqft
|
built
2010
4908 W Harrisburg Ct, New Palestine, IN 46163
$-398
Cash flow
-6.9%
Cash-on-Cash Return
4.6%
Cap rate
0.7%
Rent to Value Ratio
Active
$485,000
3
bds
|
3
ba
|
2,048
sqft
|
built
1955
568 Mc Gee Rd, Nashville, IN 47448
$-1,587
Cash flow
-17.1%
Cash-on-Cash Return
2.2%
Cap rate
0.3%
Rent to Value Ratio

Active
$1,079,000
4
bds
|
3
ba
|
2,635
sqft
|
built
1993
3718 S County Road 101 E, Clayton, IN 46118
$-3,595
Cash flow
-17.4%
Cash-on-Cash Return
2.1%
Cap rate
0.3%
Rent to Value Ratio
Active
$294,900
4
bds
|
3
ba
|
2,357
sqft
|
built
1999
919 Charnwood Pkwy, Beech Grove, IN 46107
$-149
Cash flow
-2.6%
Cash-on-Cash Return
5.5%
Cap rate
0.7%
Rent to Value Ratio
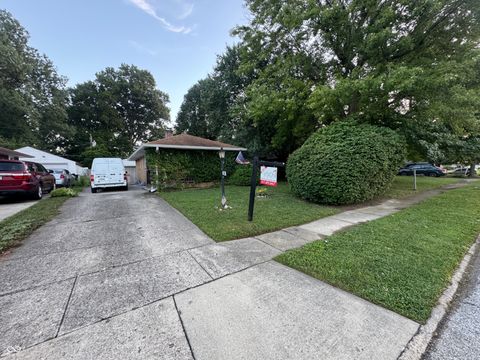
Active
$70,000
2
bds
|
1
ba
|
1,134
sqft
|
built
1910
1724 S Elm St, Muncie, IN 47302
$690
Cash flow
11.5%
Cash-on-Cash Return
11.8%
Cap rate
1.4%
Rent to Value Ratio
Active
$240,000
3
bds
|
2
ba
|
1,001
sqft
|
built
1956
2067 Mann Dr, Beech Grove, IN 46107
$13
Cash flow
0.3%
Cash-on-Cash Return
6.2%
Cap rate
0.8%
Rent to Value Ratio
Active
$135,000
3
bds
|
2
ba
|
1,404
sqft
|
built
1964
12249 N 300 E, Alexandria, IN 46001
$274
Cash flow
10.6%
Cash-on-Cash Return
8.6%
Cap rate
1.0%
Rent to Value Ratio
Active
$377,376
3
bds
|
2
ba
|
1,427
sqft
|
built
1972
3070 S 575 E, Whitestown, IN 46075
$-553
Cash flow
-7.6%
Cash-on-Cash Return
4.4%
Cap rate
0.5%
Rent to Value Ratio

Active
$465,000
5
bds
|
3
ba
|
2,451
sqft
|
built
1995
809 Red Oaks Ln, Lafayette, IN 47909
$-450
Cash flow
-5.0%
Cash-on-Cash Return
5.0%
Cap rate
0.6%
Rent to Value Ratio
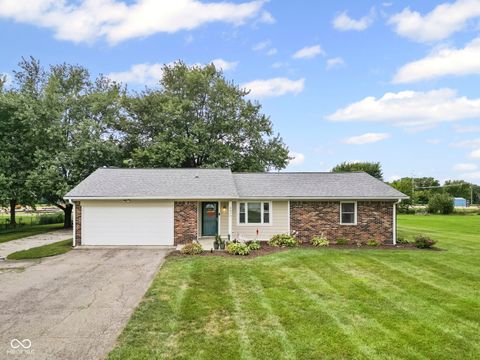
Active
$118,900
4
bds
|
2
ba
|
1,227
sqft
|
built
1930
3900 N Bellaire Ave, Muncie, IN 47303
$12
Cash flow
0.5%
Cash-on-Cash Return
6.3%
Cap rate
0.8%
Rent to Value Ratio
Active
$399,500
2
bds
|
3
ba
|
2,526
sqft
|
built
1970
10296 N State Road 13, Elwood, IN 46036
$-528
Cash flow
-6.9%
Cash-on-Cash Return
4.6%
Cap rate
0.6%
Rent to Value Ratio

Active
$220,000
3
bds
|
1
ba
|
1,068
sqft
|
built
1997
124 Meadow Creek South Dr, Whiteland, IN 46184
$-23
Cash flow
-0.5%
Cash-on-Cash Return
6.0%
Cap rate
0.7%
Rent to Value Ratio

Active
$129,900
2
bds
|
1
ba
|
1,386
sqft
|
built
1935
3276 W 400 S, Trafalgar, IN 46181
$301
Cash flow
12.1%
Cash-on-Cash Return
8.9%
Cap rate
1.1%
Rent to Value Ratio

Active
$97,900
2
bds
|
1
ba
|
1,067
sqft
|
built
1900
8110 S Edwards Ave, Daleville, IN 47334
$327
Cash flow
17.4%
Cash-on-Cash Return
10.1%
Cap rate
1.2%
Rent to Value Ratio
Active
$189,500
3
bds
|
2
ba
|
1,486
sqft
|
built
1953
2901 W North St, Muncie, IN 47304
$202
Cash flow
5.6%
Cash-on-Cash Return
7.4%
Cap rate
0.9%
Rent to Value Ratio
Active
$725,000
5
bds
|
4
ba
|
4,492
sqft
|
built
1977
2994 W State Road 32, Crawfordsville, IN 47933
$-1,575
Cash flow
-11.3%
Cash-on-Cash Return
3.5%
Cap rate
0.4%
Rent to Value Ratio

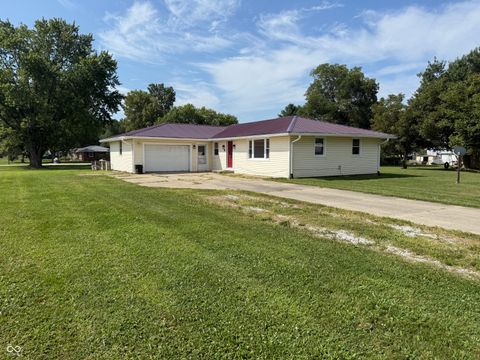
Active
$140,000
3
bds
|
1
ba
|
950
sqft
|
built
1965
307 N Blake St, Sheridan, IN 46069
$387
Cash flow
14.4%
Cash-on-Cash Return
9.5%
Cap rate
1.1%
Rent to Value Ratio
Active
$238,000
3
bds
|
2
ba
|
2,708
sqft
|
built
1900
206 W Wall St, Advance, IN 46102
$161
Cash flow
3.5%
Cash-on-Cash Return
7.0%
Cap rate
0.8%
Rent to Value Ratio
Active
$195,000
2
bds
|
1
ba
|
960
sqft
|
built
1956
111 Ben Hur St, Lizton, IN 46149
$105
Cash flow
2.8%
Cash-on-Cash Return
6.8%
Cap rate
0.8%
Rent to Value Ratio
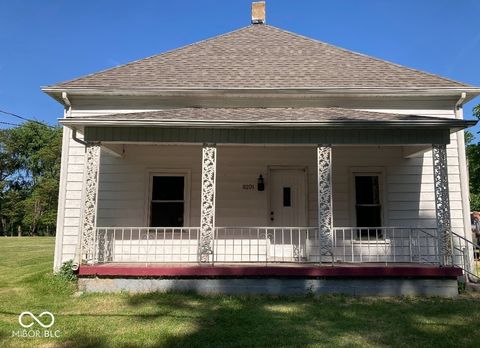
Active
$140,000
3
bds
|
1
ba
|
1,631
sqft
|
built
1900
8201 N Baldwin St, Brazil, IN 47834
$42
Cash flow
1.6%
Cash-on-Cash Return
6.5%
Cap rate
0.8%
Rent to Value Ratio
Active
$245,000
3
bds
|
2
ba
|
1,988
sqft
|
built
1956
1419 Danville Ave, Crawfordsville, IN 47933
$-151
Cash flow
-3.2%
Cash-on-Cash Return
5.4%
Cap rate
0.7%
Rent to Value Ratio

Active
$235,000
4
bds
|
3
ba
|
2,211
sqft
|
built
1969
2922 Bagley Dr W, Kokomo, IN 46902
$38
Cash flow
0.8%
Cash-on-Cash Return
6.3%
Cap rate
0.8%
Rent to Value Ratio

Active
$169,900
1
bds
|
2
ba
|
788
sqft
|
built
1948
14009 W Daleville Rd, Daleville, IN 47334
$303
Cash flow
9.3%
Cash-on-Cash Return
8.3%
Cap rate
1.0%
Rent to Value Ratio
Active
$284,900
5
bds
|
4
ba
|
3,032
sqft
|
built
1900
206 E Franklin St, Crawfordsville, IN 47933
$-79
Cash flow
-1.4%
Cash-on-Cash Return
5.8%
Cap rate
0.7%
Rent to Value Ratio