United States Investment Properties for Sale
Browse homes for sale and investment properties in United States. Refine your search by price, property type, or more.
Best cash flowing properties in United States
Active
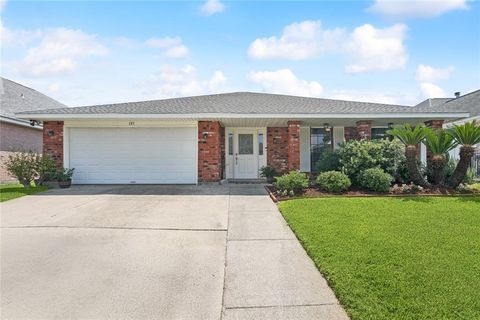
$345,000
3
bds
|
2
ba
|
1,994
sqft
|
built
1982
107 Sirius Ln, Slidell, LA 70458
$299
Cash flow
4.5%
Cash-on-Cash Return
6.7%
Cap rate
0.8%
Rent to Value Ratio
Active
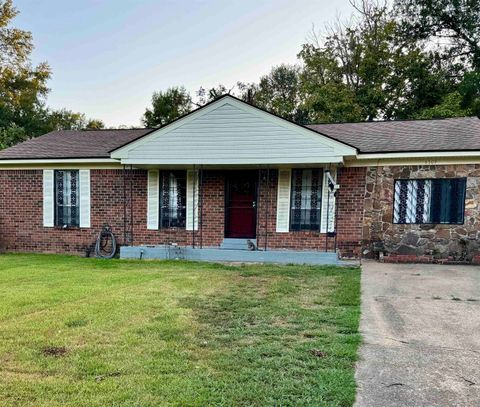
$110,000
3
bds
|
1
ba
|
0
sqft
|
built
1970
4509 Double Tree Rd, Memphis, TN 38109
$209
Cash flow
9.9%
Cash-on-Cash Return
8.0%
Cap rate
1.1%
Rent to Value Ratio
10,000 out of 305,373 properties for sale in United States
Limited Results Shown
Create a free account, or log in to reveal all property listings and enjoy the complete experience.
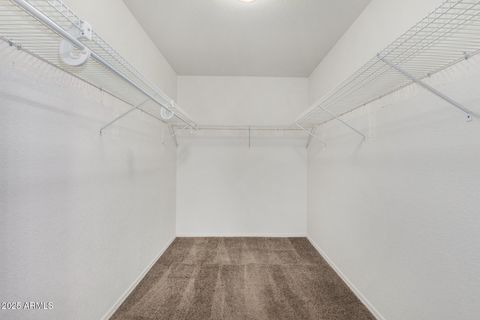
Active
$400,000
3
bds
|
2
ba
|
2,171
sqft
|
built
2002
33154 N Cherry Creek Rd, San Tan Valley, AZ 85144
$-600
Cash flow
-7.8%
Cash-on-Cash Return
3.9%
Cap rate
0.5%
Rent to Value Ratio
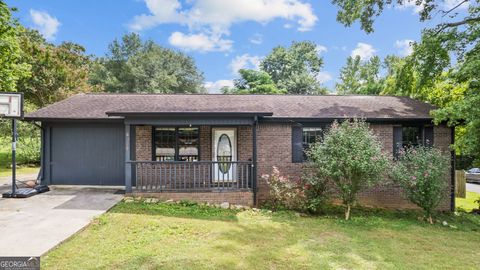
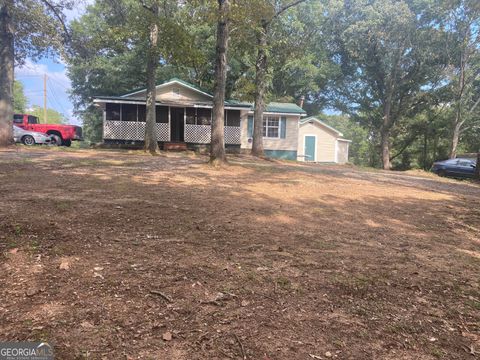
Active
$230,000
3
bds
|
2
ba
|
1,107
sqft
|
built
1982
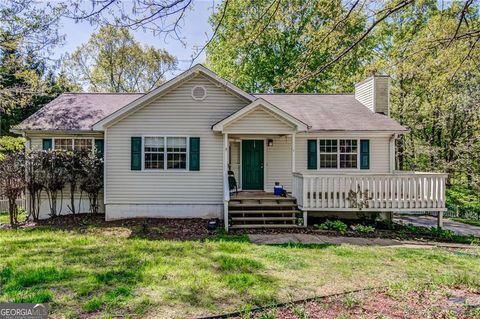
4329 Dews Pond Rd SE, Calhoun, GA 30701
$-174
Cash flow
-3.9%
Cash-on-Cash Return
5.2%
Cap rate
0.7%
Rent to Value Ratio
Active
$349,900
2
bds
|
2
ba
|
1,220
sqft
|
built
1984
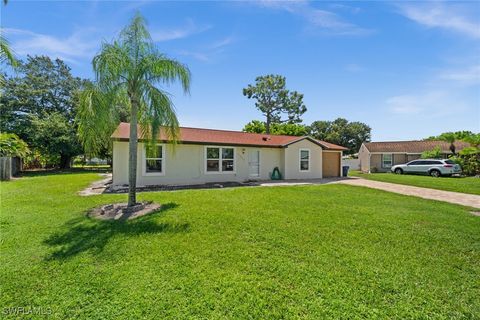
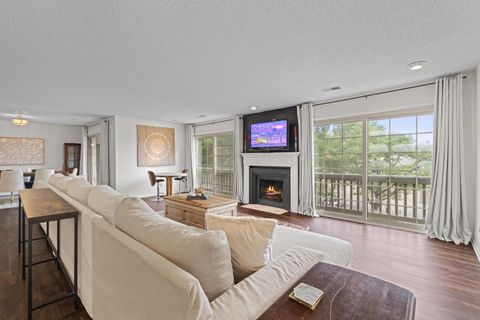
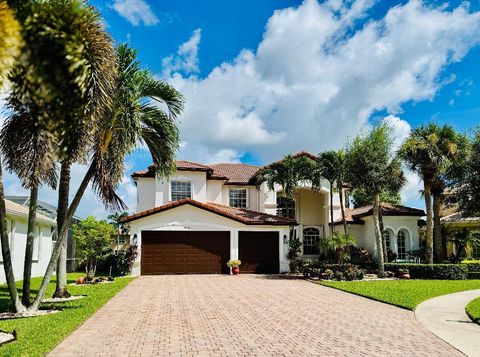
9288 Oak Bridge Ct, Fort Myers, FL 33967
$-205
Cash flow
-3.1%
Cash-on-Cash Return
5.4%
Cap rate
0.7%
Rent to Value Ratio
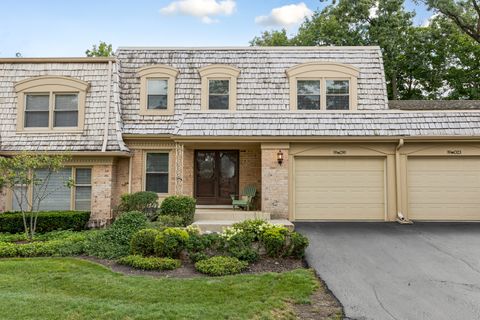
Active
$475,000
3
bds
|
3
ba
|
1,974
sqft
|
built
1972
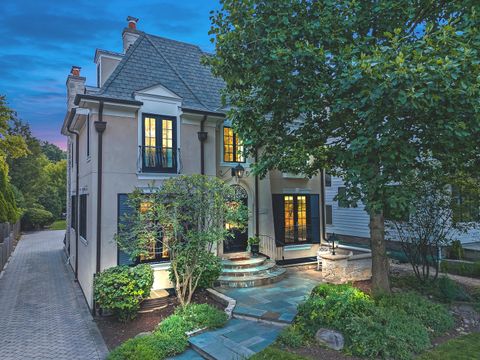
19W019 Avenue Barbizon, Oak Brook, IL 60523
$-800
Cash flow
-8.8%
Cash-on-Cash Return
3.7%
Cap rate
0.7%
Rent to Value Ratio
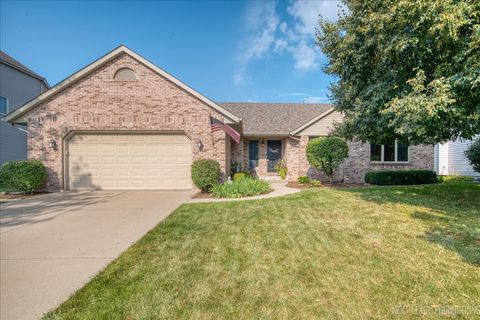
Active
$419,900
3
bds
|
3
ba
|
2,298
sqft
|
built
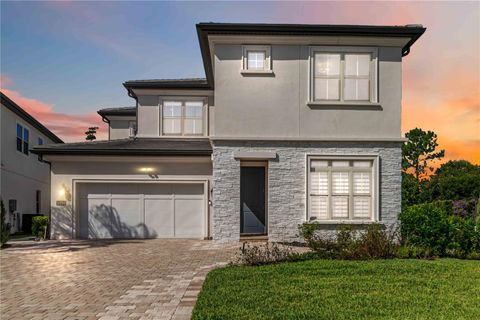
1998
1331 Yorkshire Dr N, Sycamore, IL 60178
$-1,010
Cash flow
-12.5%
Cash-on-Cash Return
2.8%
Cap rate
0.6%
Rent to Value Ratio
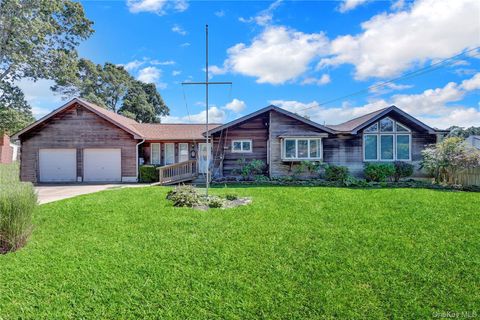
Active
$499,999
3
bds
|
2
ba
|
1,593
sqft
|
built
1958
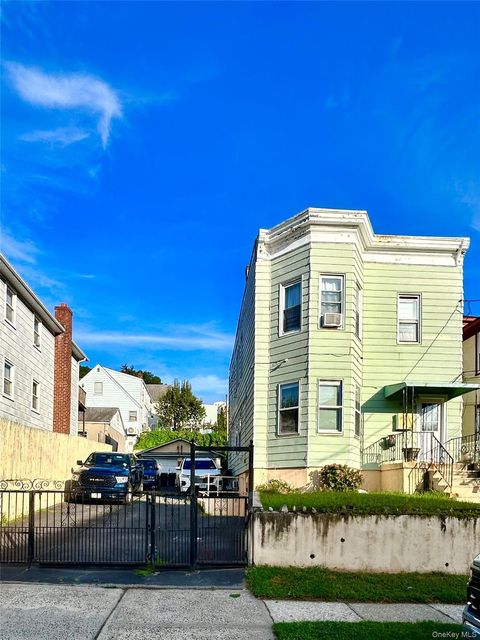
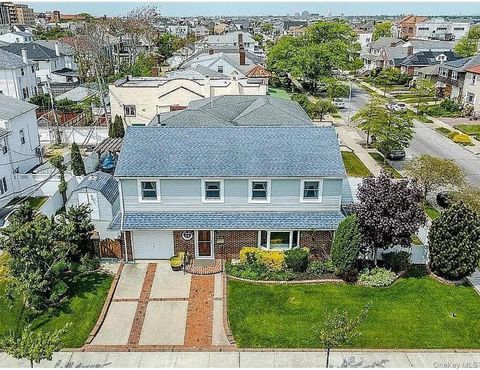
16 Flintlock Dr, Shirley, NY 11967
$-868
Cash flow
-9.1%
Cash-on-Cash Return
4.0%
Cap rate
0.7%
Rent to Value Ratio
Active
$2,100,000
5
bds
|
6
ba
|
5,880
sqft
|
built
2006
4537 Clausen Ave, Western Springs, IL 60558
$-7,146
Cash flow
-17.8%
Cash-on-Cash Return
1.6%
Cap rate
0.3%
Rent to Value Ratio
Active
$1,489,000
5
bds
|
5
ba
|
4,178
sqft
|
built
2018
10594 Royal Cypress Way, Orlando, FL 32836
$-4,674
Cash flow
-16.4%
Cash-on-Cash Return
2.4%
Cap rate
0.5%
Rent to Value Ratio
Active
$330,000
3
bds
|
1
ba
|
1,474
sqft
|
built
1928
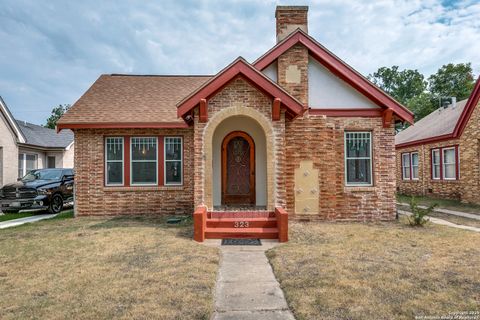
323 Donaldson Ave, San Antonio, TX 78201
$-953
Cash flow
-15.1%
Cash-on-Cash Return
2.2%
Cap rate
0.5%
Rent to Value Ratio
Active
$206,000
3
bds
|
2
ba
|
1,032
sqft
|
built
1955
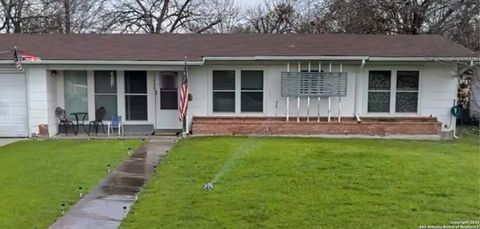
355 Cresham Dr, San Antonio, TX 78218
$-264
Cash flow
-6.7%
Cash-on-Cash Return
4.1%
Cap rate
0.7%
Rent to Value Ratio
Active
$1,650,000
6
bds
|
7
ba
|
8,029
sqft
|
built
2003
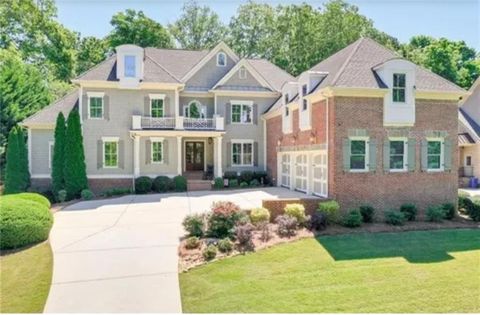
1680 Bill Murdock Rd, Marietta, GA 30062
$-4,160
Cash flow
-13.2%
Cash-on-Cash Return
3.1%
Cap rate
0.5%
Rent to Value Ratio
Active
$315,000
3
bds
|
2
ba
|
1,680
sqft
|
built
1974
1216 Lake Shore Dr, Columbus, OH 43204
$-1,220
Cash flow
-20.2%
Cash-on-Cash Return
1.0%
Cap rate
0.6%
Rent to Value Ratio
Active
$193,000
2
bds
|
2
ba
|
875
sqft
|
built
1971
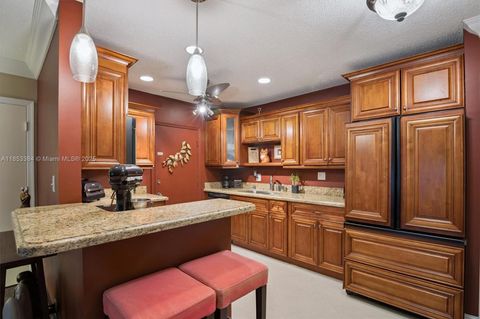
5900 NE 22nd Way, Fort Lauderdale, FL 33308
$-174
Cash flow
-4.7%
Cash-on-Cash Return
5.1%
Cap rate
1.1%
Rent to Value Ratio
Active
$138,500
2
bds
|
1
ba
|
846
sqft
|
built
1949
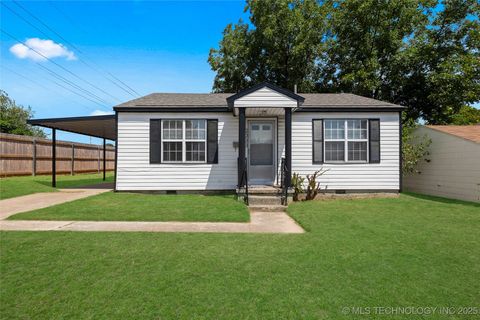
2333 W Easton Pl, Tulsa, OK 74127
$88
Cash flow
3.3%
Cash-on-Cash Return
6.4%
Cap rate
0.9%
Rent to Value Ratio
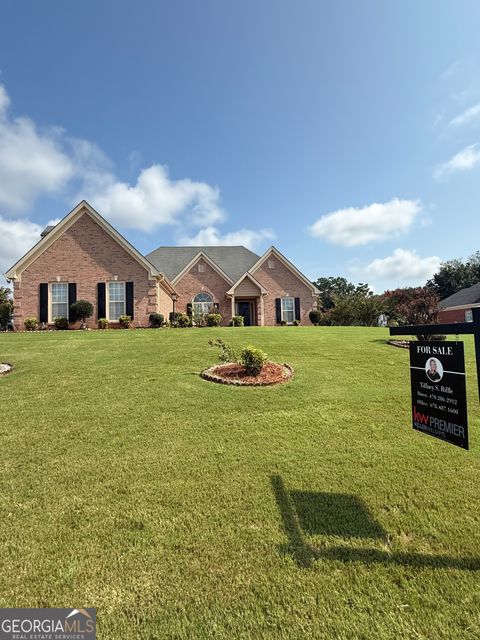
Active
$359,777
5
bds
|
3
ba
|
0
sqft
|
built
1998
255 Deer Run, Jasper, GA 30143
$-519
Cash flow
-7.5%
Cash-on-Cash Return
4.4%
Cap rate
0.6%
Rent to Value Ratio
Active
$435,000
3
bds
|
2
ba
|
1,864
sqft
|
built
2004
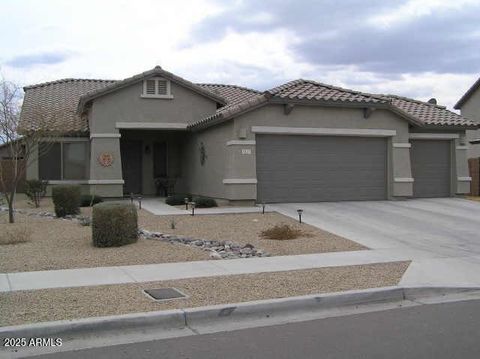
5237 W Ian Dr, Laveen, AZ 85339
$-847
Cash flow
-10.2%
Cash-on-Cash Return
3.3%
Cap rate
0.5%
Rent to Value Ratio
Active
$589,900
2
bds
|
1
ba
|
792
sqft
|
built
1920
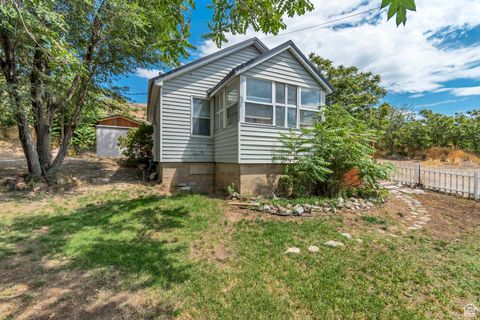
1220 N Hillside Dr, Genola, UT 84655
$-2,077
Cash flow
-18.4%
Cash-on-Cash Return
1.5%
Cap rate
0.2%
Rent to Value Ratio
Active
$475,000
5
bds
|
3
ba
|
0
sqft
|
built
1900
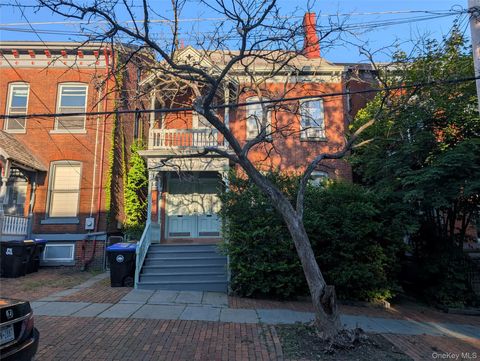
13 Grand St, Poughkeepsie, NY 12601
$-1,285
Cash flow
-14.1%
Cash-on-Cash Return
2.8%
Cap rate
0.5%
Rent to Value Ratio
Active
$799,000
7
bds
|
3
ba
|
0
sqft
|
built
1910
82 Burhans Ave, Yonkers, NY 10701
$-2,710
Cash flow
-17.7%
Cash-on-Cash Return
2.0%
Cap rate
0.4%
Rent to Value Ratio
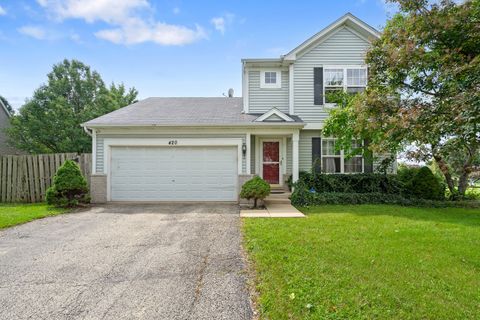
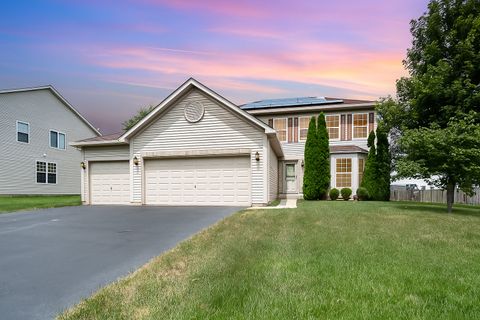
Active
$364,900
3
bds
|
3
ba
|
1,600
sqft
|
built
2003
420 N Maggie Ln, Romeoville, IL 60446
$-347
Cash flow
-5.0%
Cash-on-Cash Return
4.5%
Cap rate
0.8%
Rent to Value Ratio
Active
$325,000
4
bds
|
2
ba
|
2,070
sqft
|
built
1996
3010 Notting Hill Ct SW, Conyers, GA 30094
$-668
Cash flow
-10.7%
Cash-on-Cash Return
3.7%
Cap rate
0.6%
Rent to Value Ratio
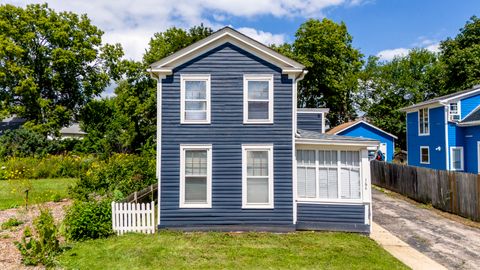
Active
$240,000
3
bds
|
1
ba
|
2,248
sqft
|
built
1920
166 Ann St, Elgin, IL 60120
$-15
Cash flow
-0.3%
Cash-on-Cash Return
5.6%
Cap rate
0.9%
Rent to Value Ratio
Active
$147,999
2
bds
|
2
ba
|
2,212
sqft
|
built
1962
32 Helen Dr, Griffin, GA 30223
$206
Cash flow
7.3%
Cash-on-Cash Return
7.8%
Cap rate
1.1%
Rent to Value Ratio
Active
$275,000
4
bds
|
2
ba
|
2,109
sqft
|
built
1950
11371 Ellingwood Ave NW, Maple Lake, MN 55358
$65
Cash flow
1.2%
Cash-on-Cash Return
6.0%
Cap rate
0.8%
Rent to Value Ratio
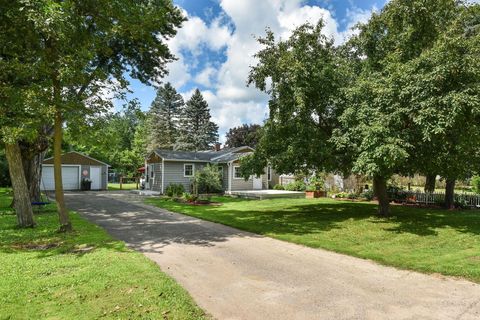
Active
$349,900
3
bds
|
2
ba
|
1,652
sqft
|
built
2001
10937 Waterloo Munith Rd, Munith, MI 49259
$-529
Cash flow
-7.9%
Cash-on-Cash Return
4.3%
Cap rate
0.6%
Rent to Value Ratio
Active
$355,000
4
bds
|
3
ba
|
2,072
sqft
|
built
2006
3407 Tamaira St, Plano, IL 60545
$-648
Cash flow
-9.5%
Cash-on-Cash Return
3.5%
Cap rate
0.8%
Rent to Value Ratio
Active
$1,050,000
5
bds
|
4
ba
|
3,818
sqft
|
built
2005
9891 Via Bernini, Lake Worth, FL 33467
$-2,709
Cash flow
-13.5%
Cash-on-Cash Return
3.1%
Cap rate
0.5%
Rent to Value Ratio
Active
$1,450,000
4
bds
|
2
ba
|
1,900
sqft
|
built
1974
221 Washington Blvd, Long Beach, NY 11561
$-4,783
Cash flow
-17.2%
Cash-on-Cash Return
2.1%
Cap rate
0.4%
Rent to Value Ratio
Active
$180,000
3
bds
|
1
ba
|
1,321
sqft
|
built
1965
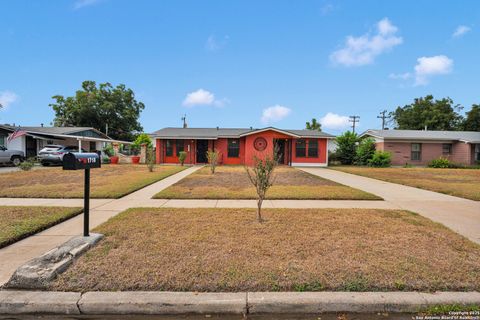
1718 Mc Cauley Blvd, San Antonio, TX 78224
$-82
Cash flow
-2.4%
Cash-on-Cash Return
5.1%
Cap rate
0.9%
Rent to Value Ratio
Active
$474,900
4
bds
|
3
ba
|
1,972
sqft
|
built
2004
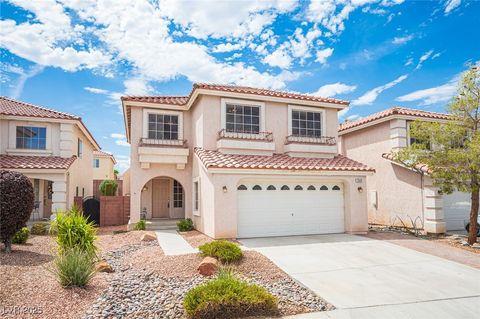
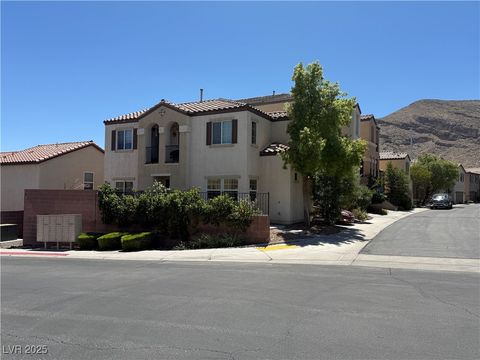
7549 Mermaid Song Ct, Las Vegas, NV 89139
$-976
Cash flow
-10.7%
Cash-on-Cash Return
3.2%
Cap rate
0.5%
Rent to Value Ratio
Active
$385,000
3
bds
|
3
ba
|
1,430
sqft
|
built
2007
10557 Shiny Skies Dr, Las Vegas, NV 89129
$-450
Cash flow
-6.1%
Cash-on-Cash Return
4.3%
Cap rate
0.6%
Rent to Value Ratio
Active
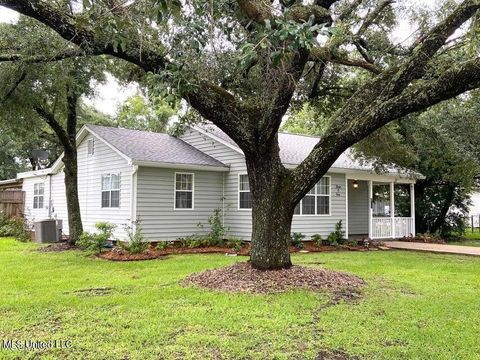
$240,000
3
bds
|
2
ba
|
0
sqft
|
built
1954
301 43rd St, Gulfport, MS 39507
$142
Cash flow
3.1%
Cash-on-Cash Return
6.4%
Cap rate
0.8%
Rent to Value Ratio

Active
$475,000
3
bds
|
2
ba
|
1,698
sqft
|
built
1984
817 Hickory Knoll Ct, Apopka, FL 32712
$-1,205
Cash flow
-13.2%
Cash-on-Cash Return
3.1%
Cap rate
0.5%
Rent to Value Ratio
Active
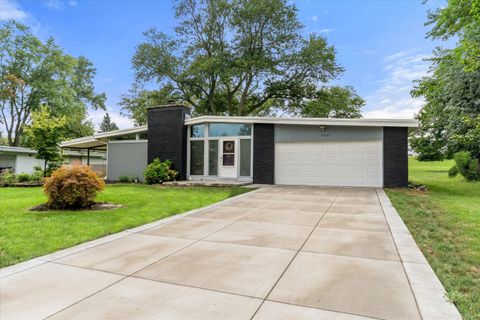
$329,000
3
bds
|
2
ba
|
1,561
sqft
|
built
1961
18825 Nola St, Livonia, MI 48152
$-493
Cash flow
-7.8%
Cash-on-Cash Return
4.3%
Cap rate
0.7%
Rent to Value Ratio
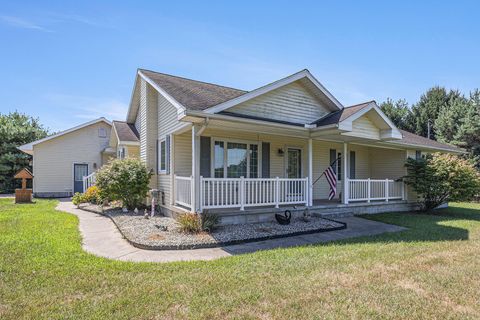
Active
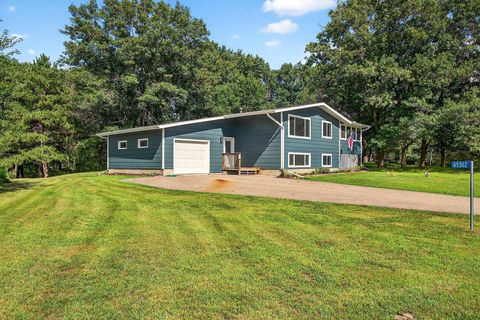
$349,900
4
bds
|
2
ba
|
2,063
sqft
|
built
1977
65302 145th Ave, Wabasha, MN 55981
$-549
Cash flow
-8.2%
Cash-on-Cash Return
3.8%
Cap rate
0.5%
Rent to Value Ratio
Active
$984,900
4
bds
|
4.5
ba
|
5,418
sqft
|
built
2015
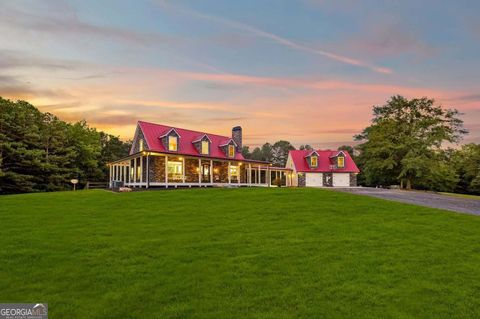
3002 Highway 101 N, Rockmart, GA 30153
$-1,933
Cash flow
-10.2%
Cash-on-Cash Return
3.8%
Cap rate
0.5%
Rent to Value Ratio
Active
$258,000
2
bds
|
2
ba
|
1,245
sqft
|
built
1985
6492 92nd Pl N, Pinellas Park, FL 33782
$-787
Cash flow
-15.9%
Cash-on-Cash Return
2.5%
Cap rate
0.9%
Rent to Value Ratio
Active
$475,000
2
bds
|
3
ba
|
1,155
sqft
|
built
2002
3853 Tree Top Dr, Weston, FL 33332
$-1,338
Cash flow
-14.7%
Cash-on-Cash Return
2.8%
Cap rate
0.6%
Rent to Value Ratio