Indiana Investment Properties for Sale
Browse homes for sale and investment properties in Indiana. Refine your search by price, property type, or more.
Best cash flowing properties in Indiana
Active
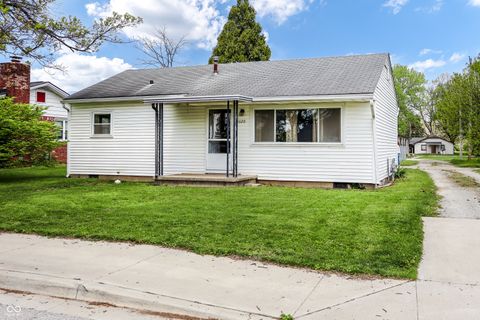
$159,900
4
bds
|
2
ba
|
1,248
sqft
|
built
1940
1020 E Sixth St, Greenfield, IN 46140
$269
Cash flow
8.8%
Cash-on-Cash Return
8.3%
Cap rate
1.0%
Rent to Value Ratio
Active
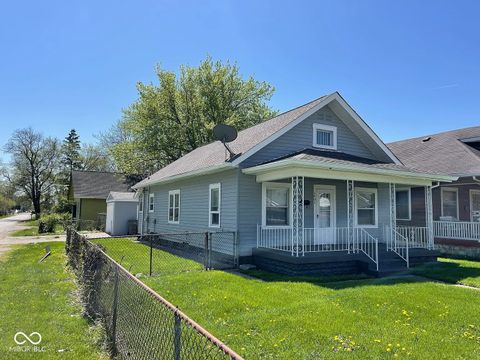
$142,000
2
bds
|
1
ba
|
960
sqft
|
built
1930
1401 W 34th St, Indianapolis, IN 46208
$225
Cash flow
8.3%
Cash-on-Cash Return
8.2%
Cap rate
1.0%
Rent to Value Ratio
4,177 out of 5,533 properties for sale in Indiana
Limited Results Shown
Create a free account, or log in to reveal all property listings and enjoy the complete experience.
Active
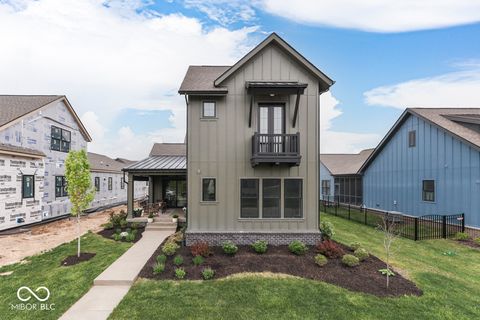
$819,900
4
bds
|
4
ba
|
3,713
sqft
|
built
2023
17346 Newton Main St, Westfield, IN 46074
$-930
Cash flow
-5.9%
Cash-on-Cash Return
4.9%
Cap rate
0.6%
Rent to Value Ratio

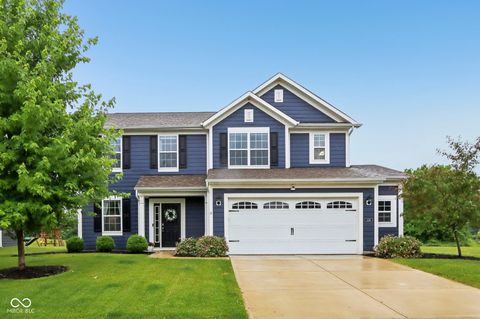
Active
$199,000
2
bds
|
2
ba
|
2,148
sqft
|
built
1955
114 E 27th St, Indianapolis, IN 46205
$43
Cash flow
1.1%
Cash-on-Cash Return
6.5%
Cap rate
0.9%
Rent to Value Ratio

Active
$159,900
3
bds
|
2
ba
|
1,404
sqft
|
built
1930
4943 S State Ave, Indianapolis, IN 46227
$131
Cash flow
4.3%
Cash-on-Cash Return
7.2%
Cap rate
0.9%
Rent to Value Ratio

Active
$334,900
4
bds
|
3
ba
|
3,190
sqft
|
built
2017
2006 Creek Bank Dr, Columbus, IN 47201
$-66
Cash flow
-1.0%
Cash-on-Cash Return
6.0%
Cap rate
0.7%
Rent to Value Ratio
Active
$142,000
2
bds
|
1
ba
|
960
sqft
|
built
1930
1401 W 34th St, Indianapolis, IN 46208
$225
Cash flow
8.3%
Cash-on-Cash Return
8.2%
Cap rate
1.0%
Rent to Value Ratio
Active
$429,000
3
bds
|
3
ba
|
2,091
sqft
|
built
2019
4245 W Fork Dr, Westfield, IN 46062
$-593
Cash flow
-7.2%
Cash-on-Cash Return
4.6%
Cap rate
0.6%
Rent to Value Ratio

Active
$699,900
4
bds
|
3
ba
|
3,192
sqft
|
built
2021
1472 Maple Ridge Ct, Columbus, IN 47201
$-1,540
Cash flow
-11.5%
Cash-on-Cash Return
3.6%
Cap rate
0.4%
Rent to Value Ratio

Active
$299,000
3
bds
|
2
ba
|
1,749
sqft
|
built
1986
11620 E 75th St, Indianapolis, IN 46236
$-181
Cash flow
-3.2%
Cash-on-Cash Return
5.5%
Cap rate
0.7%
Rent to Value Ratio

Active
$425,000
4
bds
|
0
ba
|
0
sqft
|
built
1916
1222 Nichol Ave, Anderson, IN 46016
$-1,529
Cash flow
-18.8%
Cash-on-Cash Return
1.9%
Cap rate
0.2%
Rent to Value Ratio

Active
$255,900
3
bds
|
2
ba
|
1,454
sqft
|
built
1993
4611 29th St, Columbus, IN 47203
$-232
Cash flow
-4.7%
Cash-on-Cash Return
5.2%
Cap rate
0.6%
Rent to Value Ratio

Active
$657,000
5
bds
|
4
ba
|
5,118
sqft
|
built
1994
4601 Fairhope Dr, Indianapolis, IN 46237
$-959
Cash flow
-7.6%
Cash-on-Cash Return
4.5%
Cap rate
0.5%
Rent to Value Ratio
Active
$419,900
3
bds
|
1
ba
|
1,535
sqft
|
built
1933
744 Gilbert Ave, Indianapolis, IN 46227
$-950
Cash flow
-11.8%
Cash-on-Cash Return
3.5%
Cap rate
0.4%
Rent to Value Ratio
Active
$286,000
3
bds
|
3
ba
|
1,976
sqft
|
built
1964
8417 S Sherman Dr, Indianapolis, IN 46237
$-458
Cash flow
-8.4%
Cash-on-Cash Return
4.3%
Cap rate
0.5%
Rent to Value Ratio

Active
$549,900
5
bds
|
3
ba
|
2,544
sqft
|
built
1923
4447 N College Ave, Indianapolis, IN 46205
$-870
Cash flow
-8.3%
Cash-on-Cash Return
4.4%
Cap rate
0.5%
Rent to Value Ratio
Active
$159,900
4
bds
|
2
ba
|
1,248
sqft
|
built
1940
1020 E Sixth St, Greenfield, IN 46140
$269
Cash flow
8.8%
Cash-on-Cash Return
8.3%
Cap rate
1.0%
Rent to Value Ratio

Active
$567,000
4
bds
|
3
ba
|
4,047
sqft
|
built
2007
1361 Trescott Dr, Westfield, IN 46074
$-773
Cash flow
-7.1%
Cash-on-Cash Return
4.5%
Cap rate
0.6%
Rent to Value Ratio
Active
$565,000
4
bds
|
3
ba
|
2,536
sqft
|
built
2017
4105 N Emma Dr, Bloomington, IN 47404
$-1,018
Cash flow
-9.4%
Cash-on-Cash Return
4.1%
Cap rate
0.5%
Rent to Value Ratio
Active
$799,900
5
bds
|
5
ba
|
4,619
sqft
|
built
1986
4619 Allen Dr, Carmel, IN 46033
$-1,140
Cash flow
-7.4%
Cash-on-Cash Return
4.6%
Cap rate
0.6%
Rent to Value Ratio
Active
$1,499,000
6
bds
|
10
ba
|
11,954
sqft
|
built
1960
8602 Frontgate Ln, Indianapolis, IN 46256
$-3,886
Cash flow
-13.5%
Cash-on-Cash Return
3.0%
Cap rate
0.4%
Rent to Value Ratio
Active
$379,000
4
bds
|
3
ba
|
3,052
sqft
|
built
2004
12552 Majestic Way, Fishers, IN 46037
$-210
Cash flow
-2.9%
Cash-on-Cash Return
5.6%
Cap rate
0.7%
Rent to Value Ratio
Active
$424,900
4
bds
|
3
ba
|
2,138
sqft
|
built
2007
6839 Powder Dr, Indianapolis, IN 46259
$-343
Cash flow
-4.2%
Cash-on-Cash Return
5.3%
Cap rate
0.7%
Rent to Value Ratio

Active
$599,999
4
bds
|
3
ba
|
4,179
sqft
|
built
2015
10027 Landis Blvd, Fishers, IN 46040
$-223
Cash flow
-1.9%
Cash-on-Cash Return
5.8%
Cap rate
0.7%
Rent to Value Ratio

Active
$325,000
2
bds
|
2
ba
|
1,176
sqft
|
built
2017
829 Olive St, Indianapolis, IN 46203
$-455
Cash flow
-7.3%
Cash-on-Cash Return
4.6%
Cap rate
0.6%
Rent to Value Ratio
Active
$1,900,000
6
bds
|
6
ba
|
5,682
sqft
|
built
2019
5120 Melbourne Pl, Zionsville, IN 46077
$-4,467
Cash flow
-12.3%
Cash-on-Cash Return
3.4%
Cap rate
0.4%
Rent to Value Ratio

Active
$310,000
3
bds
|
2
ba
|
1,350
sqft
|
built
1966
412 Wells Dr, Nashville, IN 47448
$-238
Cash flow
-4.0%
Cash-on-Cash Return
5.3%
Cap rate
0.6%
Rent to Value Ratio
Active
$207,500
2
bds
|
2
ba
|
1,504
sqft
|
built
1996
11541 Coastal Dr, Indianapolis, IN 46229
$-112
Cash flow
-2.8%
Cash-on-Cash Return
5.6%
Cap rate
0.8%
Rent to Value Ratio

Active
$240,000
3
bds
|
2
ba
|
1,533
sqft
|
built
2002
2449 Orchard Creek Dr, Columbus, IN 47201
$84
Cash flow
1.8%
Cash-on-Cash Return
6.7%
Cap rate
0.8%
Rent to Value Ratio

Active
$220,000
3
bds
|
2
ba
|
1,172
sqft
|
built
1986
1002 Prairie Depot, Indianapolis, IN 46241
$-45
Cash flow
-1.1%
Cash-on-Cash Return
6.0%
Cap rate
0.7%
Rent to Value Ratio
Active
$415,000
4
bds
|
3
ba
|
2,096
sqft
|
built
1997
45 E Wisteria Way, Westfield, IN 46074
$-504
Cash flow
-6.3%
Cash-on-Cash Return
4.8%
Cap rate
0.6%
Rent to Value Ratio

Active
$359,900
3
bds
|
2
ba
|
1,817
sqft
|
built
1989
378 Turnberry Ct, Avon, IN 46123
$-246
Cash flow
-3.6%
Cash-on-Cash Return
5.4%
Cap rate
0.7%
Rent to Value Ratio
Active
$225,000
3
bds
|
2
ba
|
1,520
sqft
|
built
1930
3343 N US Highway 231, Greencastle, IN 46135
$67
Cash flow
1.6%
Cash-on-Cash Return
6.6%
Cap rate
0.8%
Rent to Value Ratio

Active
$162,500
2
bds
|
2
ba
|
1,080
sqft
|
built
1978
5713 Bradston Way, Indianapolis, IN 46237
$-155
Cash flow
-5.0%
Cash-on-Cash Return
5.1%
Cap rate
0.9%
Rent to Value Ratio

Active
$399,900
4
bds
|
2
ba
|
3,222
sqft
|
built
1978
961 Parkside Dr, Columbus, IN 47203
$-156
Cash flow
-2.0%
Cash-on-Cash Return
5.8%
Cap rate
0.7%
Rent to Value Ratio

Active
$345,000
4
bds
|
2
ba
|
2,000
sqft
|
built
1910
1641 English Ave, Indianapolis, IN 46201
$-835
Cash flow
-12.6%
Cash-on-Cash Return
3.4%
Cap rate
0.4%
Rent to Value Ratio

Active
$599,000
4
bds
|
4
ba
|
3,402
sqft
|
built
1993
7357 Windridge Way, Brownsburg, IN 46112
$-974
Cash flow
-8.5%
Cash-on-Cash Return
4.3%
Cap rate
0.5%
Rent to Value Ratio
Active
$319,000
3
bds
|
2
ba
|
1,891
sqft
|
built
1999
5615 Burning Tree Ct, Indianapolis, IN 46239
$-179
Cash flow
-2.9%
Cash-on-Cash Return
5.6%
Cap rate
0.7%
Rent to Value Ratio
Active
$665,000
3
bds
|
3
ba
|
1,981
sqft
|
built
2016
7638 Beekman Ter, Zionsville, IN 46077
$-1,922
Cash flow
-15.1%
Cash-on-Cash Return
2.8%
Cap rate
0.4%
Rent to Value Ratio
Active
$2,095,000
6
bds
|
7
ba
|
6,259
sqft
|
built
2019
5130 Melbourne Pl, Zionsville, IN 46077
$-5,594
Cash flow
-13.9%
Cash-on-Cash Return
3.1%
Cap rate
0.4%
Rent to Value Ratio
Active
$199,000
2
bds
|
1
ba
|
987
sqft
|
built
1958
8341 N Washington St, Sheridan, IN 46069
$-4
Cash flow
-0.1%
Cash-on-Cash Return
6.2%
Cap rate
0.8%
Rent to Value Ratio
Active
$359,900
3
bds
|
4
ba
|
2,328
sqft
|
built
2020
17364 Graley Pl, Westfield, IN 46074
$-235
Cash flow
-3.4%
Cash-on-Cash Return
5.5%
Cap rate
0.7%
Rent to Value Ratio