Indiana Investment Properties for Sale
Browse homes for sale and investment properties in Indiana. Refine your search by price, property type, or more.
Best cash flowing properties in Indiana

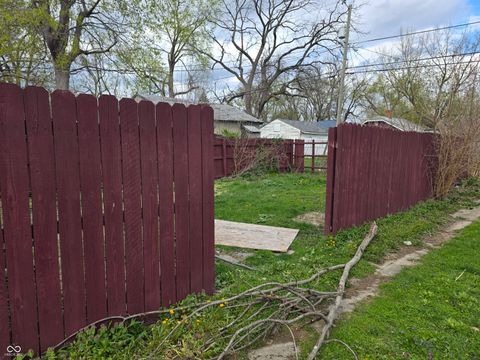
Active
$134,900
5
bds
|
2
ba
|
2,712
sqft
|
built
1930
601 E Thompson St, Edinburgh, IN 46124
$551
Cash flow
21.3%
Cash-on-Cash Return
11.0%
Cap rate
1.3%
Rent to Value Ratio
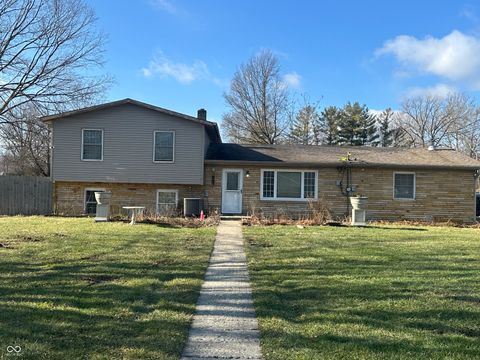
Active
$85,000
2
bds
|
1
ba
|
756
sqft
|
built
1923
335 S Dearborn St, Indianapolis, IN 46201
$315
Cash flow
19.3%
Cash-on-Cash Return
10.7%
Cap rate
1.3%
Rent to Value Ratio
4,061 out of 4,922 properties for sale in Indiana
Limited Results Shown
Create a free account, or log in to reveal all property listings and enjoy the complete experience.
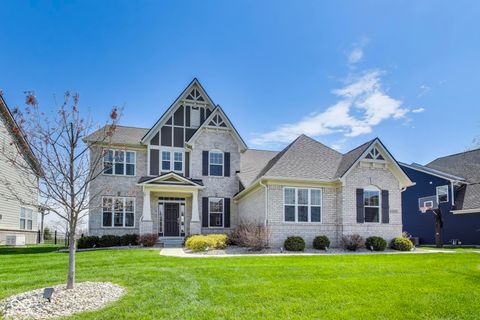
Active
$325,000
4
bds
|
2
ba
|
2,258
sqft
|
built
1962
406 S Fenton Ave, Indianapolis, IN 46219
$-800
Cash flow
-12.8%
Cash-on-Cash Return
3.3%
Cap rate
0.4%
Rent to Value Ratio
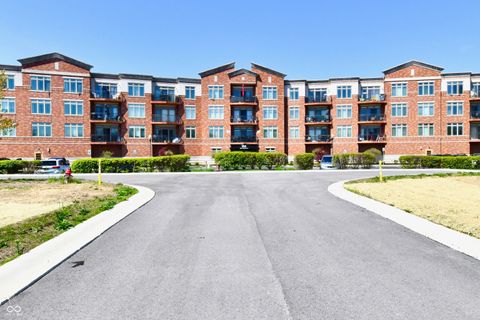
Active
$375,000
2
bds
|
2
ba
|
1,203
sqft
|
built
2006
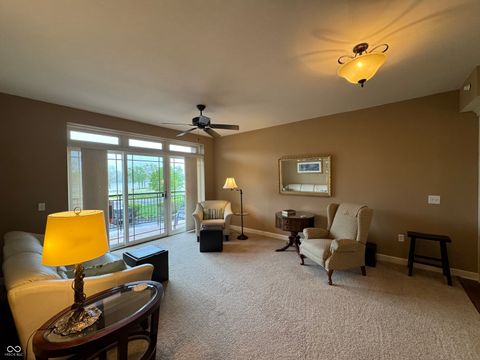
20971 Shoreline Ct, Noblesville, IN 46062
$-1,362
Cash flow
-18.9%
Cash-on-Cash Return
1.9%
Cap rate
0.4%
Rent to Value Ratio
Active
$710,000
5
bds
|
4
ba
|
5,007
sqft
|
built
2019
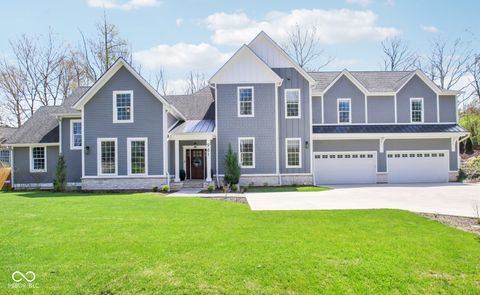
3997 Spylaw Rd, Bargersville, IN 46106
$-1,000
Cash flow
-7.3%
Cash-on-Cash Return
4.6%
Cap rate
0.6%
Rent to Value Ratio
Active
$255,000
3
bds
|
2
ba
|
1,380
sqft
|
built
1980
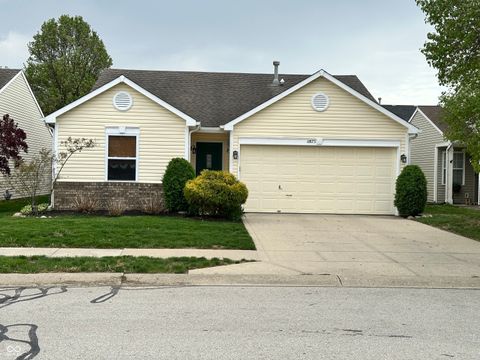
7833 Broadview Dr, Indianapolis, IN 46227
$-227
Cash flow
-4.6%
Cash-on-Cash Return
5.2%
Cap rate
0.6%
Rent to Value Ratio
Active
$499,000
4
bds
|
3
ba
|
3,873
sqft
|
built
1988
6744 Robin Hood Ct, Indianapolis, IN 46227
$-447
Cash flow
-4.7%
Cash-on-Cash Return
5.2%
Cap rate
0.6%
Rent to Value Ratio
Active
$348,900
4
bds
|
3
ba
|
2,390
sqft
|
built
2022
6536 W Shoreline Ct, Greenfield, IN 46140
$-304
Cash flow
-4.5%
Cash-on-Cash Return
5.2%
Cap rate
0.6%
Rent to Value Ratio
Active
$2,000,000
5
bds
|
7
ba
|
9,733
sqft
|
built
2000
2766 S Honey Creek Rd, Greenwood, IN 46143
$-6,646
Cash flow
-17.3%
Cash-on-Cash Return
2.3%
Cap rate
0.3%
Rent to Value Ratio
Active
$268,500
3
bds
|
2
ba
|
1,224
sqft
|
built
1999
11875 Buck Creek Cir, Noblesville, IN 46060
$-181
Cash flow
-3.5%
Cash-on-Cash Return
5.5%
Cap rate
0.7%
Rent to Value Ratio
Active
$1,560,000
6
bds
|
7
ba
|
5,700
sqft
|
built
1995
961 Starkey Rd, Zionsville, IN 46077
$-3,314
Cash flow
-11.1%
Cash-on-Cash Return
3.7%
Cap rate
0.4%
Rent to Value Ratio

Active
$319,000
3
bds
|
2
ba
|
1,420
sqft
|
built
1992
4411 Rotterdam Dr, Indianapolis, IN 46228
$-294
Cash flow
-4.8%
Cash-on-Cash Return
5.2%
Cap rate
0.6%
Rent to Value Ratio
Active
$399,900
2
bds
|
1
ba
|
1,038
sqft
|
built
2006
20971 Shoreline Ct, Noblesville, IN 46062
$-1,544
Cash flow
-20.1%
Cash-on-Cash Return
1.6%
Cap rate
0.4%
Rent to Value Ratio
Active
$390,000
3
bds
|
2
ba
|
1,258
sqft
|
built
1961
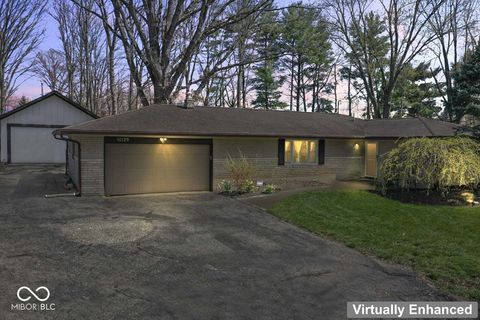
10129 Guilford Ave, Carmel, IN 46280
$-656
Cash flow
-8.8%
Cash-on-Cash Return
4.2%
Cap rate
0.5%
Rent to Value Ratio
Active
$499,900
7
bds
|
4
ba
|
4,338
sqft
|
built
2019
403 N Crystal Dr, Fortville, IN 46040
$-581
Cash flow
-6.1%
Cash-on-Cash Return
4.8%
Cap rate
0.6%
Rent to Value Ratio
Active
$750,000
4
bds
|
4
ba
|
4,393
sqft
|
built
1875
828 Woodruff Place Middle Dr, Indianapolis, IN 46201
$-1,156
Cash flow
-8.0%
Cash-on-Cash Return
4.4%
Cap rate
0.5%
Rent to Value Ratio
Active
$351,000
2
bds
|
3
ba
|
1,816
sqft
|
built
1996
11264 Fonthill Dr, Indianapolis, IN 46236
$-677
Cash flow
-10.1%
Cash-on-Cash Return
3.9%
Cap rate
0.7%
Rent to Value Ratio

Active
$439,900
3
bds
|
2
ba
|
2,391
sqft
|
built
2018
15142 Blue Ribbon Blvd, Fishers, IN 46040
$-406
Cash flow
-4.8%
Cash-on-Cash Return
5.2%
Cap rate
0.6%
Rent to Value Ratio

Active
$299,900
4
bds
|
3
ba
|
2,632
sqft
|
built
2006
853 Westpointe Dr, Shelbyville, IN 46176
$-345
Cash flow
-6.0%
Cash-on-Cash Return
4.9%
Cap rate
0.6%
Rent to Value Ratio

Active
$689,975
5
bds
|
4
ba
|
3,932
sqft
|
built
1991
138 Fairway Dr, Indianapolis, IN 46260
$-1,187
Cash flow
-9.0%
Cash-on-Cash Return
4.2%
Cap rate
0.5%
Rent to Value Ratio
Active
$450,000
3
bds
|
2
ba
|
1,988
sqft
|
built
1990
10495 Deer Run Rd, Poland, IN 47868
$-850
Cash flow
-9.9%
Cash-on-Cash Return
3.9%
Cap rate
0.5%
Rent to Value Ratio

Active
$595,900
4
bds
|
4
ba
|
2,700
sqft
|
built
1997
34 Gettysburg, Coatesville, IN 46121
$-1,246
Cash flow
-10.9%
Cash-on-Cash Return
3.8%
Cap rate
0.5%
Rent to Value Ratio
Active
$875,000
7
bds
|
6
ba
|
7,671
sqft
|
built
1994
6013 Yellow Birch Ct, Avon, IN 46123
$-1,473
Cash flow
-8.8%
Cash-on-Cash Return
4.2%
Cap rate
0.5%
Rent to Value Ratio
Active
$599,000
3
bds
|
2
ba
|
2,703
sqft
|
built
2014
9559 Summer Hollow Dr, Fishers, IN 46037
$-847
Cash flow
-7.4%
Cash-on-Cash Return
4.6%
Cap rate
0.6%
Rent to Value Ratio
Active
$599,999
4
bds
|
3
ba
|
3,691
sqft
|
built
2005
386 White Oak Ln, Greenwood, IN 46142
$-1,361
Cash flow
-11.8%
Cash-on-Cash Return
3.5%
Cap rate
0.4%
Rent to Value Ratio
Active
$589,900
5
bds
|
4
ba
|
3,456
sqft
|
built
1988
13306 W 50 S, Columbus, IN 47201
$-872
Cash flow
-7.7%
Cash-on-Cash Return
4.5%
Cap rate
0.5%
Rent to Value Ratio
Active
$534,900
4
bds
|
4
ba
|
4,108
sqft
|
built
1973
12166 N Bray Rd, Mooresville, IN 46158
$-309
Cash flow
-3.0%
Cash-on-Cash Return
5.6%
Cap rate
0.7%
Rent to Value Ratio
Active
$535,000
5
bds
|
3
ba
|
3,094
sqft
|
built
2022
5300 Veranda Dr, Noblesville, IN 46062
$-724
Cash flow
-7.1%
Cash-on-Cash Return
4.6%
Cap rate
0.6%
Rent to Value Ratio
Active
$760,000
4
bds
|
3
ba
|
3,004
sqft
|
built
2022
11075 W Deer Creek Dr, Crown Point, IN 46307
$-2,079
Cash flow
-14.3%
Cash-on-Cash Return
3.0%
Cap rate
0.5%
Rent to Value Ratio
Active
$179,900
3
bds
|
1
ba
|
1,104
sqft
|
built
1941
4818 E 14th St, Indianapolis, IN 46201
$234
Cash flow
6.8%
Cash-on-Cash Return
7.8%
Cap rate
0.9%
Rent to Value Ratio
Active
$245,000
3
bds
|
2
ba
|
1,273
sqft
|
built
2004
14317 Banister Dr, Noblesville, IN 46060
$-129
Cash flow
-2.7%
Cash-on-Cash Return
5.6%
Cap rate
0.7%
Rent to Value Ratio
Active
$259,700
3
bds
|
2
ba
|
1,713
sqft
|
built
1957
868 Glendale Dr, Franklin, IN 46131
$-114
Cash flow
-2.3%
Cash-on-Cash Return
5.7%
Cap rate
0.7%
Rent to Value Ratio
Active
$399,900
5
bds
|
3
ba
|
2,597
sqft
|
built
2003
7233 Capel Dr, Indianapolis, IN 46259
$-396
Cash flow
-5.2%
Cash-on-Cash Return
5.1%
Cap rate
0.6%
Rent to Value Ratio
Active
$184,900
3
bds
|
1
ba
|
900
sqft
|
built
1957
5368 Southeastern Ave, Indianapolis, IN 46203
$139
Cash flow
3.9%
Cash-on-Cash Return
7.2%
Cap rate
0.9%
Rent to Value Ratio

Active
$447,900
4
bds
|
3
ba
|
2,654
sqft
|
built
2022
2736 Victory Dr, Columbus, IN 47203
$-419
Cash flow
-4.9%
Cash-on-Cash Return
5.1%
Cap rate
0.6%
Rent to Value Ratio
Active
$785,000
4
bds
|
4
ba
|
4,965
sqft
|
built
2004
8910 Doubletree Dr S, Crown Point, IN 46307
$-2,034
Cash flow
-13.5%
Cash-on-Cash Return
3.2%
Cap rate
0.5%
Rent to Value Ratio

Active
$269,900
5
bds
|
4
ba
|
2,537
sqft
|
built
1937
2309 Pearl St, Columbus, IN 47201
$-29
Cash flow
-0.6%
Cash-on-Cash Return
6.1%
Cap rate
0.7%
Rent to Value Ratio
Active
$724,900
5
bds
|
4
ba
|
5,954
sqft
|
built
2001
7259 Josiah Ct, Indianapolis, IN 46259
$-832
Cash flow
-6.0%
Cash-on-Cash Return
4.9%
Cap rate
0.6%
Rent to Value Ratio

Active
$259,000
3
bds
|
1
ba
|
1,312
sqft
|
built
1905
430 Parkway Ave, Indianapolis, IN 46225
$-41
Cash flow
-0.8%
Cash-on-Cash Return
6.1%
Cap rate
0.7%
Rent to Value Ratio
Active
$115,000
3
bds
|
1
ba
|
1,114
sqft
|
built
1910
215 S Warman Ave, Indianapolis, IN 46222
$159
Cash flow
7.2%
Cash-on-Cash Return
7.9%
Cap rate
1.0%
Rent to Value Ratio