Indianapolis, IN Investment Properties for Sale
Browse homes for sale and investment properties in Indianapolis, IN. Refine your search by price, property type, or more.
Best cash flowing properties in Indianapolis, IN
Active
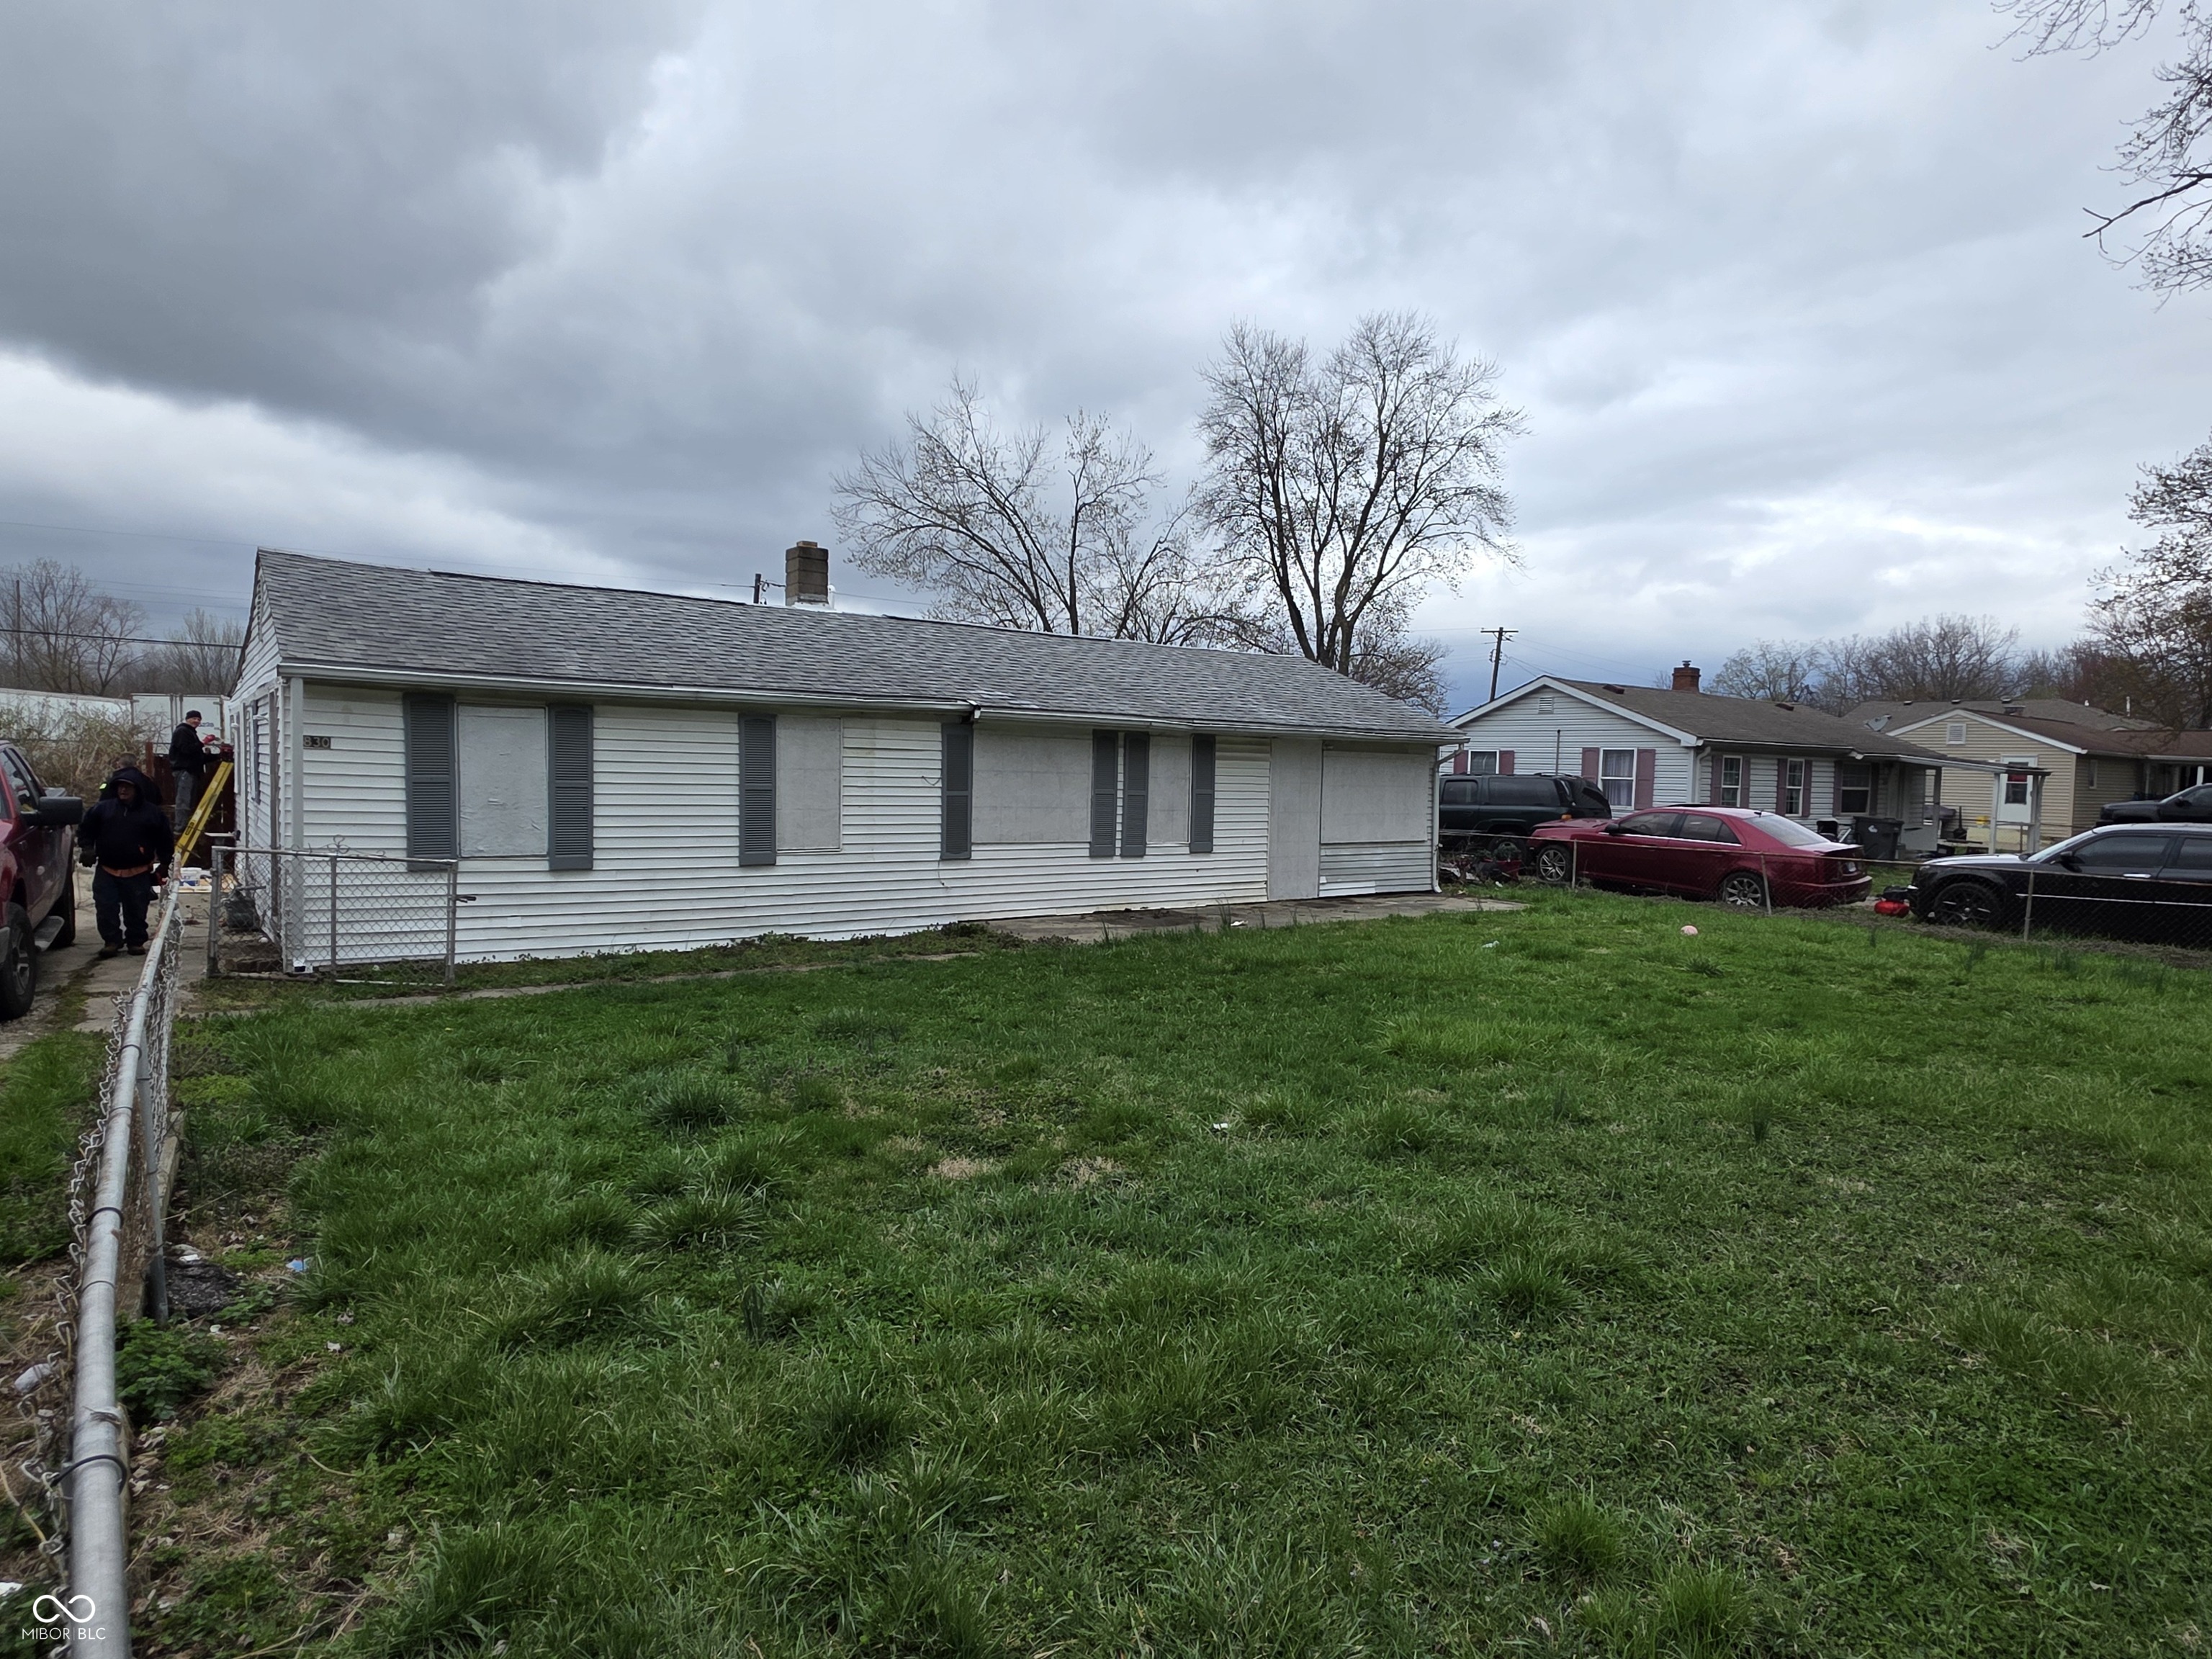
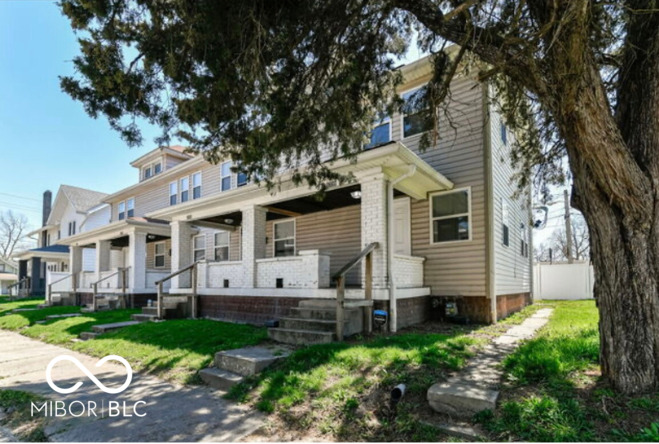
$85,000
4
bds
|
2
ba
|
1,632
sqft
|
built
1953
1830 S Chester Ave, Indianapolis, IN 46203
$600
Cash flow
36.8%
Cash-on-Cash Return
14.6%
Cap rate
1.8%
Rent to Value Ratio
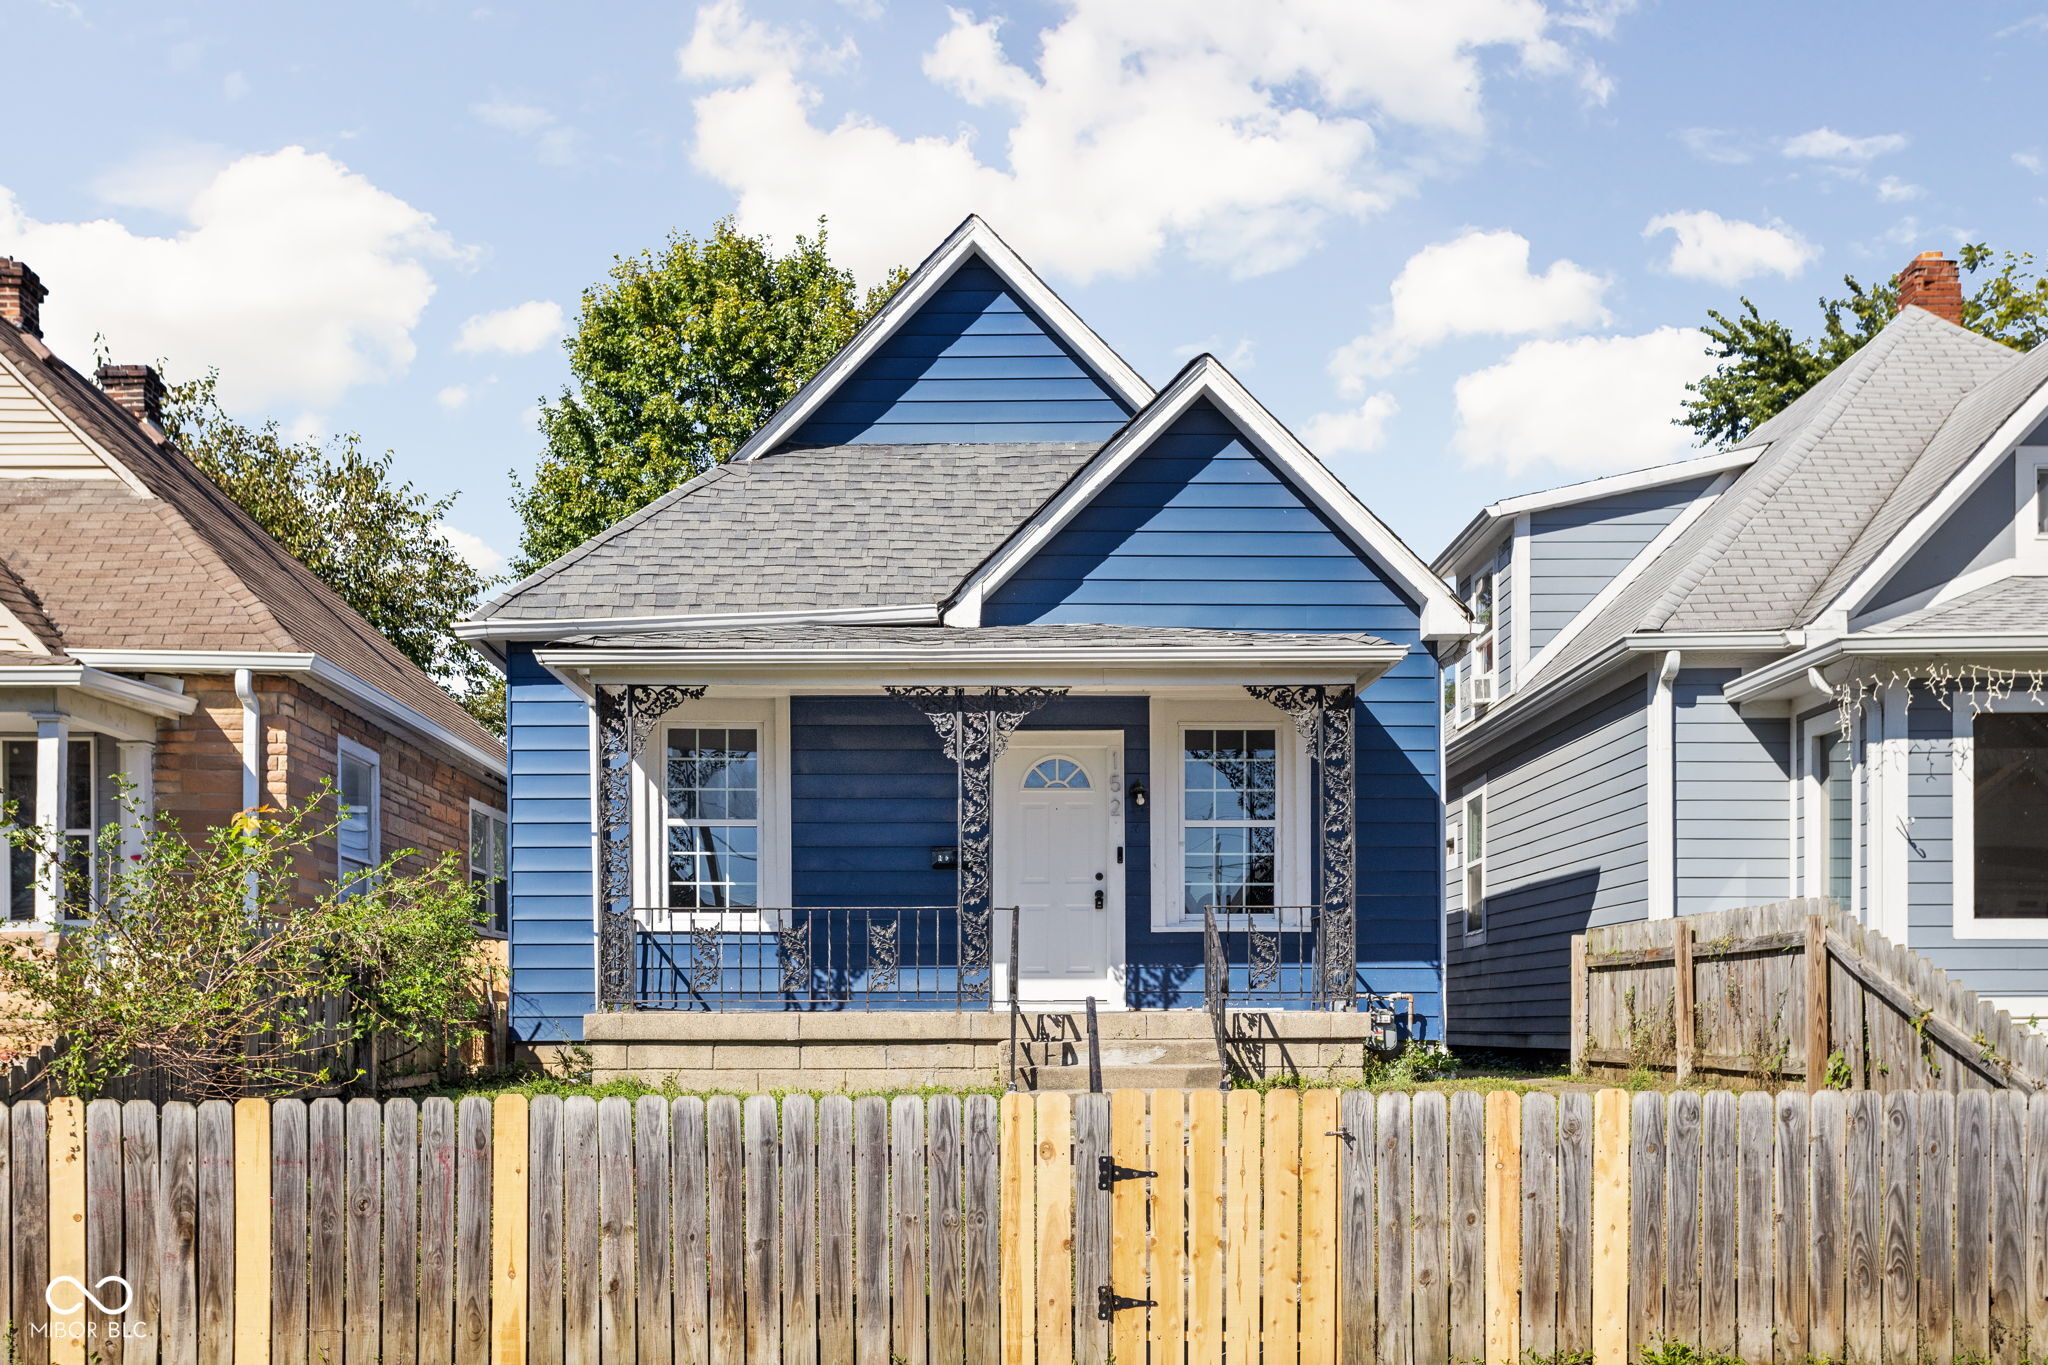
Active
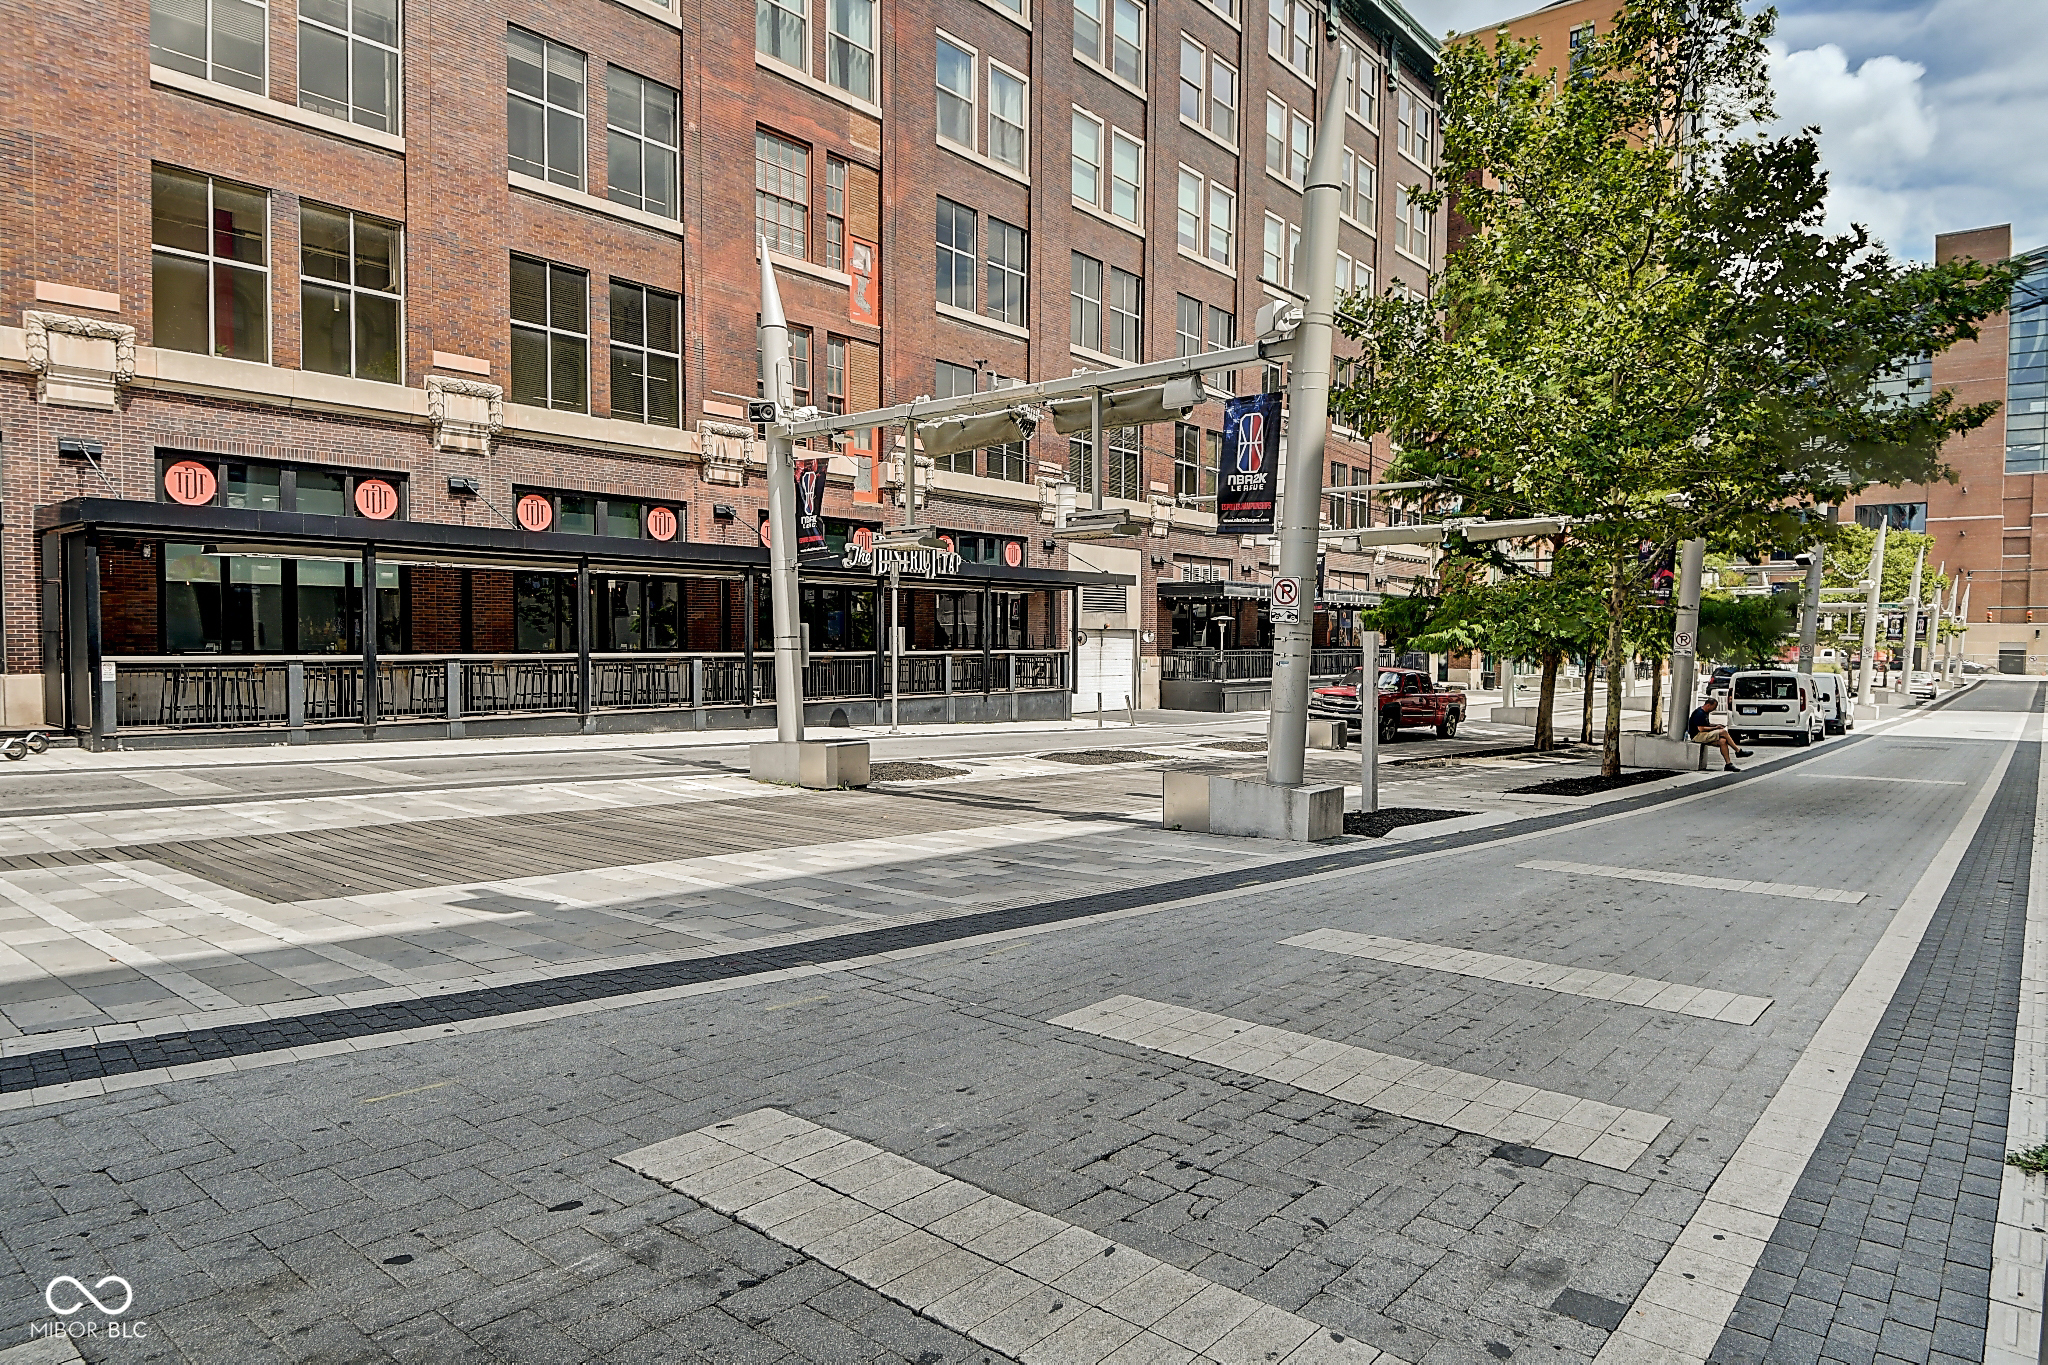
$134,900
3
bds
|
1
ba
|
1,208
sqft
|
built
1920
1526 Lawton Ave, Indianapolis, IN 46203
$482
Cash flow
18.6%
Cash-on-Cash Return
10.4%
Cap rate
1.3%
Rent to Value Ratio
1,993 out of 2,135 properties for sale in Indianapolis, IN
Limited Results Shown
Create a free account, or log in to reveal all property listings and enjoy the complete experience.
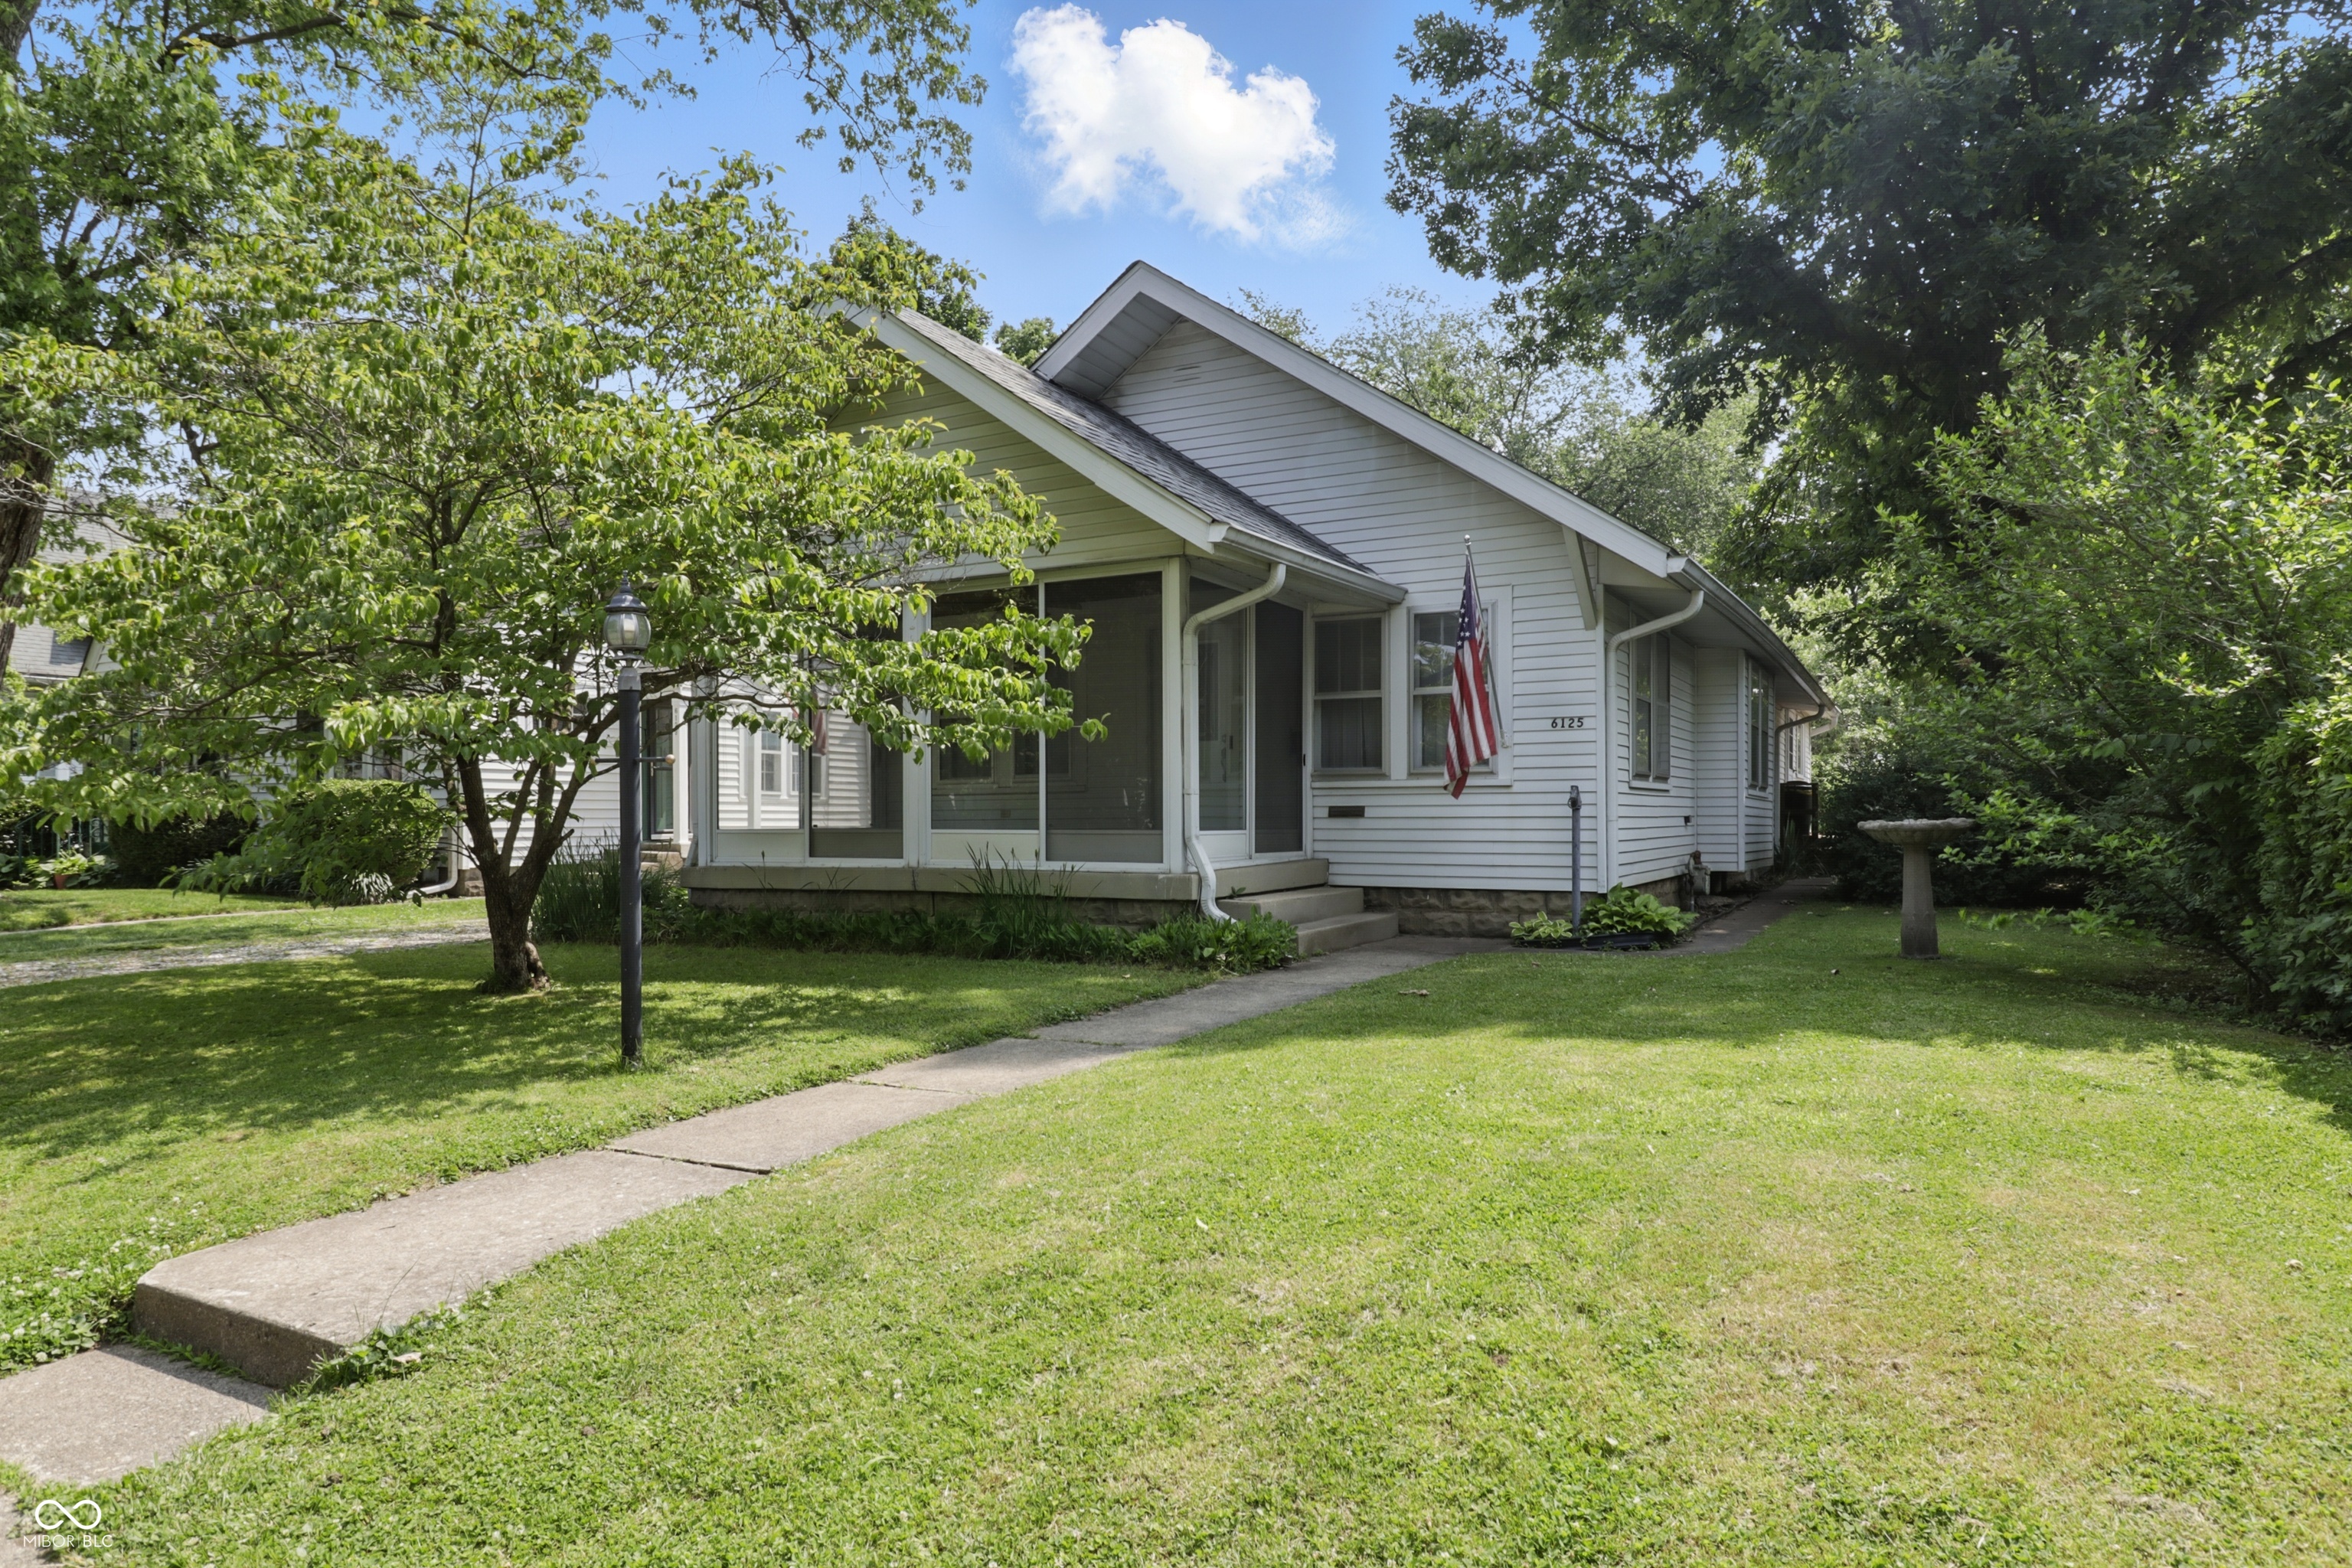
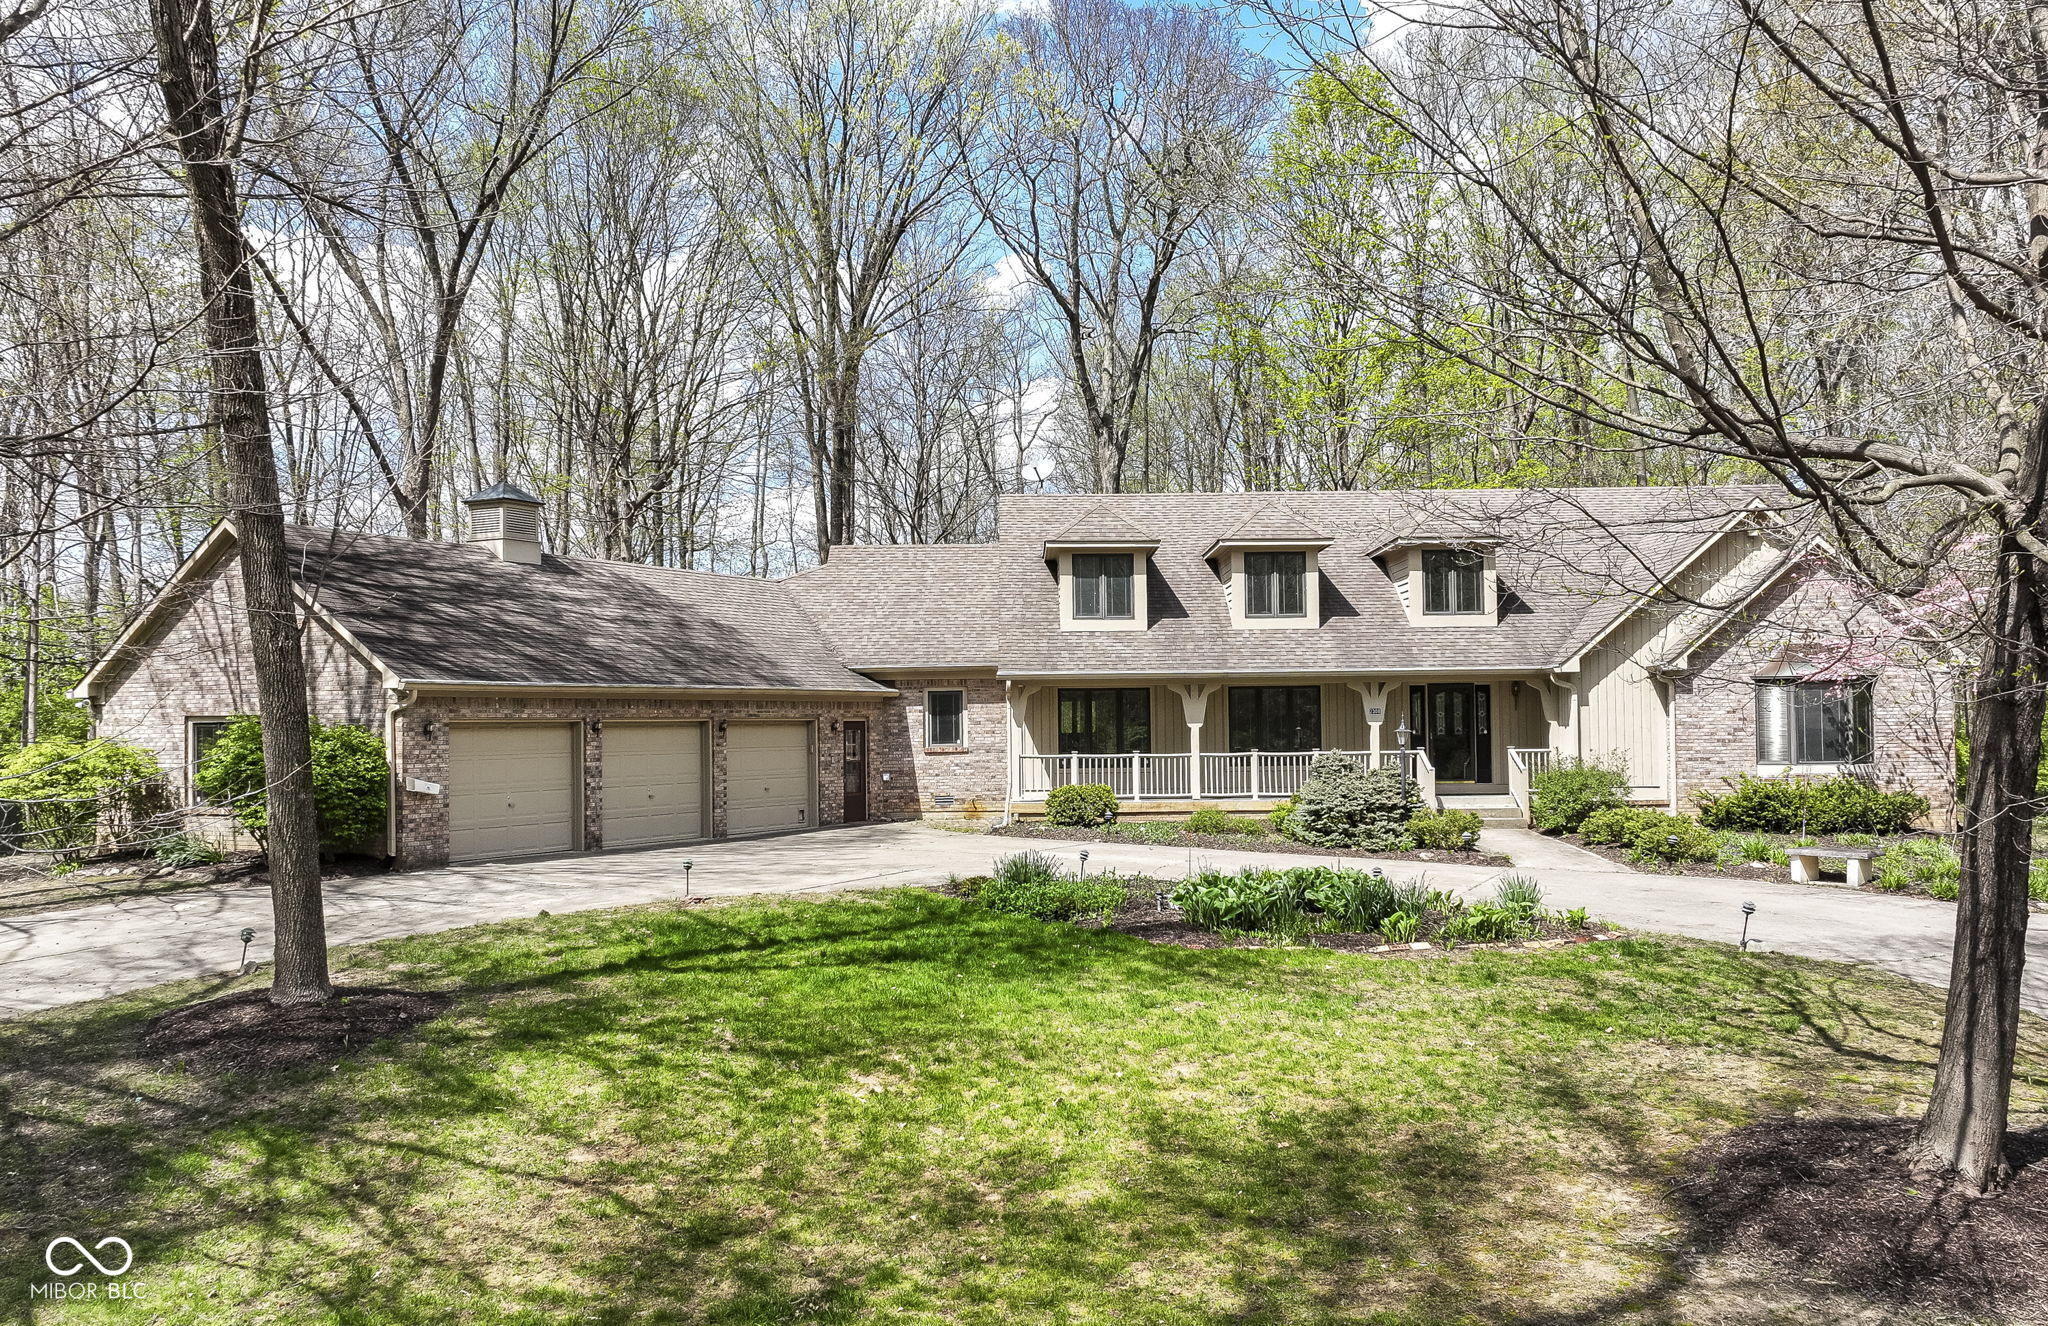
Active
$425,000
3
bds
|
1
ba
|
1,449
sqft
|
built
1920
6125 Winthrop Ave, Indianapolis, IN 46220
$-659
Cash flow
-8.1%
Cash-on-Cash Return
4.3%
Cap rate
0.5%
Rent to Value Ratio
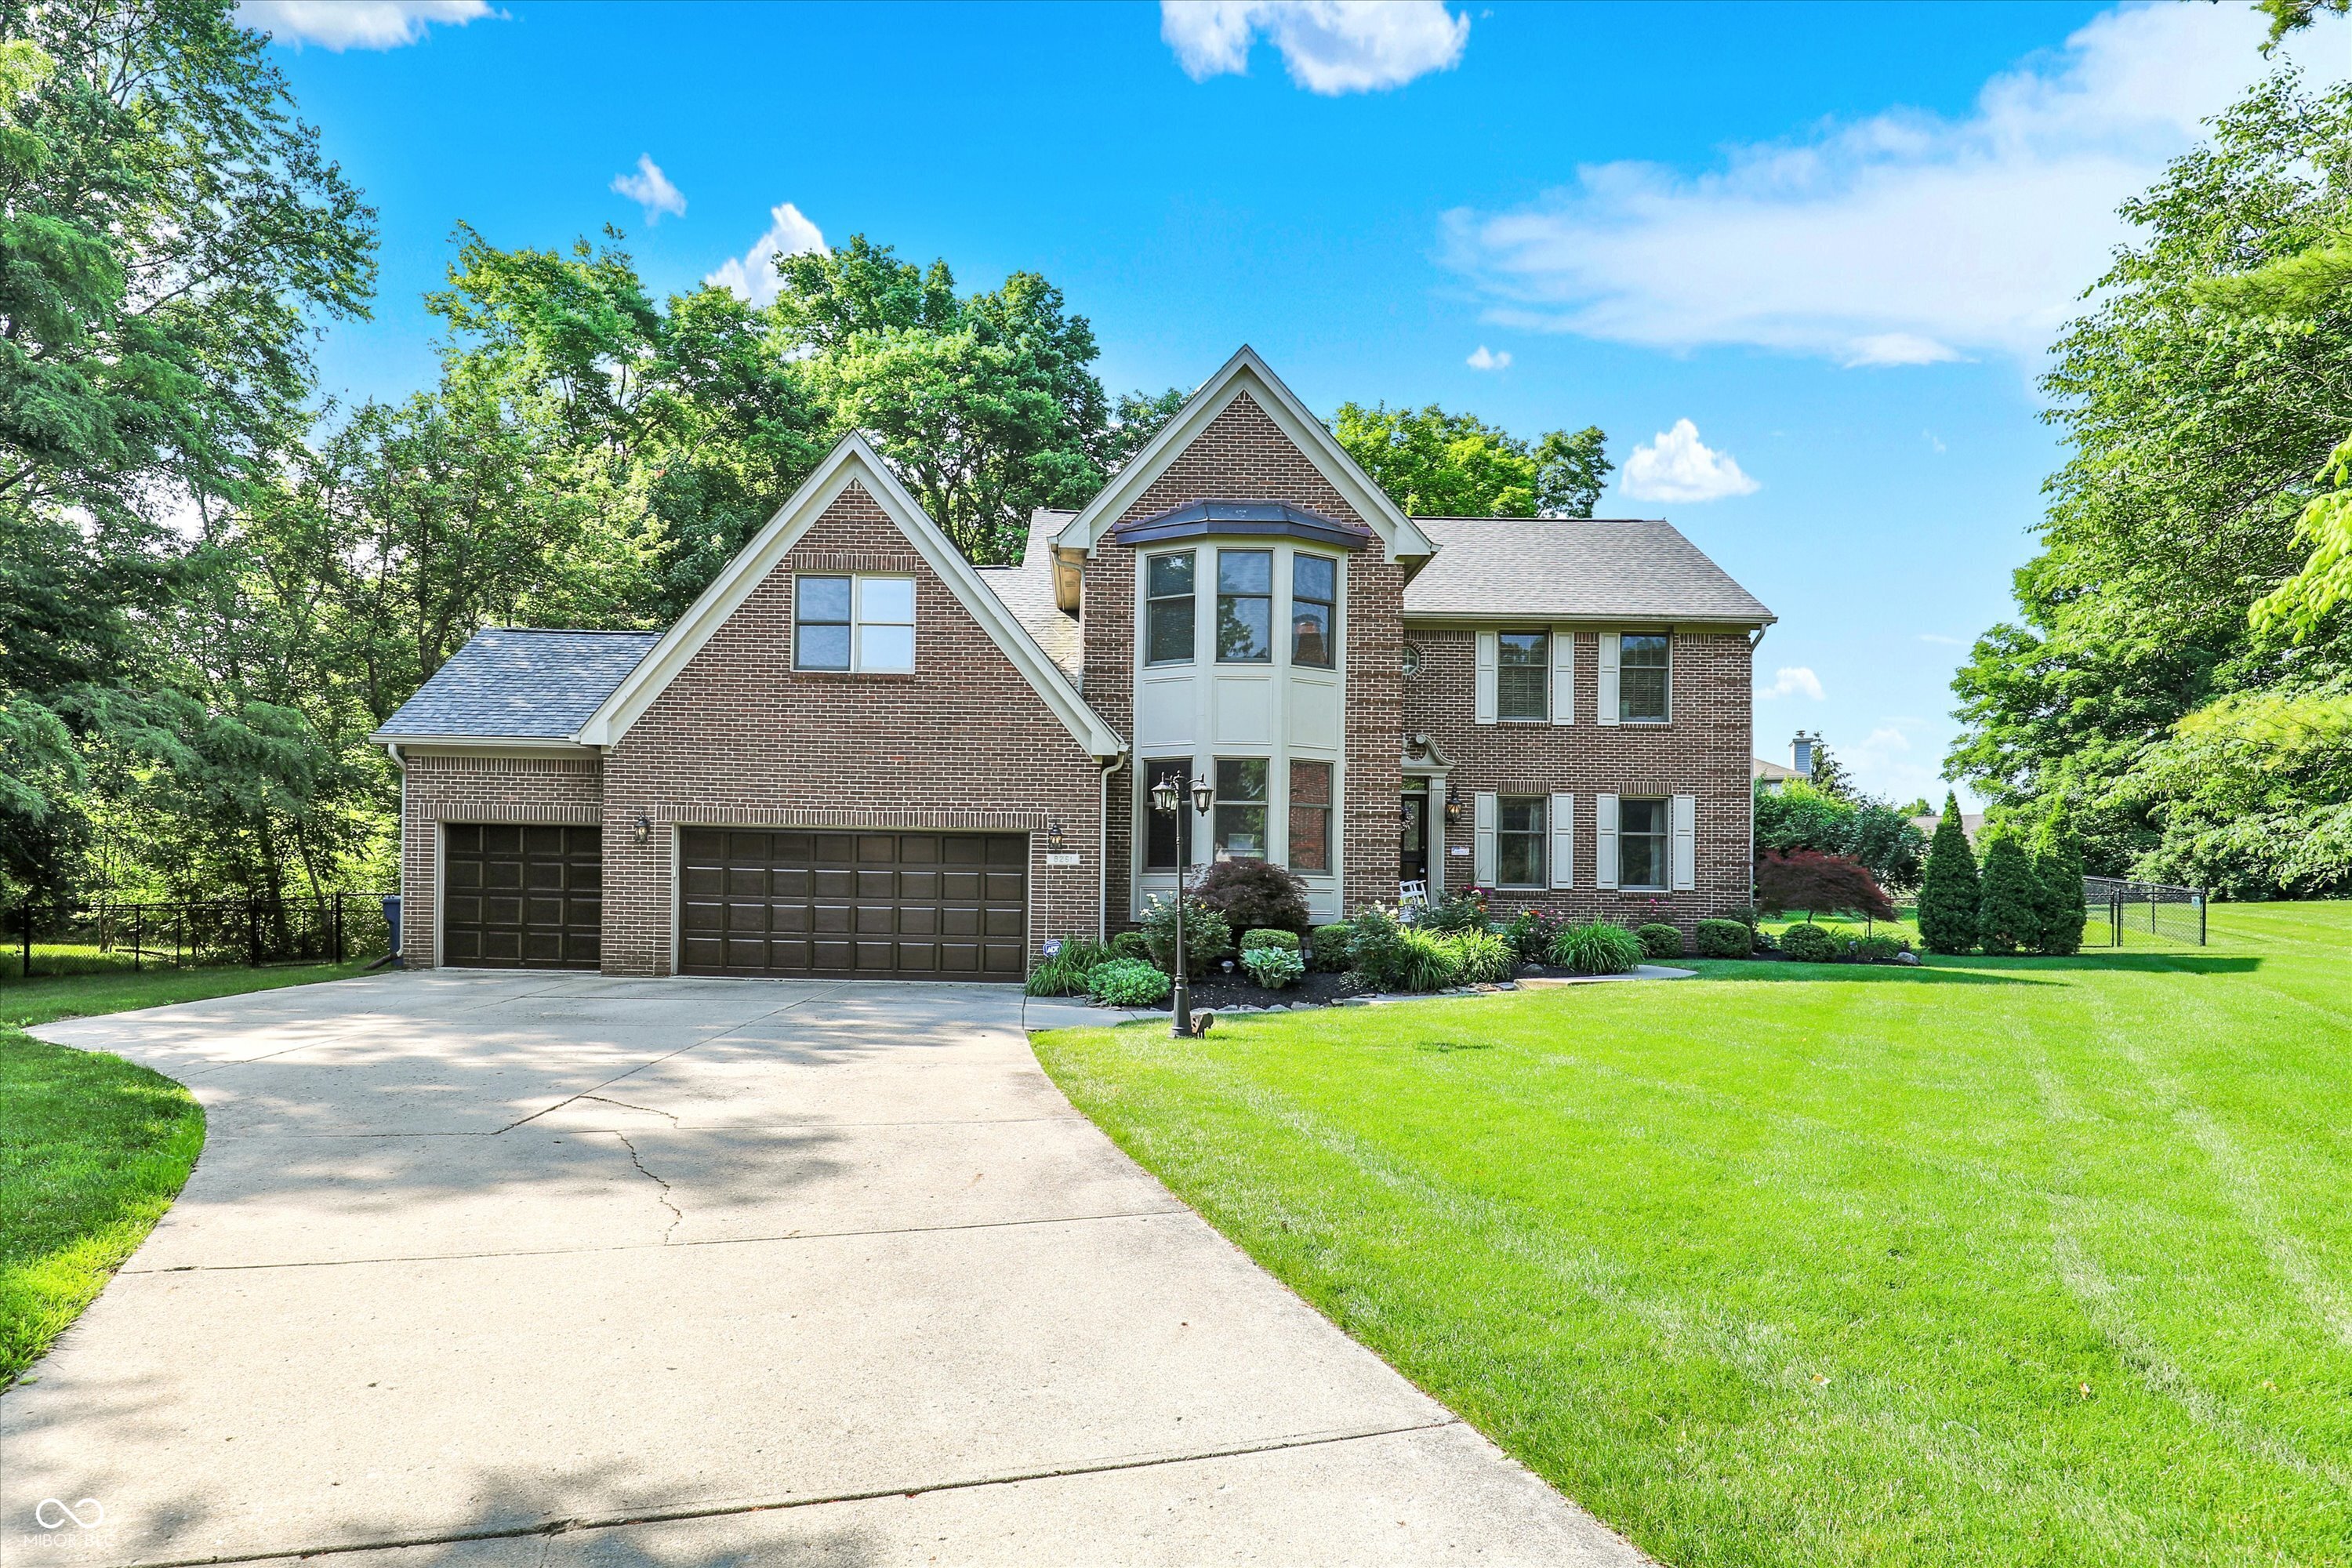
Pending
$600,000
4
bds
|
3
ba
|
2,978
sqft
|
built
1989
8261 Twin Pointe Cir, Indianapolis, IN 46236
$-426
Cash flow
-3.7%
Cash-on-Cash Return
5.3%
Cap rate
0.7%
Rent to Value Ratio
Active
$899,000
4
bds
|
3
ba
|
2,914
sqft
|
built
1930
5261 N Pennsylvania St, Indianapolis, IN 46220
$-2,190
Cash flow
-12.7%
Cash-on-Cash Return
3.2%
Cap rate
0.4%
Rent to Value Ratio
Active
$297,000
4
bds
|
3
ba
|
2,322
sqft
|
built
2004
3445 Brandenburg Blvd, Indianapolis, IN 46239
$-26
Cash flow
-0.5%
Cash-on-Cash Return
6.0%
Cap rate
0.7%
Rent to Value Ratio
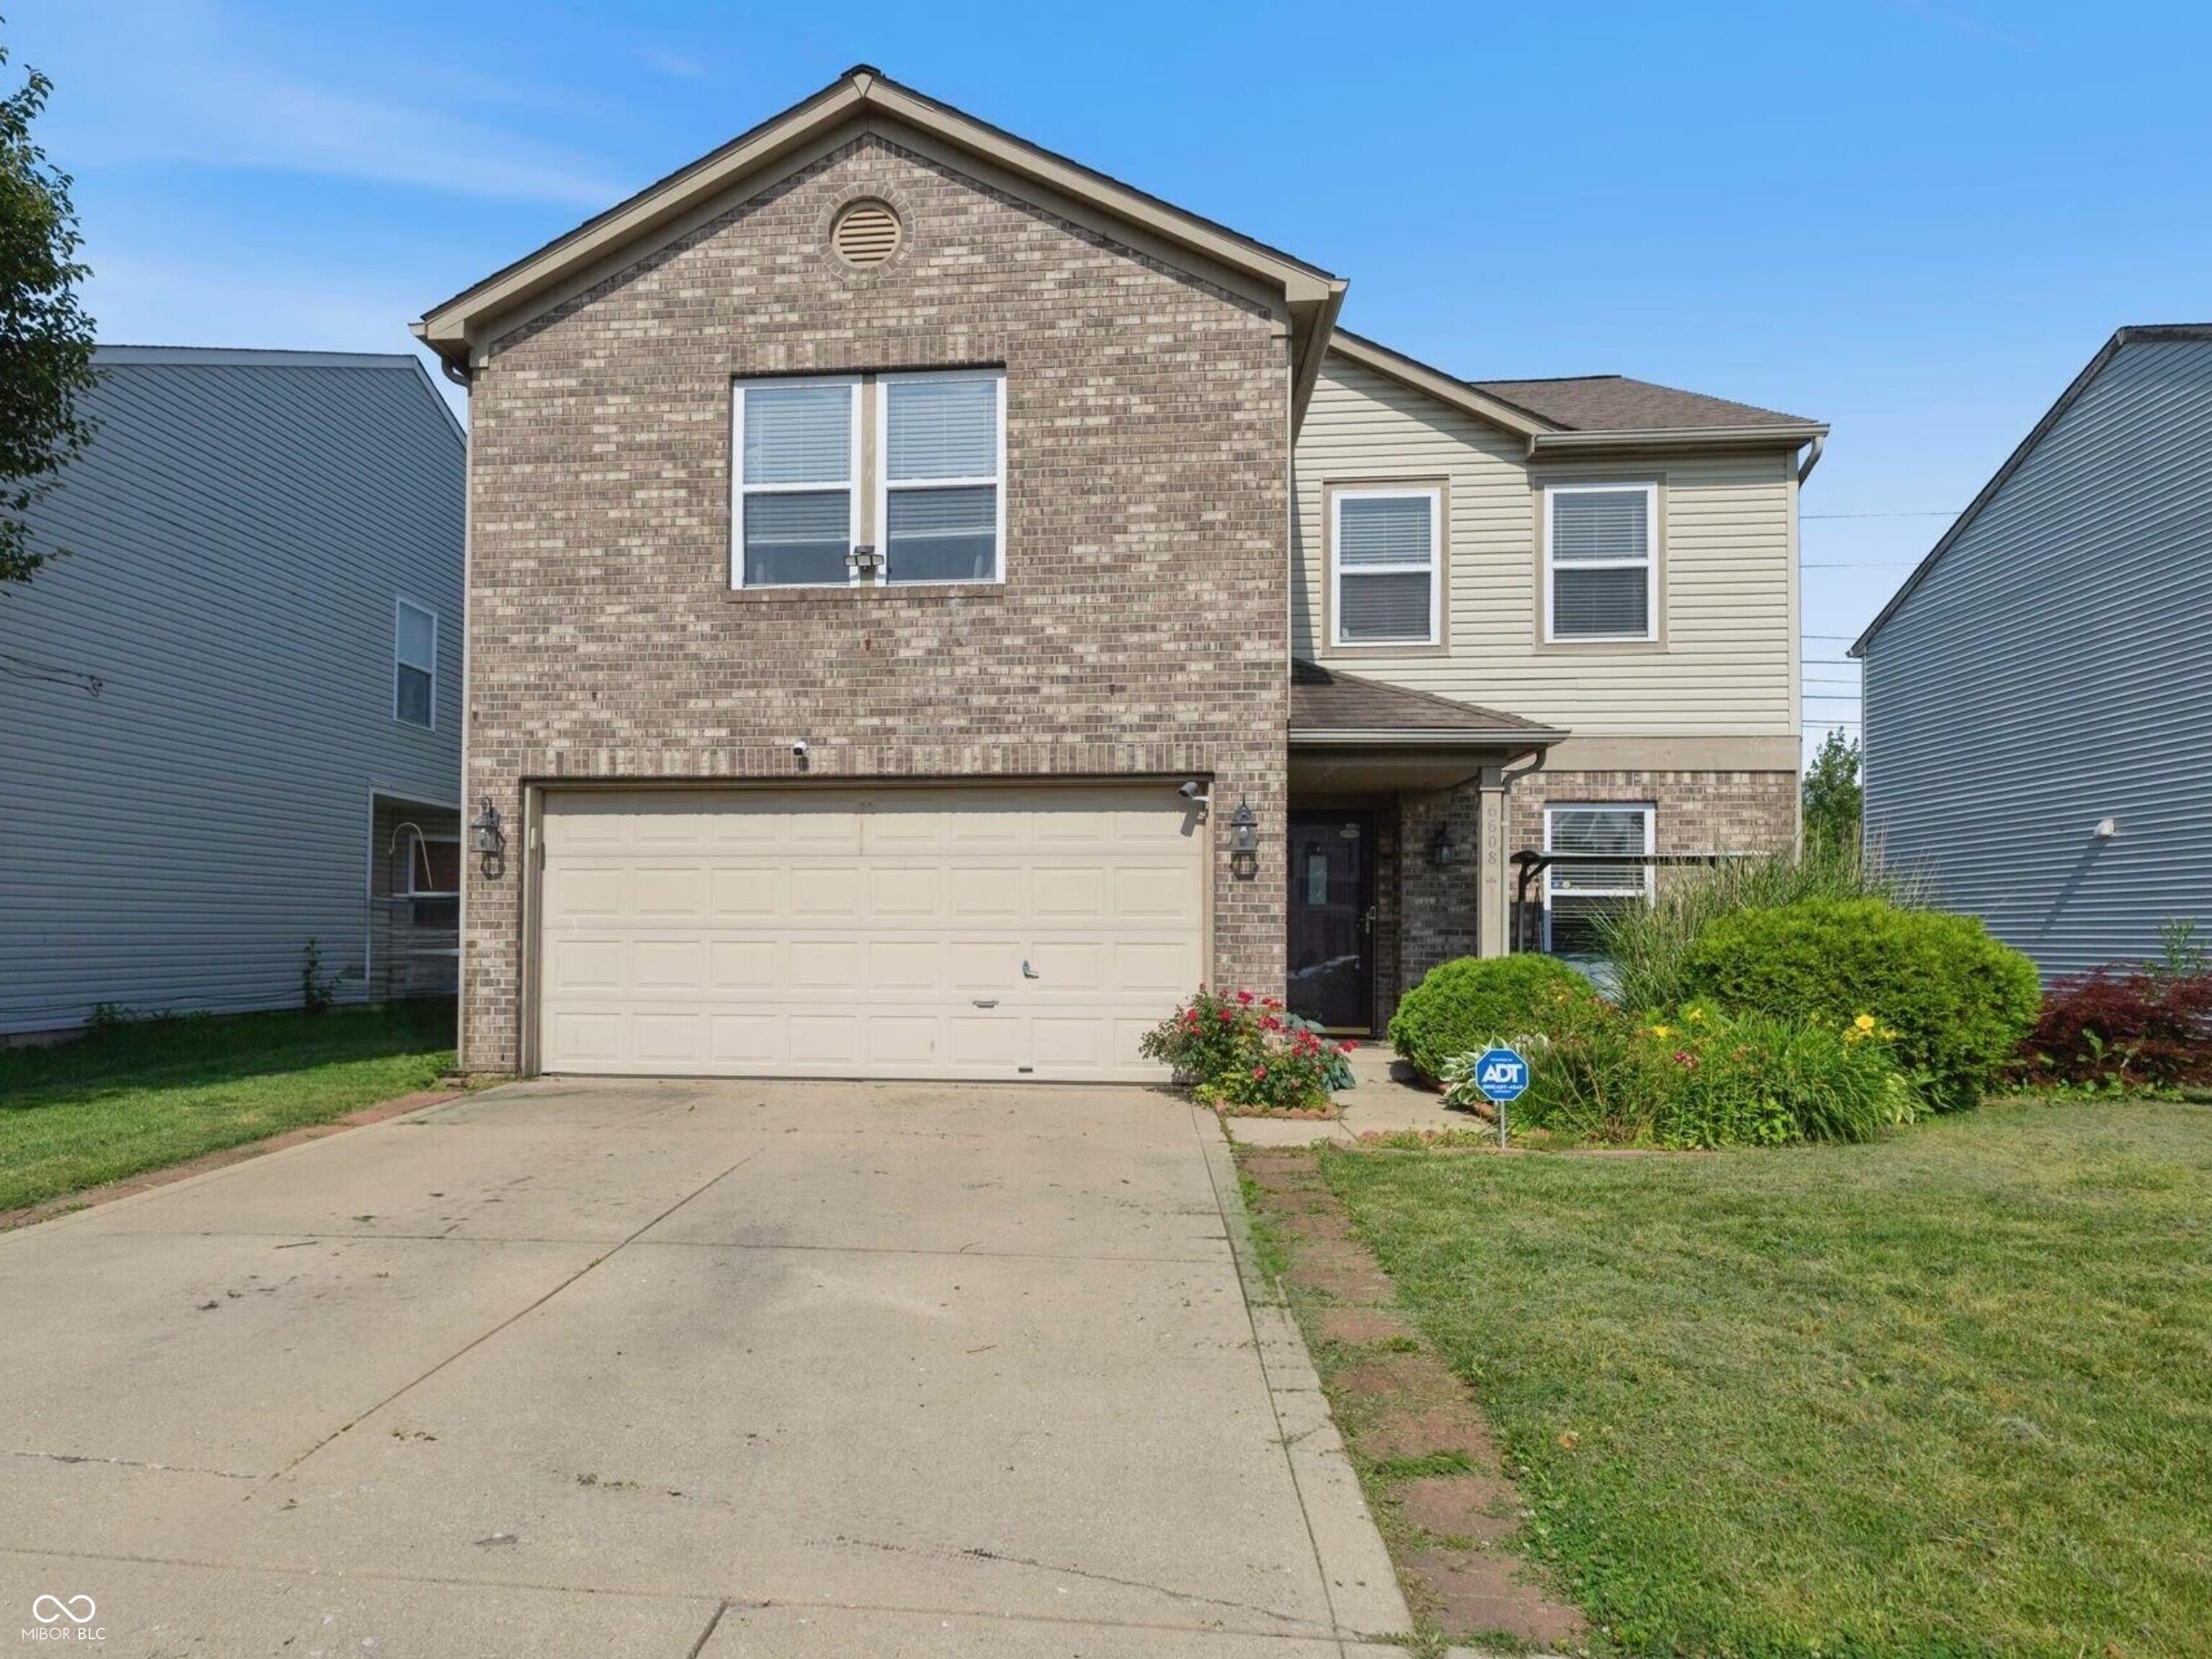
Active
$309,900
3
bds
|
3
ba
|
2,036
sqft
|
built
2000
6608 Sonesta Dr, Indianapolis, IN 46217
$-249
Cash flow
-4.2%
Cash-on-Cash Return
5.2%
Cap rate
0.6%
Rent to Value Ratio
Active
$174,000
3
bds
|
2
ba
|
1,456
sqft
|
built
1961
1749 N Graham Ave, Indianapolis, IN 46218
$213
Cash flow
6.4%
Cash-on-Cash Return
7.6%
Cap rate
0.9%
Rent to Value Ratio
Active
$85,000
4
bds
|
2
ba
|
1,632
sqft
|
built
1953
1830 S Chester Ave, Indianapolis, IN 46203
$600
Cash flow
36.8%
Cash-on-Cash Return
14.6%
Cap rate
1.8%
Rent to Value Ratio
Active
$134,900
3
bds
|
1
ba
|
1,208
sqft
|
built
1920
1526 Lawton Ave, Indianapolis, IN 46203
$482
Cash flow
18.6%
Cash-on-Cash Return
10.4%
Cap rate
1.3%
Rent to Value Ratio
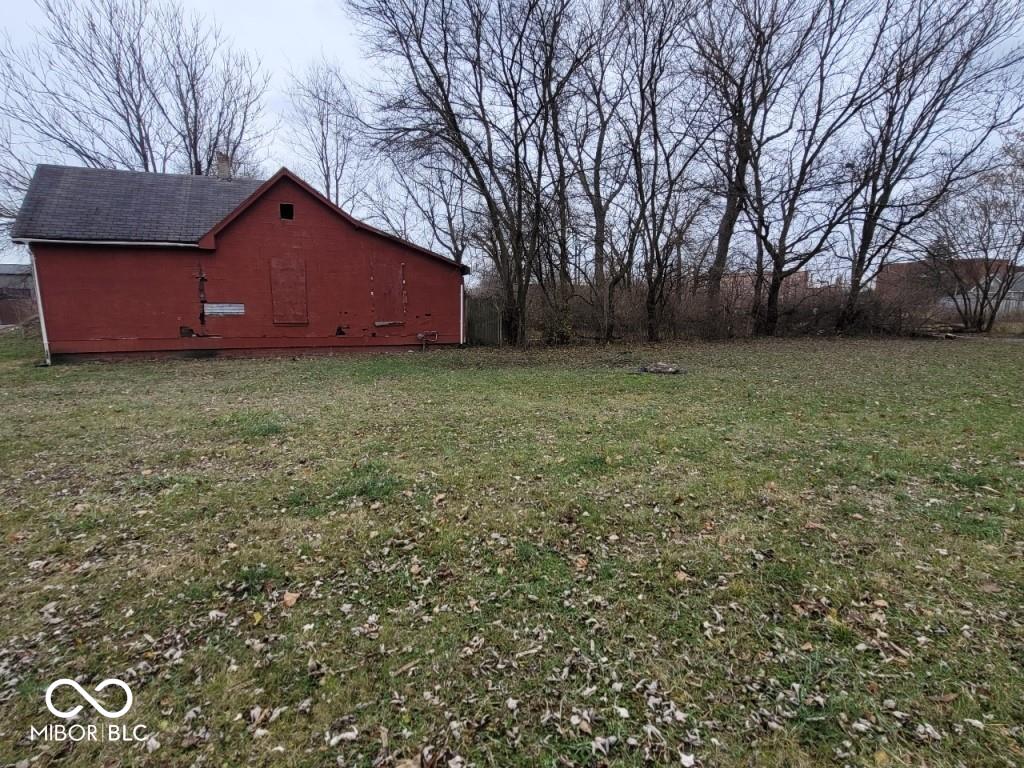
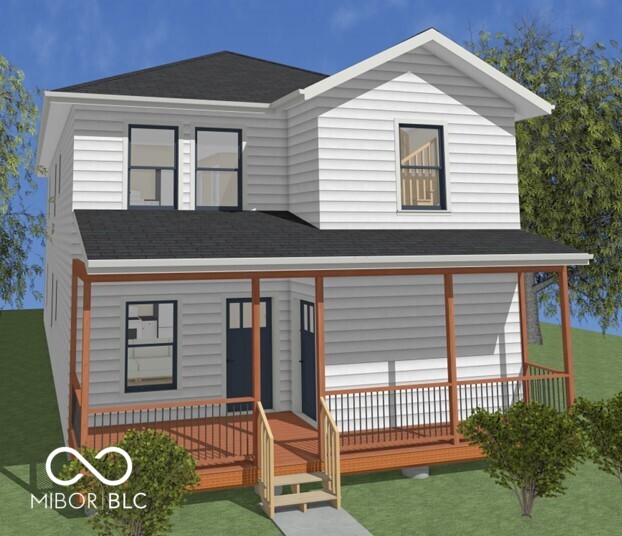
Active
$85,000
2
bds
|
1
ba
|
960
sqft
|
built
1955
1724 Sheldon St, Indianapolis, IN 46218
$393
Cash flow
24.1%
Cash-on-Cash Return
11.7%
Cap rate
1.4%
Rent to Value Ratio
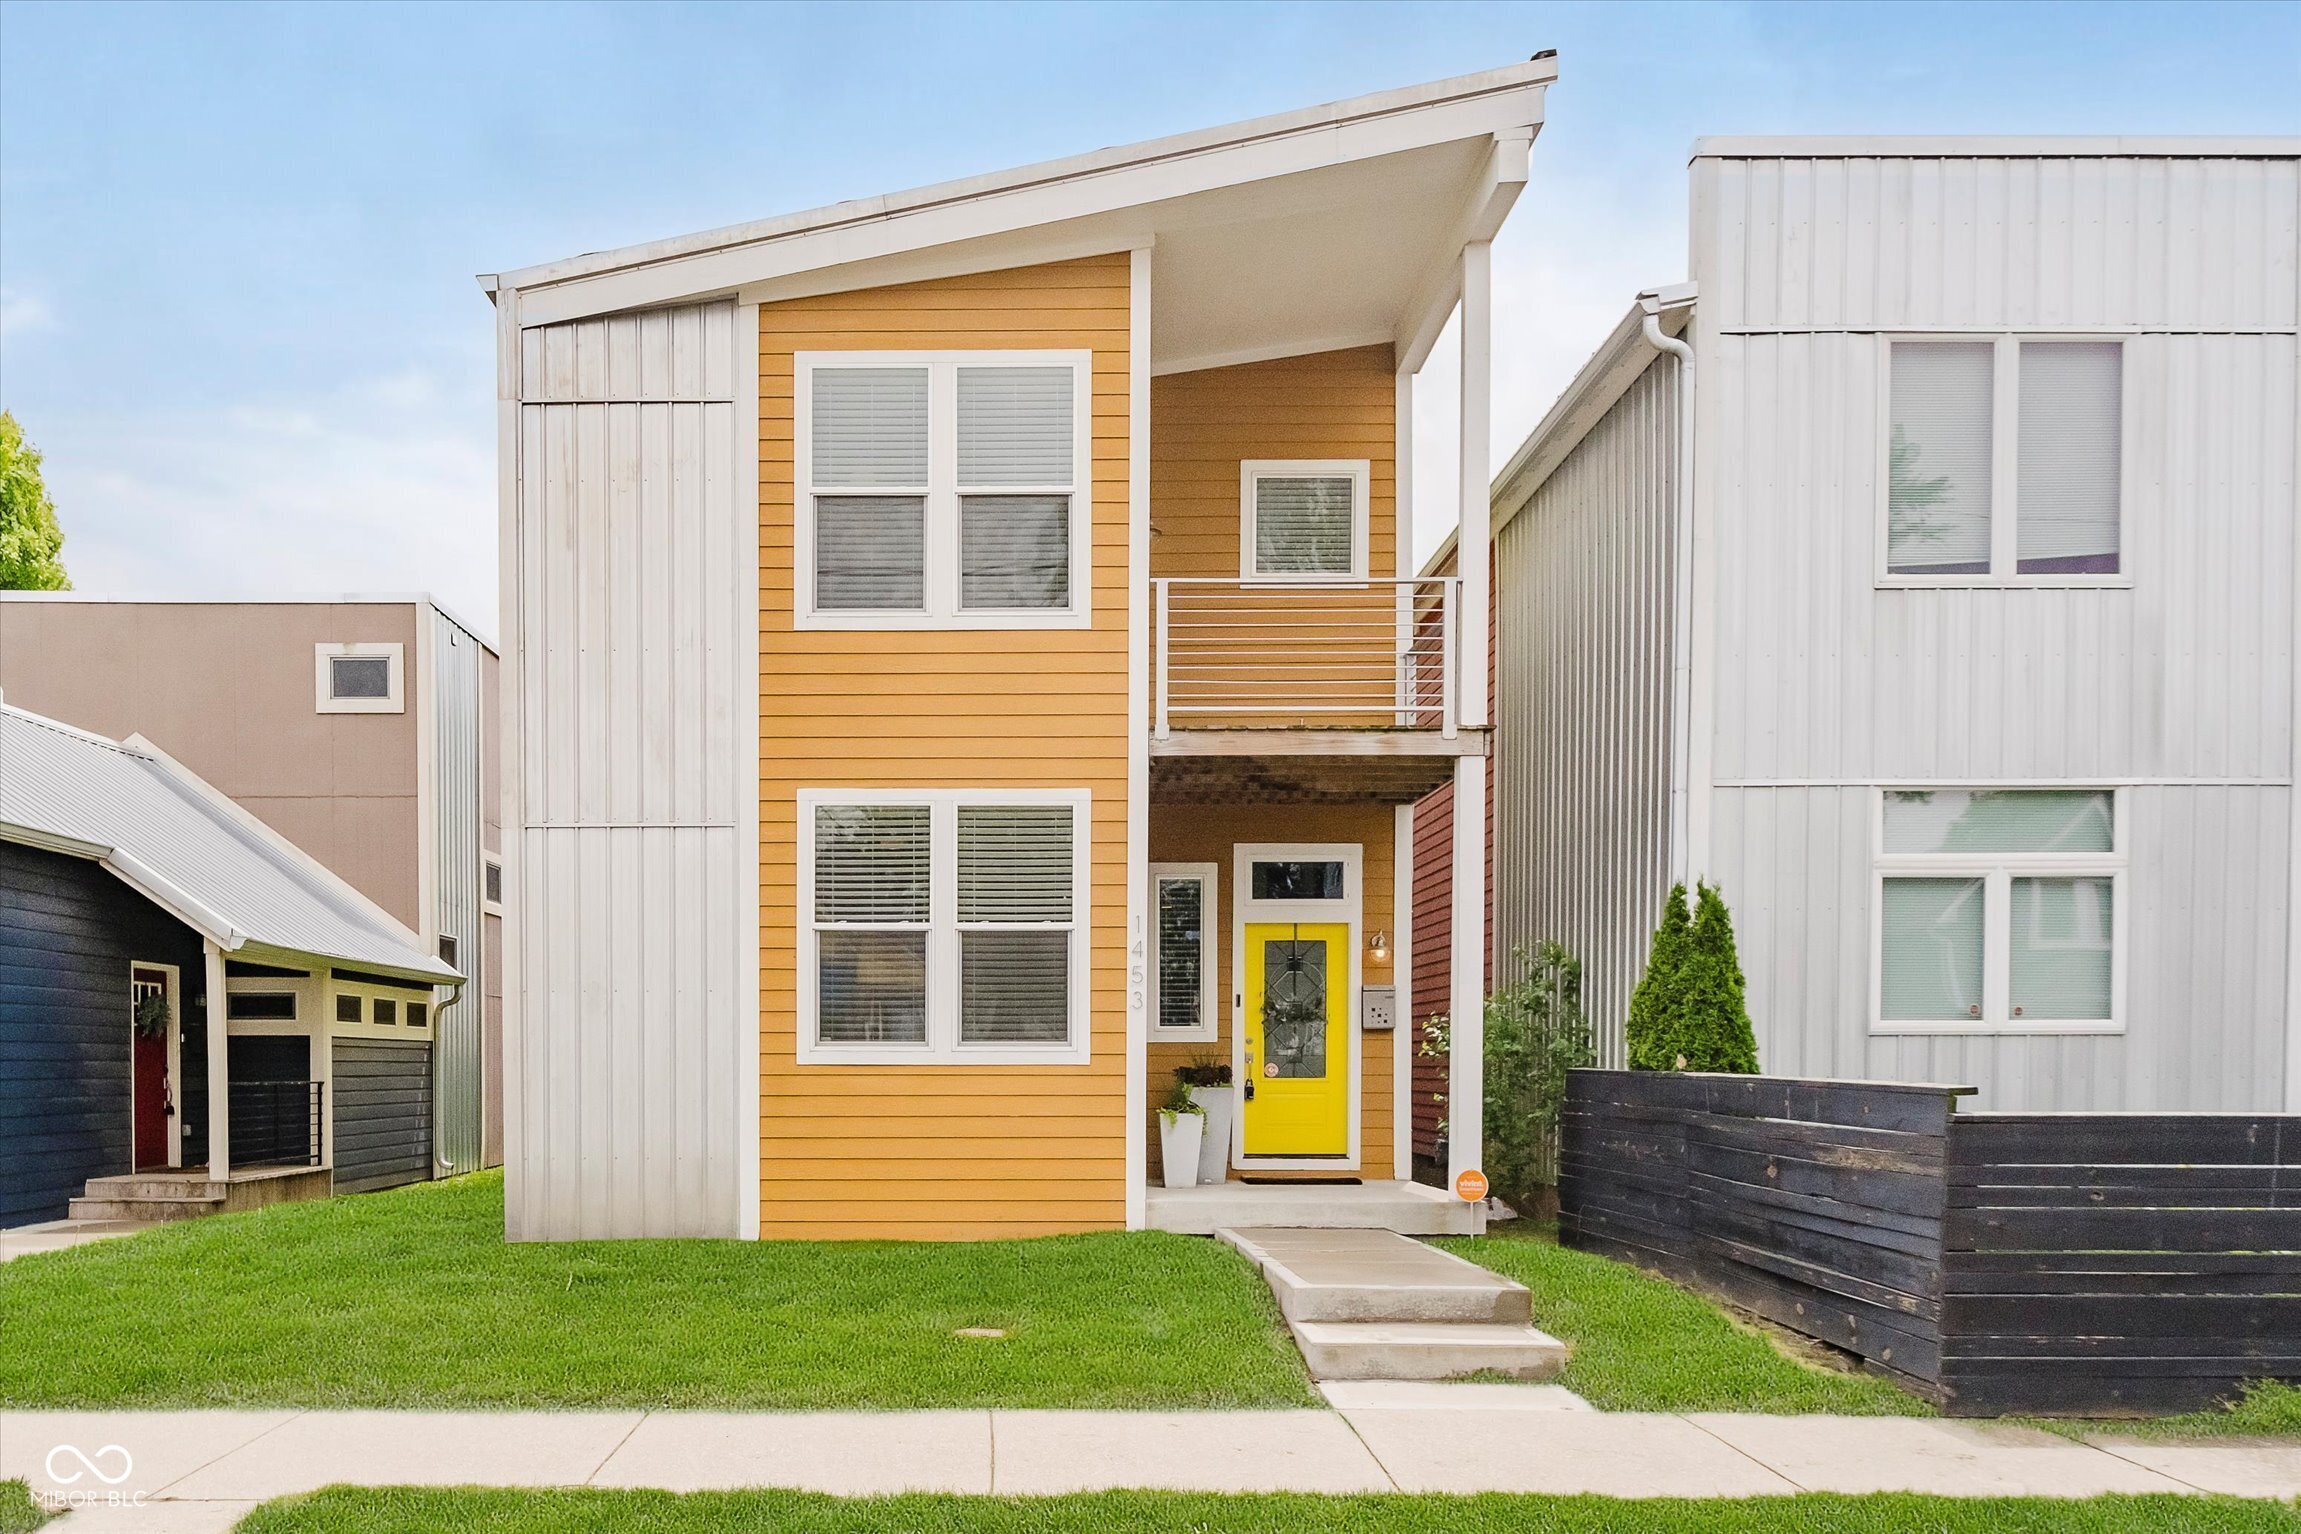
Pending
$475,000
3
bds
|
3
ba
|
2,260
sqft
|
built
2016
1453 English Ave, Indianapolis, IN 46201
$-708
Cash flow
-7.8%
Cash-on-Cash Return
4.4%
Cap rate
0.5%
Rent to Value Ratio
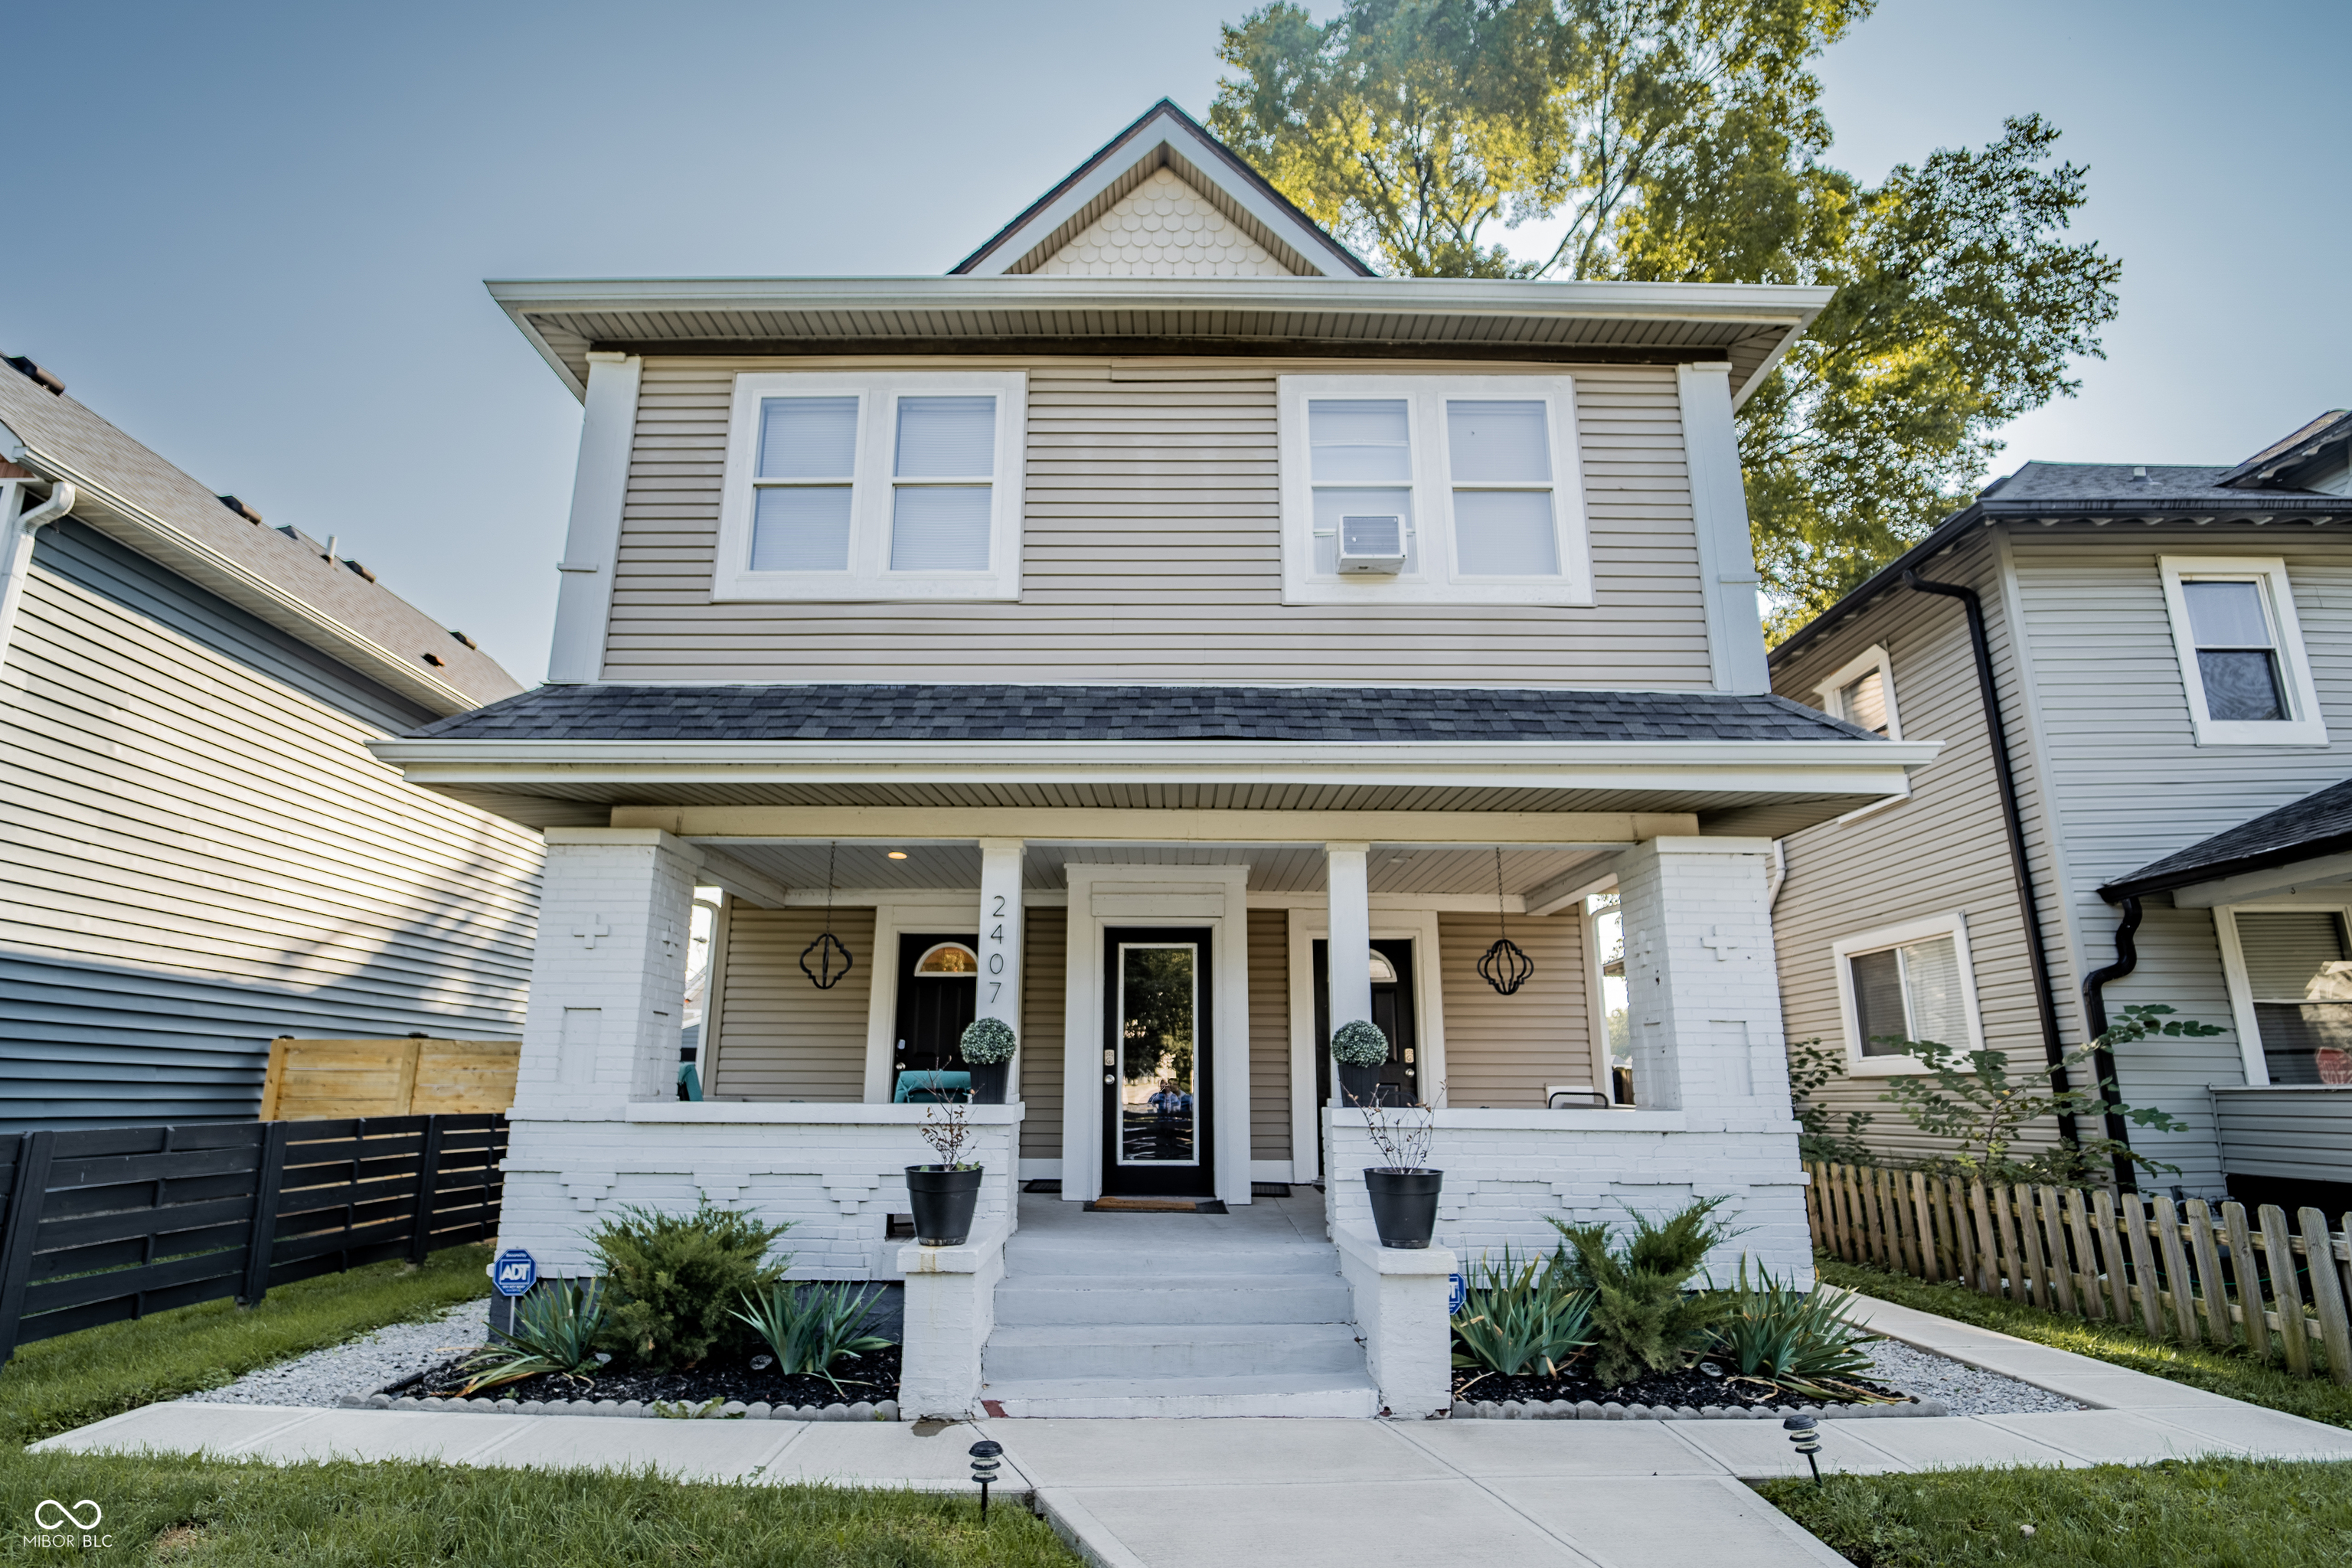
Active
$750,000
4
bds
|
0
ba
|
0
sqft
|
built
1914
2407 N Capitol Ave, Indianapolis, IN 46208
$-2,255
Cash flow
-15.7%
Cash-on-Cash Return
2.5%
Cap rate
0.3%
Rent to Value Ratio
Active
$465,000
6
bds
|
0
ba
|
0
sqft
|
built
1917
1315 Union St, Indianapolis, IN 46225
$-1,278
Cash flow
-14.3%
Cash-on-Cash Return
2.8%
Cap rate
0.3%
Rent to Value Ratio
Active
$294,900
2
bds
|
2
ba
|
1,219
sqft
|
built
2002
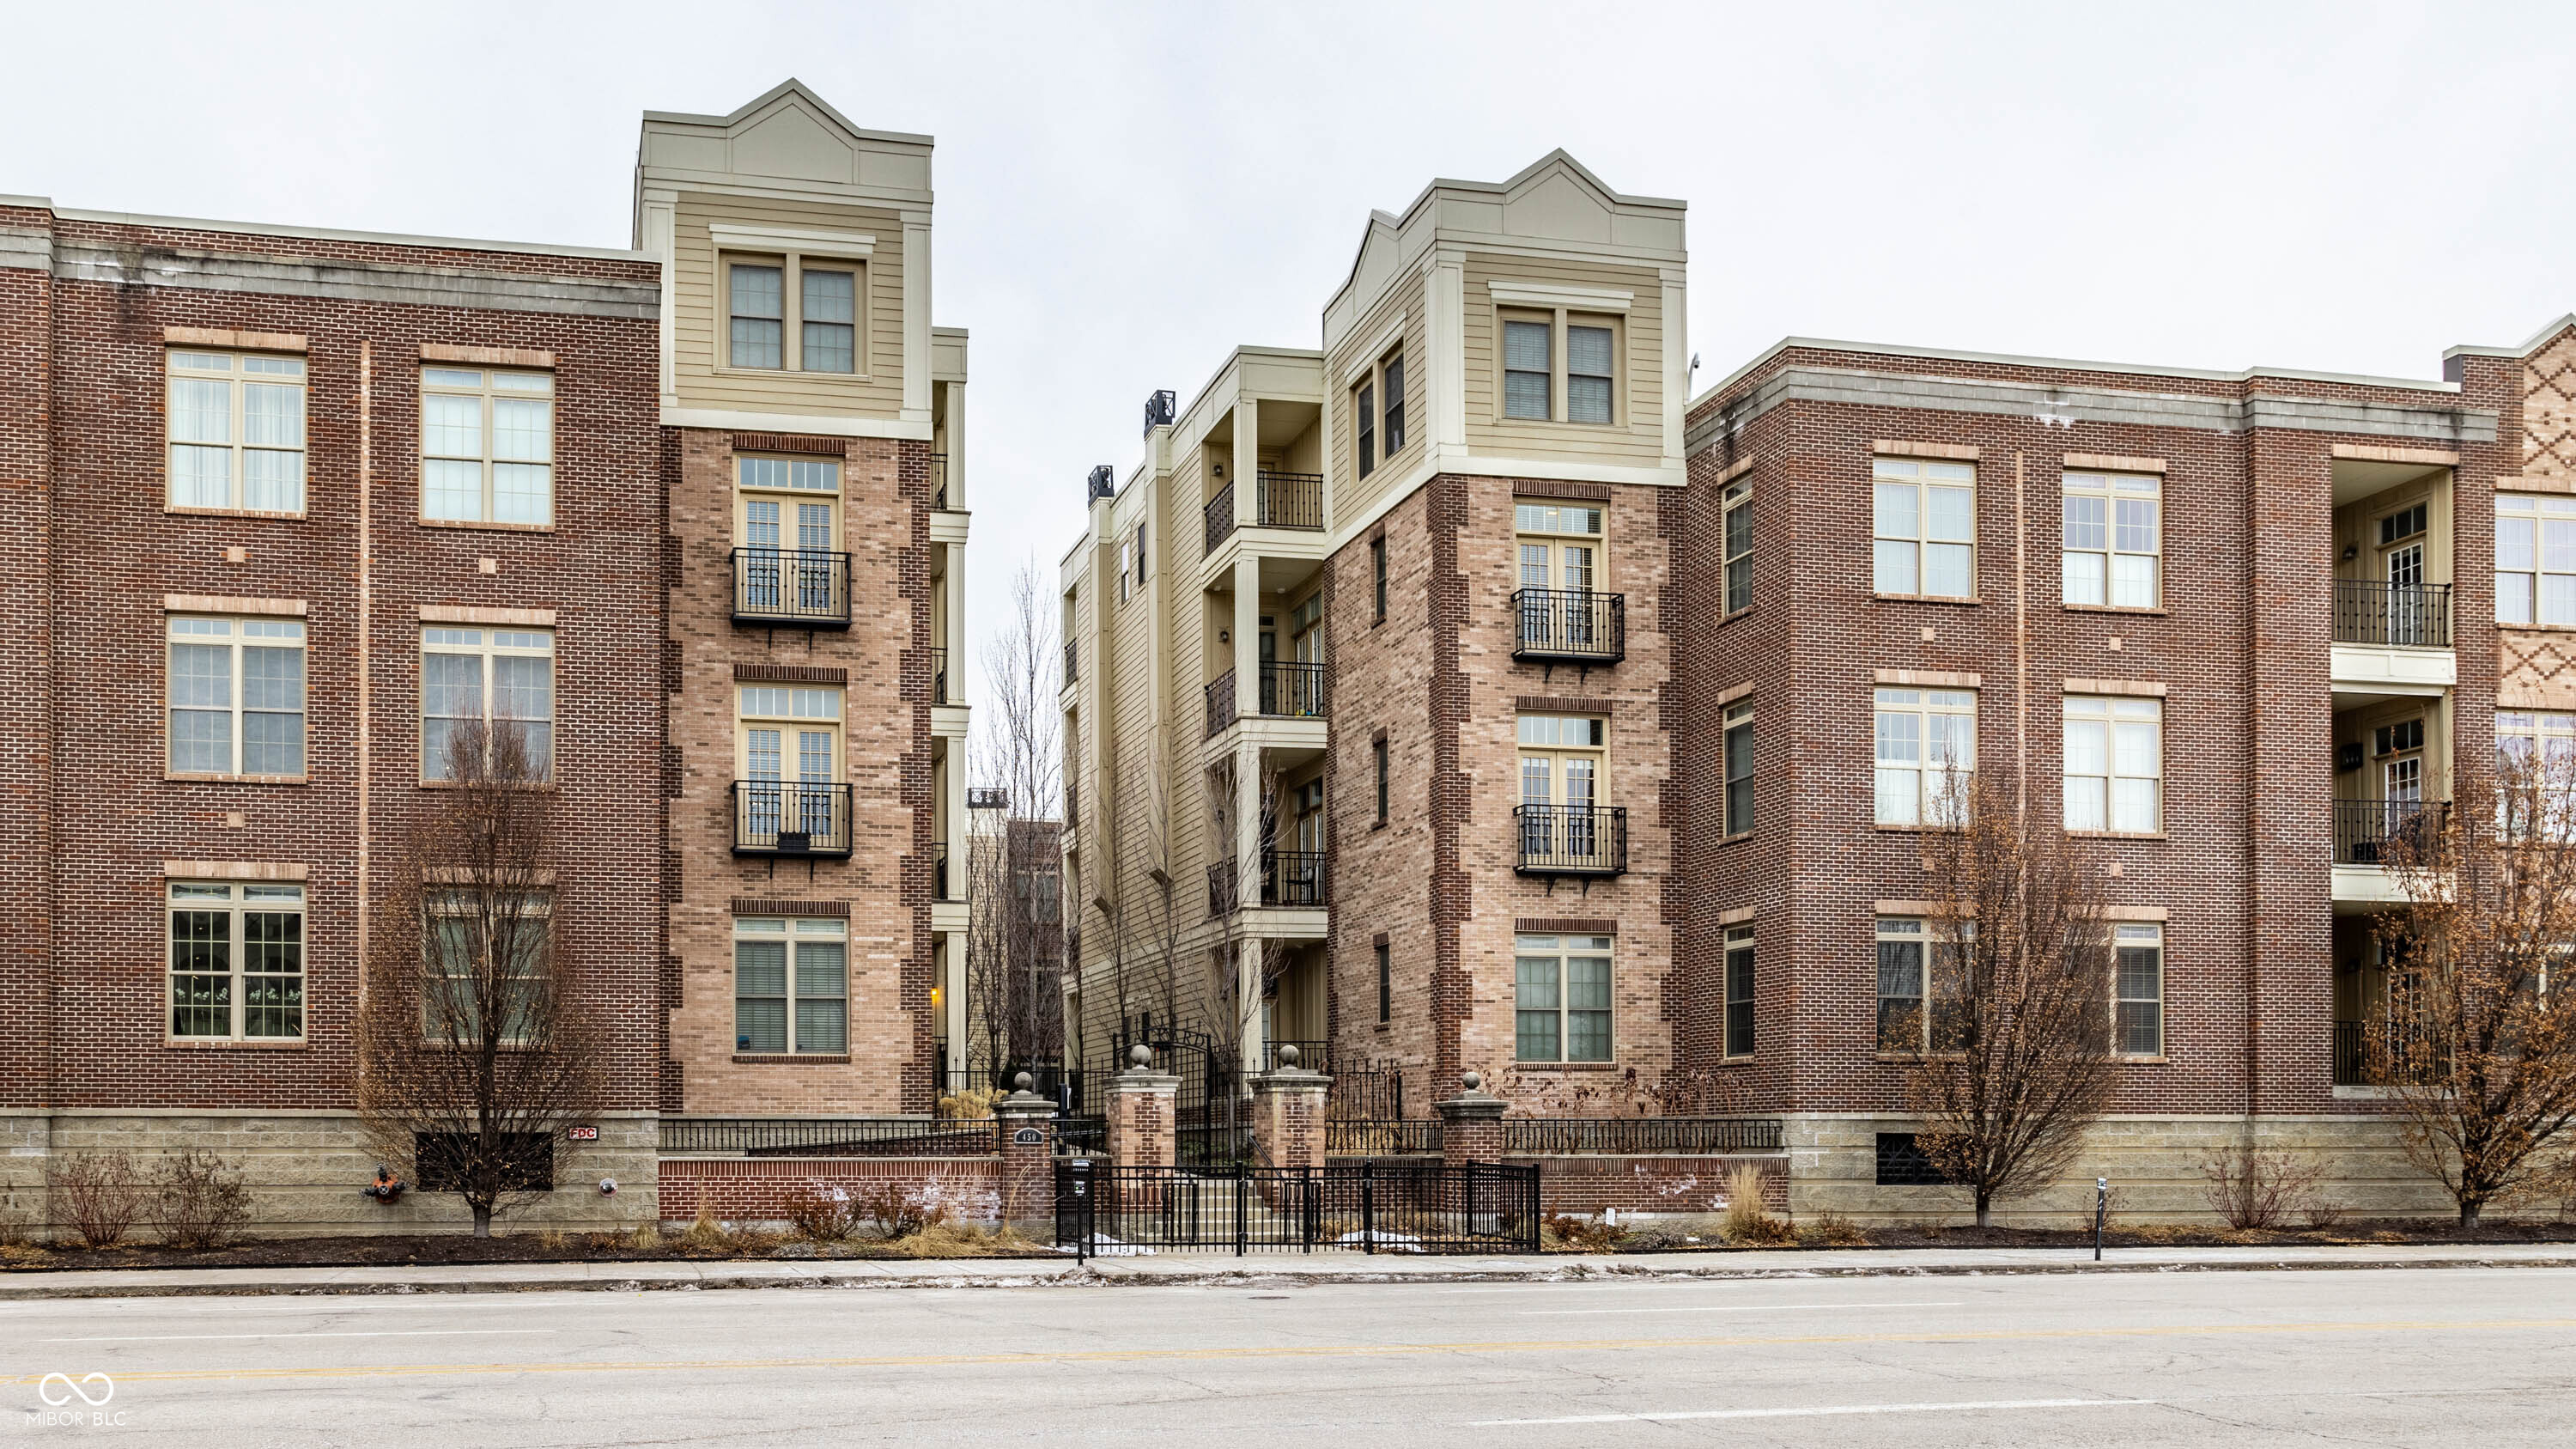
450 E Ohio St, Indianapolis, IN 46204
$-496
Cash flow
-8.8%
Cash-on-Cash Return
4.1%
Cap rate
0.7%
Rent to Value Ratio
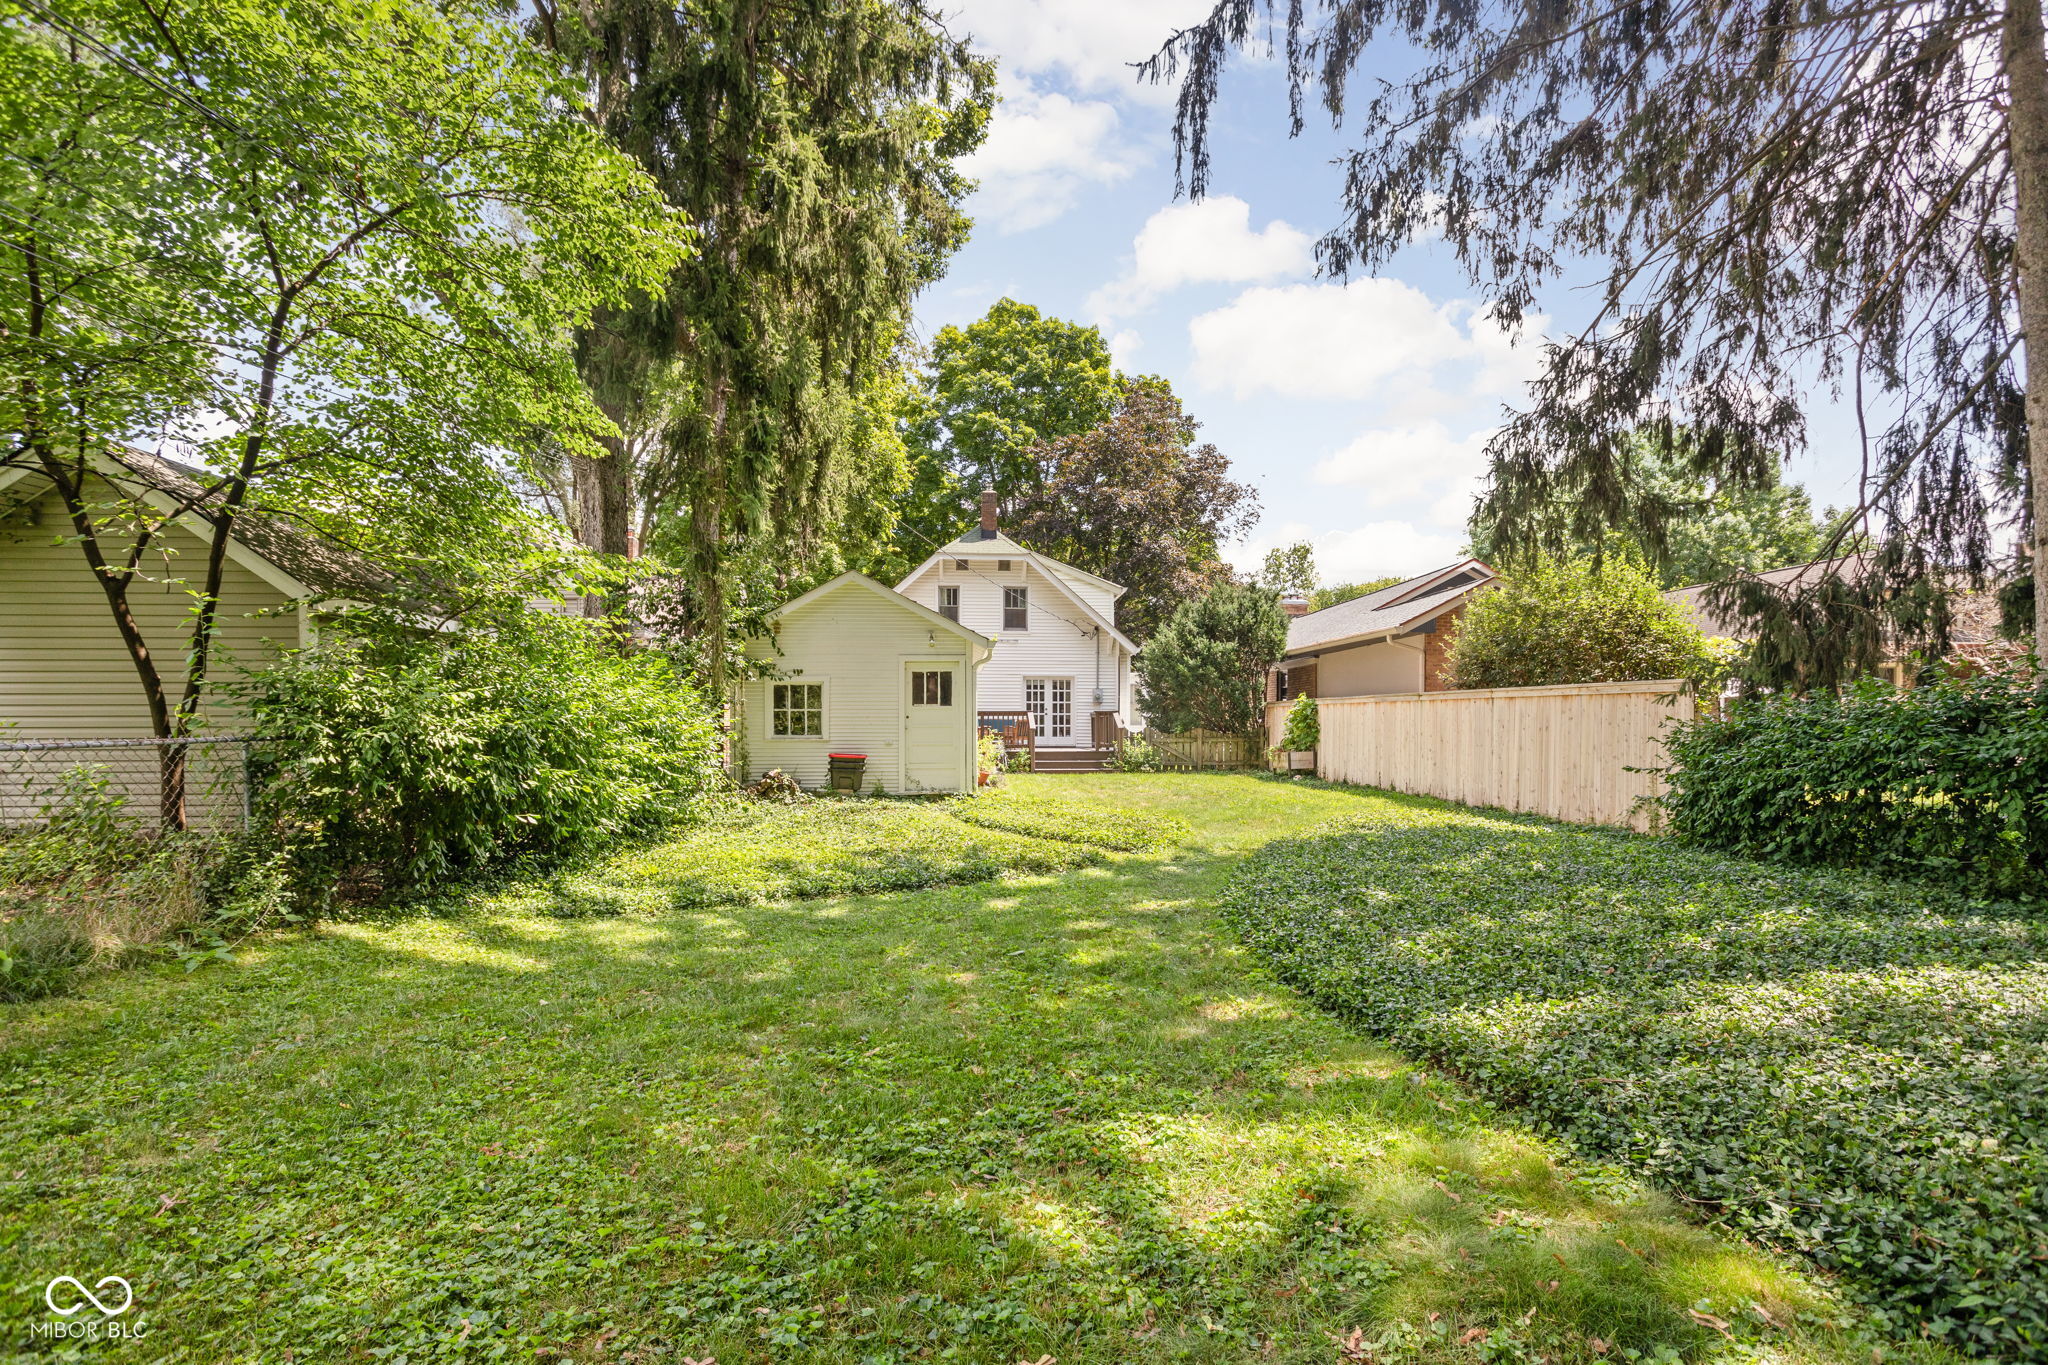
Pending
$329,900
4
bds
|
3
ba
|
2,144
sqft
|
built
1923
1321 Union St, Indianapolis, IN 46225
$-724
Cash flow
-11.5%
Cash-on-Cash Return
3.5%
Cap rate
0.4%
Rent to Value Ratio
Active
$260,000
3
bds
|
0
ba
|
0
sqft
|
built
1890
1808 E Washington St, Indianapolis, IN 46201
$-504
Cash flow
-10.1%
Cash-on-Cash Return
3.8%
Cap rate
0.5%
Rent to Value Ratio
Active
$519,900
2
bds
|
3
ba
|
1,681
sqft
|
built
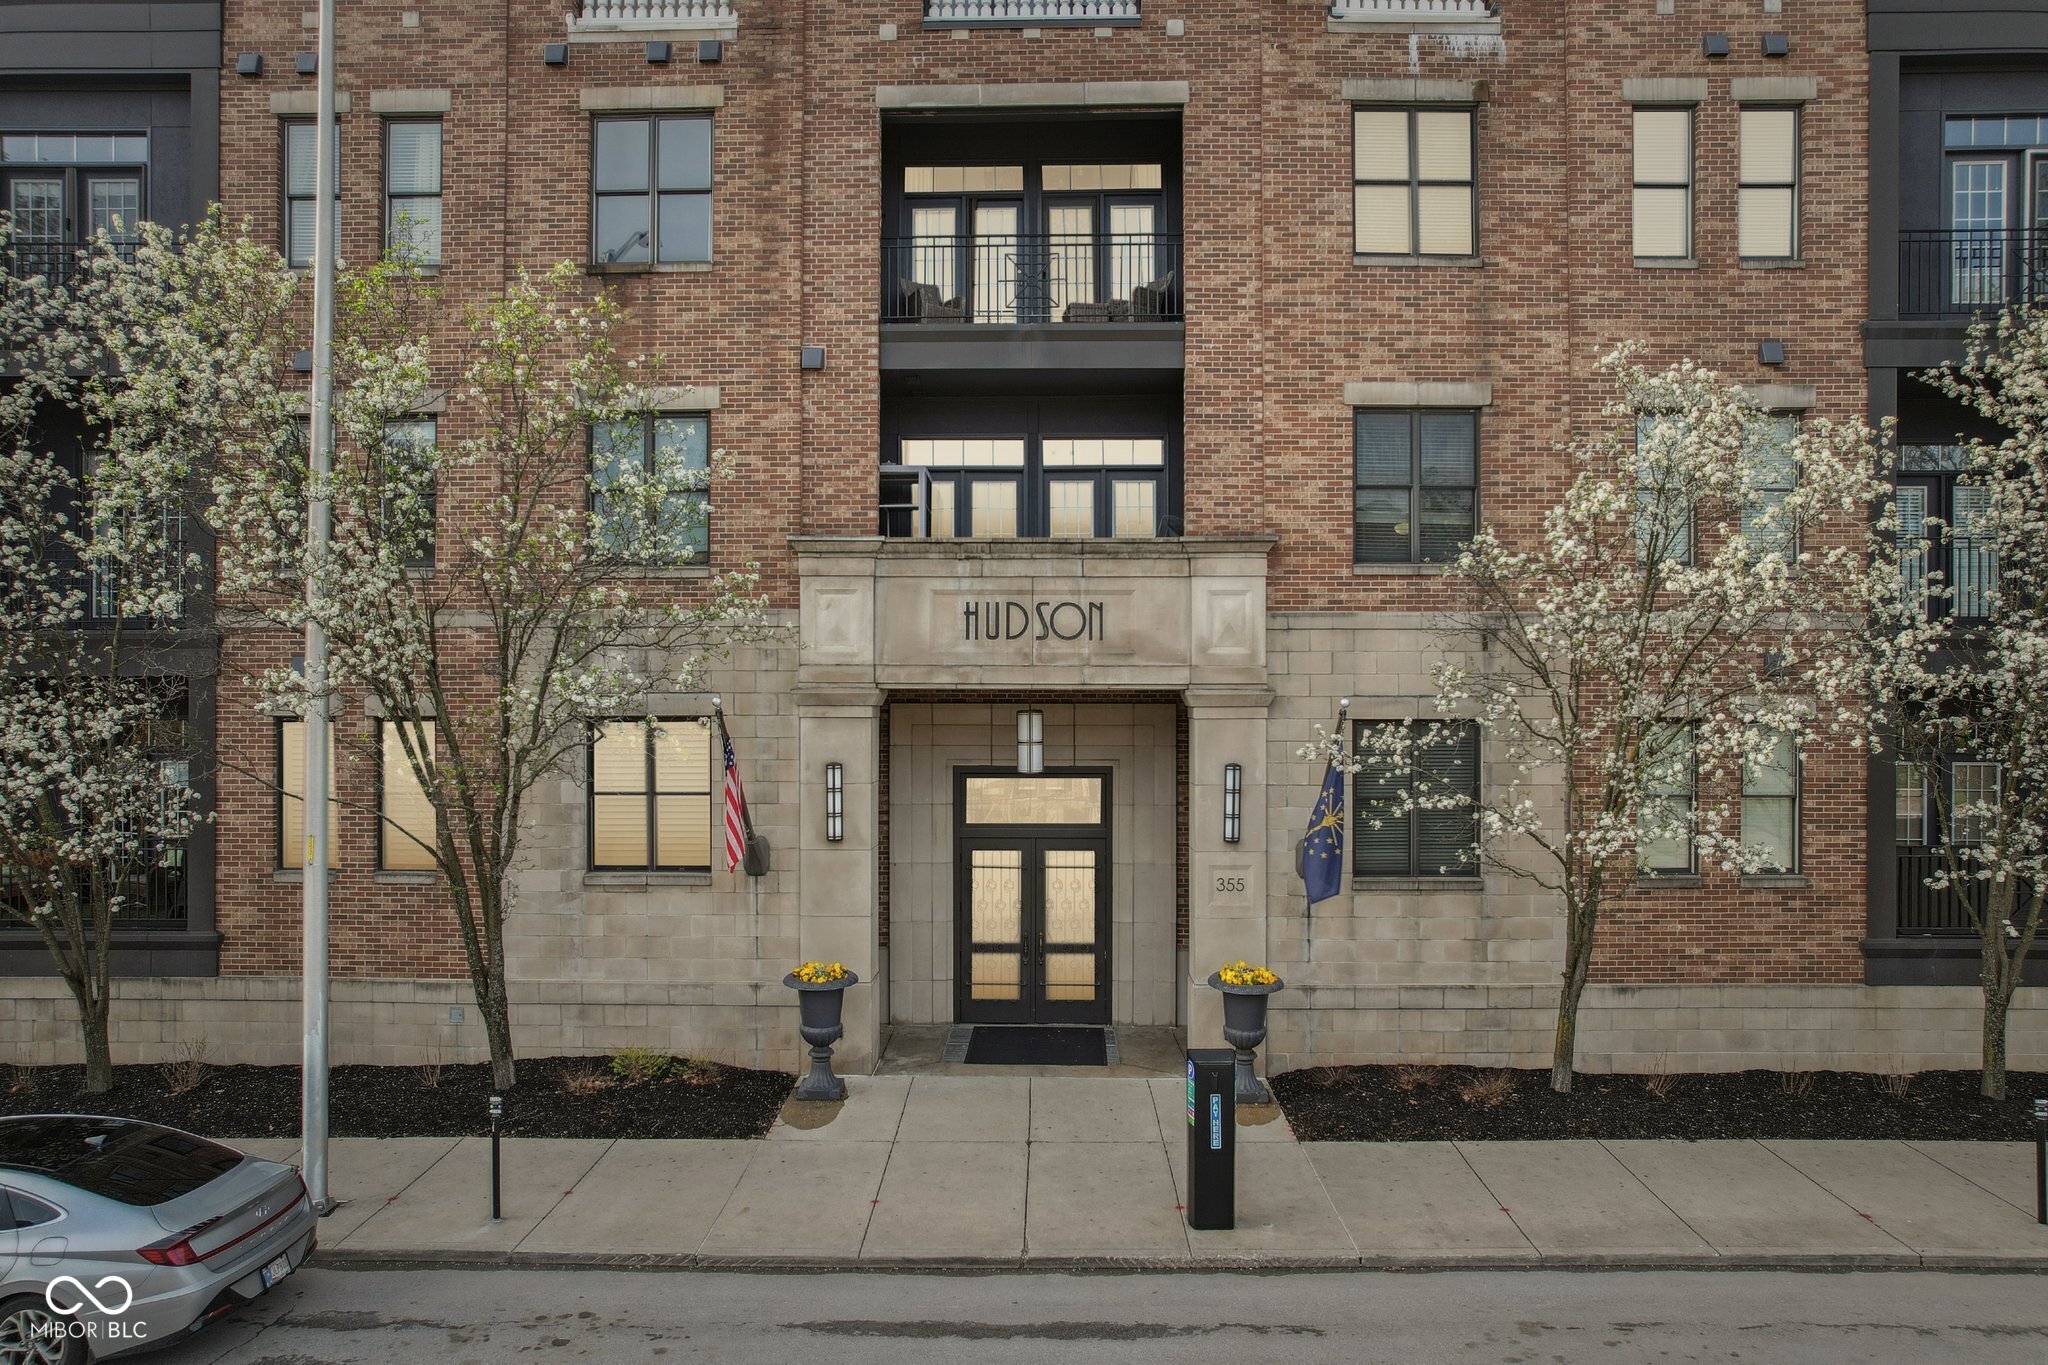
2008
355 E Ohio St, Indianapolis, IN 46204
$-1,317
Cash flow
-13.2%
Cash-on-Cash Return
3.1%
Cap rate
0.5%
Rent to Value Ratio
Active
$545,000
2
bds
|
0
ba
|
0
sqft
|
built
1910
3739 E Market St, Indianapolis, IN 46201
$-2,171
Cash flow
-20.8%
Cash-on-Cash Return
1.4%
Cap rate
0.2%
Rent to Value Ratio
Active
$450,000
2
bds
|
2
ba
|
2,285
sqft
|
built
2005
141 S Meridian St, Indianapolis, IN 46225
$-845
Cash flow
-9.8%
Cash-on-Cash Return
3.9%
Cap rate
0.7%
Rent to Value Ratio
Active
$685,000
5
bds
|
5
ba
|
5,851
sqft
|
built
1989
2308 Galahad Dr, Indianapolis, IN 46228
$-680
Cash flow
-5.2%
Cash-on-Cash Return
5.0%
Cap rate
0.6%
Rent to Value Ratio
Active
$415,000
bds
|
0
ba
|
0
sqft
|
built
1930
58 N Addison St, Indianapolis, IN 46222
$-953
Cash flow
-12.0%
Cash-on-Cash Return
3.4%
Cap rate
0.4%
Rent to Value Ratio
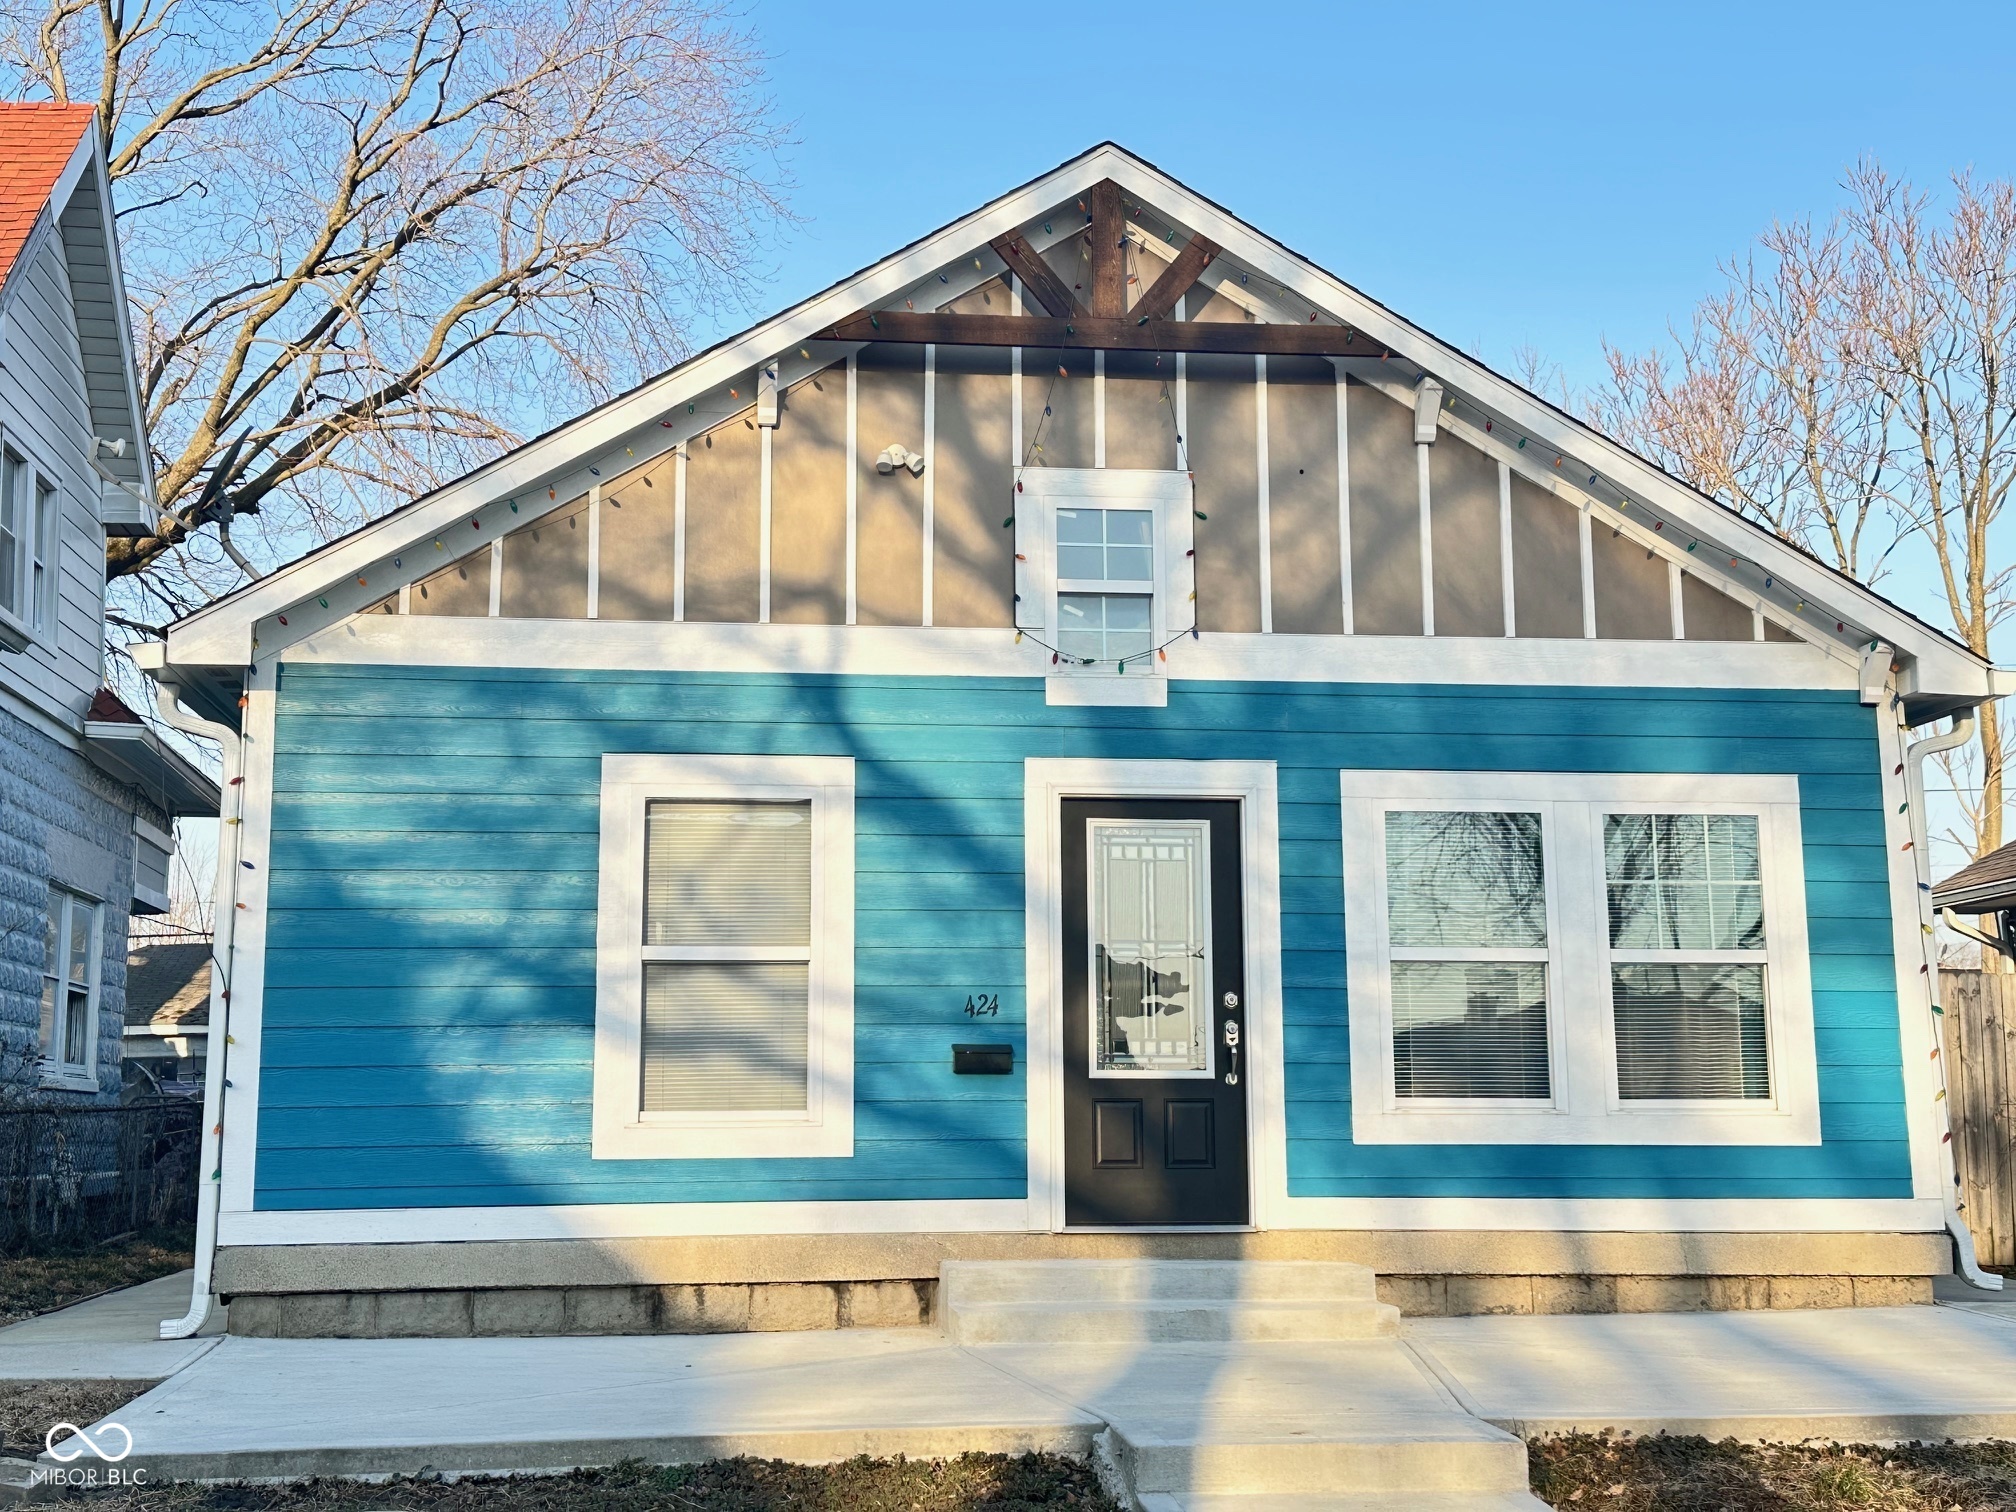
Active
$245,000
4
bds
|
2
ba
|
1,066
sqft
|
built
1911
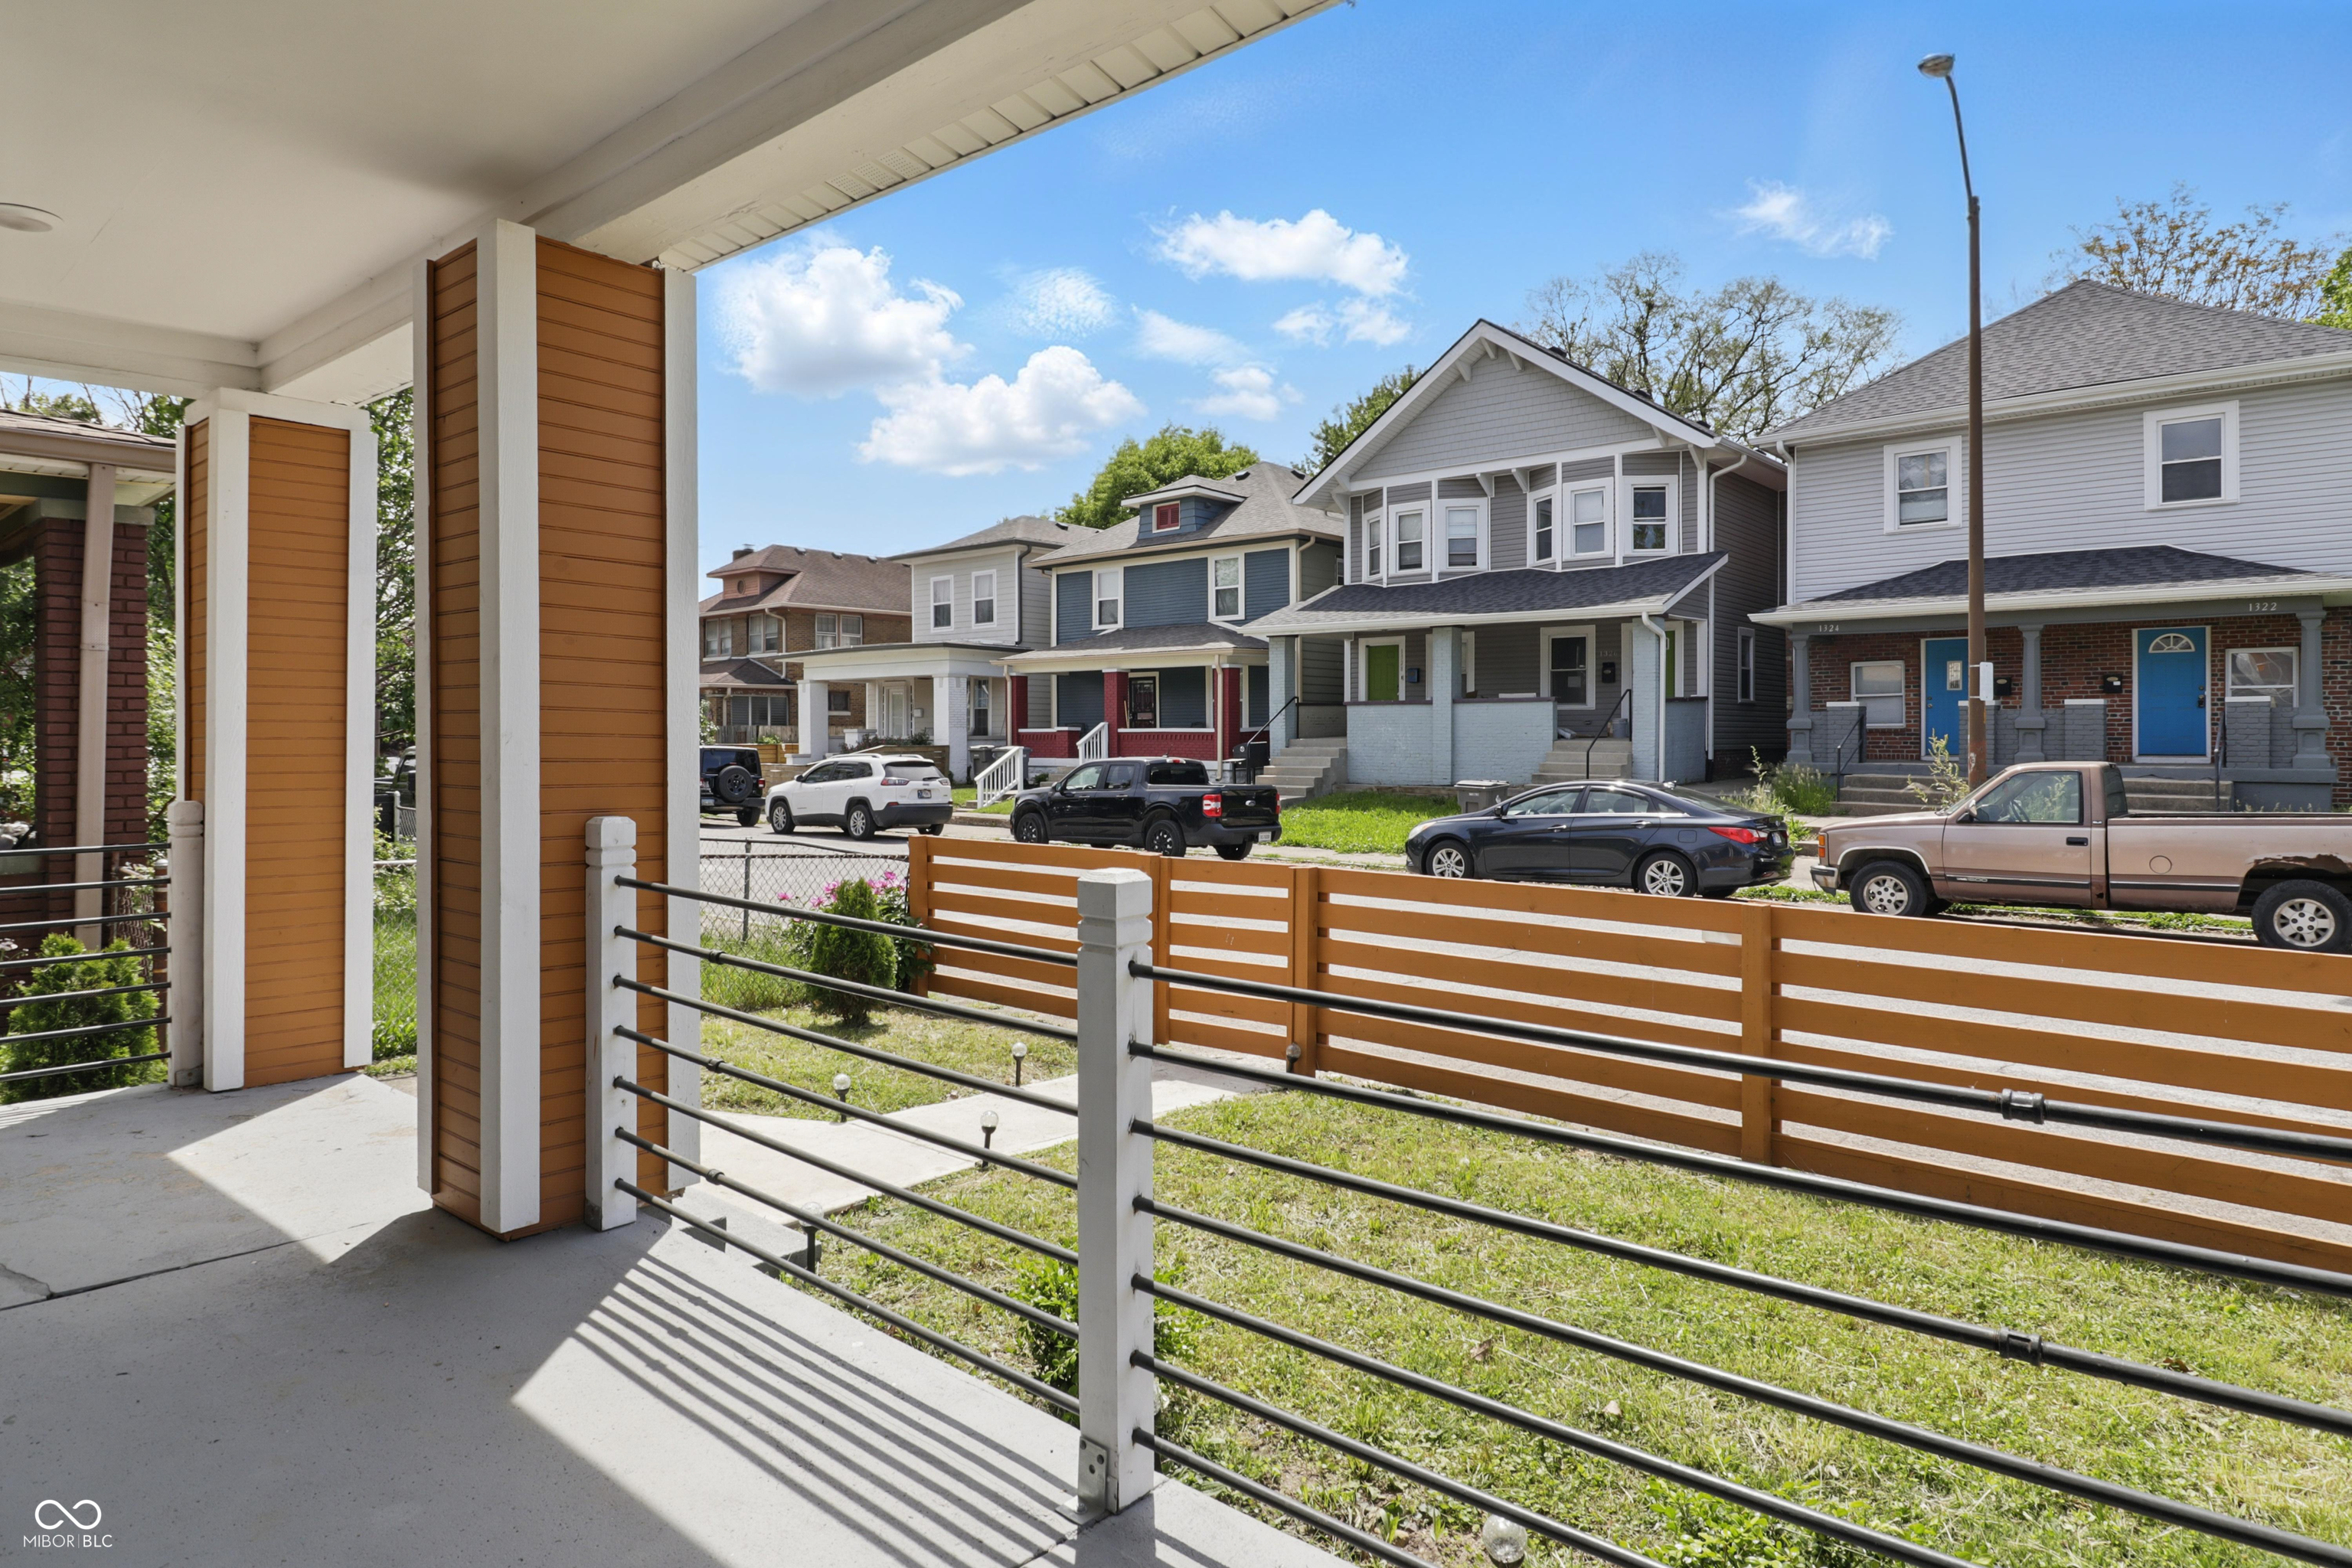
424 S Parker Ave, Indianapolis, IN 46201
$-496
Cash flow
-10.6%
Cash-on-Cash Return
3.7%
Cap rate
0.4%
Rent to Value Ratio
Active
$319,900
3
bds
|
4
ba
|
1,960
sqft
|
built
1930
213 S State Ave, Indianapolis, IN 46201
$-880
Cash flow
-14.4%
Cash-on-Cash Return
2.8%
Cap rate
0.3%
Rent to Value Ratio
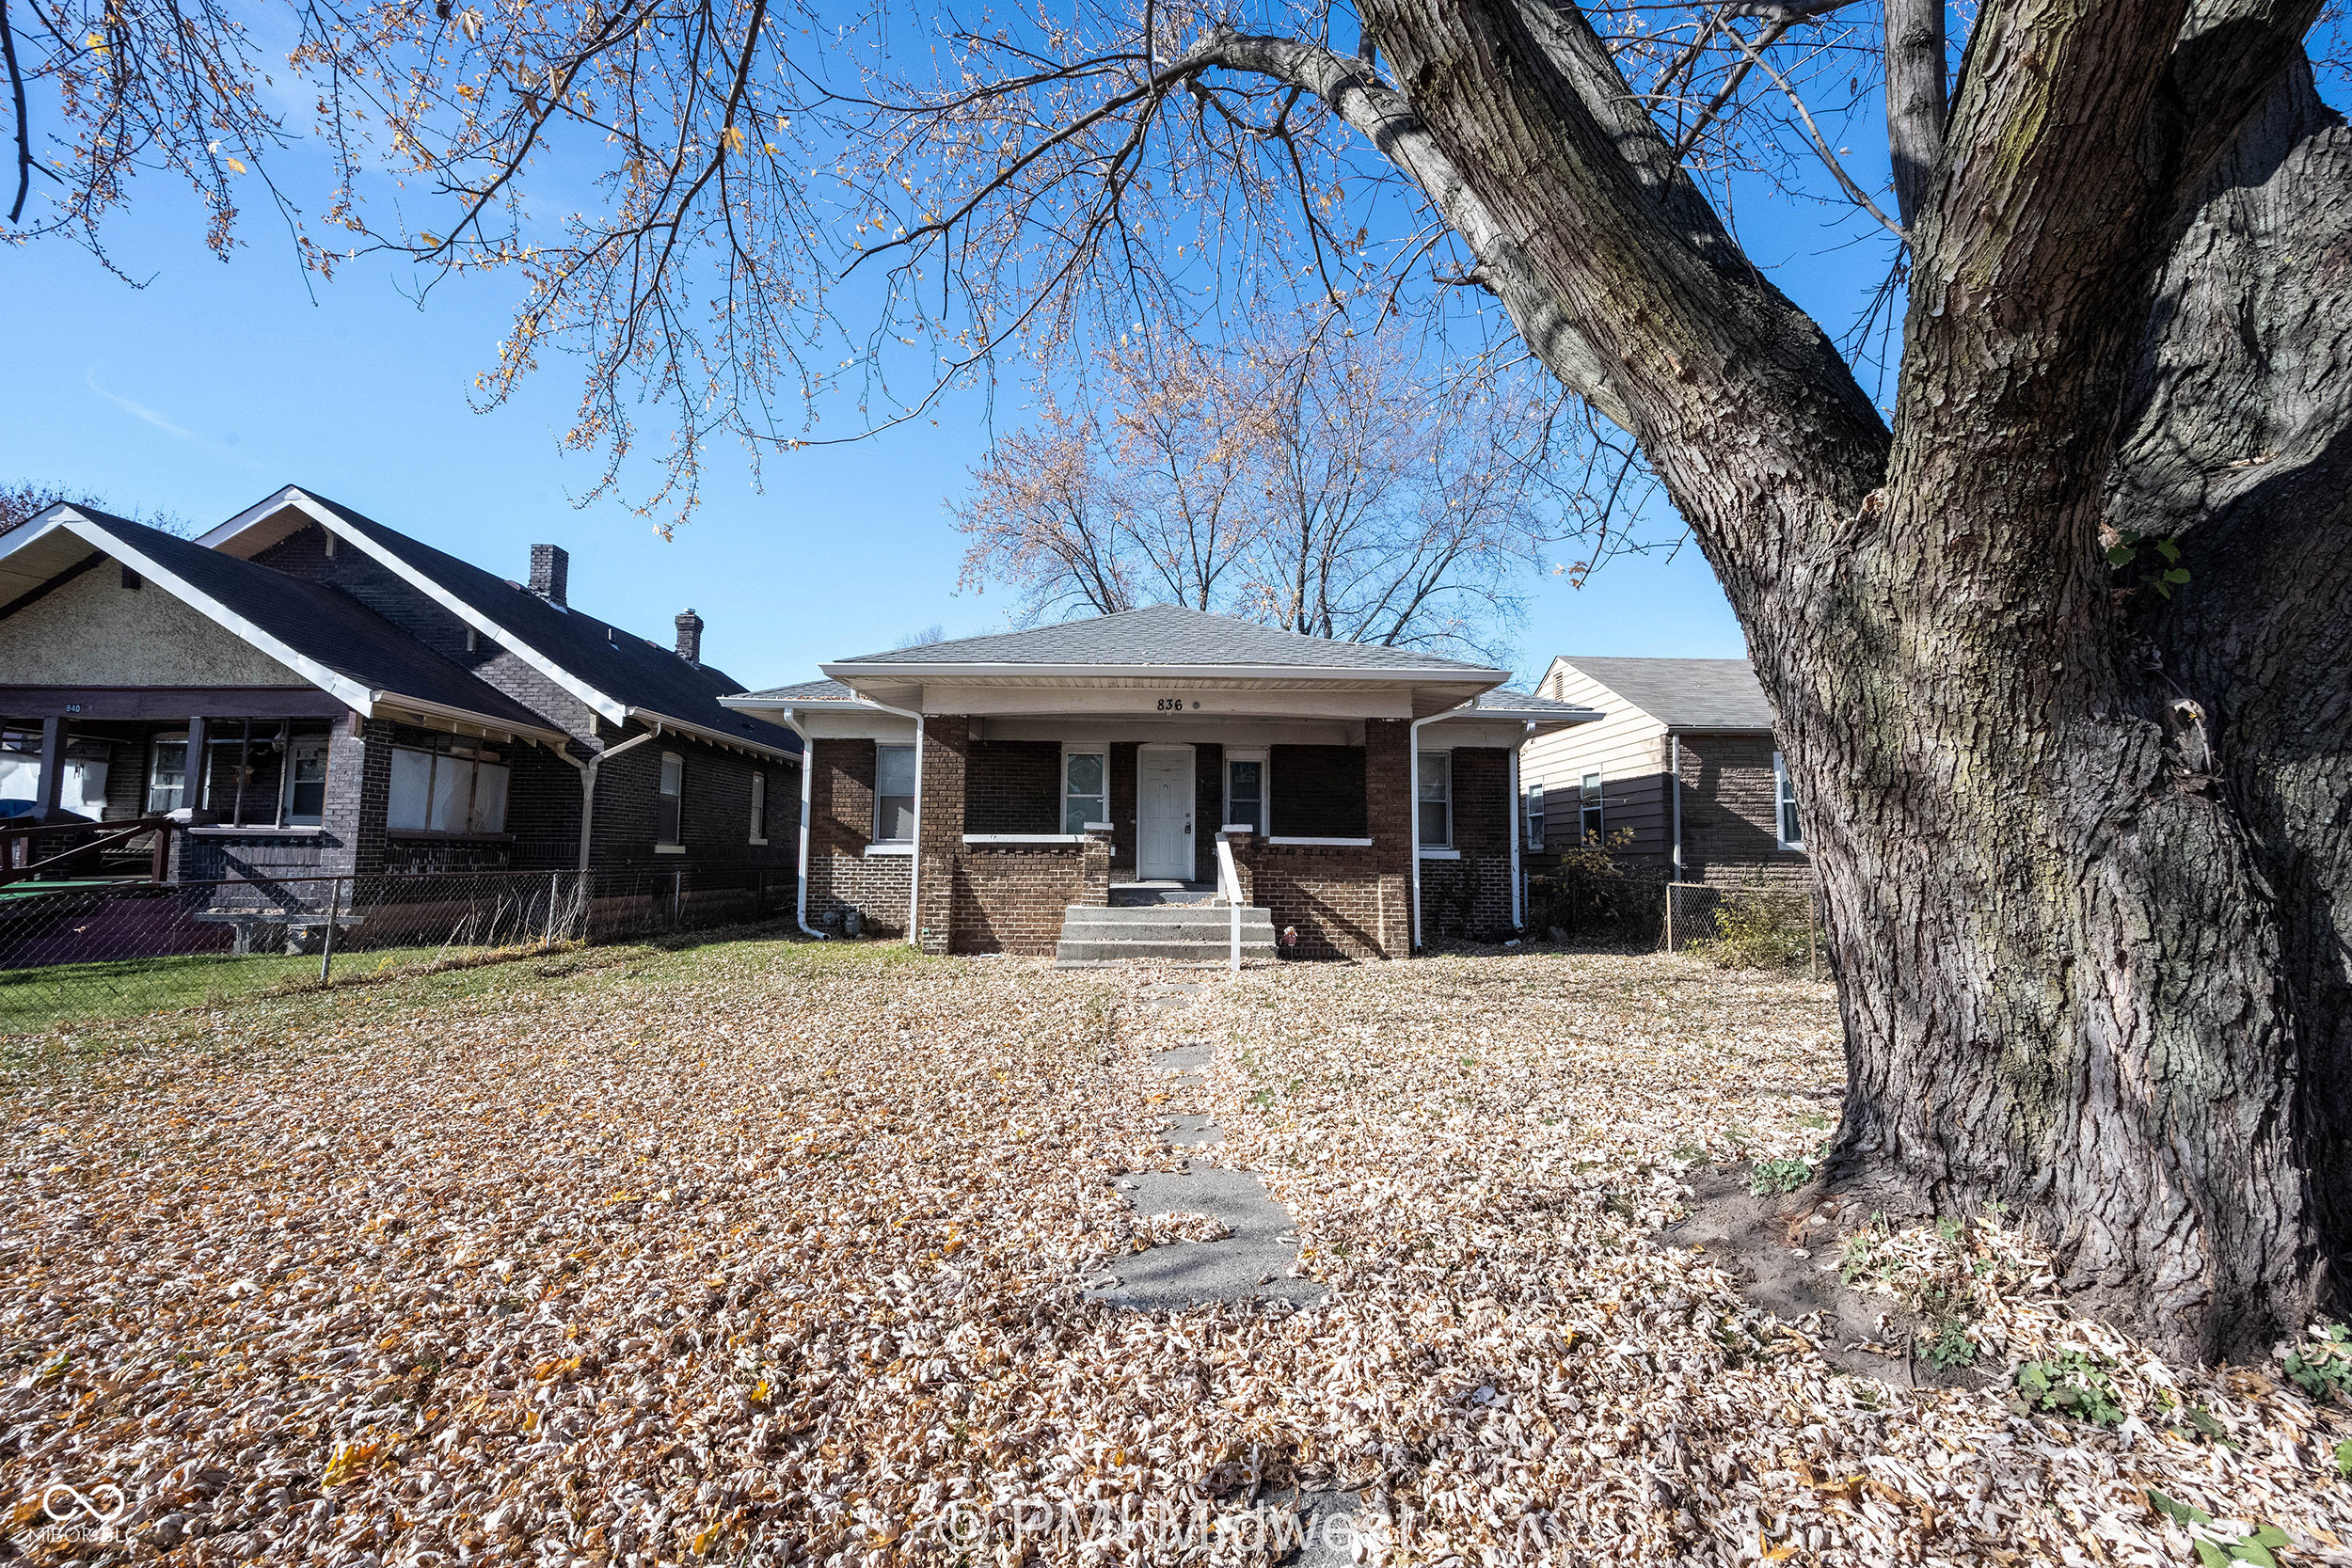
Active
$134,900
3
bds
|
1
ba
|
1,296
sqft
|
built
1915
836 S Tremont St, Indianapolis, IN 46221
$413
Cash flow
16.0%
Cash-on-Cash Return
9.8%
Cap rate
1.2%
Rent to Value Ratio
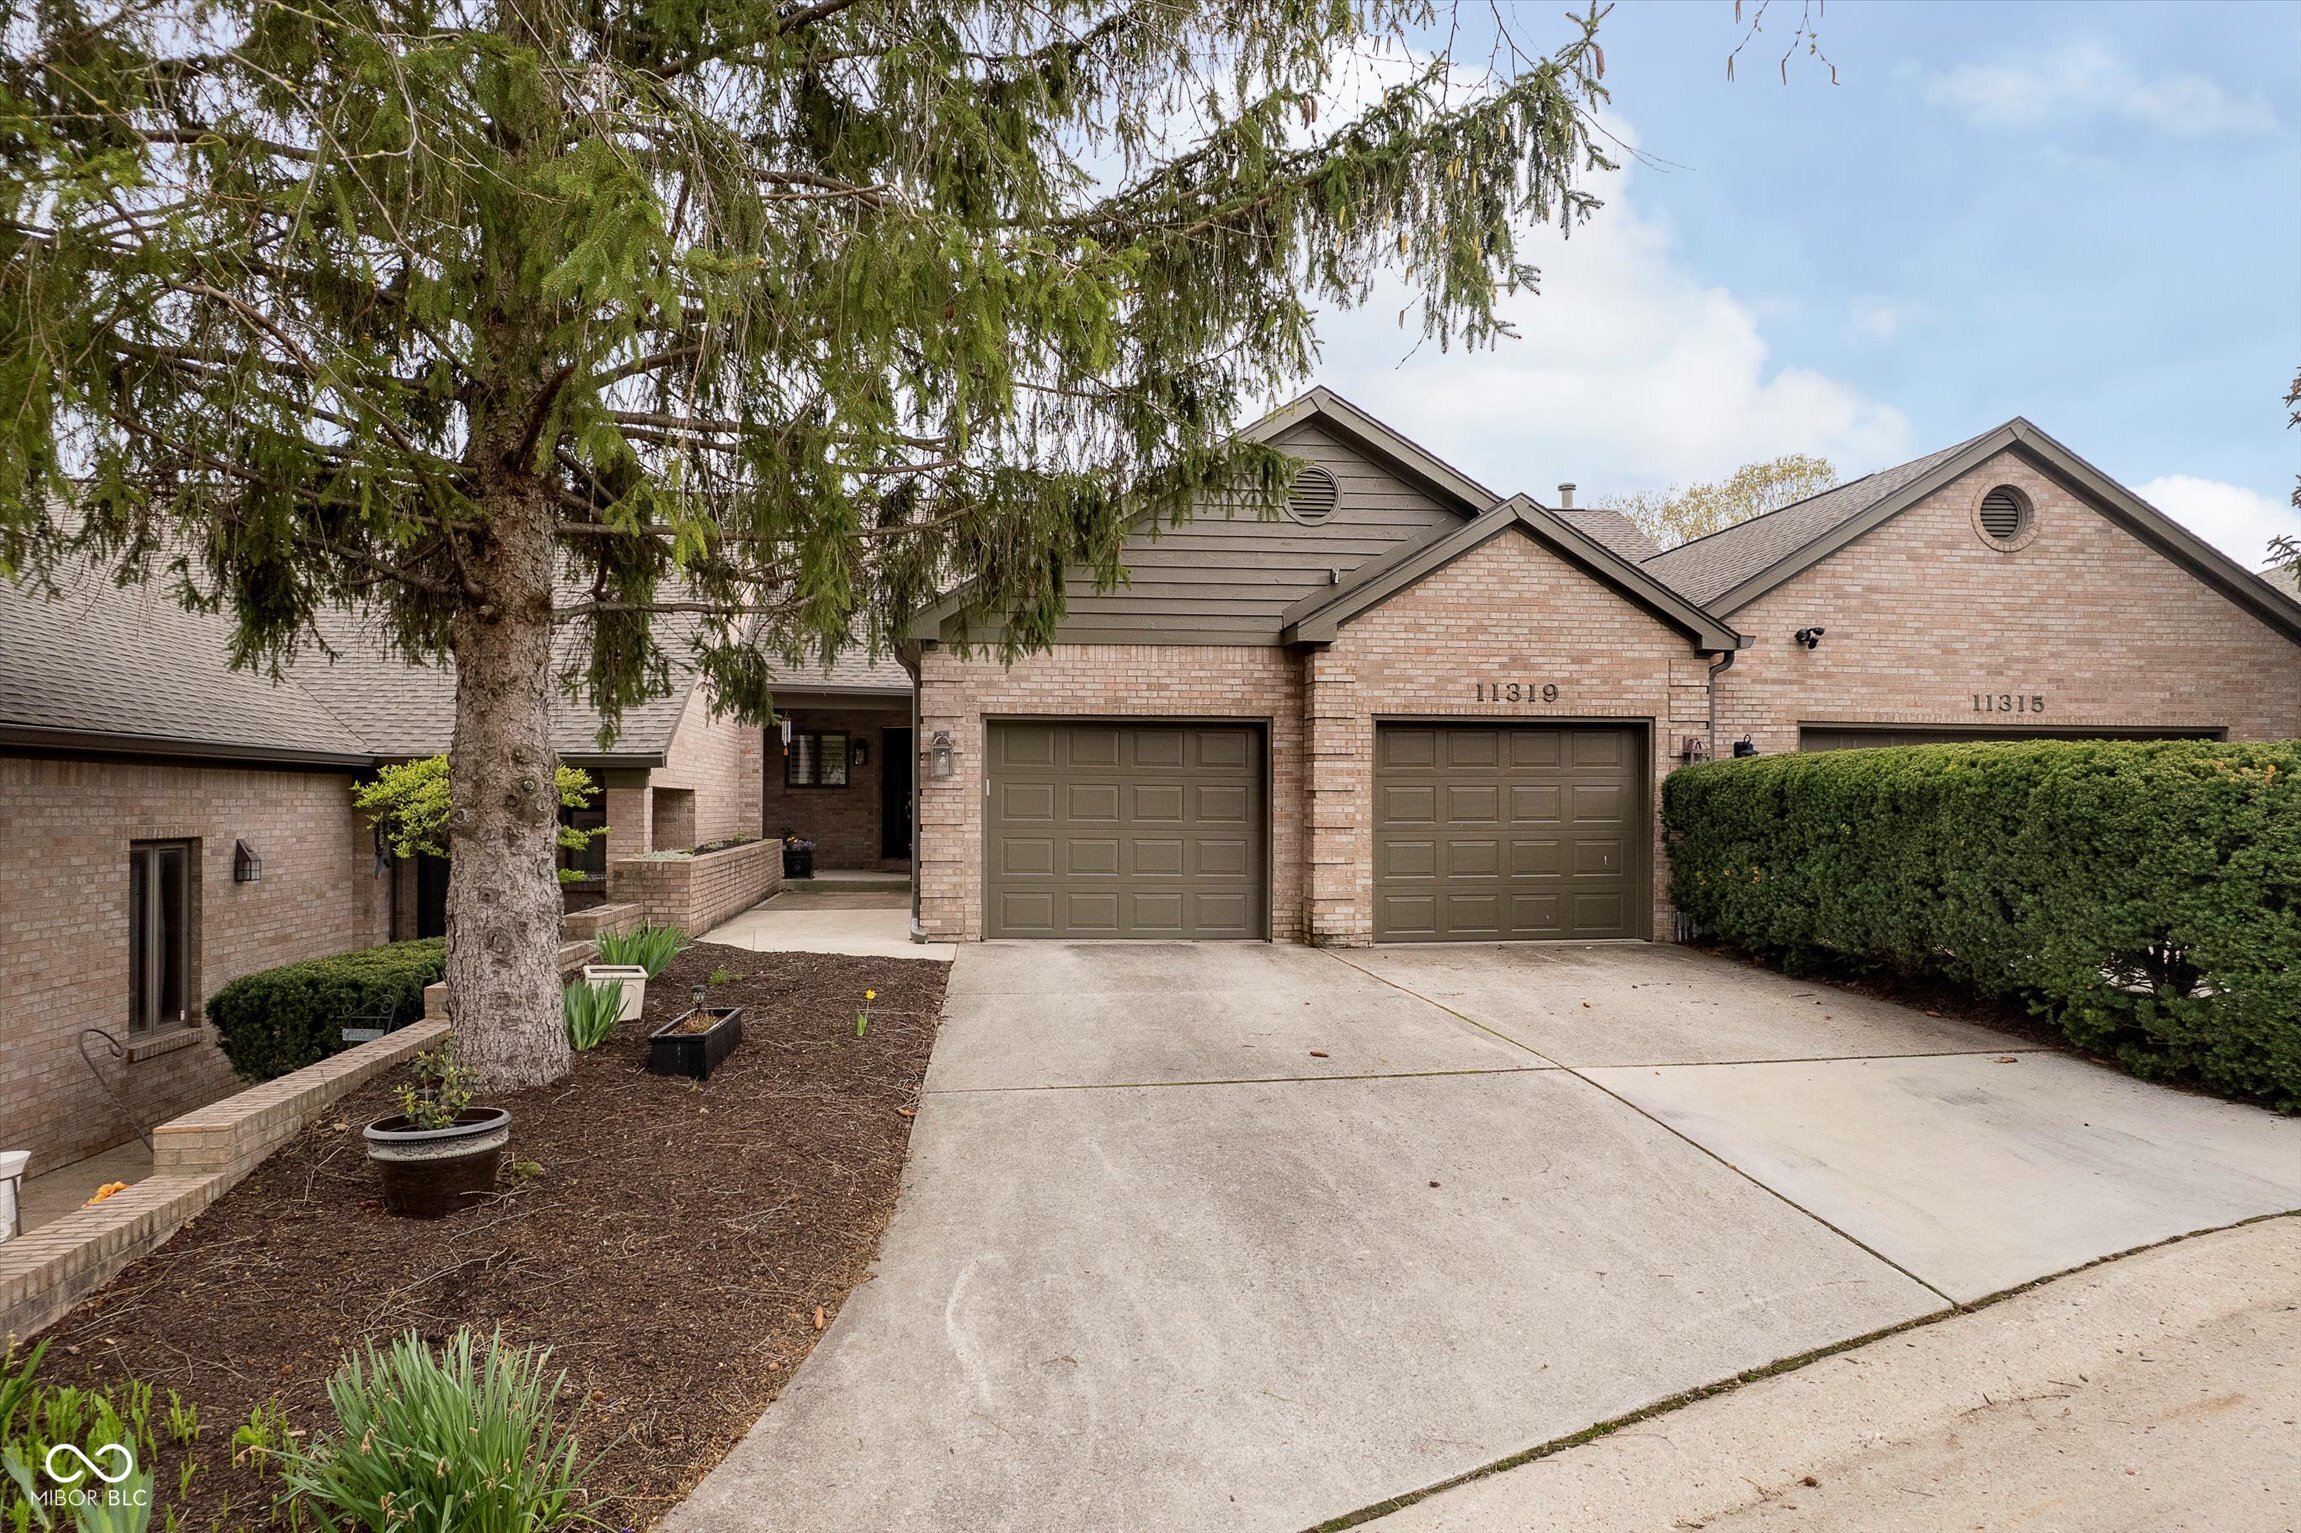
Active
$765,000
4
bds
|
4
ba
|
3,938
sqft
|
built
1989
11319 Shoreview Ln, Indianapolis, IN 46236
$-1,218
Cash flow
-8.3%
Cash-on-Cash Return
4.2%
Cap rate
0.6%
Rent to Value Ratio
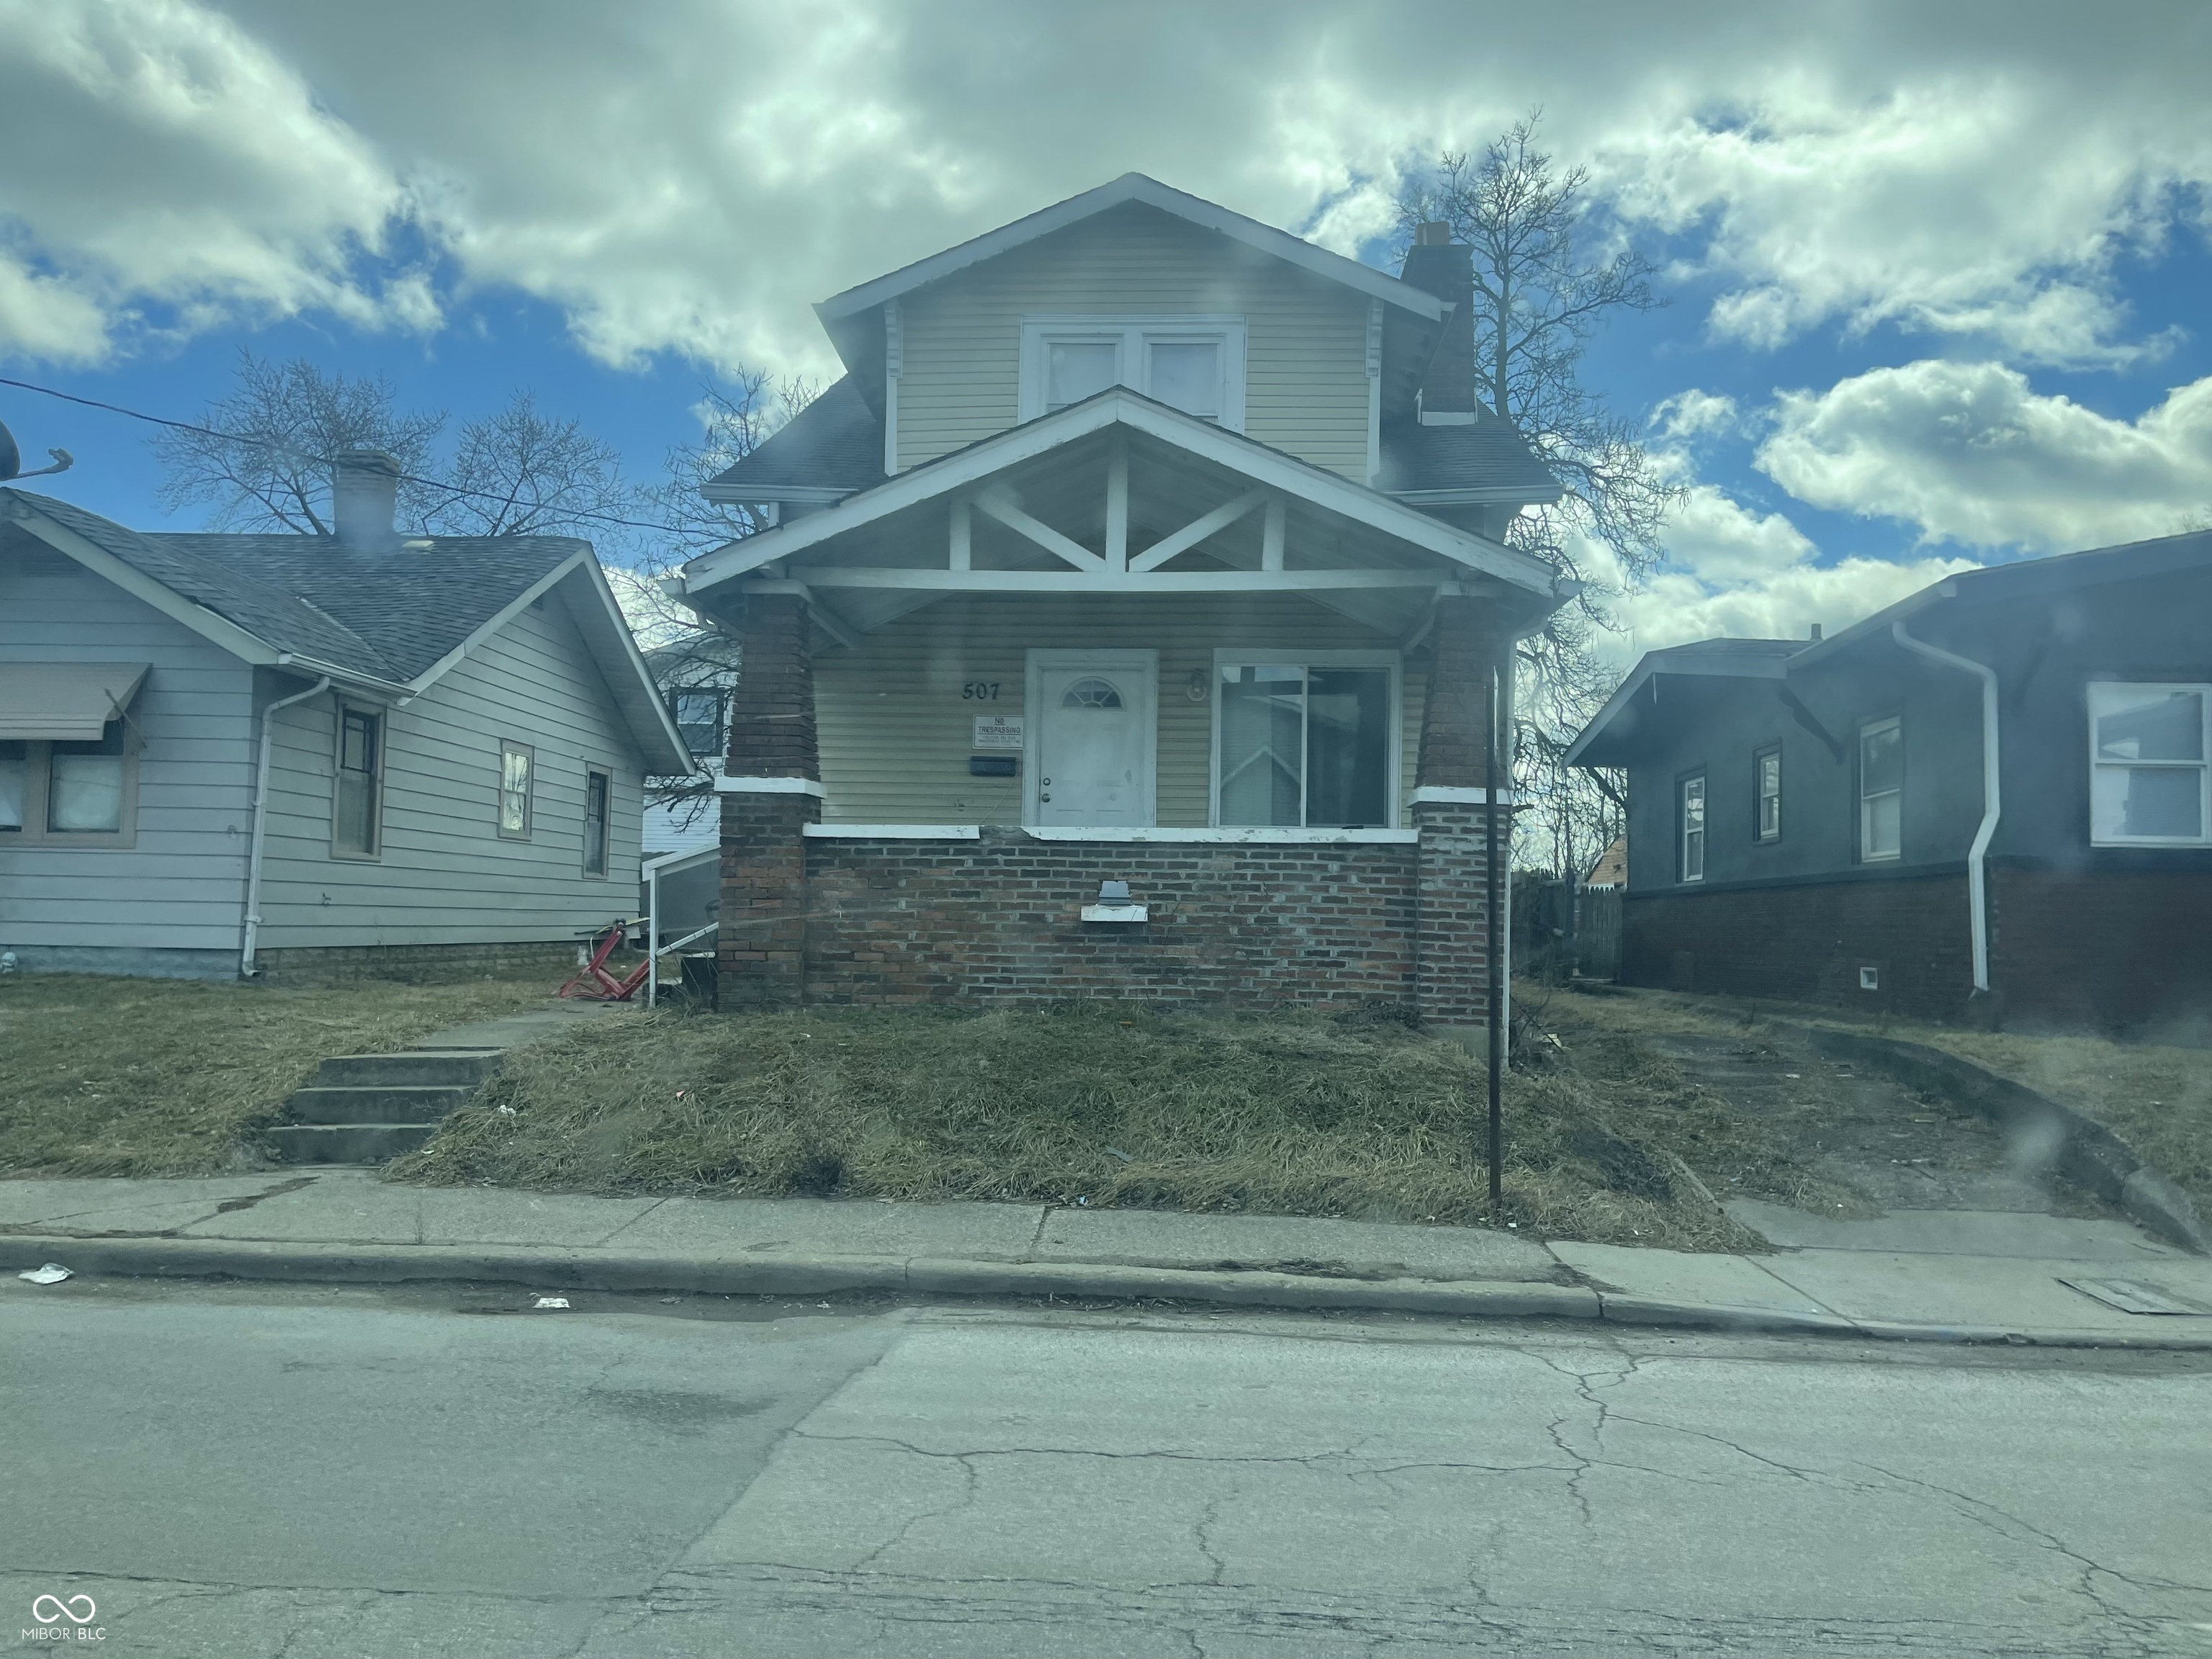
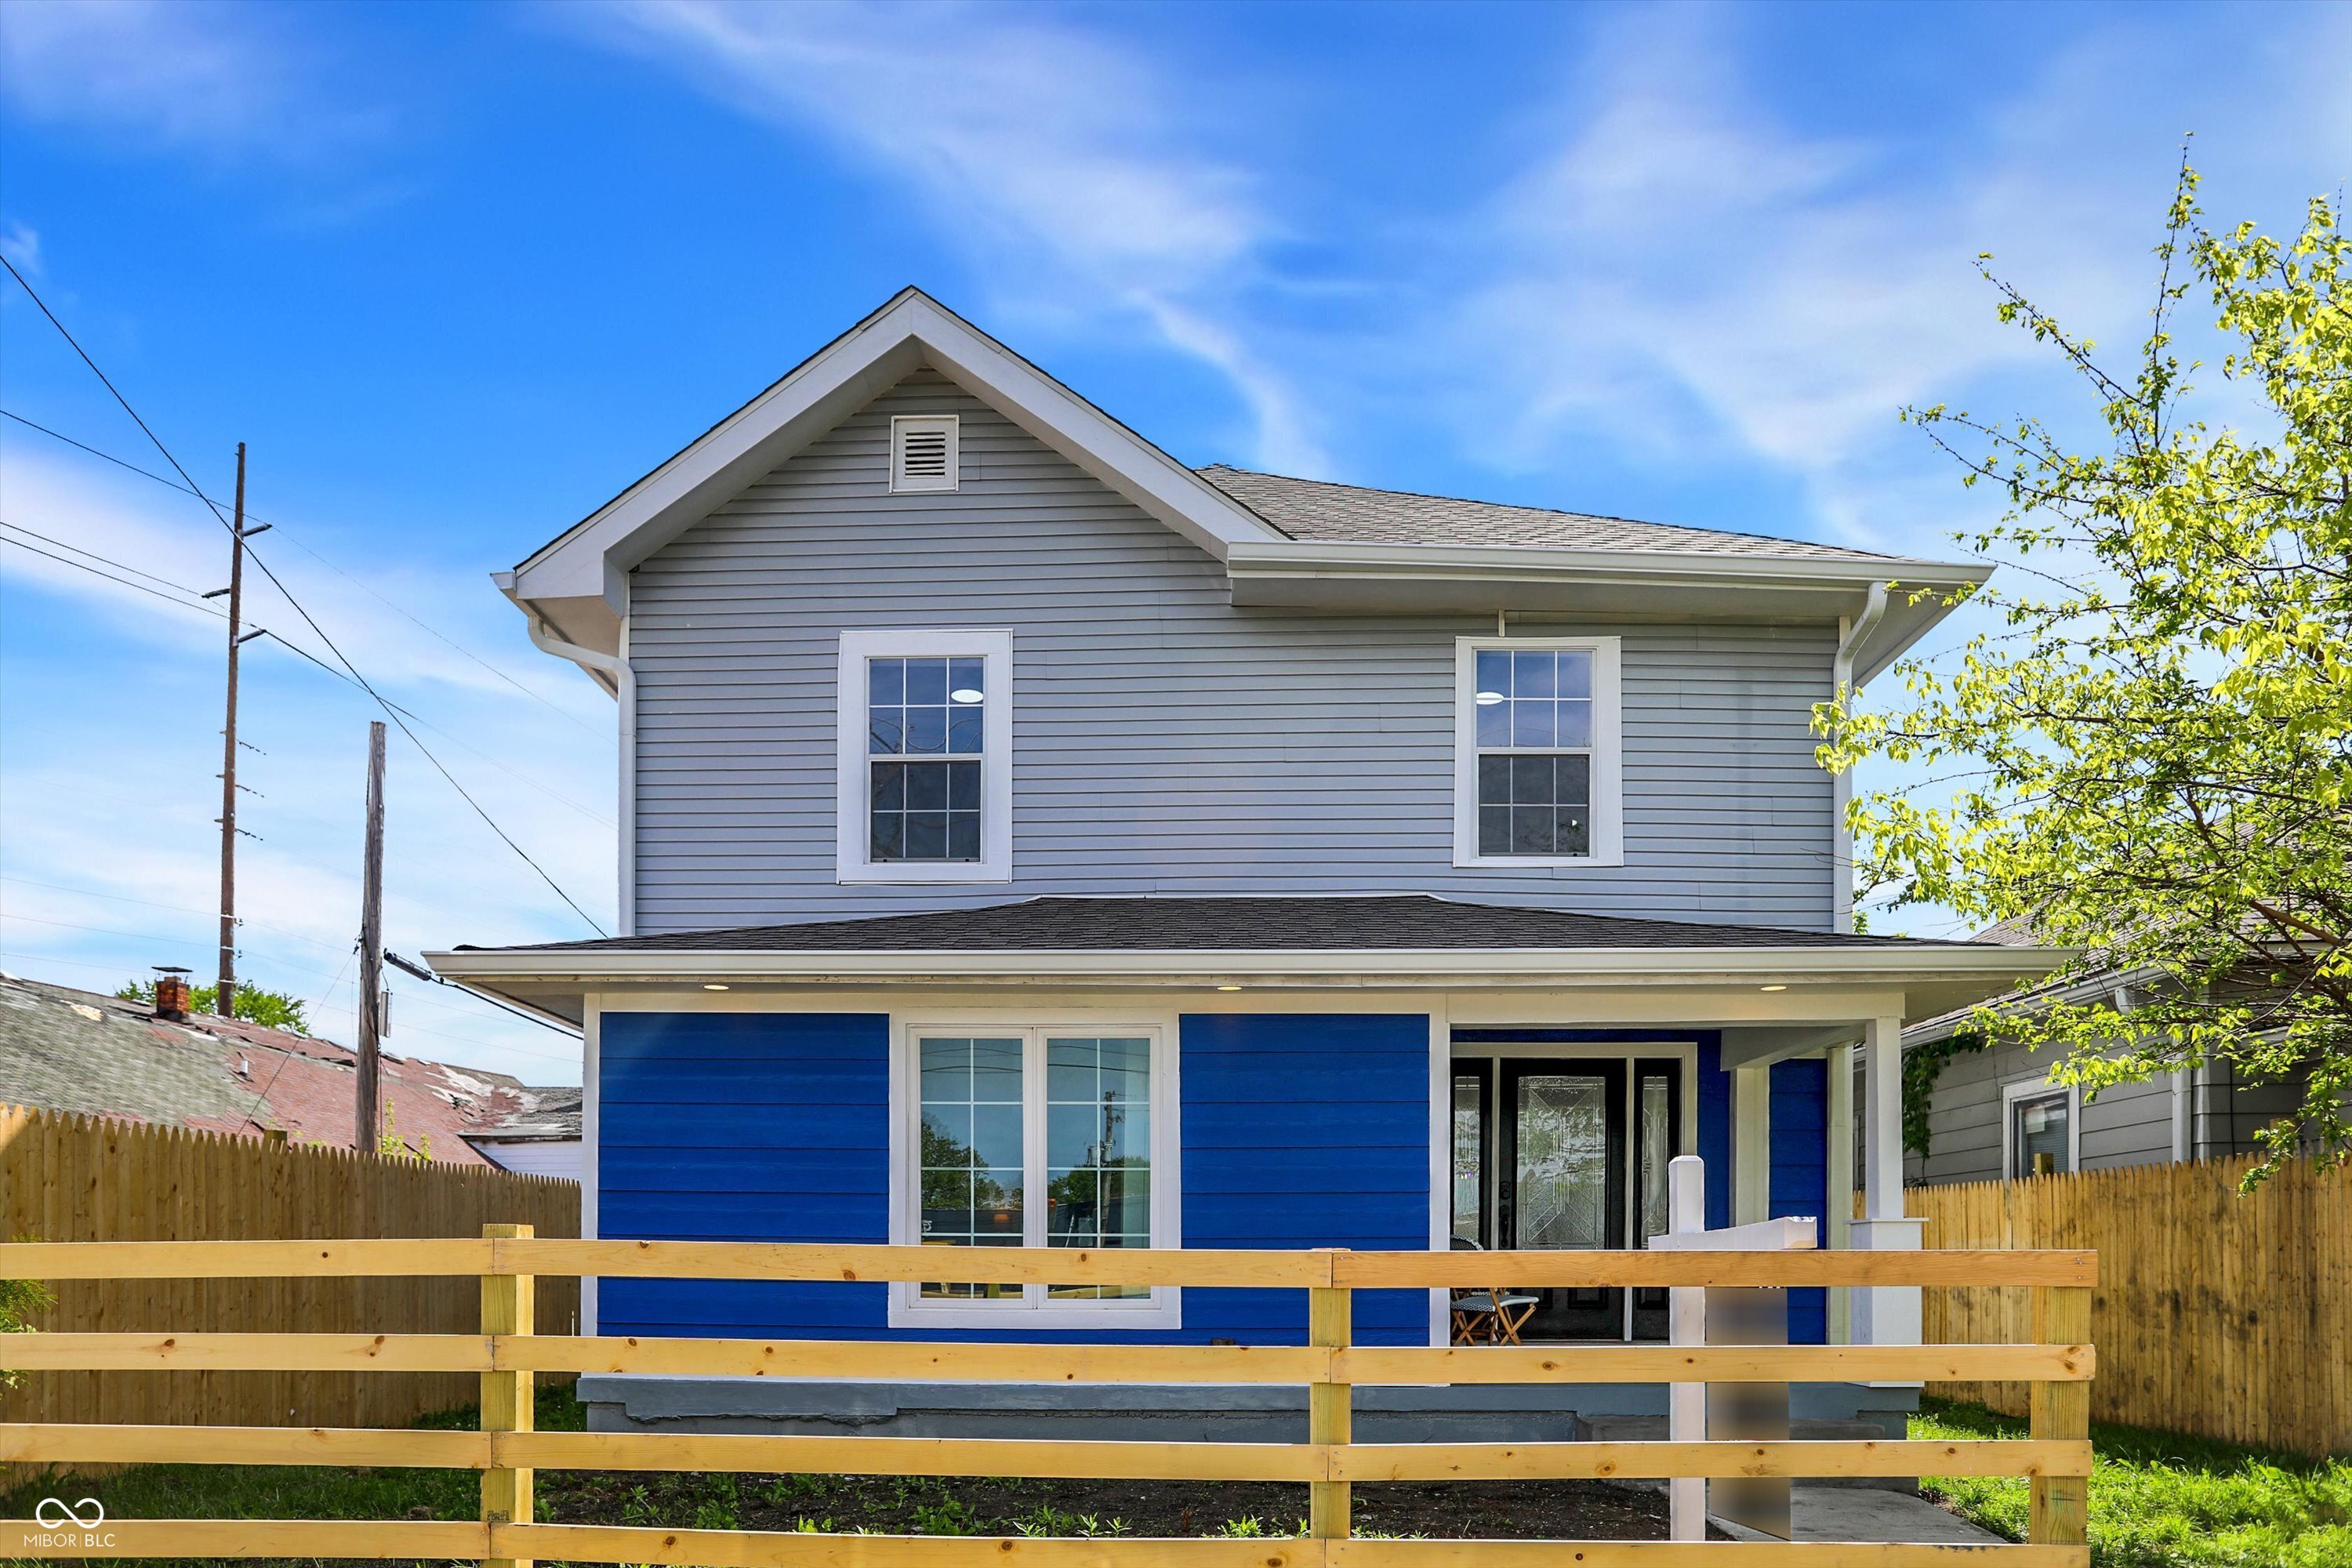
Active
$600,000
4
bds
|
2
ba
|
1,600
sqft
|
built
1925
507 W 29th St, Indianapolis, IN 46208
$-2,314
Cash flow
-20.1%
Cash-on-Cash Return
1.5%
Cap rate
0.2%
Rent to Value Ratio
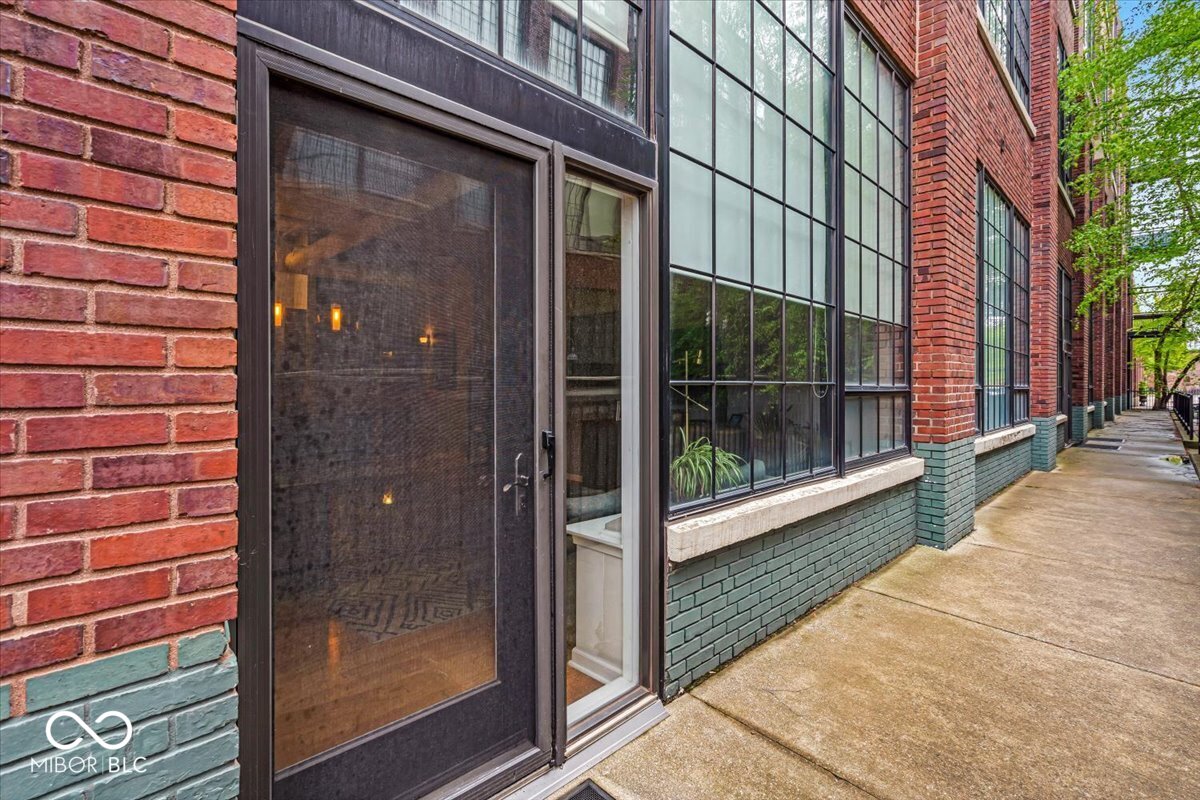
Active
$349,900
1
bds
|
2
ba
|
1,162
sqft
|
built
1922
630 N College Ave, Indianapolis, IN 46204
$-647
Cash flow
-9.6%
Cash-on-Cash Return
3.9%
Cap rate
0.7%
Rent to Value Ratio
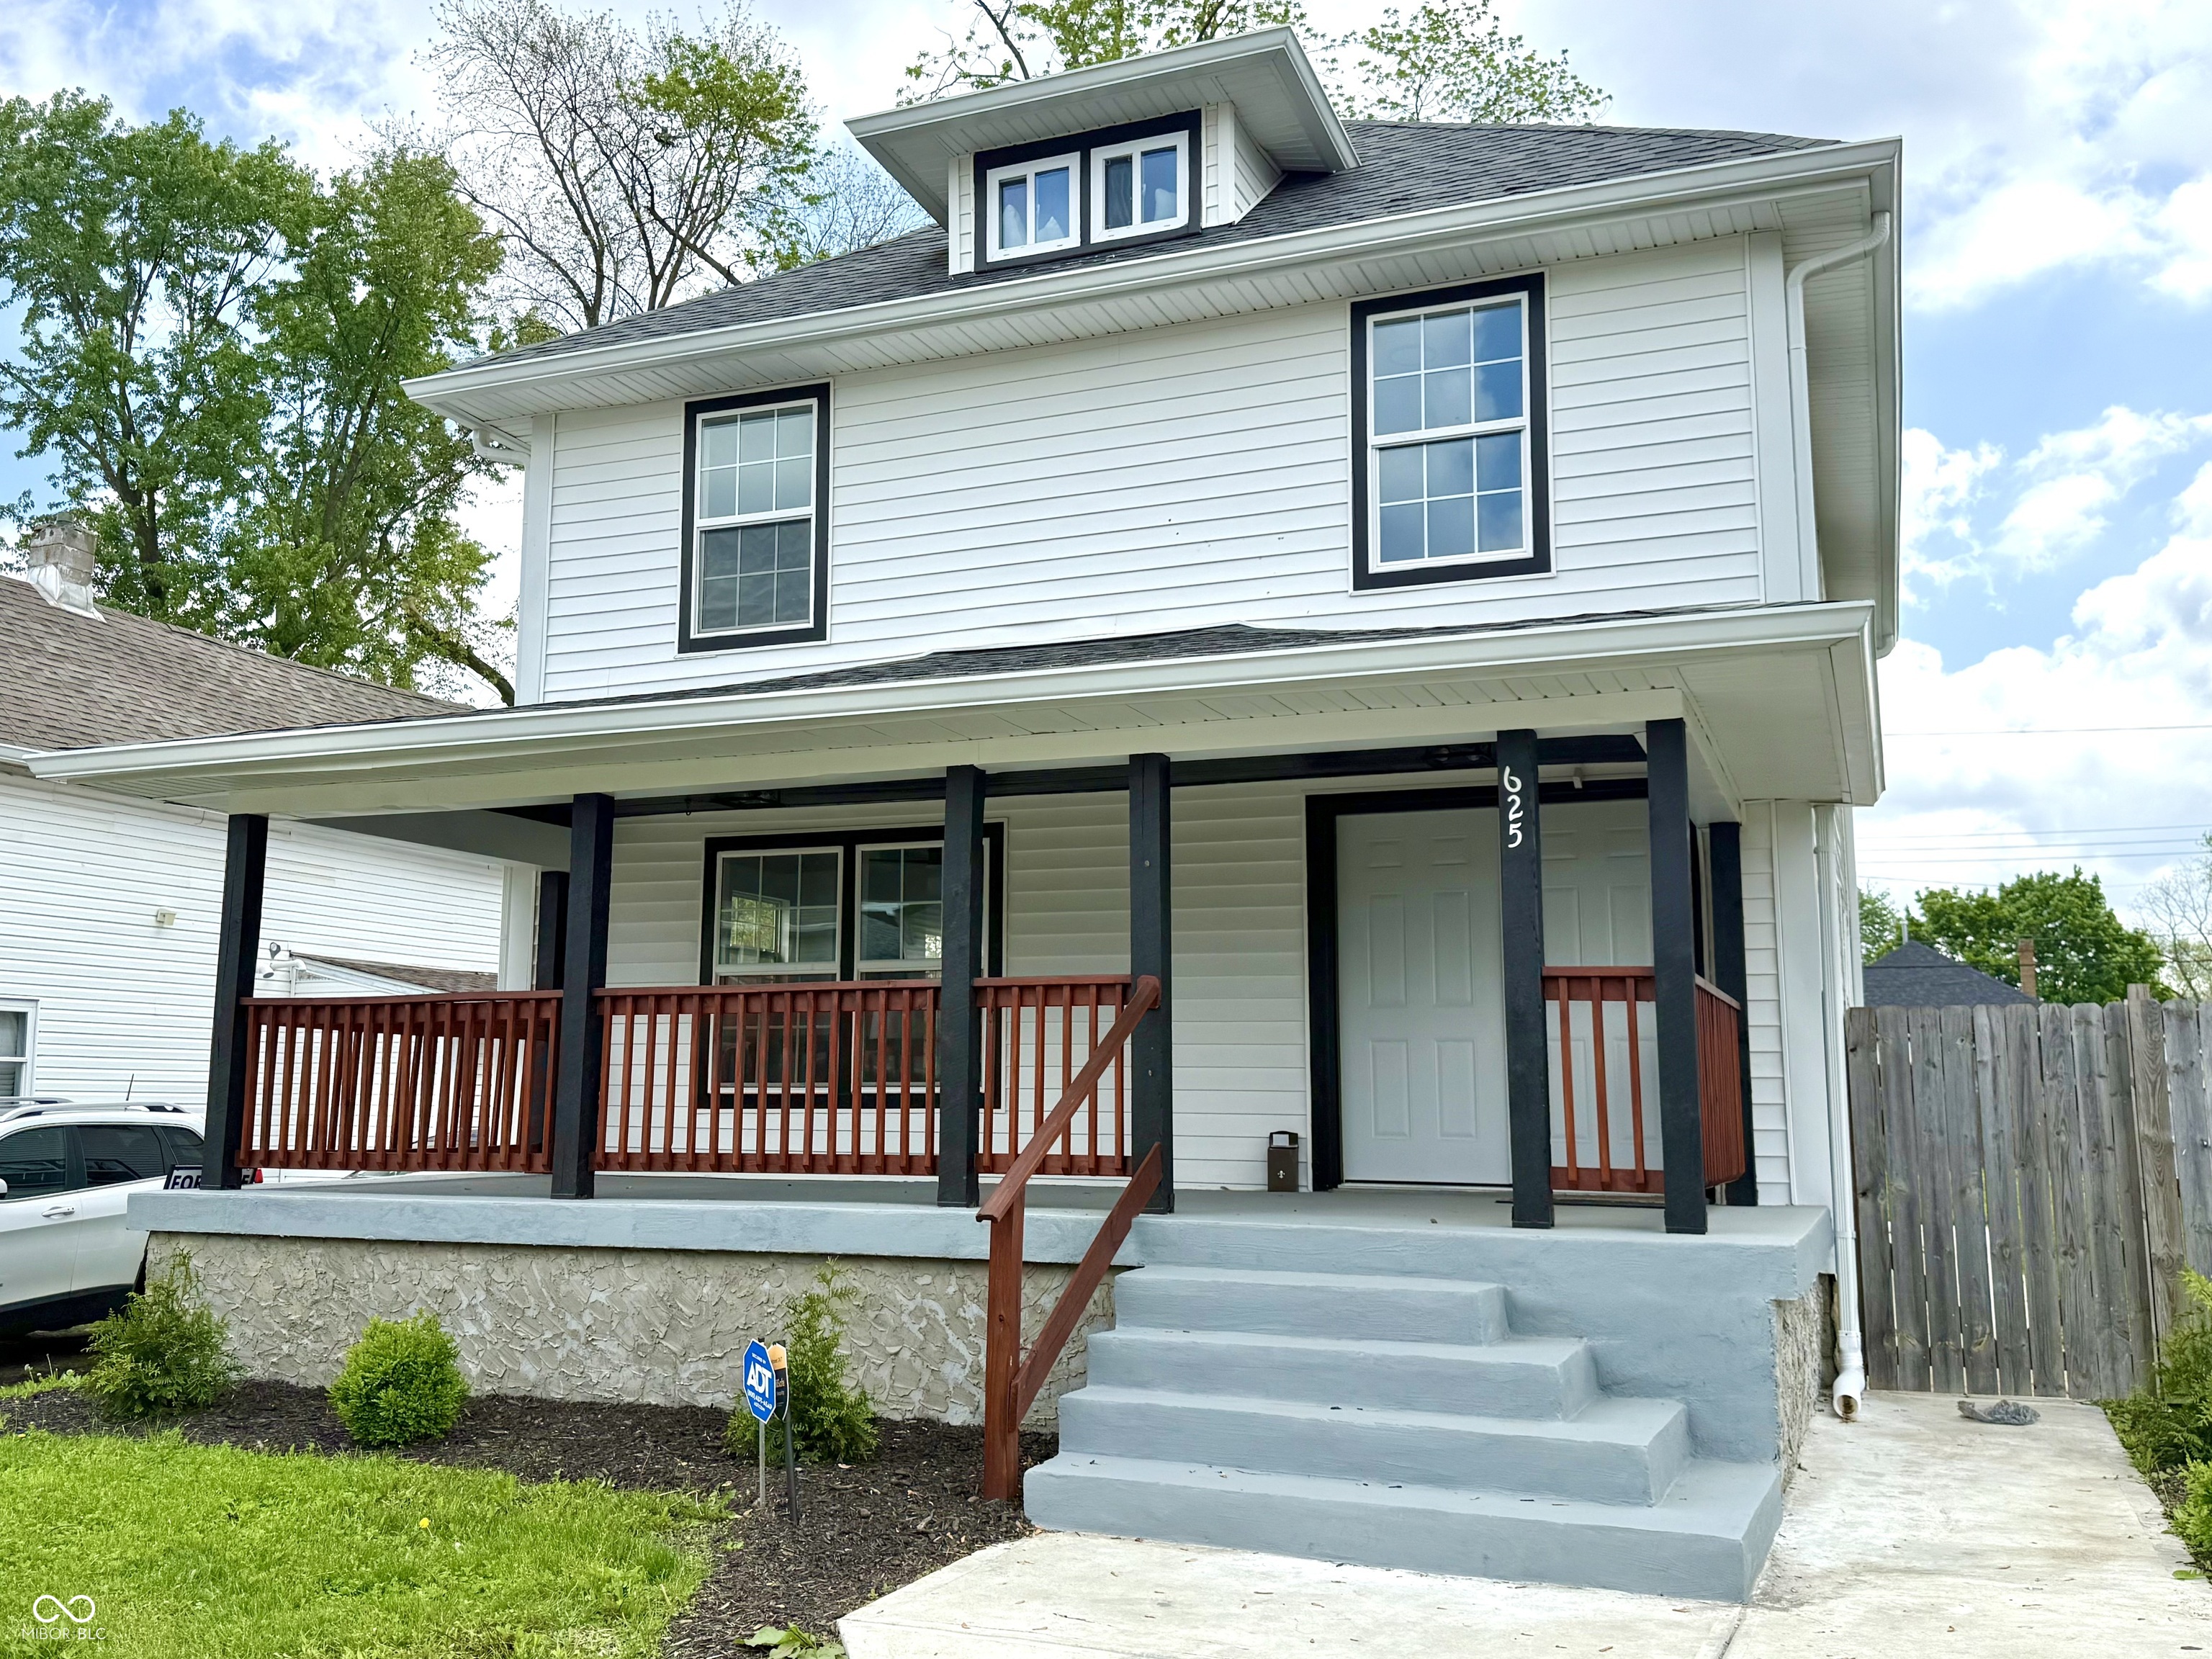
Active
$349,999
4
bds
|
4
ba
|
1,951
sqft
|
built
1910
625 N Parker Ave, Indianapolis, IN 46201
$-1,103
Cash flow
-16.4%
Cash-on-Cash Return
2.4%
Cap rate
0.3%
Rent to Value Ratio
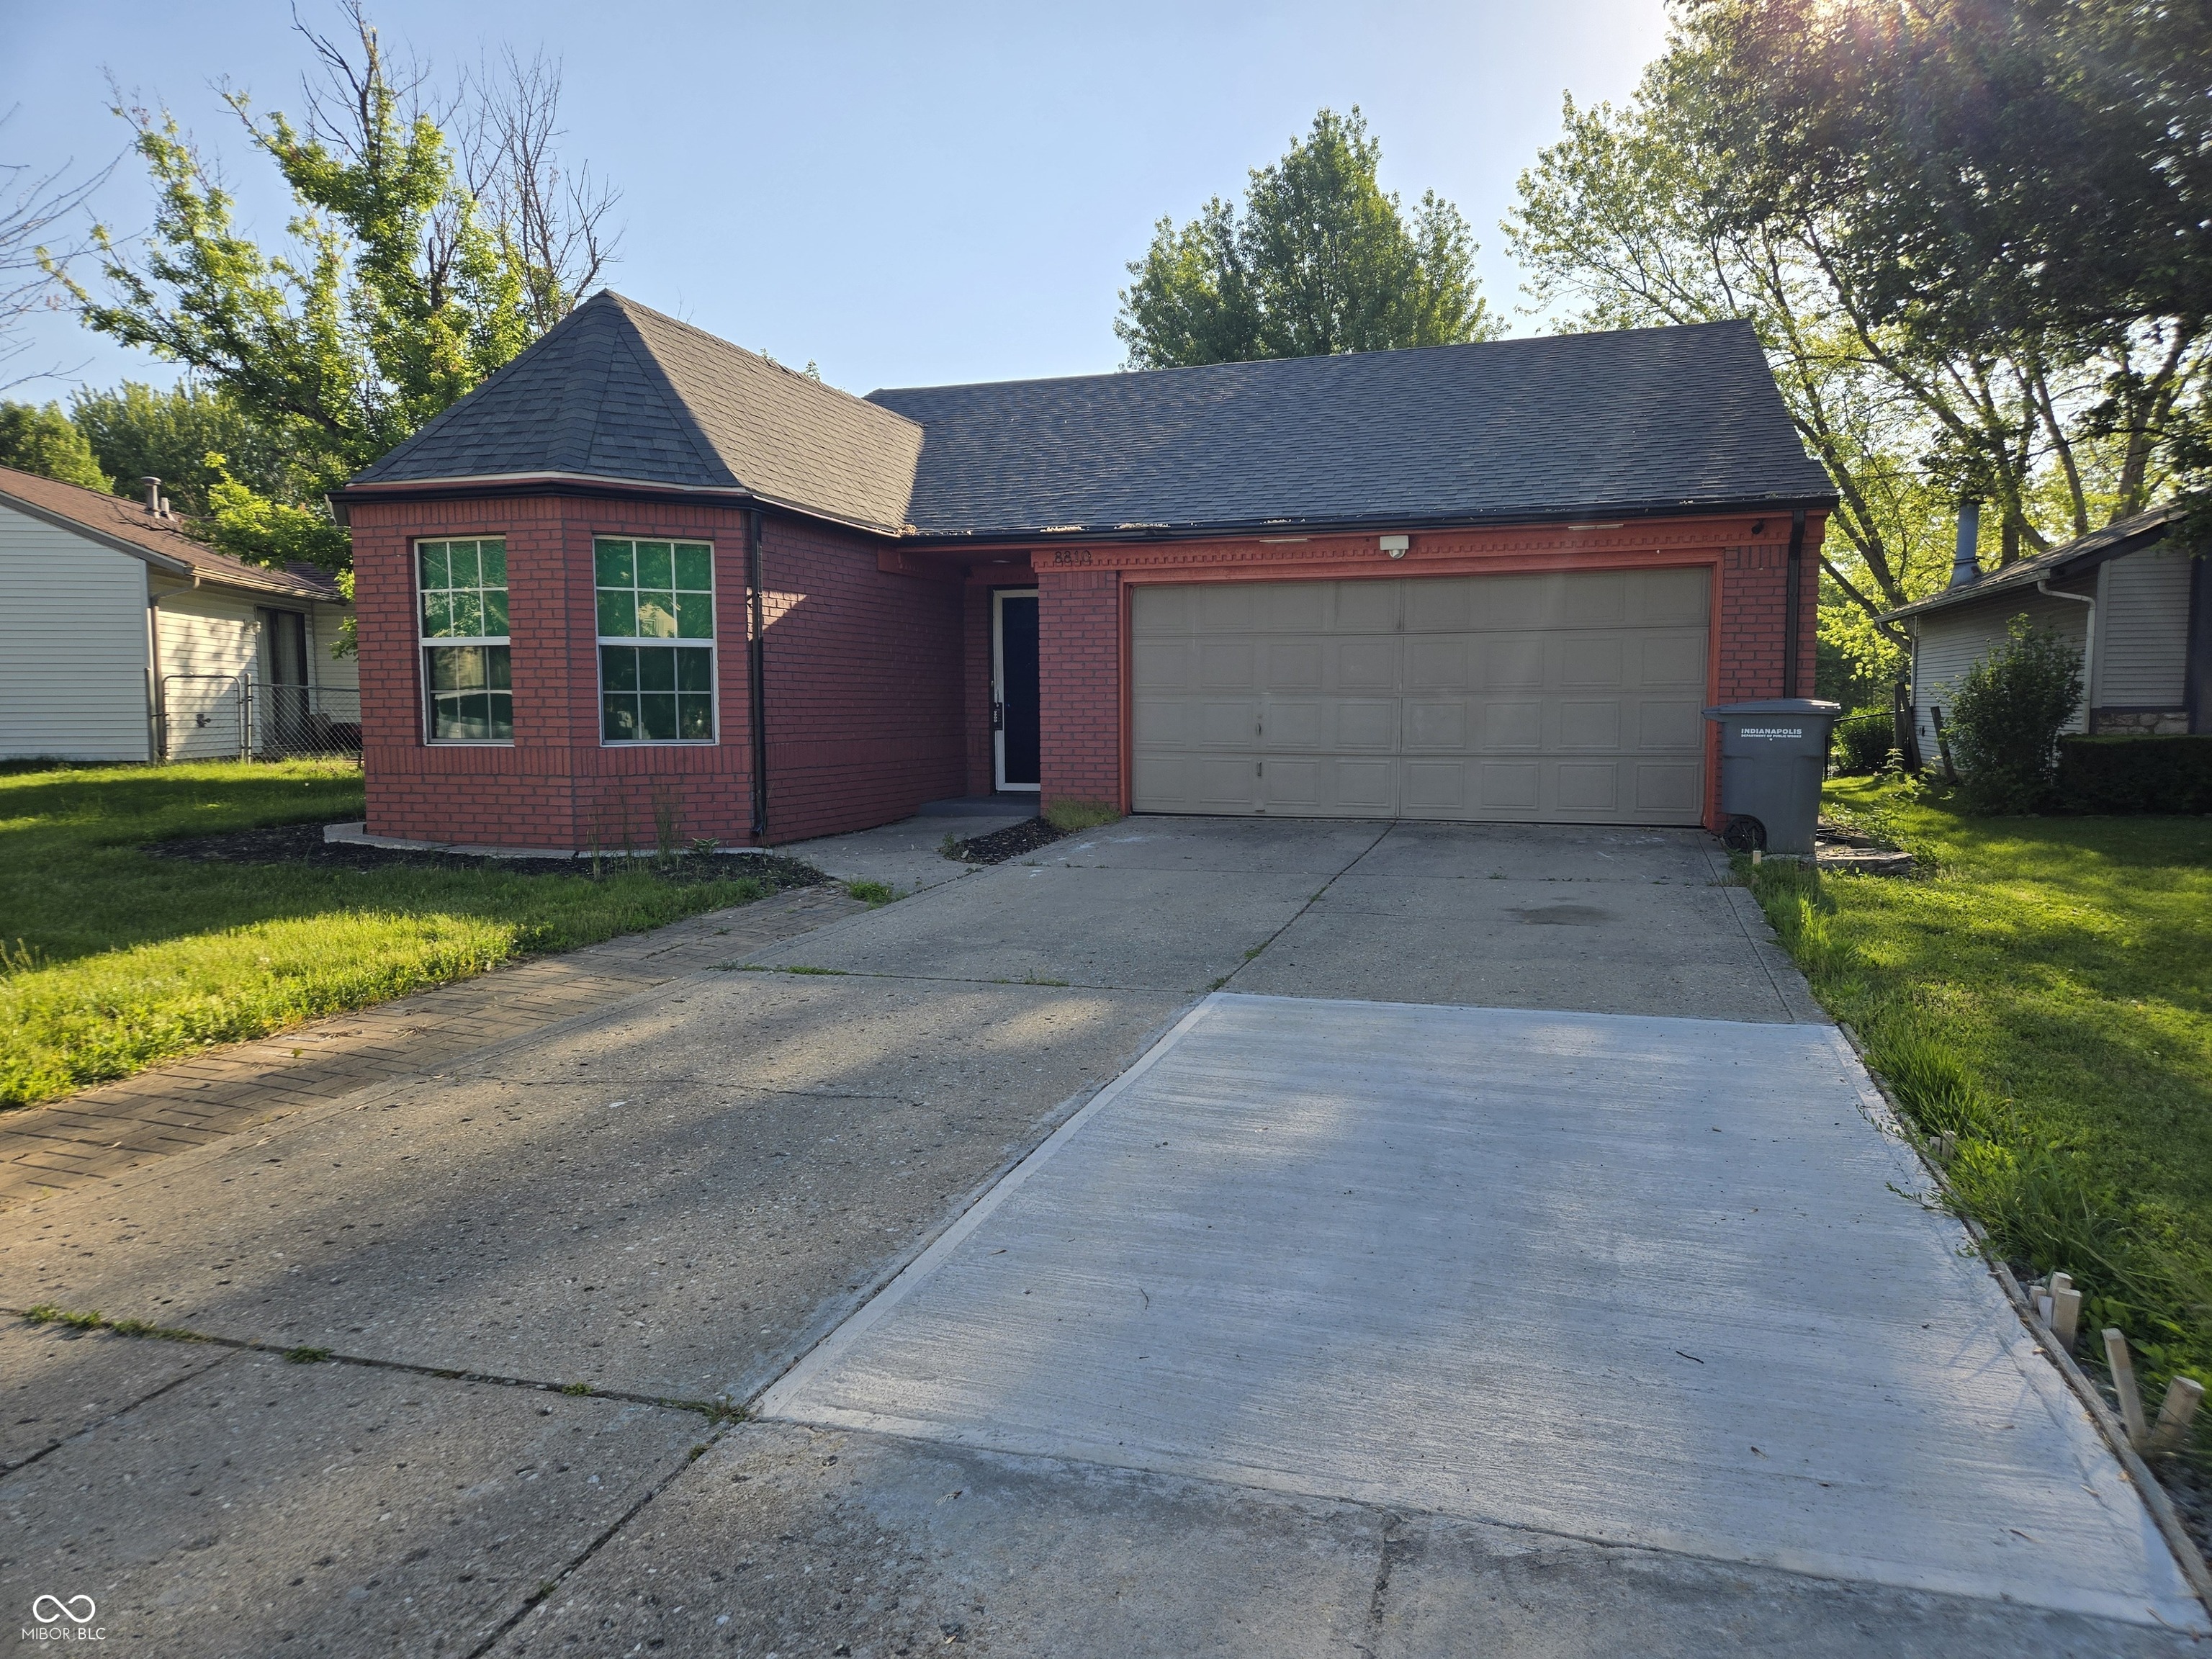
Active
$249,999
3
bds
|
2
ba
|
1,222
sqft
|
built
1989
8810 Summer Walk Dr E, Indianapolis, IN 46227
$-384
Cash flow
-8.0%
Cash-on-Cash Return
4.3%
Cap rate
0.5%
Rent to Value Ratio
Pending
$429,900
2
bds
|
2
ba
|
1,242
sqft
|
built
1925
5426 Broadway St, Indianapolis, IN 46220
$-408
Cash flow
-5.0%
Cash-on-Cash Return
5.0%
Cap rate
0.6%
Rent to Value Ratio
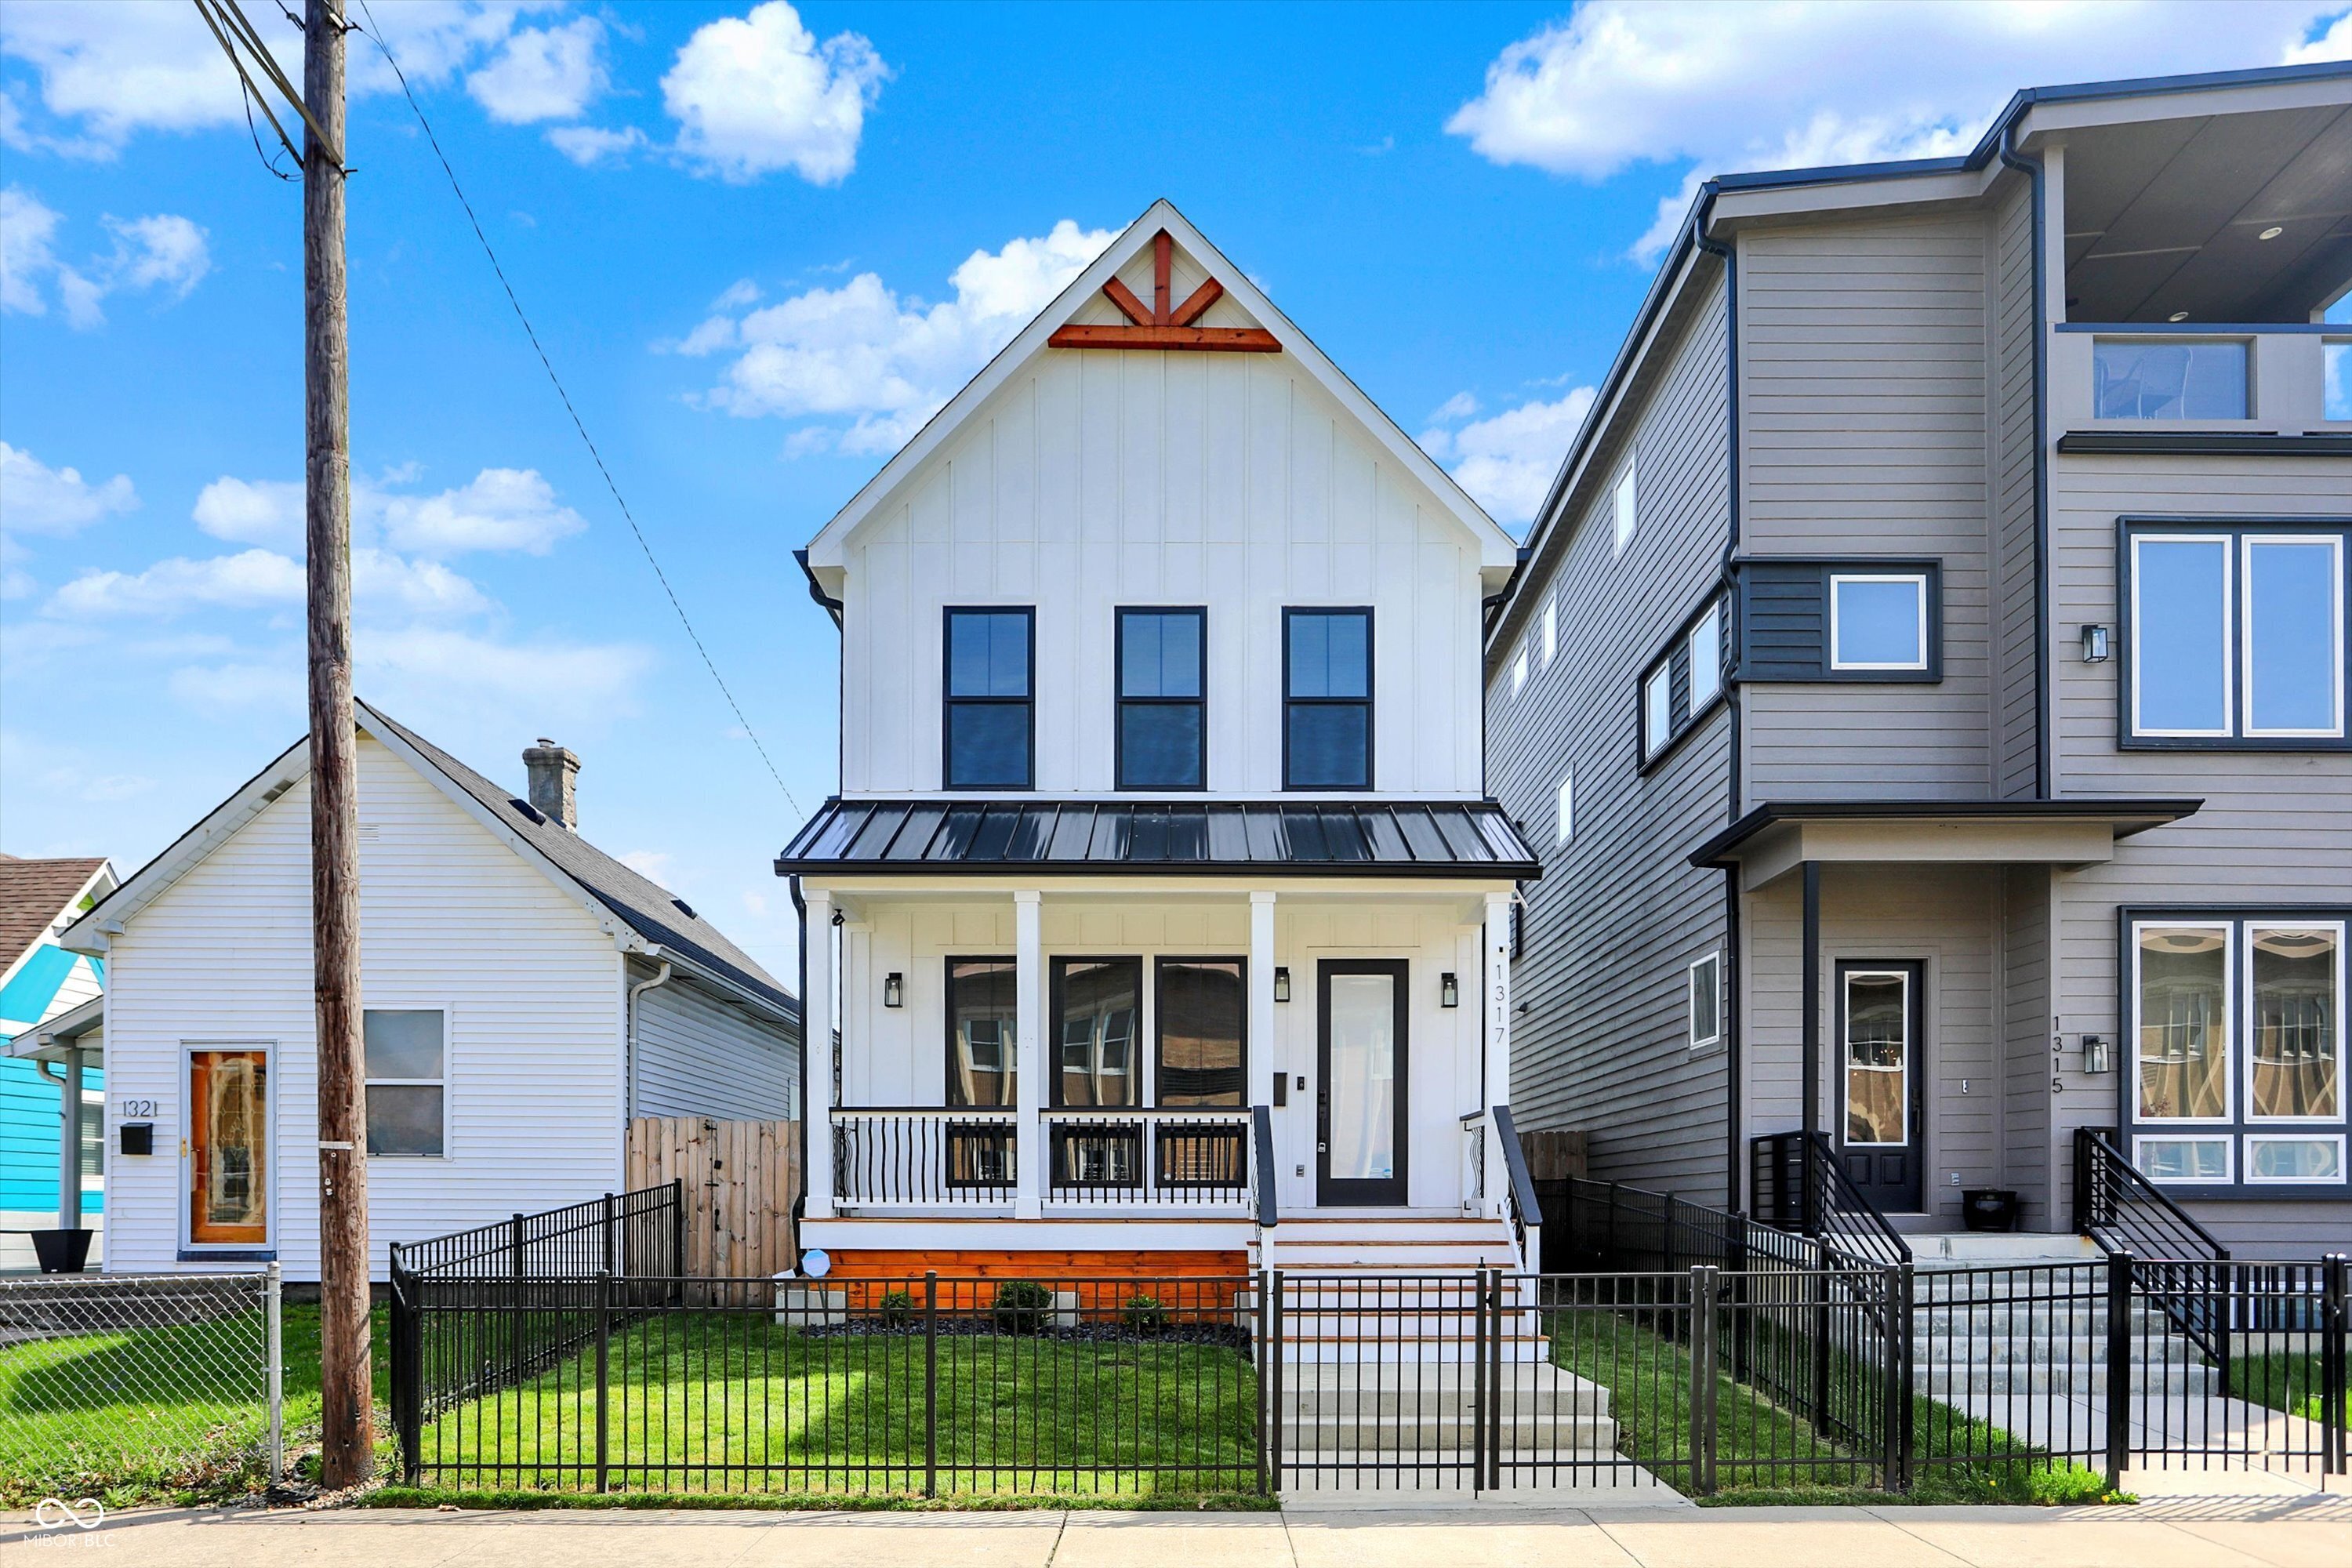
Active
$625,000
3
bds
|
4
ba
|
2,400
sqft
|
built
2021
1317 Spann Ave, Indianapolis, IN 46203
$-511
Cash flow
-4.3%
Cash-on-Cash Return
5.2%
Cap rate
0.6%
Rent to Value Ratio
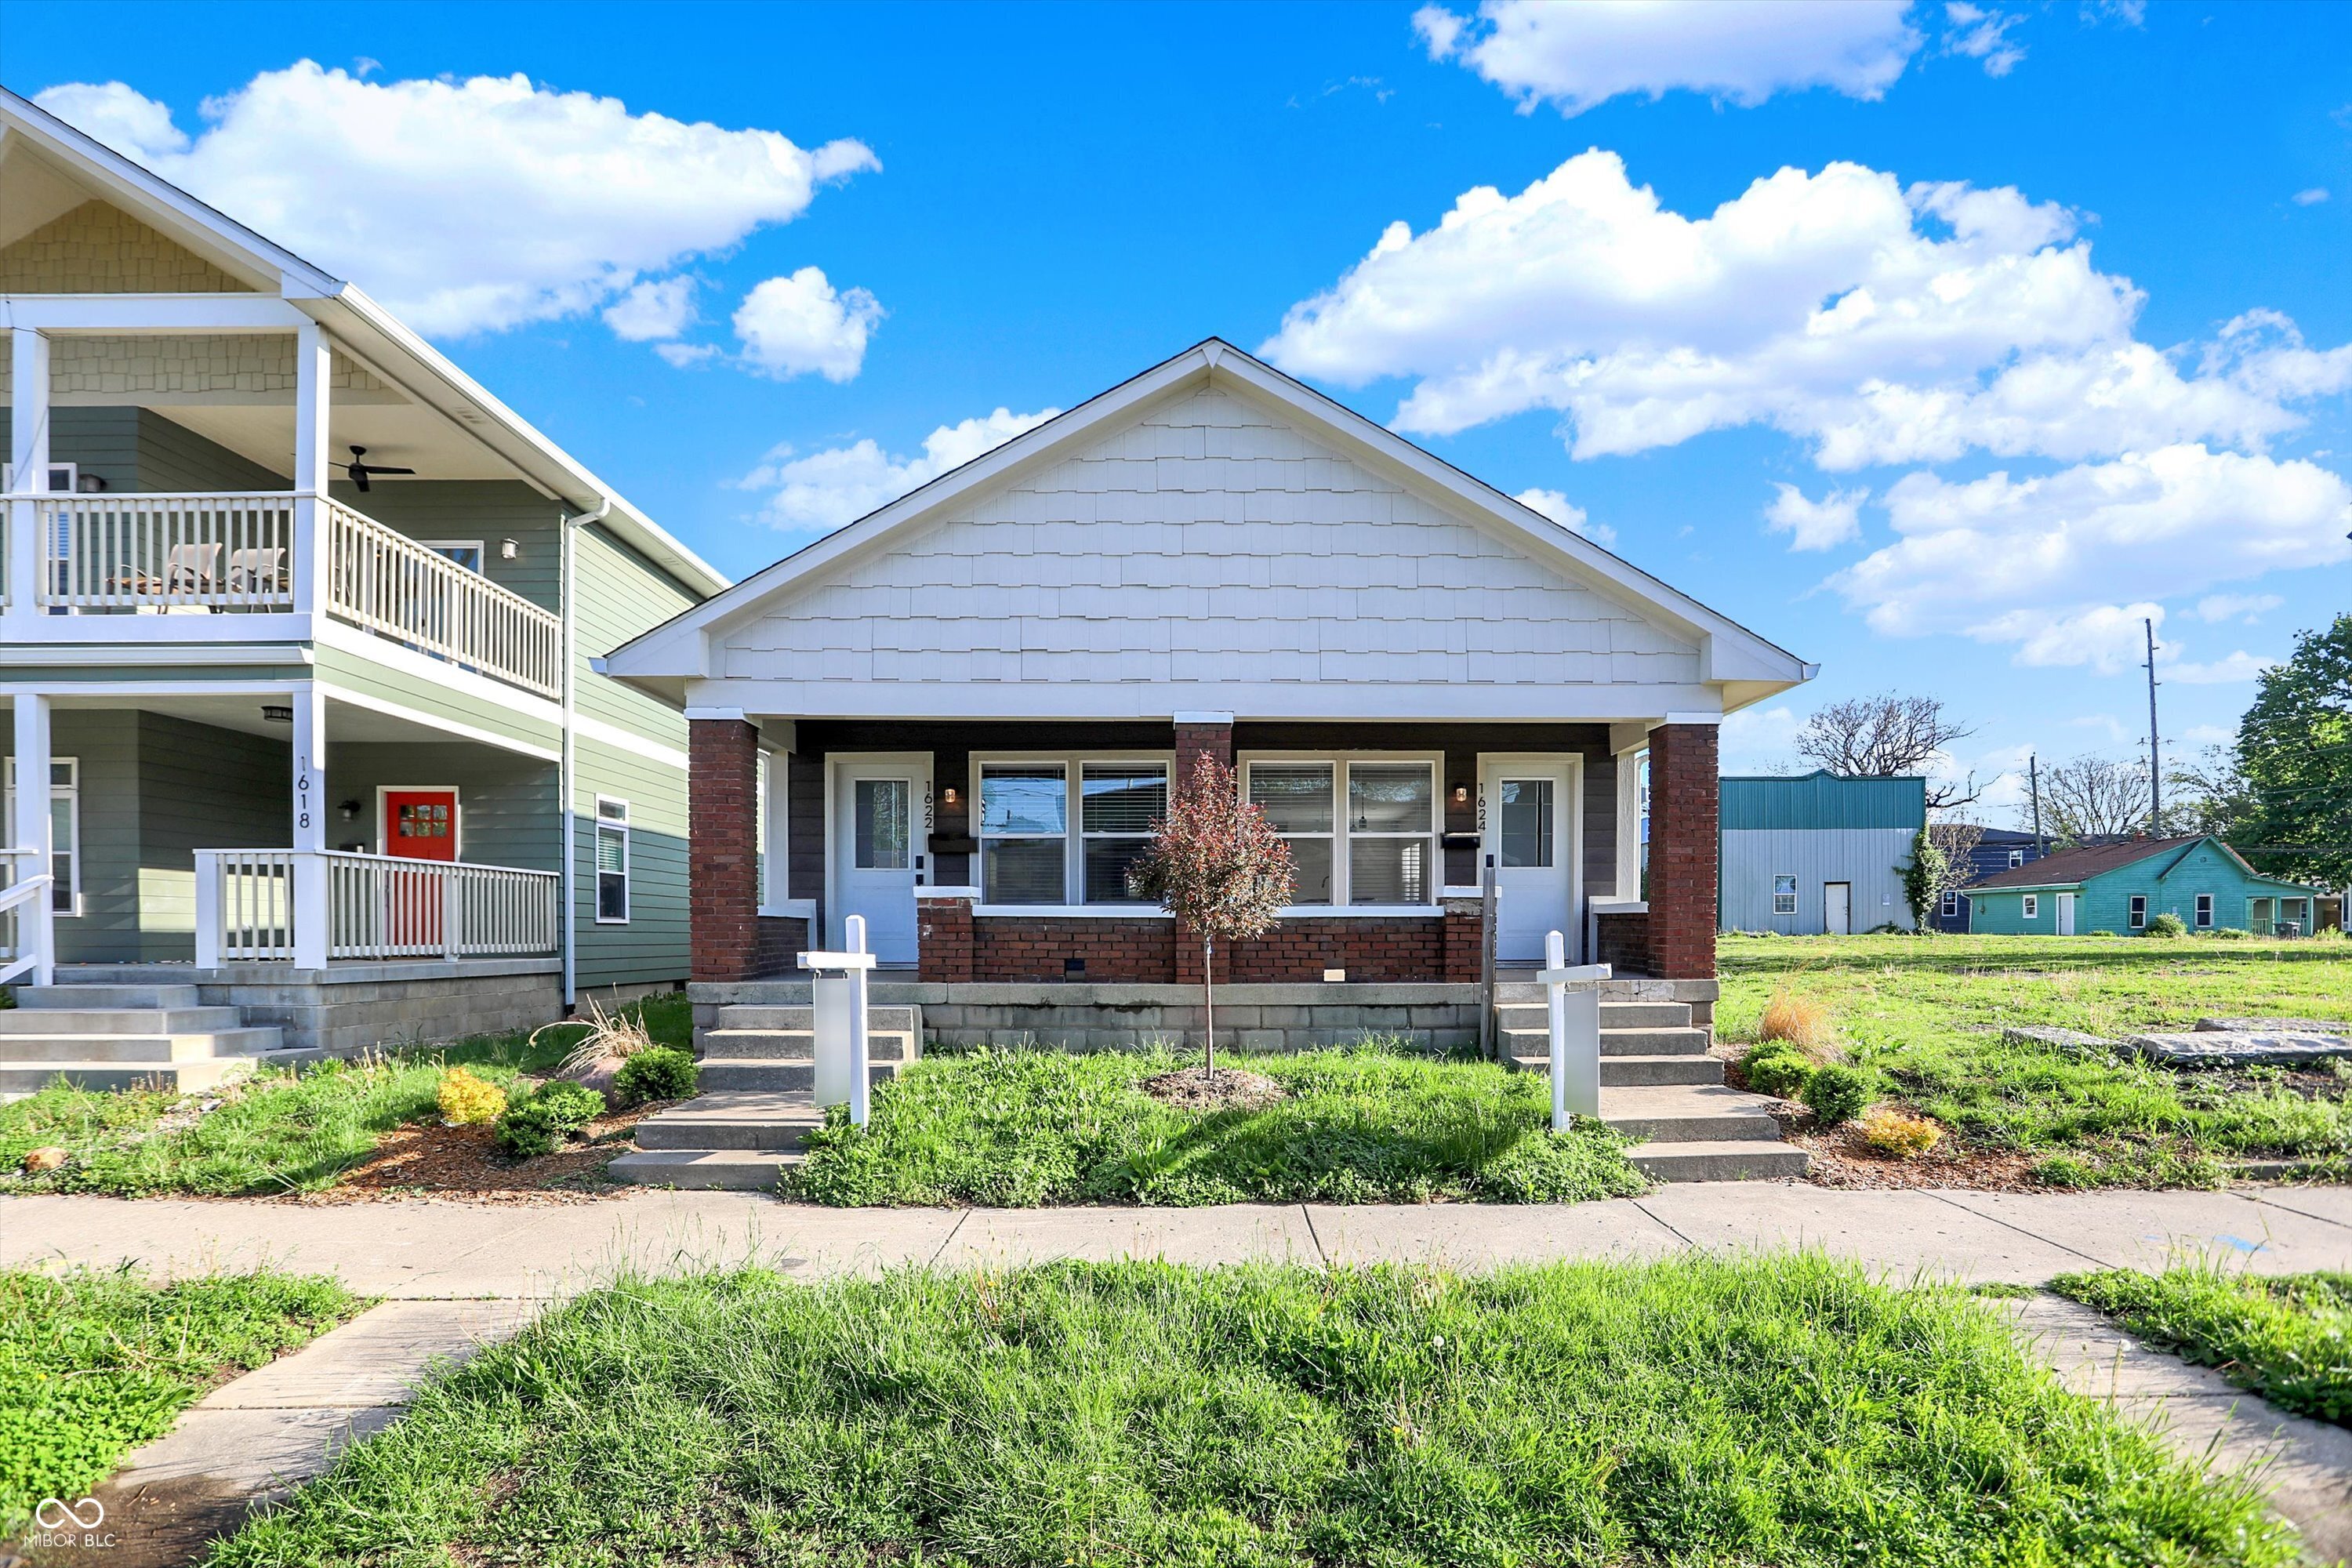
Active
$369,000
2
bds
|
3
ba
|
1,774
sqft
|
built
1910
1622 Prospect St, Indianapolis, IN 46203
$-717
Cash flow
-10.1%
Cash-on-Cash Return
3.8%
Cap rate
0.5%
Rent to Value Ratio
Active
$549,999
3
bds
|
4
ba
|
2,951
sqft
|
built
1997
7322 Franklin Parke Ct, Indianapolis, IN 46259
$-1,100
Cash flow
-10.4%
Cash-on-Cash Return
3.7%
Cap rate
0.5%
Rent to Value Ratio
Active
$750,000
5
bds
|
4
ba
|
3,060
sqft
|
built
1994
9909 E Mc Gregor Rd, Indianapolis, IN 46259
$-1,358
Cash flow
-9.4%
Cash-on-Cash Return
4.0%
Cap rate
0.5%
Rent to Value Ratio
Active
$698,000
3
bds
|
3
ba
|
2,572
sqft
|
built
1985
958 Tamarack Circle North Dr, Indianapolis, IN 46260
$-1,600
Cash flow
-12.0%
Cash-on-Cash Return
3.4%
Cap rate
0.5%
Rent to Value Ratio
Active
$279,900
4
bds
|
3
ba
|
1,997
sqft
|
built
2006
8249 Retreat Ln, Indianapolis, IN 46259
$-54
Cash flow
-1.0%
Cash-on-Cash Return
5.9%
Cap rate
0.7%
Rent to Value Ratio
Active
$239,900
2
bds
|
2
ba
|
1,620
sqft
|
built
1989
8651 Jaffa Court East Dr, Indianapolis, IN 46260
$-289
Cash flow
-6.3%
Cash-on-Cash Return
4.7%
Cap rate
0.9%
Rent to Value Ratio
Active
$359,900
3
bds
|
2
ba
|
1,627
sqft
|
built
1960
7915 Allisonville Rd, Indianapolis, IN 46250
$-257
Cash flow
-3.7%
Cash-on-Cash Return
5.3%
Cap rate
0.6%
Rent to Value Ratio
Active
$389,990
4
bds
|
3
ba
|
2,380
sqft
|
built
1920
3535 Birchwood Ave, Indianapolis, IN 46205
$-66
Cash flow
-0.9%
Cash-on-Cash Return
5.9%
Cap rate
0.7%
Rent to Value Ratio
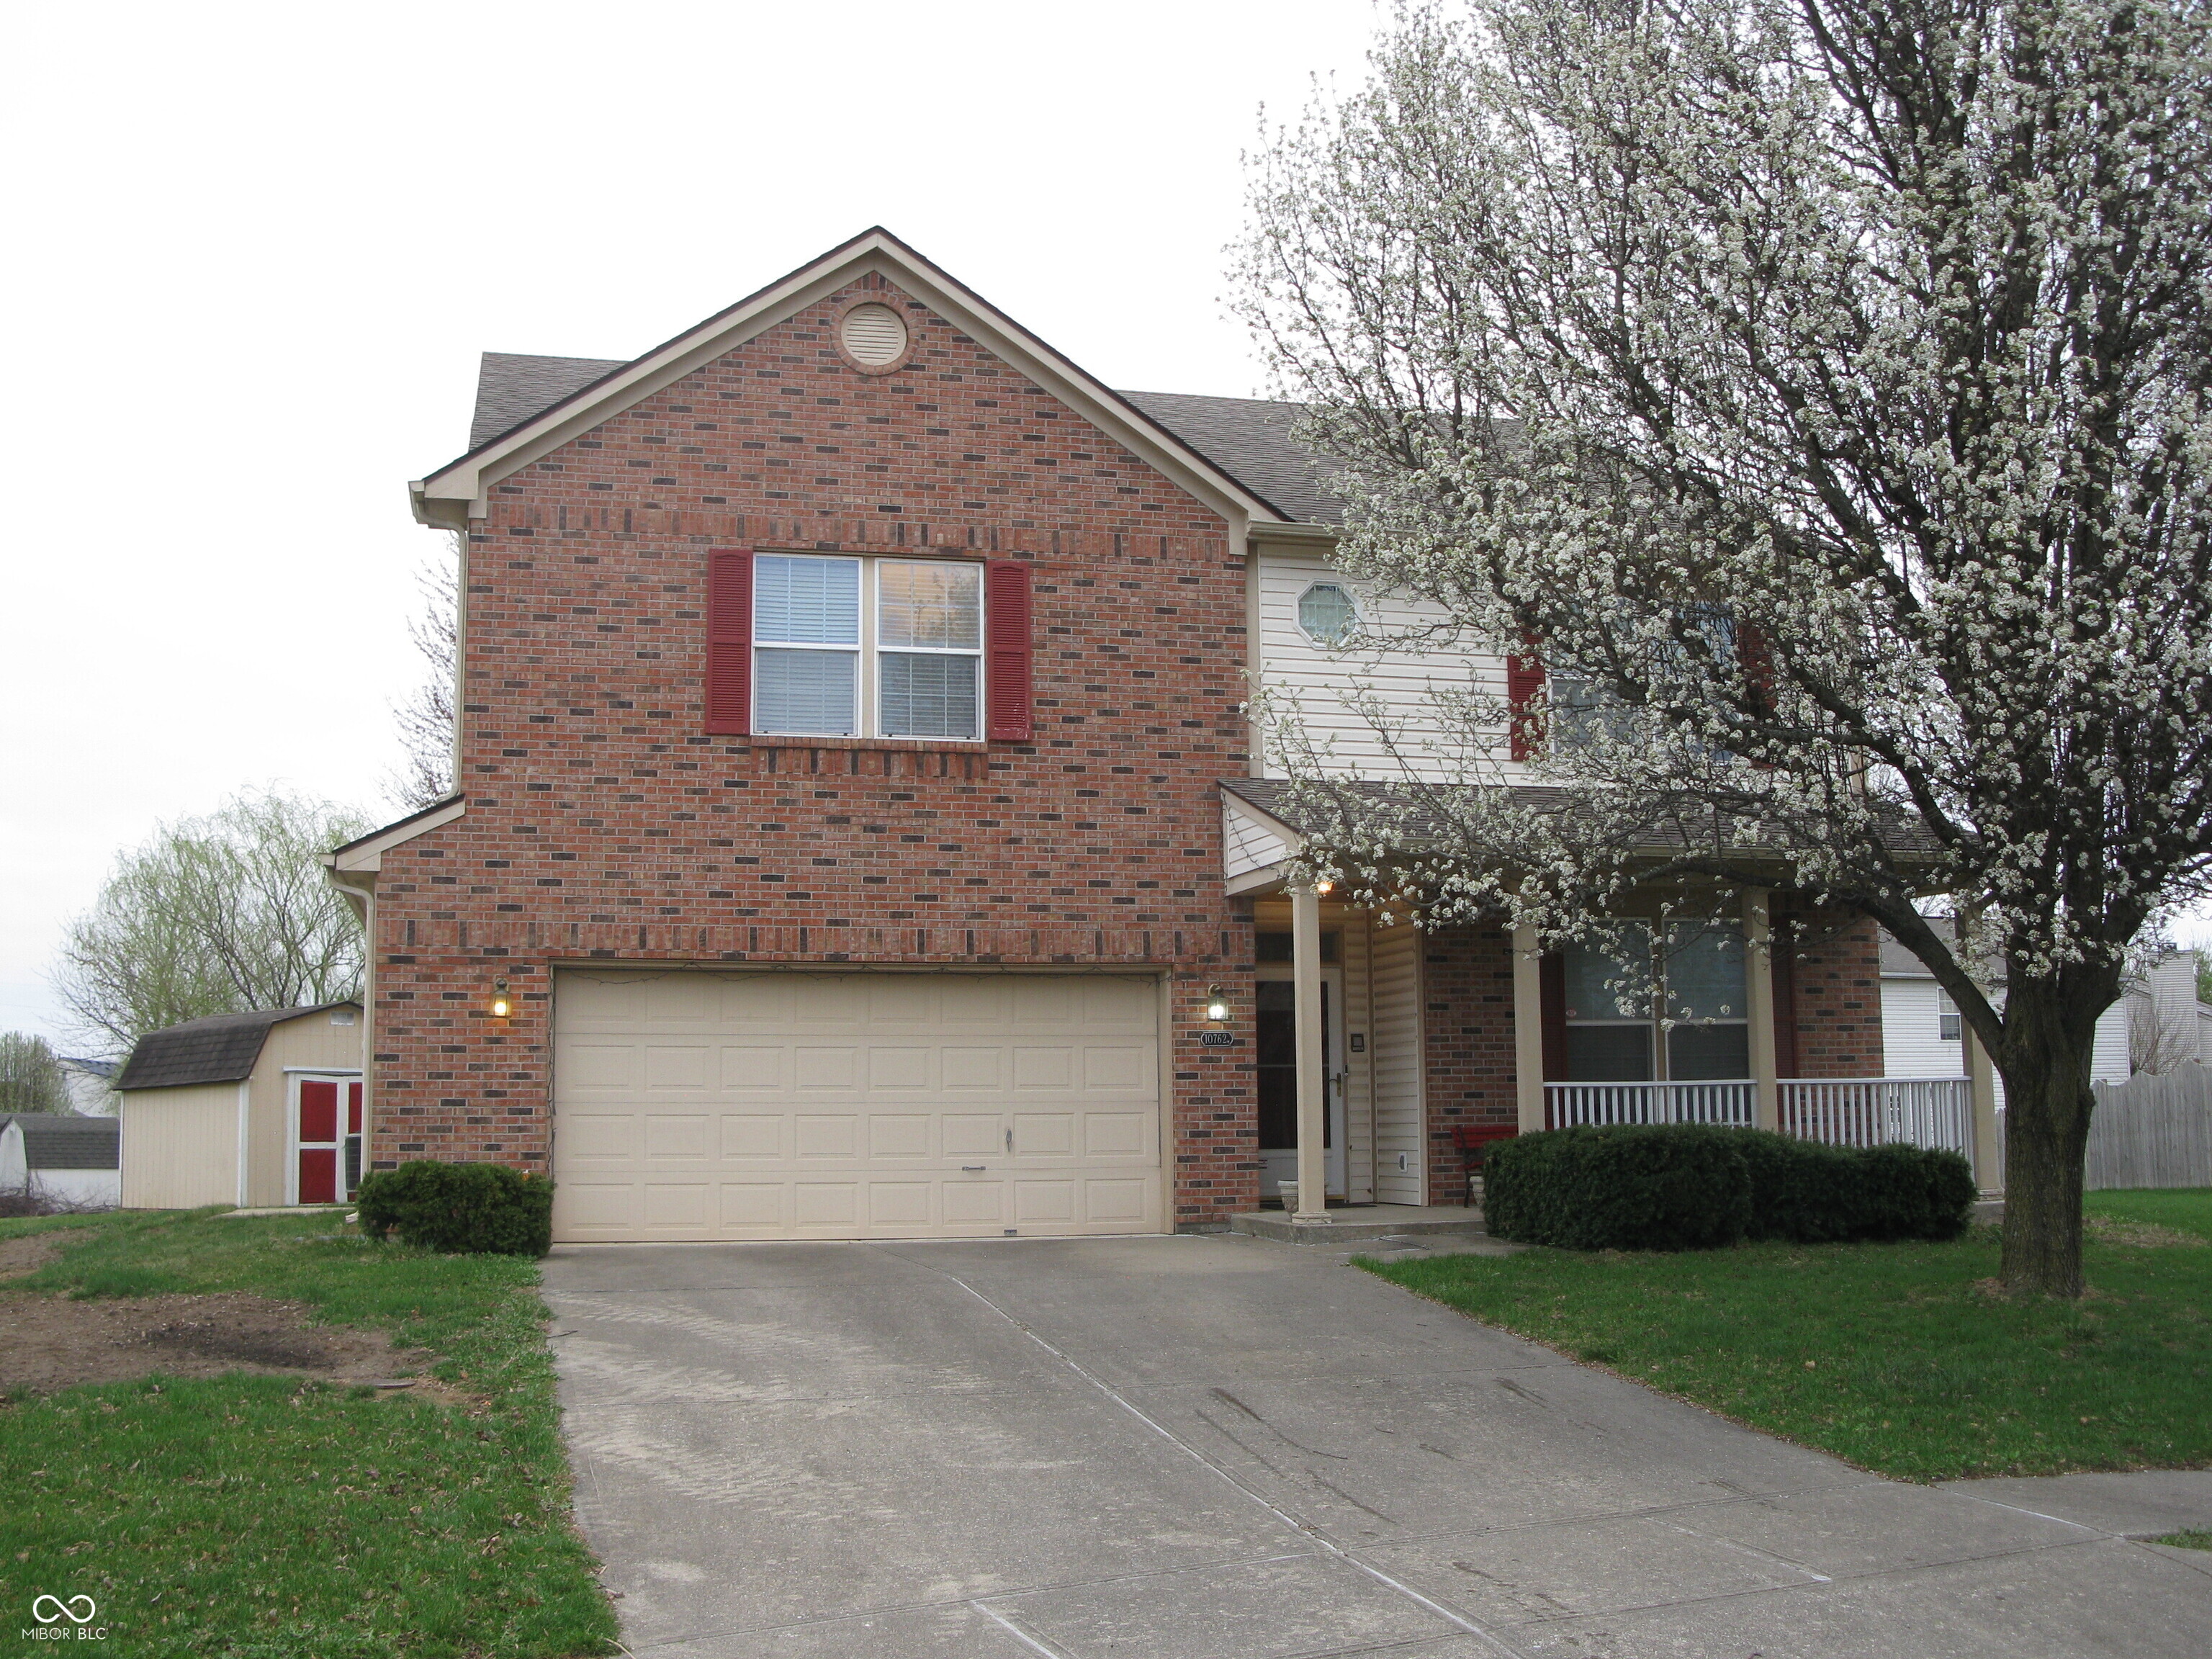
Active
$360,000
5
bds
|
3
ba
|
2,878
sqft
|
built
2001
10762 Galant Fox Ct, Indianapolis, IN 46234
$-161
Cash flow
-2.3%
Cash-on-Cash Return
5.6%
Cap rate
0.7%
Rent to Value Ratio
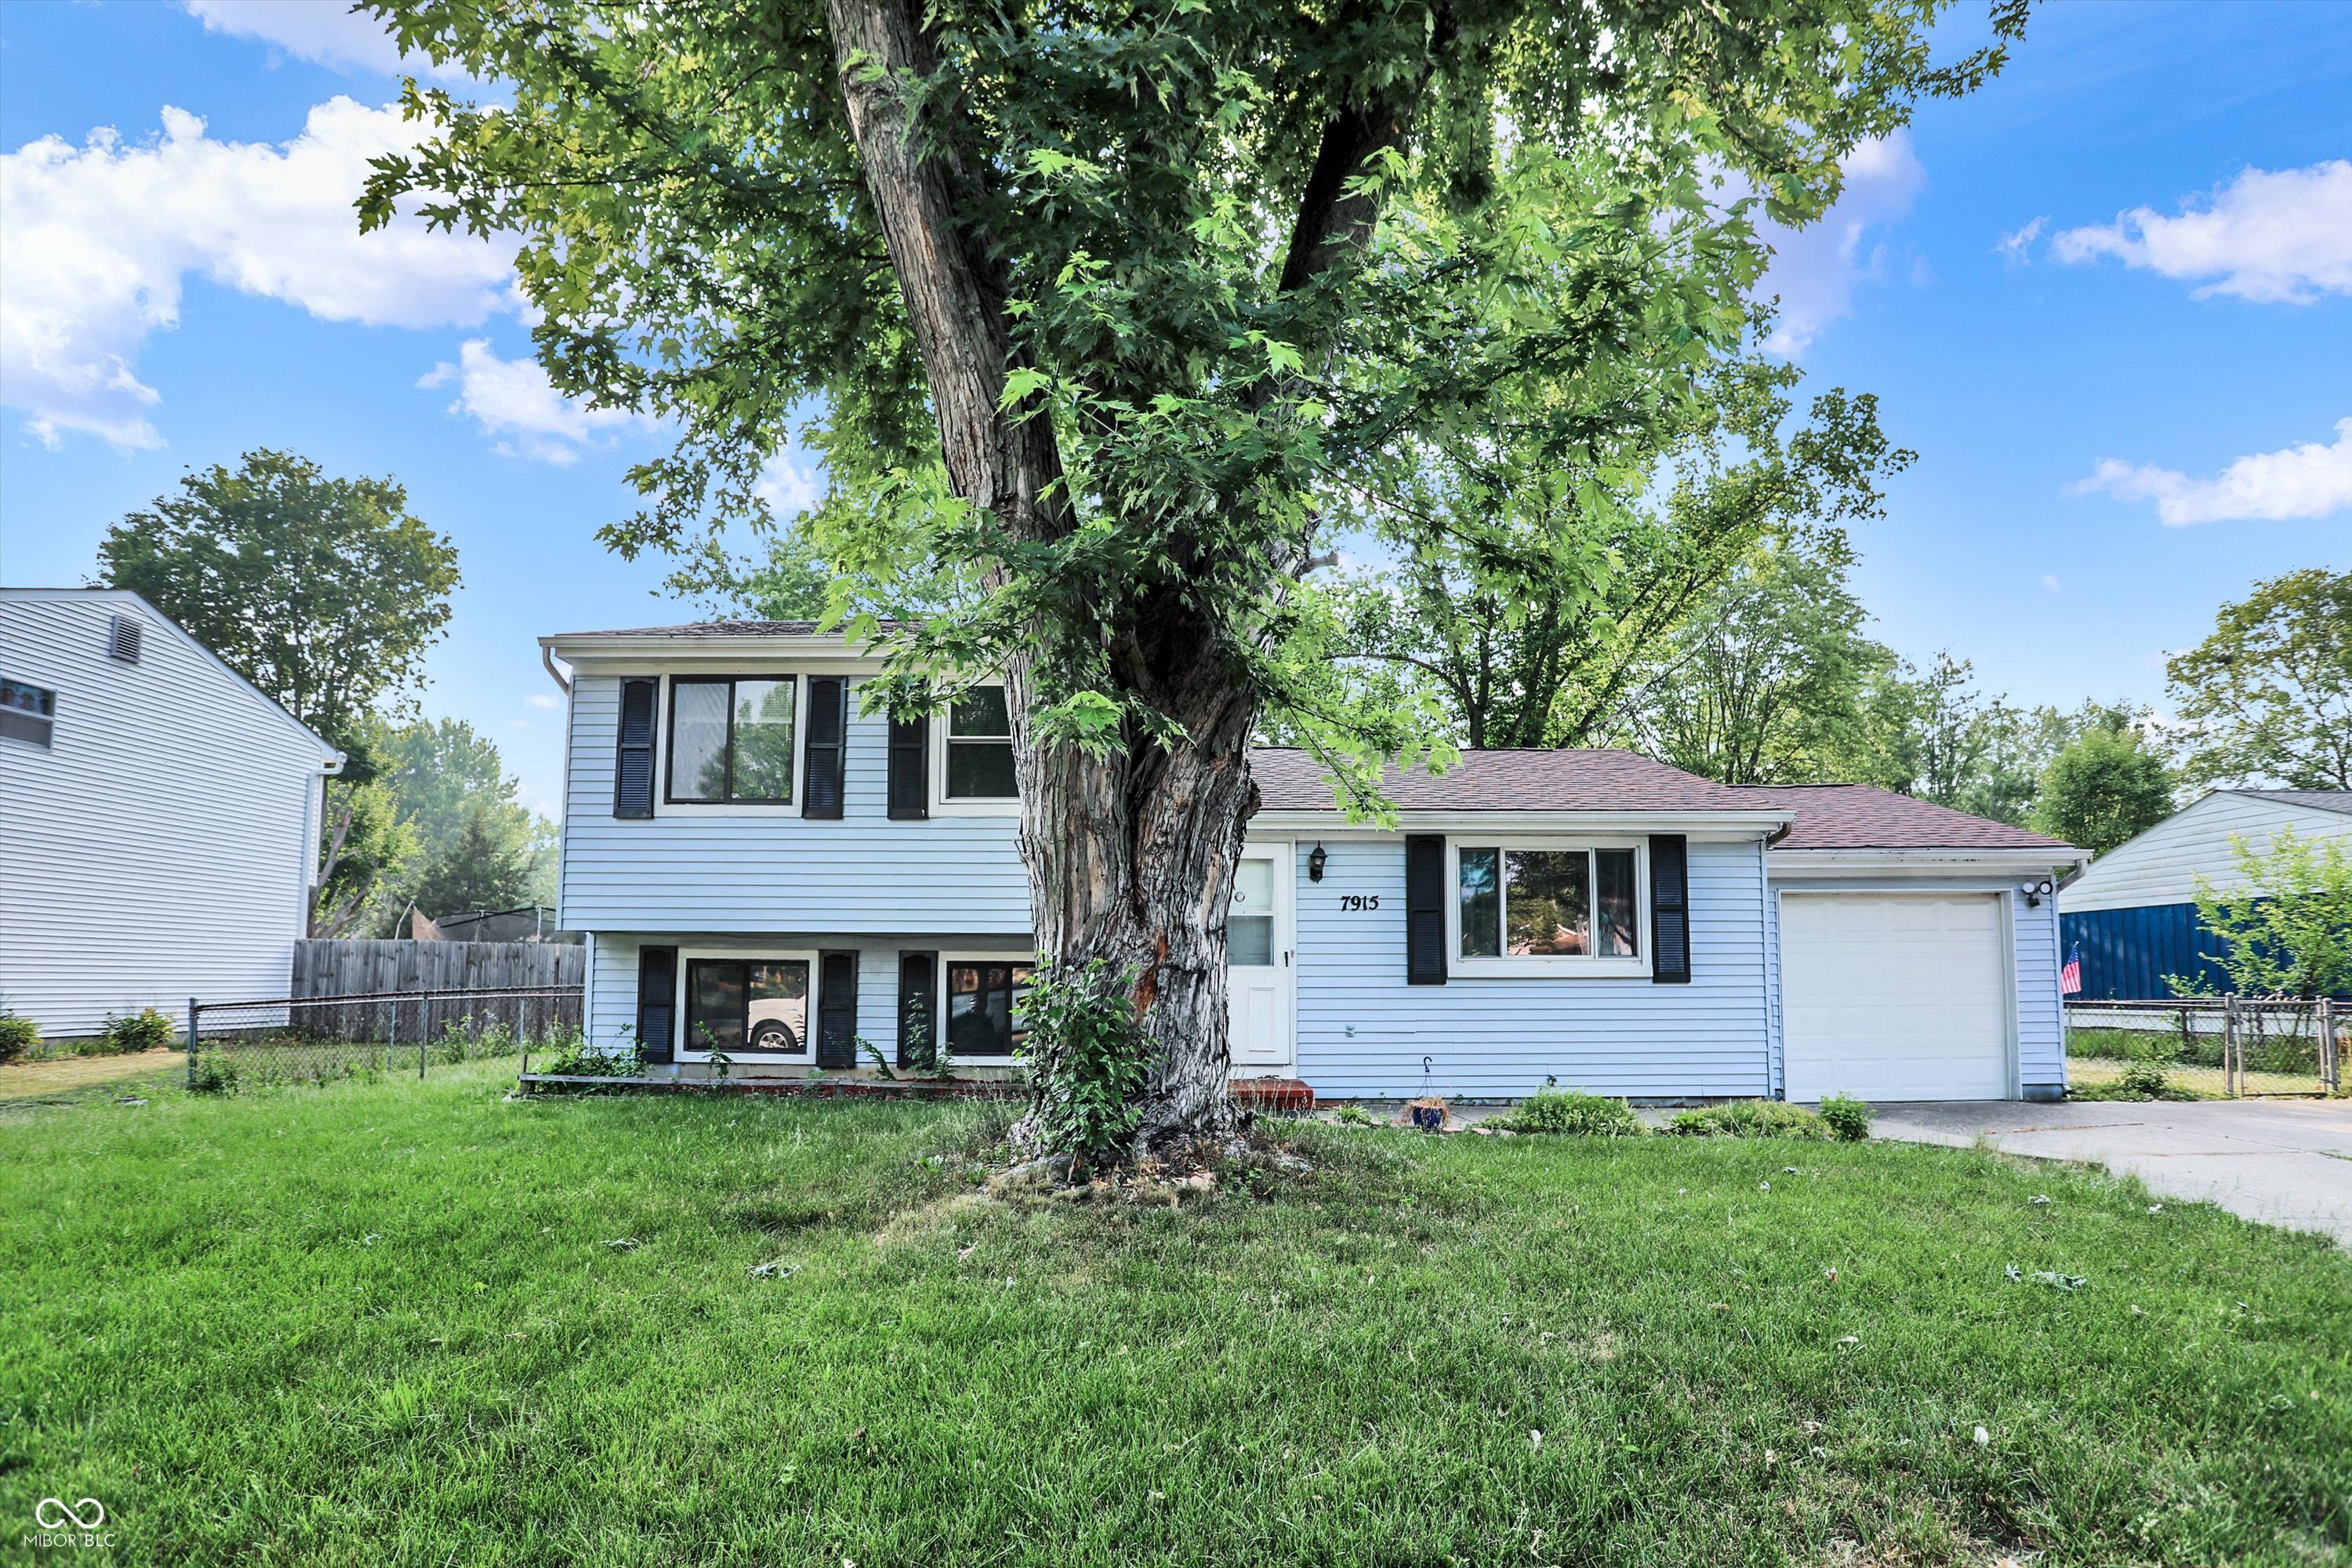
Active
$209,900
3
bds
|
2
ba
|
1,224
sqft
|
built
1981
7915 Broadview Dr, Indianapolis, IN 46227
$29
Cash flow
0.7%
Cash-on-Cash Return
6.3%
Cap rate
0.8%
Rent to Value Ratio