Indianapolis, IN Investment Properties for Sale
Browse homes for sale and investment properties in Indianapolis, IN. Refine your search by price, property type, or more.
Best cash flowing properties in Indianapolis, IN

Active
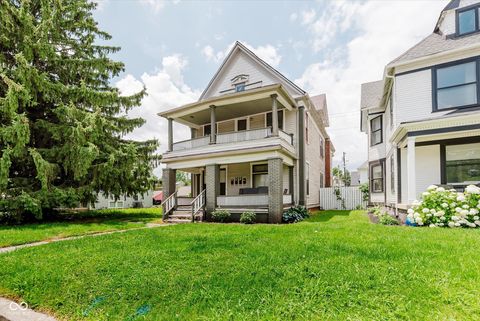
$285,000
2
bds
|
1
ba
|
1,056
sqft
|
built
1915
923 E 42nd St, Indianapolis, IN 46205
$237
Cash flow
4.3%
Cash-on-Cash Return
7.3%
Cap rate
0.9%
Rent to Value Ratio

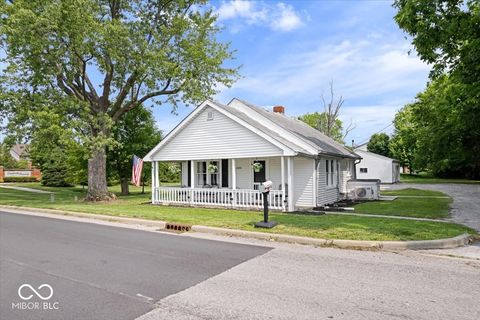
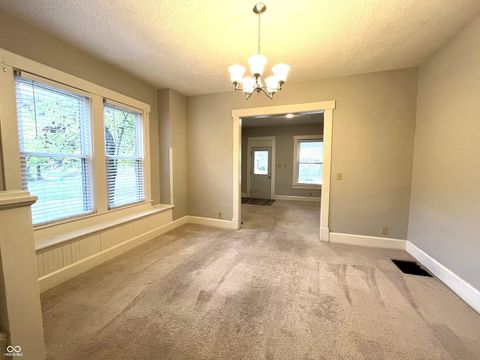
Active
$180,000
3
bds
|
2
ba
|
1,457
sqft
|
built
1930
244 W 31st St, Indianapolis, IN 46208
$164
Cash flow
4.8%
Cash-on-Cash Return
7.4%
Cap rate
0.9%
Rent to Value Ratio
1,632 out of 1,758 properties for sale in Indianapolis, IN
Limited Results Shown
Create a free account, or log in to reveal all property listings and enjoy the complete experience.
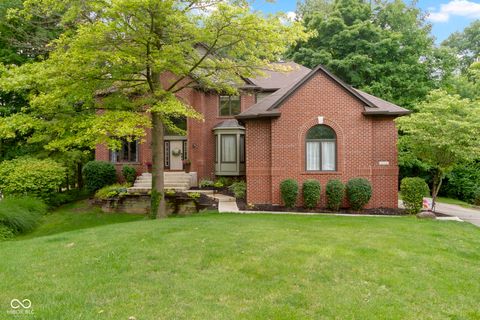
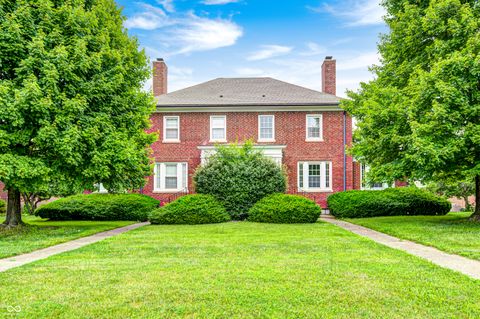
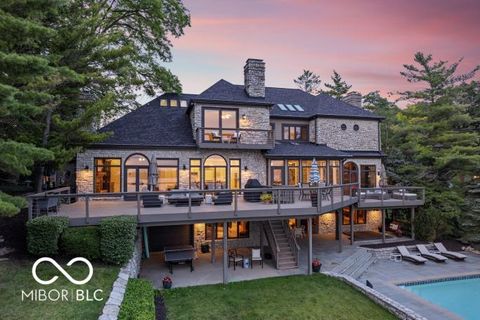
Active
$850,000
5
bds
|
4
ba
|
4,598
sqft
|
built
1995
12214 Ridgeside Rd, Indianapolis, IN 46256
$-1,458
Cash flow
-8.9%
Cash-on-Cash Return
4.1%
Cap rate
0.5%
Rent to Value Ratio
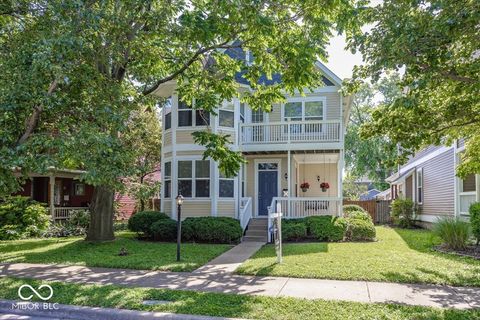
Active
$467,900
3
bds
|
3
ba
|
2,930
sqft
|
built
2004
2325 N Talbott St, Indianapolis, IN 46205
$-1
Cash flow
0.0%
Cash-on-Cash Return
6.1%
Cap rate
0.7%
Rent to Value Ratio
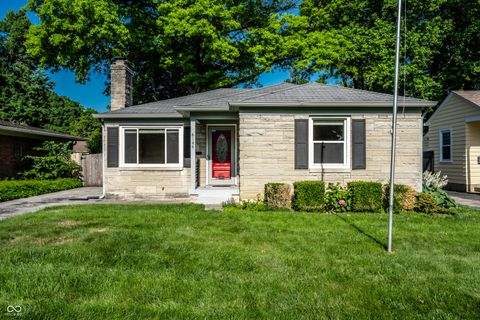
Active
$300,000
2
bds
|
2
ba
|
954
sqft
|
built
1948
6146 Burlington Ave, Indianapolis, IN 46220
$-157
Cash flow
-2.7%
Cash-on-Cash Return
5.5%
Cap rate
0.7%
Rent to Value Ratio
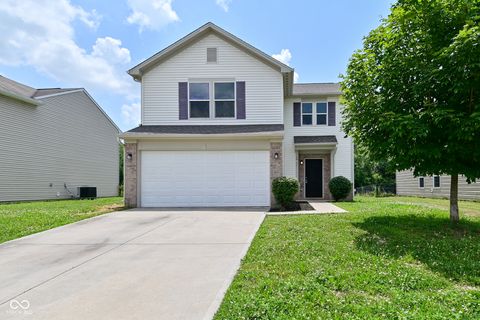
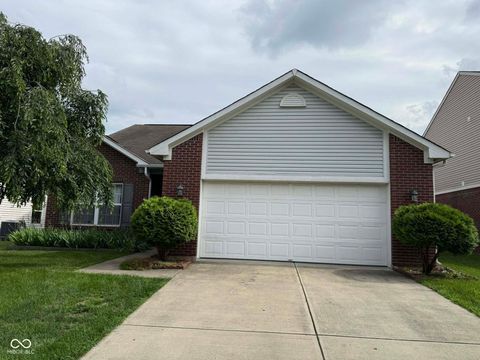
Active
$244,900
4
bds
|
3
ba
|
1,633
sqft
|
built
2013
10431 Bellchime Ct, Indianapolis, IN 46235
$83
Cash flow
1.8%
Cash-on-Cash Return
6.6%
Cap rate
0.8%
Rent to Value Ratio
Active
$450,000
5
bds
|
0
ba
|
0
sqft
|
built
1900
2060 Central Ave, Indianapolis, IN 46202
$-1,339
Cash flow
-15.5%
Cash-on-Cash Return
2.6%
Cap rate
0.3%
Rent to Value Ratio
Active
$275,000
3
bds
|
2
ba
|
1,480
sqft
|
built
2011
621 Appleseed Dr, Indianapolis, IN 46217
$-198
Cash flow
-3.8%
Cash-on-Cash Return
5.3%
Cap rate
0.7%
Rent to Value Ratio
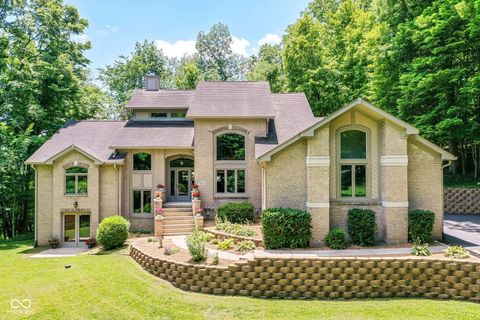
Active
$689,900
4
bds
|
4
ba
|
4,744
sqft
|
built
2001
8004 Lafayette Rd, Indianapolis, IN 46278
$-1,740
Cash flow
-13.2%
Cash-on-Cash Return
3.1%
Cap rate
0.4%
Rent to Value Ratio
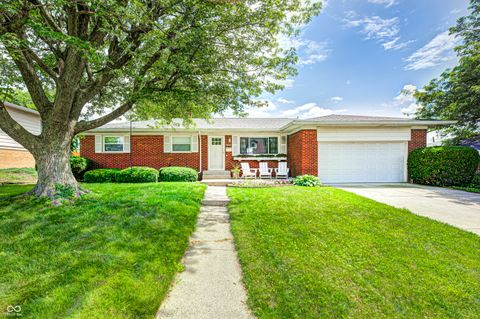
Active
$339,000
3
bds
|
2
ba
|
2,370
sqft
|
built
1958
6143 Schoolwood Dr, Indianapolis, IN 46224
$-495
Cash flow
-7.6%
Cash-on-Cash Return
4.4%
Cap rate
0.5%
Rent to Value Ratio
Active
$425,000
4
bds
|
3
ba
|
2,492
sqft
|
built
1977
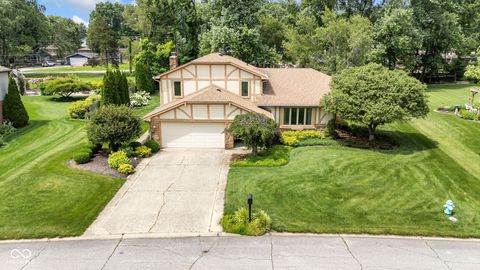
8525 Winding Ridge Rd, Indianapolis, IN 46217
$-253
Cash flow
-3.1%
Cash-on-Cash Return
5.4%
Cap rate
0.7%
Rent to Value Ratio
Active
$344,500
2
bds
|
2
ba
|
1,533
sqft
|
built
1986
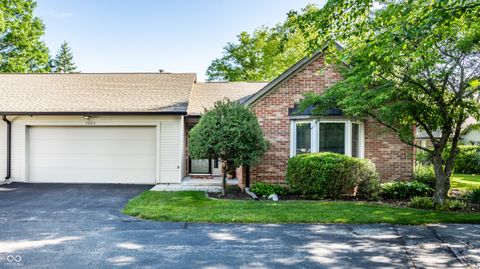
1663 Cloister Dr, Indianapolis, IN 46260
$-761
Cash flow
-11.5%
Cash-on-Cash Return
3.5%
Cap rate
0.6%
Rent to Value Ratio
Active
$150,000
2
bds
|
1
ba
|
672
sqft
|
built
1940
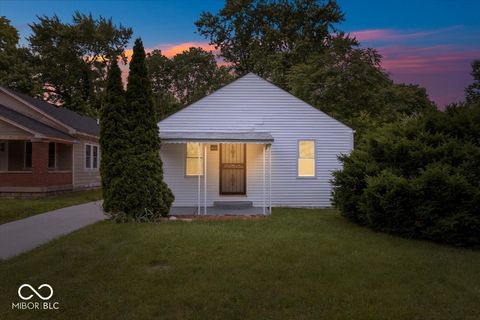
4310 Crittenden Ave, Indianapolis, IN 46205
$-78
Cash flow
-2.7%
Cash-on-Cash Return
5.5%
Cap rate
0.7%
Rent to Value Ratio
Active
$330,000
4
bds
|
3
ba
|
1,932
sqft
|
built
1980
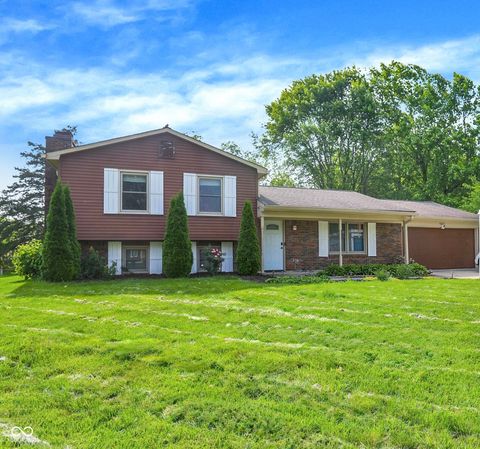
8315 San Marcos Cir, Indianapolis, IN 46256
$-192
Cash flow
-3.0%
Cash-on-Cash Return
5.4%
Cap rate
0.7%
Rent to Value Ratio
Active
$250,000
3
bds
|
1
ba
|
1,472
sqft
|
built
1931
8436 E 56th St, Indianapolis, IN 46216
$-631
Cash flow
-13.2%
Cash-on-Cash Return
3.2%
Cap rate
0.6%
Rent to Value Ratio
Active
$293,000
3
bds
|
3
ba
|
1,941
sqft
|
built
2014
2211 Willowview Dr, Indianapolis, IN 46239
$-162
Cash flow
-2.9%
Cash-on-Cash Return
5.5%
Cap rate
0.7%
Rent to Value Ratio
Active
$235,000
3
bds
|
2
ba
|
1,207
sqft
|
built
1999
6332 Long River Ln, Indianapolis, IN 46221
$-116
Cash flow
-2.6%
Cash-on-Cash Return
5.6%
Cap rate
0.7%
Rent to Value Ratio
Active
$299,900
4
bds
|
3
ba
|
1,986
sqft
|
built
1999
1903 Windy Hill Ln, Indianapolis, IN 46239
$-240
Cash flow
-4.2%
Cash-on-Cash Return
5.2%
Cap rate
0.6%
Rent to Value Ratio
Active
$245,000
3
bds
|
2
ba
|
1,236
sqft
|
built
1999
6227 Long River Ln, Indianapolis, IN 46221
$-167
Cash flow
-3.6%
Cash-on-Cash Return
5.3%
Cap rate
0.7%
Rent to Value Ratio
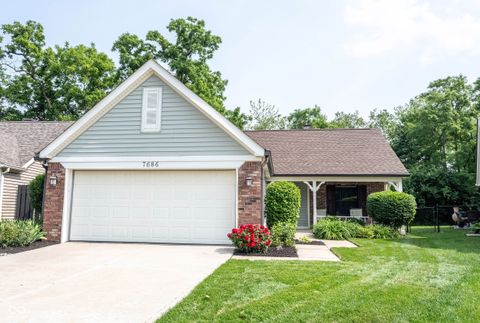
Active
$290,000
2
bds
|
2
ba
|
1,295
sqft
|
built
1984
7686 Micawber Ct, Indianapolis, IN 46256
$-141
Cash flow
-2.5%
Cash-on-Cash Return
5.6%
Cap rate
0.7%
Rent to Value Ratio
Active
$275,000
3
bds
|
2
ba
|
1,600
sqft
|
built
2016
6315 Emerald Field Way, Indianapolis, IN 46221
$-192
Cash flow
-3.6%
Cash-on-Cash Return
5.3%
Cap rate
0.7%
Rent to Value Ratio
Active
$414,900
4
bds
|
3
ba
|
3,090
sqft
|
built
2002
8030 Parcrest Ct, Indianapolis, IN 46259
$-243
Cash flow
-3.1%
Cash-on-Cash Return
5.4%
Cap rate
0.7%
Rent to Value Ratio
Active
$210,000
2
bds
|
3
ba
|
1,789
sqft
|
built
1994
11632 Coastal Way, Indianapolis, IN 46229
$8
Cash flow
0.2%
Cash-on-Cash Return
6.2%
Cap rate
0.9%
Rent to Value Ratio

Active
$499,900
3
bds
|
2
ba
|
1,550
sqft
|
built
1922
4619 N Park Ave, Indianapolis, IN 46205
$-678
Cash flow
-7.1%
Cash-on-Cash Return
4.6%
Cap rate
0.6%
Rent to Value Ratio
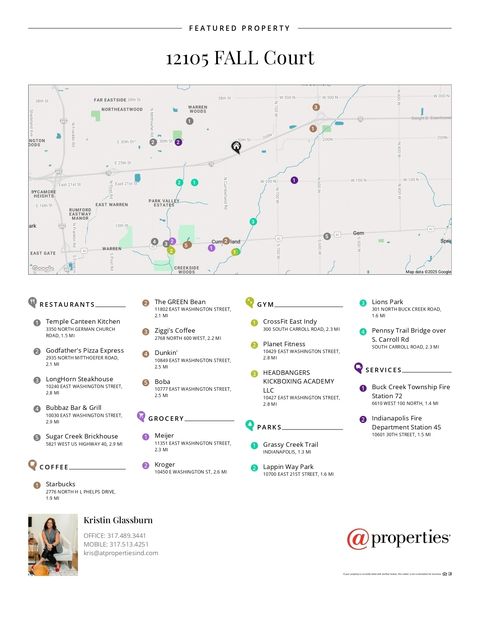
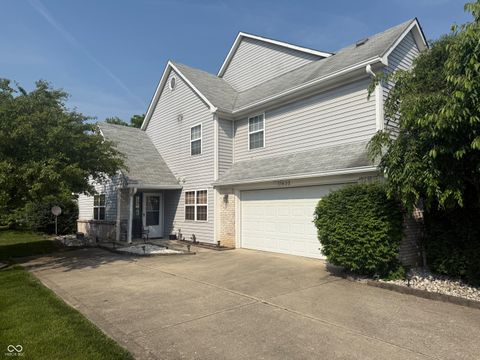
Active
$310,000
4
bds
|
2
ba
|
2,278
sqft
|
built
2021
12105 Fall Ct, Indianapolis, IN 46229
$-241
Cash flow
-4.1%
Cash-on-Cash Return
5.2%
Cap rate
0.6%
Rent to Value Ratio
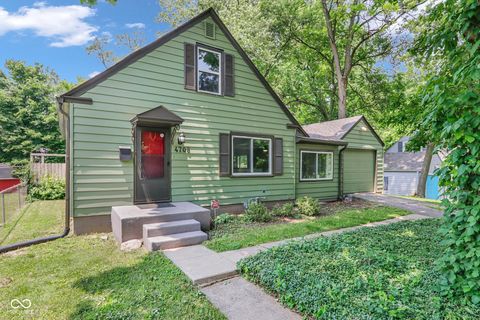
Active
$274,900
3
bds
|
2
ba
|
1,620
sqft
|
built
1947
4708 Haverford Ave, Indianapolis, IN 46205
$41
Cash flow
0.8%
Cash-on-Cash Return
6.3%
Cap rate
0.8%
Rent to Value Ratio
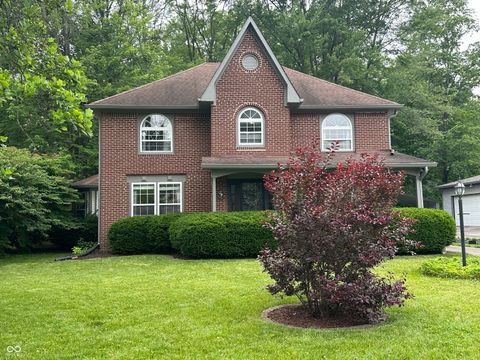
Active
$388,000
4
bds
|
3
ba
|
2,388
sqft
|
built
1995
5010 Melbourne Rd, Indianapolis, IN 46228
$-194
Cash flow
-2.6%
Cash-on-Cash Return
5.5%
Cap rate
0.7%
Rent to Value Ratio
Active
$230,000
2
bds
|
1
ba
|
680
sqft
|
built
1939
606 E County Line Rd, Indianapolis, IN 46227
$-506
Cash flow
-11.5%
Cash-on-Cash Return
3.6%
Cap rate
0.4%
Rent to Value Ratio

Active
$475,000
3
bds
|
2
ba
|
2,168
sqft
|
built
1900
552 Woodruff Place West Dr, Indianapolis, IN 46201
$-341
Cash flow
-3.7%
Cash-on-Cash Return
5.4%
Cap rate
0.7%
Rent to Value Ratio

Active
$369,500
3
bds
|
3
ba
|
1,440
sqft
|
built
2003
2434 N Pennsylvania St, Indianapolis, IN 46205
$-430
Cash flow
-6.1%
Cash-on-Cash Return
4.9%
Cap rate
0.6%
Rent to Value Ratio

Active
$349,900
3
bds
|
3
ba
|
1,876
sqft
|
built
1969
8209 Burn Ct, Indianapolis, IN 46217
$-451
Cash flow
-6.7%
Cash-on-Cash Return
4.7%
Cap rate
0.6%
Rent to Value Ratio

Active
$265,000
3
bds
|
3
ba
|
1,523
sqft
|
built
1995
8908 Sunningdale Blvd, Indianapolis, IN 46234
$-16
Cash flow
-0.3%
Cash-on-Cash Return
6.2%
Cap rate
0.8%
Rent to Value Ratio

Active
$359,999
4
bds
|
3
ba
|
2,961
sqft
|
built
2004
5522 Grassy Bank Dr, Indianapolis, IN 46237
$-385
Cash flow
-5.6%
Cash-on-Cash Return
5.0%
Cap rate
0.6%
Rent to Value Ratio

Active
$225,000
1
bds
|
2
ba
|
998
sqft
|
built
2006
1635 N College Ave, Indianapolis, IN 46202
$-233
Cash flow
-5.4%
Cash-on-Cash Return
5.0%
Cap rate
0.8%
Rent to Value Ratio

Active
$270,000
3
bds
|
3
ba
|
1,964
sqft
|
built
2001
3362 Pavetto Ln, Indianapolis, IN 46203
$-61
Cash flow
-1.2%
Cash-on-Cash Return
6.0%
Cap rate
0.7%
Rent to Value Ratio
Active
$350,000
0
bds
|
0
ba
|
0
sqft
|
built
1916
38 N Irvington Ave, Indianapolis, IN 46219
$-861
Cash flow
-12.8%
Cash-on-Cash Return
3.3%
Cap rate
0.4%
Rent to Value Ratio

Active
$419,000
5
bds
|
3
ba
|
3,046
sqft
|
built
2022
10118 Falls Canyon Ln, Indianapolis, IN 46229
$-284
Cash flow
-3.5%
Cash-on-Cash Return
5.5%
Cap rate
0.7%
Rent to Value Ratio

Active
$208,000
3
bds
|
2
ba
|
1,064
sqft
|
built
1982
5401 Padre Ln, Indianapolis, IN 46237
$87
Cash flow
2.2%
Cash-on-Cash Return
6.8%
Cap rate
0.8%
Rent to Value Ratio
Active
$2,499,000
5
bds
|
5
ba
|
7,705
sqft
|
built
1988
11715 Landings Dr, Indianapolis, IN 46256
$-8,813
Cash flow
-18.4%
Cash-on-Cash Return
2.0%
Cap rate
0.2%
Rent to Value Ratio

Active
$449,000
3
bds
|
3
ba
|
2,856
sqft
|
built
1979
7630 Blain Way, Indianapolis, IN 46254
$-427
Cash flow
-5.0%
Cash-on-Cash Return
5.1%
Cap rate
0.6%
Rent to Value Ratio