Fishers, IN Investment Properties for Sale
Browse homes for sale and investment properties in Fishers, IN. Refine your search by price, property type, or more.
Best cash flowing properties in Fishers, IN
Active
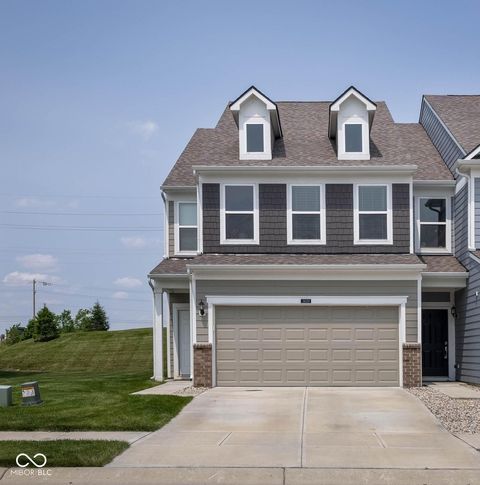
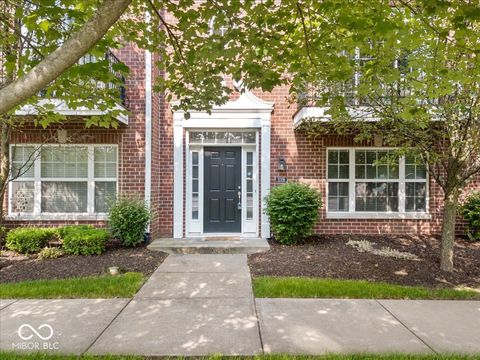
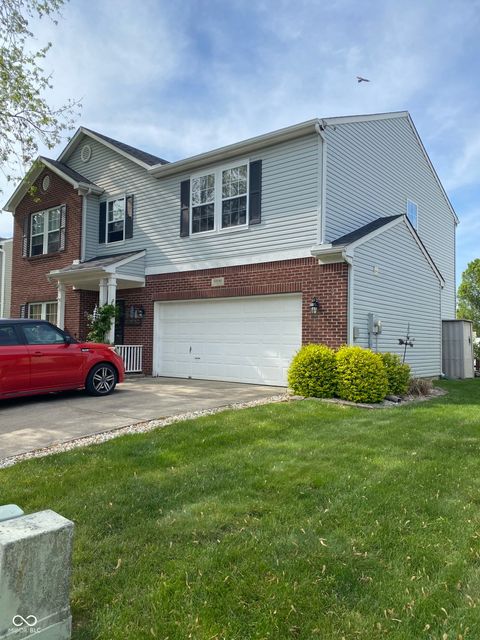
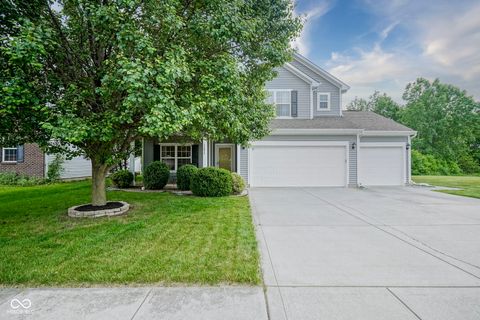
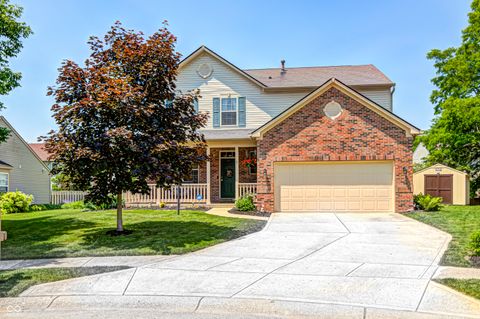
$369,900
3
bds
|
3
ba
|
2,096
sqft
|
built
2021
14110 Bay Willow Dr, Fishers, IN 46037
$-199
Cash flow
-2.8%
Cash-on-Cash Return
5.6%
Cap rate
0.8%
Rent to Value Ratio
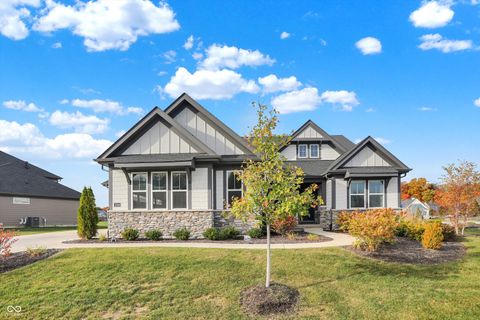
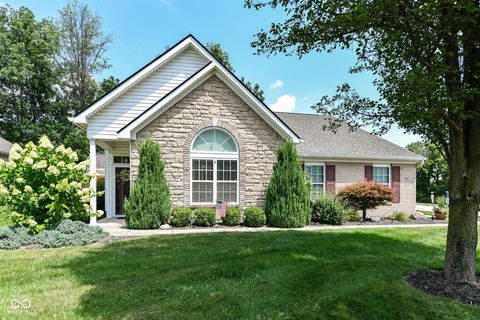
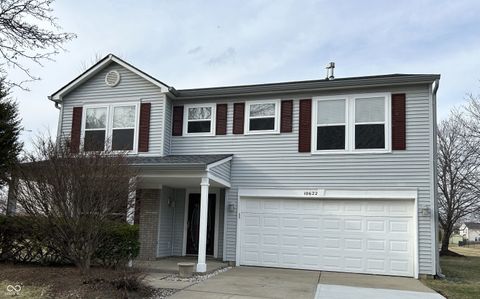
Active
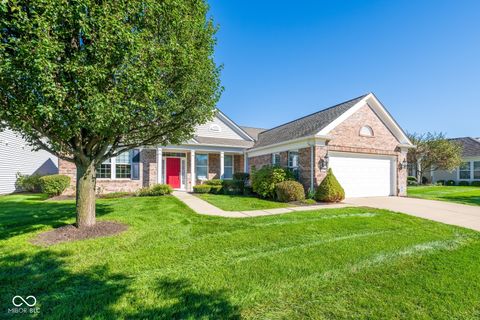
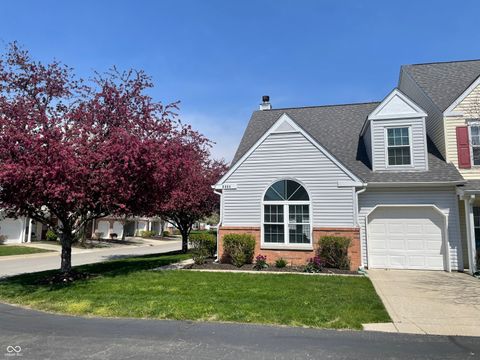
$687,500
3
bds
|
3
ba
|
2,898
sqft
|
built
2021
12594 Tidecrest Dr, Fishers, IN 46037
$-214
Cash flow
-1.6%
Cash-on-Cash Return
5.9%
Cap rate
0.7%
Rent to Value Ratio
120 out of 179 properties for sale in Fishers, IN
Limited Results Shown
Create a free account, or log in to reveal all property listings and enjoy the complete experience.
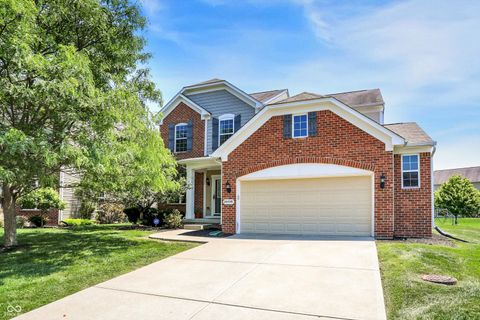
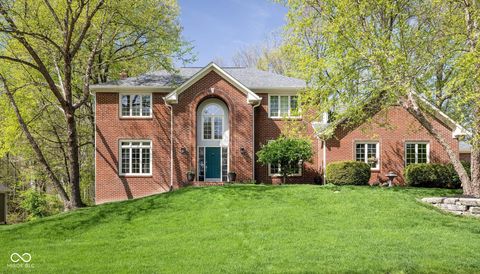
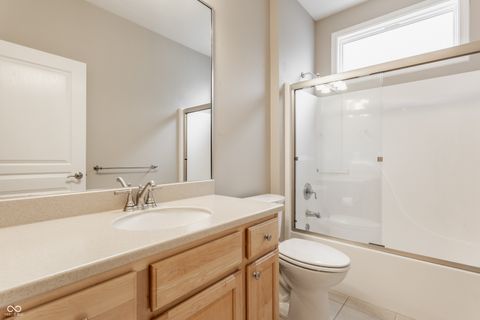
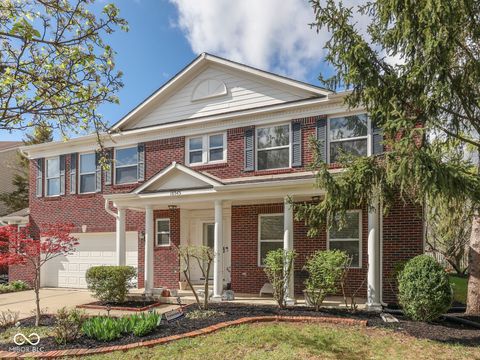
Active
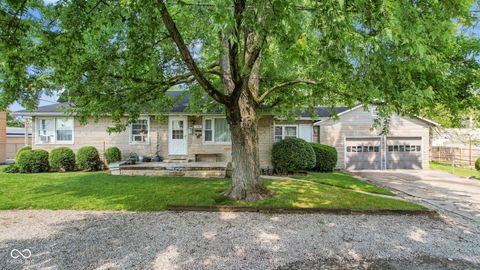
$510,000
5
bds
|
4
ba
|
3,468
sqft
|
built
2013
14499 Milton Rd, Fishers, IN 46037
$-582
Cash flow
-6.0%
Cash-on-Cash Return
4.9%
Cap rate
0.6%
Rent to Value Ratio
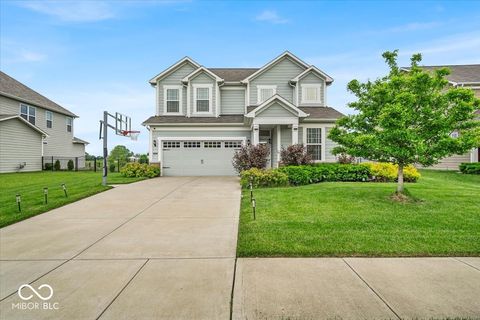
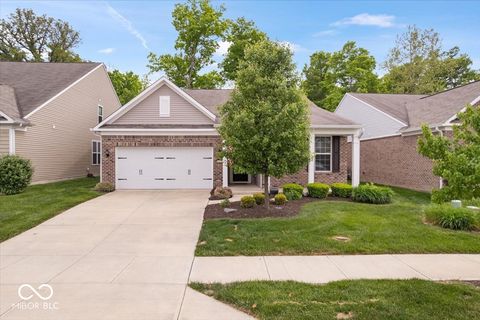
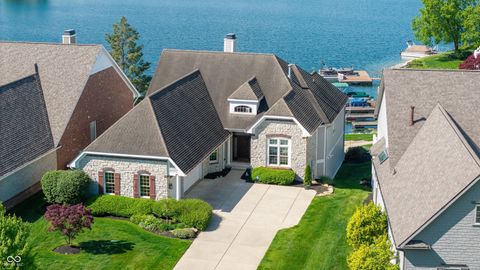
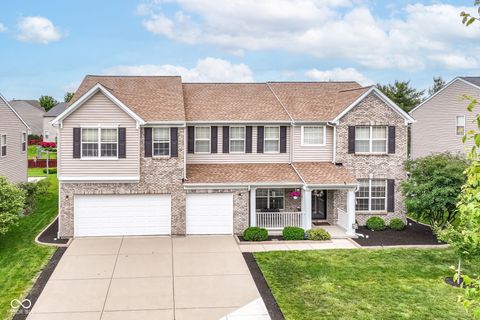
Active
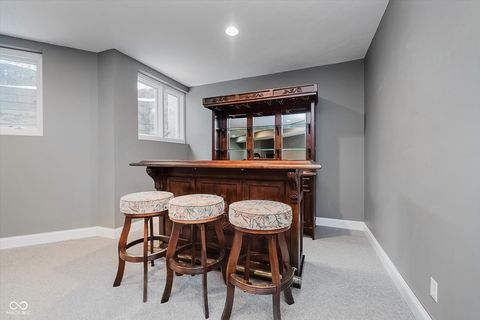
$439,900
4
bds
|
3
ba
|
2,379
sqft
|
built
2017
13495 Forest Glade Dr, Fishers, IN 46037
$-568
Cash flow
-6.7%
Cash-on-Cash Return
4.7%
Cap rate
0.6%
Rent to Value Ratio
Active
$375,000
3
bds
|
4
ba
|
2,466
sqft
|
built
2010
11509 Reagan Dr, Fishers, IN 46038
$-802
Cash flow
-11.2%
Cash-on-Cash Return
3.7%
Cap rate
0.6%
Rent to Value Ratio
Active
$365,000
2
bds
|
2
ba
|
1,728
sqft
|
built
2008
11692 Seven Oaks Dr, Fishers, IN 46038
$-471
Cash flow
-6.7%
Cash-on-Cash Return
4.7%
Cap rate
0.6%
Rent to Value Ratio
Active
$799,900
5
bds
|
4
ba
|
4,305
sqft
|
built
1991
9838 Gulfstream Ct, Fishers, IN 46037
$-1,736
Cash flow
-11.3%
Cash-on-Cash Return
3.7%
Cap rate
0.5%
Rent to Value Ratio
Active
$439,500
2
bds
|
2
ba
|
2,096
sqft
|
built
2016
16573 Cava Dr, Fishers, IN 46037
$-616
Cash flow
-7.3%
Cash-on-Cash Return
4.6%
Cap rate
0.6%
Rent to Value Ratio

Active
$775,000
6
bds
|
4
ba
|
4,716
sqft
|
built
2020
12811 Corydon Dr, Fishers, IN 46037
$-937
Cash flow
-6.3%
Cash-on-Cash Return
4.8%
Cap rate
0.6%
Rent to Value Ratio

Active
$465,000
2
bds
|
2
ba
|
1,980
sqft
|
built
2021
14878 Anees Ln, Fishers, IN 46040
$-727
Cash flow
-8.2%
Cash-on-Cash Return
4.4%
Cap rate
0.6%
Rent to Value Ratio

Active
$599,999
4
bds
|
3
ba
|
4,179
sqft
|
built
2015
10027 Landis Blvd, Fishers, IN 46040
$-223
Cash flow
-1.9%
Cash-on-Cash Return
5.8%
Cap rate
0.7%
Rent to Value Ratio
Active
$670,000
4
bds
|
5
ba
|
4,432
sqft
|
built
2019
12988 Fernie Cir, Fishers, IN 46037
$-1,081
Cash flow
-8.4%
Cash-on-Cash Return
4.3%
Cap rate
0.5%
Rent to Value Ratio

Active
$439,900
3
bds
|
2
ba
|
2,391
sqft
|
built
2018
15142 Blue Ribbon Blvd, Fishers, IN 46040
$-406
Cash flow
-4.8%
Cash-on-Cash Return
5.2%
Cap rate
0.6%
Rent to Value Ratio
Active
$599,000
3
bds
|
2
ba
|
2,703
sqft
|
built
2014
9559 Summer Hollow Dr, Fishers, IN 46037
$-847
Cash flow
-7.4%
Cash-on-Cash Return
4.6%
Cap rate
0.6%
Rent to Value Ratio
Active
$2,850,000
6
bds
|
7
ba
|
9,525
sqft
|
built
1999
395 Breakwater Dr, Fishers, IN 46037
$-10,161
Cash flow
-18.6%
Cash-on-Cash Return
2.0%
Cap rate
0.3%
Rent to Value Ratio
Active
$345,000
4
bds
|
3
ba
|
1,880
sqft
|
built
2008
13124 S Elster Way, Fishers, IN 46037
$-328
Cash flow
-5.0%
Cash-on-Cash Return
5.1%
Cap rate
0.6%
Rent to Value Ratio
Active
$515,000
4
bds
|
4
ba
|
3,554
sqft
|
built
2013
12964 Walbeck Dr, Fishers, IN 46037
$-328
Cash flow
-3.3%
Cash-on-Cash Return
5.5%
Cap rate
0.7%
Rent to Value Ratio
Active
$699,900
4
bds
|
4
ba
|
4,273
sqft
|
built
2019
14878 Horse Branch Way, Fishers, IN 46040
$-689
Cash flow
-5.1%
Cash-on-Cash Return
5.1%
Cap rate
0.6%
Rent to Value Ratio

Active
$995,000
5
bds
|
5
ba
|
6,451
sqft
|
built
1992
12536 Lowery Way, Fishers, IN 46037
$-2,209
Cash flow
-11.6%
Cash-on-Cash Return
3.6%
Cap rate
0.4%
Rent to Value Ratio

Active
$410,000
3
bds
|
3
ba
|
2,392
sqft
|
built
2020
14474 Treasure Creek Ln, Fishers, IN 46038
$-566
Cash flow
-7.2%
Cash-on-Cash Return
4.6%
Cap rate
0.6%
Rent to Value Ratio
Active
$369,900
3
bds
|
3
ba
|
2,096
sqft
|
built
2021
14110 Bay Willow Dr, Fishers, IN 46037
$-199
Cash flow
-2.8%
Cash-on-Cash Return
5.6%
Cap rate
0.8%
Rent to Value Ratio
Active
$369,900
3
bds
|
2
ba
|
1,894
sqft
|
built
1997
9635 Shasta Dr, Fishers, IN 46038
$-455
Cash flow
-6.4%
Cash-on-Cash Return
4.8%
Cap rate
0.6%
Rent to Value Ratio
Active
$399,900
3
bds
|
3
ba
|
2,436
sqft
|
built
2003
12993 E 131st St, Fishers, IN 46037
$-390
Cash flow
-5.1%
Cash-on-Cash Return
5.1%
Cap rate
0.6%
Rent to Value Ratio
Active
$359,900
4
bds
|
3
ba
|
2,354
sqft
|
built
2000
10190 Holly Berry Cir, Fishers, IN 46038
$-392
Cash flow
-5.7%
Cash-on-Cash Return
5.0%
Cap rate
0.6%
Rent to Value Ratio
Active
$499,000
2
bds
|
2
ba
|
2,588
sqft
|
built
2007
16156 Oliver St, Fishers, IN 46037
$-875
Cash flow
-9.1%
Cash-on-Cash Return
4.2%
Cap rate
0.6%
Rent to Value Ratio

Active
$524,999
3
bds
|
3
ba
|
3,063
sqft
|
built
2013
12610 Broadmoor Ct N, Fishers, IN 46037
$-1,211
Cash flow
-12.0%
Cash-on-Cash Return
3.5%
Cap rate
0.5%
Rent to Value Ratio
Active
$568,900
3
bds
|
3
ba
|
4,384
sqft
|
built
2003
13091 Duval Dr, Fishers, IN 46037
$-701
Cash flow
-6.4%
Cash-on-Cash Return
4.8%
Cap rate
0.6%
Rent to Value Ratio
Active
$874,900
3
bds
|
4
ba
|
4,980
sqft
|
built
2000
11065 Spice Ln, Fishers, IN 46037
$-1,546
Cash flow
-9.2%
Cash-on-Cash Return
4.1%
Cap rate
0.6%
Rent to Value Ratio
Active
$449,900
5
bds
|
3
ba
|
3,220
sqft
|
built
2008
13817 Black Canyon Ct, Fishers, IN 46038
$-444
Cash flow
-5.1%
Cash-on-Cash Return
5.1%
Cap rate
0.6%
Rent to Value Ratio
Active
$426,900
4
bds
|
3
ba
|
2,845
sqft
|
built
2001
10622 Howe Rd, Fishers, IN 46038
$-479
Cash flow
-5.9%
Cash-on-Cash Return
4.9%
Cap rate
0.6%
Rent to Value Ratio

Active
$2,390,000
6
bds
|
8
ba
|
8,254
sqft
|
built
2002
10821 Club Point Dr, Fishers, IN 46037
$-8,381
Cash flow
-18.3%
Cash-on-Cash Return
2.1%
Cap rate
0.3%
Rent to Value Ratio
Active
$539,000
5
bds
|
4
ba
|
4,299
sqft
|
built
2003
10343 Waveland Cir, Fishers, IN 46038
$-1,133
Cash flow
-11.0%
Cash-on-Cash Return
3.7%
Cap rate
0.5%
Rent to Value Ratio
Active
$549,999
5
bds
|
5
ba
|
4,312
sqft
|
built
2005
12994 Dekoven Dr, Fishers, IN 46037
$-786
Cash flow
-7.5%
Cash-on-Cash Return
4.5%
Cap rate
0.6%
Rent to Value Ratio
Active
$460,000
4
bds
|
3
ba
|
3,294
sqft
|
built
2000
13068 Lamarque Pl, Fishers, IN 46038
$-791
Cash flow
-9.0%
Cash-on-Cash Return
4.2%
Cap rate
0.5%
Rent to Value Ratio

Active
$639,900
4
bds
|
5
ba
|
4,857
sqft
|
built
2006
10267 Ranford Blvd, Fishers, IN 46040
$-709
Cash flow
-5.8%
Cash-on-Cash Return
4.9%
Cap rate
0.6%
Rent to Value Ratio

Active
$875,000
5
bds
|
5
ba
|
5,488
sqft
|
built
1996
12954 Water Ridge Dr, Fishers, IN 46055
$-1,160
Cash flow
-6.9%
Cash-on-Cash Return
4.7%
Cap rate
0.6%
Rent to Value Ratio
Active
$305,000
3
bds
|
2
ba
|
1,592
sqft
|
built
1999
9664 Legare St, Fishers, IN 46038
$-450
Cash flow
-7.7%
Cash-on-Cash Return
4.5%
Cap rate
0.7%
Rent to Value Ratio
Active
$750,000
3
bds
|
2
ba
|
1,331
sqft
|
built
1950
11445 N School St, Fishers, IN 46038
$-1,777
Cash flow
-12.4%
Cash-on-Cash Return
3.4%
Cap rate
0.4%
Rent to Value Ratio
Active
$874,000
4
bds
|
3
ba
|
5,262
sqft
|
built
1995
10295 Summerlin Way, Fishers, IN 46037
$-1,177
Cash flow
-7.0%
Cash-on-Cash Return
4.6%
Cap rate
0.6%
Rent to Value Ratio
Active
$749,900
4
bds
|
3
ba
|
3,782
sqft
|
built
1991
6862 Riverside Way, Fishers, IN 46038
$-1,121
Cash flow
-7.8%
Cash-on-Cash Return
4.5%
Cap rate
0.5%
Rent to Value Ratio

Active
$955,000
5
bds
|
5
ba
|
6,404
sqft
|
built
2010
10138 Backstretch Row, Fishers, IN 46040
$-1,586
Cash flow
-8.7%
Cash-on-Cash Return
4.3%
Cap rate
0.5%
Rent to Value Ratio
Active
$687,500
3
bds
|
3
ba
|
2,898
sqft
|
built
2021
12594 Tidecrest Dr, Fishers, IN 46037
$-214
Cash flow
-1.6%
Cash-on-Cash Return
5.9%
Cap rate
0.7%
Rent to Value Ratio