Fishers, IN Investment Properties for Sale
Browse homes for sale and investment properties in Fishers, IN. Refine your search by price, property type, or more.
Best cash flowing properties in Fishers, IN
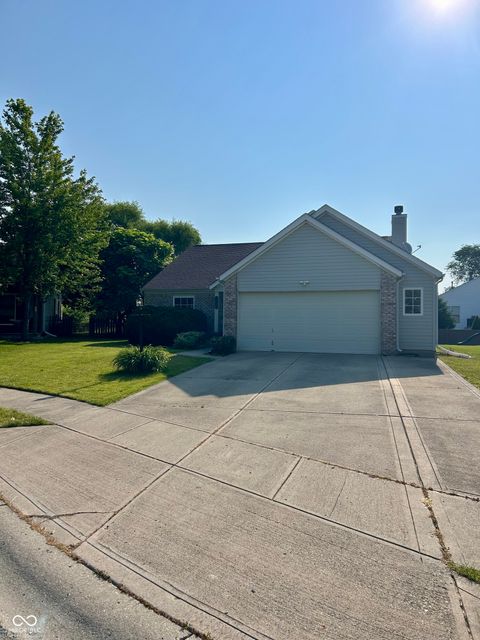
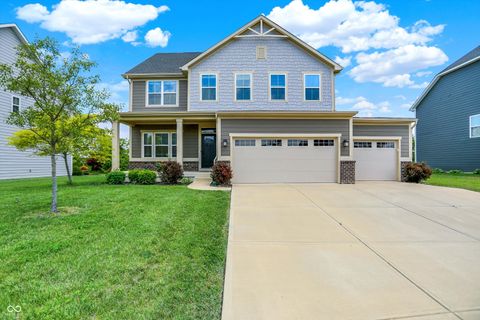
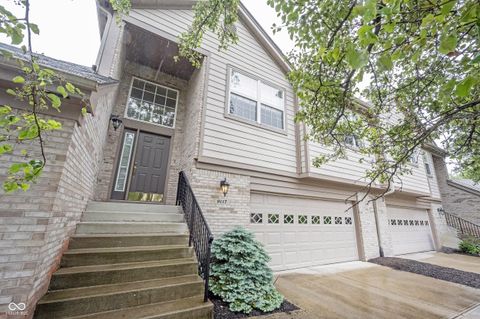
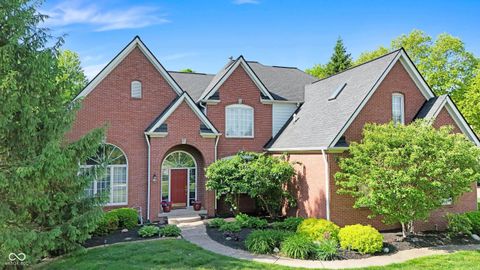
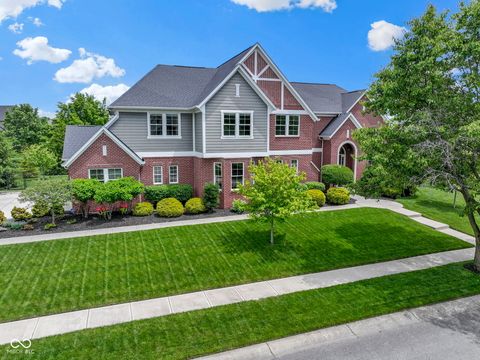
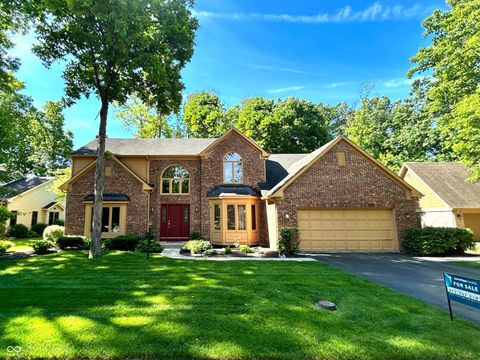
Active
$294,900
3
bds
|
2
ba
|
1,406
sqft
|
built
2003
12307 Chiseled Stone Dr, Fishers, IN 46037
$-186
Cash flow
-3.3%
Cash-on-Cash Return
5.5%
Cap rate
0.7%
Rent to Value Ratio
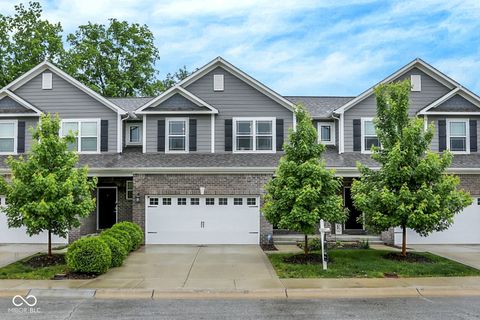
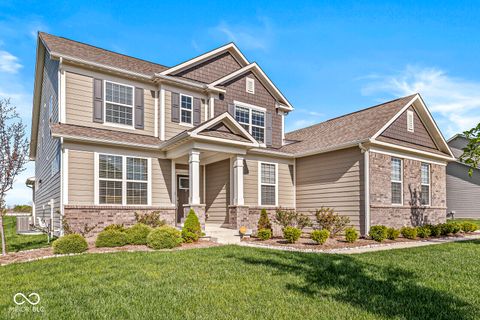
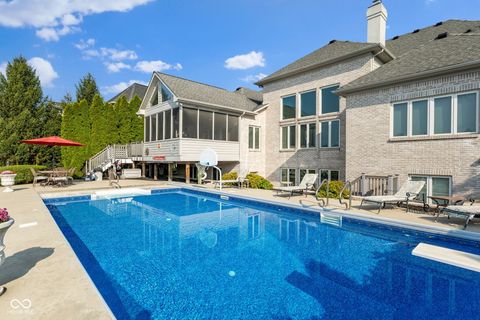
Active
$379,900
3
bds
|
4
ba
|
2,728
sqft
|
built
2020
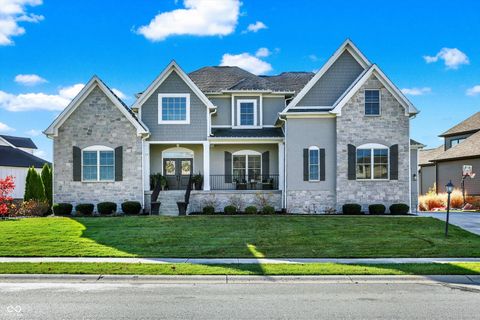
8266 Glacier Ridge Dr, Fishers, IN 46038
$-201
Cash flow
-2.8%
Cash-on-Cash Return
5.6%
Cap rate
0.7%
Rent to Value Ratio
120 out of 179 properties for sale in Fishers, IN
Limited Results Shown
Create a free account, or log in to reveal all property listings and enjoy the complete experience.
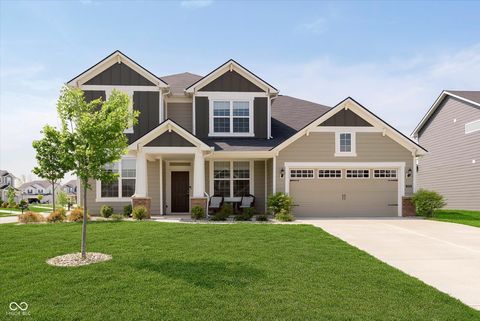
Active
$349,000
3
bds
|
3
ba
|
2,490
sqft
|
built
2006
13094 Overview Dr, Fishers, IN 46037
$-298
Cash flow
-4.5%
Cash-on-Cash Return
5.2%
Cap rate
0.7%
Rent to Value Ratio
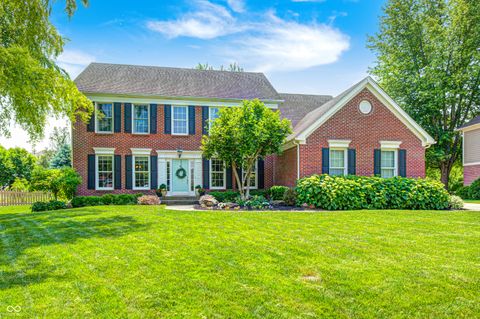
Active
$569,900
5
bds
|
4
ba
|
4,033
sqft
|
built
2014
13485 Mancroft Dr, Fishers, IN 46037
$-832
Cash flow
-7.6%
Cash-on-Cash Return
4.5%
Cap rate
0.6%
Rent to Value Ratio
Active
$2,799,000
5
bds
|
7
ba
|
9,884
sqft
|
built
1992
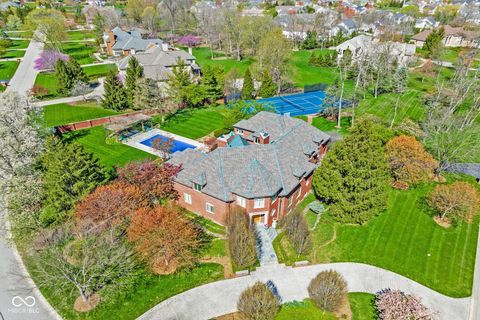
290 Breakwater Dr, Fishers, IN 46037
$-10,516
Cash flow
-19.6%
Cash-on-Cash Return
1.8%
Cap rate
0.2%
Rent to Value Ratio
Active
$2,315,000
6
bds
|
6
ba
|
6,986
sqft
|
built
2018
13613 Lake Ridge Ln, Fishers, IN 46055
$-7,875
Cash flow
-17.7%
Cash-on-Cash Return
2.2%
Cap rate
0.3%
Rent to Value Ratio
Active
$445,000
4
bds
|
3
ba
|
3,610
sqft
|
built
2002
11866 Weathered Edge Dr, Fishers, IN 46037
$-416
Cash flow
-4.9%
Cash-on-Cash Return
5.1%
Cap rate
0.6%
Rent to Value Ratio
Active
$379,900
3
bds
|
4
ba
|
2,728
sqft
|
built
2020
8266 Glacier Ridge Dr, Fishers, IN 46038
$-201
Cash flow
-2.8%
Cash-on-Cash Return
5.6%
Cap rate
0.7%
Rent to Value Ratio
Active
$379,900
4
bds
|
3
ba
|
2,857
sqft
|
built
1999
10216 Hatherley Way, Fishers, IN 46037
$-294
Cash flow
-4.0%
Cash-on-Cash Return
5.3%
Cap rate
0.7%
Rent to Value Ratio
Active
$1,075,000
3
bds
|
5
ba
|
3,726
sqft
|
built
2018
8740 Morgan Dr, Fishers, IN 46038
$-2,135
Cash flow
-10.4%
Cash-on-Cash Return
3.9%
Cap rate
0.5%
Rent to Value Ratio
Active
$629,900
4
bds
|
4
ba
|
3,813
sqft
|
built
1999
9703 Fortune Dr, Fishers, IN 46037
$-1,136
Cash flow
-9.4%
Cash-on-Cash Return
4.1%
Cap rate
0.5%
Rent to Value Ratio

Active
$674,900
4
bds
|
3
ba
|
4,416
sqft
|
built
2021
12535 Tidecrest Dr, Fishers, IN 46037
$-836
Cash flow
-6.5%
Cash-on-Cash Return
4.8%
Cap rate
0.6%
Rent to Value Ratio
Active
$400,000
4
bds
|
3
ba
|
2,508
sqft
|
built
2001
10443 Ringtail Pl, Fishers, IN 46038
$-203
Cash flow
-2.6%
Cash-on-Cash Return
5.7%
Cap rate
0.7%
Rent to Value Ratio
Active
$349,900
3
bds
|
3
ba
|
1,896
sqft
|
built
2020
14350 Ludwell Ct, Fishers, IN 46037
$-333
Cash flow
-5.0%
Cash-on-Cash Return
5.1%
Cap rate
0.7%
Rent to Value Ratio
Active
$575,000
4
bds
|
5
ba
|
3,882
sqft
|
built
2018
13567 Moorcroft Dr, Fishers, IN 46037
$-646
Cash flow
-5.9%
Cash-on-Cash Return
4.9%
Cap rate
0.6%
Rent to Value Ratio

Active
$1,025,000
4
bds
|
5
ba
|
6,900
sqft
|
built
2004
14565 Geist Ridge Dr, Fishers, IN 46040
$-446
Cash flow
-2.3%
Cash-on-Cash Return
5.7%
Cap rate
0.7%
Rent to Value Ratio
Active
$345,000
3
bds
|
2
ba
|
1,566
sqft
|
built
1991
11014 Lake Run Dr, Fishers, IN 46038
$-438
Cash flow
-6.6%
Cash-on-Cash Return
4.7%
Cap rate
0.6%
Rent to Value Ratio

Active
$459,000
5
bds
|
3
ba
|
3,070
sqft
|
built
2021
9851 Pica Dr, Fishers, IN 46040
$-257
Cash flow
-2.9%
Cash-on-Cash Return
5.6%
Cap rate
0.7%
Rent to Value Ratio
Active
$449,900
4
bds
|
4
ba
|
2,732
sqft
|
built
2005
12878 Ari Ln, Fishers, IN 46037
$-465
Cash flow
-5.4%
Cash-on-Cash Return
5.0%
Cap rate
0.6%
Rent to Value Ratio

Active
$895,000
3
bds
|
4
ba
|
4,204
sqft
|
built
2017
13797 E Southshore Dr, Fishers, IN 46037
$-2,398
Cash flow
-14.0%
Cash-on-Cash Return
3.1%
Cap rate
0.4%
Rent to Value Ratio

Active
$729,900
4
bds
|
4
ba
|
4,587
sqft
|
built
2004
10611 Proposal Pointe Way, Fishers, IN 46040
$-823
Cash flow
-5.9%
Cash-on-Cash Return
4.9%
Cap rate
0.6%
Rent to Value Ratio
Active
$294,900
3
bds
|
2
ba
|
1,406
sqft
|
built
2003
12307 Chiseled Stone Dr, Fishers, IN 46037
$-186
Cash flow
-3.3%
Cash-on-Cash Return
5.5%
Cap rate
0.7%
Rent to Value Ratio
Active
$440,000
5
bds
|
4
ba
|
3,503
sqft
|
built
2003
12679 Chargers Ct, Fishers, IN 46037
$-333
Cash flow
-3.9%
Cash-on-Cash Return
5.4%
Cap rate
0.7%
Rent to Value Ratio
Active
$280,000
2
bds
|
2
ba
|
1,982
sqft
|
built
2003
9117 Thoreau Ct, Fishers, IN 46037
$-227
Cash flow
-4.2%
Cash-on-Cash Return
5.3%
Cap rate
0.8%
Rent to Value Ratio
Active
$640,000
4
bds
|
4
ba
|
3,431
sqft
|
built
2020
12894 Corydon Dr, Fishers, IN 46037
$-922
Cash flow
-7.5%
Cash-on-Cash Return
4.5%
Cap rate
0.6%
Rent to Value Ratio
Active
$470,000
4
bds
|
3
ba
|
2,949
sqft
|
built
2021
13204 Caterwood Cir, Fishers, IN 46037
$-518
Cash flow
-5.8%
Cash-on-Cash Return
4.9%
Cap rate
0.6%
Rent to Value Ratio
Active
$600,000
4
bds
|
3
ba
|
4,160
sqft
|
built
1999
10717 Windermere Blvd, Fishers, IN 46037
$-694
Cash flow
-6.0%
Cash-on-Cash Return
4.9%
Cap rate
0.6%
Rent to Value Ratio
Active
$795,000
6
bds
|
5
ba
|
4,843
sqft
|
built
1999
10390 Tremont Dr, Fishers, IN 46037
$-1,390
Cash flow
-9.1%
Cash-on-Cash Return
4.2%
Cap rate
0.5%
Rent to Value Ratio
Active
$1,850,000
5
bds
|
6
ba
|
7,700
sqft
|
built
2001
13499 Marjac Way, Fishers, IN 46055
$-6,956
Cash flow
-19.6%
Cash-on-Cash Return
1.8%
Cap rate
0.2%
Rent to Value Ratio
Active
$549,000
6
bds
|
4
ba
|
4,467
sqft
|
built
2010
14402 Wolverton Way, Fishers, IN 46037
$-573
Cash flow
-5.4%
Cash-on-Cash Return
5.0%
Cap rate
0.6%
Rent to Value Ratio

Active
$1,979,900
7
bds
|
7
ba
|
11,618
sqft
|
built
1999
12010 Landover Ln, Fishers, IN 46037
$-7,760
Cash flow
-20.4%
Cash-on-Cash Return
1.6%
Cap rate
0.2%
Rent to Value Ratio

Active
$375,000
3
bds
|
3
ba
|
1,896
sqft
|
built
2021
13460 Dewpoint Ln, Fishers, IN 46037
$-669
Cash flow
-9.3%
Cash-on-Cash Return
4.1%
Cap rate
0.6%
Rent to Value Ratio
Active
$385,000
4
bds
|
3
ba
|
2,350
sqft
|
built
2006
11070 Long Lake Ln, Fishers, IN 46037
$-317
Cash flow
-4.3%
Cash-on-Cash Return
5.3%
Cap rate
0.6%
Rent to Value Ratio

Active
$455,000
5
bds
|
3
ba
|
2,946
sqft
|
built
2021
9717 Chuckwalla Pl, Fishers, IN 46040
$-488
Cash flow
-5.6%
Cash-on-Cash Return
5.0%
Cap rate
0.6%
Rent to Value Ratio
Active
$1,399,900
5
bds
|
6
ba
|
7,121
sqft
|
built
2015
11984 Talnuck Cir, Fishers, IN 46037
$-3,950
Cash flow
-14.7%
Cash-on-Cash Return
2.9%
Cap rate
0.4%
Rent to Value Ratio
Active
$444,900
4
bds
|
3
ba
|
2,848
sqft
|
built
2000
11458 Falling Water Way, Fishers, IN 46037
$-435
Cash flow
-5.1%
Cash-on-Cash Return
5.1%
Cap rate
0.6%
Rent to Value Ratio
Active
$418,500
3
bds
|
4
ba
|
2,592
sqft
|
built
2021
11436 Mossy Ct, Fishers, IN 46037
$-326
Cash flow
-4.1%
Cash-on-Cash Return
5.3%
Cap rate
0.7%
Rent to Value Ratio
Active
$379,900
4
bds
|
3
ba
|
2,214
sqft
|
built
2000
10150 Beresford Ct, Fishers, IN 46038
$-305
Cash flow
-4.2%
Cash-on-Cash Return
5.3%
Cap rate
0.7%
Rent to Value Ratio
Active
$549,900
4
bds
|
3
ba
|
3,145
sqft
|
built
1991
7621 Forest Dr, Fishers, IN 46038
$-895
Cash flow
-8.5%
Cash-on-Cash Return
4.3%
Cap rate
0.5%
Rent to Value Ratio
Active
$454,900
4
bds
|
3
ba
|
3,296
sqft
|
built
2001
11850 Stepping Stone Dr, Fishers, IN 46037
$-469
Cash flow
-5.4%
Cash-on-Cash Return
5.0%
Cap rate
0.6%
Rent to Value Ratio

Active
$999,999
5
bds
|
6
ba
|
5,357
sqft
|
built
2016
10473 Ranford Blvd, Fishers, IN 46040
$-2,216
Cash flow
-11.6%
Cash-on-Cash Return
3.6%
Cap rate
0.5%
Rent to Value Ratio

Active
$450,000
4
bds
|
3
ba
|
2,844
sqft
|
built
2018
9860 Gallop Ln, Fishers, IN 46040
$-496
Cash flow
-5.8%
Cash-on-Cash Return
4.9%
Cap rate
0.6%
Rent to Value Ratio