Fishers, IN Investment Properties for Sale
Browse homes for sale and investment properties in Fishers, IN. Refine your search by price, property type, or more.
Best cash flowing properties in Fishers, IN
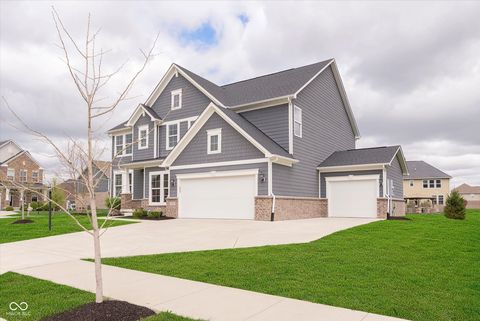
Active
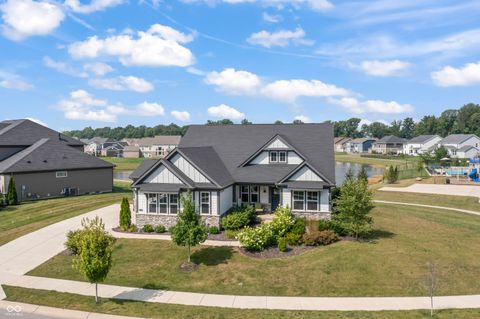
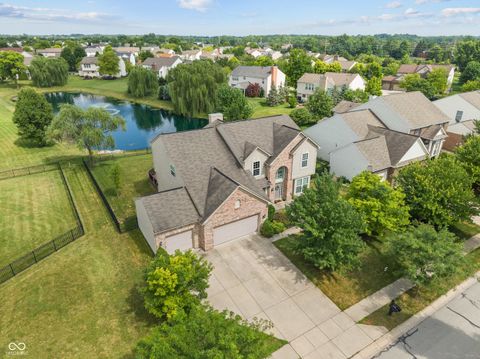
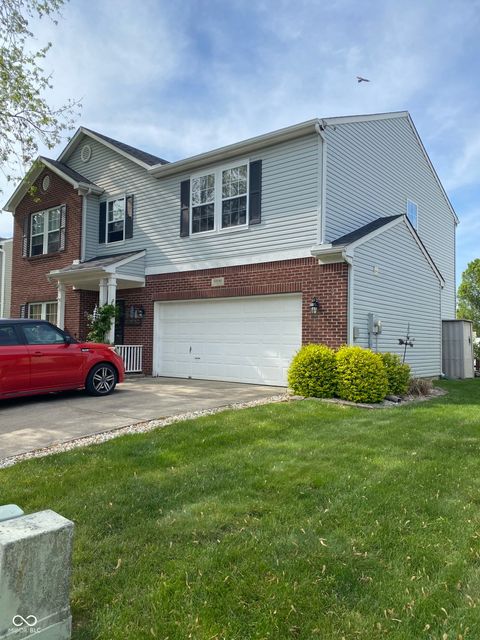
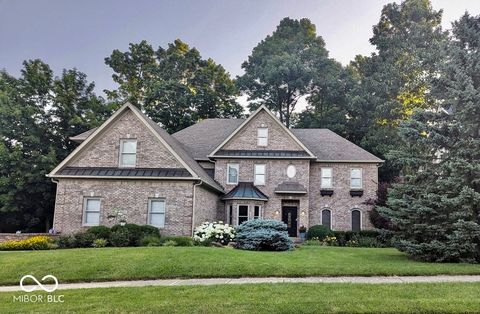
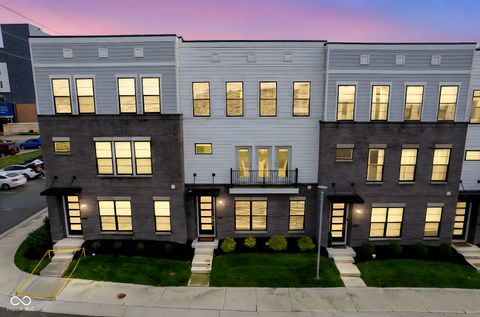
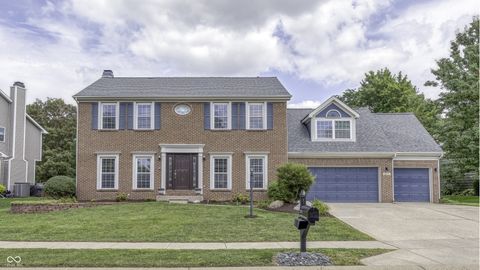
$668,500
4
bds
|
3
ba
|
2,898
sqft
|
built
2021
12594 Tidecrest Dr, Fishers, IN 46037
$-49
Cash flow
-0.4%
Cash-on-Cash Return
6.1%
Cap rate
0.7%
Rent to Value Ratio
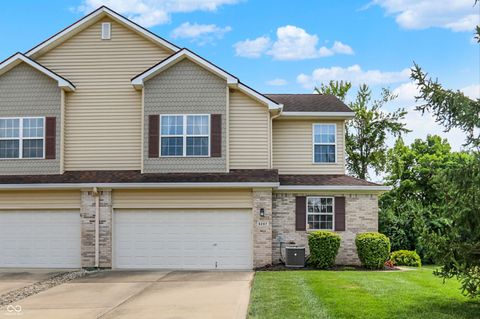
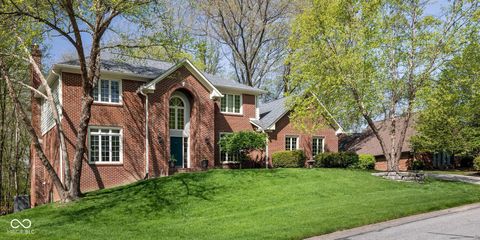
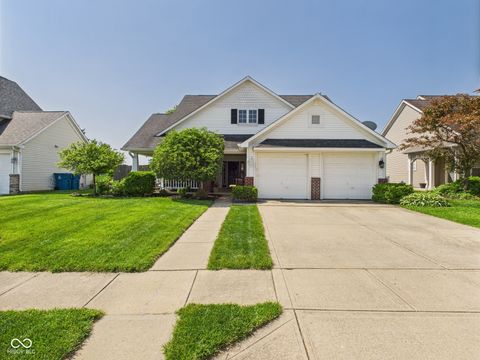
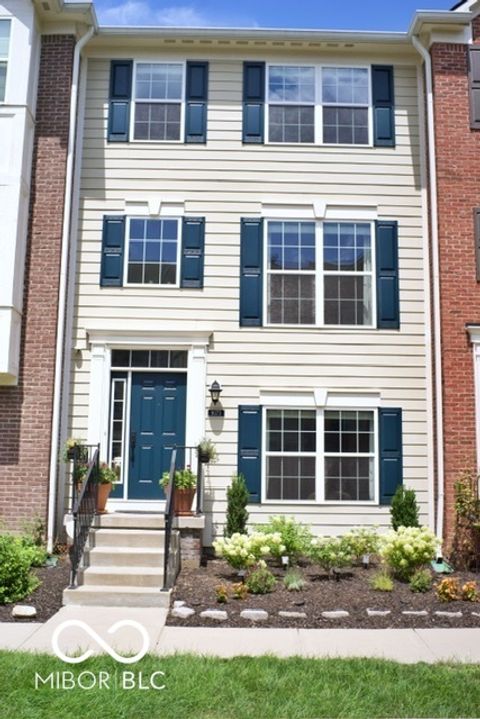
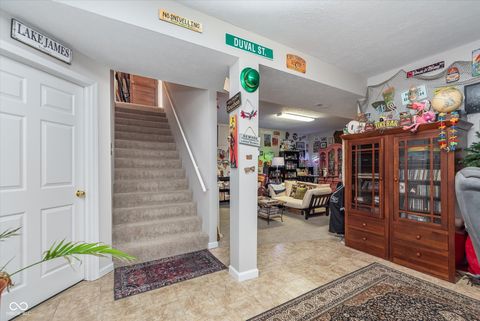
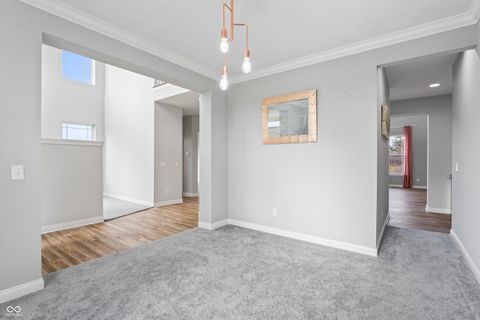
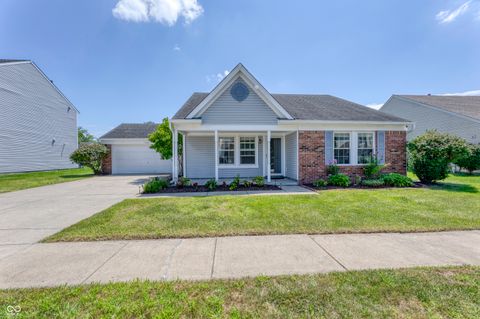
Active
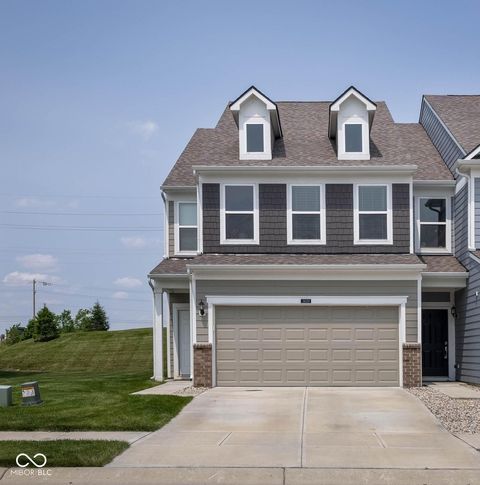
$349,900
3
bds
|
3
ba
|
2,096
sqft
|
built
2021
14110 Bay Willow Dr, Fishers, IN 46037
$-60
Cash flow
-0.9%
Cash-on-Cash Return
5.9%
Cap rate
0.8%
Rent to Value Ratio
161 out of 176 properties for sale in Fishers, IN
Limited Results Shown
Create a free account, or log in to reveal all property listings and enjoy the complete experience.
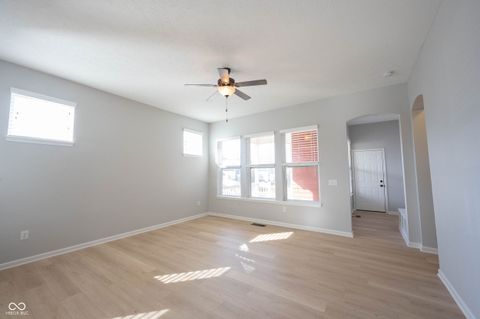
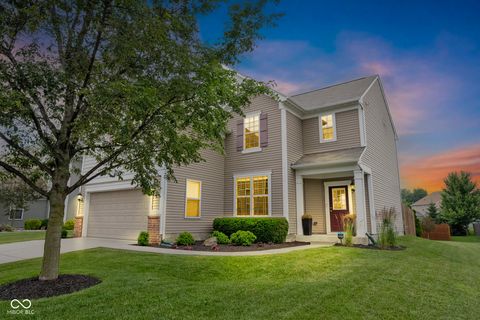
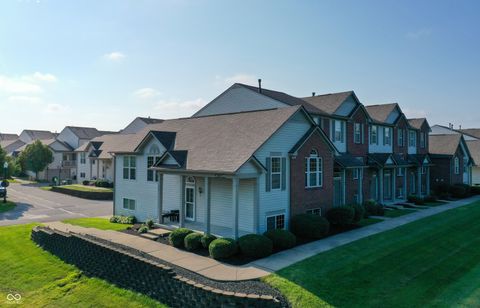
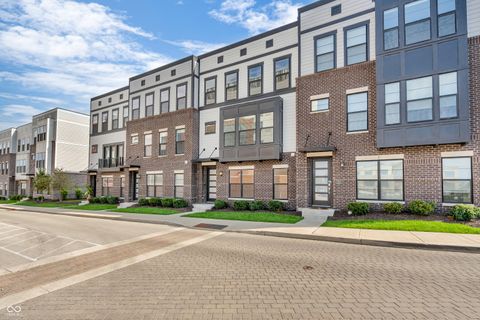
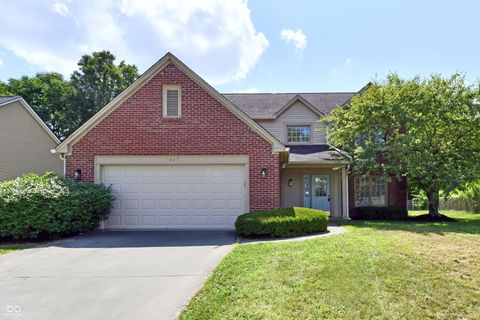
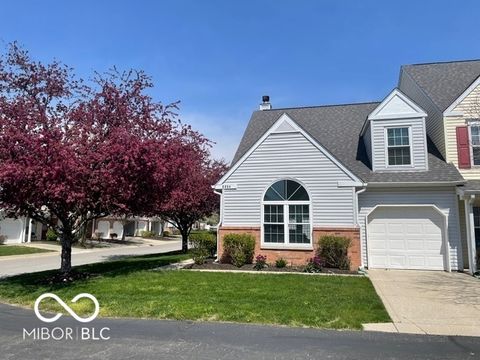
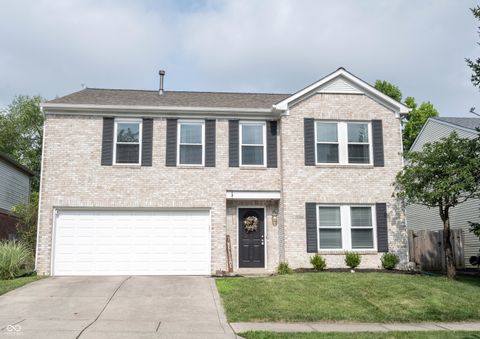
Active
$594,900
6
bds
|
5
ba
|
4,290
sqft
|
built
2005
11581 Ludlow Dr, Fishers, IN 46037
$-674
Cash flow
-5.9%
Cash-on-Cash Return
4.8%
Cap rate
0.6%
Rent to Value Ratio

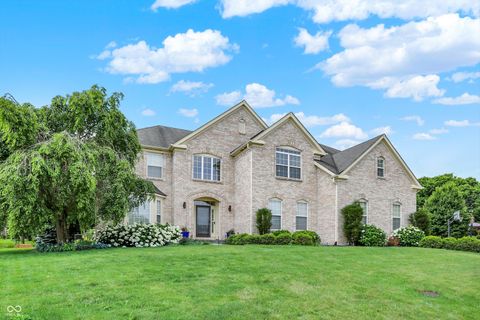
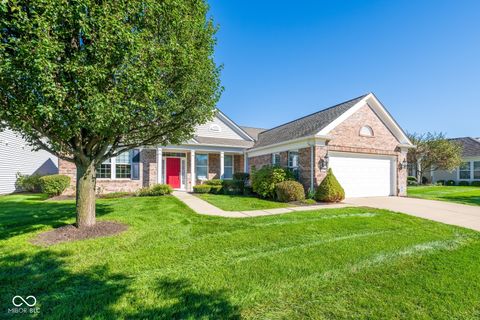
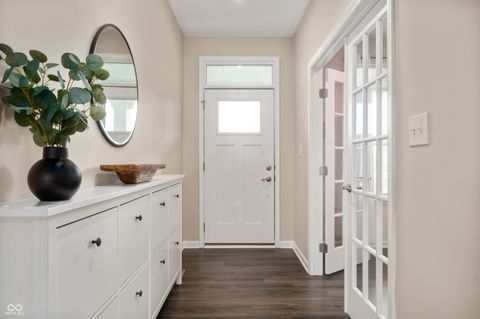
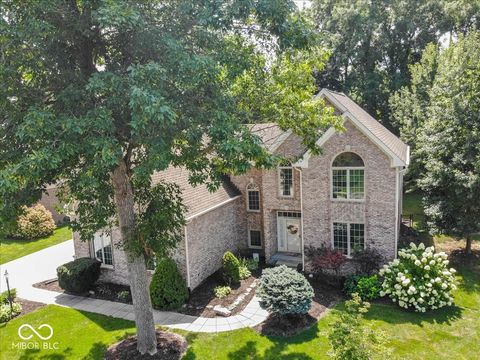
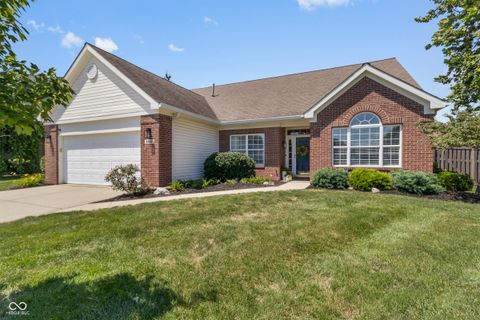
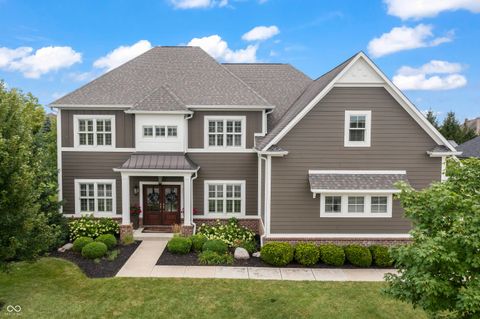
Active
$449,900
5
bds
|
3
ba
|
2,736
sqft
|
built
1995
8400 Harrison Pkwy, Fishers, IN 46038
$-596
Cash flow
-6.9%
Cash-on-Cash Return
4.6%
Cap rate
0.6%
Rent to Value Ratio
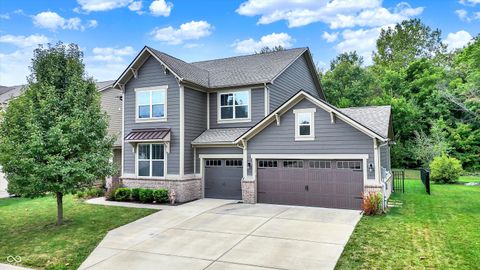
Active
$515,000
4
bds
|
4
ba
|
3,655
sqft
|
built
1997
8363 Bighorn Ct, Fishers, IN 46038
$-658
Cash flow
-6.7%
Cash-on-Cash Return
4.6%
Cap rate
0.6%
Rent to Value Ratio
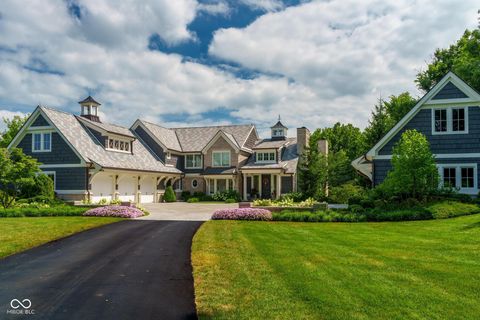
Active
$5,900,000
4
bds
|
6
ba
|
10,614
sqft
|
built
1980
13665 E 114th St, Fishers, IN 46037
$-26,126
Cash flow
-23.1%
Cash-on-Cash Return
0.8%
Cap rate
0.1%
Rent to Value Ratio
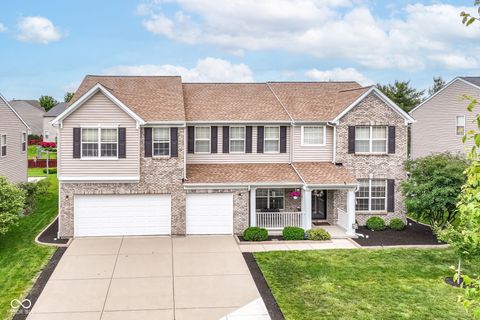
Active
$300,000
3
bds
|
3
ba
|
2,150
sqft
|
built
2004
6247 Eller Creek Way, Fishers, IN 46038
$-306
Cash flow
-5.3%
Cash-on-Cash Return
4.9%
Cap rate
0.7%
Rent to Value Ratio
Active
$339,000
3
bds
|
3
ba
|
1,536
sqft
|
built
1996
8913 Glass Chimney Ln, Fishers, IN 46037
$-452
Cash flow
-7.0%
Cash-on-Cash Return
4.5%
Cap rate
0.6%
Rent to Value Ratio
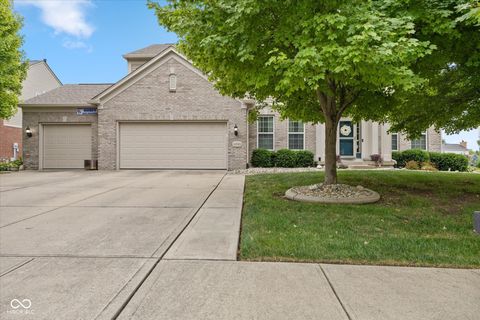
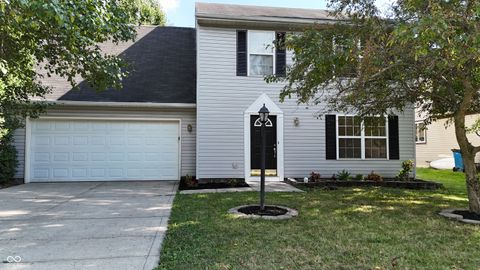
Active
$400,000
4
bds
|
3
ba
|
2,370
sqft
|
built
2011
11581 Beardsley Way, Fishers, IN 46038
$-351
Cash flow
-4.6%
Cash-on-Cash Return
5.1%
Cap rate
0.6%
Rent to Value Ratio
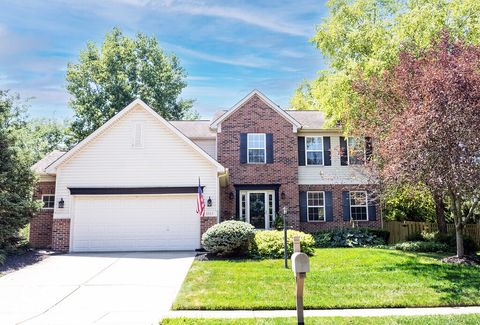
Active
$574,900
5
bds
|
4
ba
|
3,954
sqft
|
built
2006
11761 Boothbay Ln, Fishers, IN 46037
$-771
Cash flow
-7.0%
Cash-on-Cash Return
4.5%
Cap rate
0.6%
Rent to Value Ratio
Active
$799,900
5
bds
|
4
ba
|
4,305
sqft
|
built
1991
9838 Gulfstream Ct, Fishers, IN 46037
$-1,657
Cash flow
-10.8%
Cash-on-Cash Return
3.7%
Cap rate
0.5%
Rent to Value Ratio
Active
$499,000
4
bds
|
4
ba
|
3,554
sqft
|
built
2013
12964 Walbeck Dr, Fishers, IN 46037
$-195
Cash flow
-2.0%
Cash-on-Cash Return
5.7%
Cap rate
0.7%
Rent to Value Ratio
Active
$785,000
5
bds
|
5
ba
|
5,974
sqft
|
built
2004
10587 Proposal Pointe Way, Fishers, IN 46040
$-688
Cash flow
-4.6%
Cash-on-Cash Return
5.1%
Cap rate
0.6%
Rent to Value Ratio
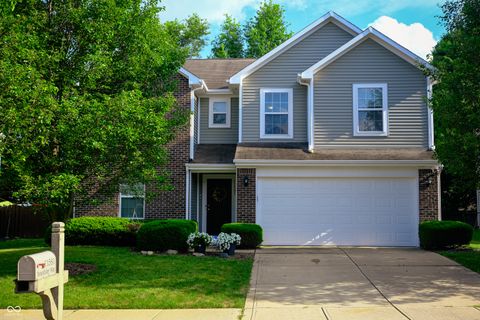
Active
$359,900
4
bds
|
3
ba
|
2,354
sqft
|
built
2000
10190 Holly Berry Cir, Fishers, IN 46038
$-357
Cash flow
-5.2%
Cash-on-Cash Return
5.0%
Cap rate
0.6%
Rent to Value Ratio
Active
$364,900
3
bds
|
2
ba
|
1,894
sqft
|
built
1997
9635 Shasta Dr, Fishers, IN 46038
$-393
Cash flow
-5.6%
Cash-on-Cash Return
4.9%
Cap rate
0.6%
Rent to Value Ratio
Active
$425,000
4
bds
|
3
ba
|
2,362
sqft
|
built
2014
14514 Glapthorn Rd, Fishers, IN 46037
$-502
Cash flow
-6.2%
Cash-on-Cash Return
4.7%
Cap rate
0.6%
Rent to Value Ratio
Active
$464,900
2
bds
|
2
ba
|
2,588
sqft
|
built
2007
16156 Oliver St, Fishers, IN 46037
$-651
Cash flow
-7.3%
Cash-on-Cash Return
4.5%
Cap rate
0.6%
Rent to Value Ratio
Active
$675,000
4
bds
|
4
ba
|
4,273
sqft
|
built
2019
14878 Horse Branch Way, Fishers, IN 46040
$-493
Cash flow
-3.8%
Cash-on-Cash Return
5.3%
Cap rate
0.7%
Rent to Value Ratio
Active
$329,500
3
bds
|
4
ba
|
1,844
sqft
|
built
2016
9075 Teaneck Dr, Fishers, IN 46038
$-397
Cash flow
-6.3%
Cash-on-Cash Return
4.7%
Cap rate
0.6%
Rent to Value Ratio
Active
$314,000
2
bds
|
3
ba
|
1,770
sqft
|
built
2005
12698 Watford Way, Fishers, IN 46037
$-228
Cash flow
-3.8%
Cash-on-Cash Return
5.3%
Cap rate
0.6%
Rent to Value Ratio
Active
$535,000
4
bds
|
3
ba
|
3,436
sqft
|
built
2020
12888 Girvan Way, Fishers, IN 46037
$-587
Cash flow
-5.7%
Cash-on-Cash Return
4.8%
Cap rate
0.6%
Rent to Value Ratio
Active
$925,000
6
bds
|
5
ba
|
5,584
sqft
|
built
1995
12968 Water Ridge Dr, Fishers, IN 46055
$-1,311
Cash flow
-7.4%
Cash-on-Cash Return
4.4%
Cap rate
0.6%
Rent to Value Ratio
Active
$445,000
4
bds
|
3
ba
|
2,970
sqft
|
built
1995
10518 Greenway Dr, Fishers, IN 46037
$-598
Cash flow
-7.0%
Cash-on-Cash Return
4.5%
Cap rate
0.6%
Rent to Value Ratio
Active
$475,000
3
bds
|
4
ba
|
2,420
sqft
|
built
2020
9729 District North Dr, Fishers, IN 46037
$-816
Cash flow
-9.0%
Cash-on-Cash Return
4.1%
Cap rate
0.6%
Rent to Value Ratio
Active
$690,000
4
bds
|
5
ba
|
5,086
sqft
|
built
1996
9990 Sugarleaf Pl, Fishers, IN 46038
$-1,371
Cash flow
-10.4%
Cash-on-Cash Return
3.8%
Cap rate
0.5%
Rent to Value Ratio
Active
$395,000
4
bds
|
3
ba
|
2,332
sqft
|
built
1989
7587 Winding Way, Fishers, IN 46038
$-328
Cash flow
-4.3%
Cash-on-Cash Return
5.1%
Cap rate
0.6%
Rent to Value Ratio
Active
$354,900
3
bds
|
2
ba
|
1,886
sqft
|
built
1995
8988 Max Ct, Fishers, IN 46037
$-332
Cash flow
-4.9%
Cash-on-Cash Return
5.0%
Cap rate
0.6%
Rent to Value Ratio
Active
$549,900
4
bds
|
3
ba
|
3,912
sqft
|
built
2017
10274 Cloverbank Dr, Fishers, IN 46040
$-477
Cash flow
-4.5%
Cash-on-Cash Return
5.1%
Cap rate
0.6%
Rent to Value Ratio
Active
$525,000
5
bds
|
5
ba
|
4,312
sqft
|
built
2005
12994 Dekoven Dr, Fishers, IN 46037
$-604
Cash flow
-6.0%
Cash-on-Cash Return
4.8%
Cap rate
0.6%
Rent to Value Ratio
Active
$465,000
3
bds
|
4
ba
|
2,400
sqft
|
built
2021
9728 Junction Sta, Fishers, IN 46037
$-555
Cash flow
-6.2%
Cash-on-Cash Return
4.7%
Cap rate
0.7%
Rent to Value Ratio
Active
$785,000
4
bds
|
5
ba
|
5,726
sqft
|
built
2020
16222 Browning Ct, Fishers, IN 46037
$-688
Cash flow
-4.6%
Cash-on-Cash Return
5.1%
Cap rate
0.6%
Rent to Value Ratio
Active
$265,000
3
bds
|
2
ba
|
1,592
sqft
|
built
1999
9664 Legare St, Fishers, IN 46038
$-215
Cash flow
-4.2%
Cash-on-Cash Return
5.2%
Cap rate
0.8%
Rent to Value Ratio
Active
$1,050,000
5
bds
|
5
ba
|
5,967
sqft
|
built
2013
10297 Timberland Dr, Fishers, IN 46040
$-1,939
Cash flow
-9.6%
Cash-on-Cash Return
3.9%
Cap rate
0.5%
Rent to Value Ratio
Active
$460,000
4
bds
|
3
ba
|
3,294
sqft
|
built
2000
13068 Lamarque Pl, Fishers, IN 46038
$-745
Cash flow
-8.4%
Cash-on-Cash Return
4.2%
Cap rate
0.5%
Rent to Value Ratio
Active
$299,999
2
bds
|
3
ba
|
2,109
sqft
|
built
2006
12675 Hollice Ln, Fishers, IN 46037
$-209
Cash flow
-3.6%
Cash-on-Cash Return
5.3%
Cap rate
0.7%
Rent to Value Ratio
Active
$425,000
5
bds
|
3
ba
|
2,977
sqft
|
built
1989
12586 Pointer Pl, Fishers, IN 46038
$-383
Cash flow
-4.7%
Cash-on-Cash Return
5.1%
Cap rate
0.6%
Rent to Value Ratio
Active
$624,500
4
bds
|
5
ba
|
5,759
sqft
|
built
2004
10381 Beaver Ridge Dr, Fishers, IN 46037
$-468
Cash flow
-3.9%
Cash-on-Cash Return
5.2%
Cap rate
0.6%
Rent to Value Ratio
Active
$395,000
4
bds
|
3
ba
|
2,560
sqft
|
built
1992
8771 Buffett Pkwy, Fishers, IN 46038
$-298
Cash flow
-3.9%
Cash-on-Cash Return
5.2%
Cap rate
0.6%
Rent to Value Ratio
Active
$327,500
3
bds
|
2
ba
|
1,284
sqft
|
built
1994
11229 Spring Blossom Ln, Fishers, IN 46038
$-326
Cash flow
-5.2%
Cash-on-Cash Return
5.0%
Cap rate
0.6%
Rent to Value Ratio
Active
$369,000
4
bds
|
3
ba
|
2,907
sqft
|
built
1998
10266 Hatherley Way, Fishers, IN 46037
$-201
Cash flow
-2.8%
Cash-on-Cash Return
5.5%
Cap rate
0.7%
Rent to Value Ratio