Indianapolis, IN Investment Properties for Sale
Browse homes for sale and investment properties in Indianapolis, IN. Refine your search by price, property type, or more.
Best cash flowing properties in Indianapolis, IN
Active
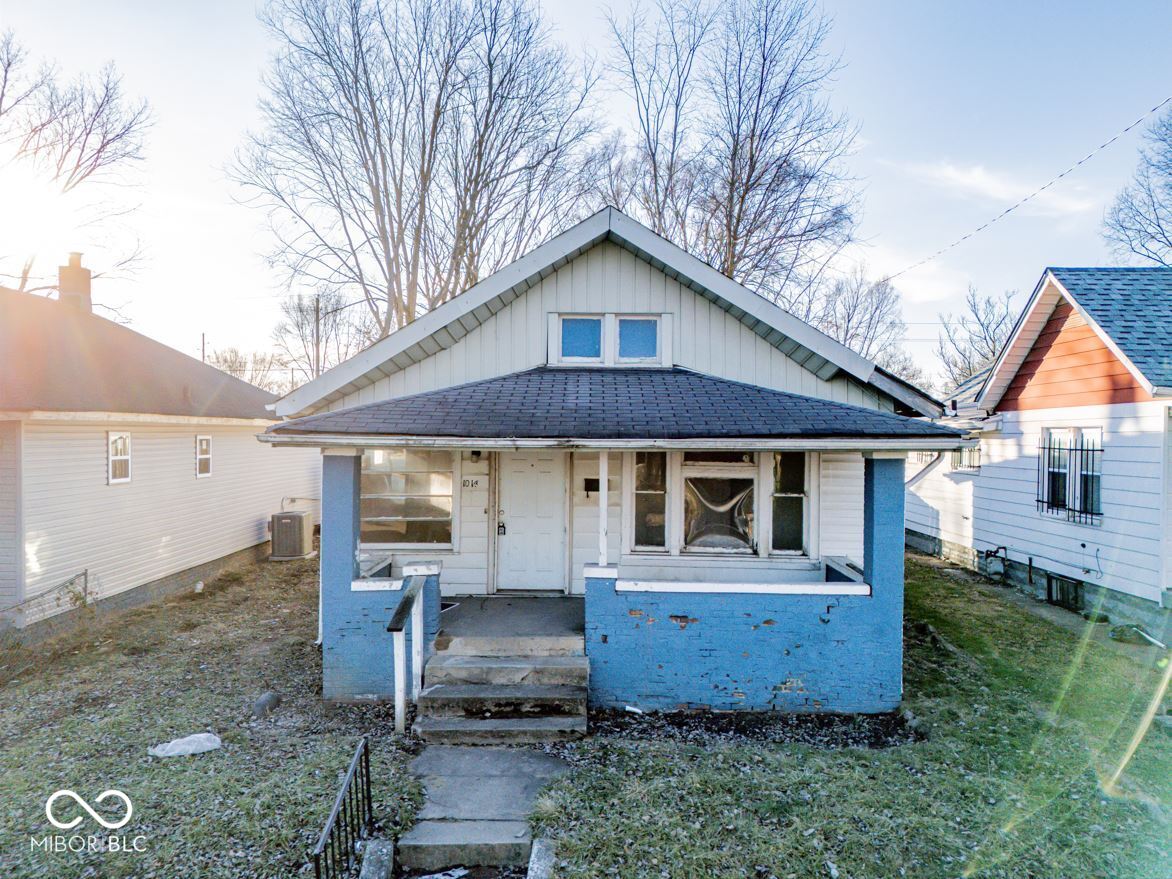
$79,900
3
bds
|
1
ba
|
1,011
sqft
|
built
1920
1014 N Sheffield Ave, Indianapolis, IN 46222
$350
Cash flow
22.9%
Cash-on-Cash Return
11.4%
Cap rate
1.4%
Rent to Value Ratio
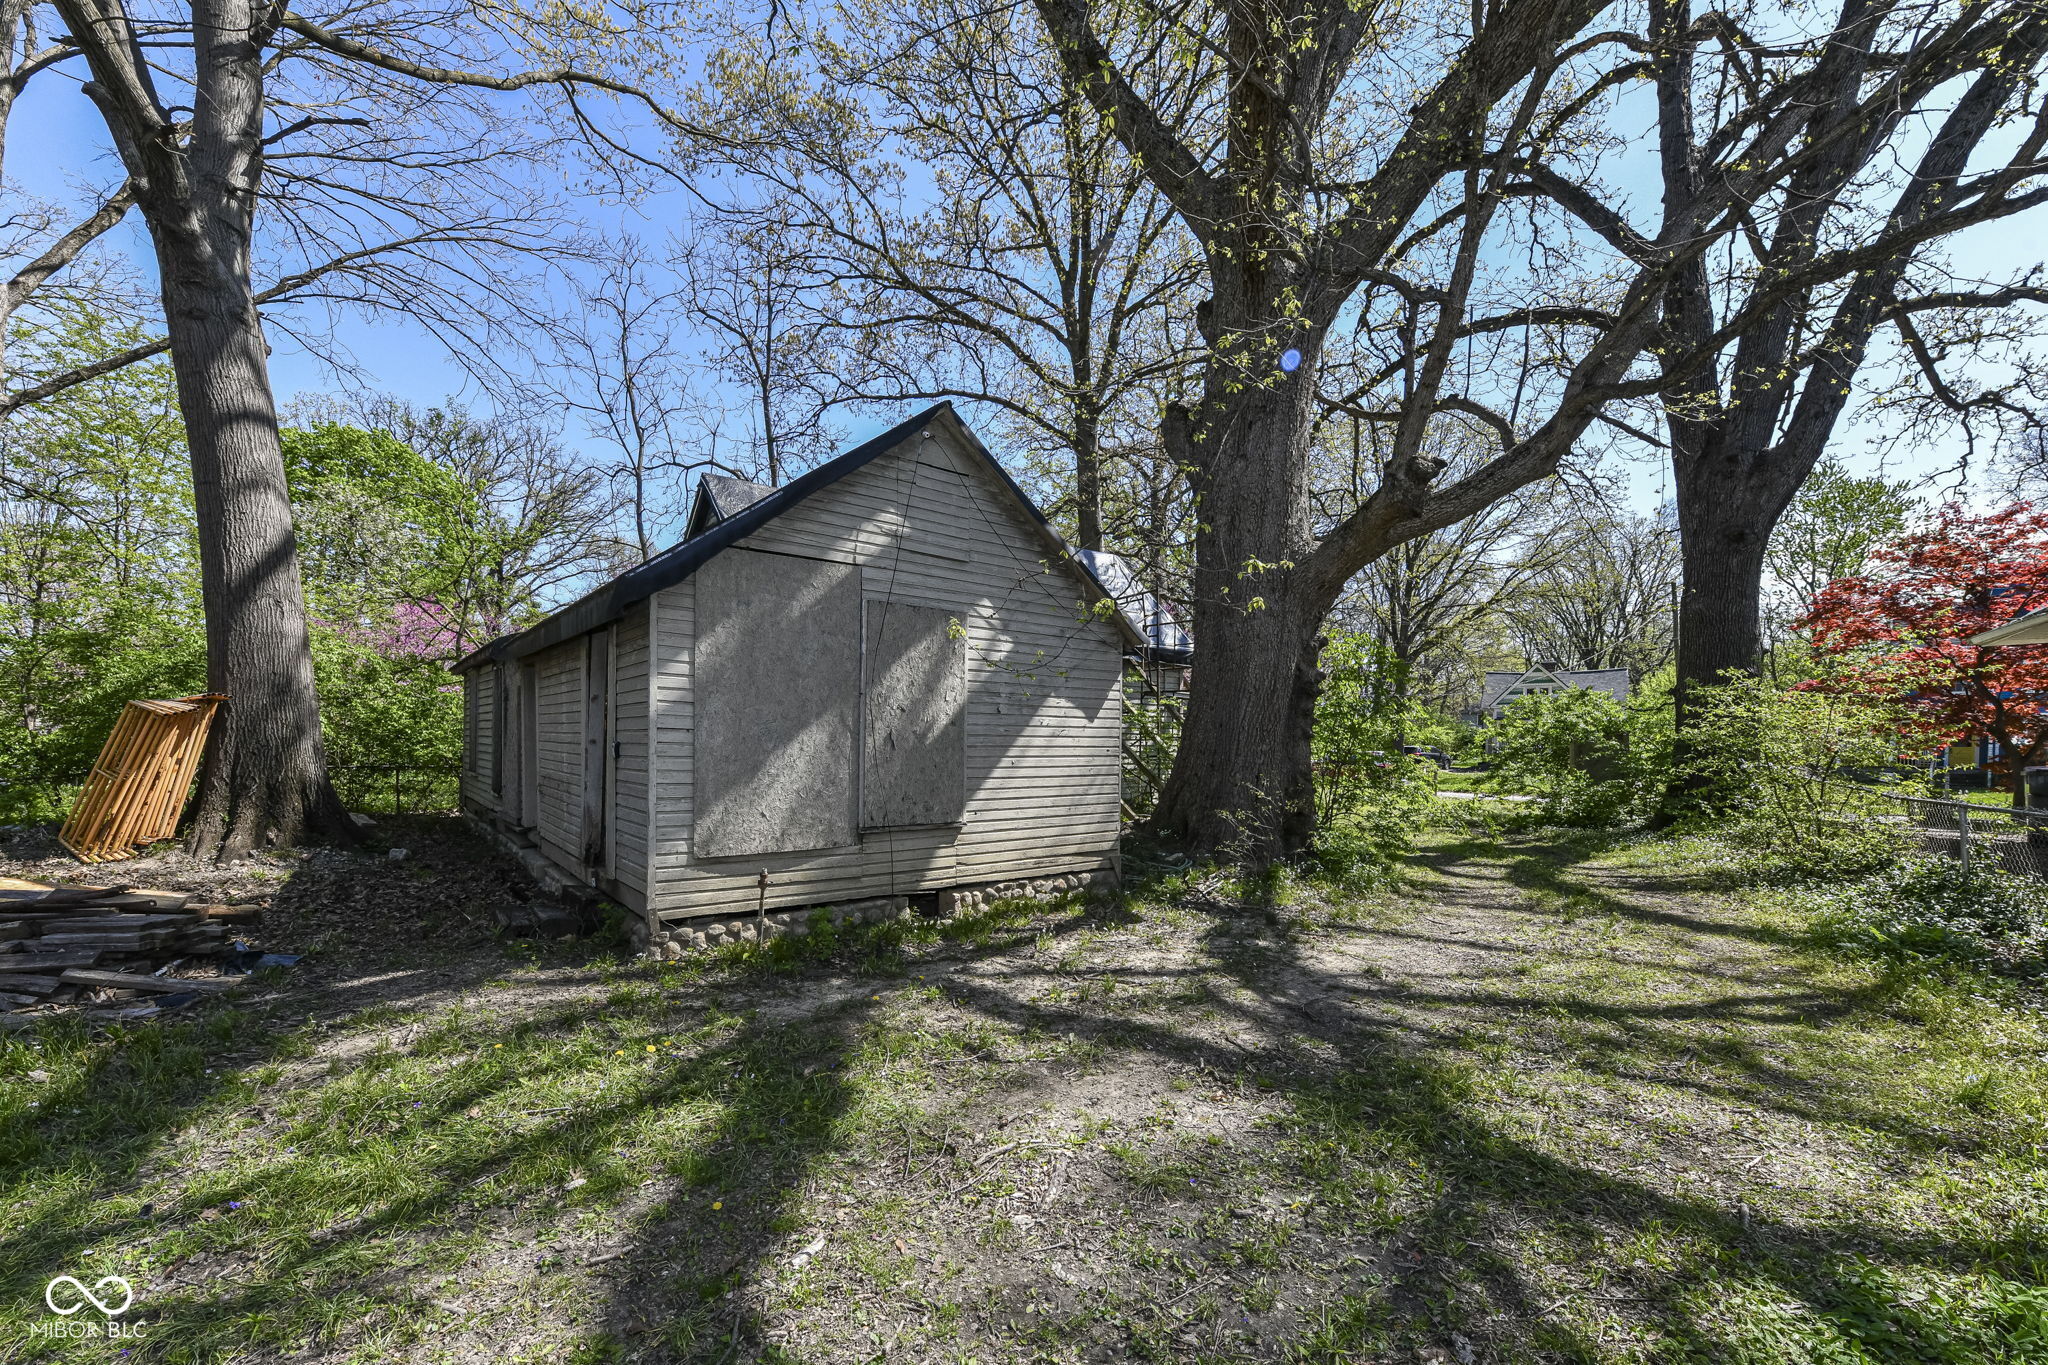
Active
$125,000
2
bds
|
0
ba
|
872
sqft
|
built
1870
324 Burgess Ave, Indianapolis, IN 46219
$326
Cash flow
13.6%
Cash-on-Cash Return
9.3%
Cap rate
1.1%
Rent to Value Ratio
2,000 out of 2,142 properties for sale in Indianapolis, IN
Limited Results Shown
Create a free account, or log in to reveal all property listings and enjoy the complete experience.
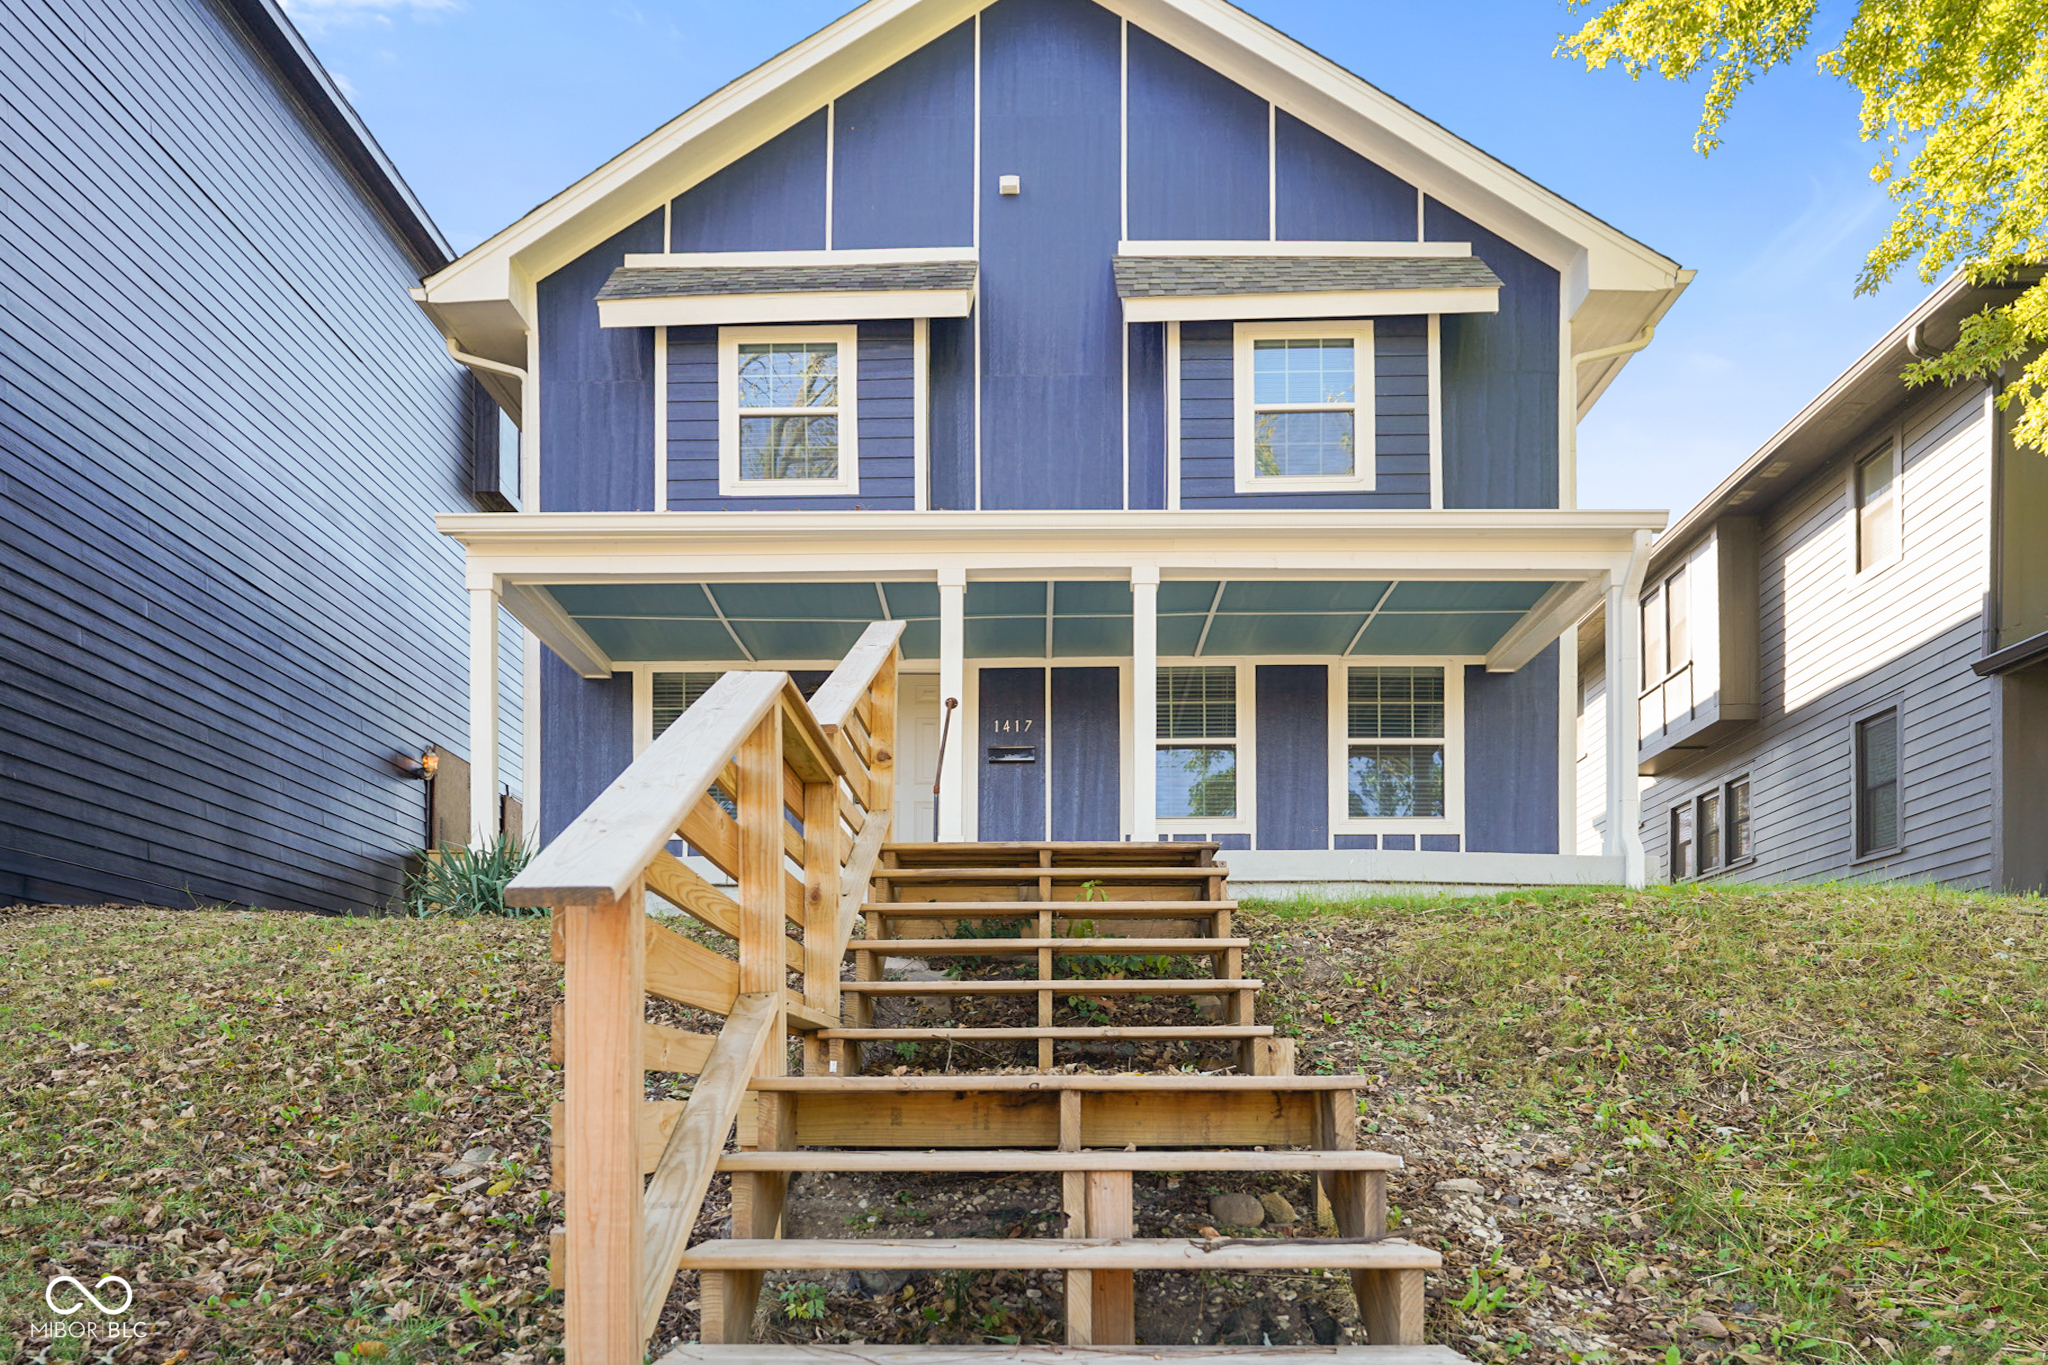
Active
$459,999
4
bds
|
4
ba
|
2,842
sqft
|
built
1920
1417 E Michigan St, Indianapolis, IN 46201
$-355
Cash flow
-4.0%
Cash-on-Cash Return
5.2%
Cap rate
0.6%
Rent to Value Ratio
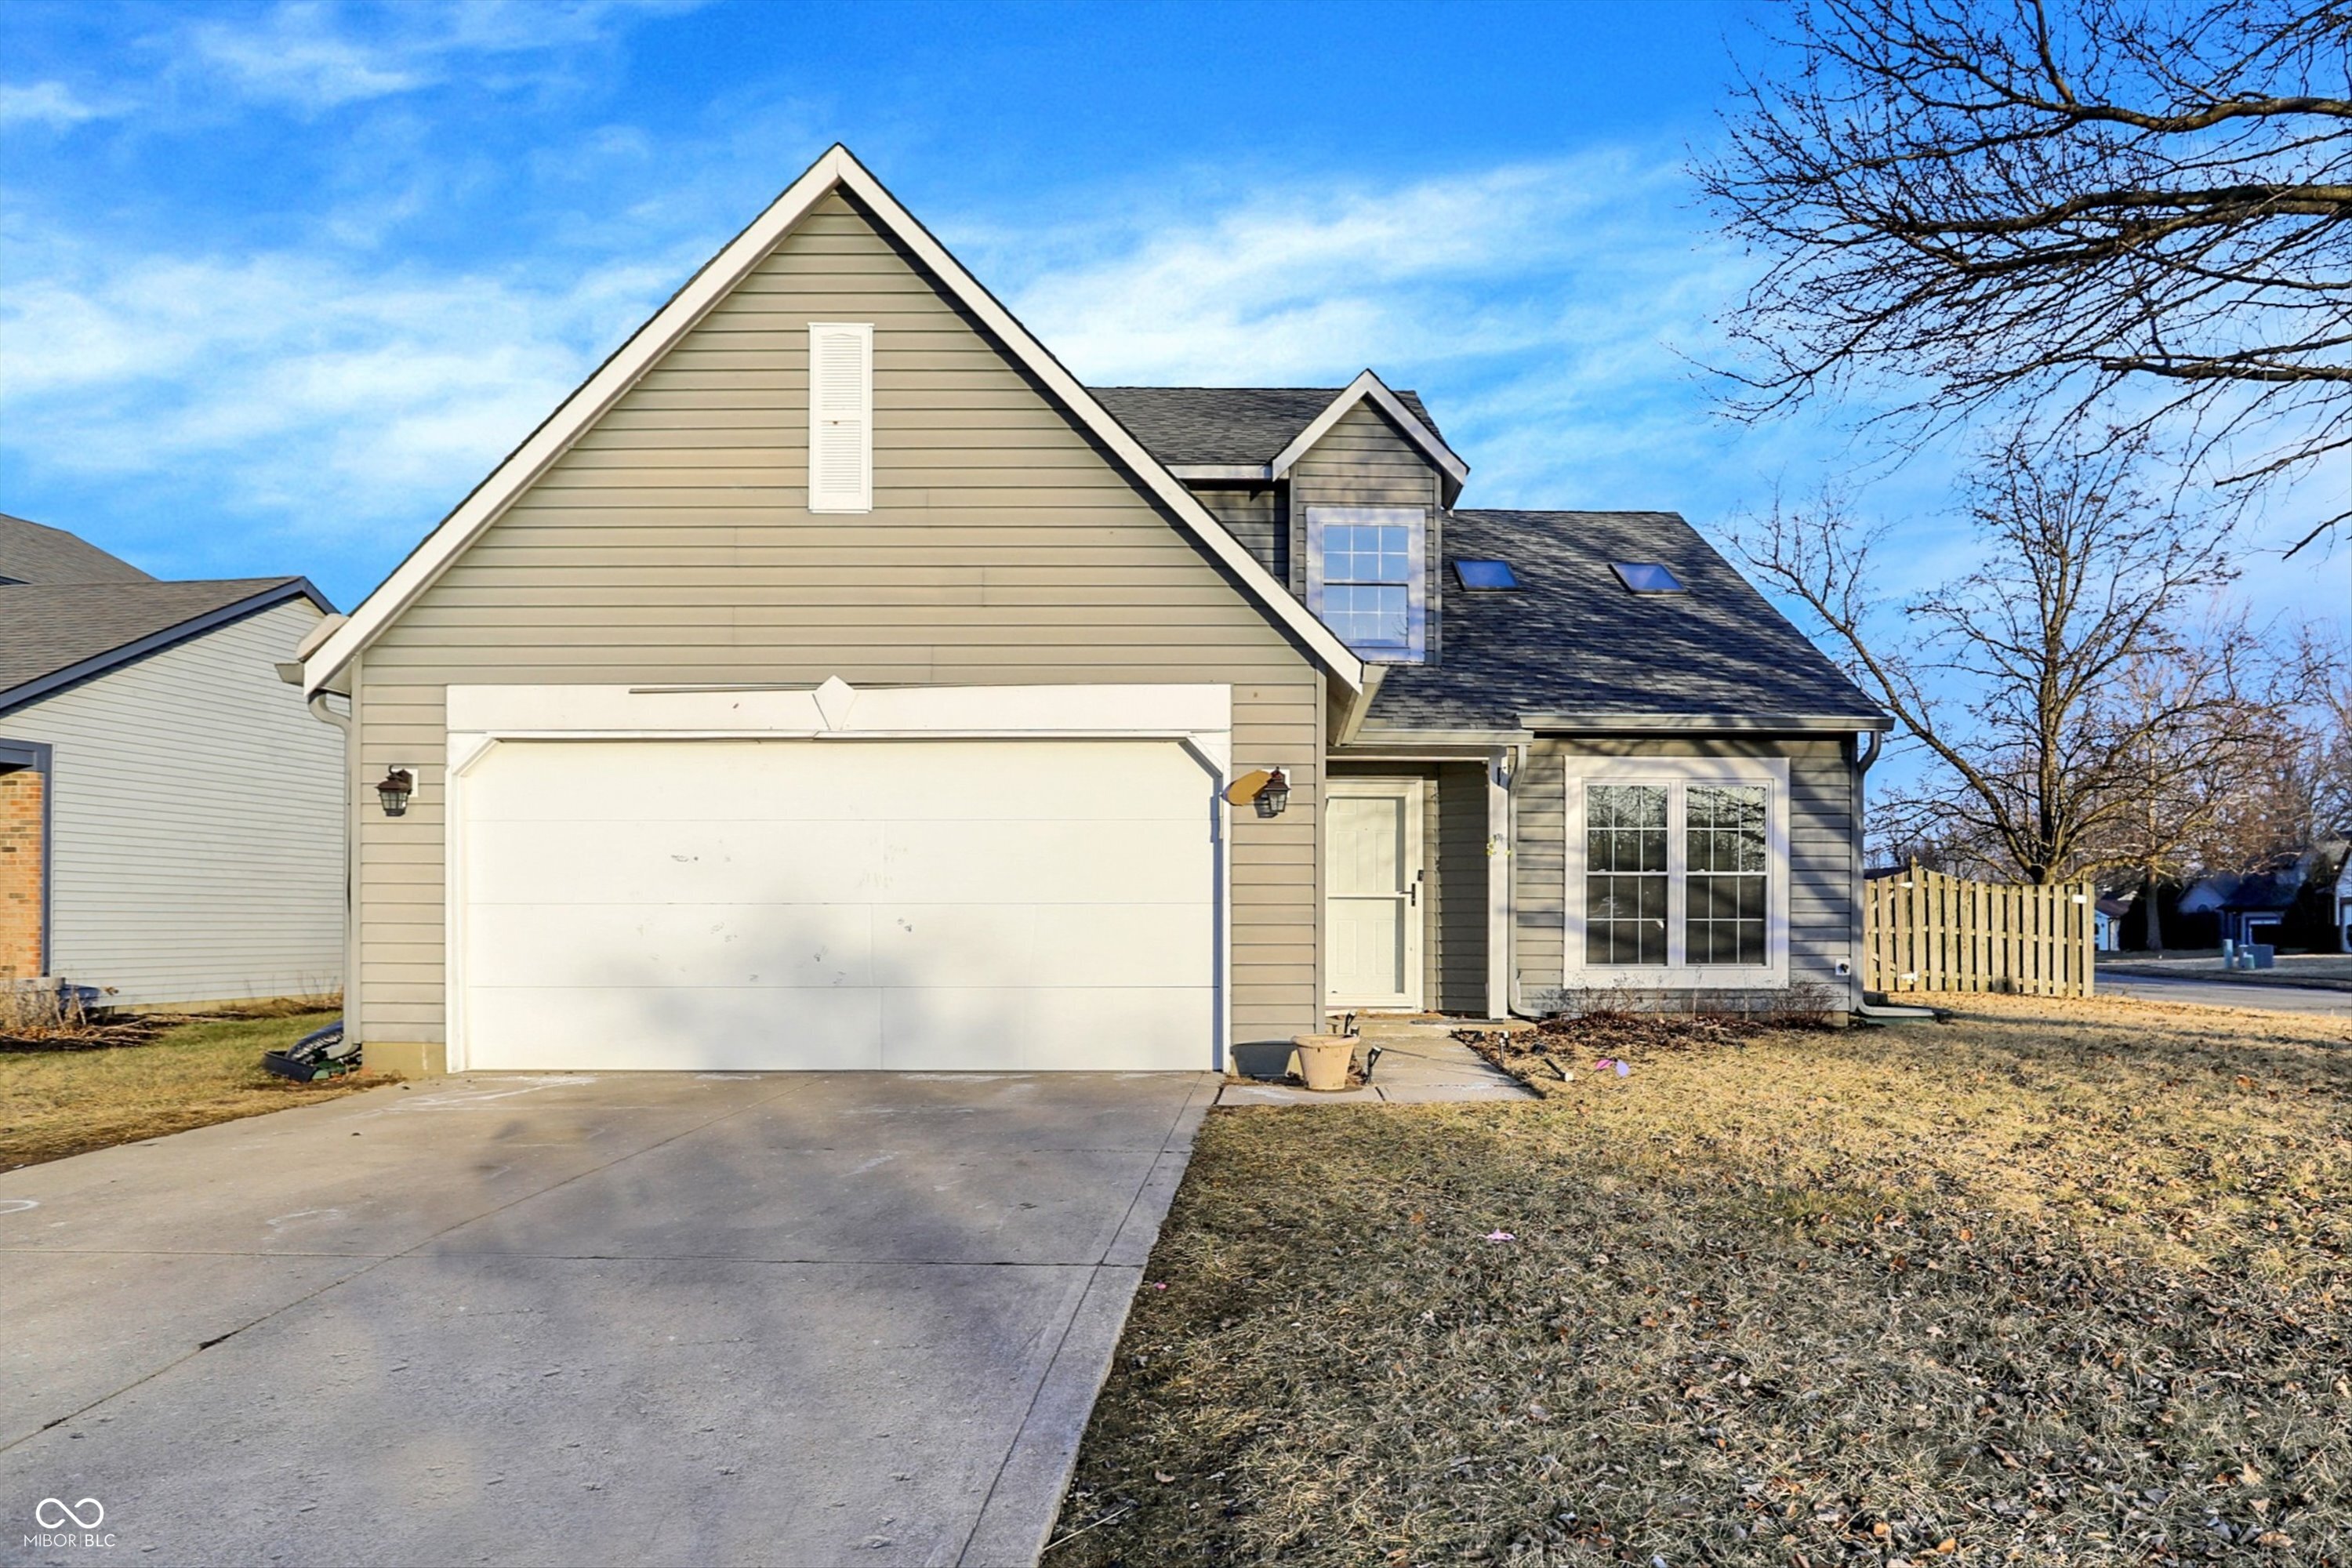
Pending
$268,000
3
bds
|
3
ba
|
1,587
sqft
|
built
1990
5937 Terrytown Pkwy, Indianapolis, IN 46254
$-26
Cash flow
-0.5%
Cash-on-Cash Return
6.0%
Cap rate
0.7%
Rent to Value Ratio
Active
$209,500
3
bds
|
2
ba
|
1,460
sqft
|
built
1952
5757 E 21st St, Indianapolis, IN 46218
$-245
Cash flow
-6.1%
Cash-on-Cash Return
4.7%
Cap rate
0.6%
Rent to Value Ratio
Active
$245,000
3
bds
|
3
ba
|
1,952
sqft
|
built
2004
8317 Pine Branch Ln, Indianapolis, IN 46234
$-121
Cash flow
-2.6%
Cash-on-Cash Return
5.6%
Cap rate
0.8%
Rent to Value Ratio
Active
$209,900
3
bds
|
1
ba
|
1,776
sqft
|
built
1930
721 N Grant Ave, Indianapolis, IN 46201
$-109
Cash flow
-2.7%
Cash-on-Cash Return
5.5%
Cap rate
0.7%
Rent to Value Ratio
Active
$189,999
3
bds
|
1
ba
|
1,475
sqft
|
built
1910
1125 Laurel St, Indianapolis, IN 46203
$-76
Cash flow
-2.1%
Cash-on-Cash Return
5.7%
Cap rate
0.7%
Rent to Value Ratio
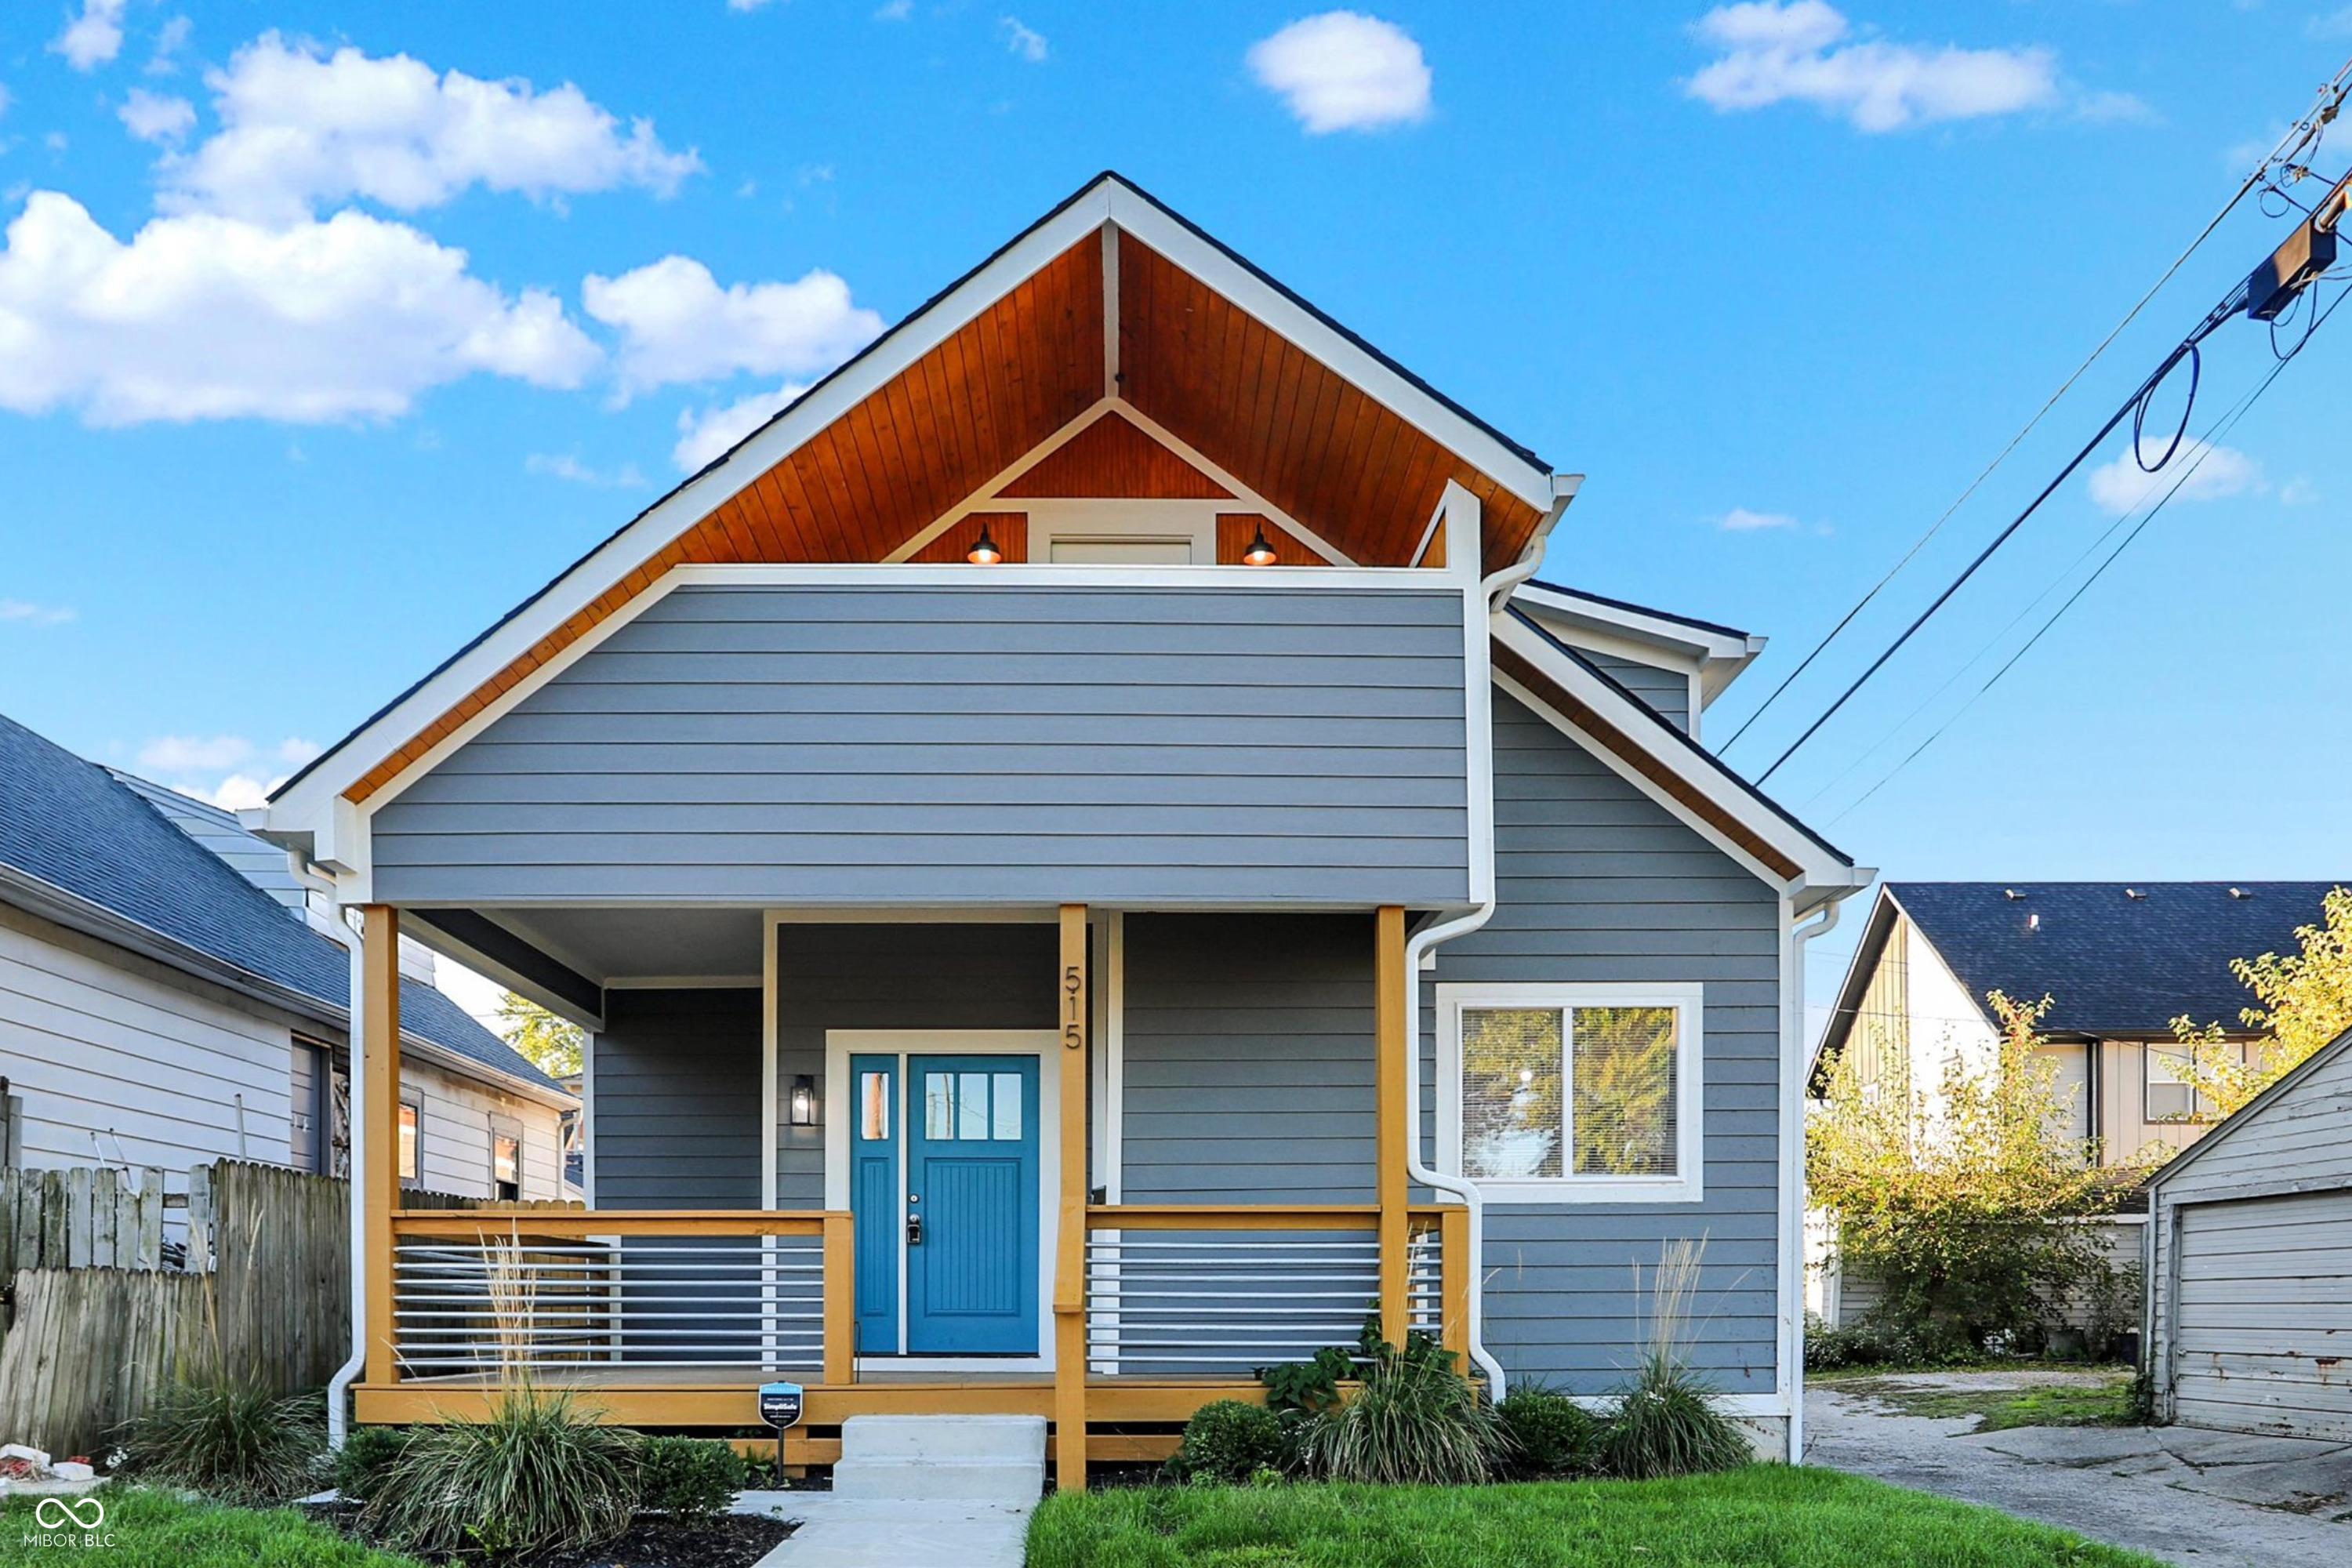
Active
$398,900
3
bds
|
3
ba
|
1,926
sqft
|
built
1904
515 Orange St, Indianapolis, IN 46203
$-111
Cash flow
-1.5%
Cash-on-Cash Return
5.8%
Cap rate
0.7%
Rent to Value Ratio
Active
$290,000
3
bds
|
2
ba
|
1,130
sqft
|
built
1930
337 E Minnesota St, Indianapolis, IN 46225
$-313
Cash flow
-5.6%
Cash-on-Cash Return
4.9%
Cap rate
0.6%
Rent to Value Ratio
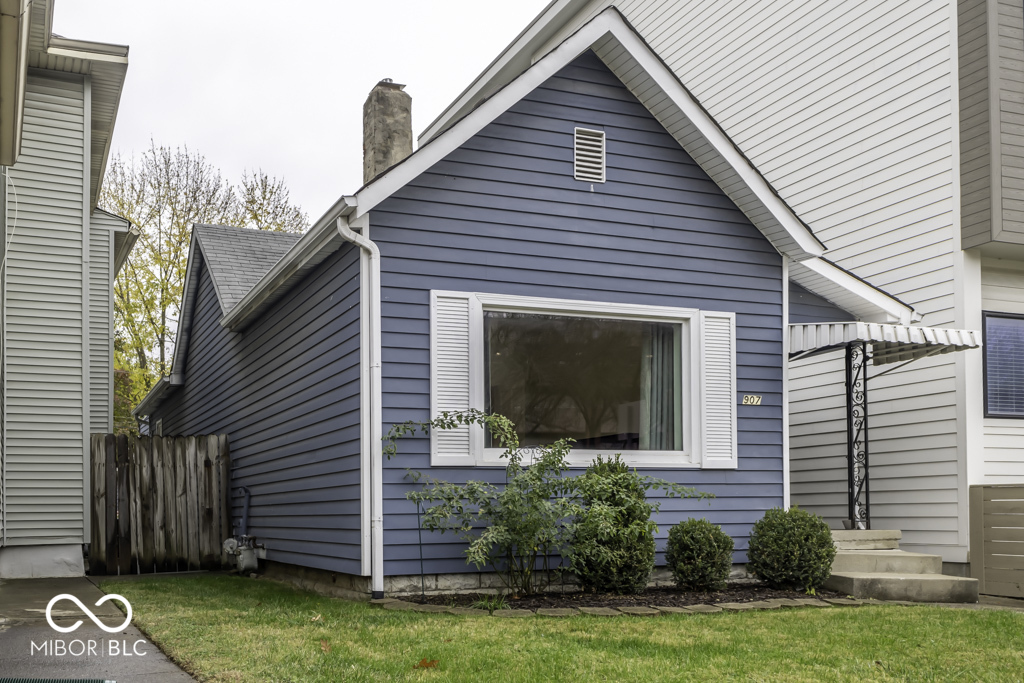
Active
$275,000
2
bds
|
1
ba
|
956
sqft
|
built
1880
907 S East St, Indianapolis, IN 46225
$-29
Cash flow
-0.6%
Cash-on-Cash Return
6.0%
Cap rate
0.7%
Rent to Value Ratio
Active
$204,900
3
bds
|
2
ba
|
1,368
sqft
|
built
1920
402 W 38th St, Indianapolis, IN 46208
$-84
Cash flow
-2.1%
Cash-on-Cash Return
5.7%
Cap rate
0.7%
Rent to Value Ratio
Pending
$585,000
4
bds
|
4
ba
|
4,332
sqft
|
built
1977
6235 Johnson Rd, Indianapolis, IN 46220
$108
Cash flow
1.0%
Cash-on-Cash Return
6.4%
Cap rate
0.8%
Rent to Value Ratio
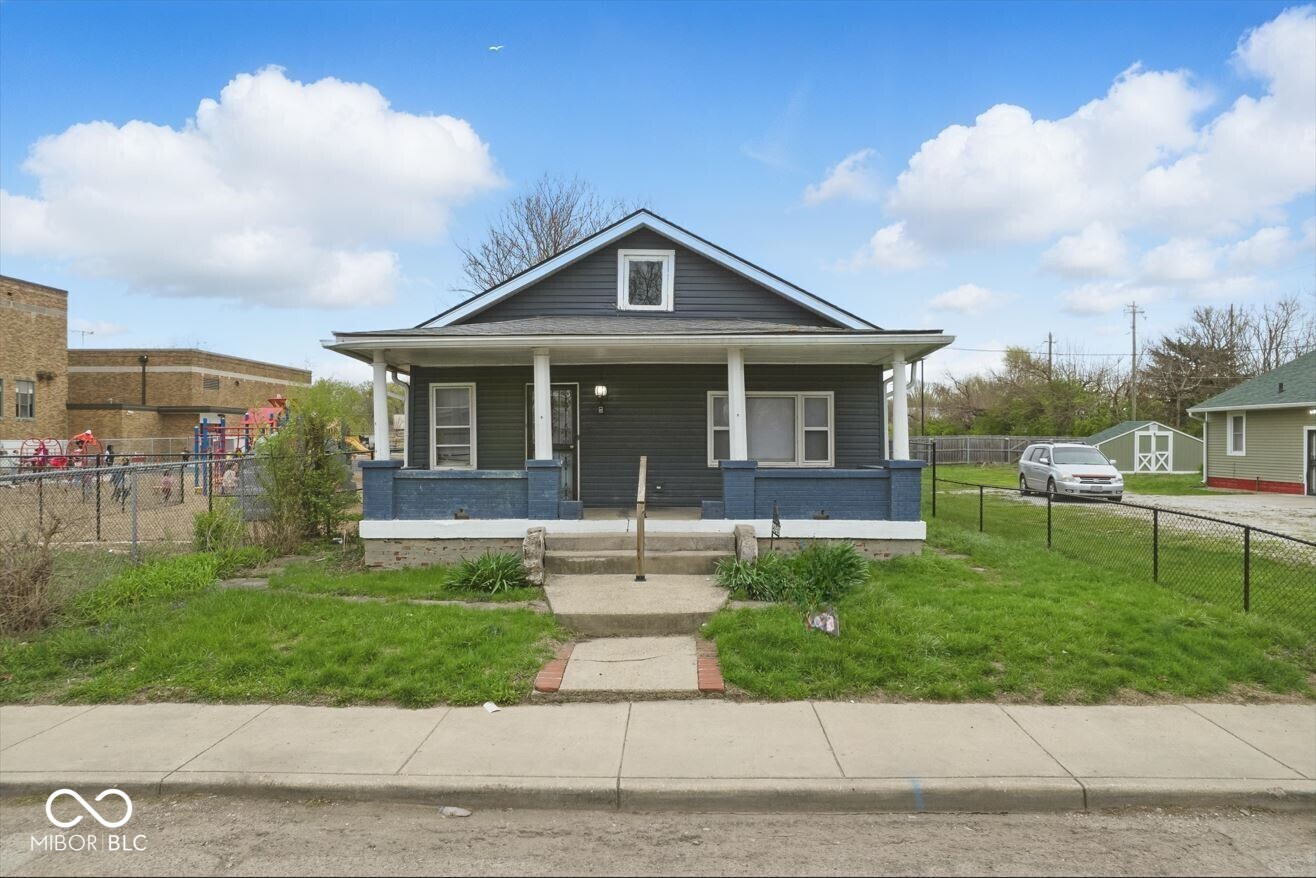
Active
$184,900
3
bds
|
1
ba
|
1,522
sqft
|
built
1910
3470 N Kenwood Ave, Indianapolis, IN 46208
$295
Cash flow
8.3%
Cash-on-Cash Return
8.1%
Cap rate
1.0%
Rent to Value Ratio
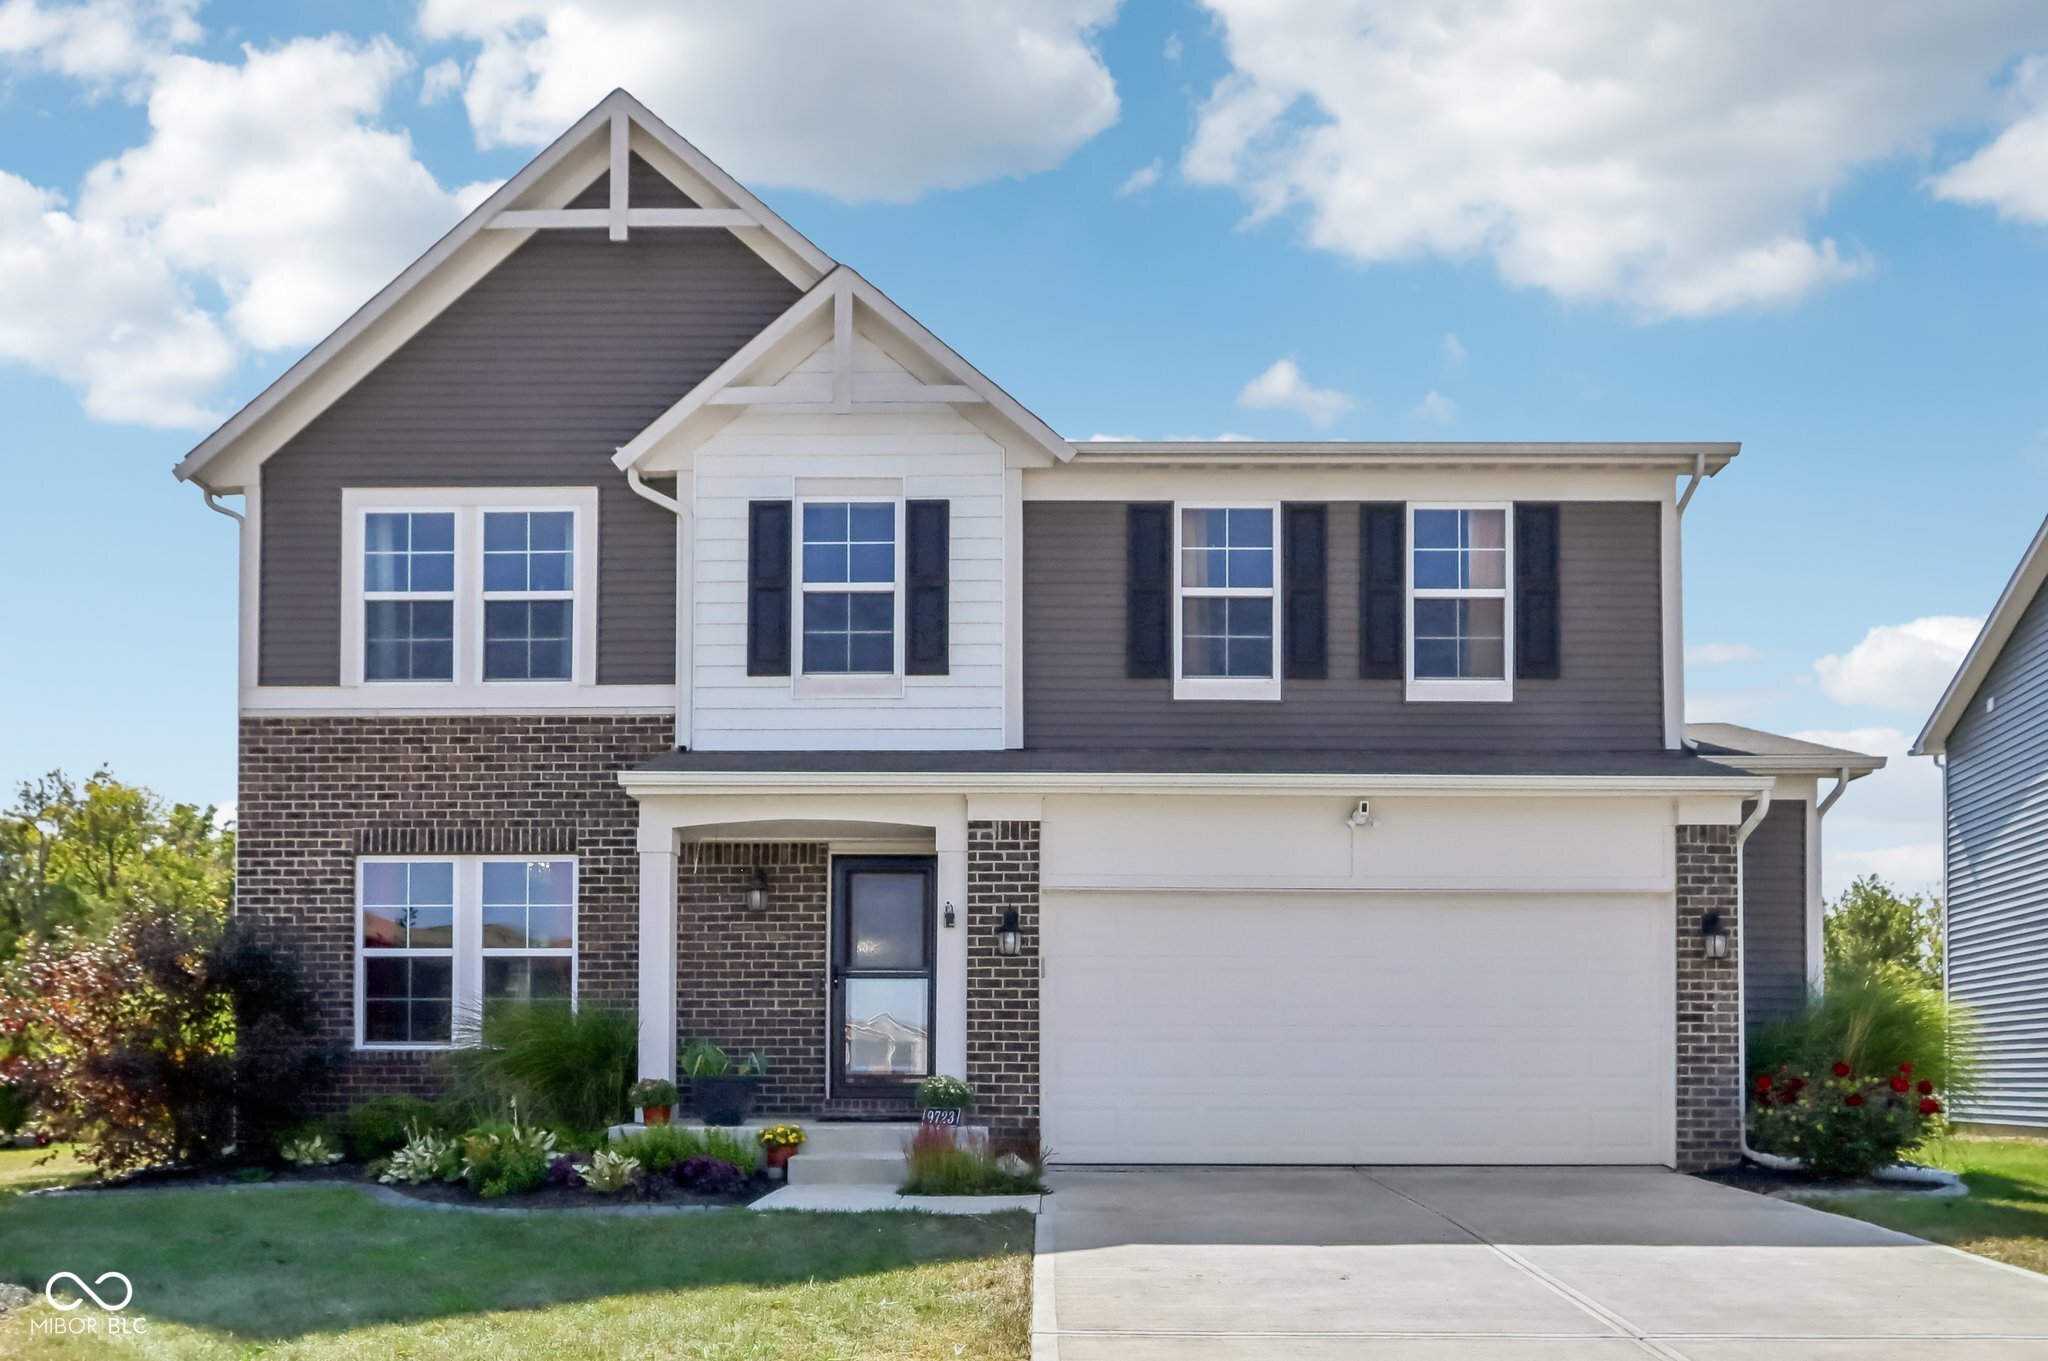
Active
$349,900
3
bds
|
3
ba
|
2,256
sqft
|
built
2019
9723 Violet Cir, Indianapolis, IN 46239
$91
Cash flow
1.4%
Cash-on-Cash Return
6.5%
Cap rate
0.8%
Rent to Value Ratio
Active
$79,900
3
bds
|
1
ba
|
1,011
sqft
|
built
1920
1014 N Sheffield Ave, Indianapolis, IN 46222
$350
Cash flow
22.9%
Cash-on-Cash Return
11.4%
Cap rate
1.4%
Rent to Value Ratio
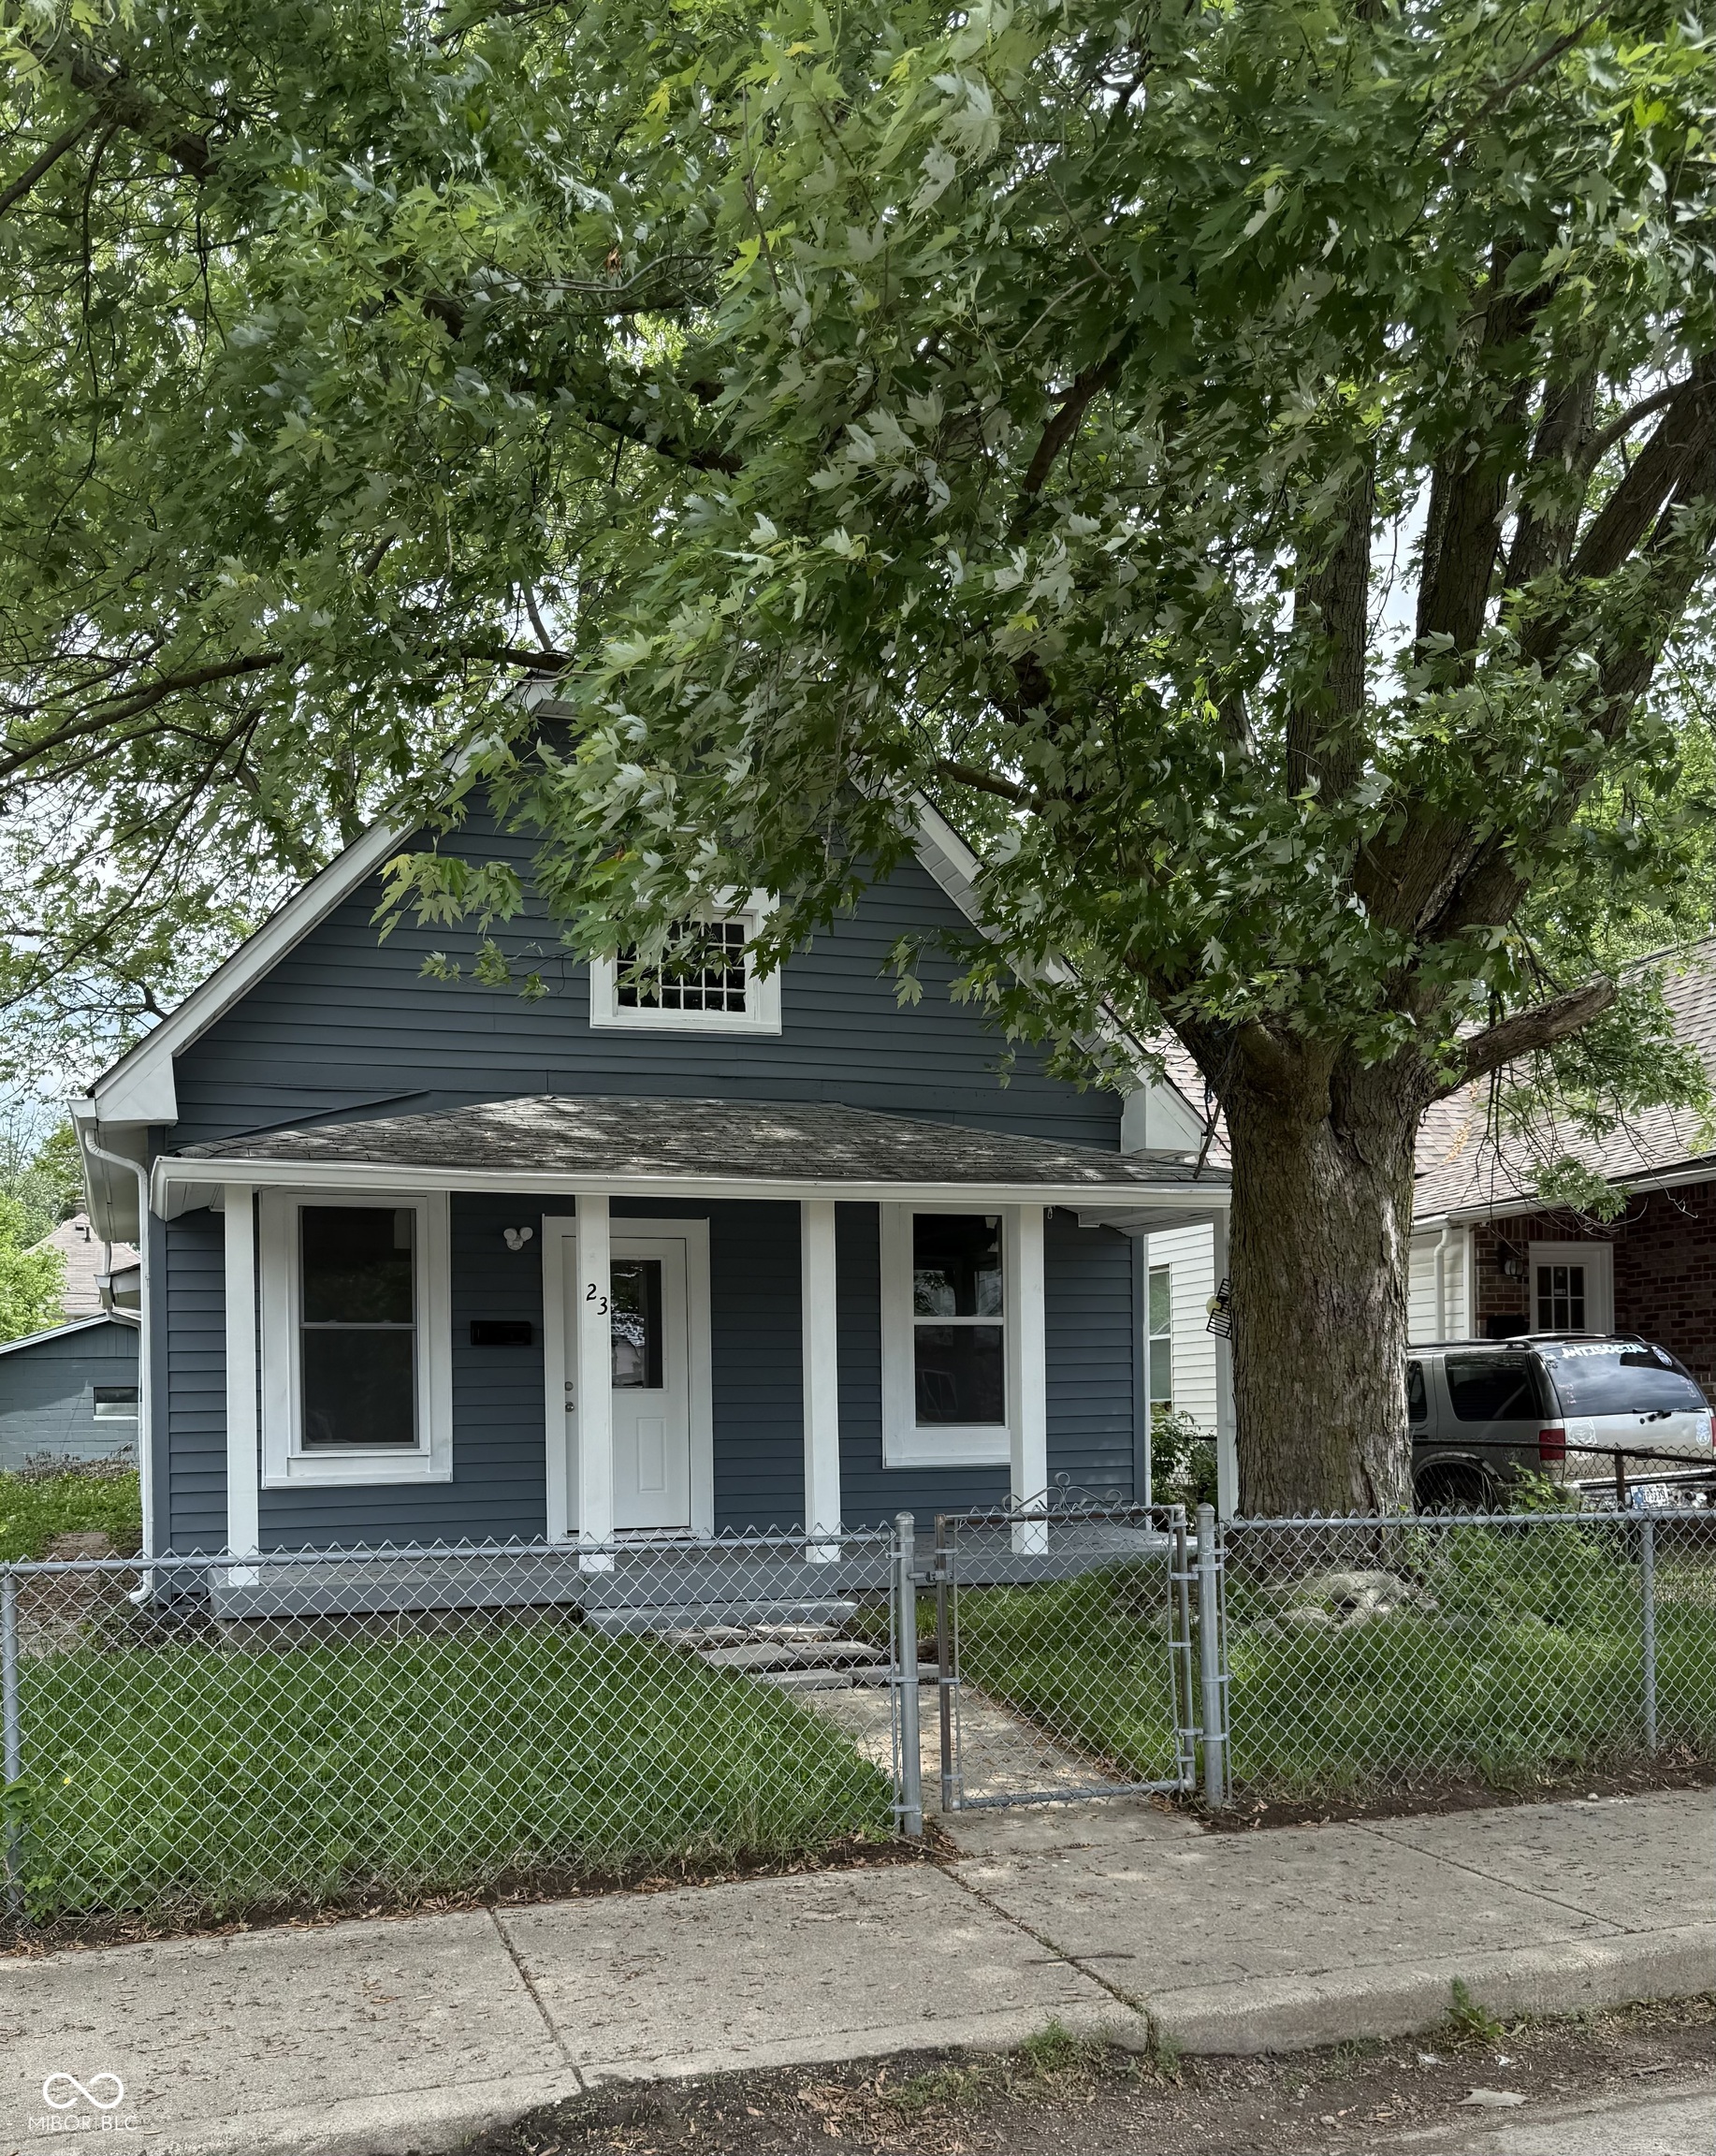
Active
$139,999
2
bds
|
1
ba
|
770
sqft
|
built
1900
23 S Holmes Ave, Indianapolis, IN 46222
$42
Cash flow
1.6%
Cash-on-Cash Return
6.5%
Cap rate
0.8%
Rent to Value Ratio
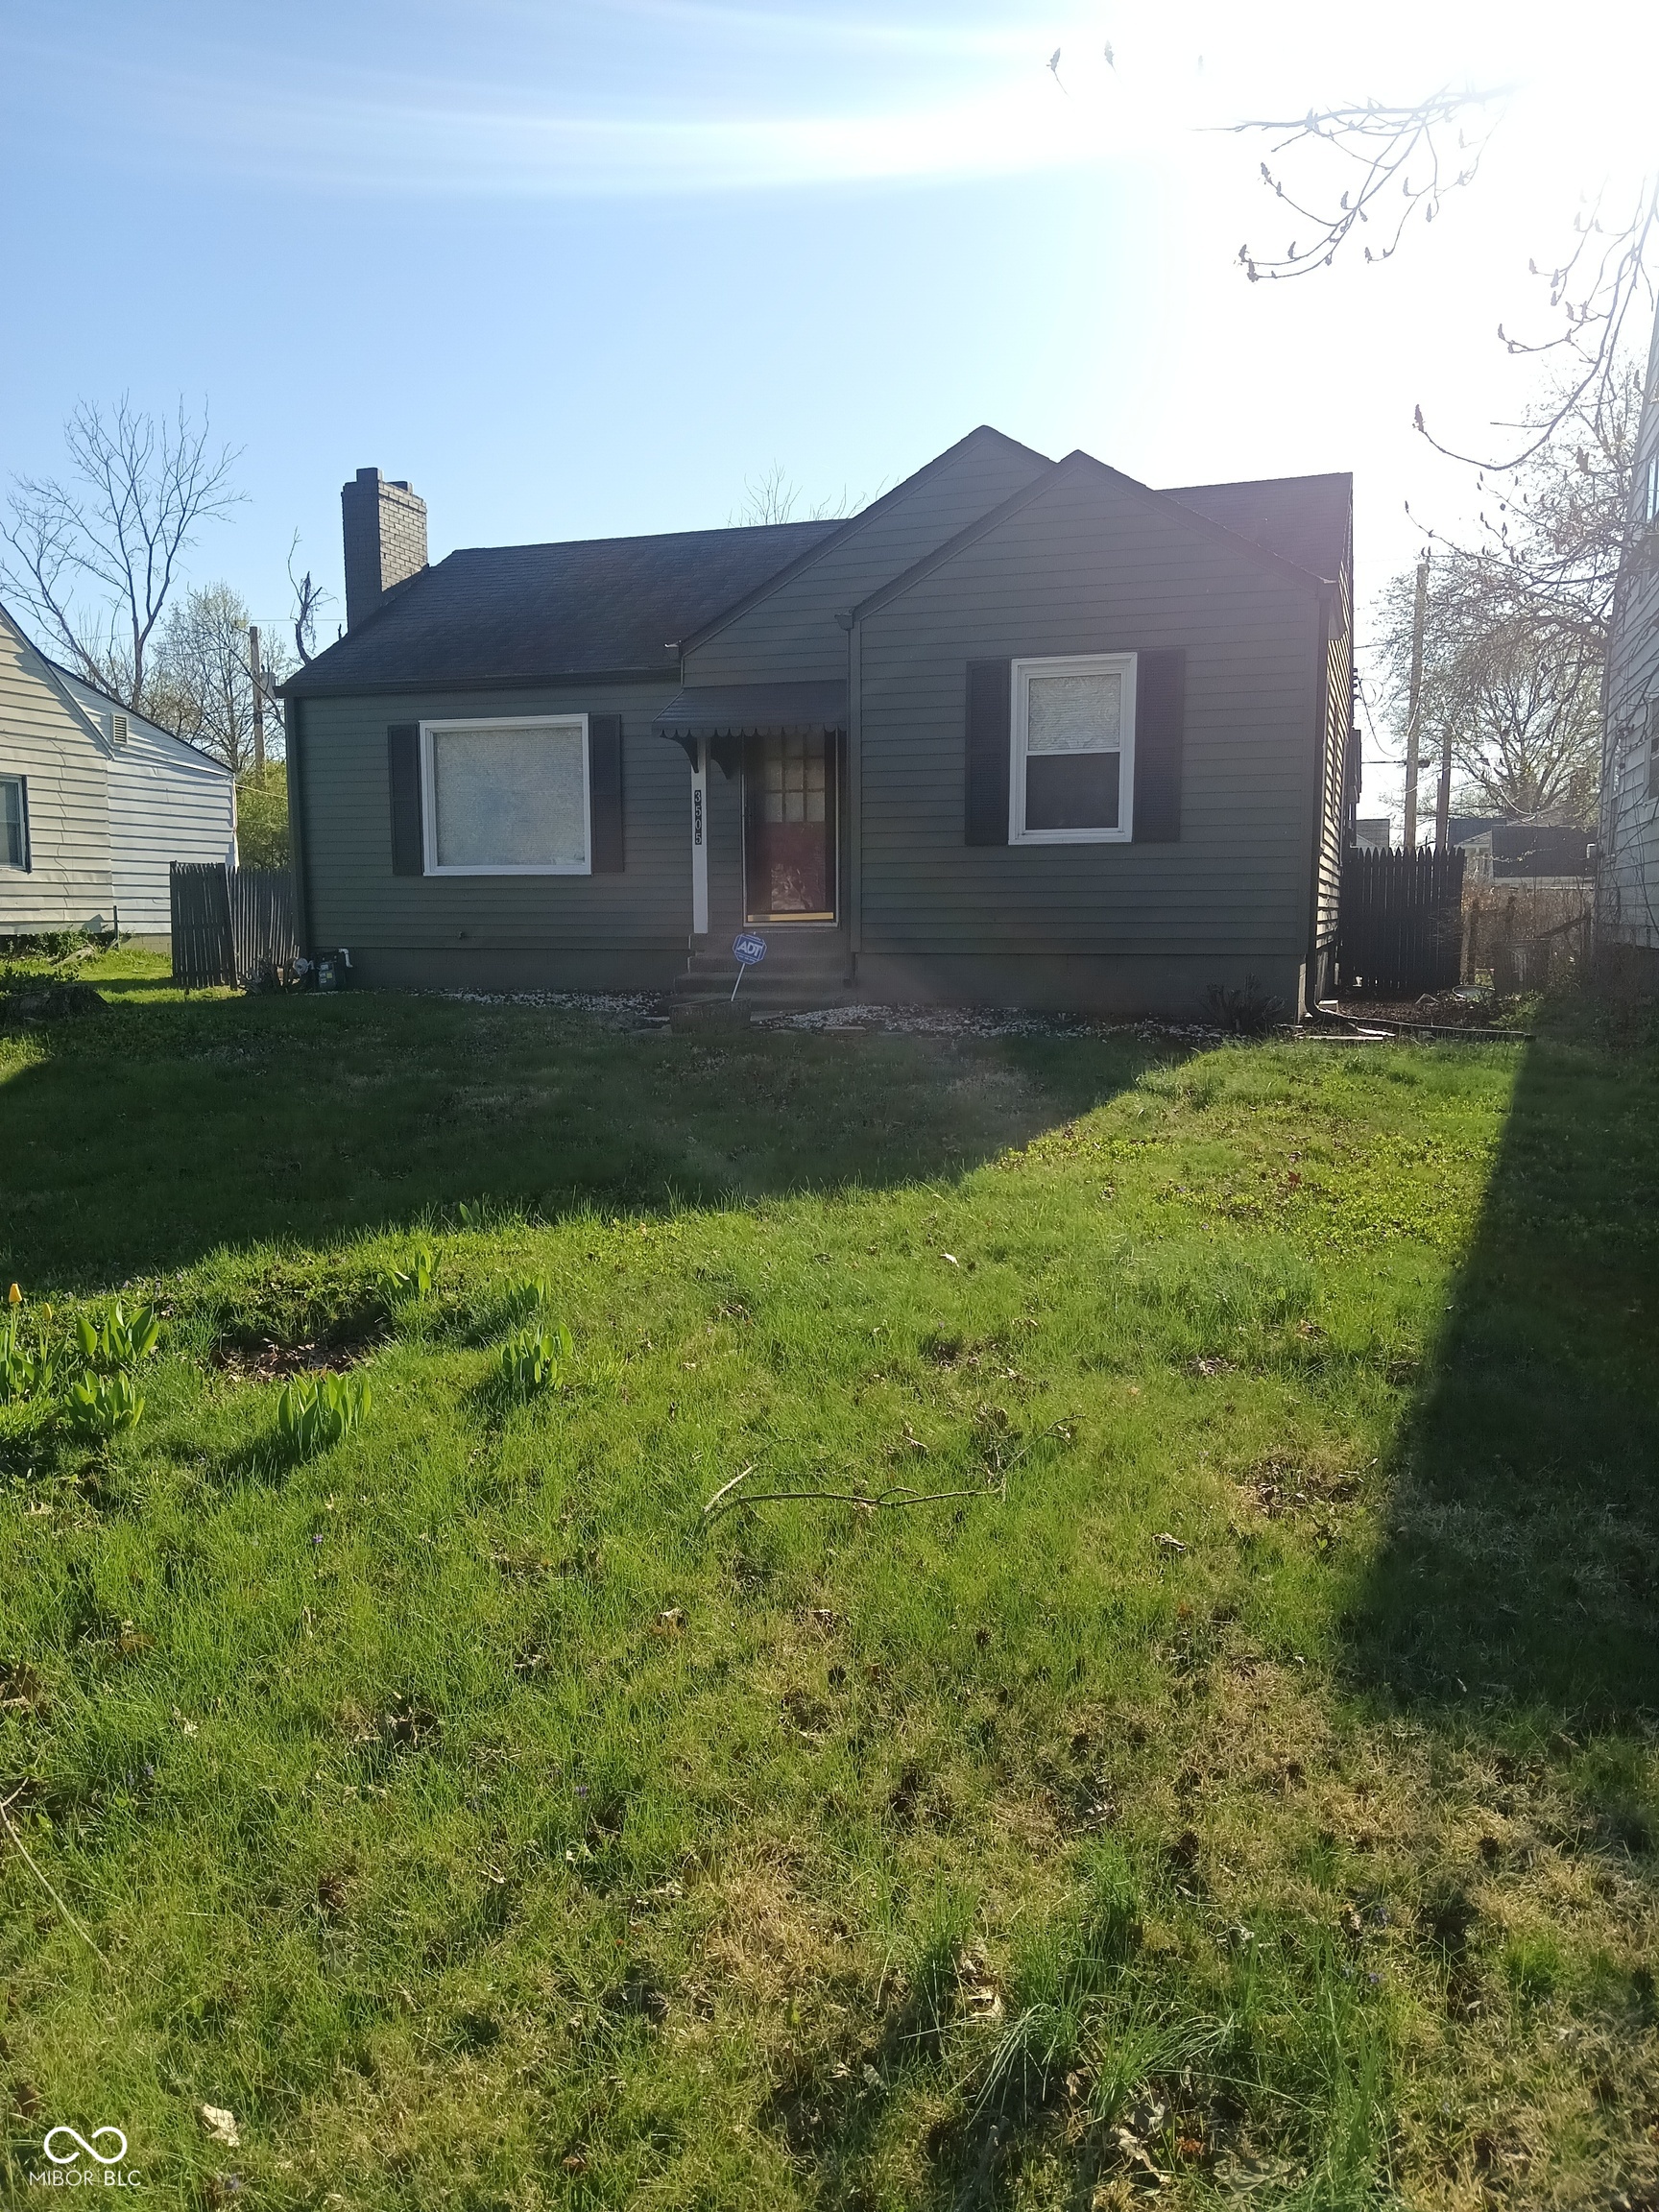
Active
$142,000
3
bds
|
1
ba
|
920
sqft
|
built
1951
3521 N Riley Ave, Indianapolis, IN 46218
$170
Cash flow
6.2%
Cash-on-Cash Return
7.6%
Cap rate
0.9%
Rent to Value Ratio
Active
$125,000
2
bds
|
0
ba
|
872
sqft
|
built
1870
324 Burgess Ave, Indianapolis, IN 46219
$326
Cash flow
13.6%
Cash-on-Cash Return
9.3%
Cap rate
1.1%
Rent to Value Ratio
Active
$164,900
2
bds
|
1
ba
|
754
sqft
|
built
1912
1546 Kappes St, Indianapolis, IN 46221
$121
Cash flow
3.8%
Cash-on-Cash Return
7.0%
Cap rate
0.8%
Rent to Value Ratio
Active
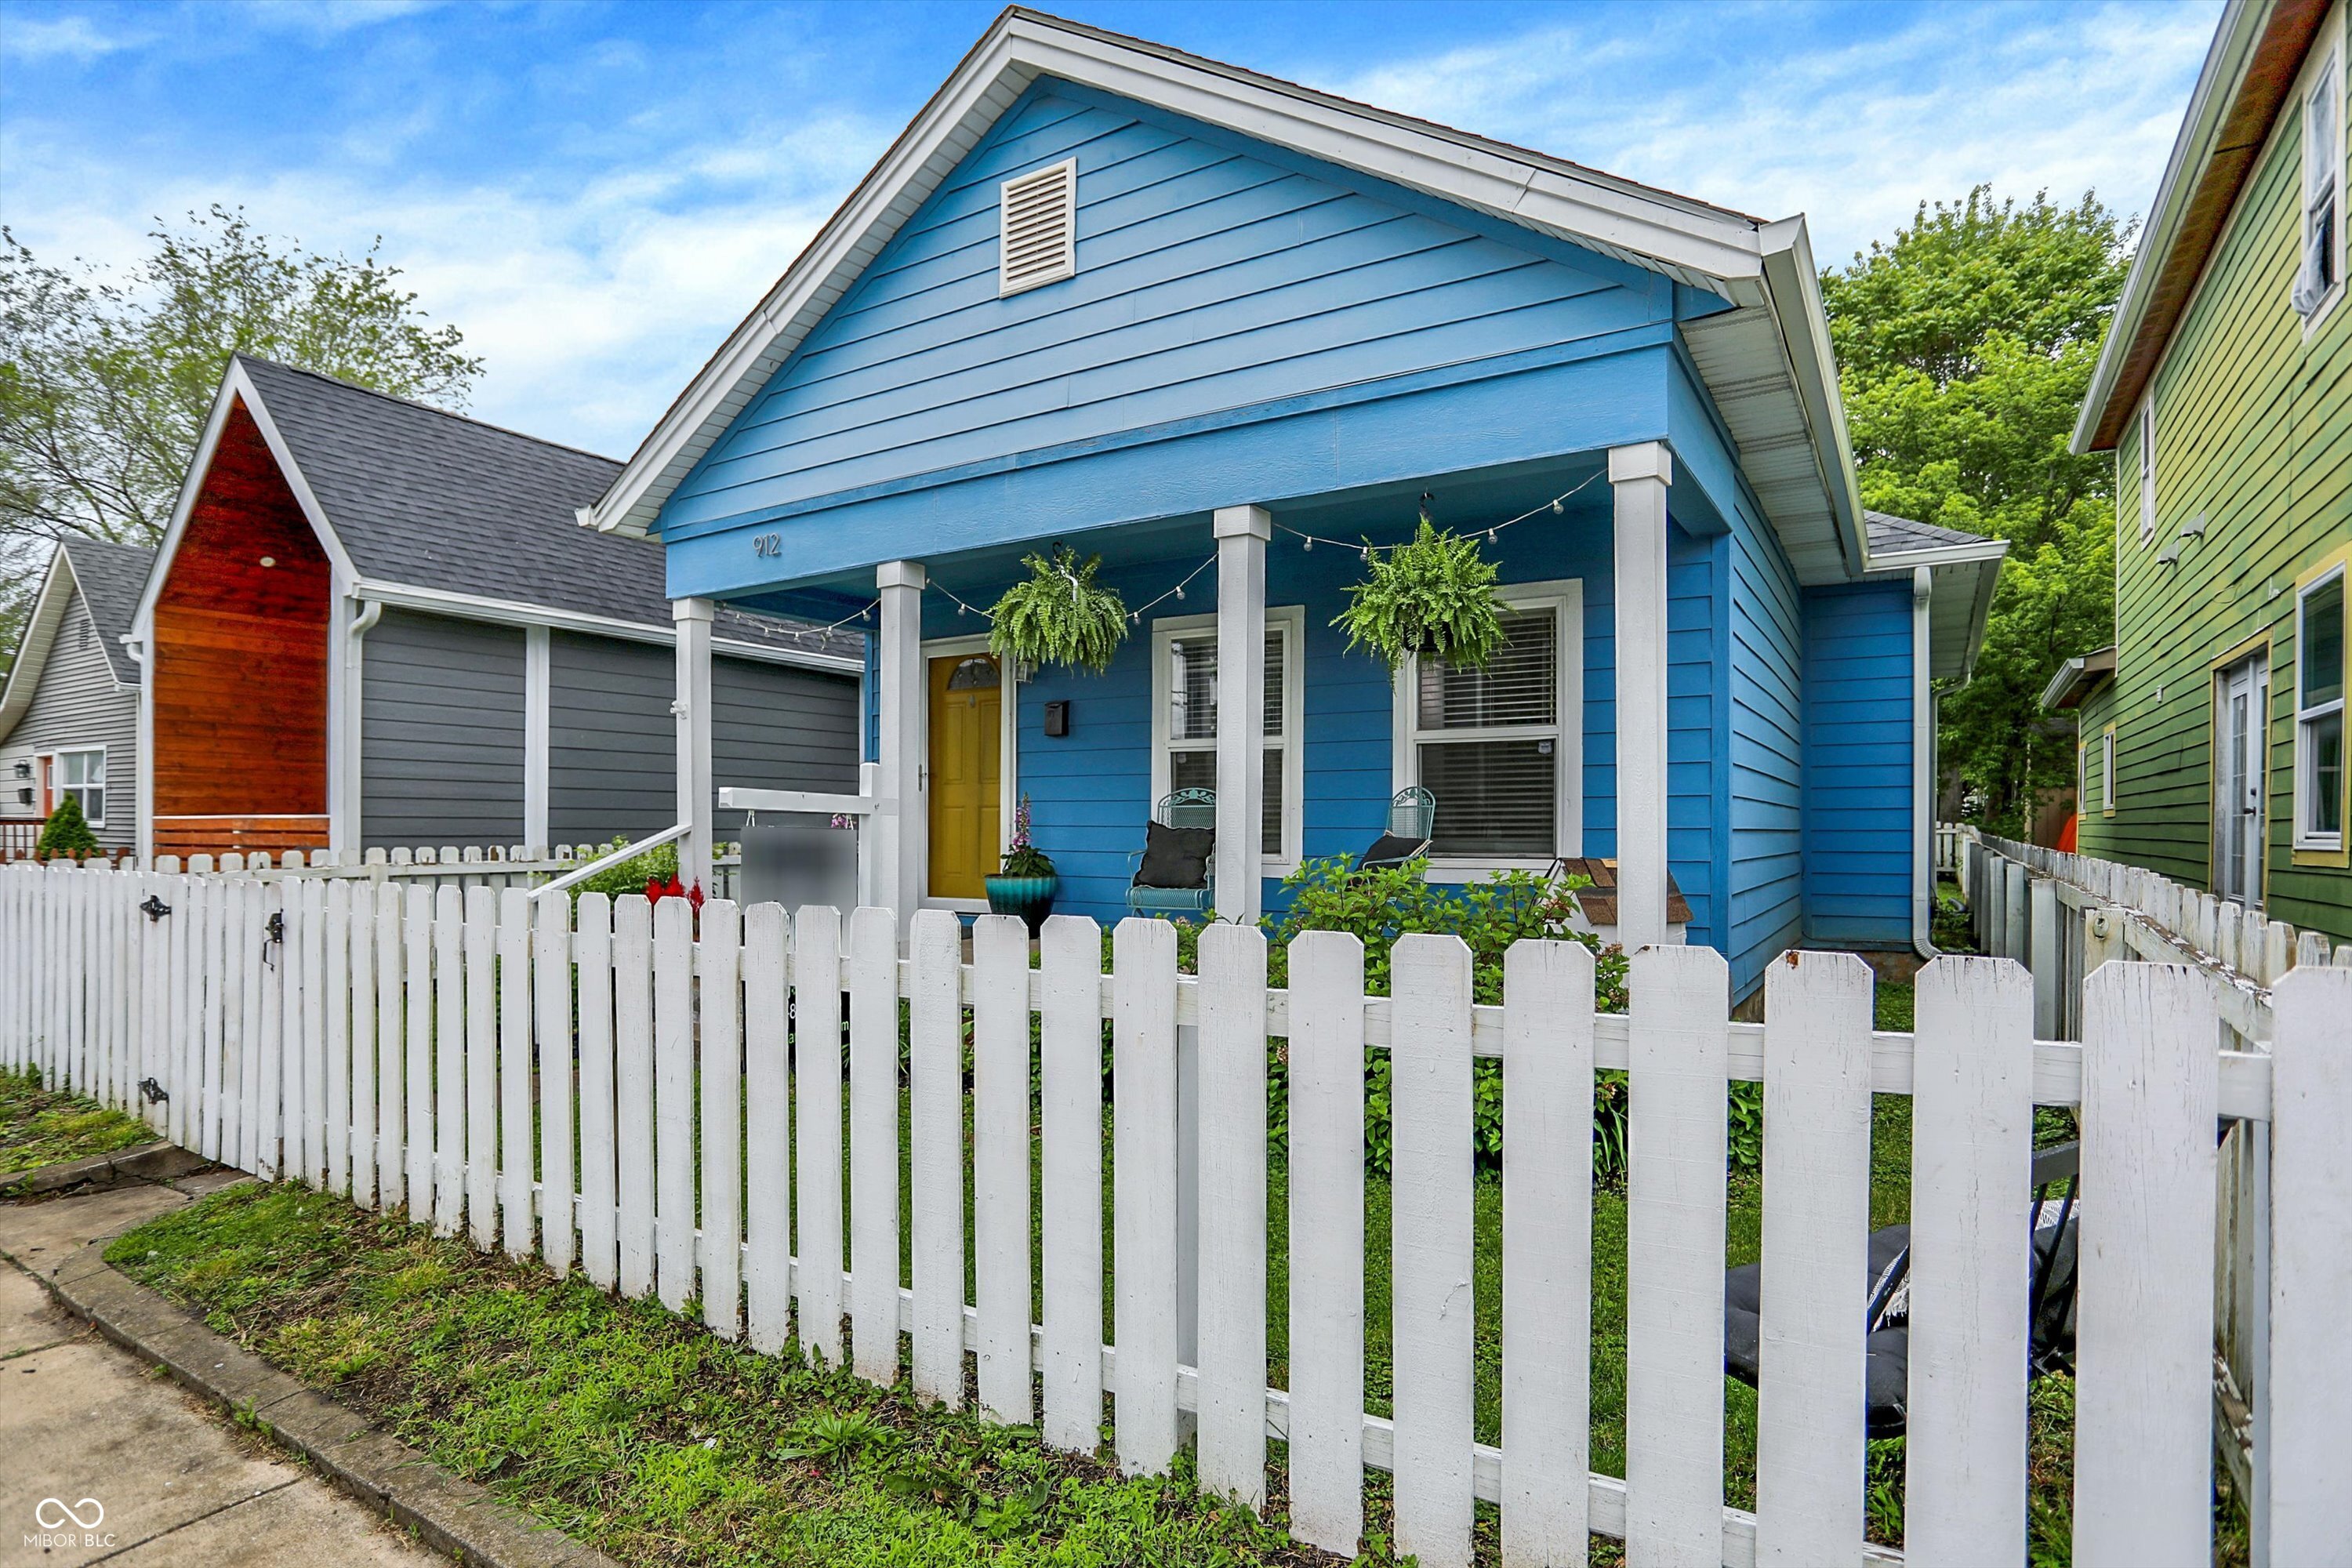
$190,000
2
bds
|
1
ba
|
994
sqft
|
built
2008
912 Harlan St, Indianapolis, IN 46203
$131
Cash flow
3.6%
Cash-on-Cash Return
7.0%
Cap rate
0.8%
Rent to Value Ratio
Active
$114,900
2
bds
|
1
ba
|
1,115
sqft
|
built
1890
834 N Temple Ave, Indianapolis, IN 46201
$170
Cash flow
7.7%
Cash-on-Cash Return
7.9%
Cap rate
1.0%
Rent to Value Ratio
Active
$114,900
3
bds
|
1
ba
|
2,048
sqft
|
built
1955
325 Harlan St, Indianapolis, IN 46201
$308
Cash flow
14.0%
Cash-on-Cash Return
9.4%
Cap rate
1.1%
Rent to Value Ratio
Active
$155,000
3
bds
|
1
ba
|
864
sqft
|
built
1968
1246 Mc Dougal St, Indianapolis, IN 46203
$103
Cash flow
3.5%
Cash-on-Cash Return
6.9%
Cap rate
0.8%
Rent to Value Ratio
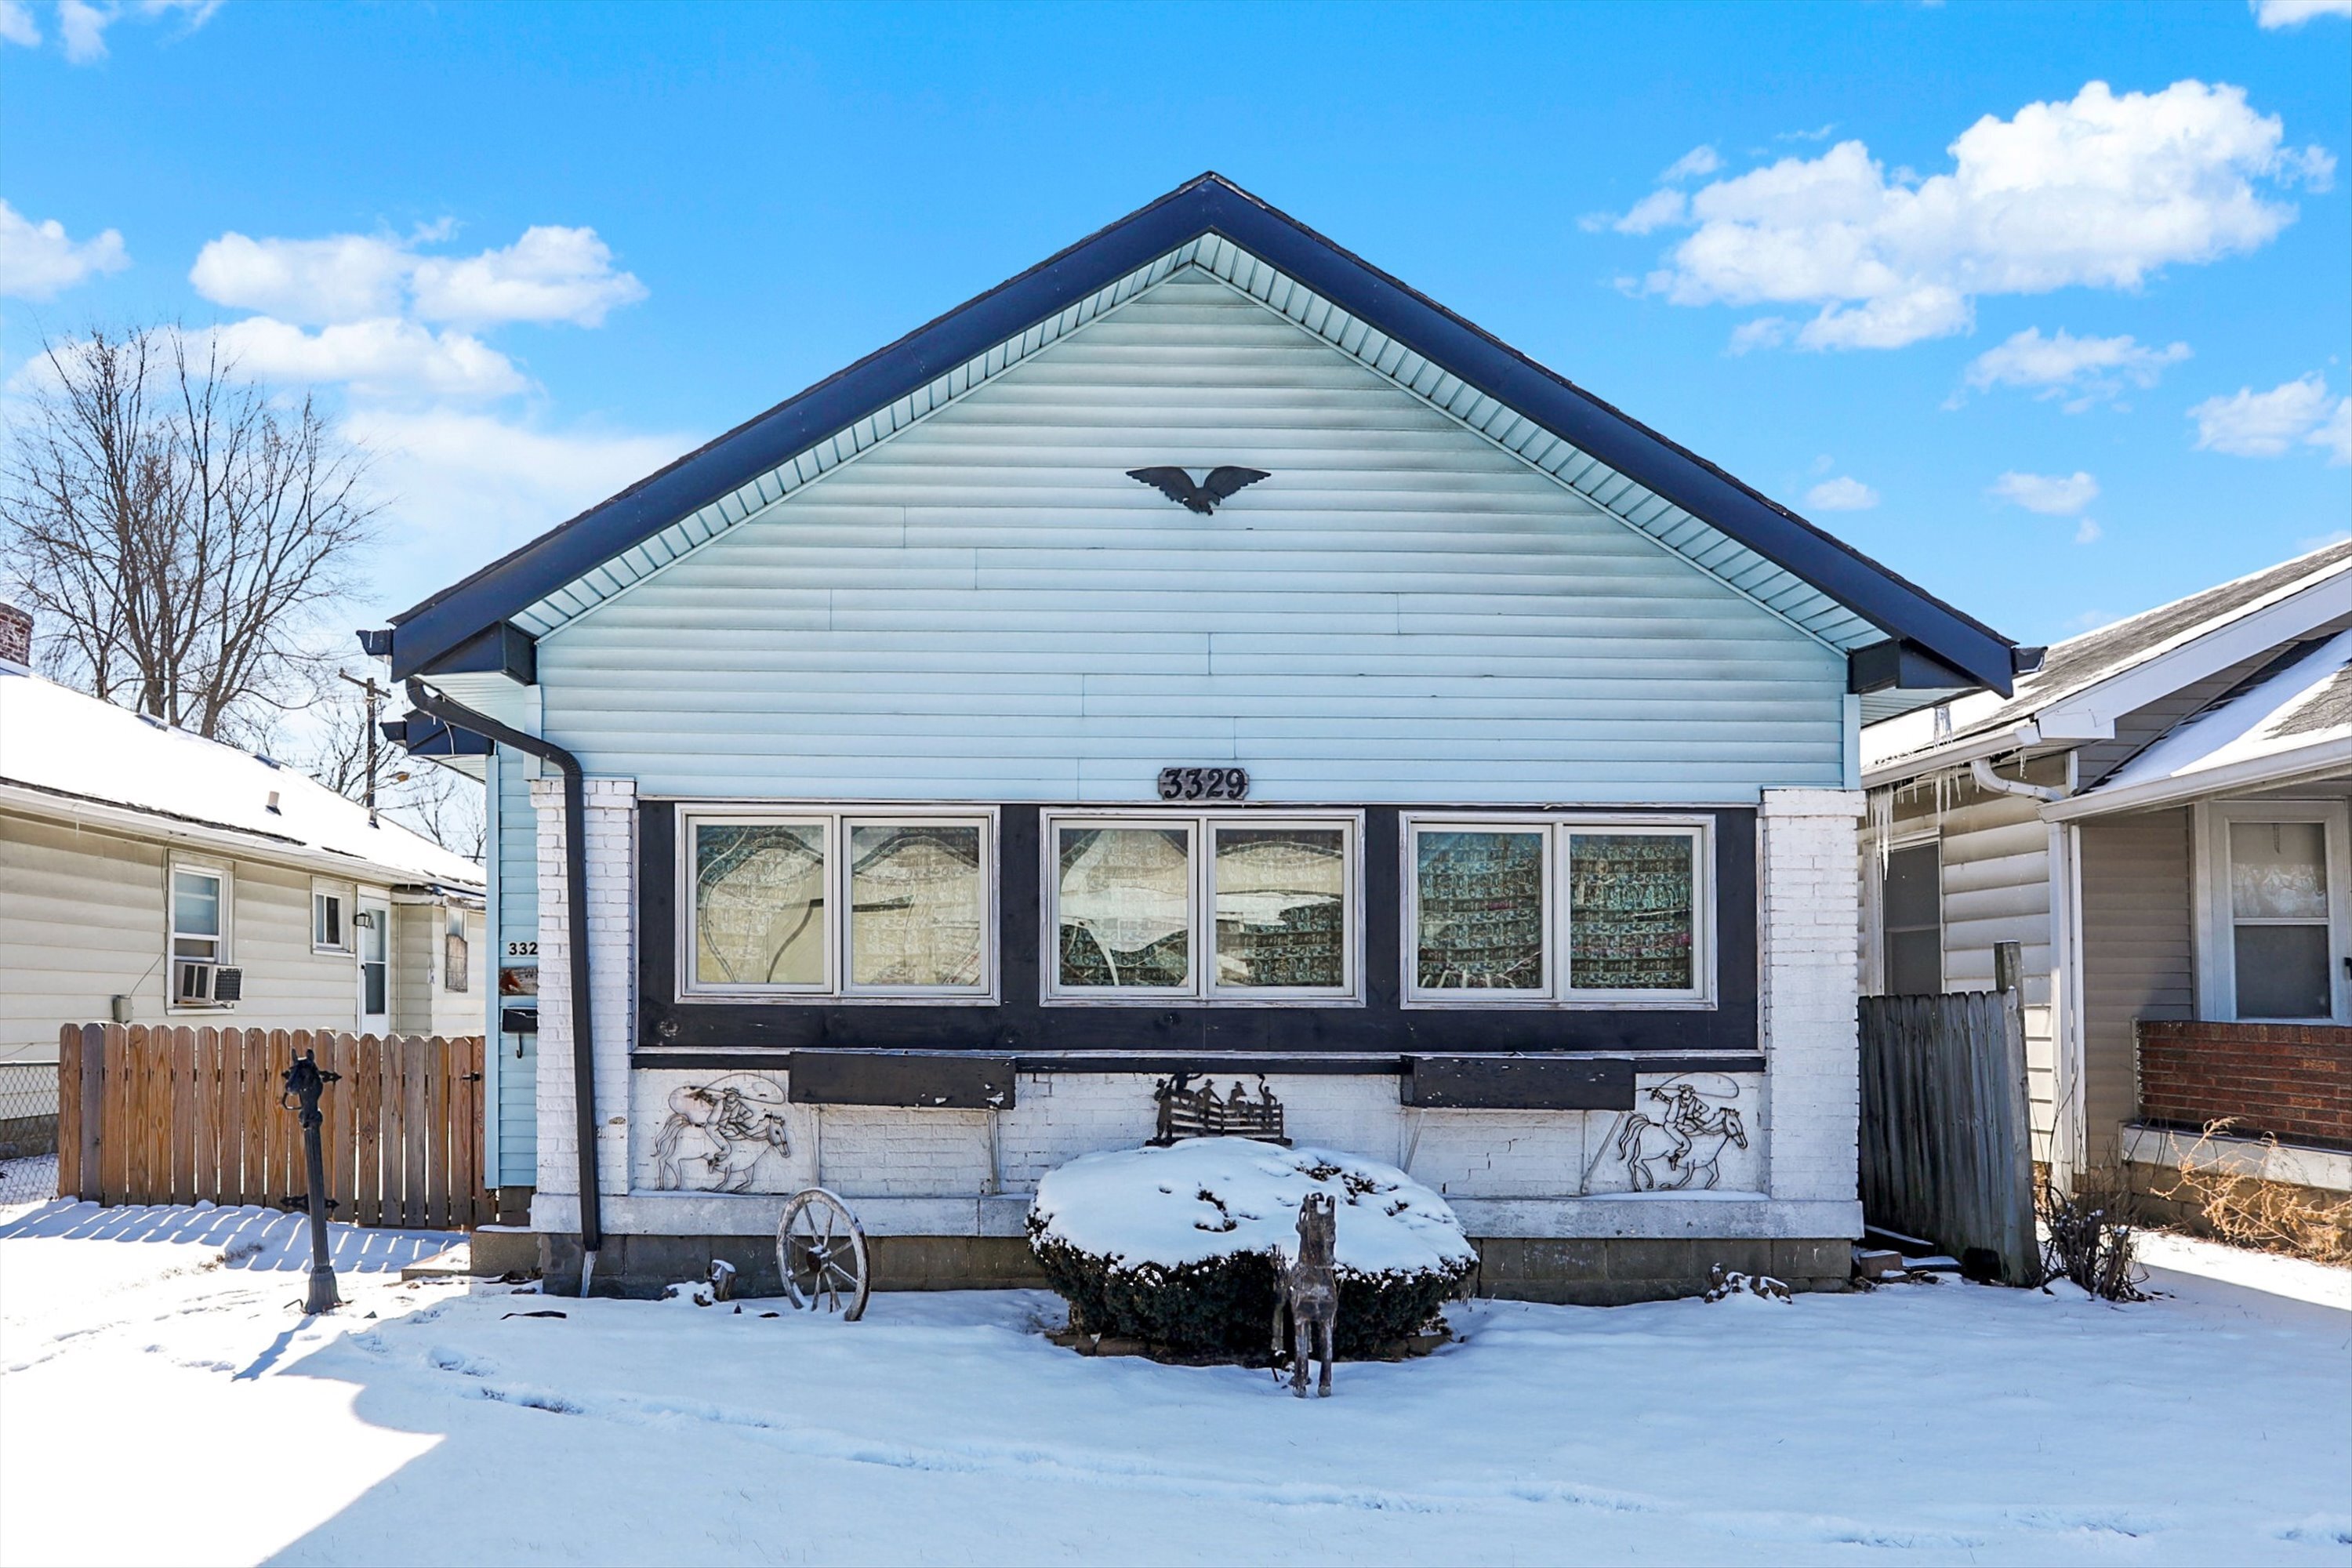
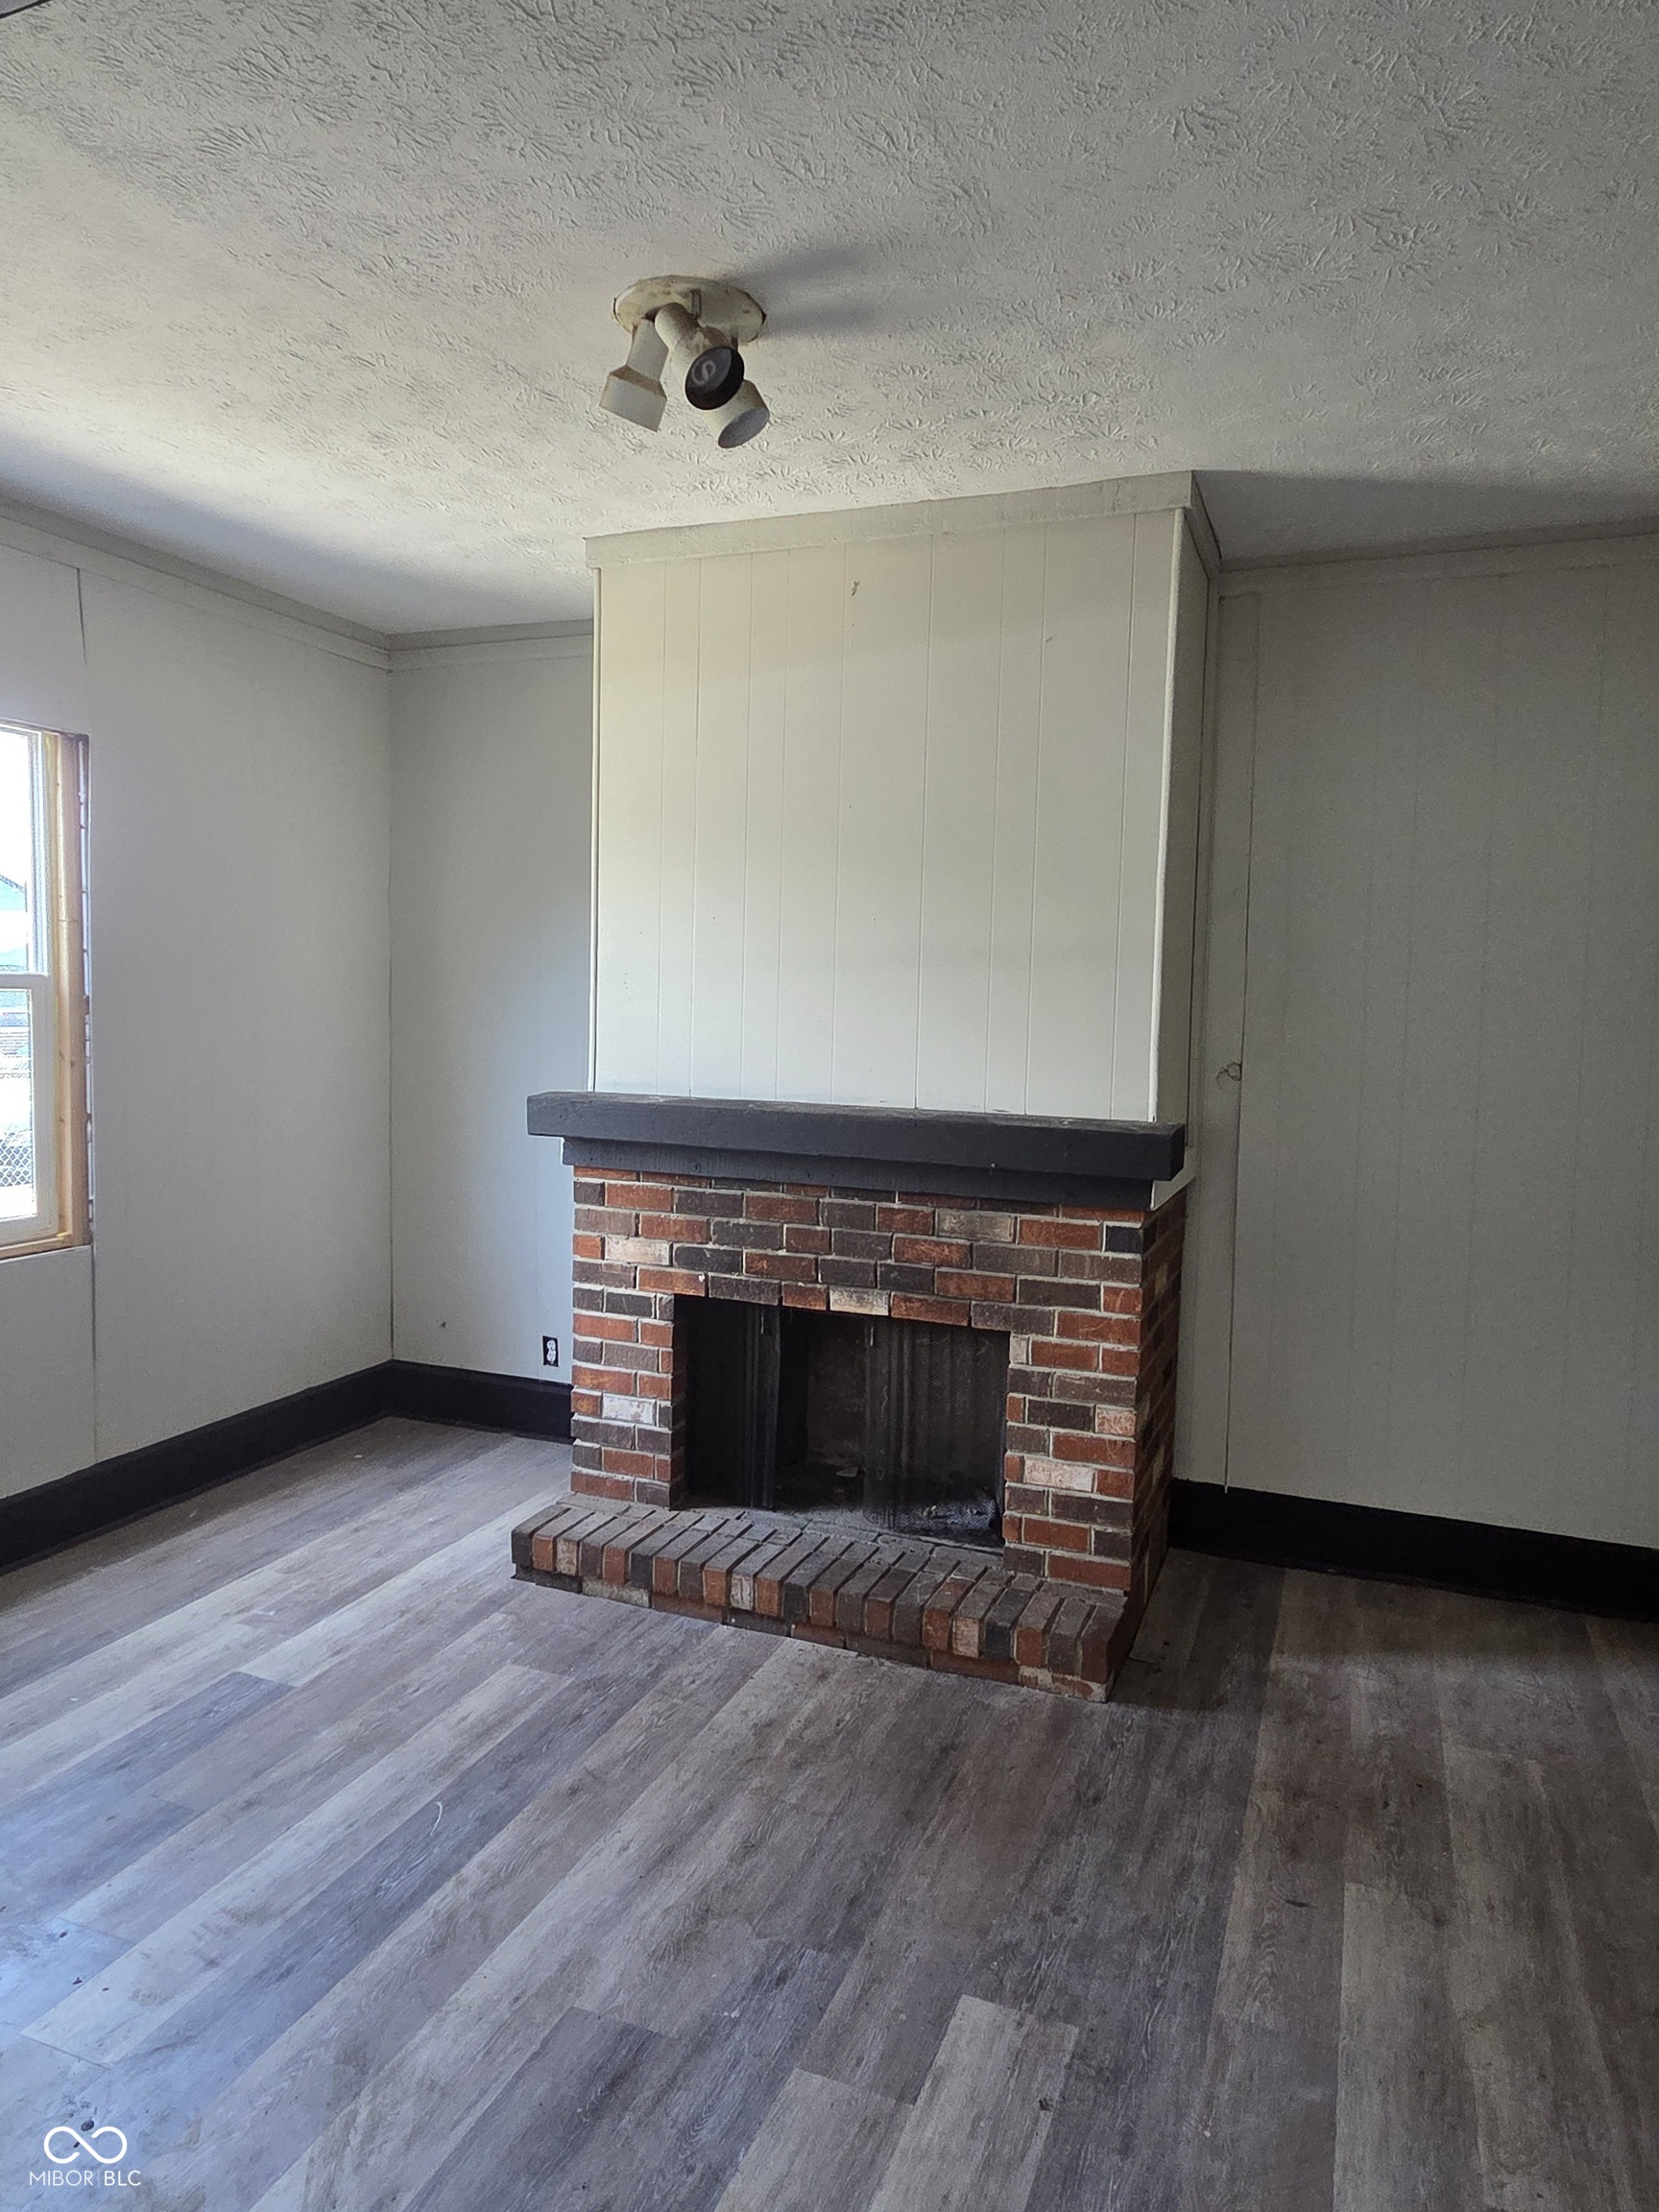
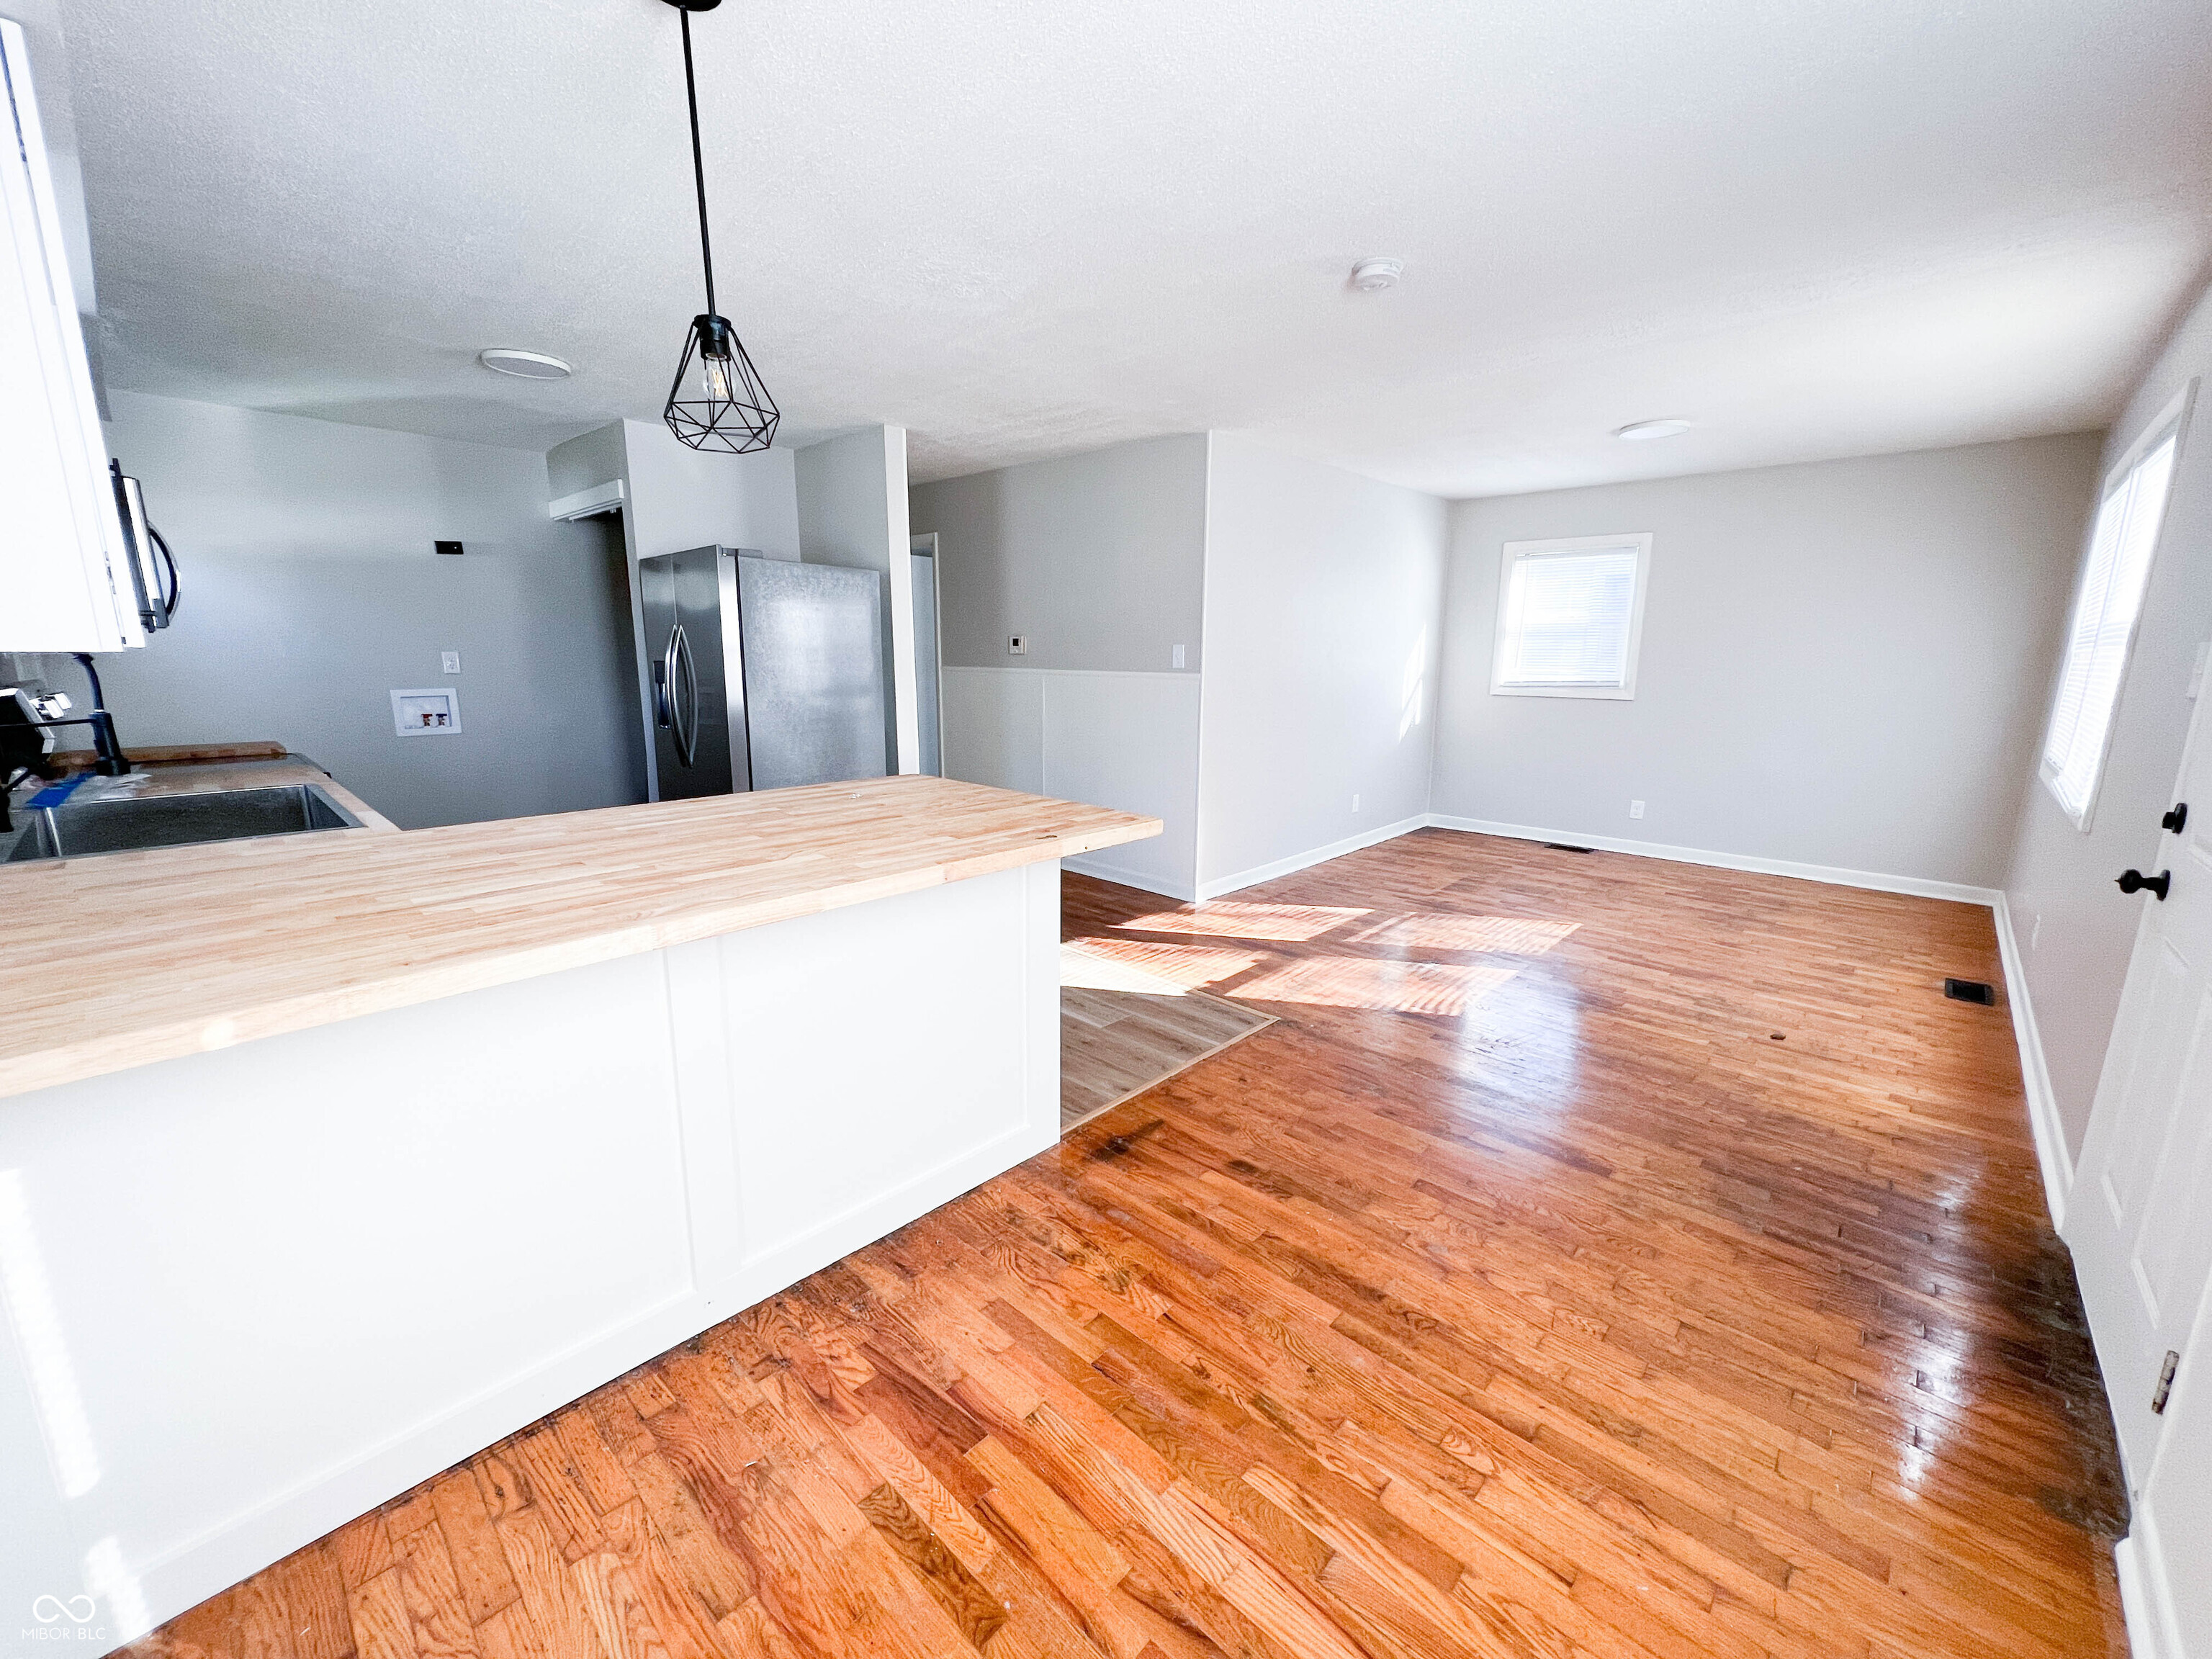
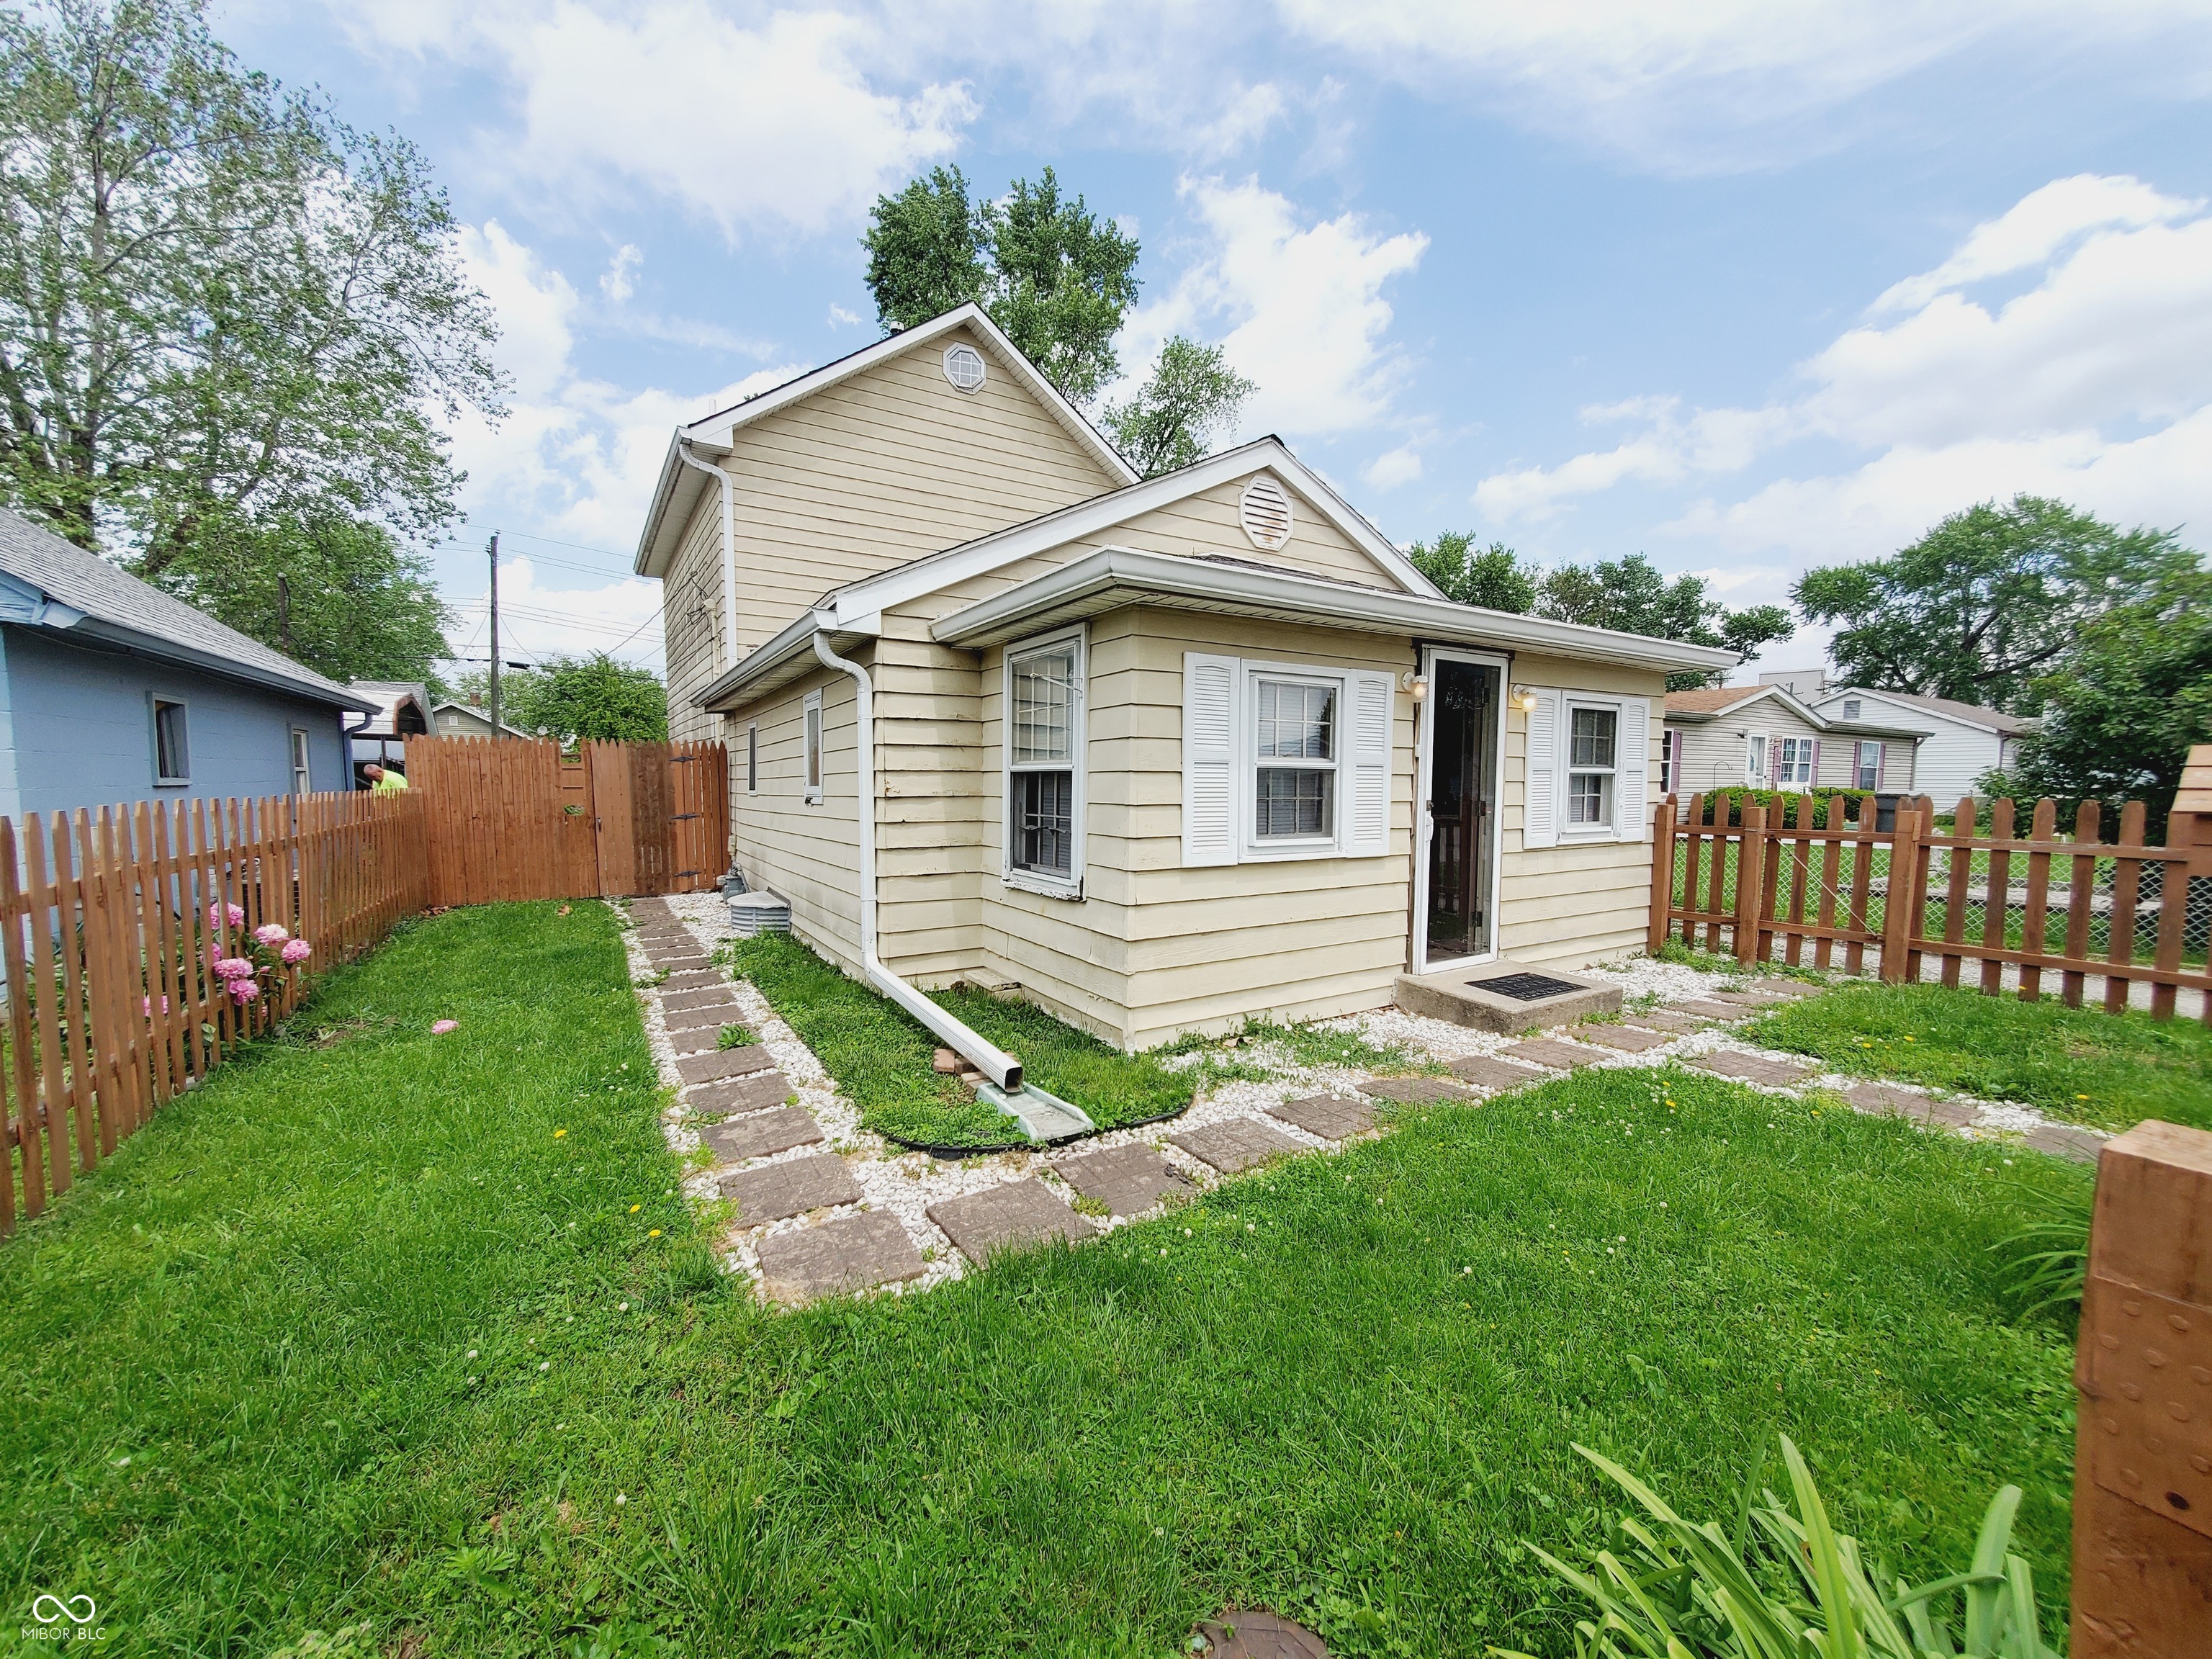
Active
$159,000
2
bds
|
2
ba
|
1,094
sqft
|
built
1932
3329 W 10th St, Indianapolis, IN 46222
$152
Cash flow
5.0%
Cash-on-Cash Return
7.3%
Cap rate
0.9%
Rent to Value Ratio
Active
$129,000
2
bds
|
2
ba
|
1,491
sqft
|
built
1940
704 E Perry St, Indianapolis, IN 46227
$305
Cash flow
12.3%
Cash-on-Cash Return
9.0%
Cap rate
1.1%
Rent to Value Ratio
Active
$165,000
5
bds
|
2
ba
|
1,036
sqft
|
built
2004
6215 E 11th St, Indianapolis, IN 46219
$52
Cash flow
1.6%
Cash-on-Cash Return
6.5%
Cap rate
0.8%
Rent to Value Ratio
Active
$185,000
3
bds
|
1
ba
|
1,421
sqft
|
built
1961
8902 Carla Dr, Indianapolis, IN 46219
$156
Cash flow
4.4%
Cash-on-Cash Return
7.2%
Cap rate
0.9%
Rent to Value Ratio
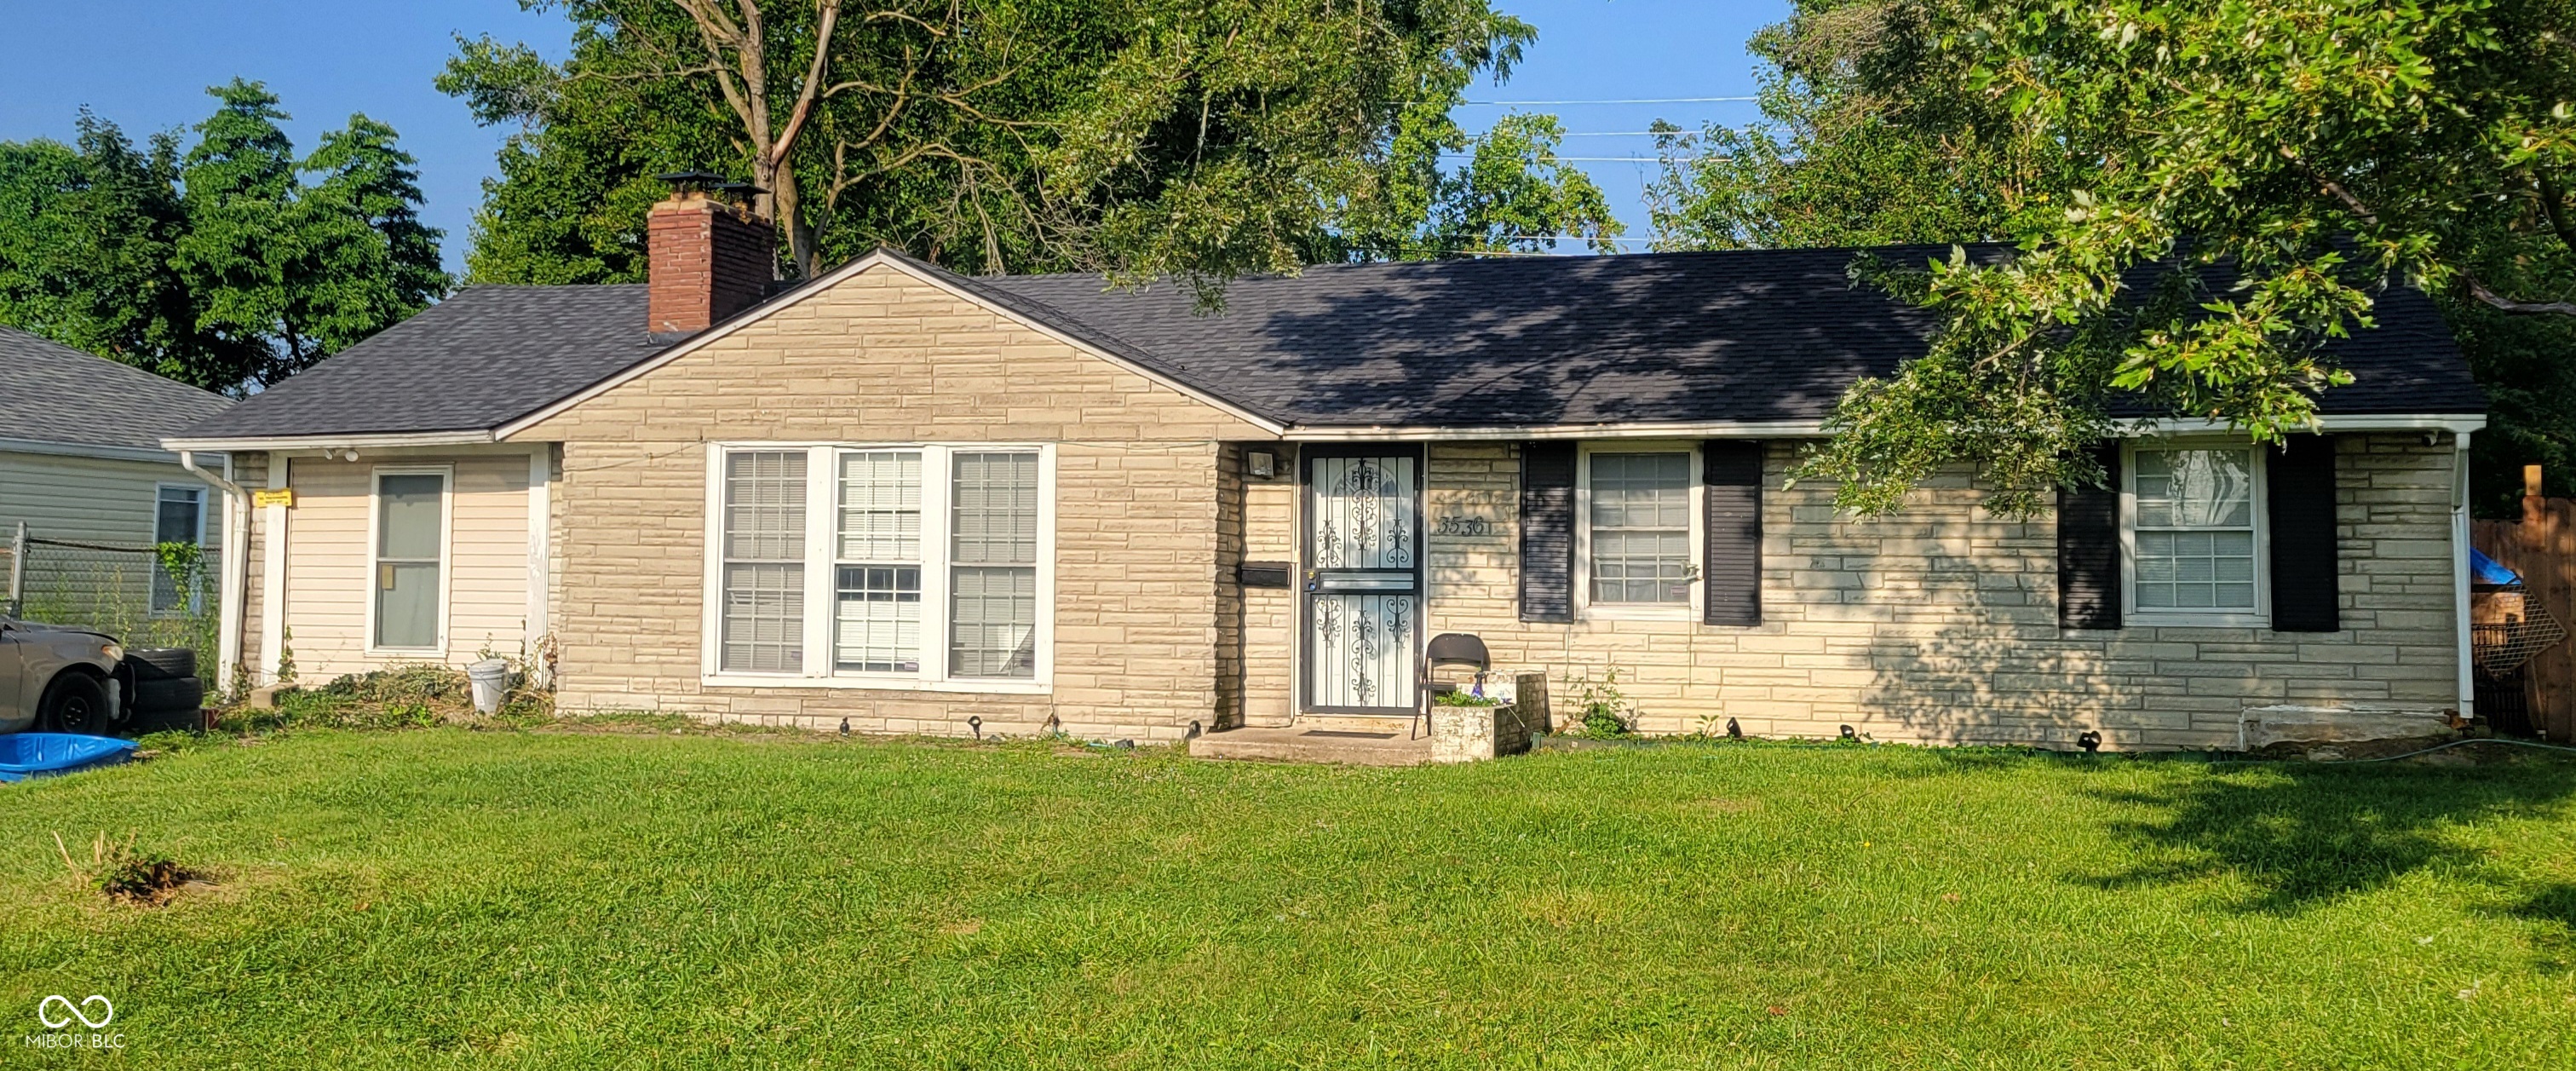
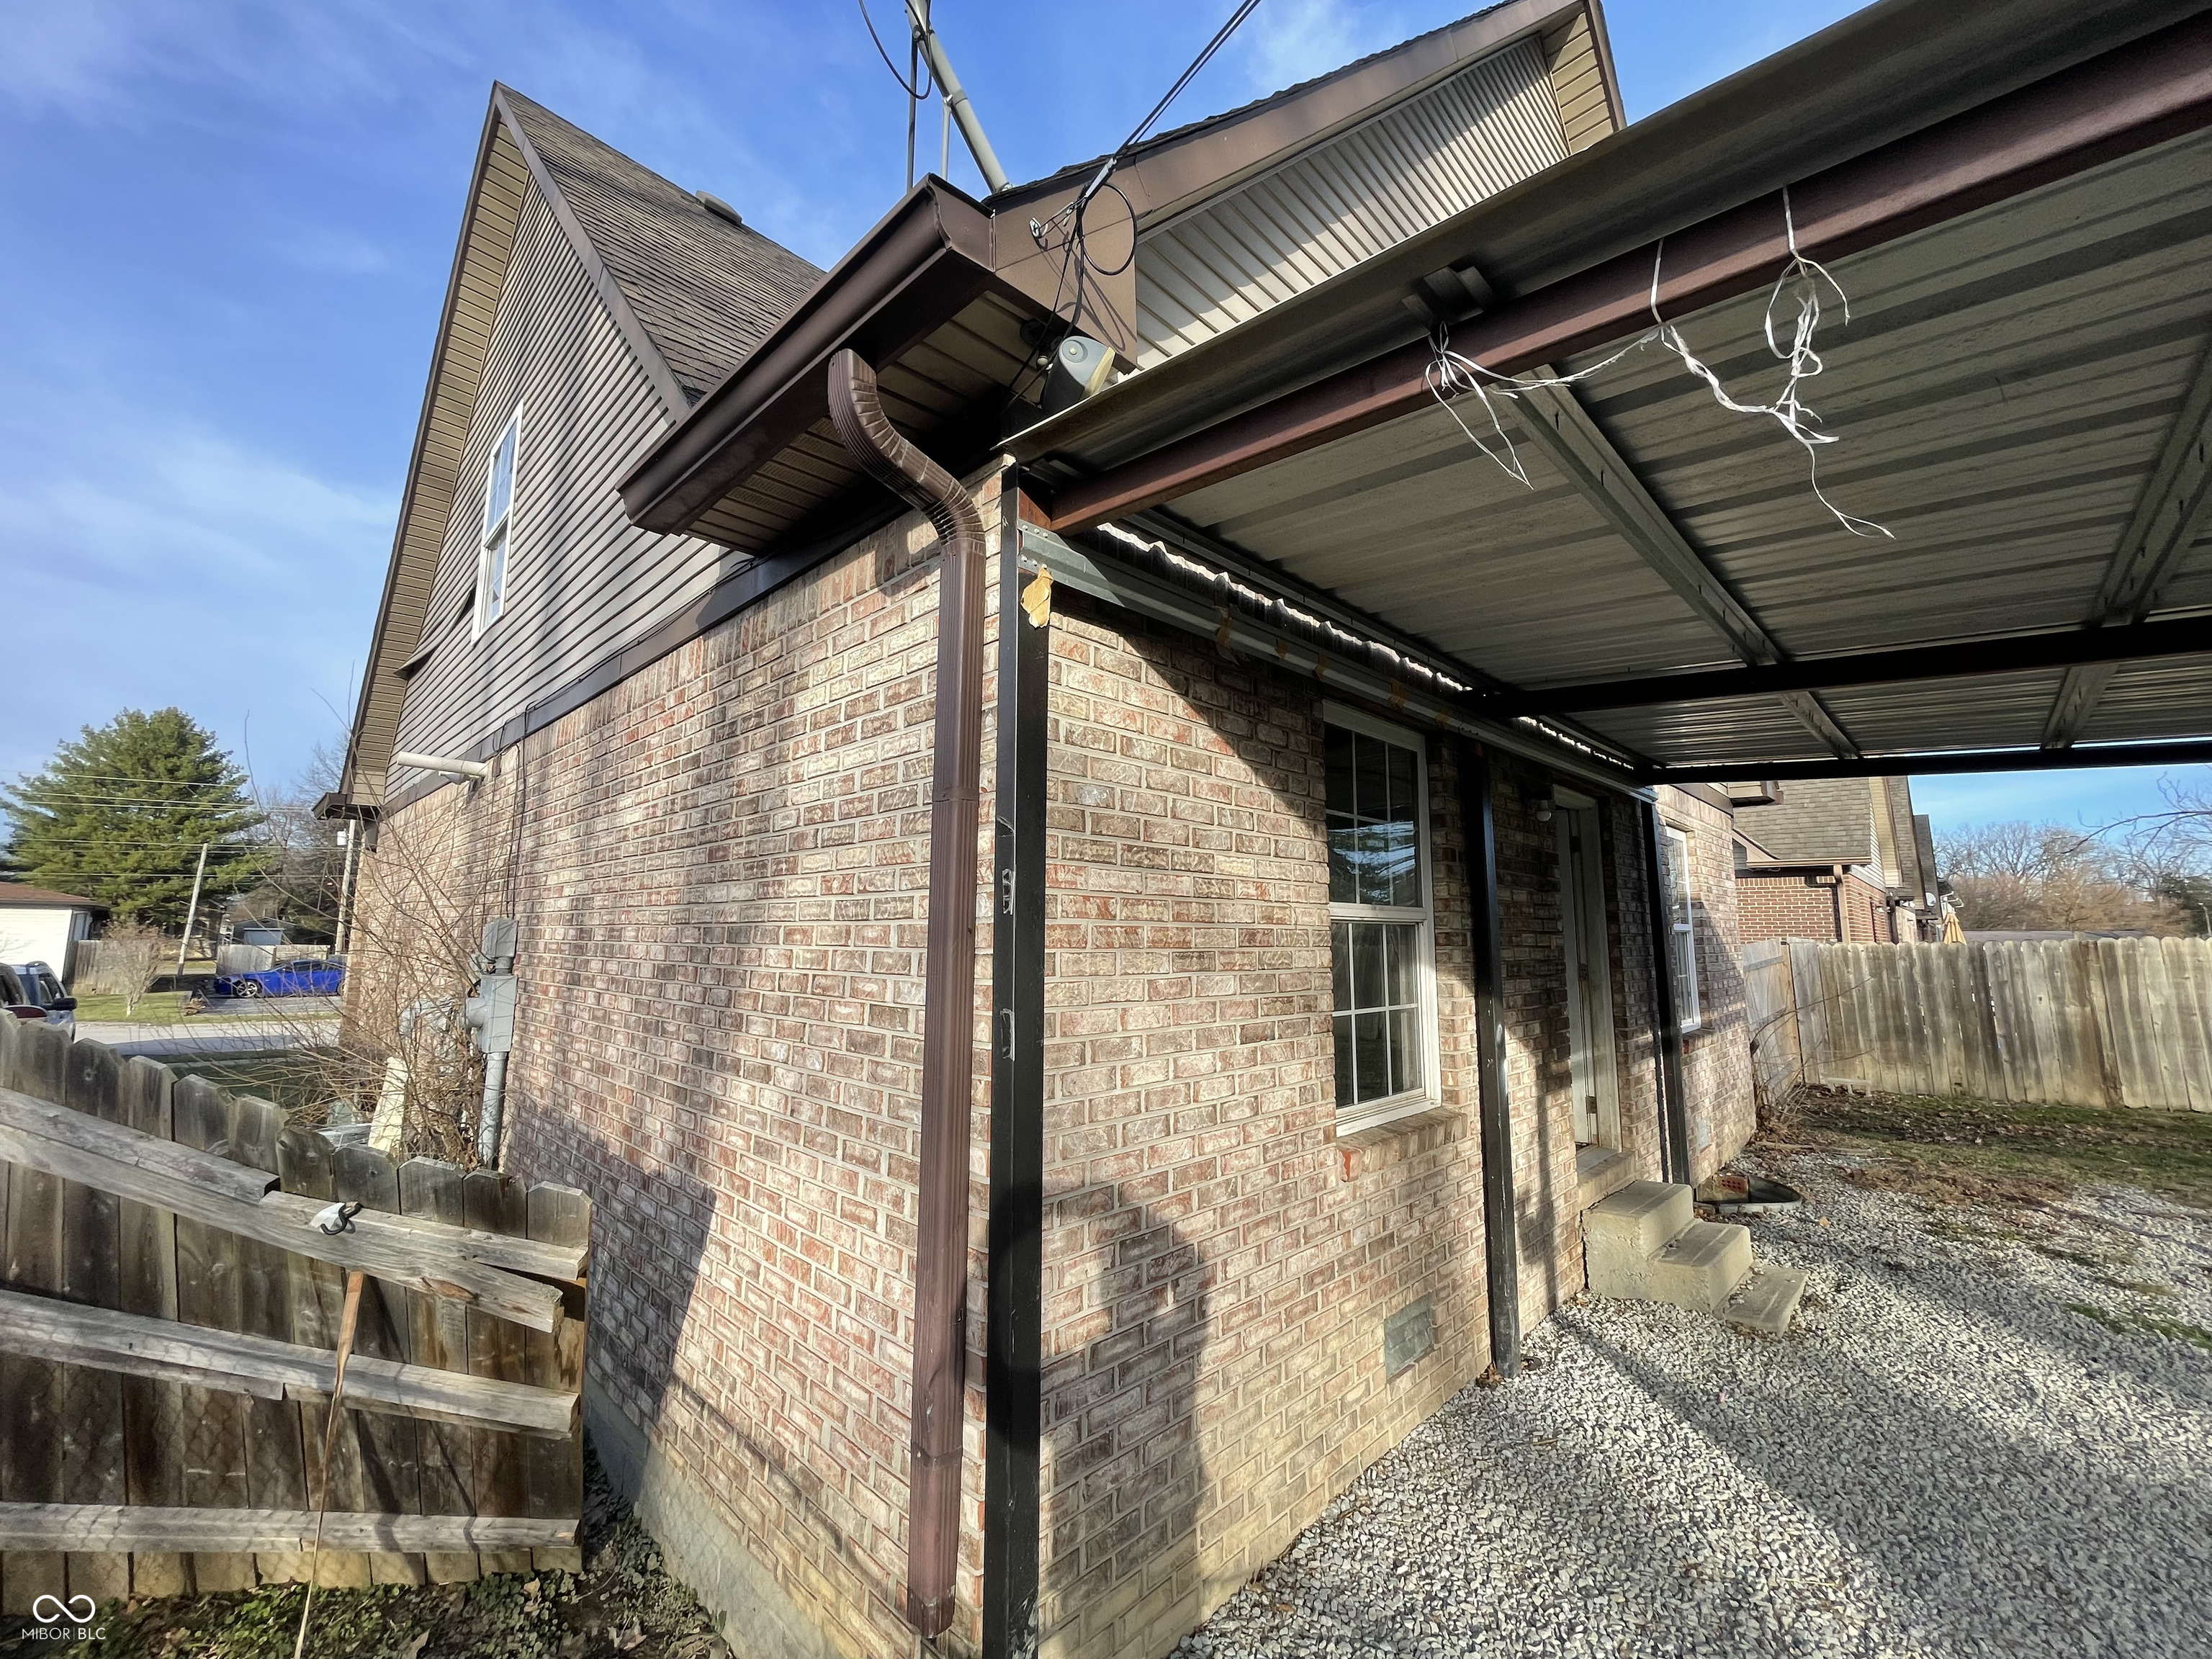
Active
$125,000
3
bds
|
1
ba
|
1,140
sqft
|
built
1953
3536 N Audubon Rd, Indianapolis, IN 46218
$119
Cash flow
5.0%
Cash-on-Cash Return
7.3%
Cap rate
0.9%
Rent to Value Ratio
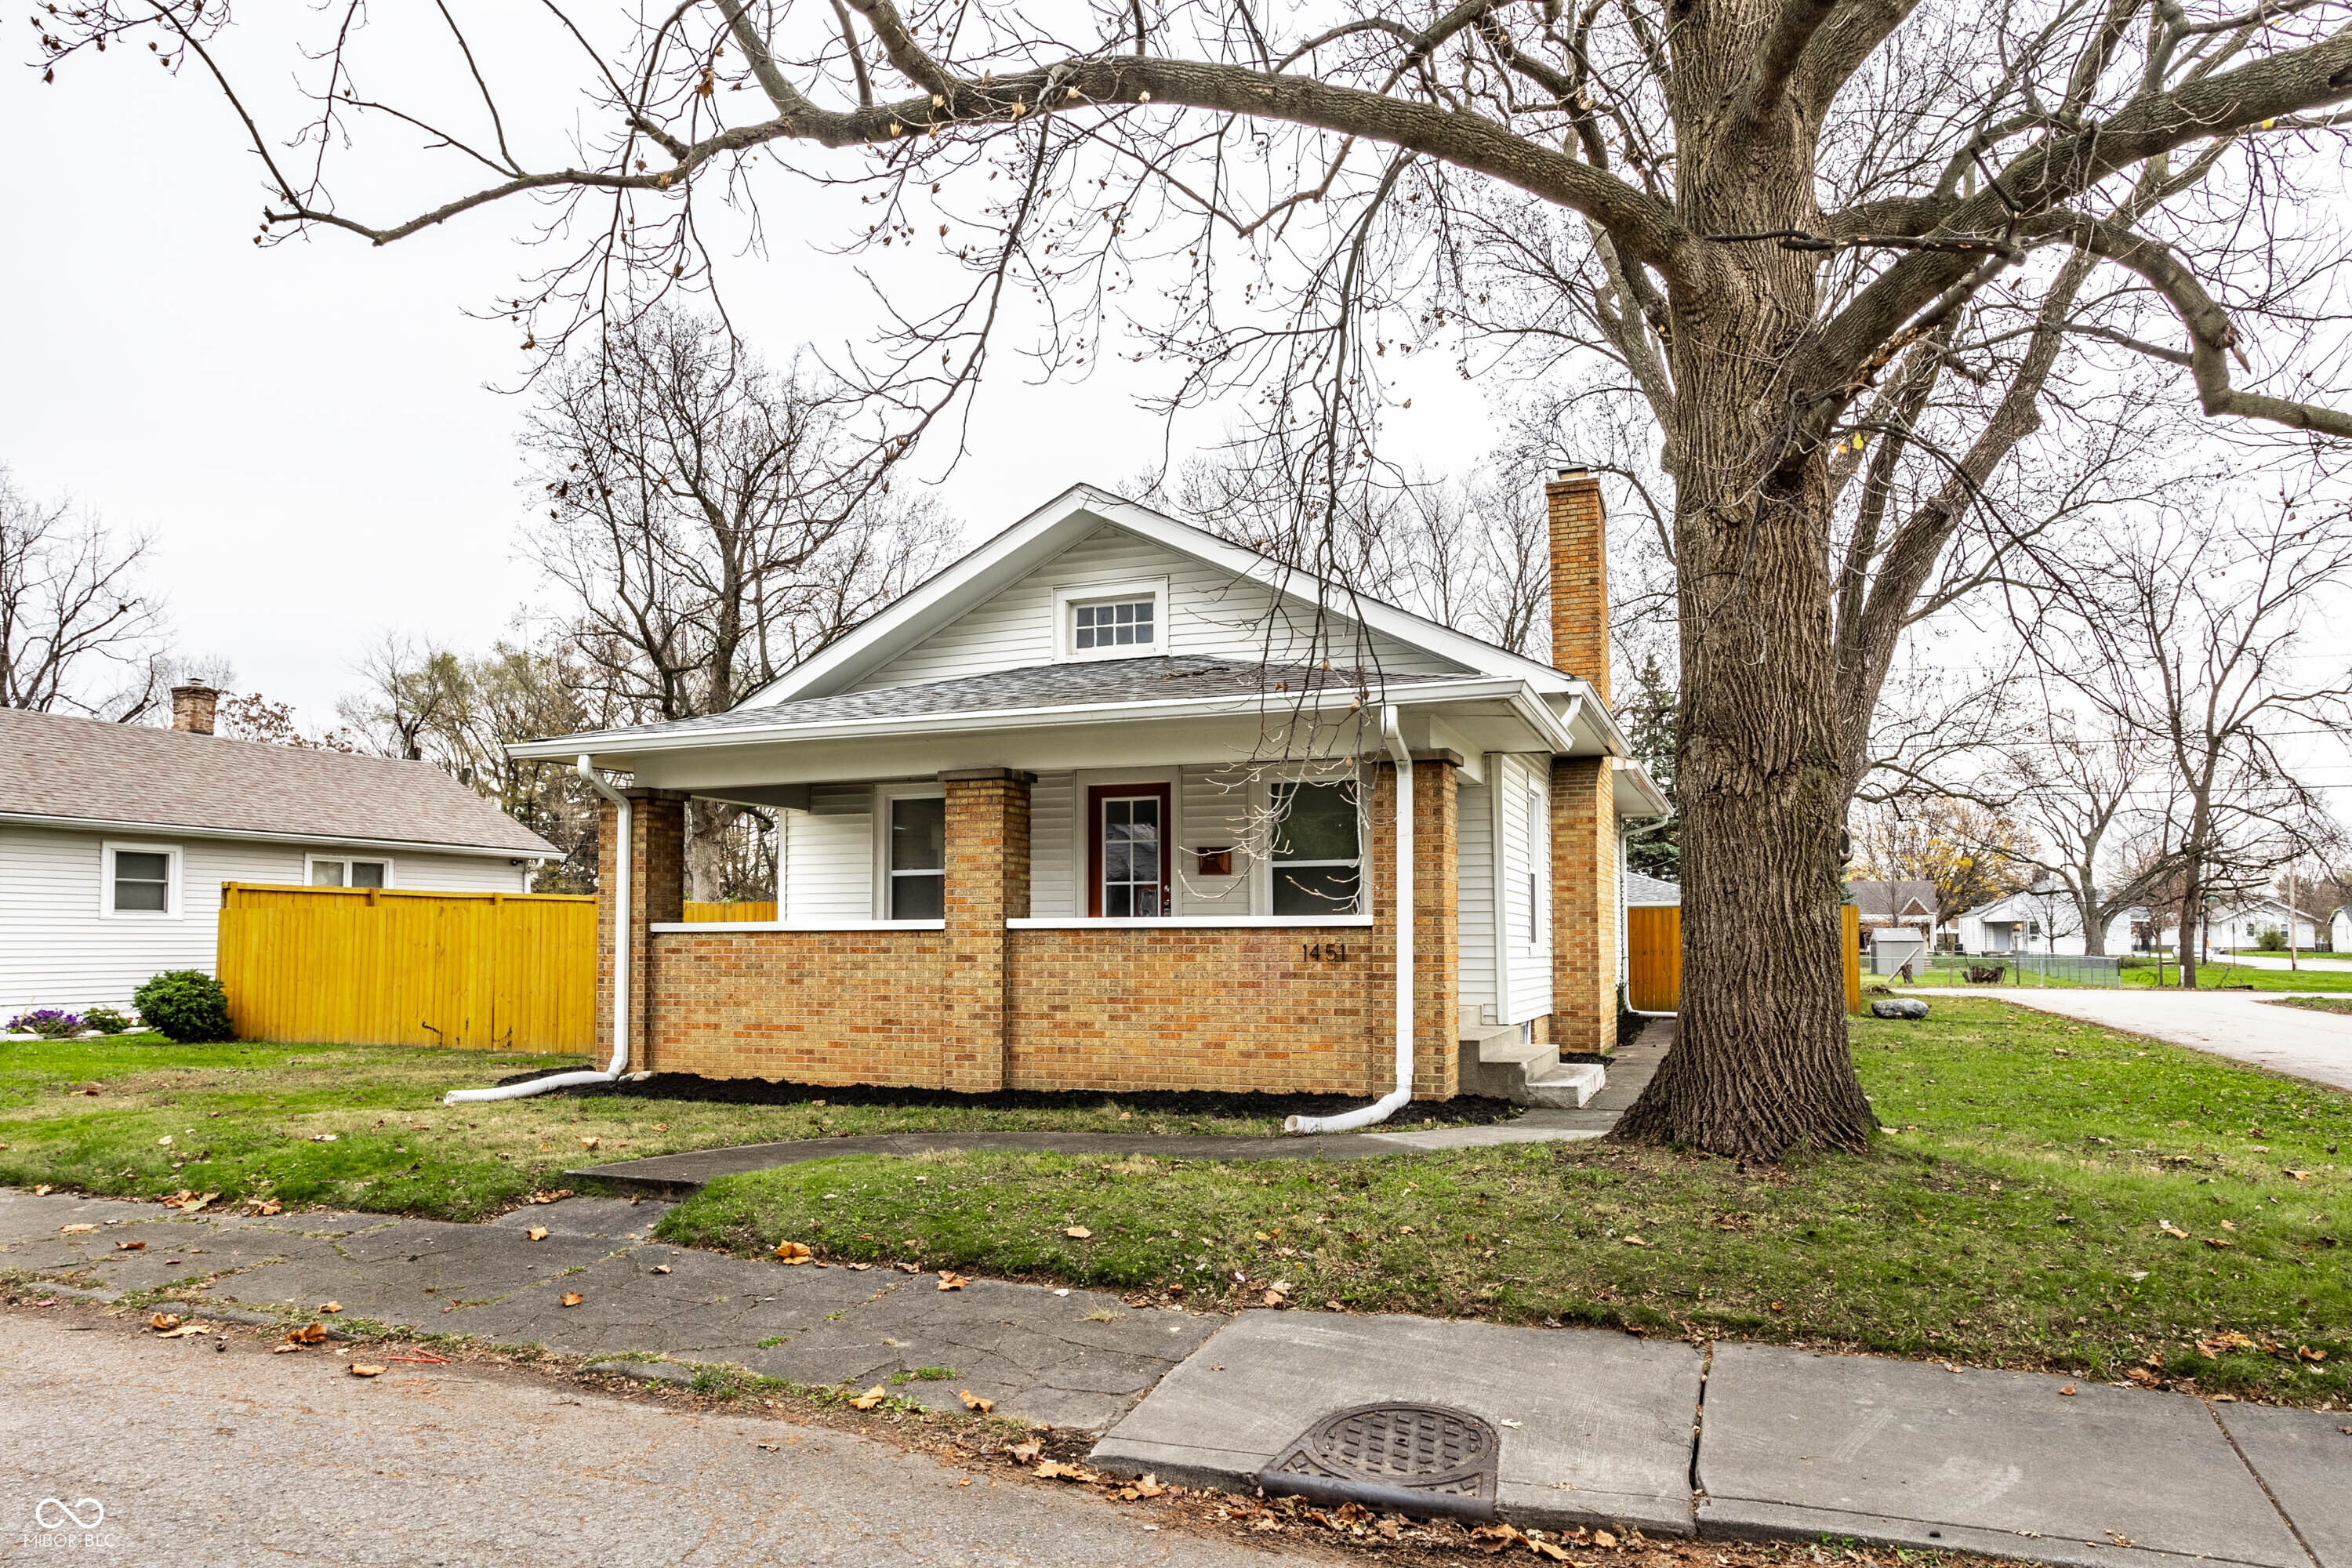
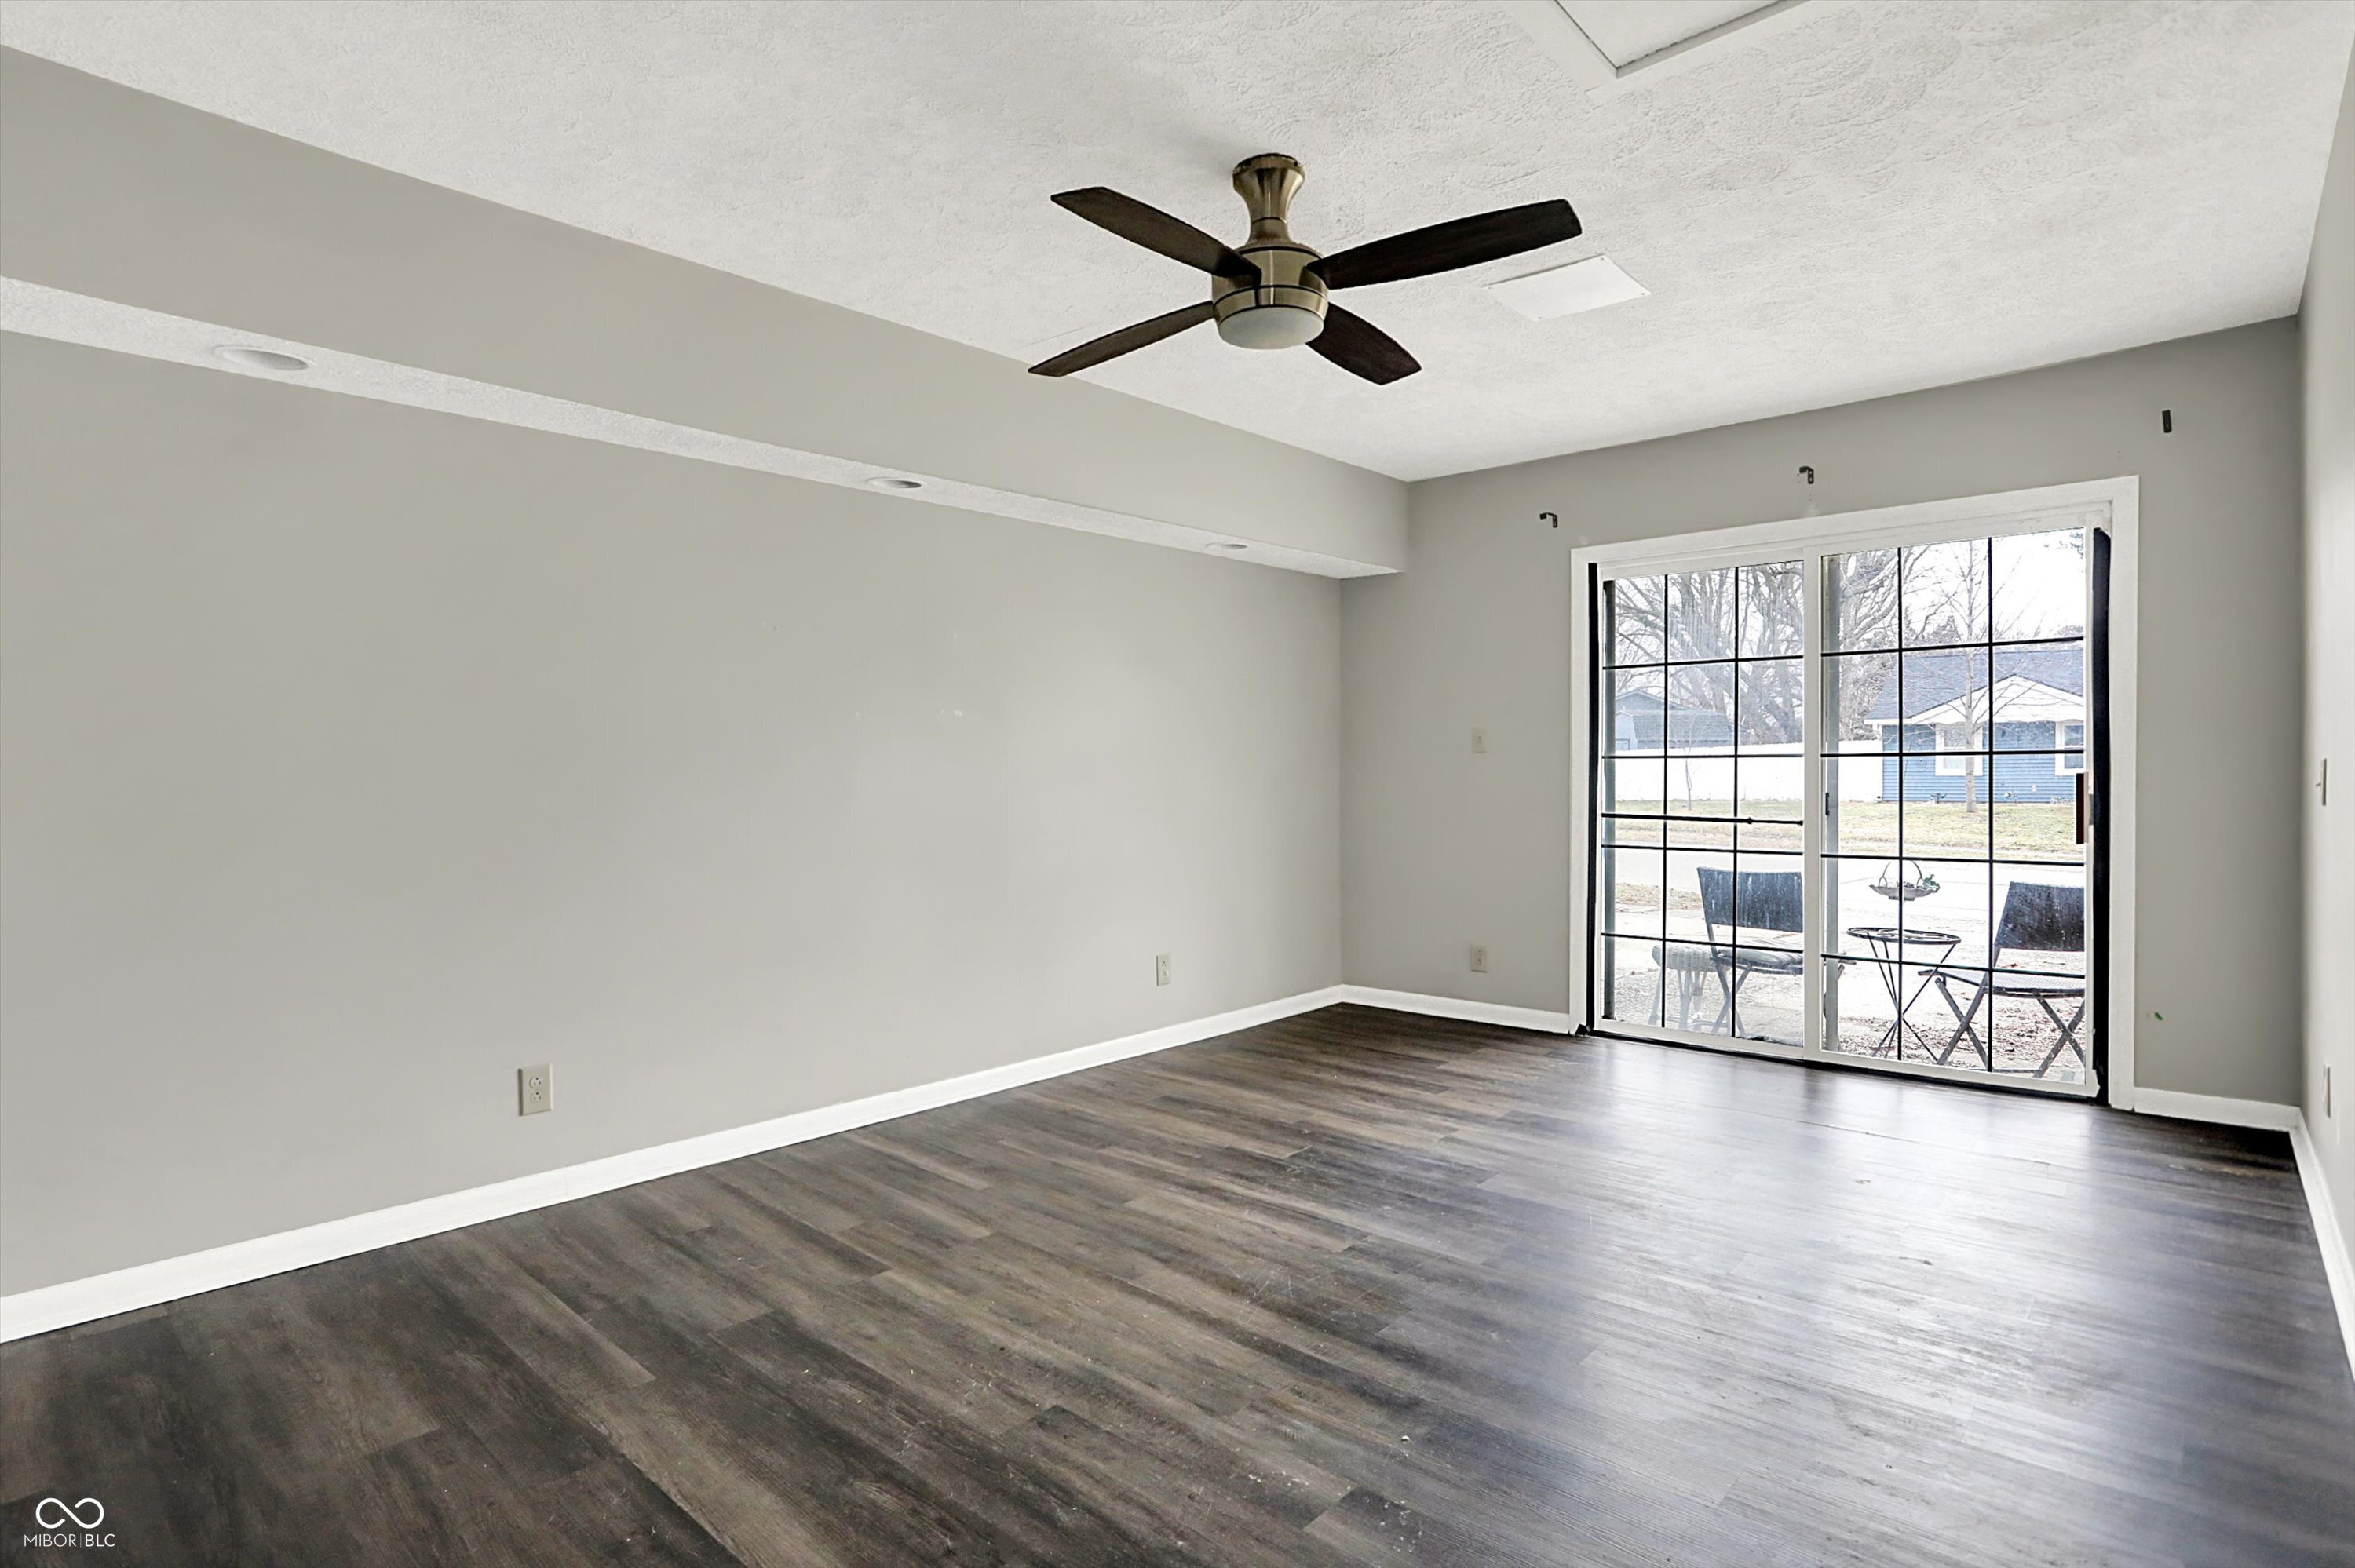
Pending
$225,000
2
bds
|
1
ba
|
1,084
sqft
|
built
1910
1451 N Grant Ave, Indianapolis, IN 46201
$227
Cash flow
5.3%
Cash-on-Cash Return
7.4%
Cap rate
0.9%
Rent to Value Ratio
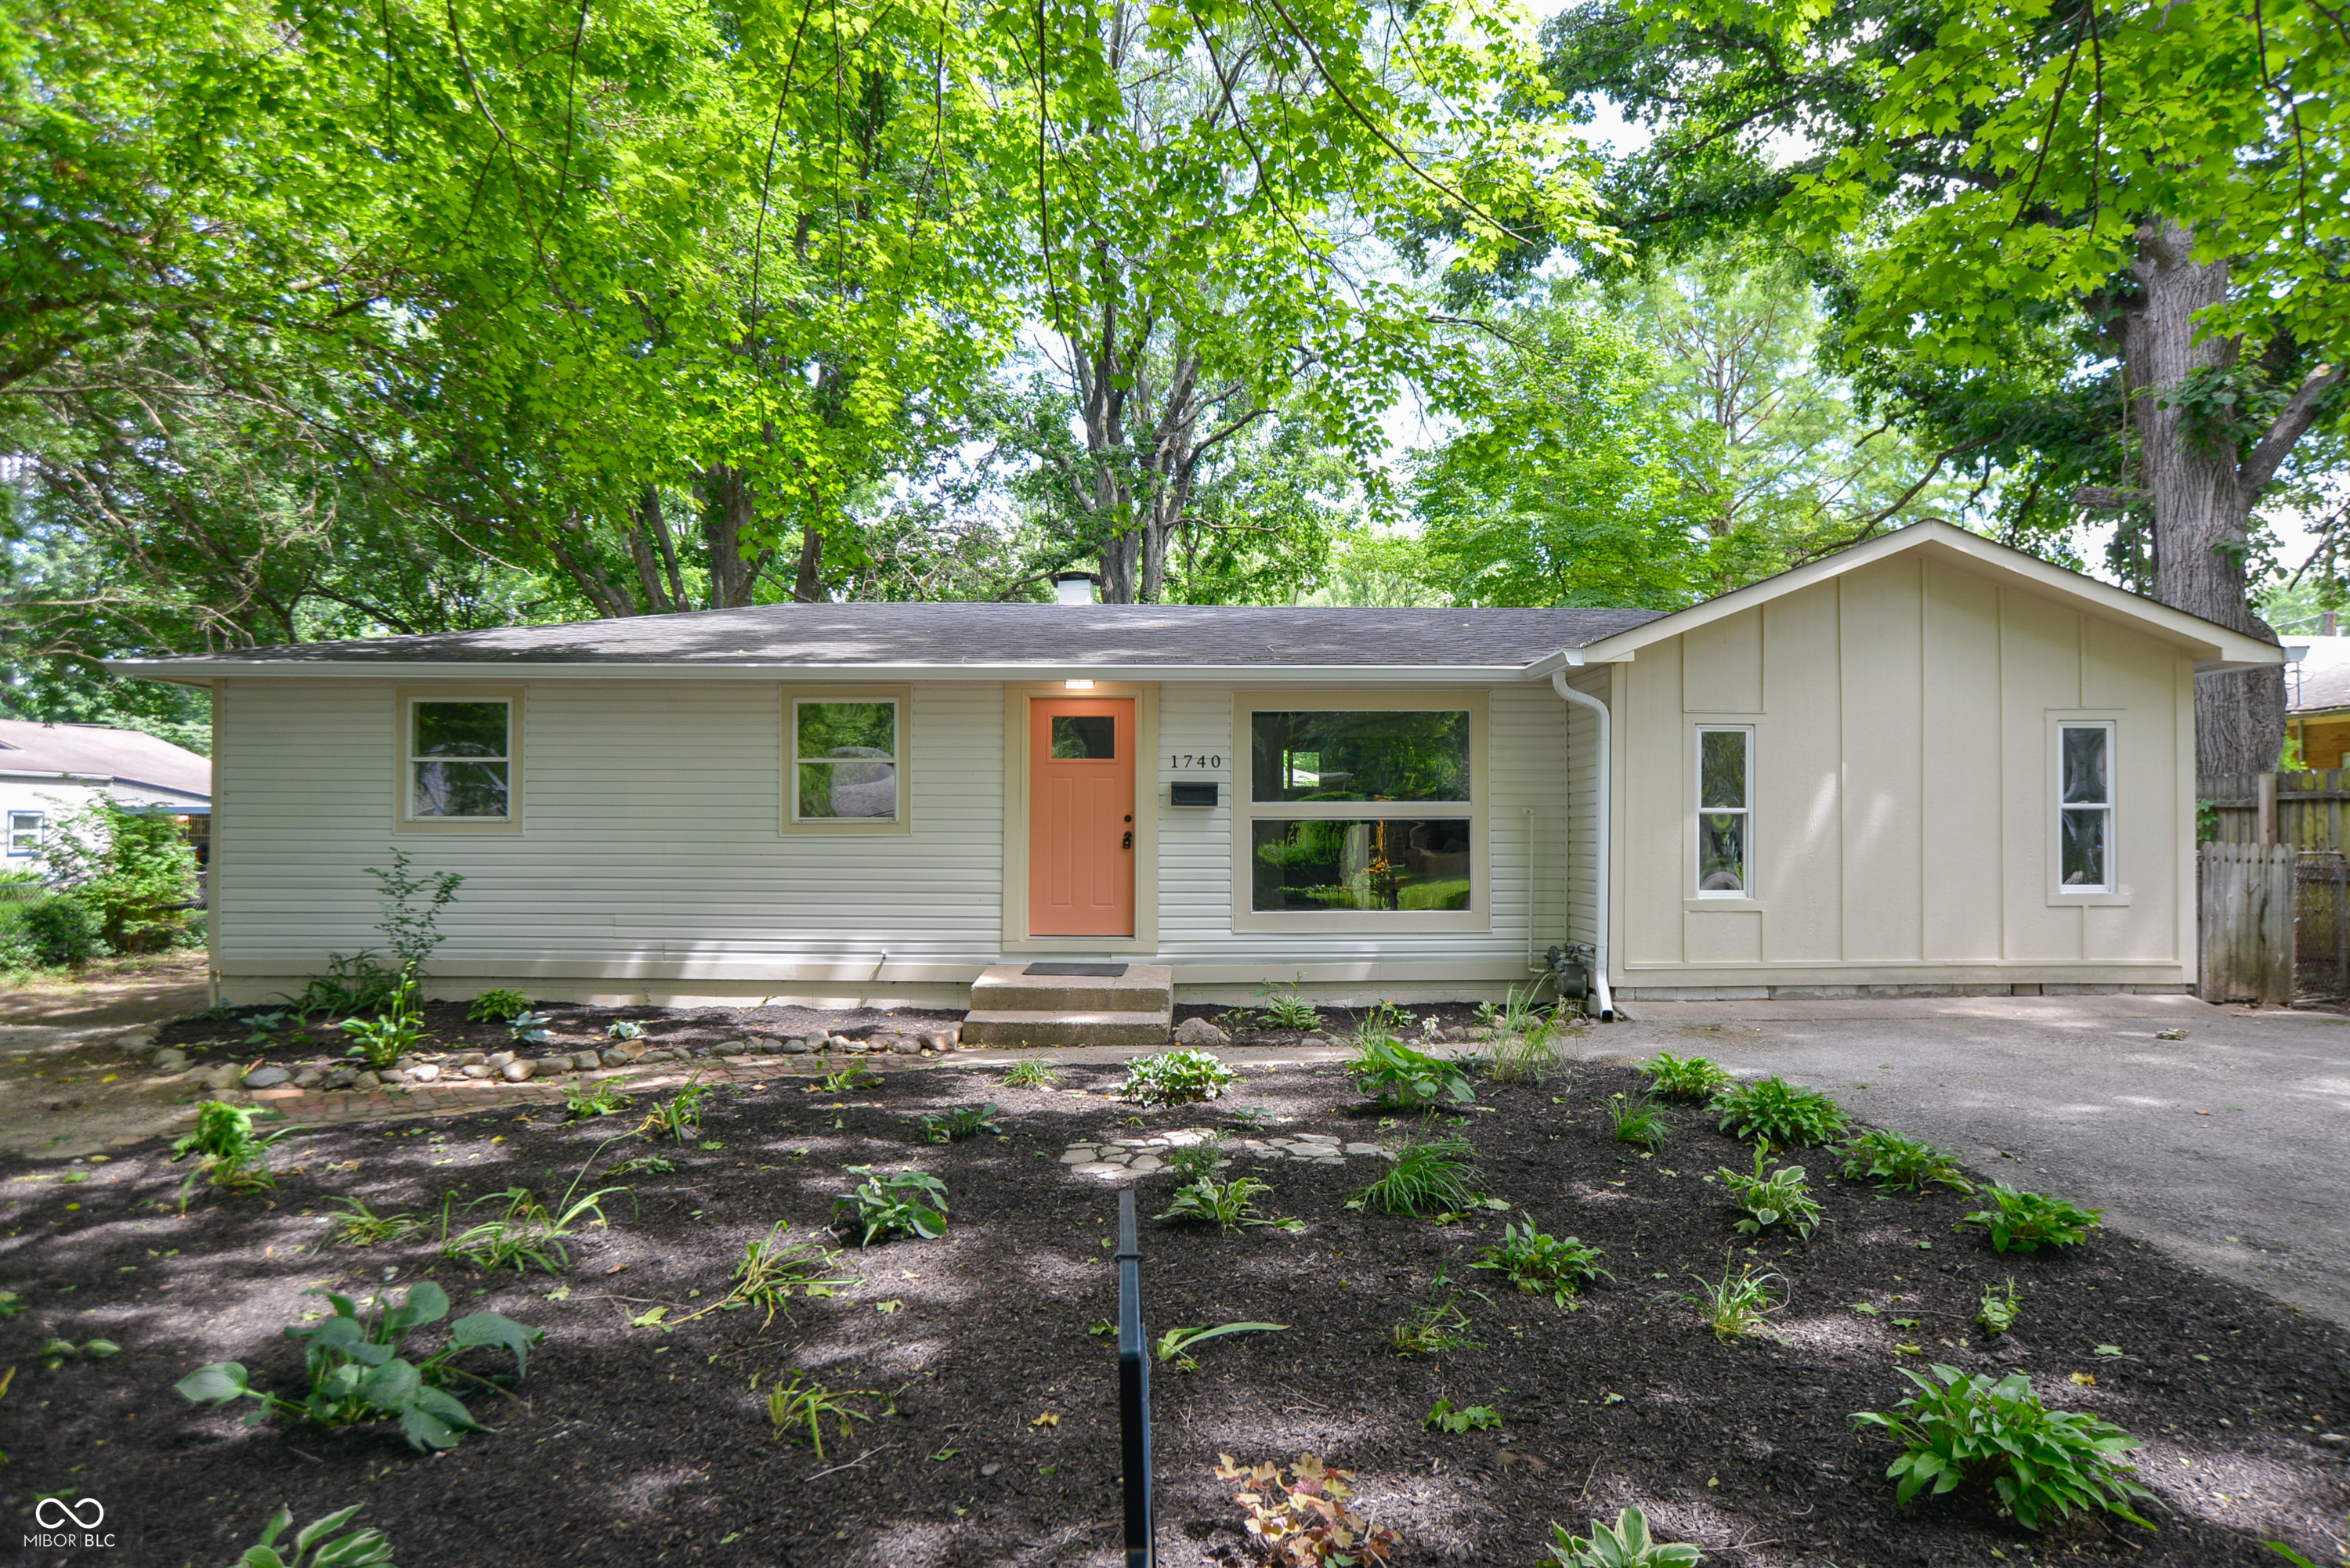
Active
$265,000
4
bds
|
2
ba
|
1,182
sqft
|
built
1958
1740 Haynes Ave, Indianapolis, IN 46240
$161
Cash flow
3.2%
Cash-on-Cash Return
6.9%
Cap rate
0.8%
Rent to Value Ratio
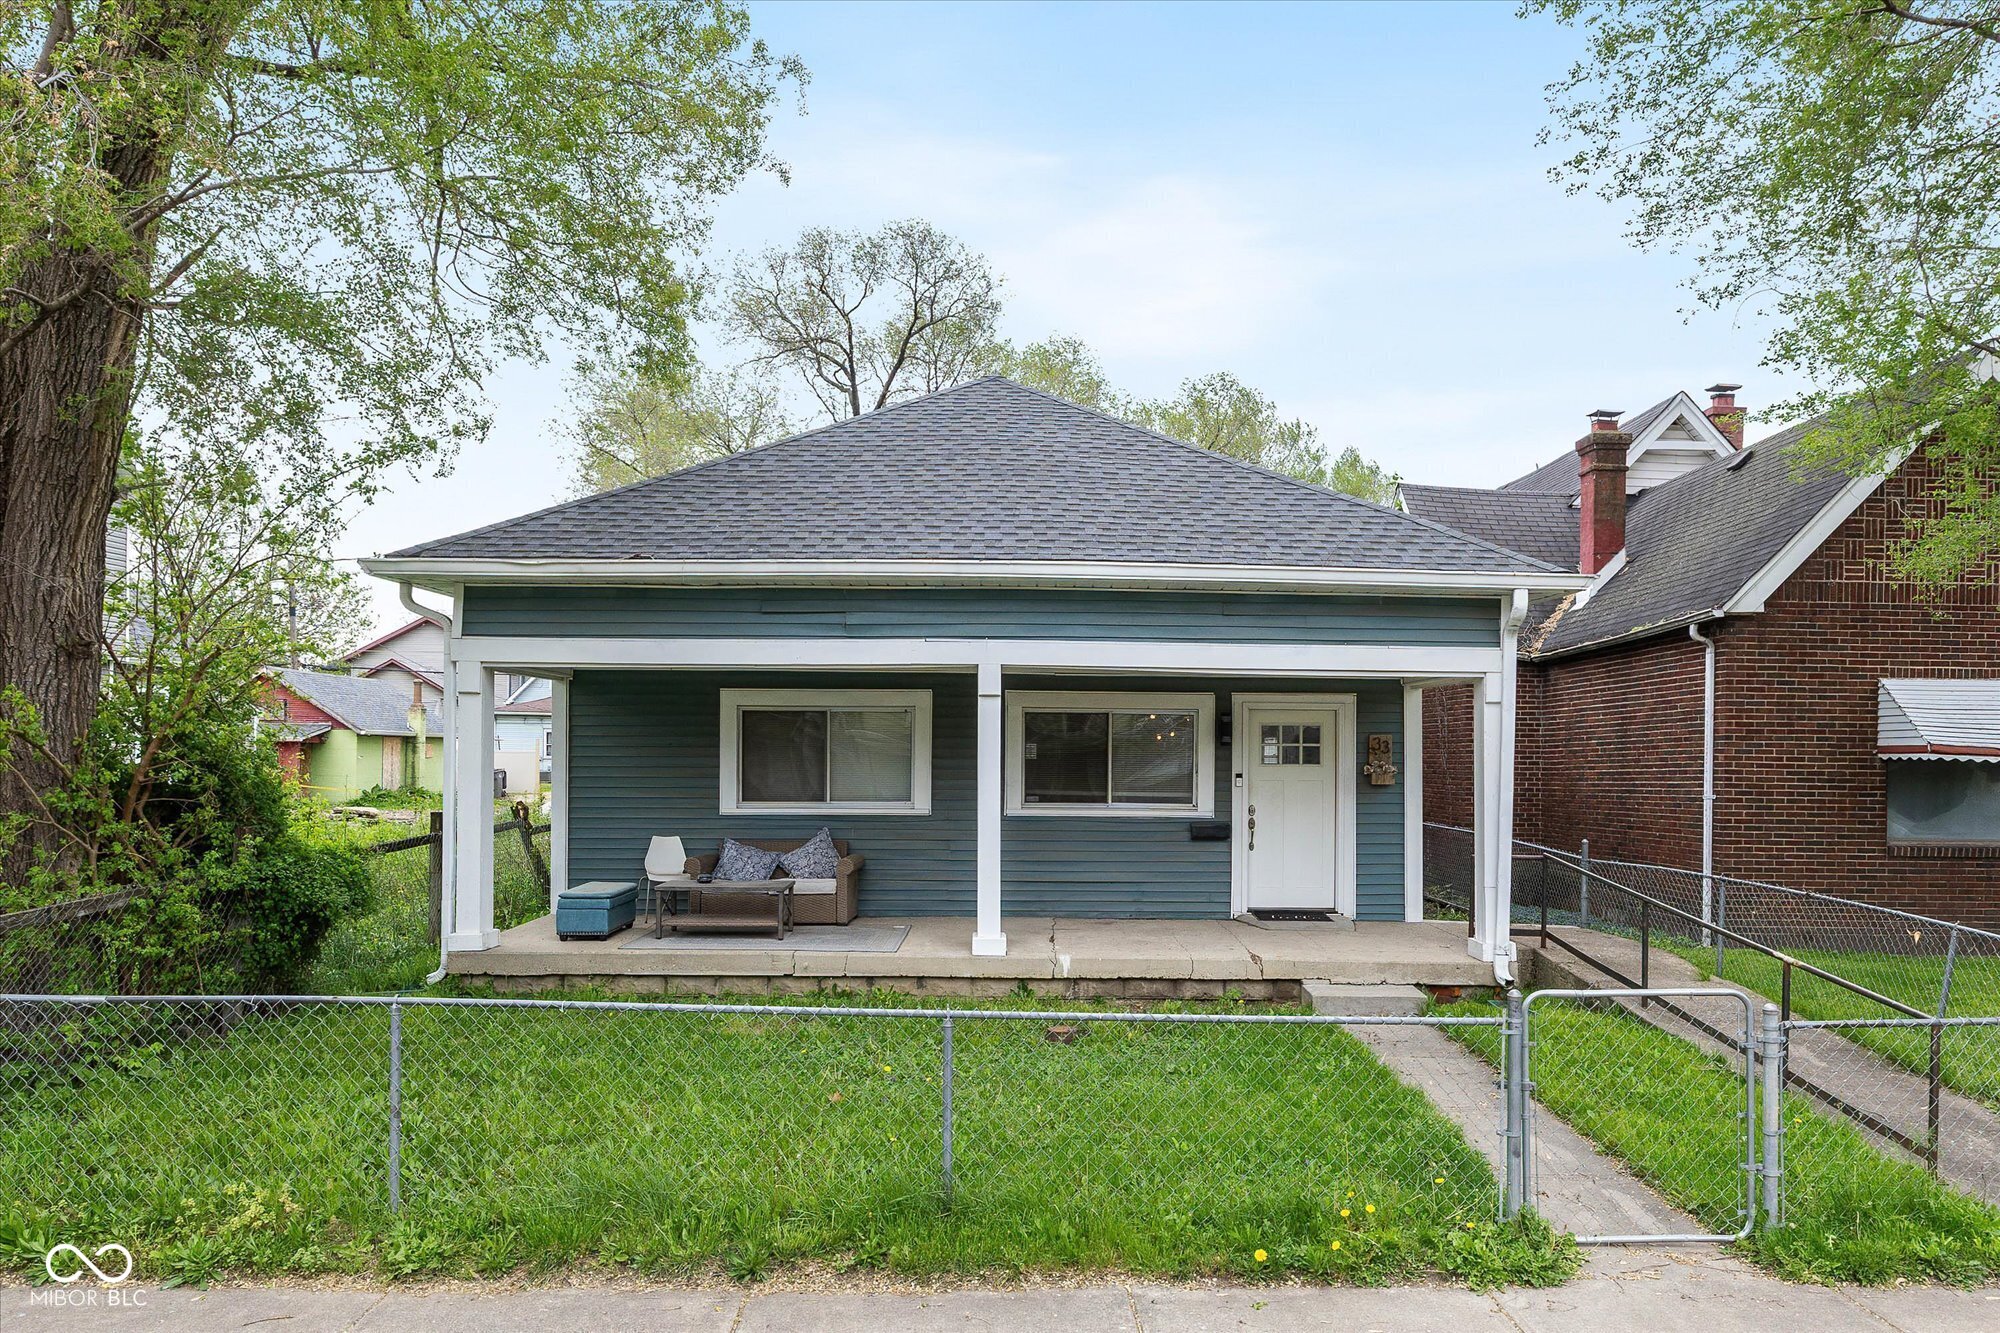
Active
$280,000
4
bds
|
2
ba
|
1,798
sqft
|
built
1955
33 N Beville Ave, Indianapolis, IN 46201
$84
Cash flow
1.6%
Cash-on-Cash Return
6.5%
Cap rate
0.8%
Rent to Value Ratio
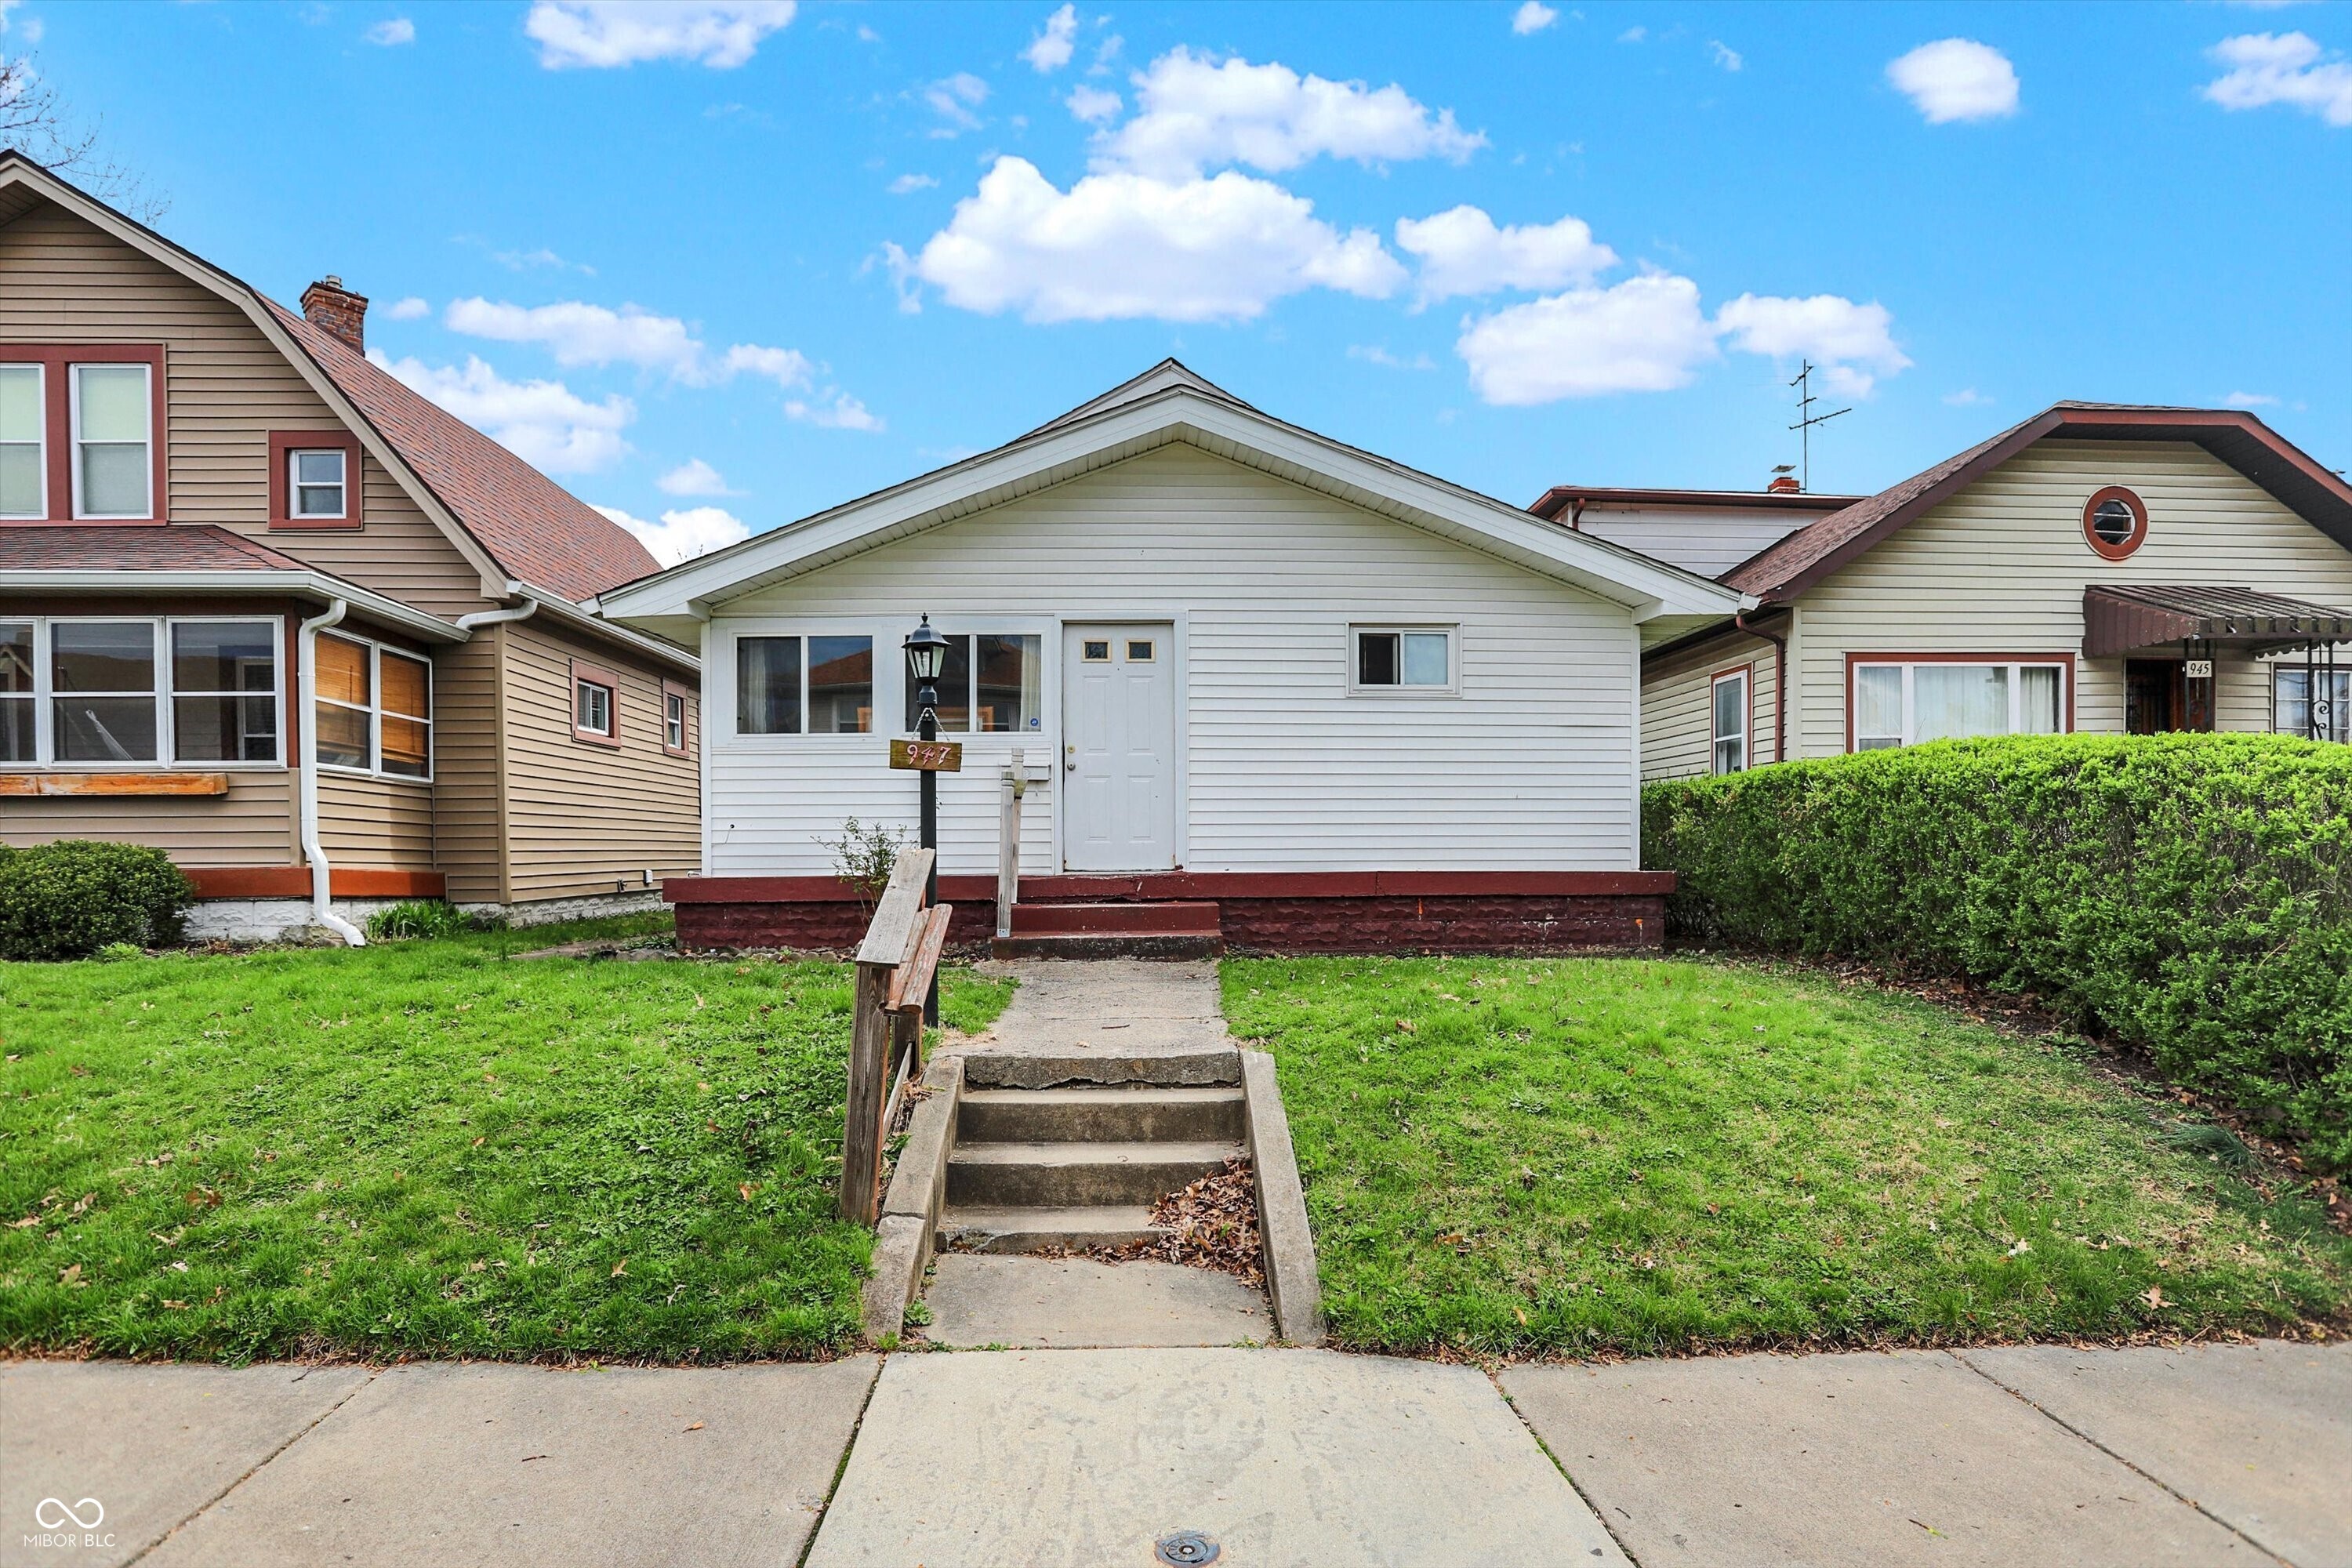
Active
$160,000
3
bds
|
1
ba
|
947
sqft
|
built
1924
426 Eastern Ave, Indianapolis, IN 46201
$146
Cash flow
4.8%
Cash-on-Cash Return
7.2%
Cap rate
0.9%
Rent to Value Ratio
Active
$235,000
3
bds
|
3
ba
|
1,960
sqft
|
built
1955
1304 N Tuxedo St, Indianapolis, IN 46201
$176
Cash flow
3.9%
Cash-on-Cash Return
7.0%
Cap rate
0.9%
Rent to Value Ratio
Active
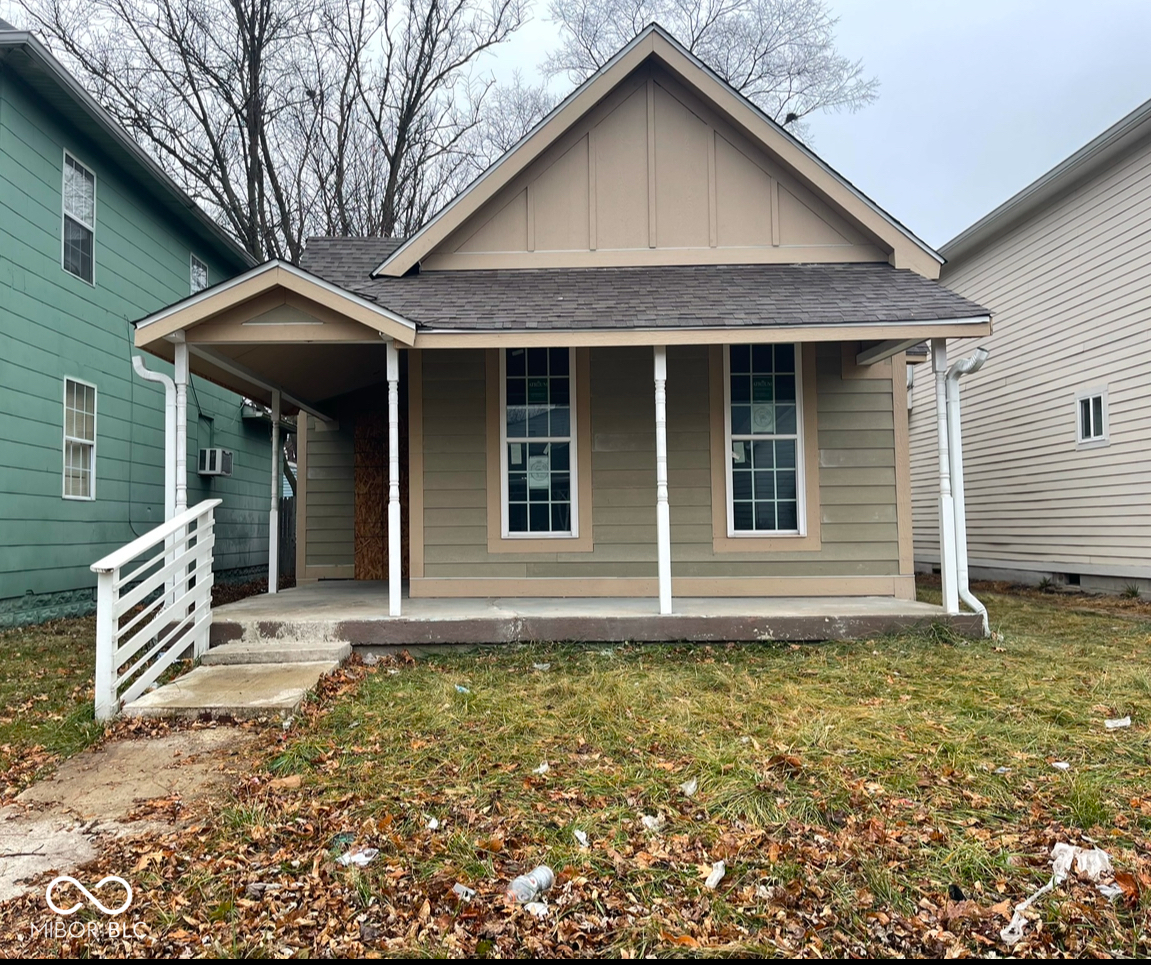
$145,000
3
bds
|
1
ba
|
1,096
sqft
|
built
1955
438 N Keystone Ave, Indianapolis, IN 46201
$85
Cash flow
3.1%
Cash-on-Cash Return
6.9%
Cap rate
0.8%
Rent to Value Ratio
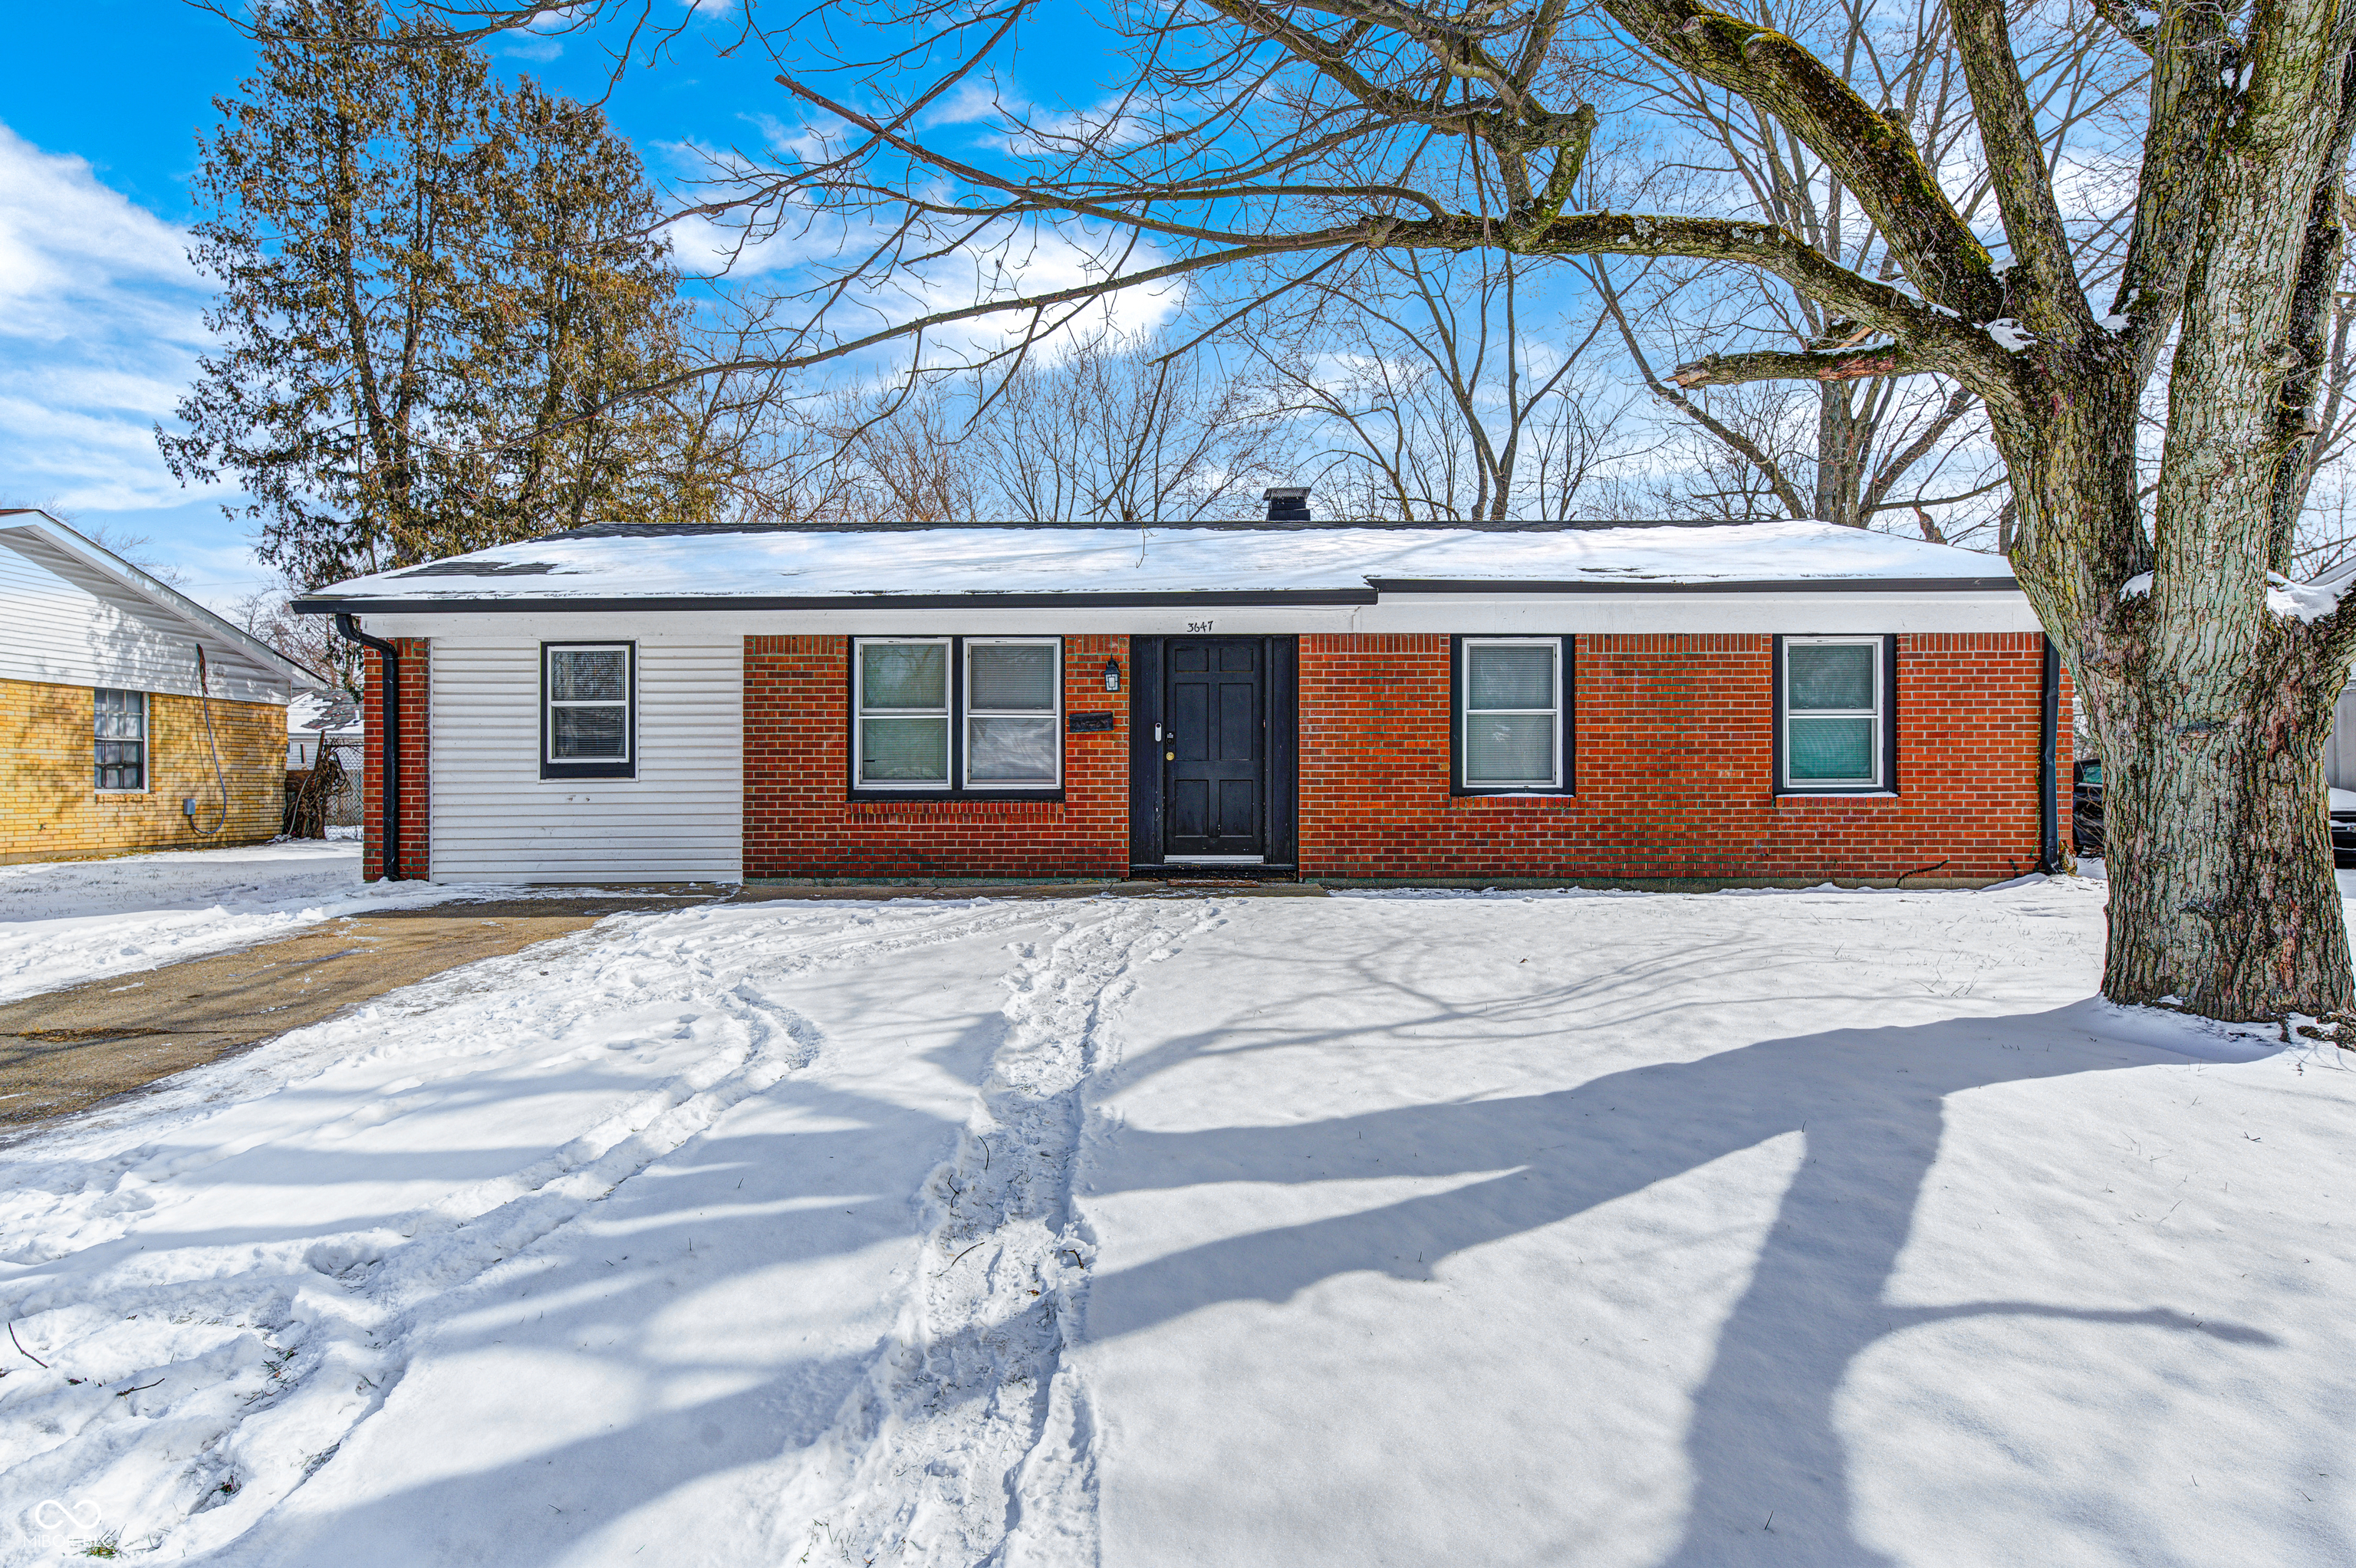
Active
$167,000
4
bds
|
2
ba
|
1,421
sqft
|
built
1960
3647 Richelieu Rd, Indianapolis, IN 46226
$249
Cash flow
7.8%
Cash-on-Cash Return
7.9%
Cap rate
1.0%
Rent to Value Ratio
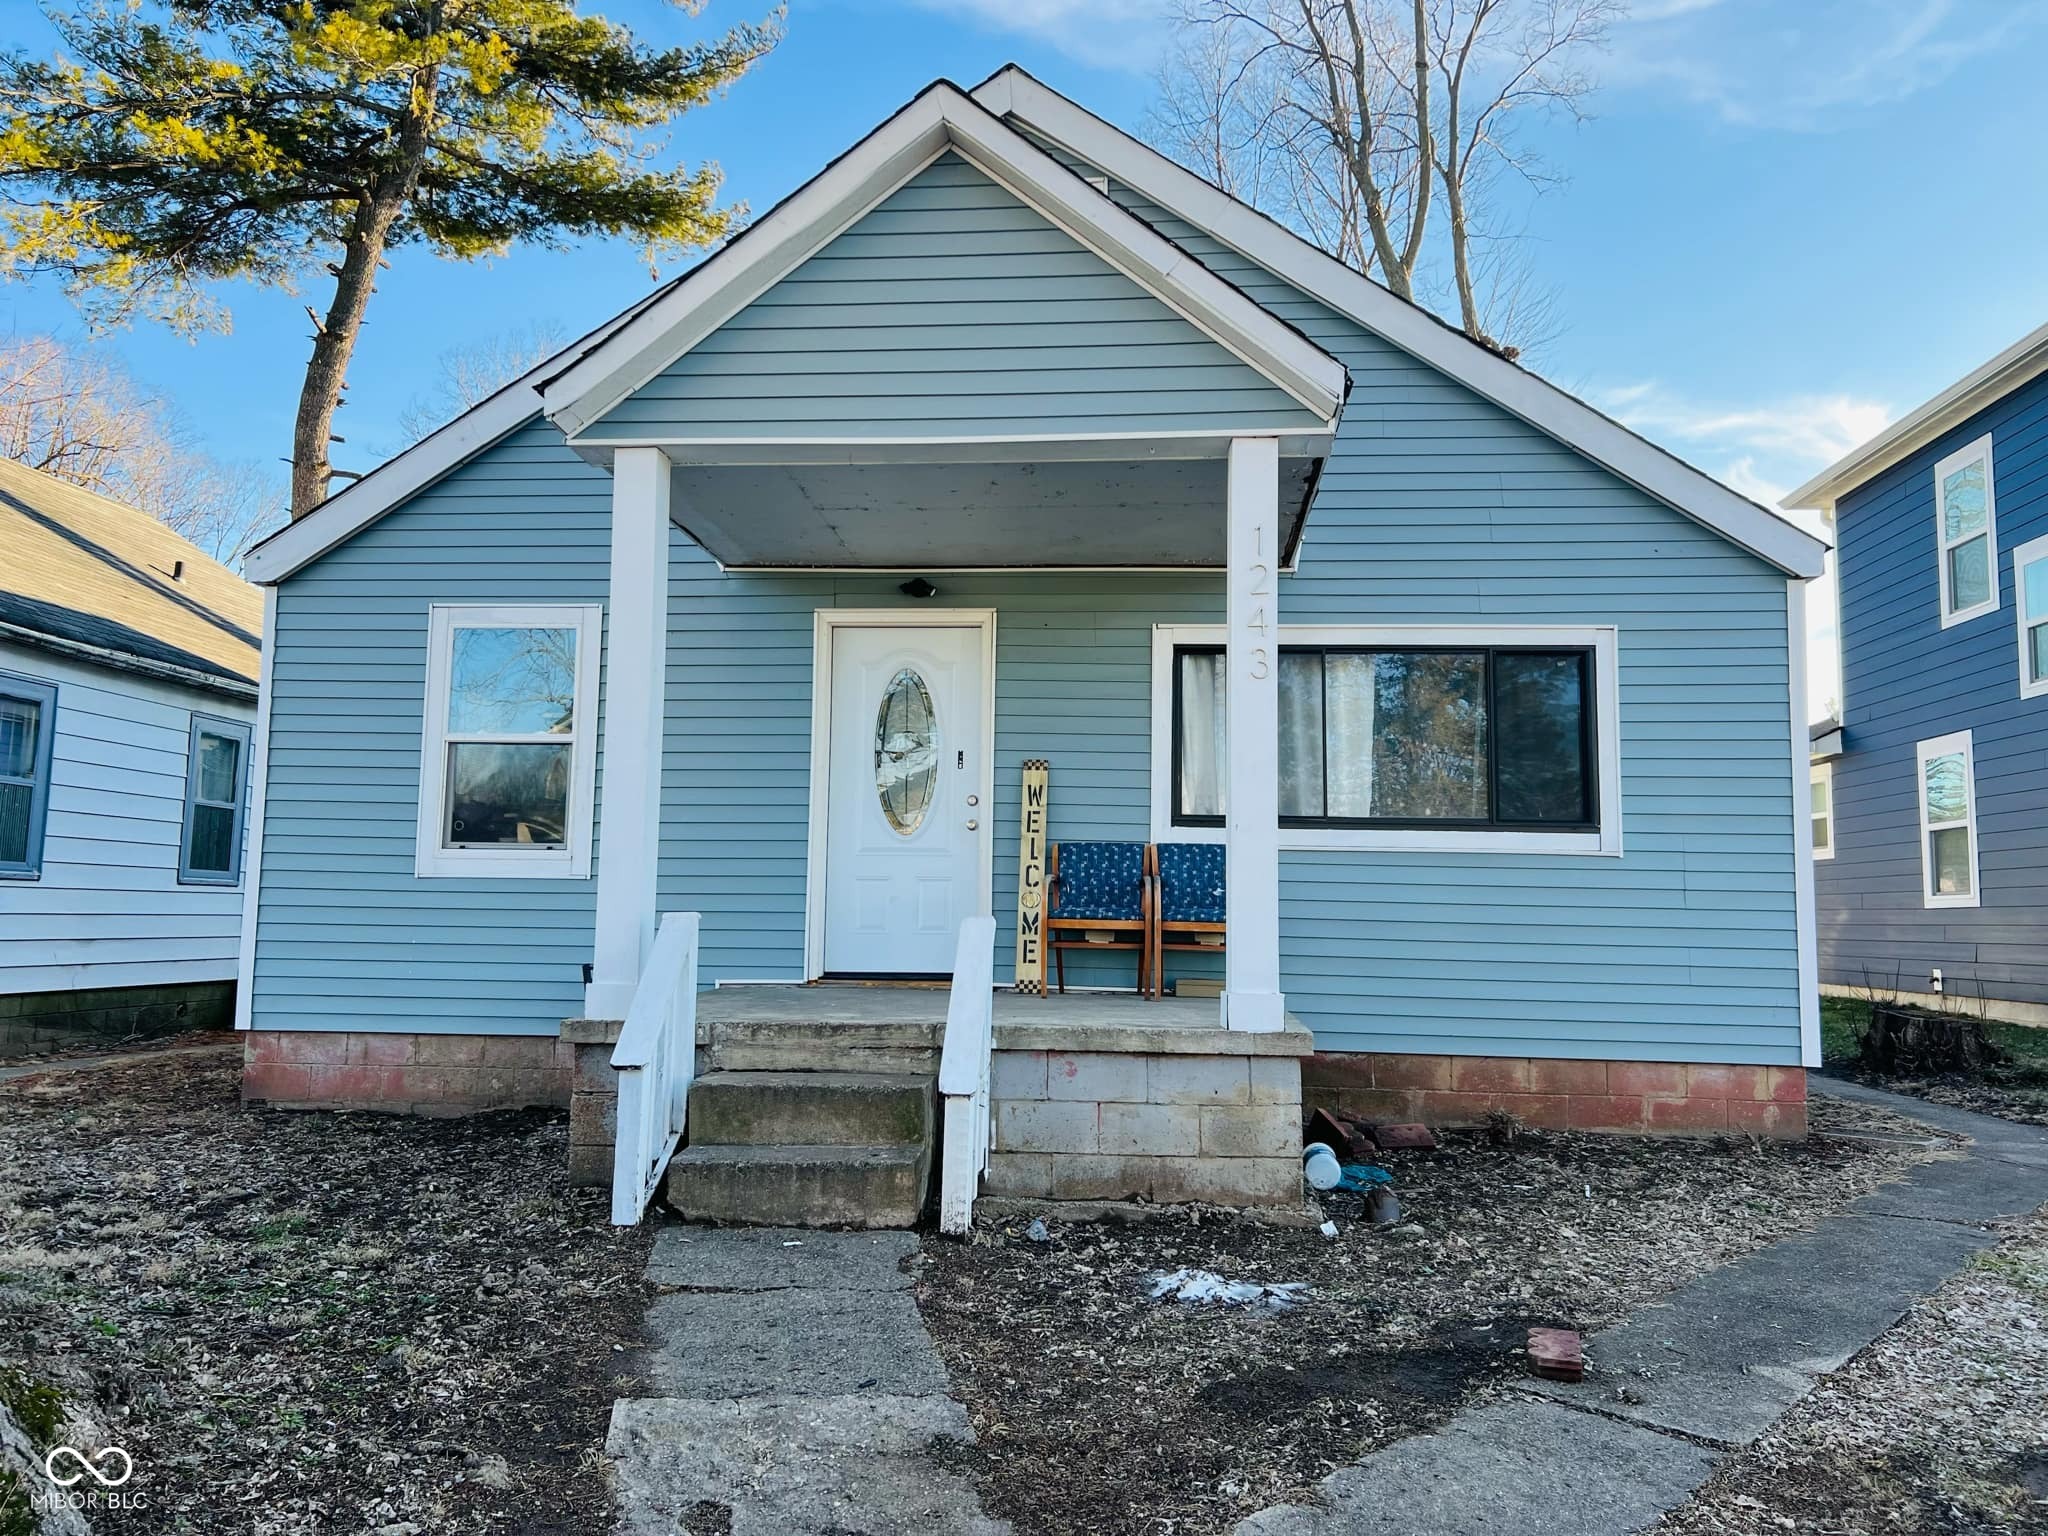
Active
$179,900
4
bds
|
1
ba
|
896
sqft
|
built
1950
1243 W 19th St, Indianapolis, IN 46202
$44
Cash flow
1.3%
Cash-on-Cash Return
6.4%
Cap rate
0.8%
Rent to Value Ratio
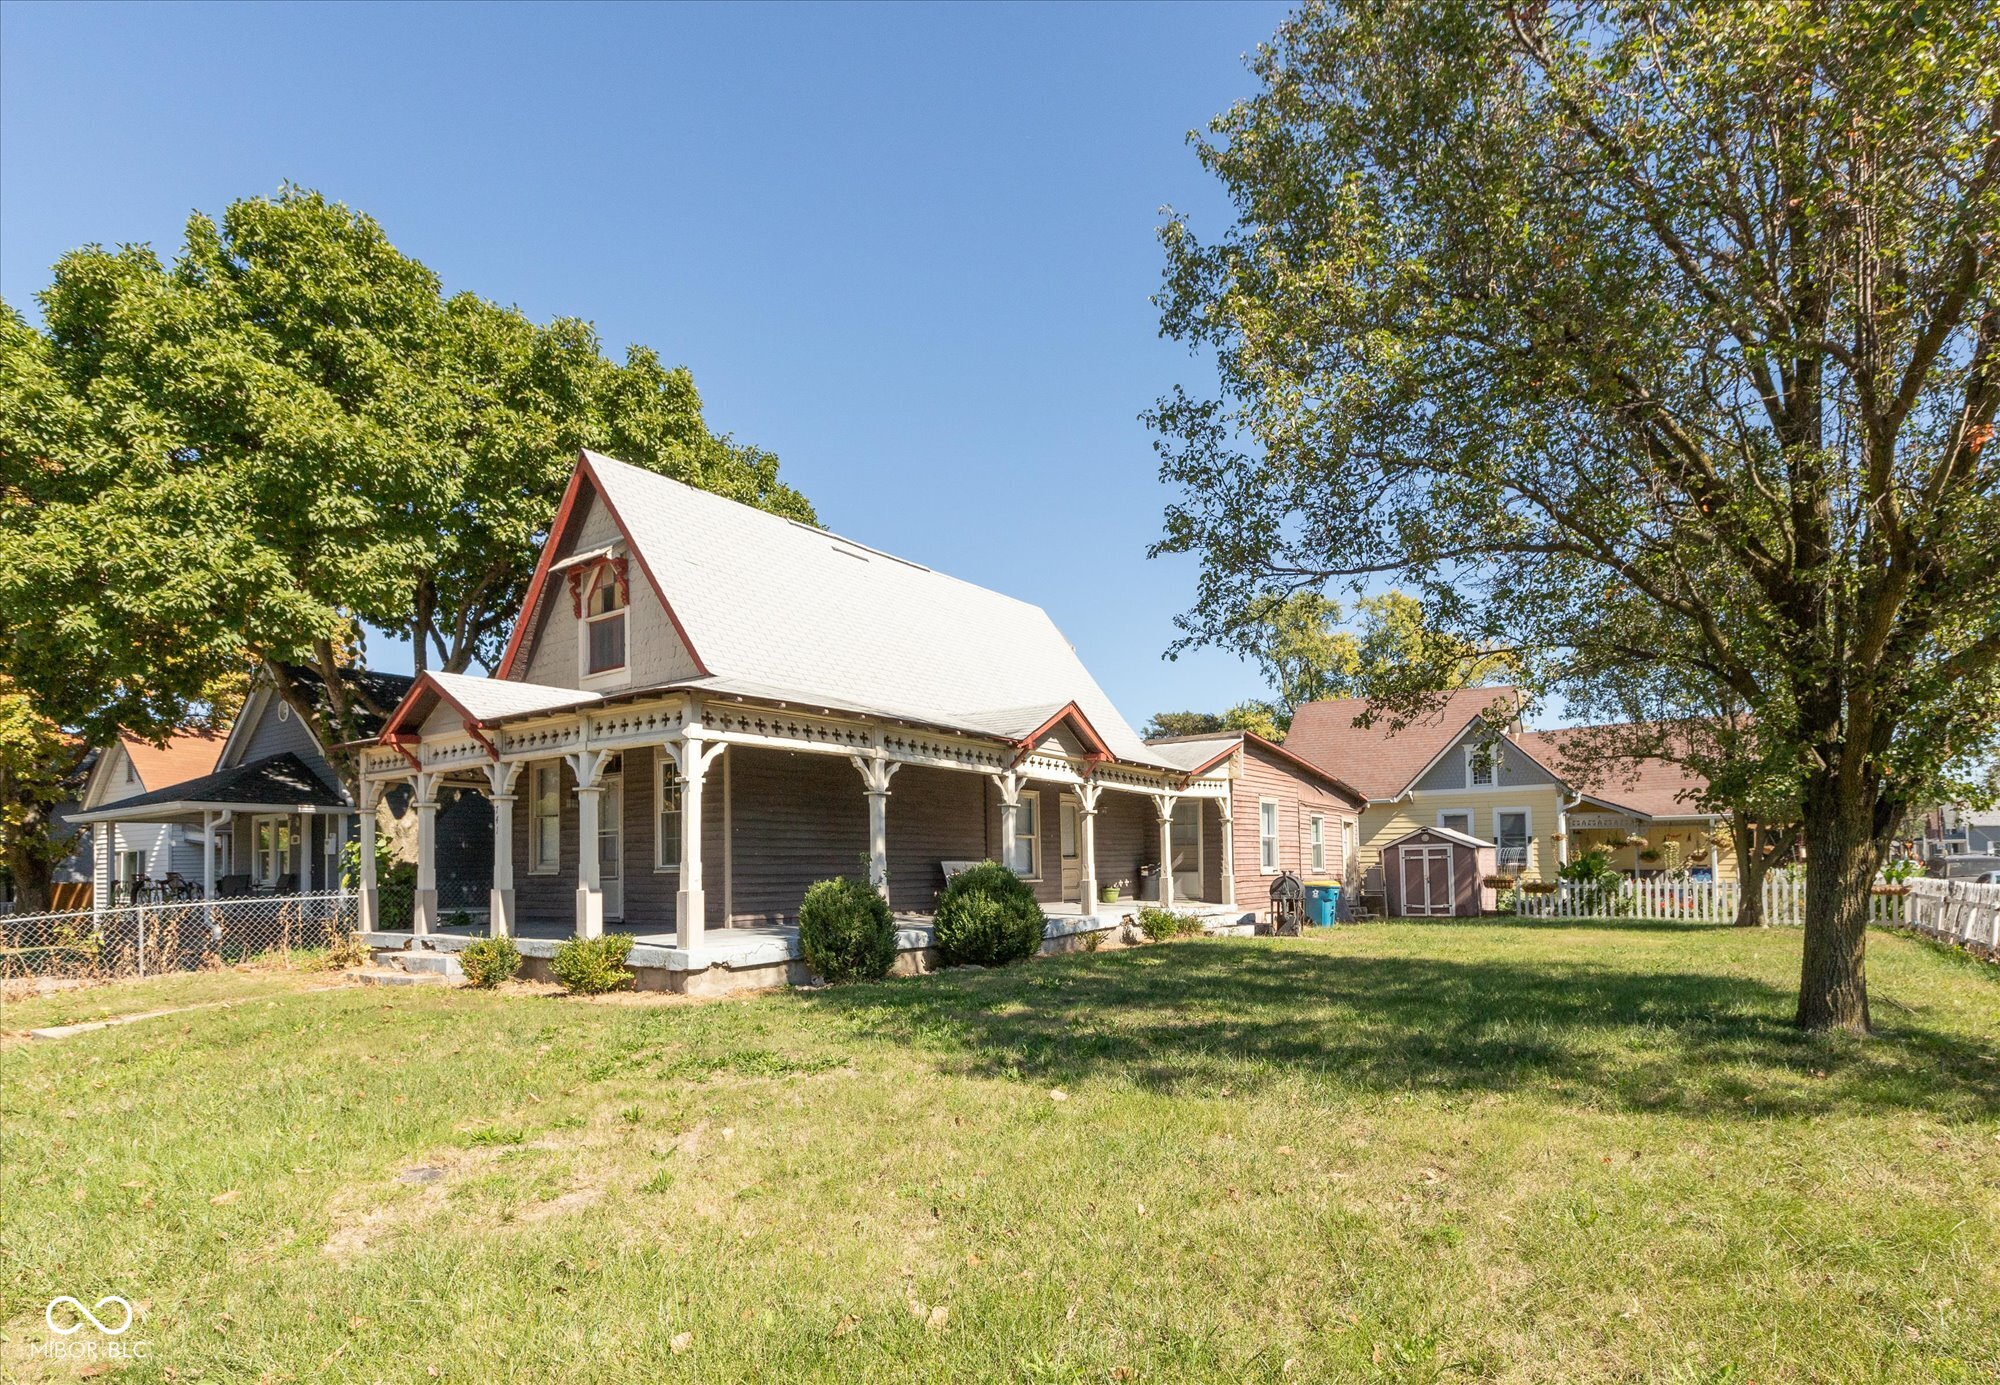
Active
$339,900
3
bds
|
3
ba
|
2,752
sqft
|
built
1890
741 Greer St, Indianapolis, IN 46203
$260
Cash flow
4.0%
Cash-on-Cash Return
7.1%
Cap rate
0.9%
Rent to Value Ratio
Active
$135,000
2
bds
|
1
ba
|
1,220
sqft
|
built
1902
947 E Bradbury Ave, Indianapolis, IN 46203
$274
Cash flow
10.6%
Cash-on-Cash Return
8.6%
Cap rate
1.0%
Rent to Value Ratio
Active
$115,000
3
bds
|
1
ba
|
1,170
sqft
|
built
1920
2349 Indianapolis Ave, Indianapolis, IN 46208
$308
Cash flow
14.0%
Cash-on-Cash Return
9.4%
Cap rate
1.1%
Rent to Value Ratio
Active
$160,000
2
bds
|
1
ba
|
1,925
sqft
|
built
1951
3505 N Layman Ave, Indianapolis, IN 46218
$146
Cash flow
4.8%
Cash-on-Cash Return
7.2%
Cap rate
0.9%
Rent to Value Ratio
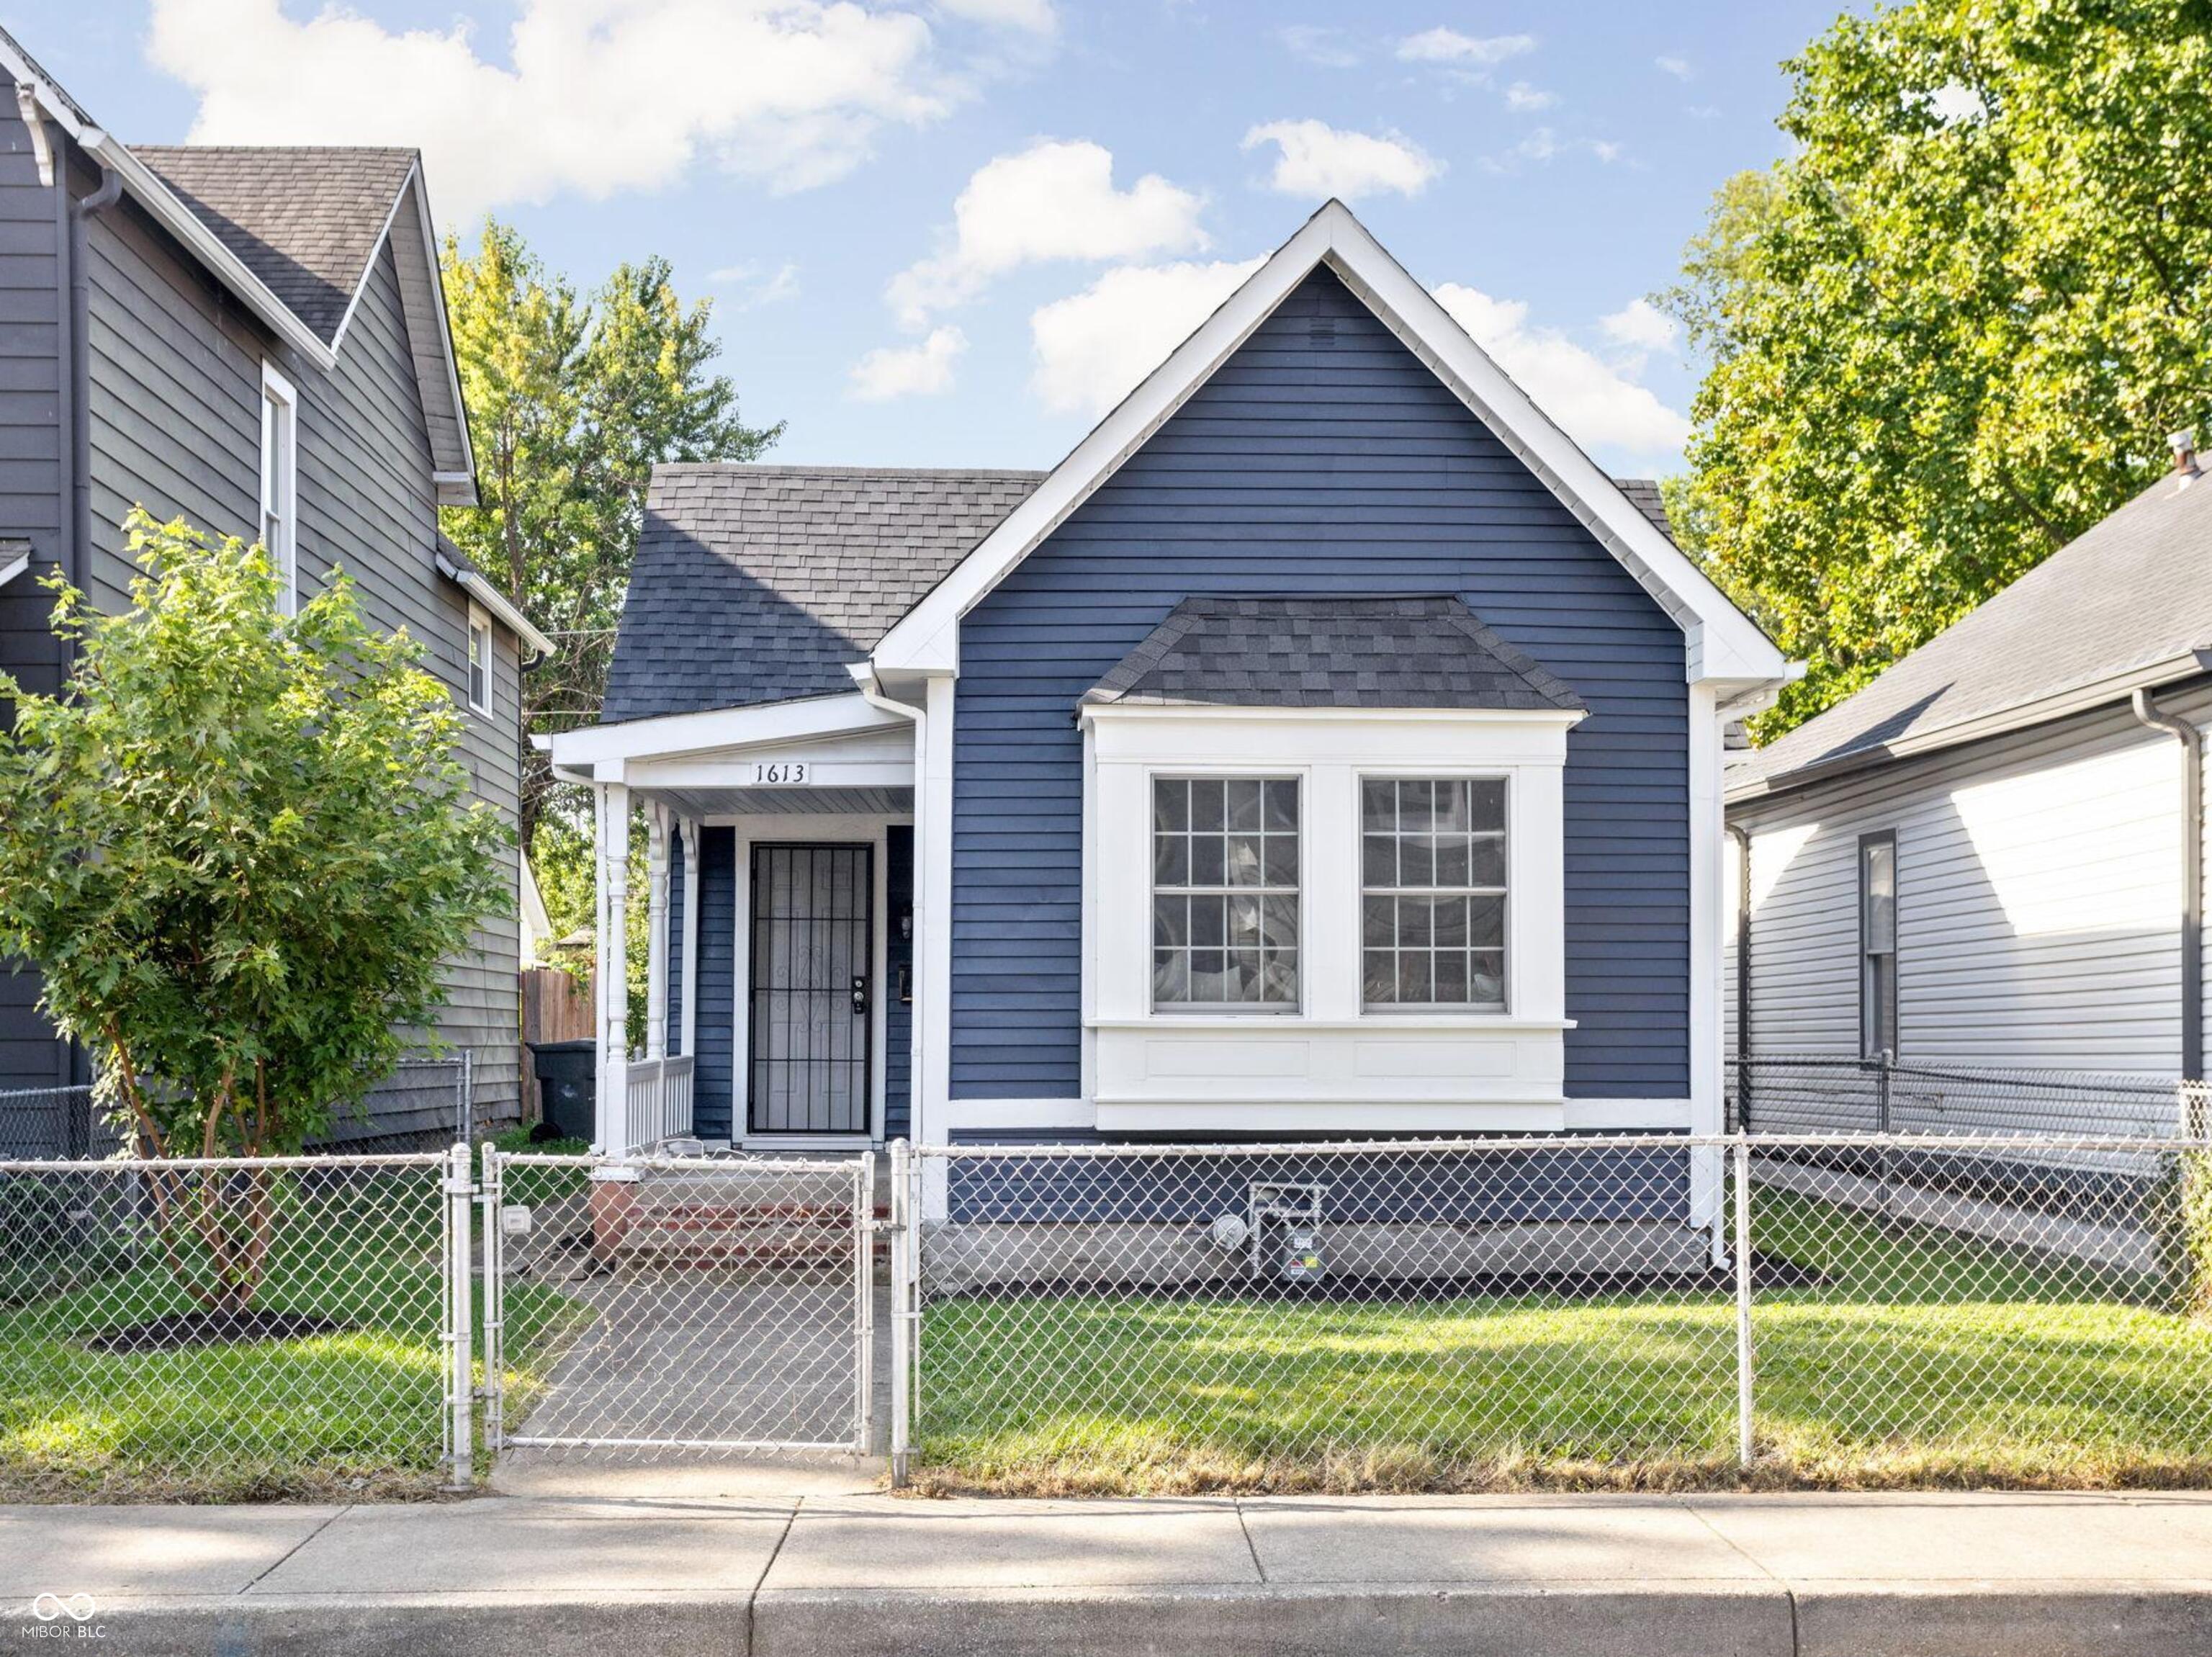
Active
$209,900
2
bds
|
1
ba
|
792
sqft
|
built
1910
1613 E Ohio St, Indianapolis, IN 46201
$98
Cash flow
2.4%
Cash-on-Cash Return
6.7%
Cap rate
0.8%
Rent to Value Ratio