Indianapolis, IN Investment Properties for Sale
Browse homes for sale and investment properties in Indianapolis, IN. Refine your search by price, property type, or more.
Best cash flowing properties in Indianapolis, IN
Active
$65,000
2
bds
|
1
ba
|
780
sqft
|
built
1940
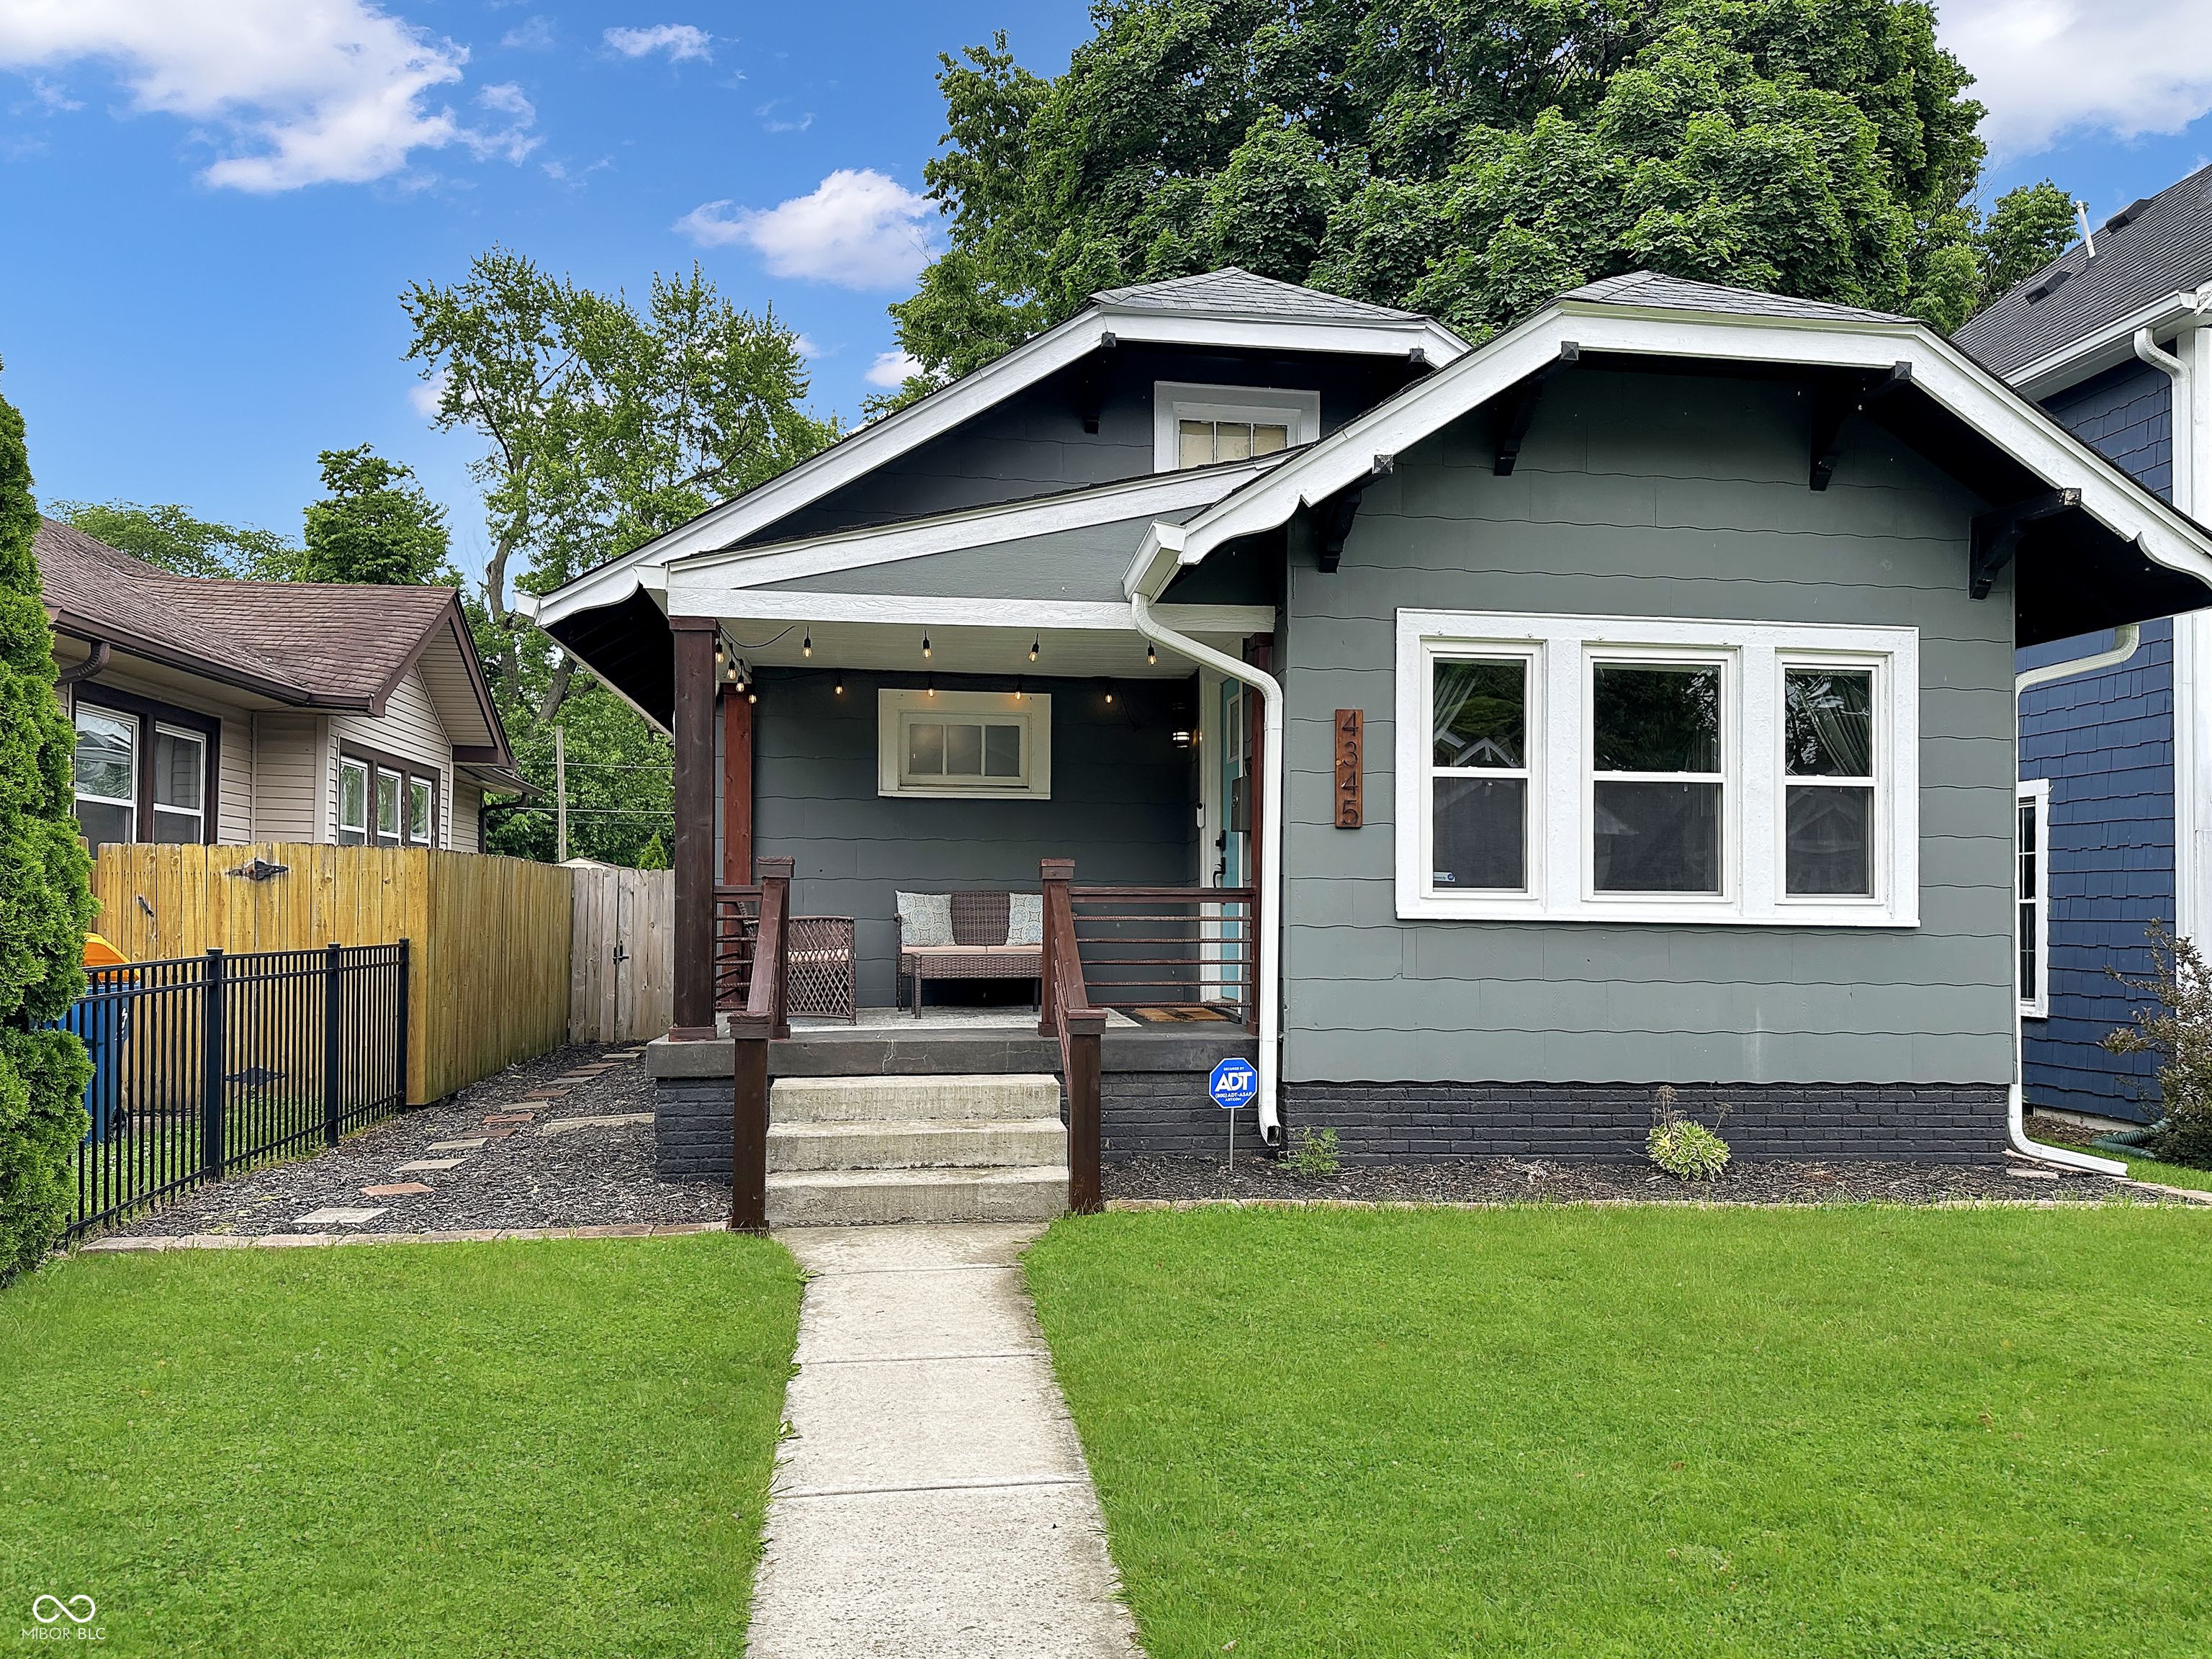
3336 S Rybolt Ave, Indianapolis, IN 46221
$621
Cash flow
11.1%
Cash-on-Cash Return
11.5%
Cap rate
1.4%
Rent to Value Ratio
Pending
$200,000
5
bds
|
4
ba
|
2,570
sqft
|
built
1916
609 E 37th St, Indianapolis, IN 46205
$540
Cash flow
14.1%
Cash-on-Cash Return
9.5%
Cap rate
1.2%
Rent to Value Ratio
1,989 out of 2,131 properties for sale in Indianapolis, IN
Limited Results Shown
Create a free account, or log in to reveal all property listings and enjoy the complete experience.
Active
$129,000
2
bds
|
2
ba
|
1,491
sqft
|
built
1940
704 E Perry St, Indianapolis, IN 46227
$290
Cash flow
11.7%
Cash-on-Cash Return
9.0%
Cap rate
1.1%
Rent to Value Ratio
Active
$125,000
3
bds
|
1
ba
|
1,140
sqft
|
built
1953
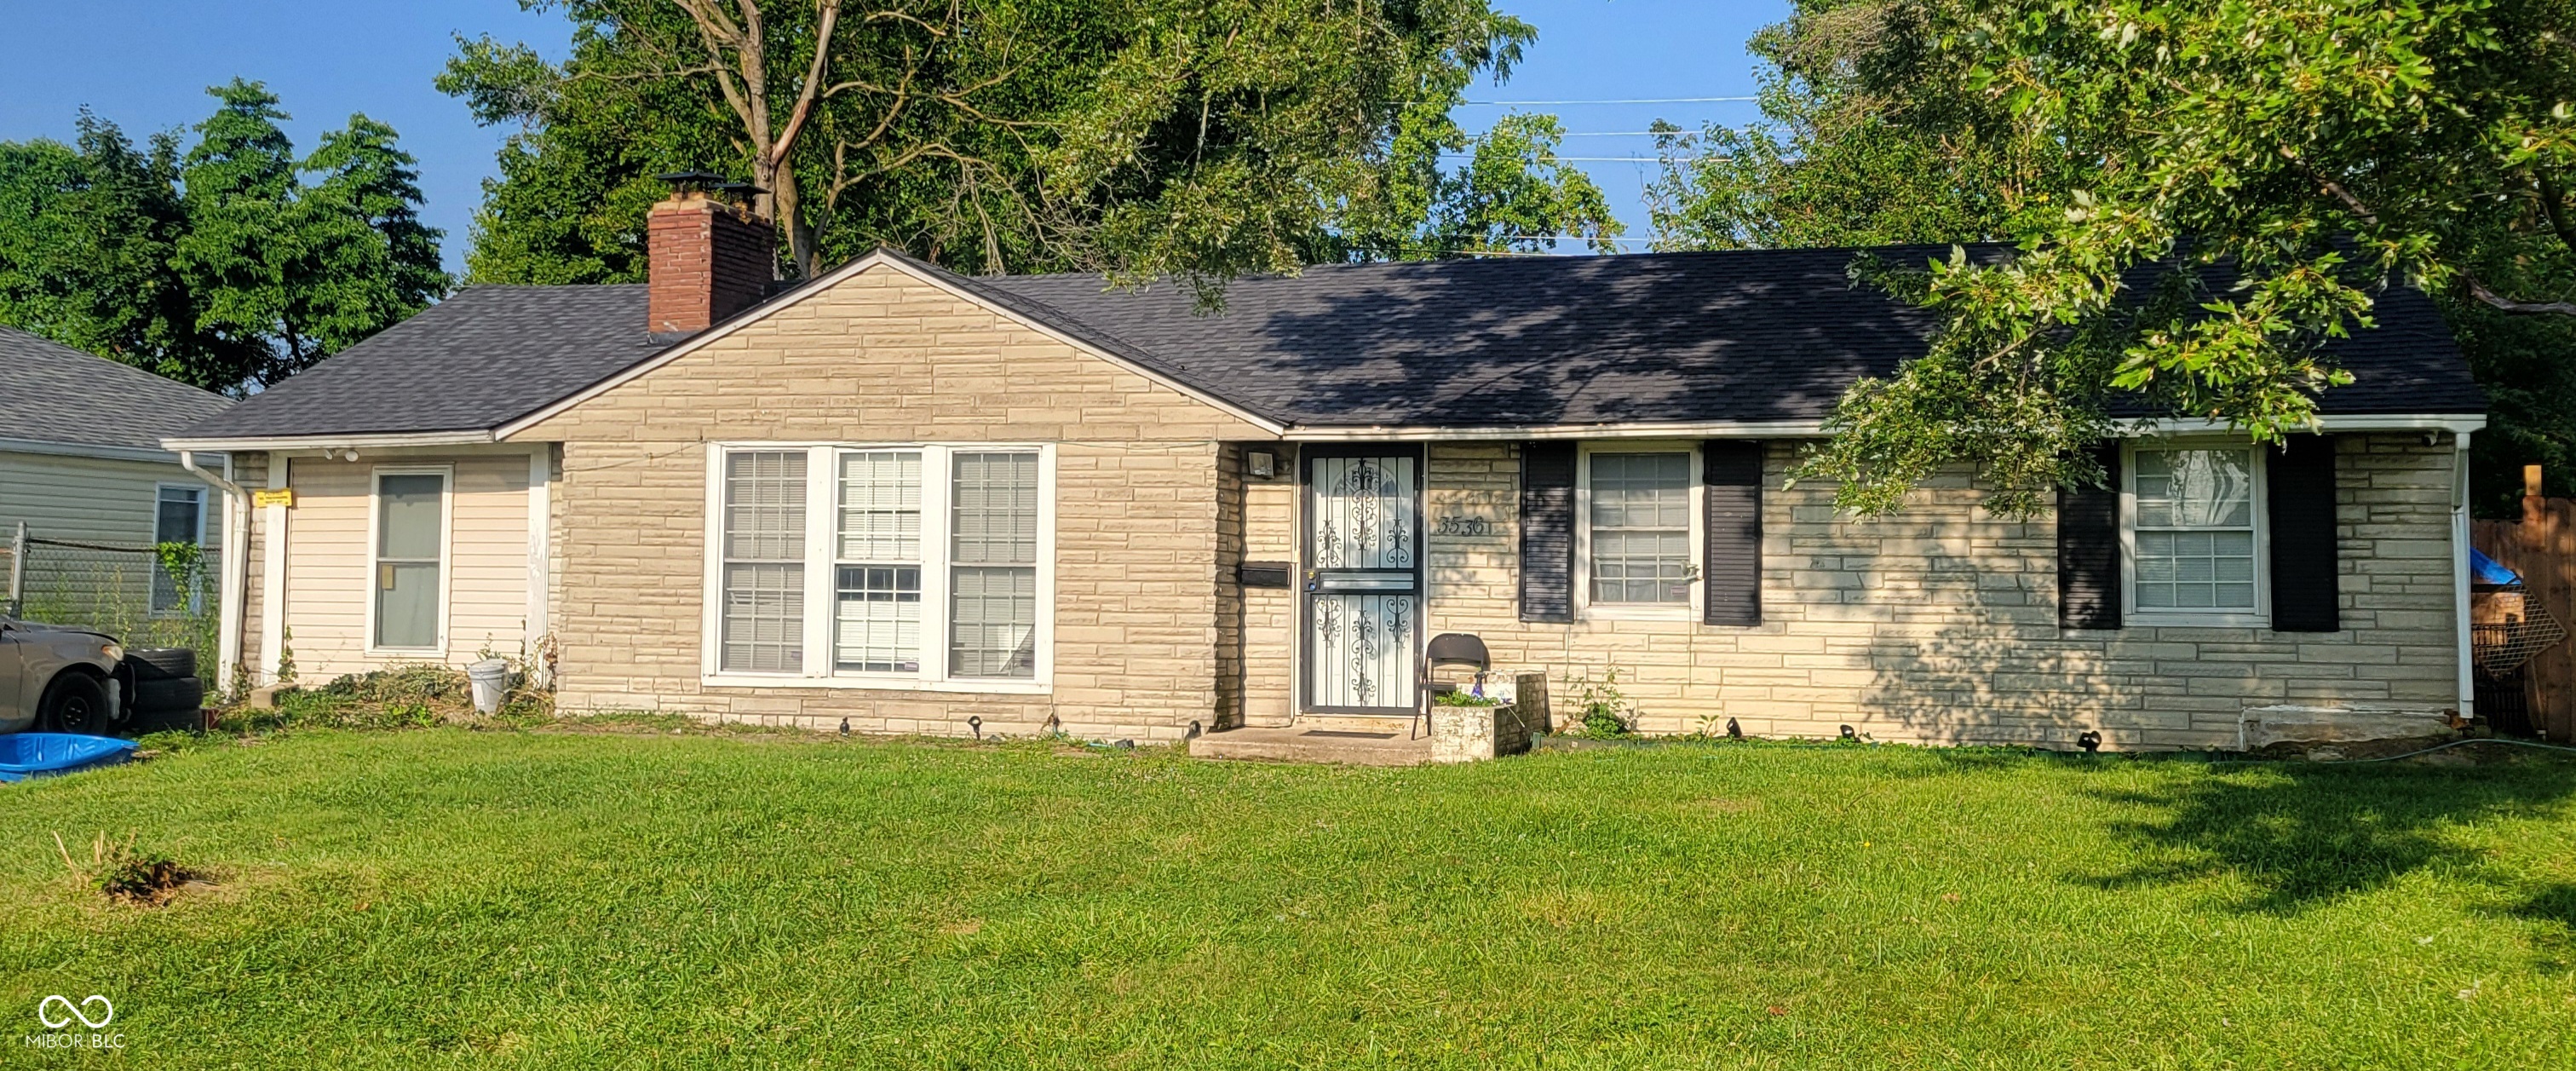
3536 N Audubon Rd, Indianapolis, IN 46218
$104
Cash flow
4.3%
Cash-on-Cash Return
7.3%
Cap rate
0.9%
Rent to Value Ratio
Active
$165,000
5
bds
|
2
ba
|
1,036
sqft
|
built
2004
6215 E 11th St, Indianapolis, IN 46219
$33
Cash flow
1.0%
Cash-on-Cash Return
6.5%
Cap rate
0.8%
Rent to Value Ratio
Active
$185,000
3
bds
|
1
ba
|
1,421
sqft
|
built
1961
8902 Carla Dr, Indianapolis, IN 46219
$135
Cash flow
3.8%
Cash-on-Cash Return
7.2%
Cap rate
0.9%
Rent to Value Ratio
Active
$265,000
4
bds
|
2
ba
|
1,182
sqft
|
built
1958
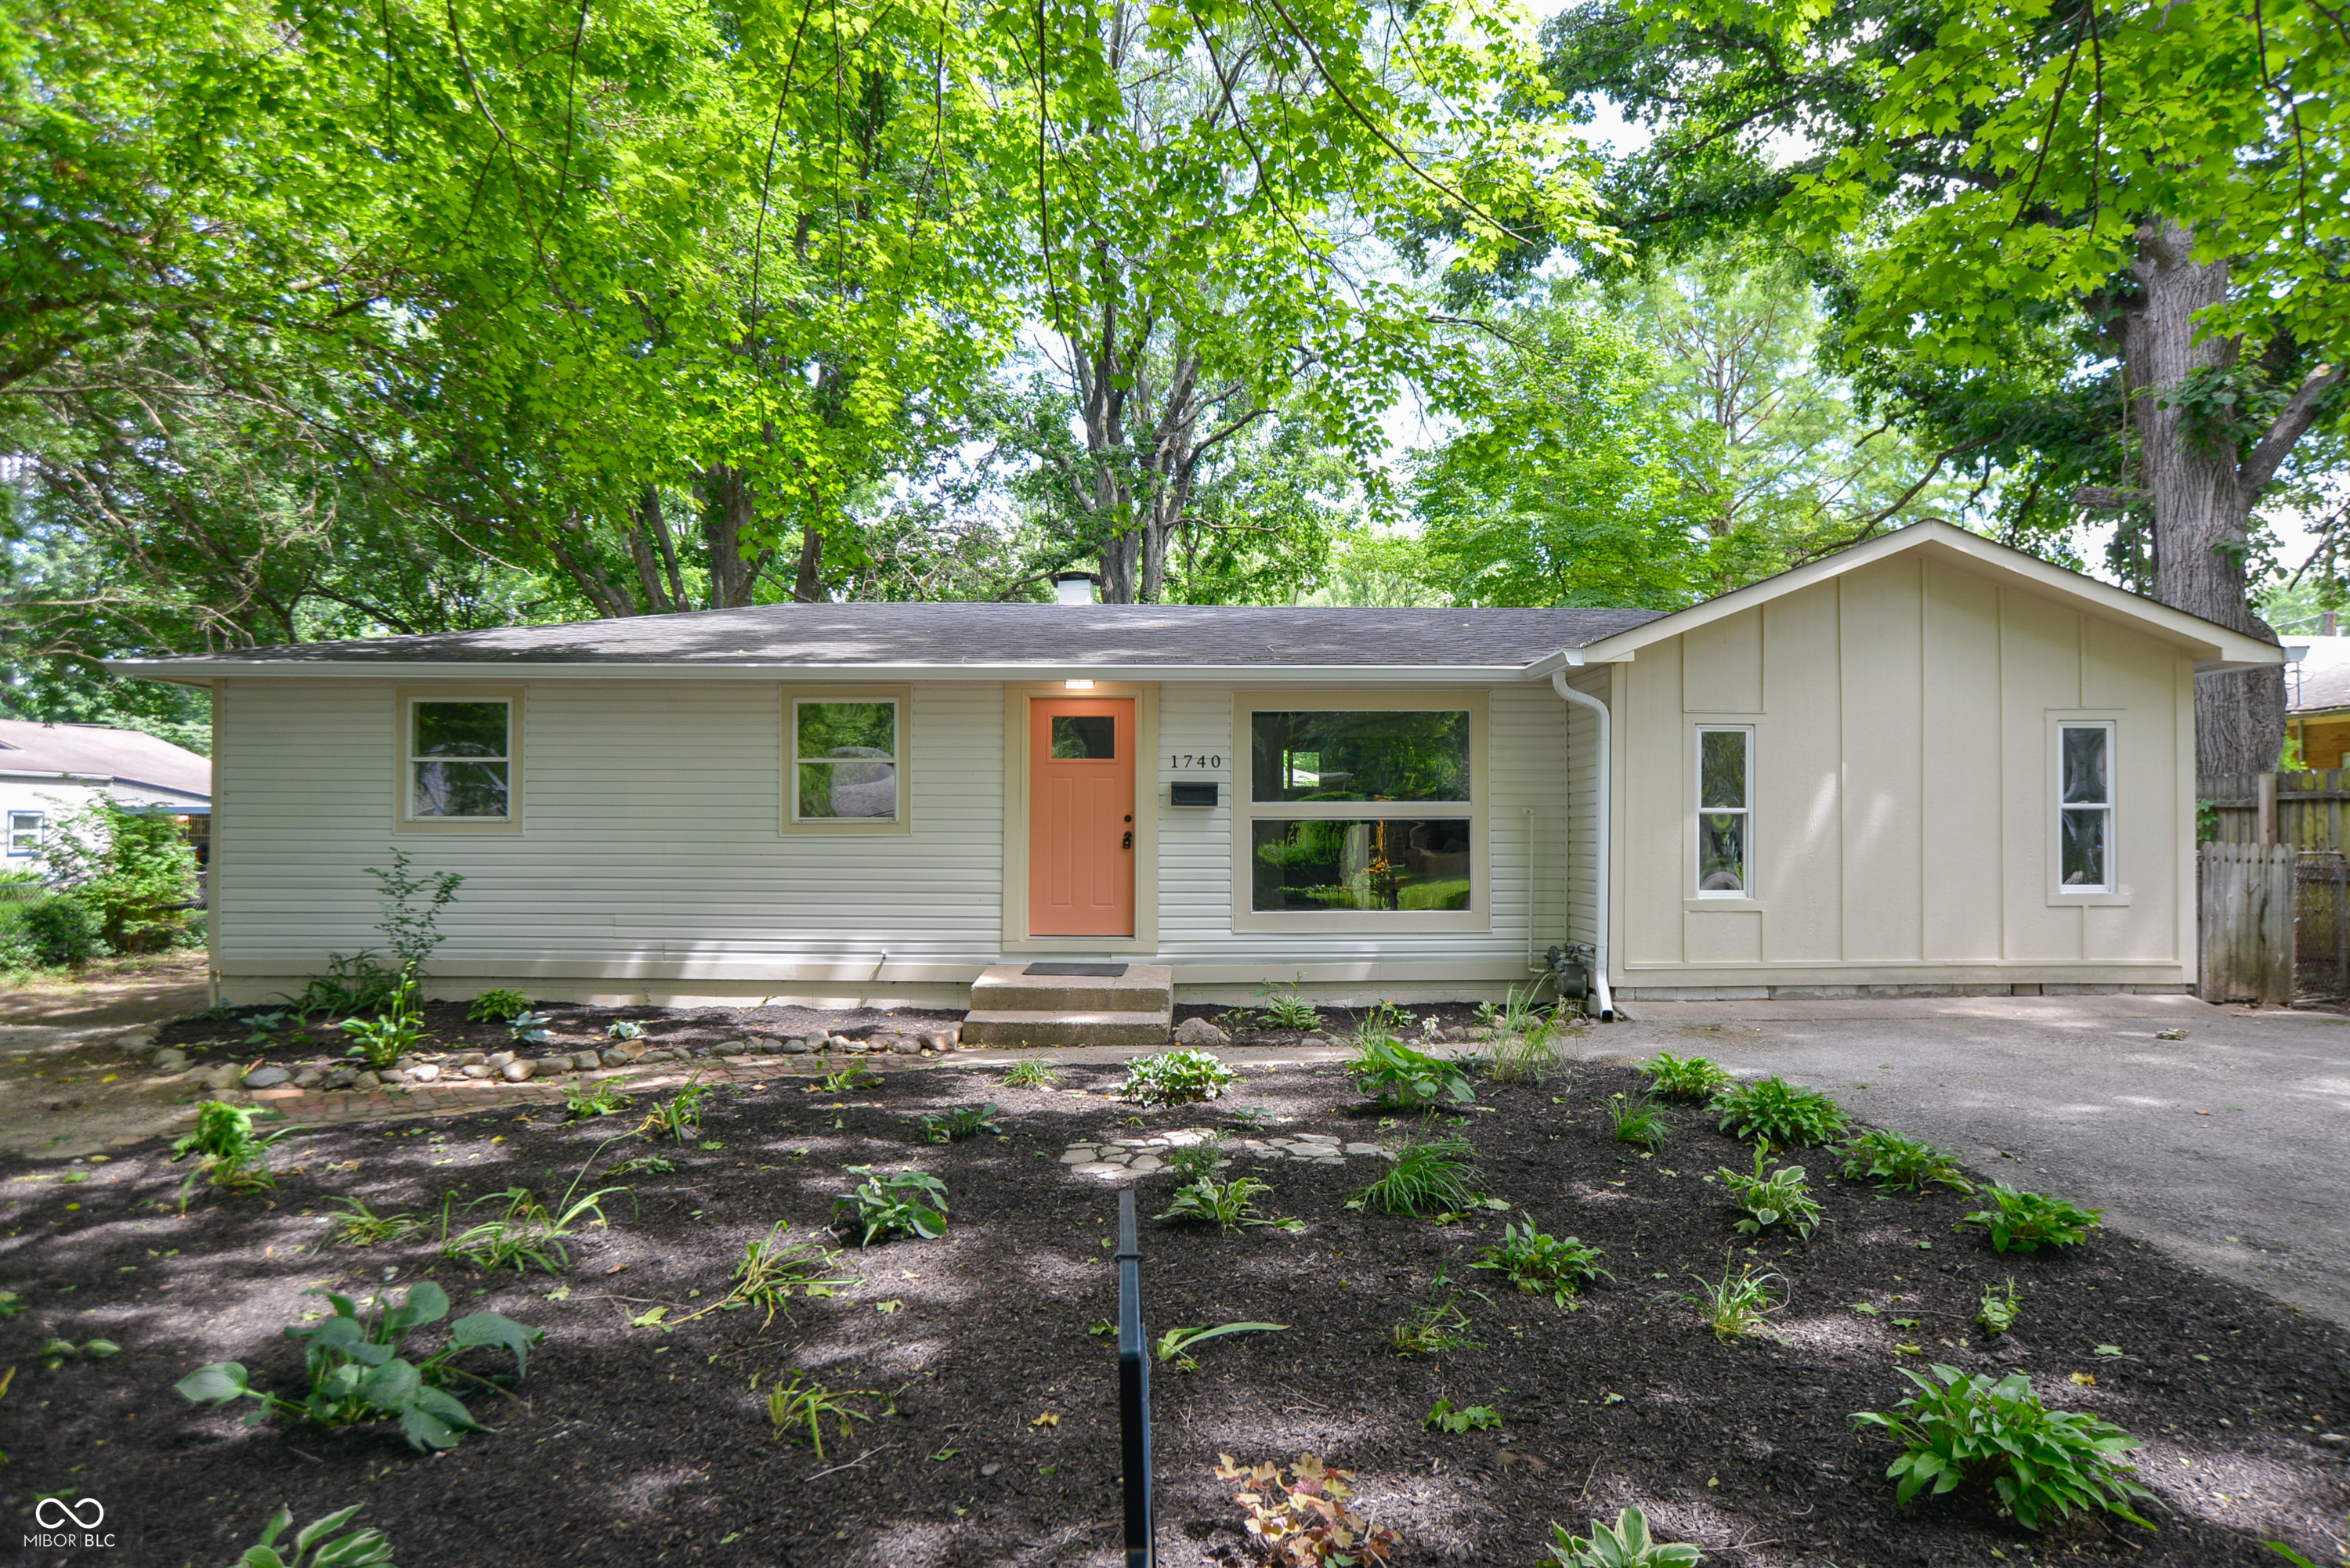
1740 Haynes Ave, Indianapolis, IN 46240
$130
Cash flow
2.6%
Cash-on-Cash Return
6.9%
Cap rate
0.8%
Rent to Value Ratio
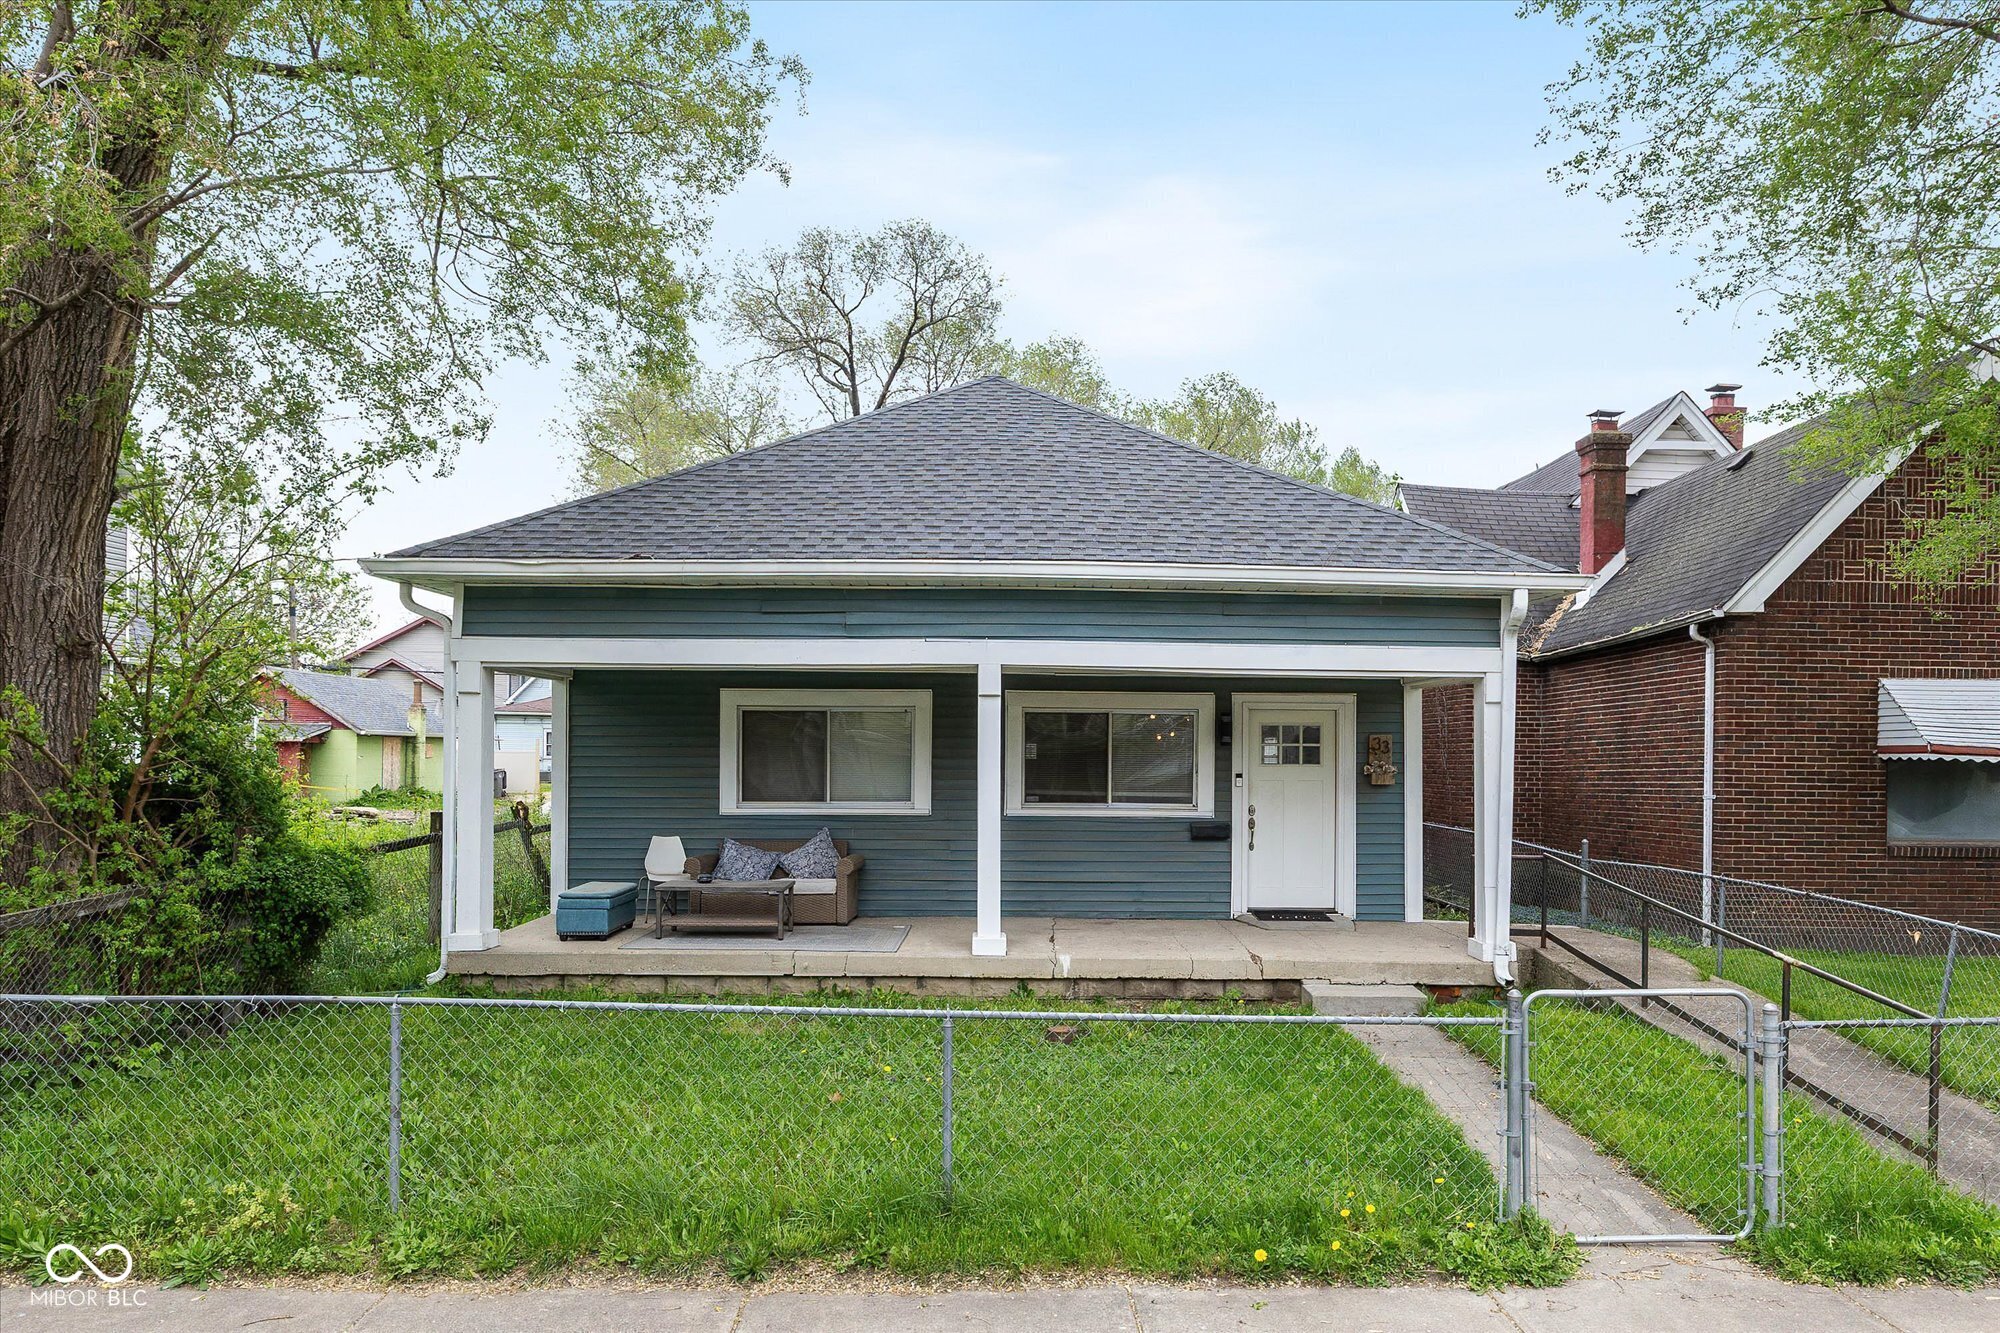
Active
$125,000
2
bds
|
0
ba
|
872
sqft
|
built
1870
324 Burgess Ave, Indianapolis, IN 46219
$311
Cash flow
13.0%
Cash-on-Cash Return
9.3%
Cap rate
1.1%
Rent to Value Ratio
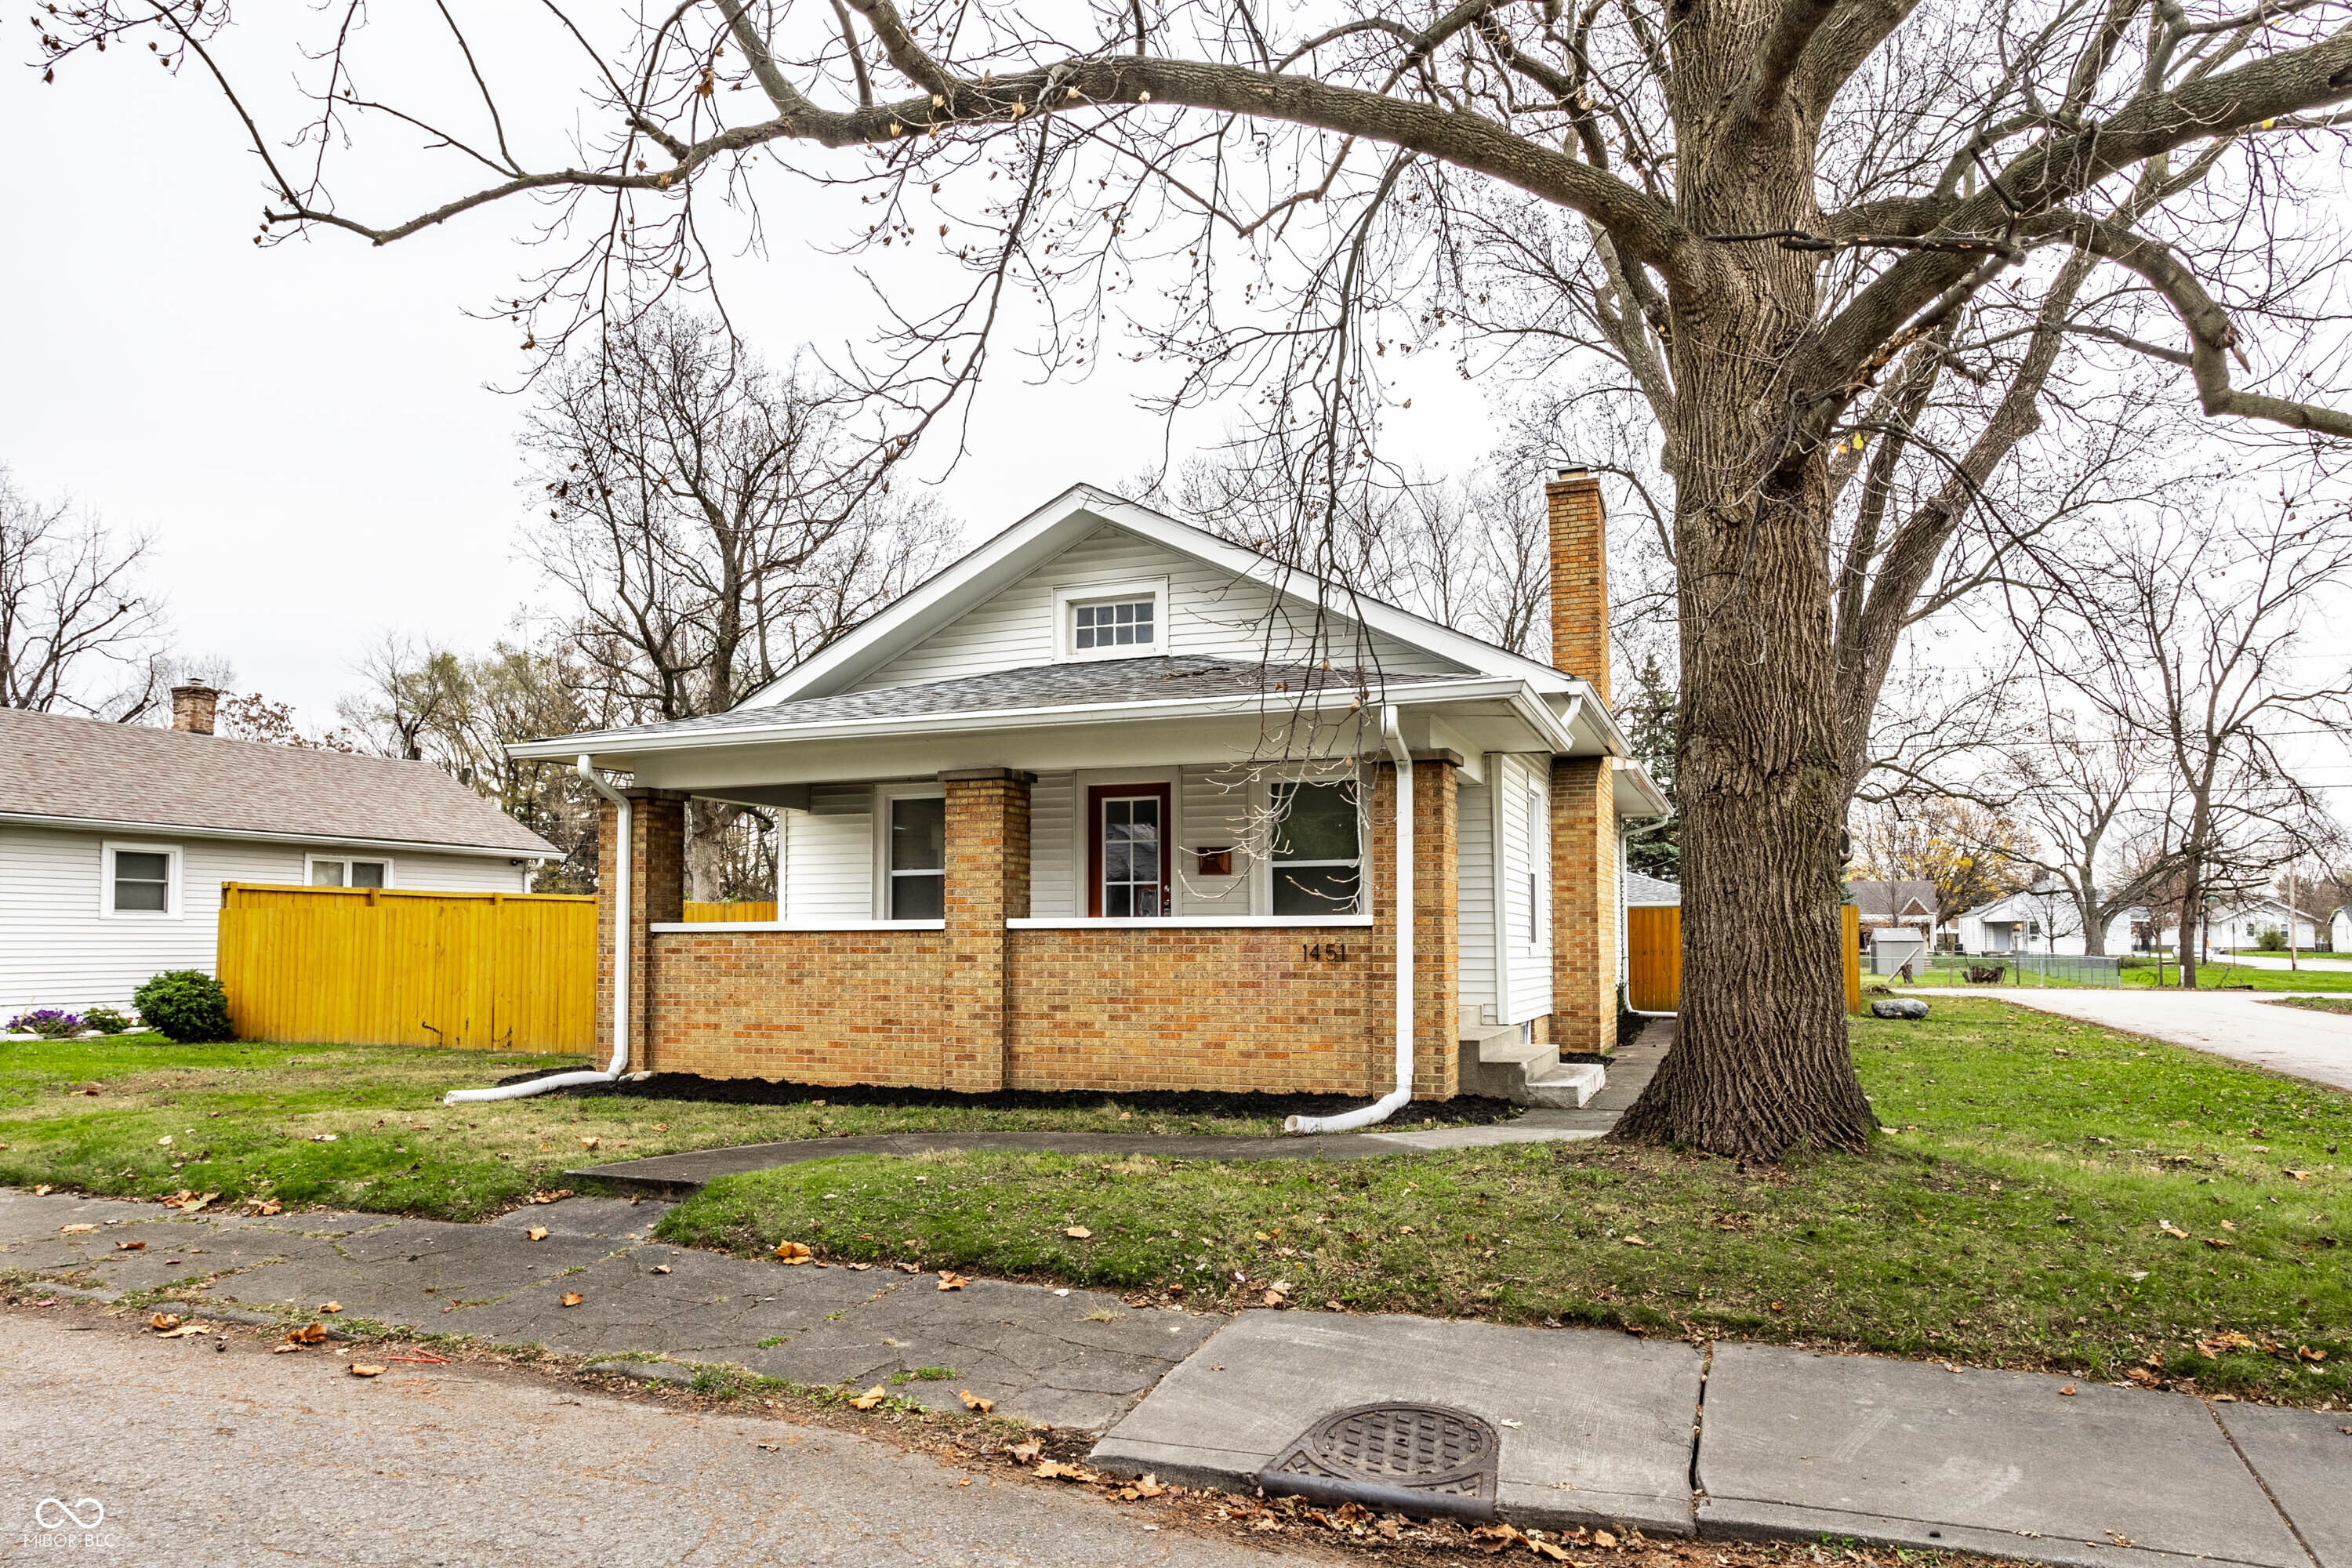
Pending
$225,000
2
bds
|
1
ba
|
1,084
sqft
|
built
1910
1451 N Grant Ave, Indianapolis, IN 46201
$202
Cash flow
4.7%
Cash-on-Cash Return
7.4%
Cap rate
0.9%
Rent to Value Ratio
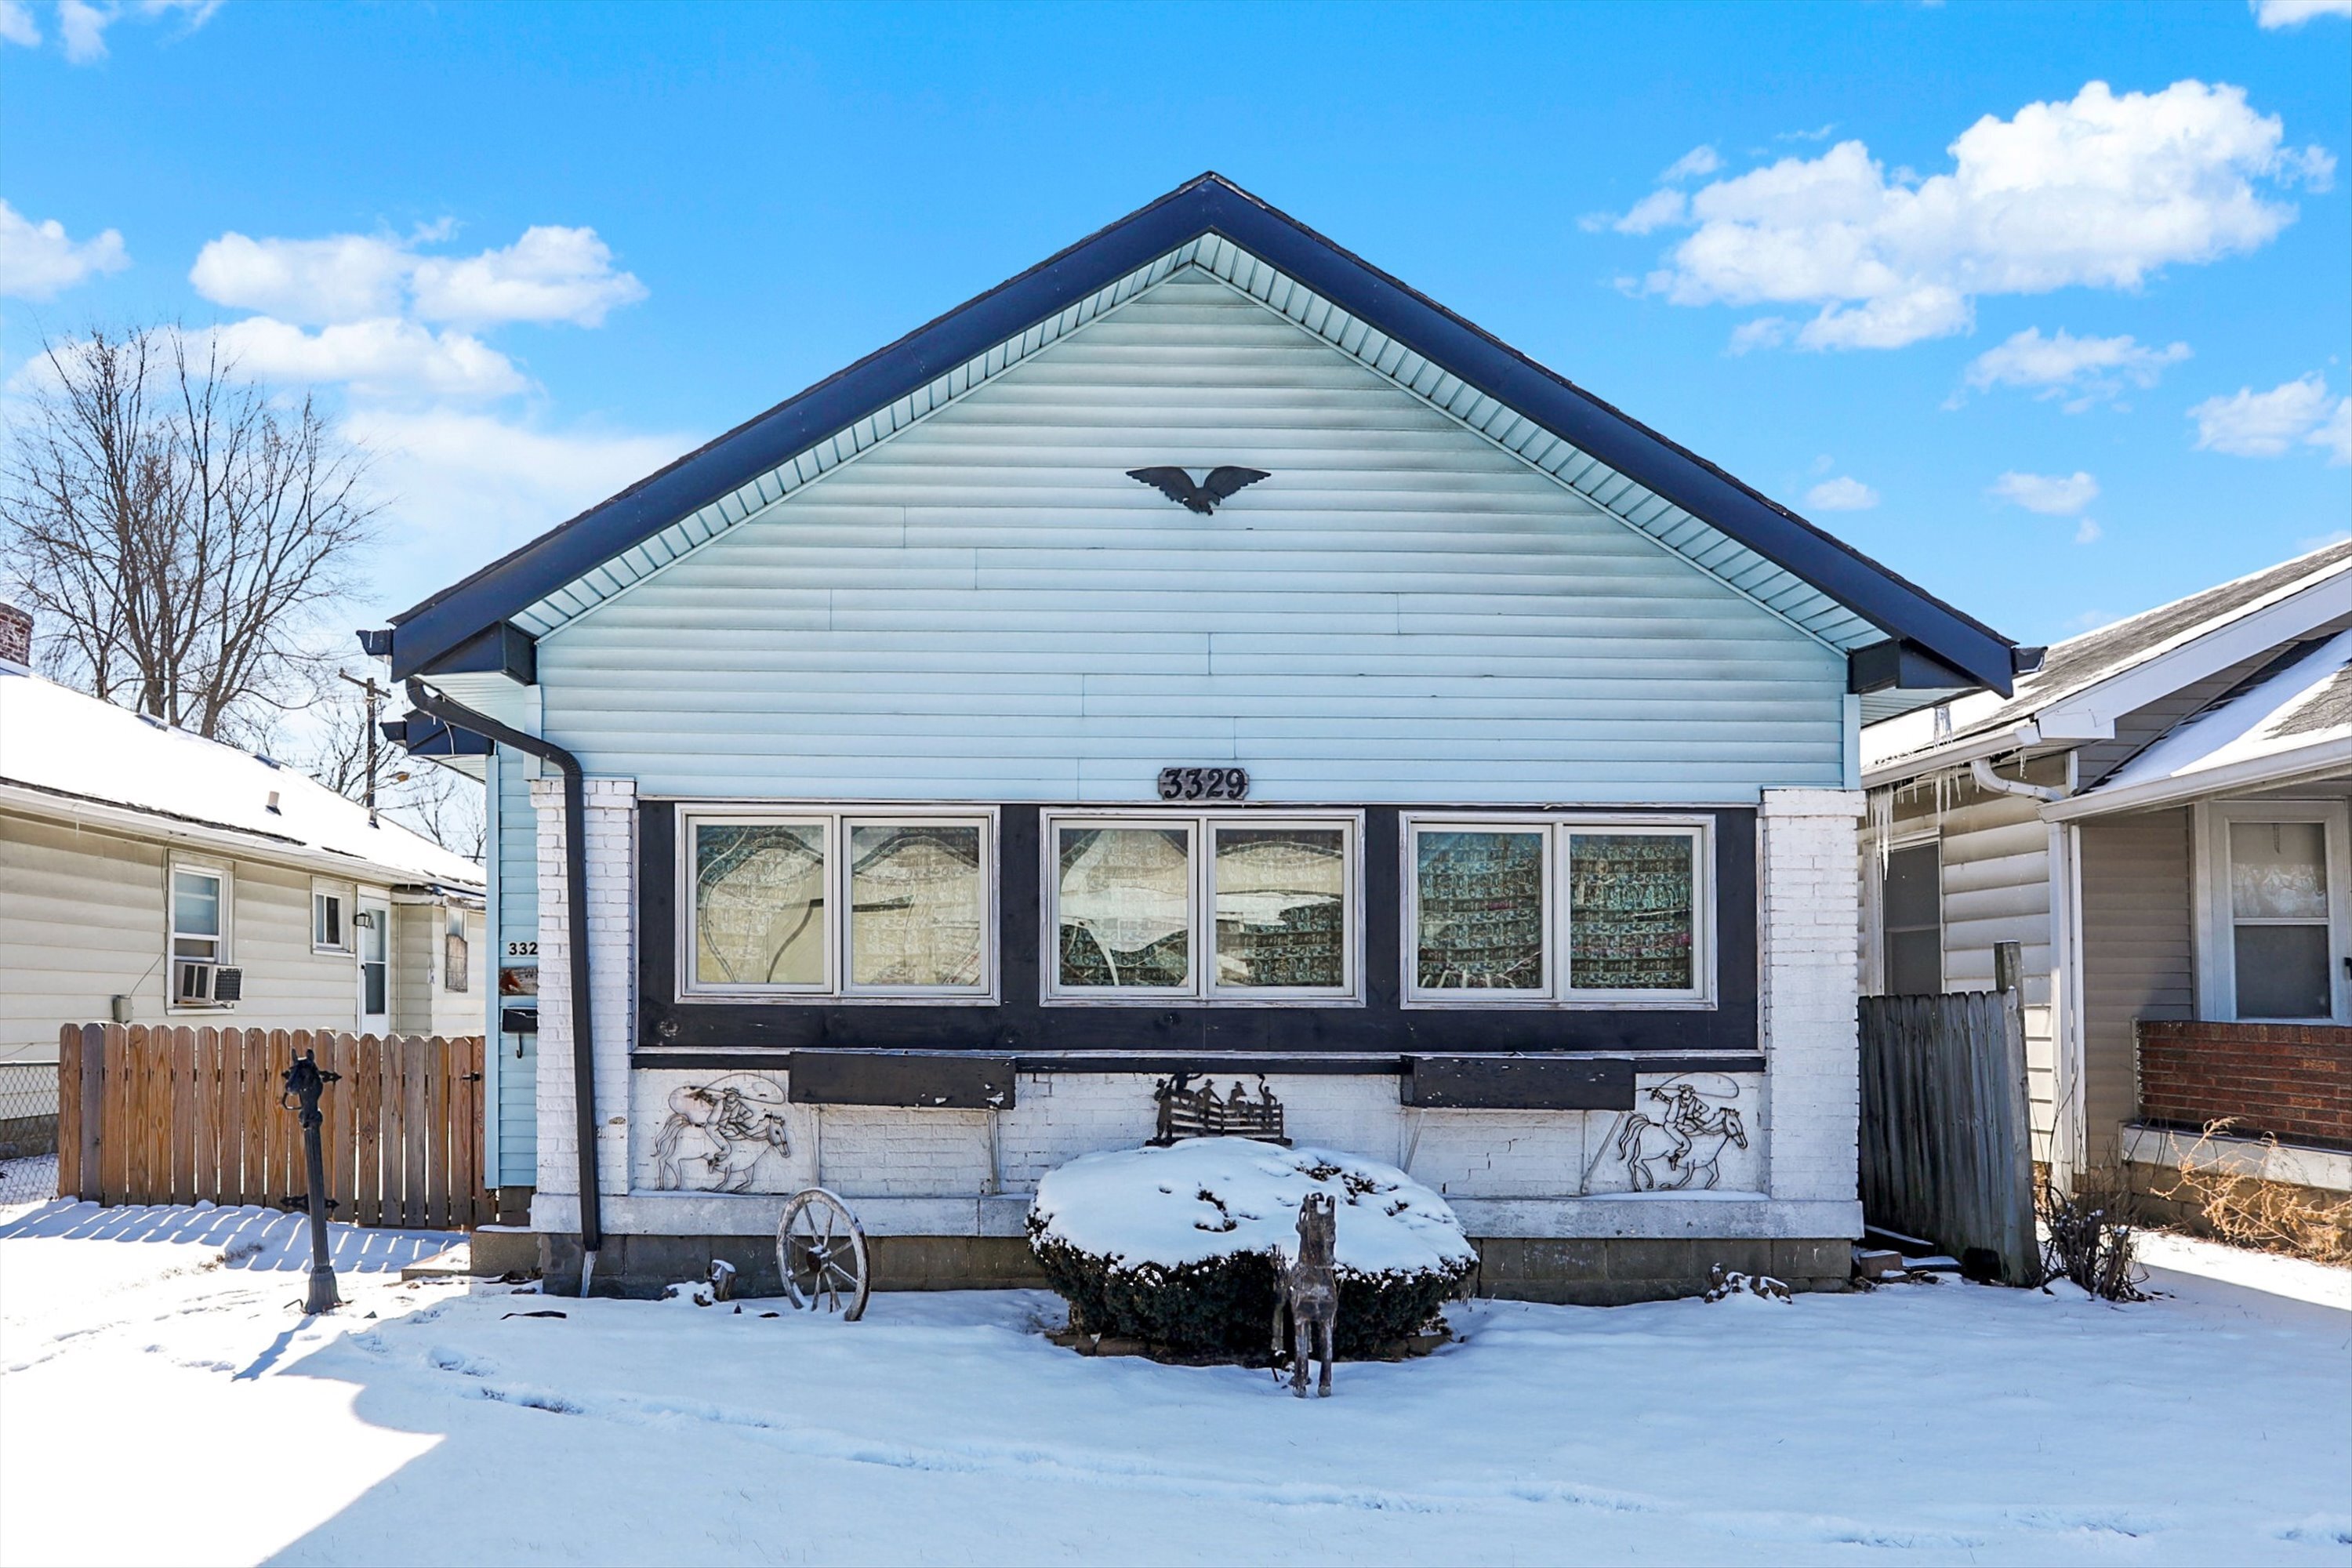
Active
$159,000
2
bds
|
2
ba
|
1,094
sqft
|
built
1932
3329 W 10th St, Indianapolis, IN 46222
$133
Cash flow
4.4%
Cash-on-Cash Return
7.3%
Cap rate
0.9%
Rent to Value Ratio
Active
$280,000
4
bds
|
2
ba
|
1,798
sqft
|
built
1955
33 N Beville Ave, Indianapolis, IN 46201
$52
Cash flow
1.0%
Cash-on-Cash Return
6.5%
Cap rate
0.8%
Rent to Value Ratio
Active
$65,000
2
bds
|
1
ba
|
780
sqft
|
built
1940
3336 S Rybolt Ave, Indianapolis, IN 46221
$621
Cash flow
11.1%
Cash-on-Cash Return
11.5%
Cap rate
1.4%
Rent to Value Ratio
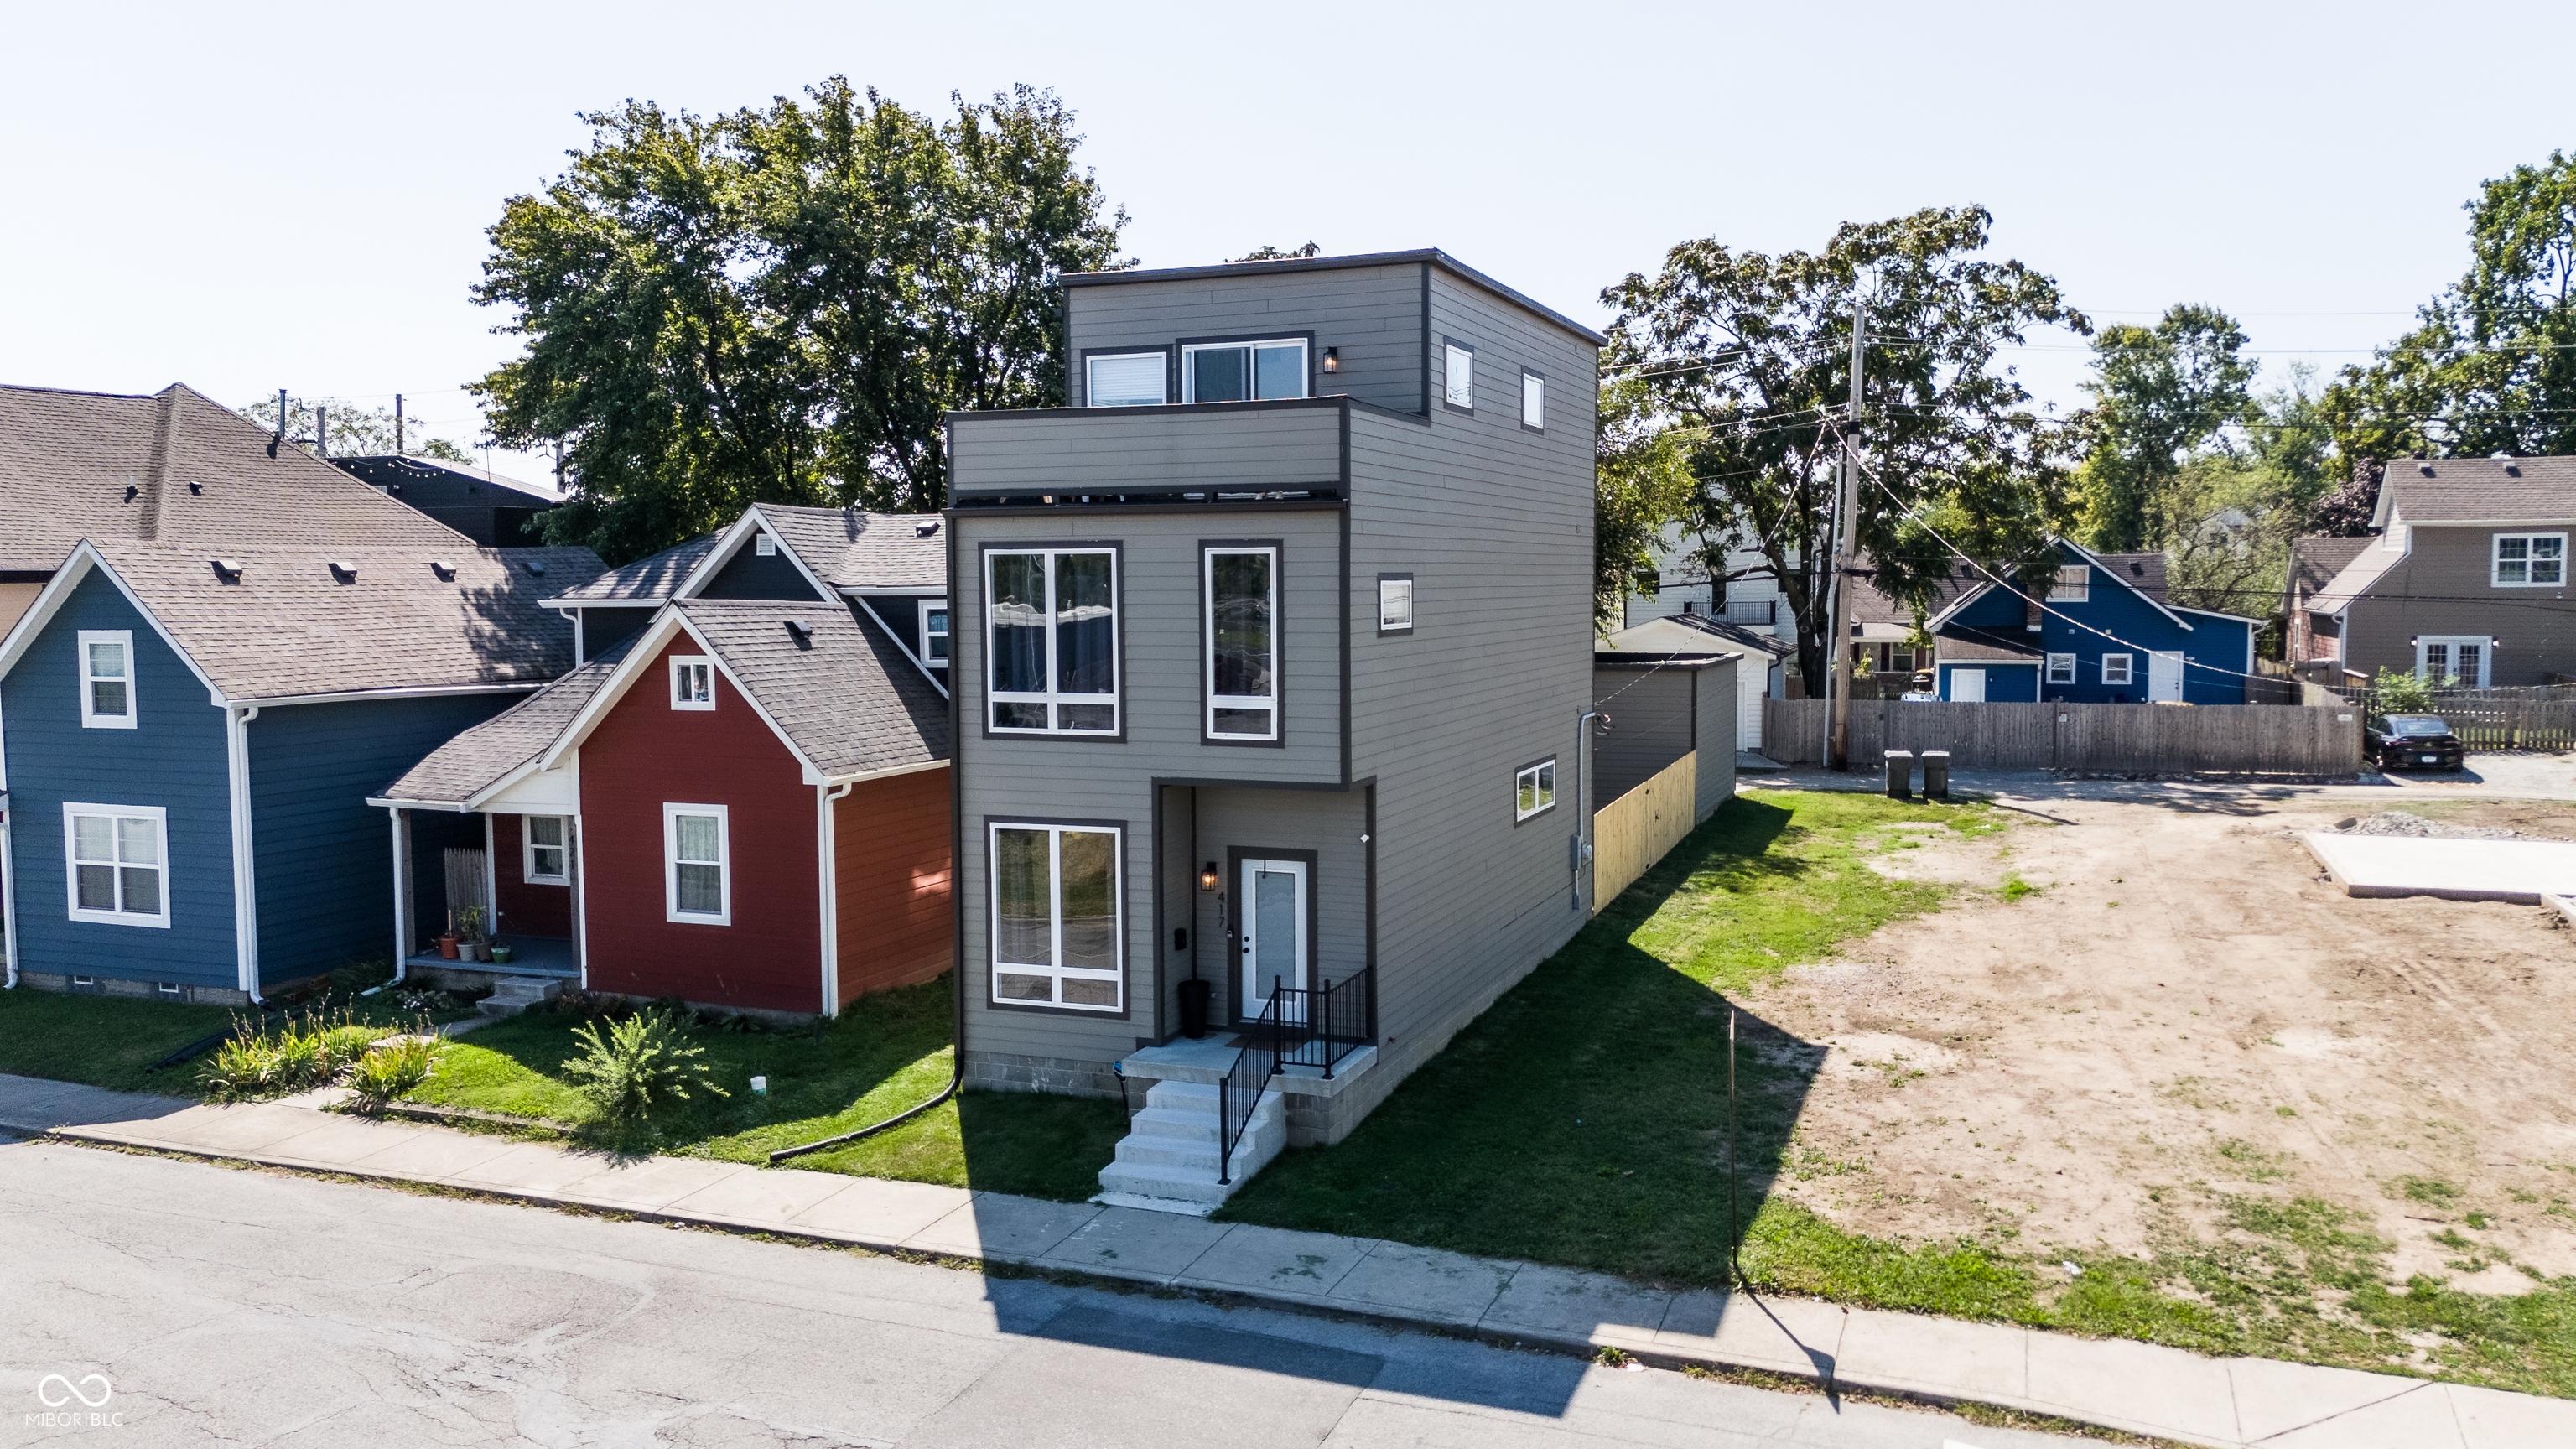
Active
$449,000
3
bds
|
4
ba
|
1,972
sqft
|
built
2021
417 E Morris St, Indianapolis, IN 46225
$64
Cash flow
0.7%
Cash-on-Cash Return
6.5%
Cap rate
0.8%
Rent to Value Ratio
Active
$177,000
2
bds
|
2
ba
|
1,375
sqft
|
built
2005
6231 Amber Creek Ln, Indianapolis, IN 46237
$-226
Cash flow
-6.7%
Cash-on-Cash Return
4.8%
Cap rate
0.8%
Rent to Value Ratio
Active
$280,000
3
bds
|
3
ba
|
1,400
sqft
|
built
2022
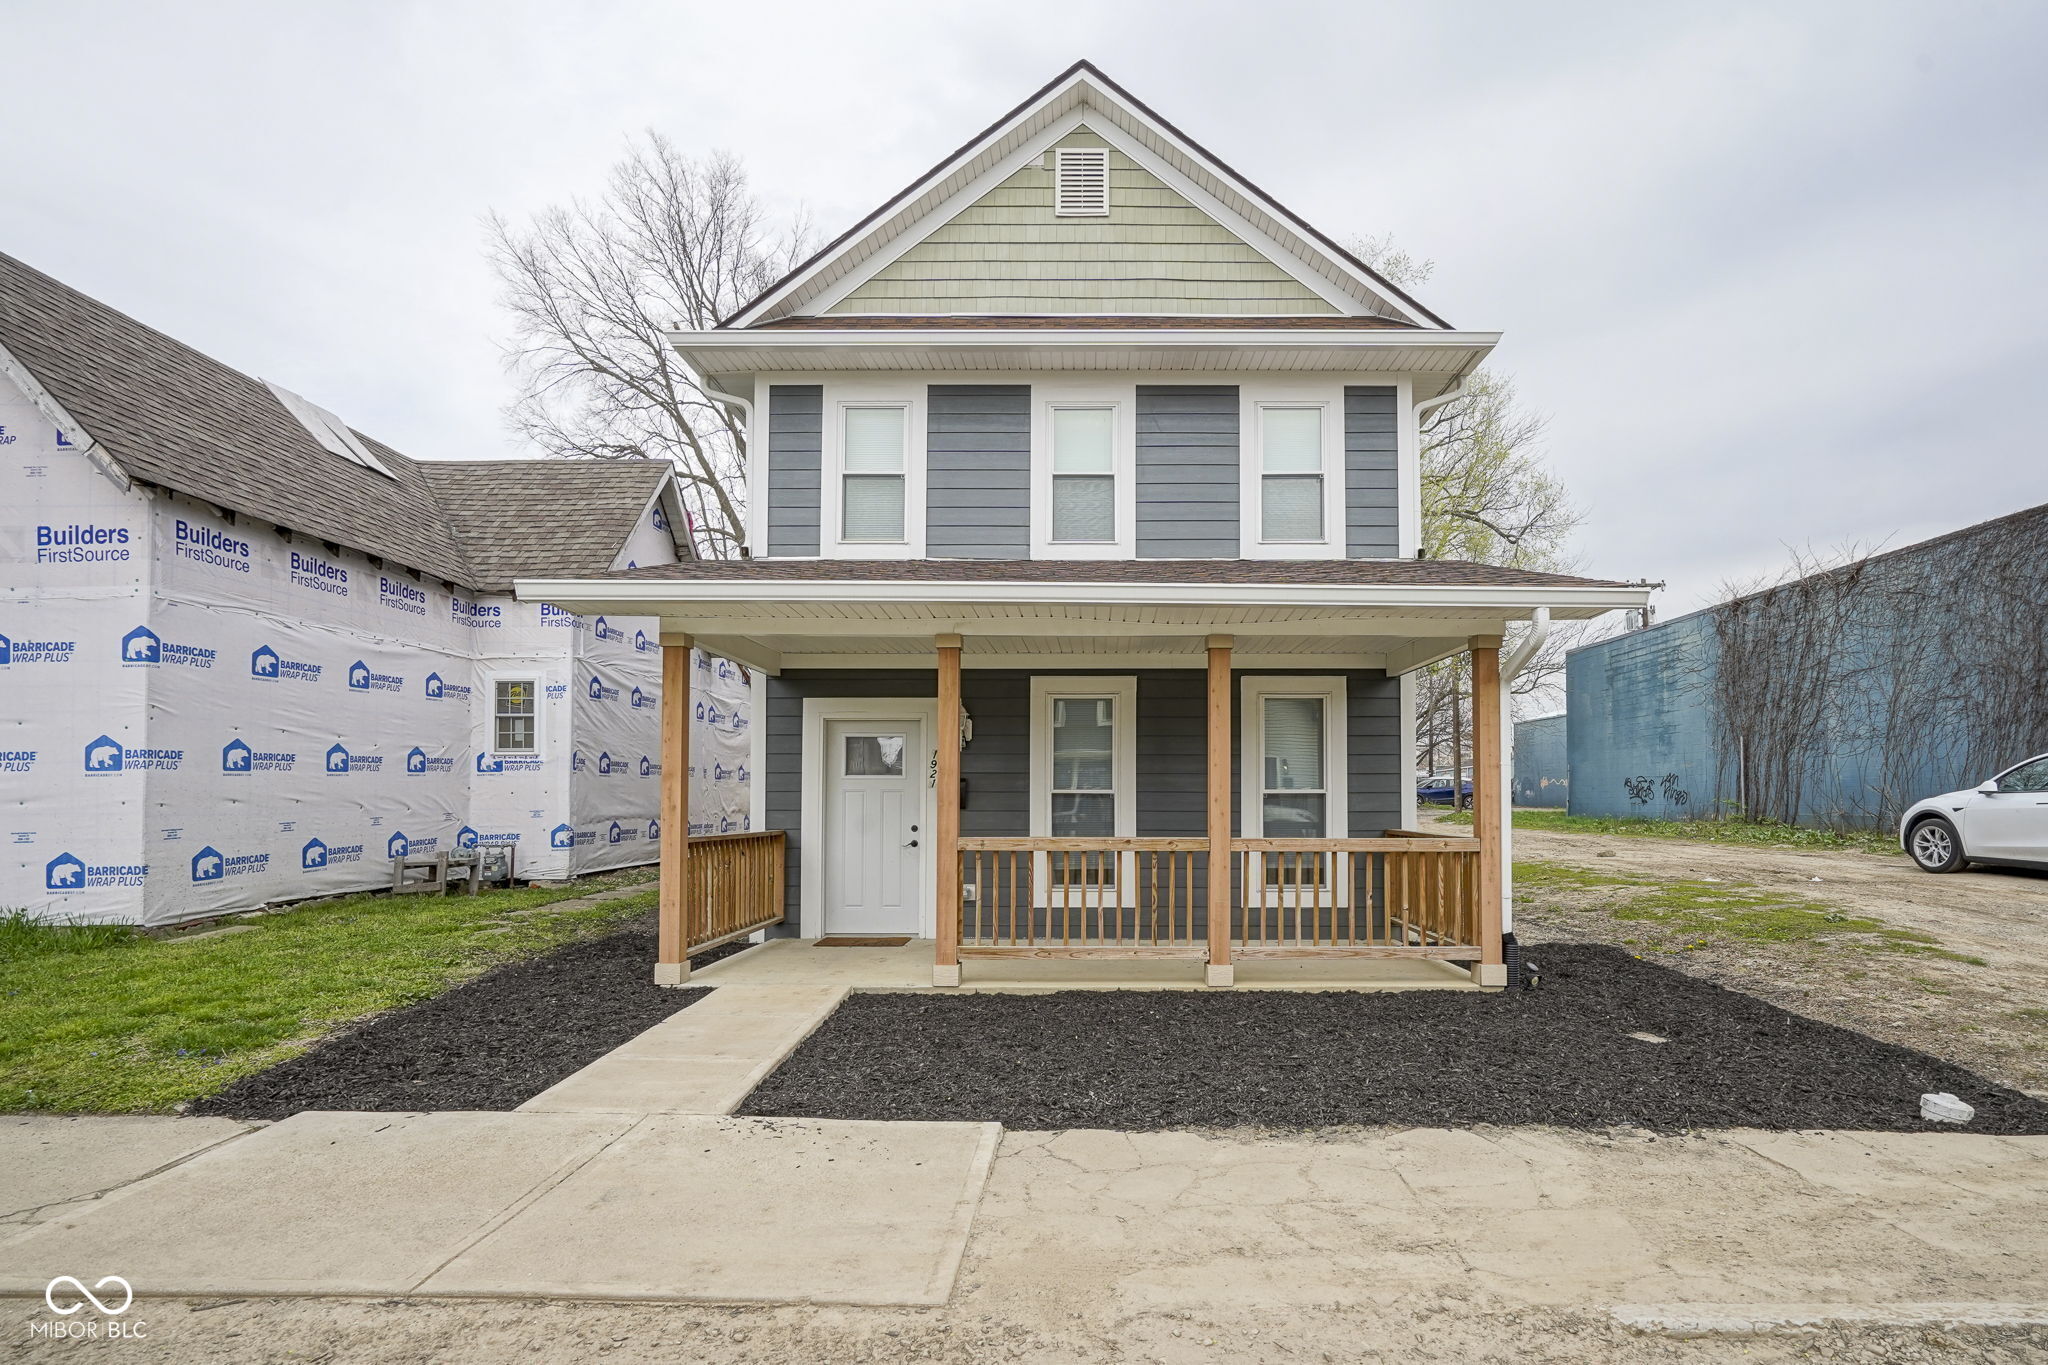
1921 Union St, Indianapolis, IN 46225
$-86
Cash flow
-1.6%
Cash-on-Cash Return
5.9%
Cap rate
0.7%
Rent to Value Ratio
Active
$190,000
4
bds
|
2
ba
|
1,269
sqft
|
built
1971
415 W Gimber St, Indianapolis, IN 46225
$-29
Cash flow
-0.8%
Cash-on-Cash Return
6.1%
Cap rate
0.7%
Rent to Value Ratio
Active
$525,000
3
bds
|
3
ba
|
2,064
sqft
|
built
1900
1156 Spruce St, Indianapolis, IN 46203
$-955
Cash flow
-9.5%
Cash-on-Cash Return
4.1%
Cap rate
0.5%
Rent to Value Ratio
Active
$239,900
3
bds
|
2
ba
|
1,032
sqft
|
built
1957
7088 Sandalwood Dr, Indianapolis, IN 46217
$-221
Cash flow
-4.8%
Cash-on-Cash Return
5.2%
Cap rate
0.6%
Rent to Value Ratio
Active
$200,000
4
bds
|
2
ba
|
1,271
sqft
|
built
1943
1141 N Shadeland Ave, Indianapolis, IN 46219
$-288
Cash flow
-7.5%
Cash-on-Cash Return
4.6%
Cap rate
0.5%
Rent to Value Ratio
Active
$257,900
3
bds
|
2
ba
|
1,558
sqft
|
built
1916
909 N Parker Ave, Indianapolis, IN 46201
$-109
Cash flow
-2.2%
Cash-on-Cash Return
5.8%
Cap rate
0.7%
Rent to Value Ratio
Active
$312,000
3
bds
|
2
ba
|
1,668
sqft
|
built
1910
344 N Whittier Pl, Indianapolis, IN 46219
$-668
Cash flow
-11.2%
Cash-on-Cash Return
3.7%
Cap rate
0.4%
Rent to Value Ratio
Active
$114,900
4
bds
|
2
ba
|
1,748
sqft
|
built
1924
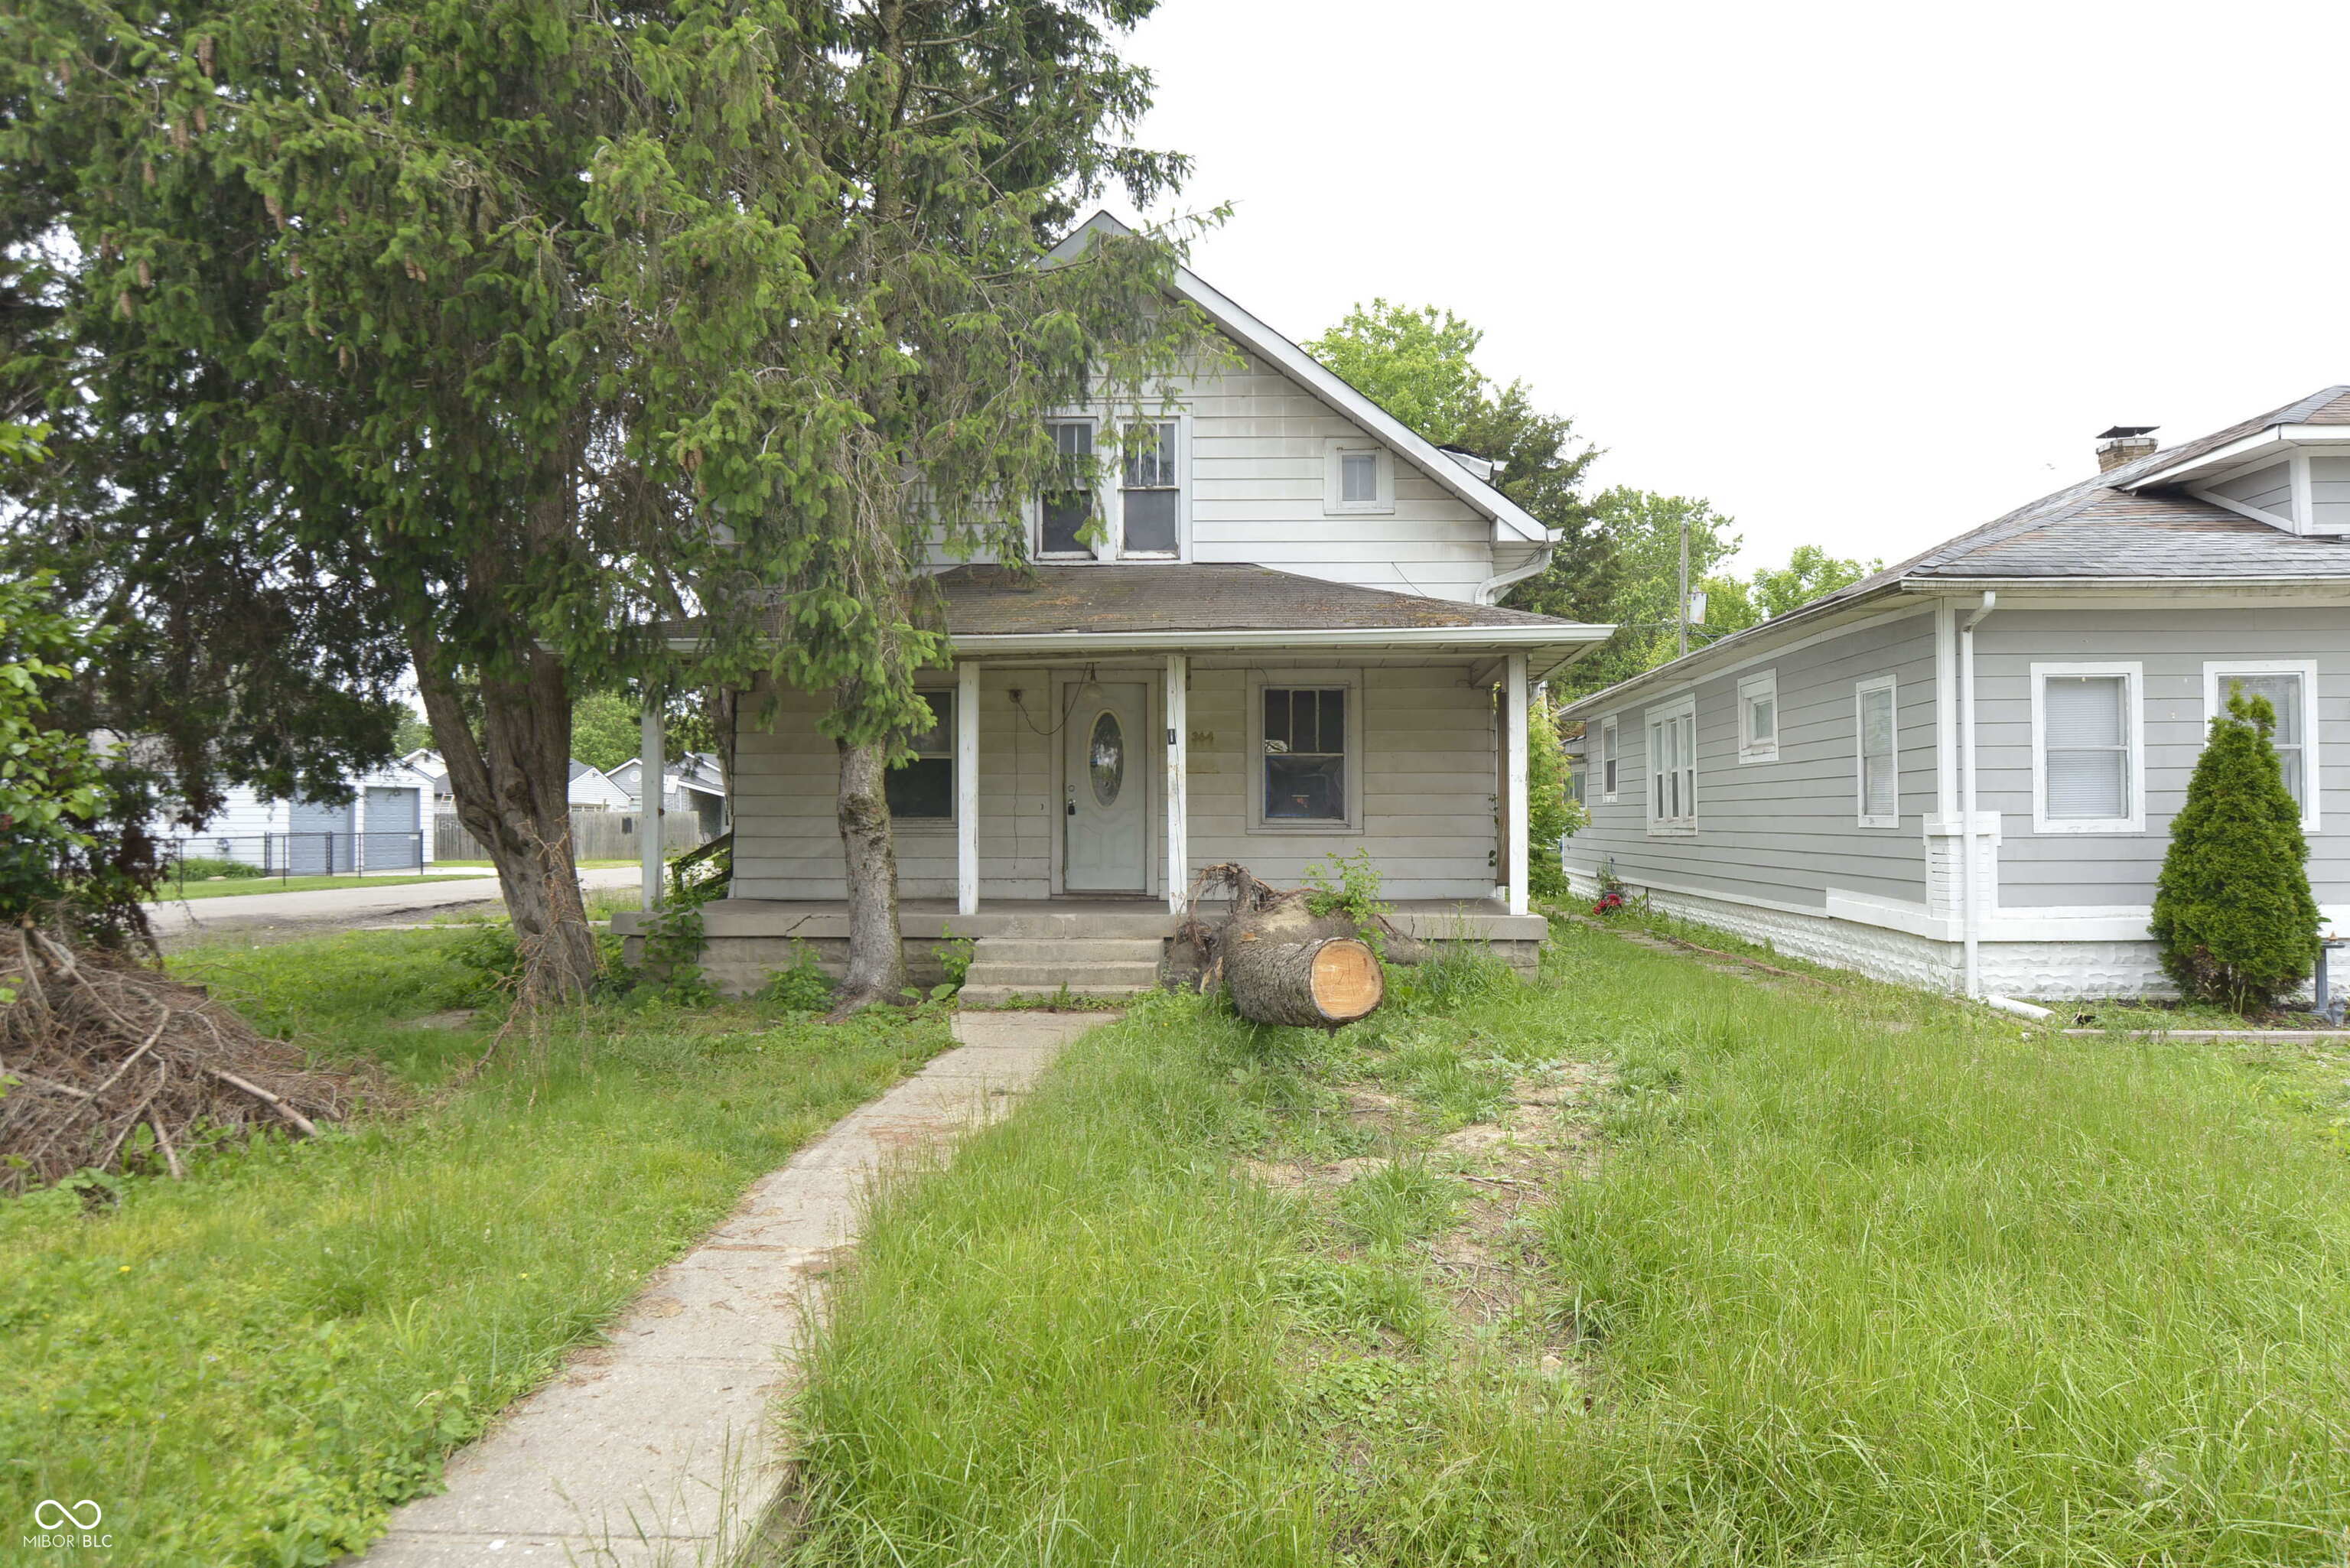
364 S Cole St, Indianapolis, IN 46241
$364
Cash flow
16.5%
Cash-on-Cash Return
10.1%
Cap rate
1.2%
Rent to Value Ratio
Active
$327,000
3
bds
|
3
ba
|
1,808
sqft
|
built
2019
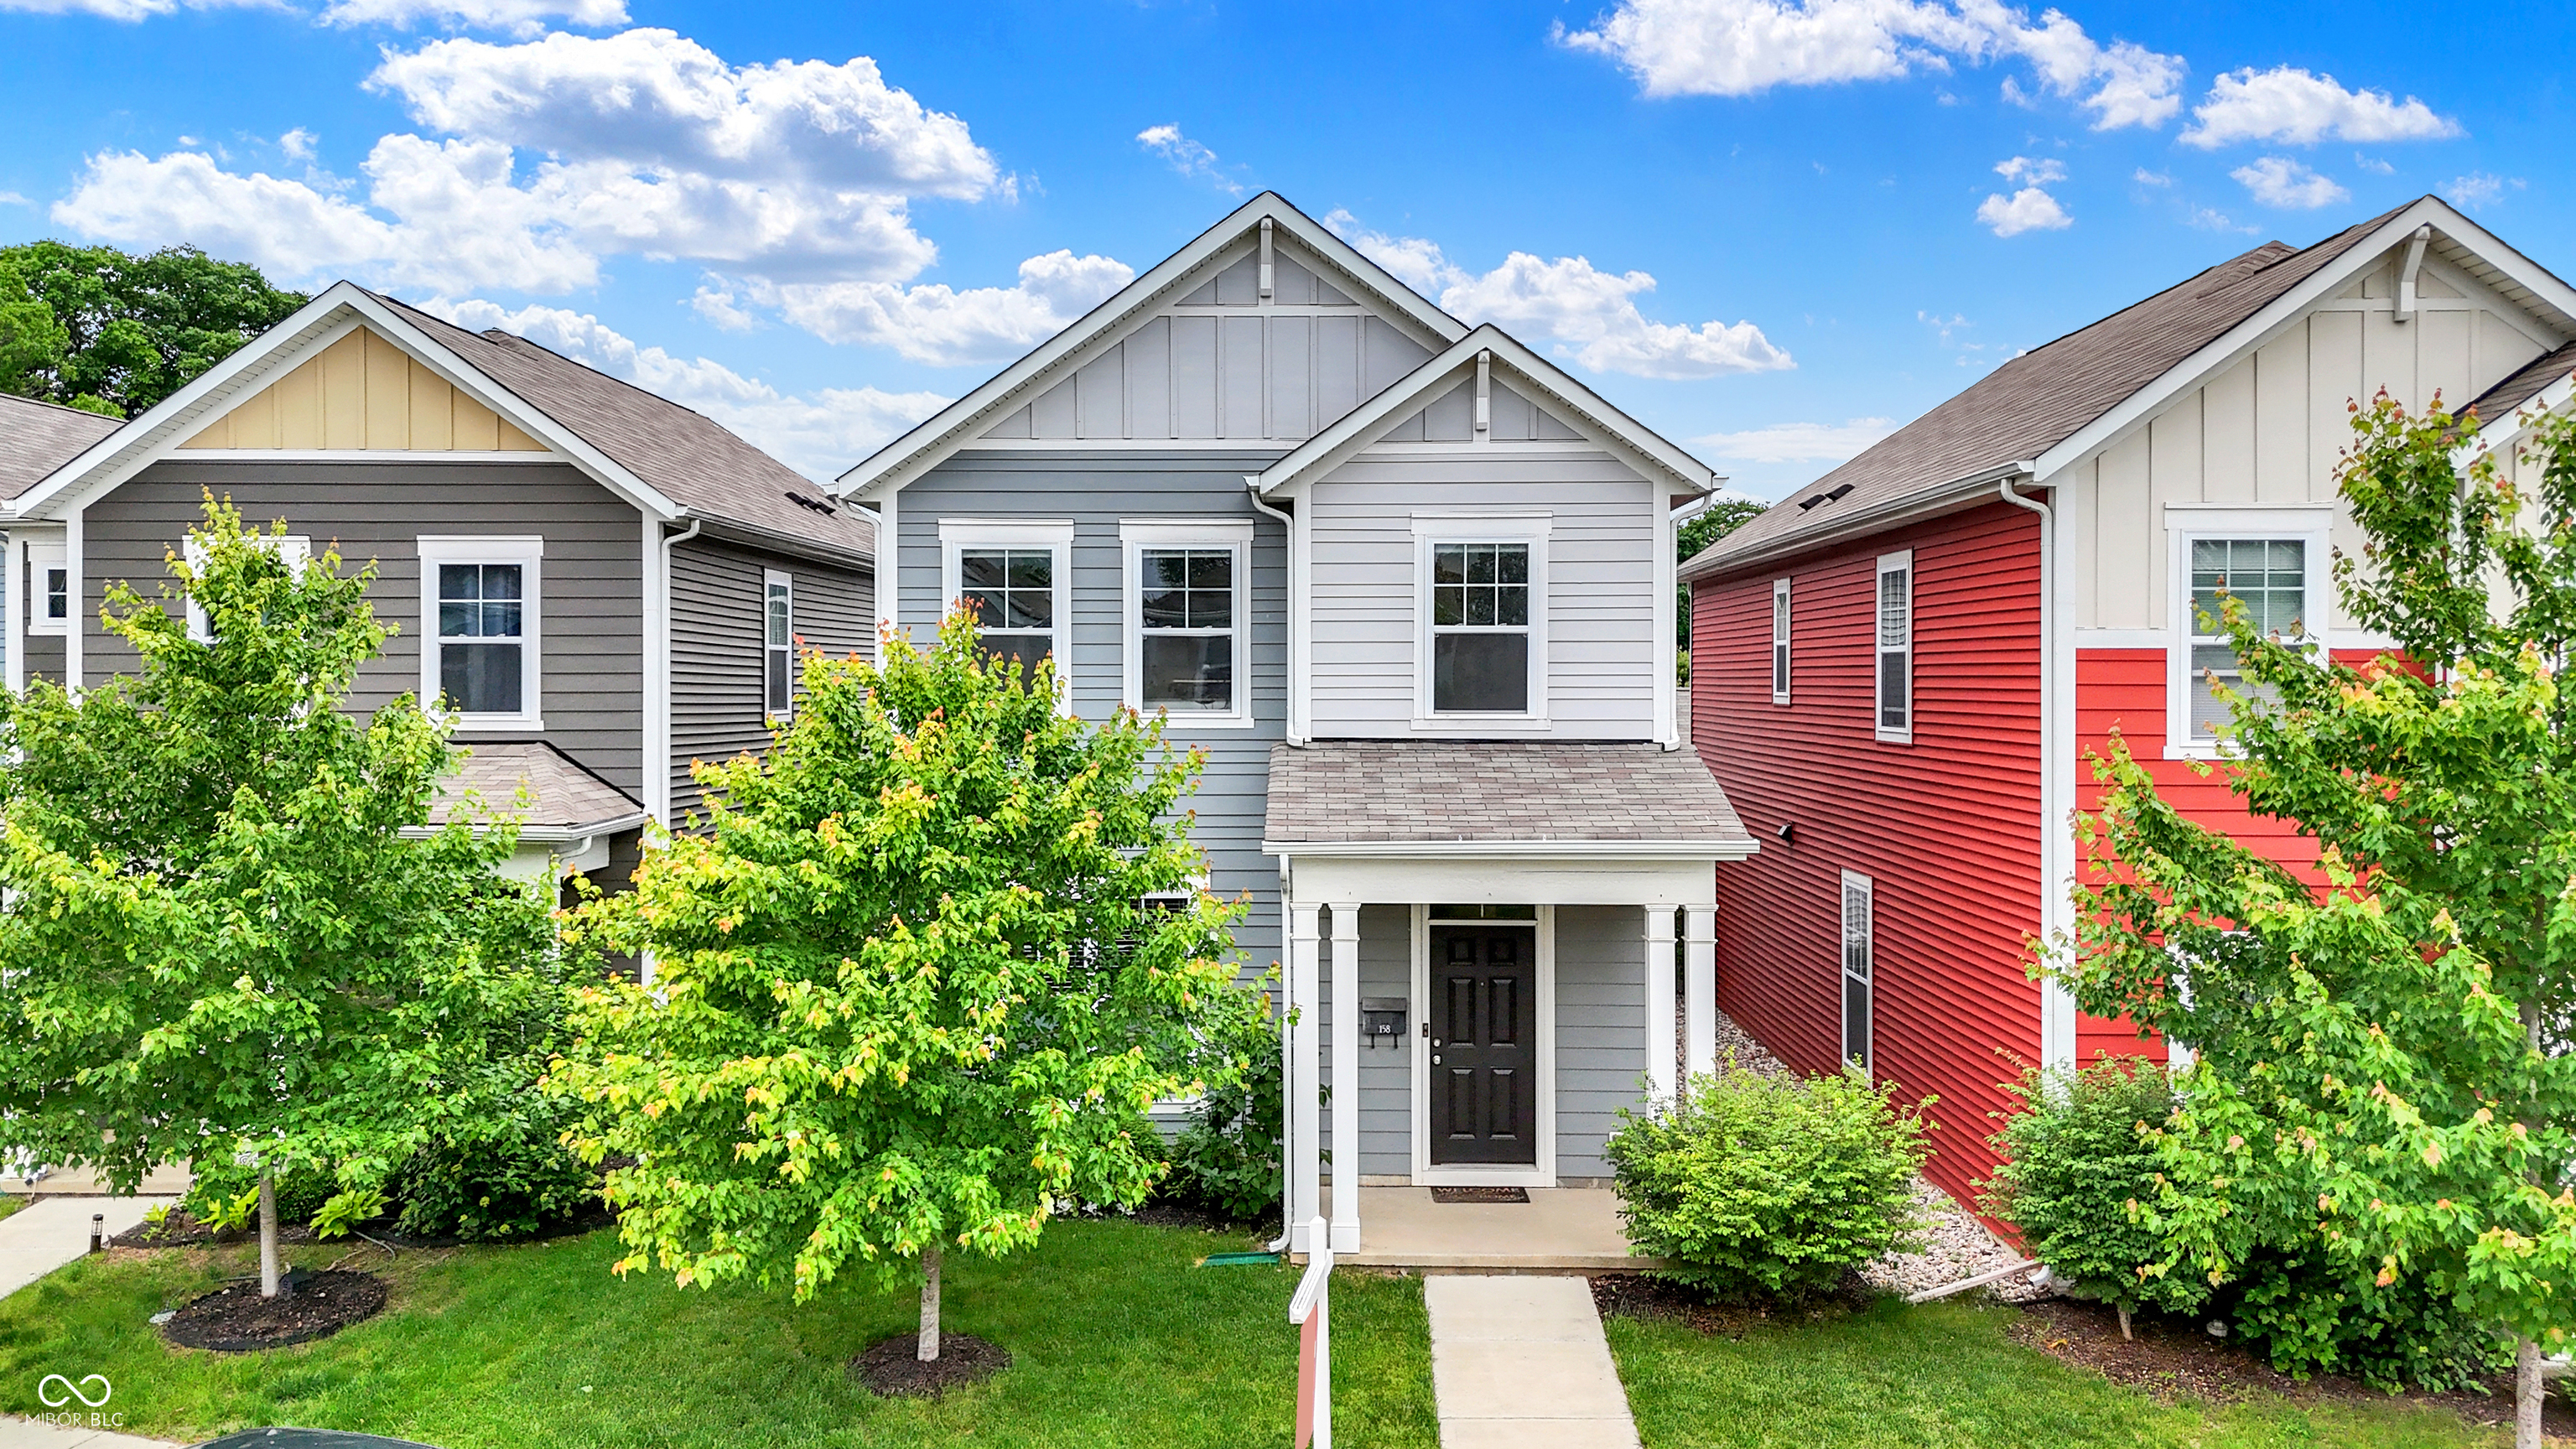
158 Handley St, Indianapolis, IN 46222
$-162
Cash flow
-2.6%
Cash-on-Cash Return
5.7%
Cap rate
0.7%
Rent to Value Ratio
Active
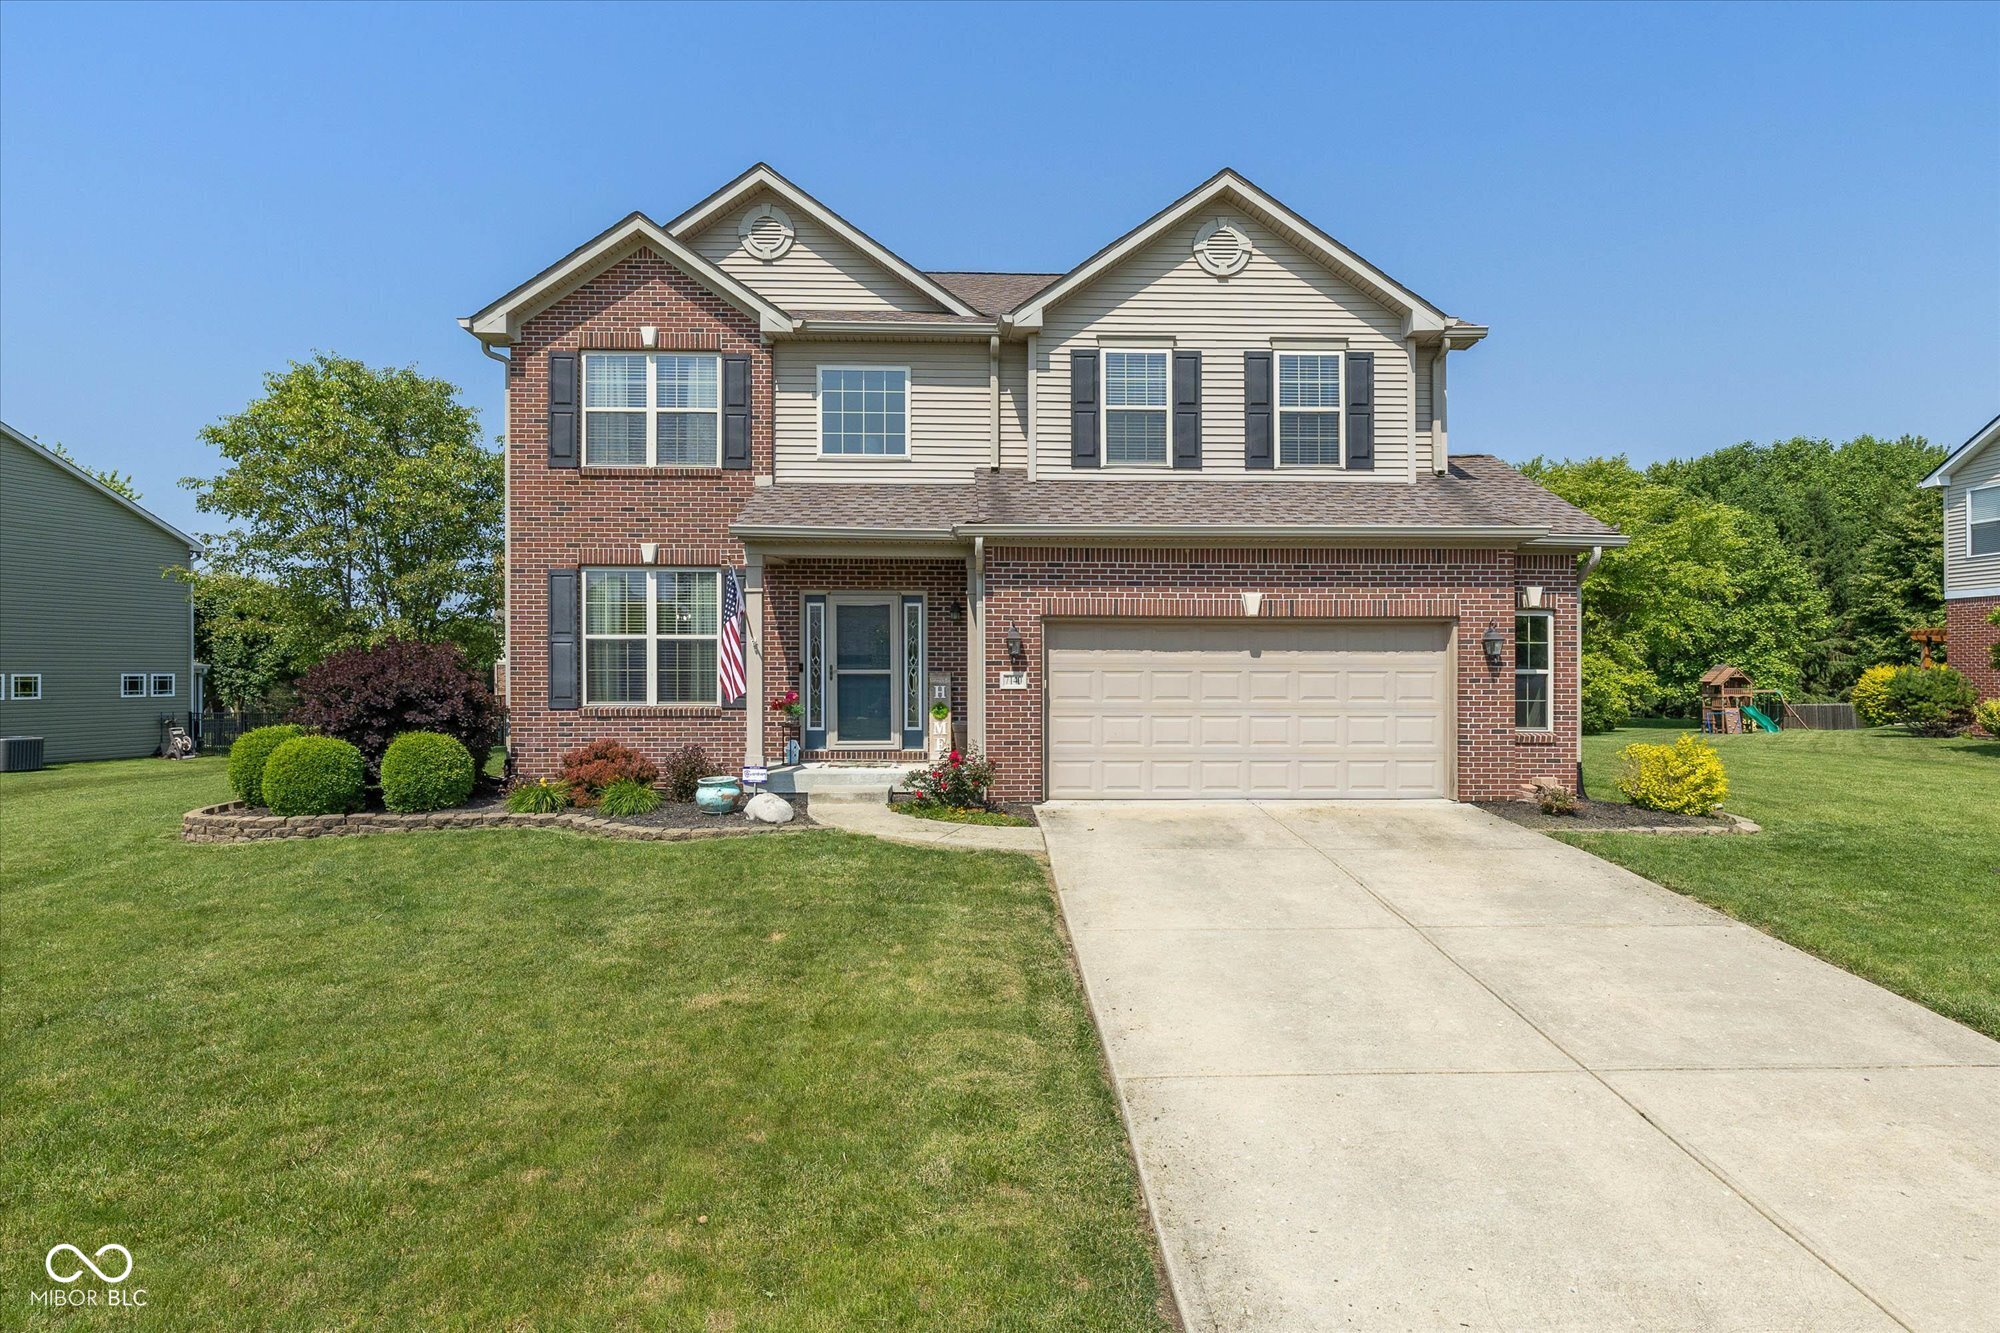
$404,900
4
bds
|
3
ba
|
2,828
sqft
|
built
2009
7140 Lakeland Trails Blvd, Indianapolis, IN 46259
$-151
Cash flow
-1.9%
Cash-on-Cash Return
5.8%
Cap rate
0.7%
Rent to Value Ratio
Active
$250,000
3
bds
|
2
ba
|
1,258
sqft
|
built
1985
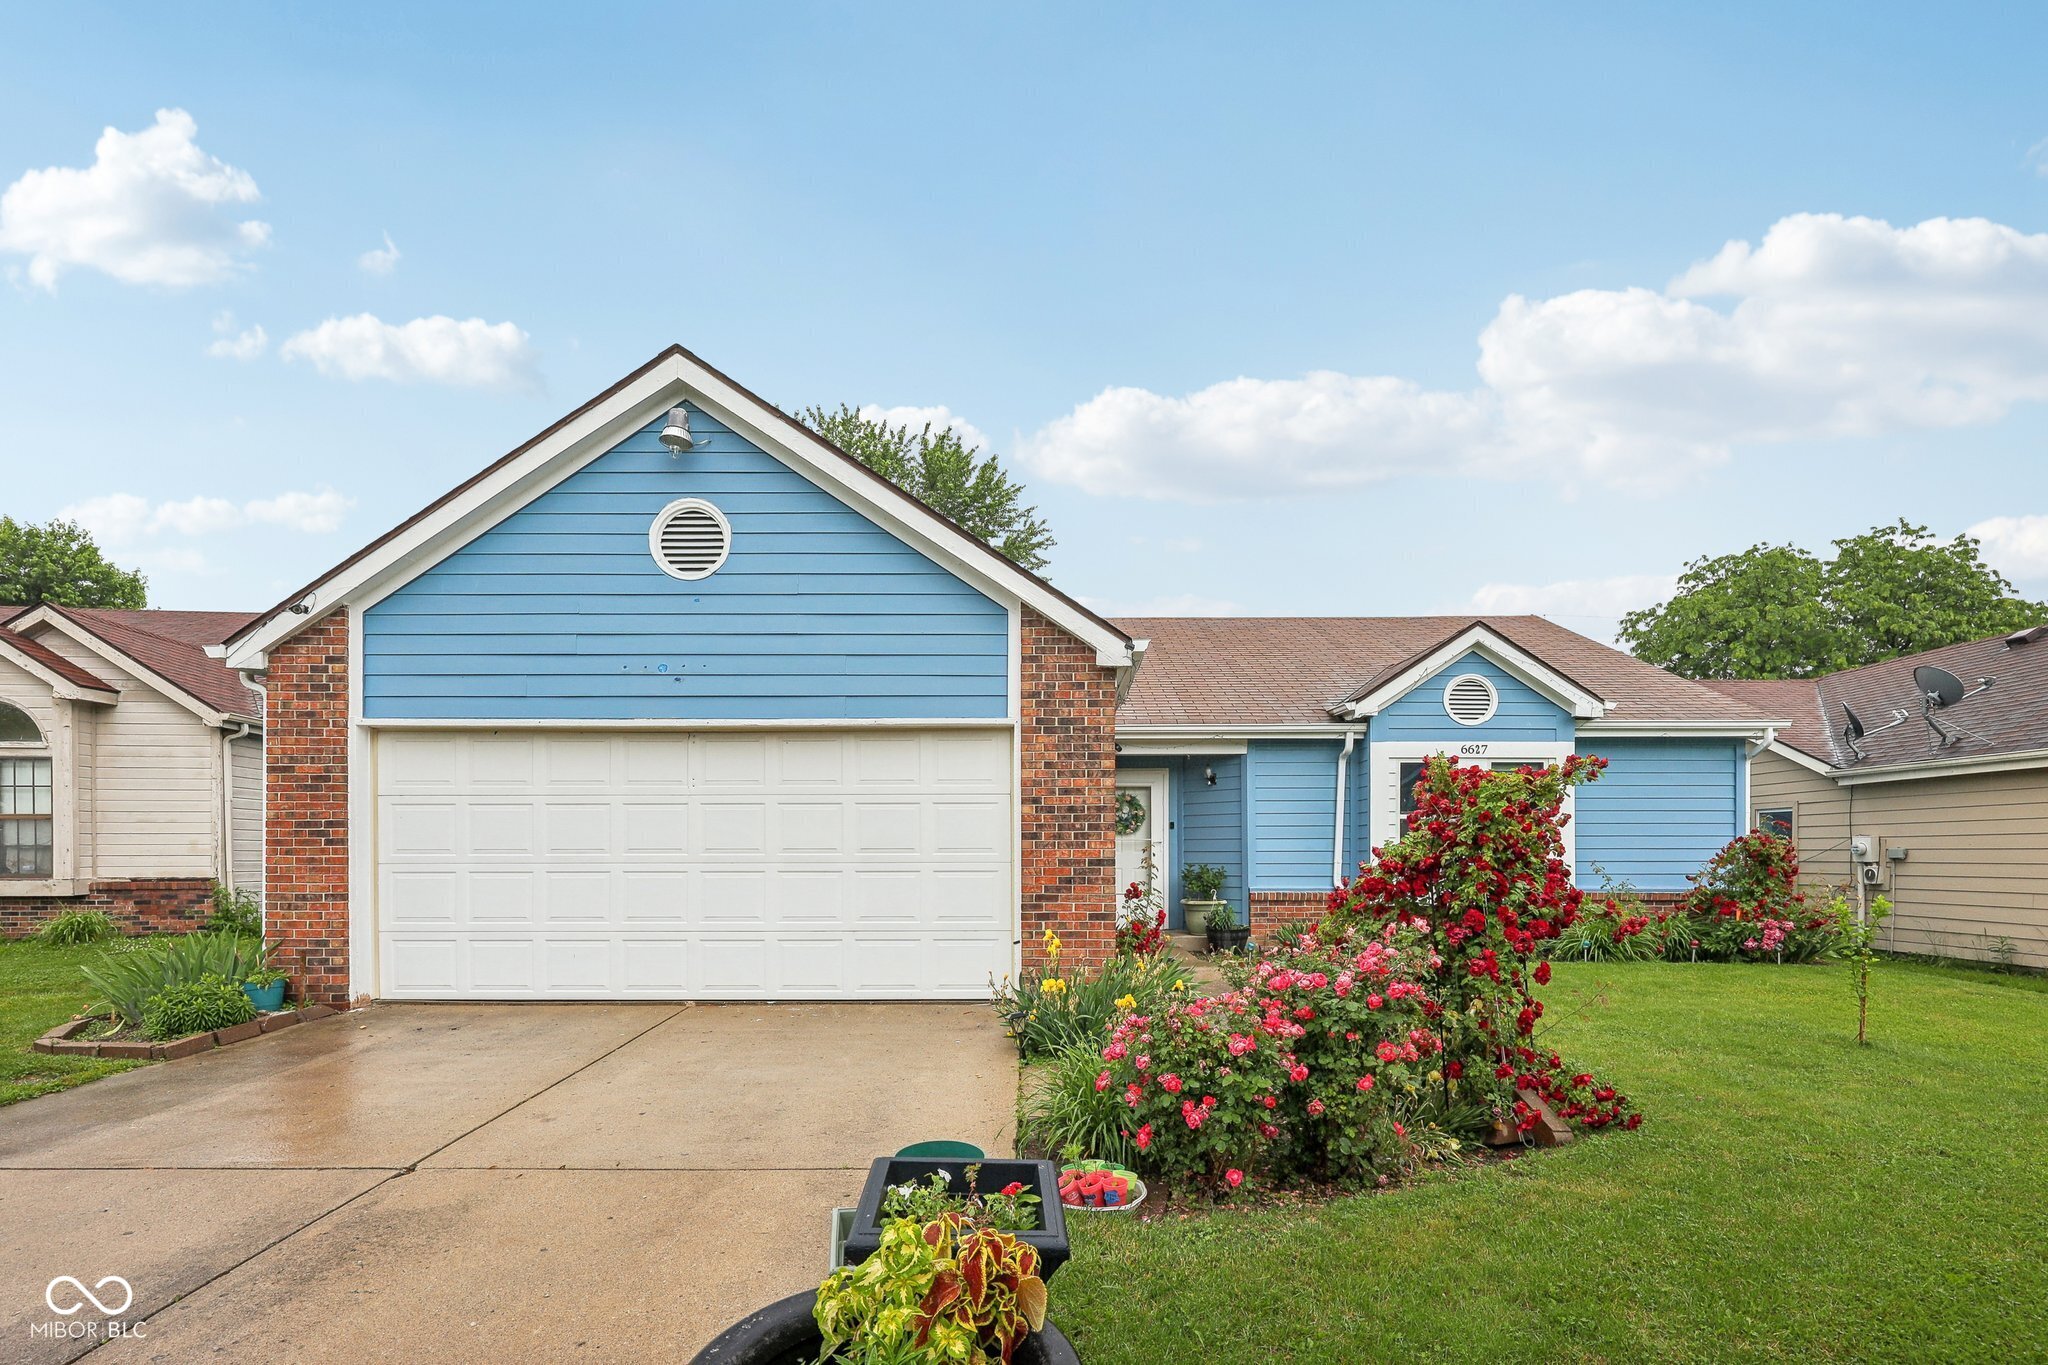
6627 Cobden Ct, Indianapolis, IN 46254
$-67
Cash flow
-1.4%
Cash-on-Cash Return
6.0%
Cap rate
0.7%
Rent to Value Ratio
Active
$417,500
3
bds
|
3
ba
|
1,844
sqft
|
built
1914
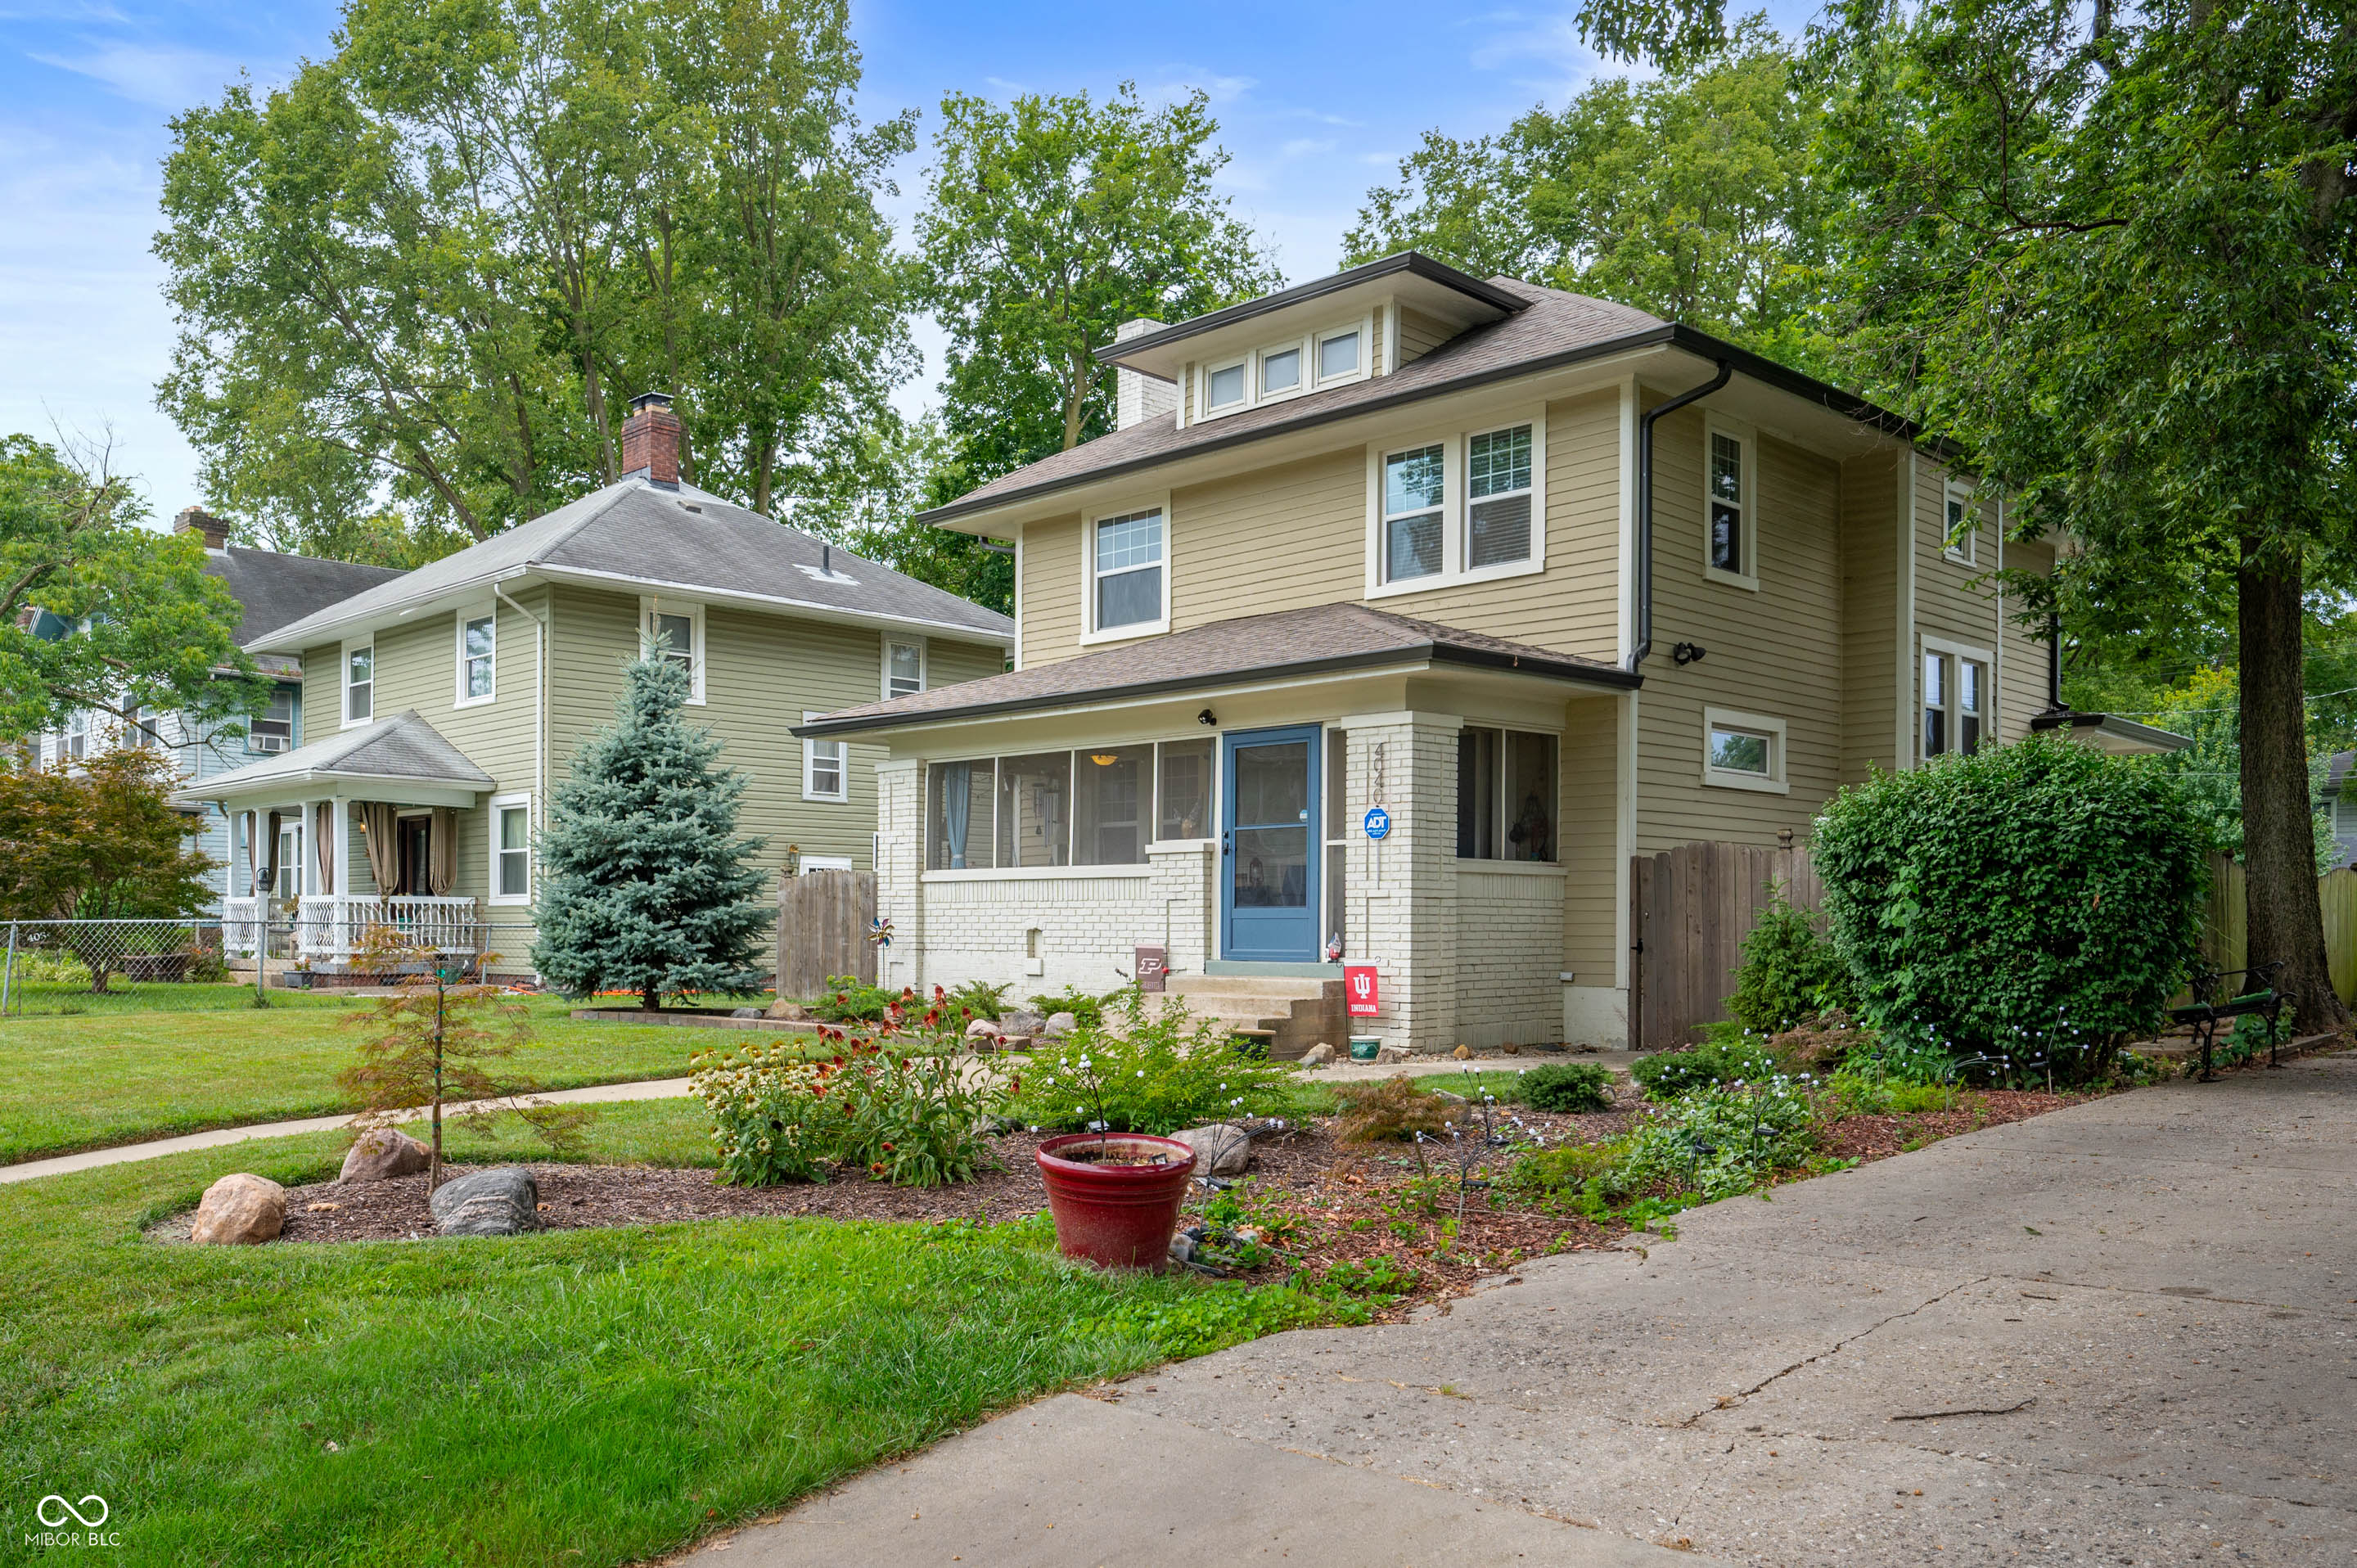
4040 Carrollton Ave, Indianapolis, IN 46205
$22
Cash flow
0.3%
Cash-on-Cash Return
6.3%
Cap rate
0.8%
Rent to Value Ratio
Pending
$142,000
3
bds
|
1
ba
|
1,008
sqft
|
built
1959
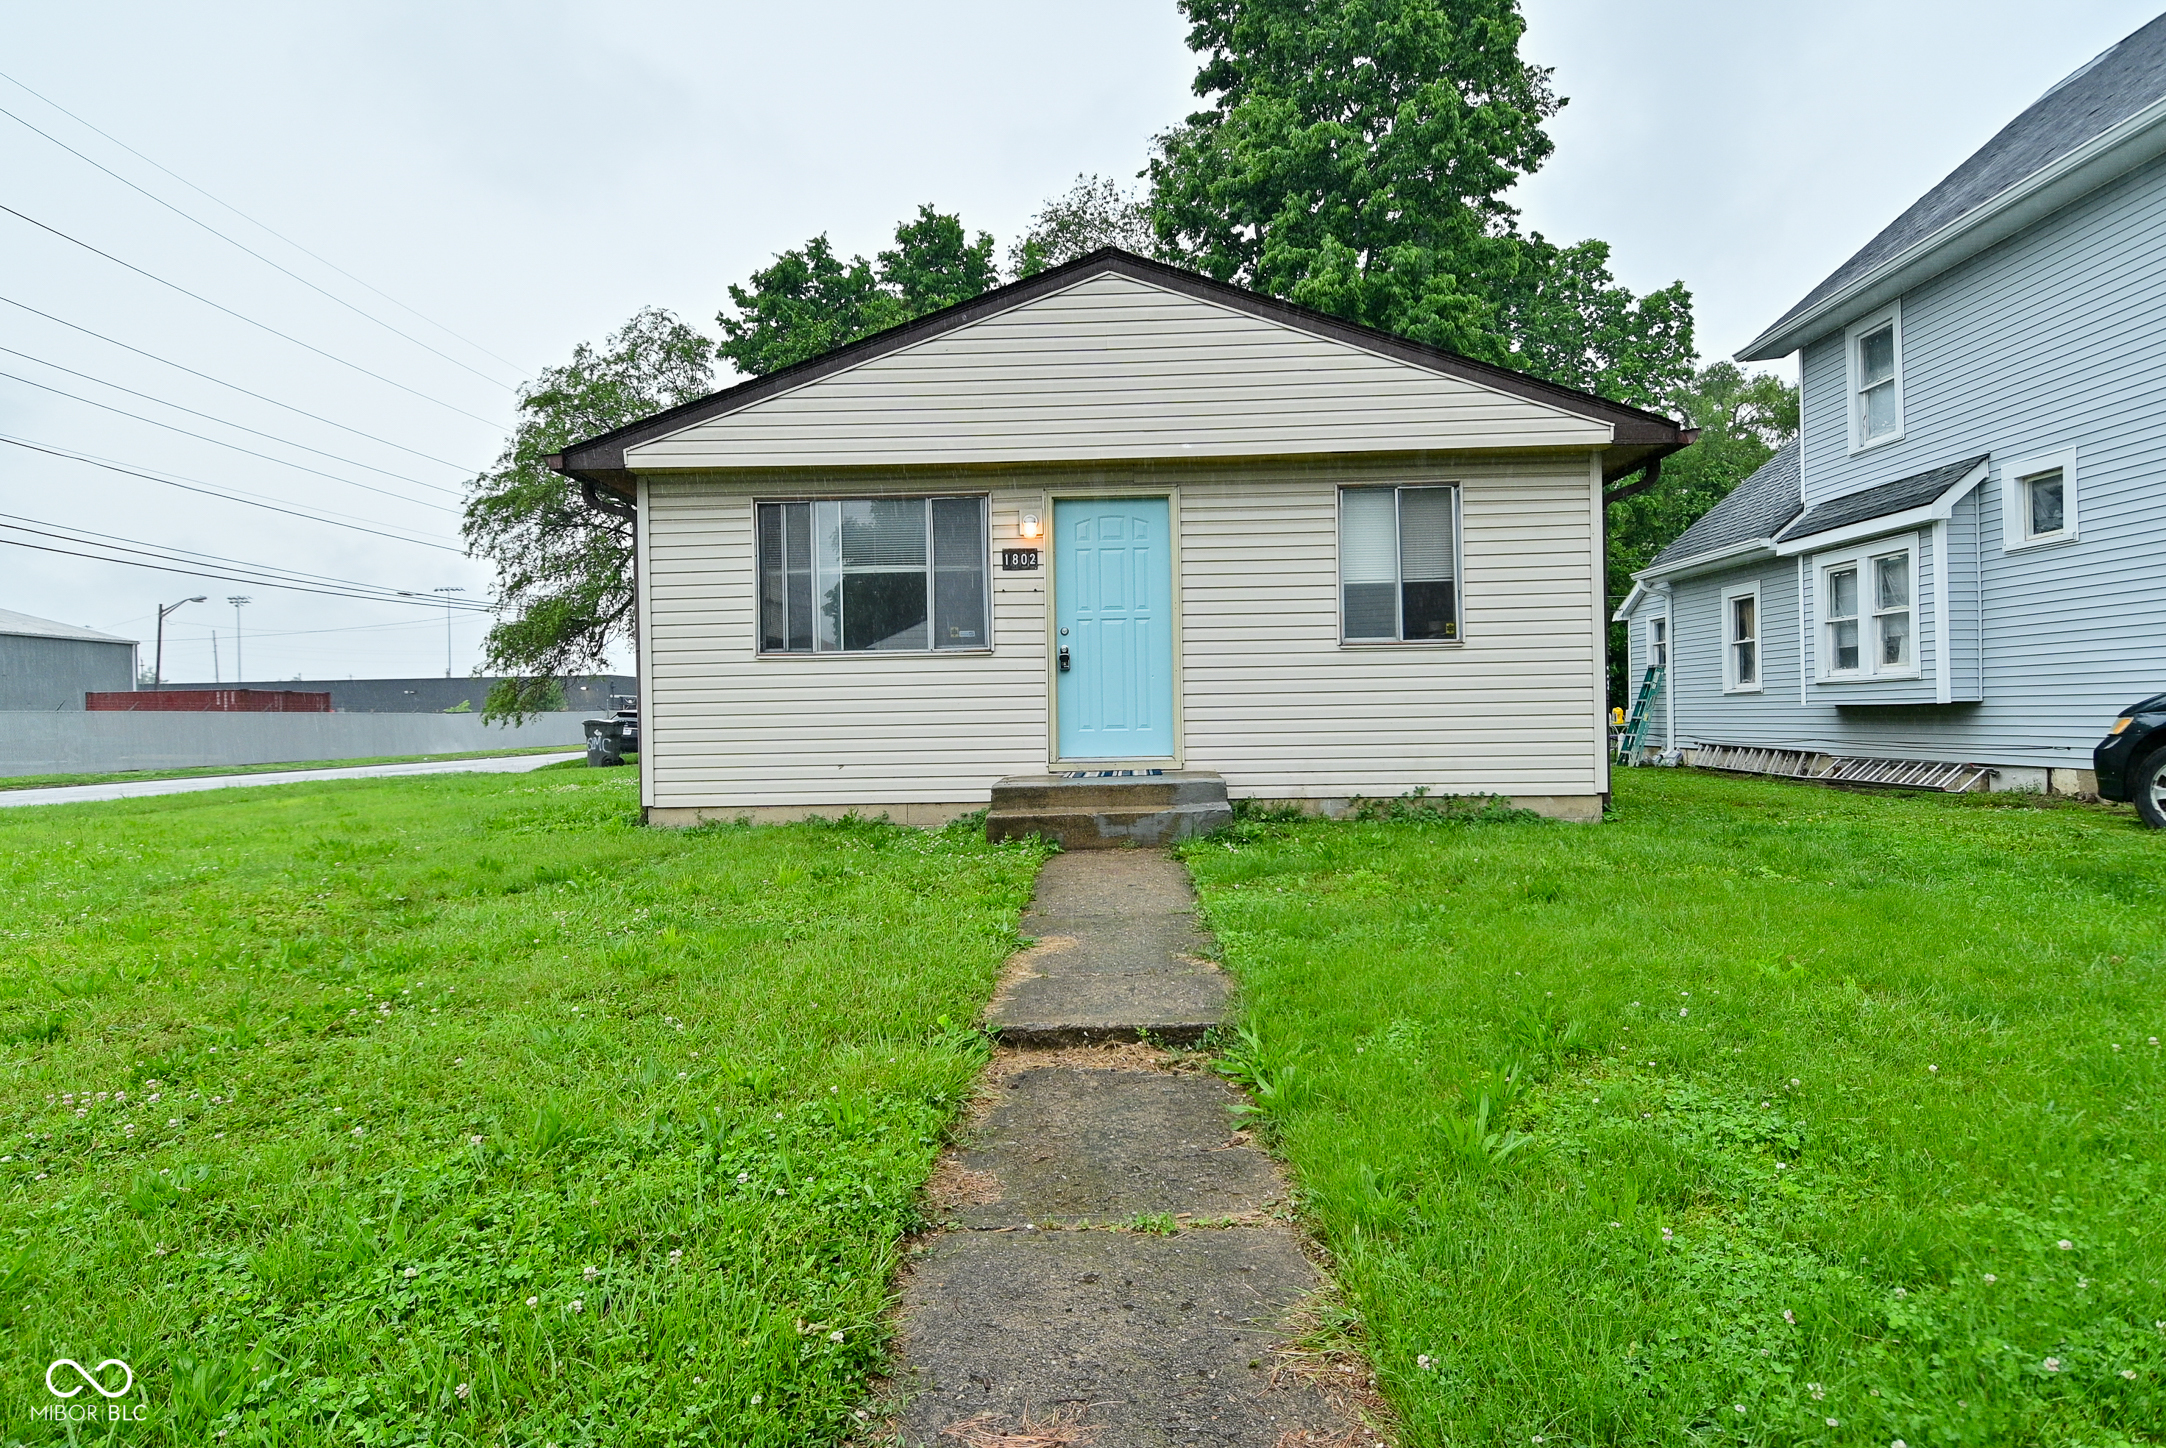
1802 Sugar Grove Ave, Indianapolis, IN 46202
$84
Cash flow
3.1%
Cash-on-Cash Return
7.0%
Cap rate
0.8%
Rent to Value Ratio
Pending
$189,000
2
bds
|
2
ba
|
1,350
sqft
|
built
1950
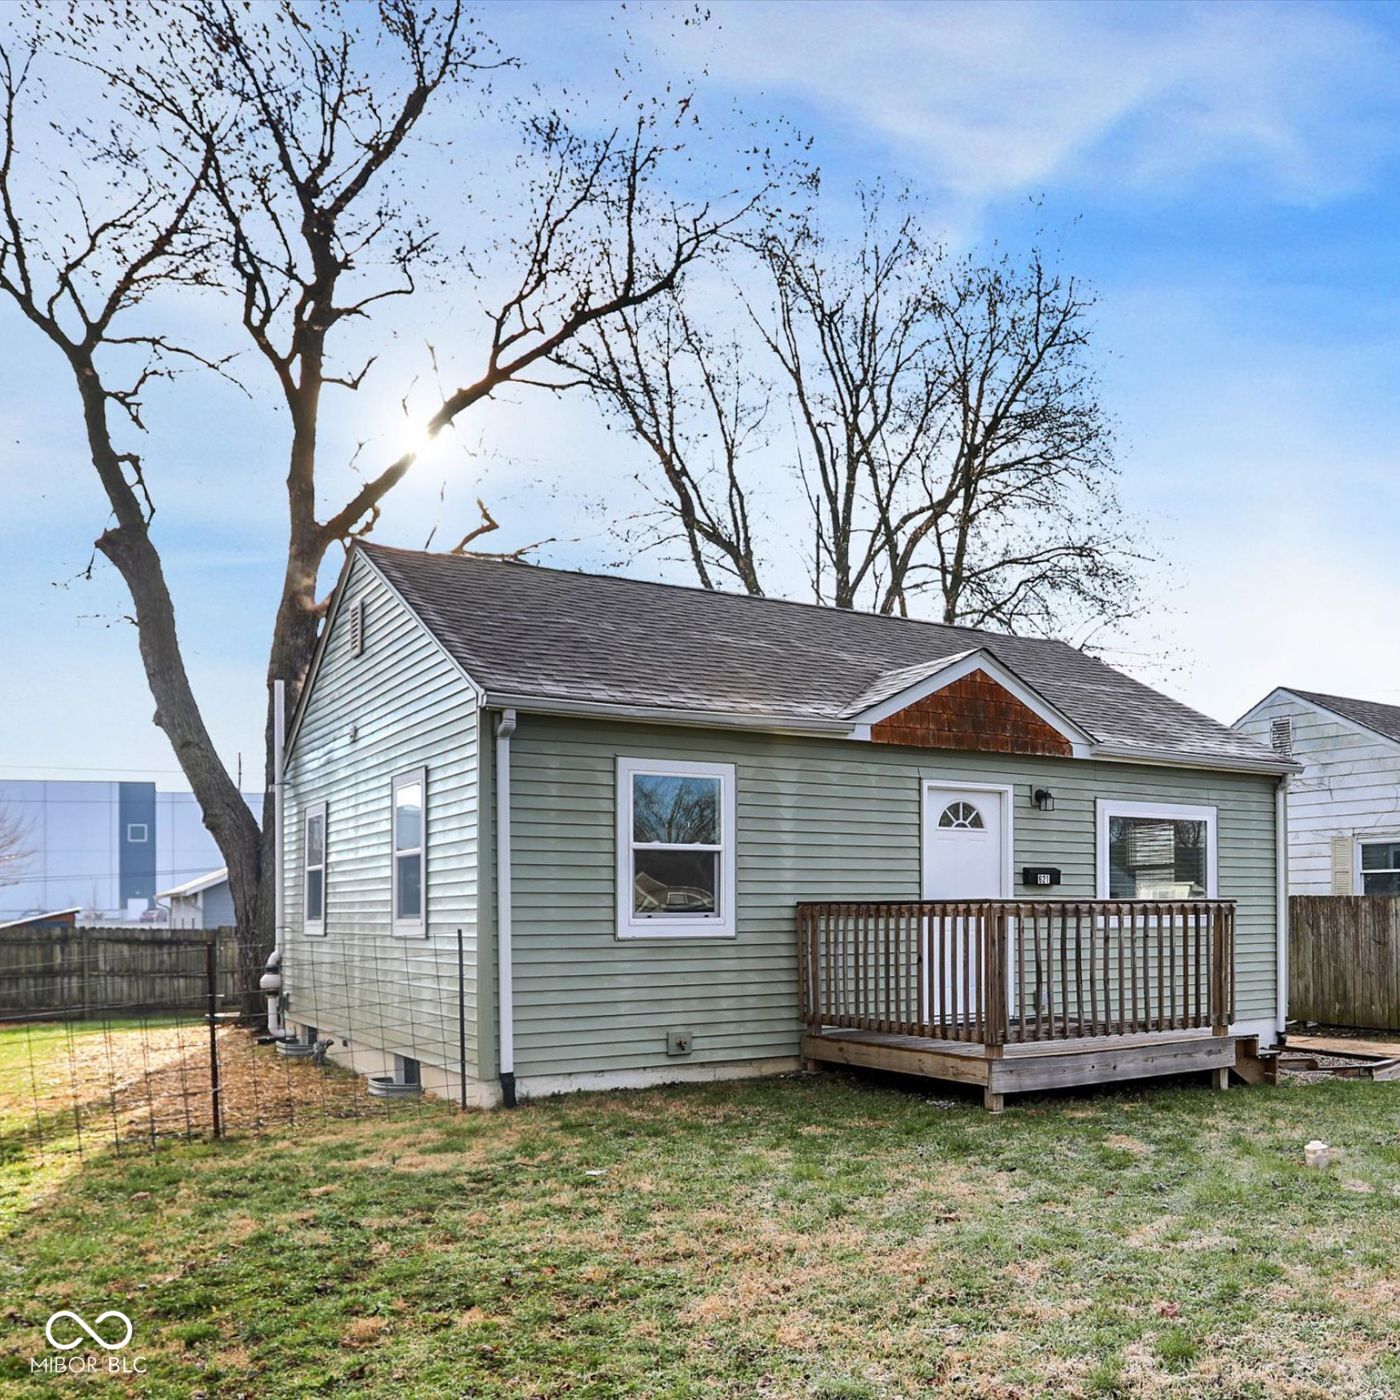
621 Melvenia St, Indianapolis, IN 46219
$114
Cash flow
3.1%
Cash-on-Cash Return
7.0%
Cap rate
0.8%
Rent to Value Ratio
Active
$300,000
3
bds
|
1
ba
|
1,152
sqft
|
built
1994
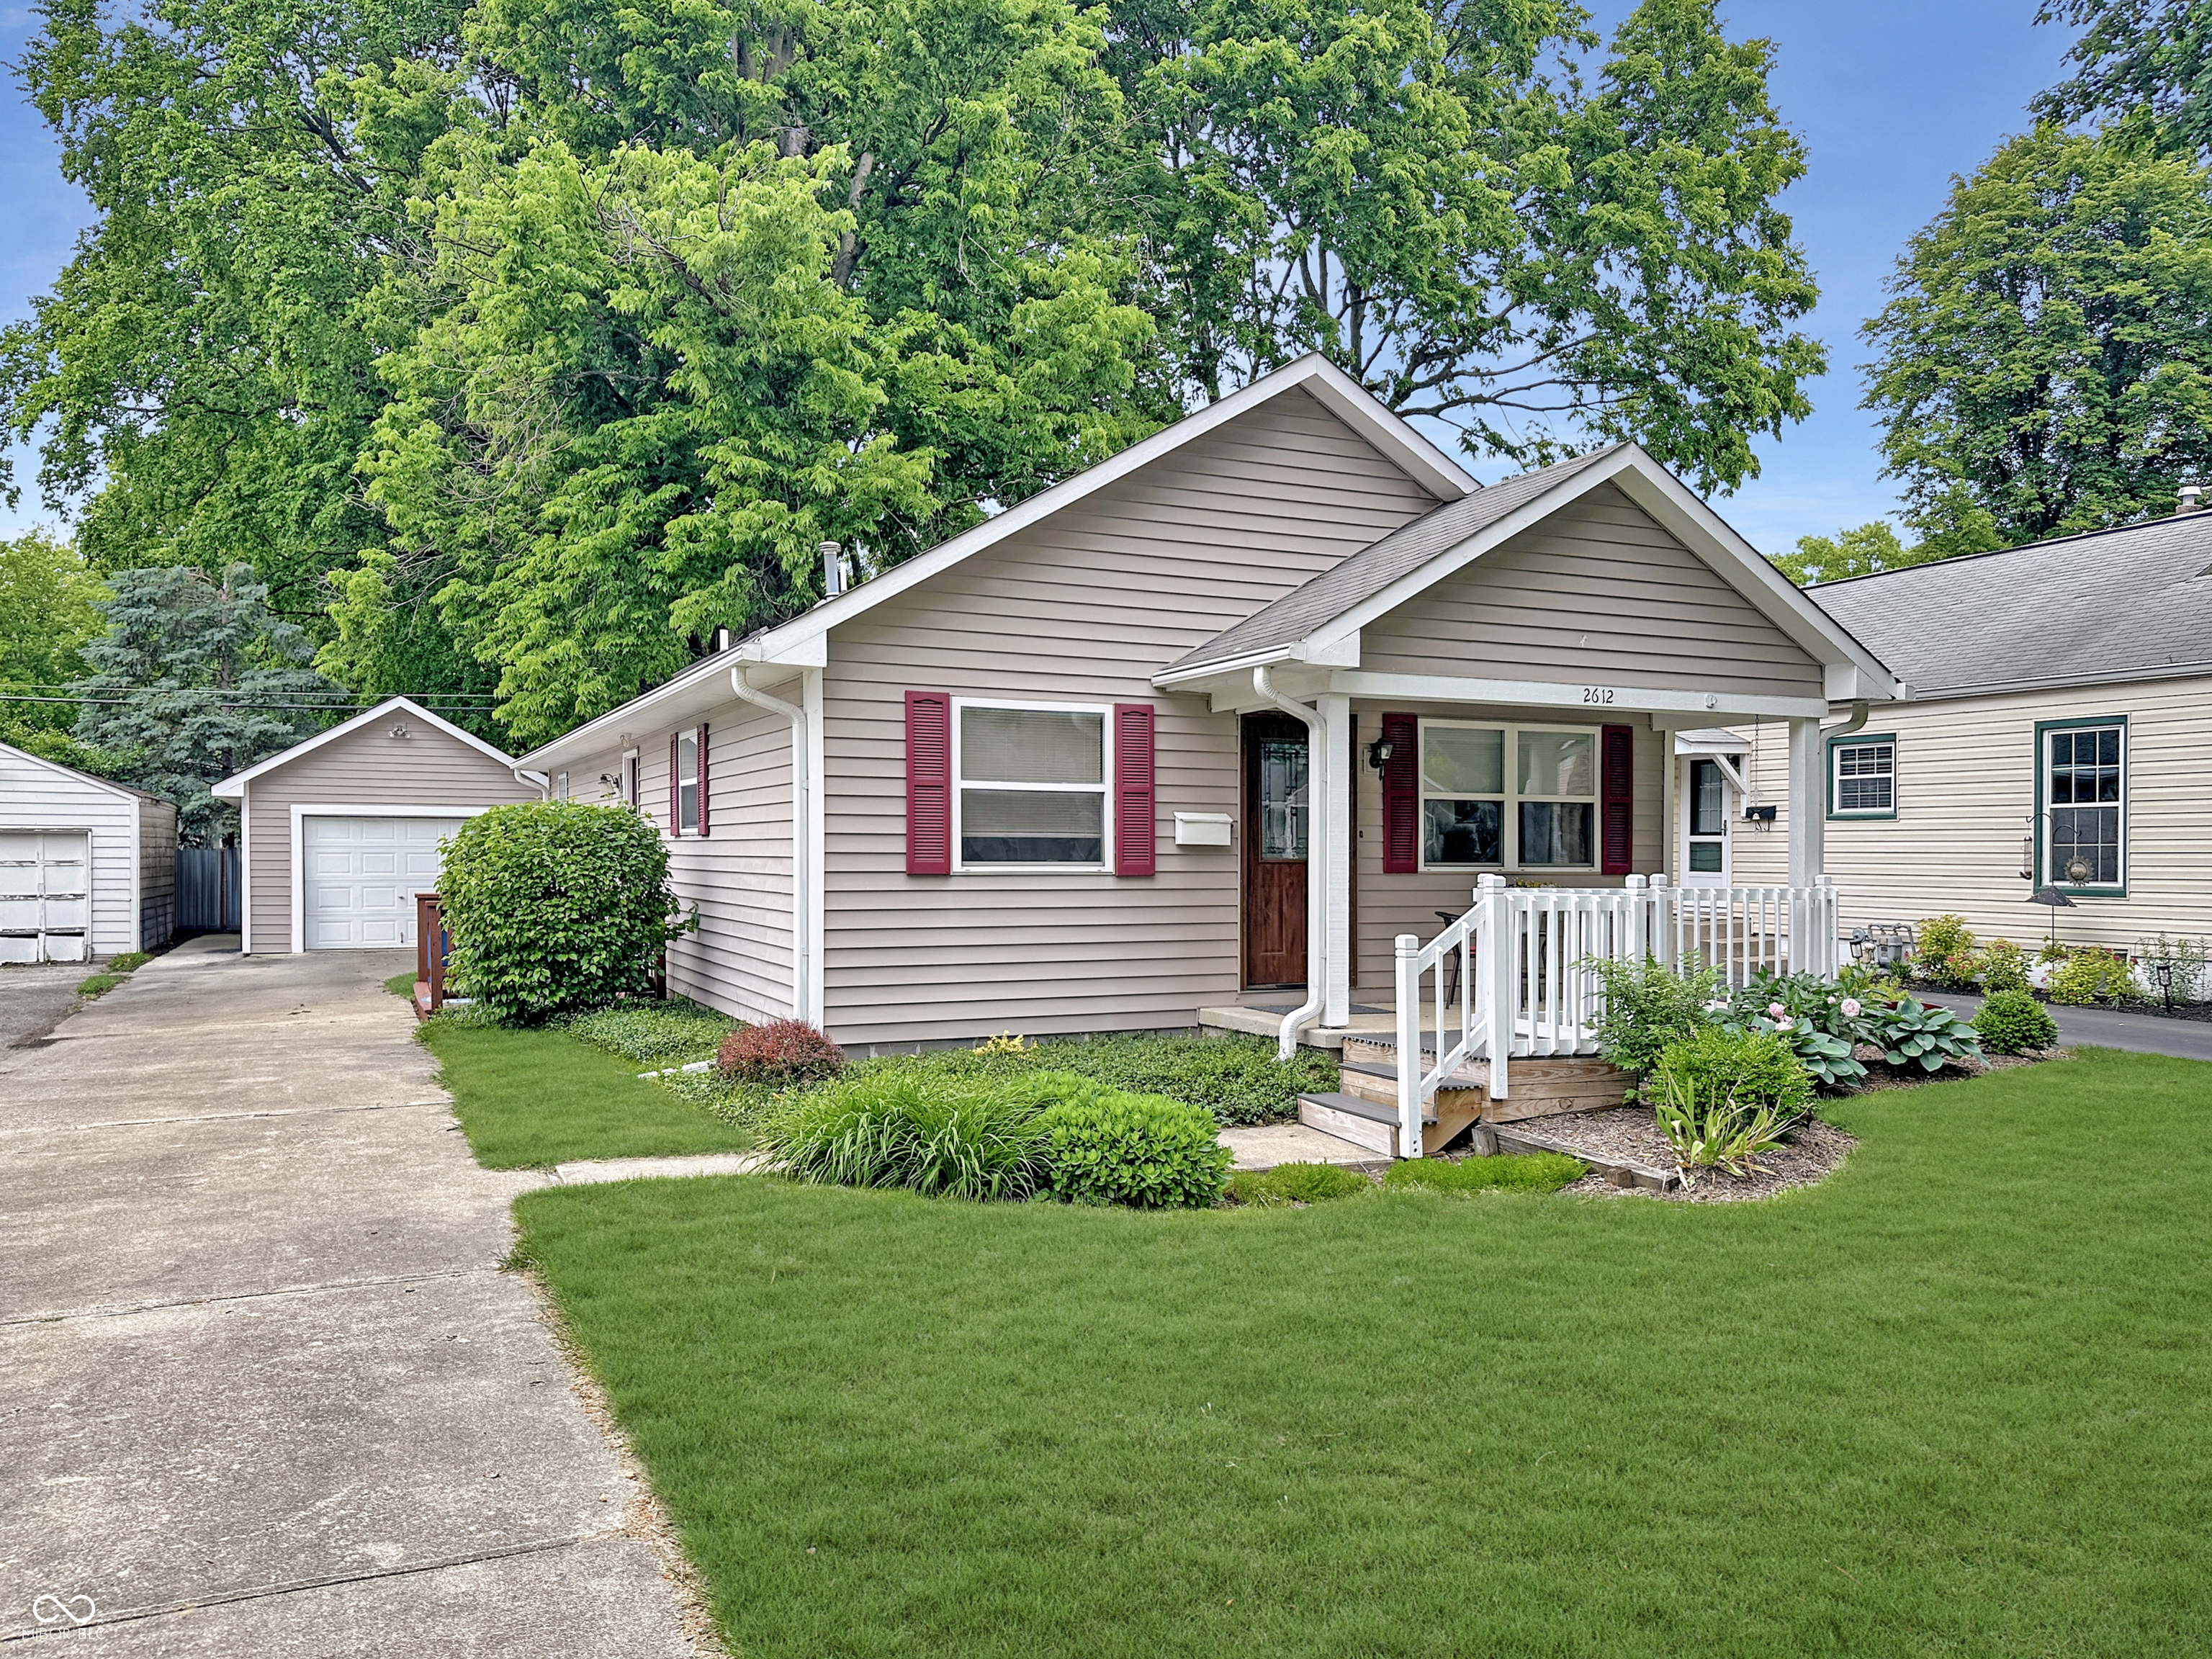
2612 E Northgate St, Indianapolis, IN 46220
$-191
Cash flow
-3.3%
Cash-on-Cash Return
5.5%
Cap rate
0.7%
Rent to Value Ratio
Active
$275,000
2
bds
|
1
ba
|
885
sqft
|
built
1920
4345 Guilford Ave, Indianapolis, IN 46205
$-60
Cash flow
-1.1%
Cash-on-Cash Return
6.0%
Cap rate
0.7%
Rent to Value Ratio
Pending
$200,000
5
bds
|
4
ba
|
2,570
sqft
|
built
1916
609 E 37th St, Indianapolis, IN 46205
$540
Cash flow
14.1%
Cash-on-Cash Return
9.5%
Cap rate
1.2%
Rent to Value Ratio
Active
$250,000
3
bds
|
3
ba
|
1,800
sqft
|
built
2007
9704 Gull Lake Dr, Indianapolis, IN 46239
$71
Cash flow
1.5%
Cash-on-Cash Return
6.6%
Cap rate
0.8%
Rent to Value Ratio
Active
$655,000
3
bds
|
3
ba
|
2,869
sqft
|
built
1954
5543 N Pennsylvania St, Indianapolis, IN 46220
$-1,705
Cash flow
-13.6%
Cash-on-Cash Return
3.2%
Cap rate
0.4%
Rent to Value Ratio
Active
$349,900
4
bds
|
8
ba
|
2,688
sqft
|
built
1997
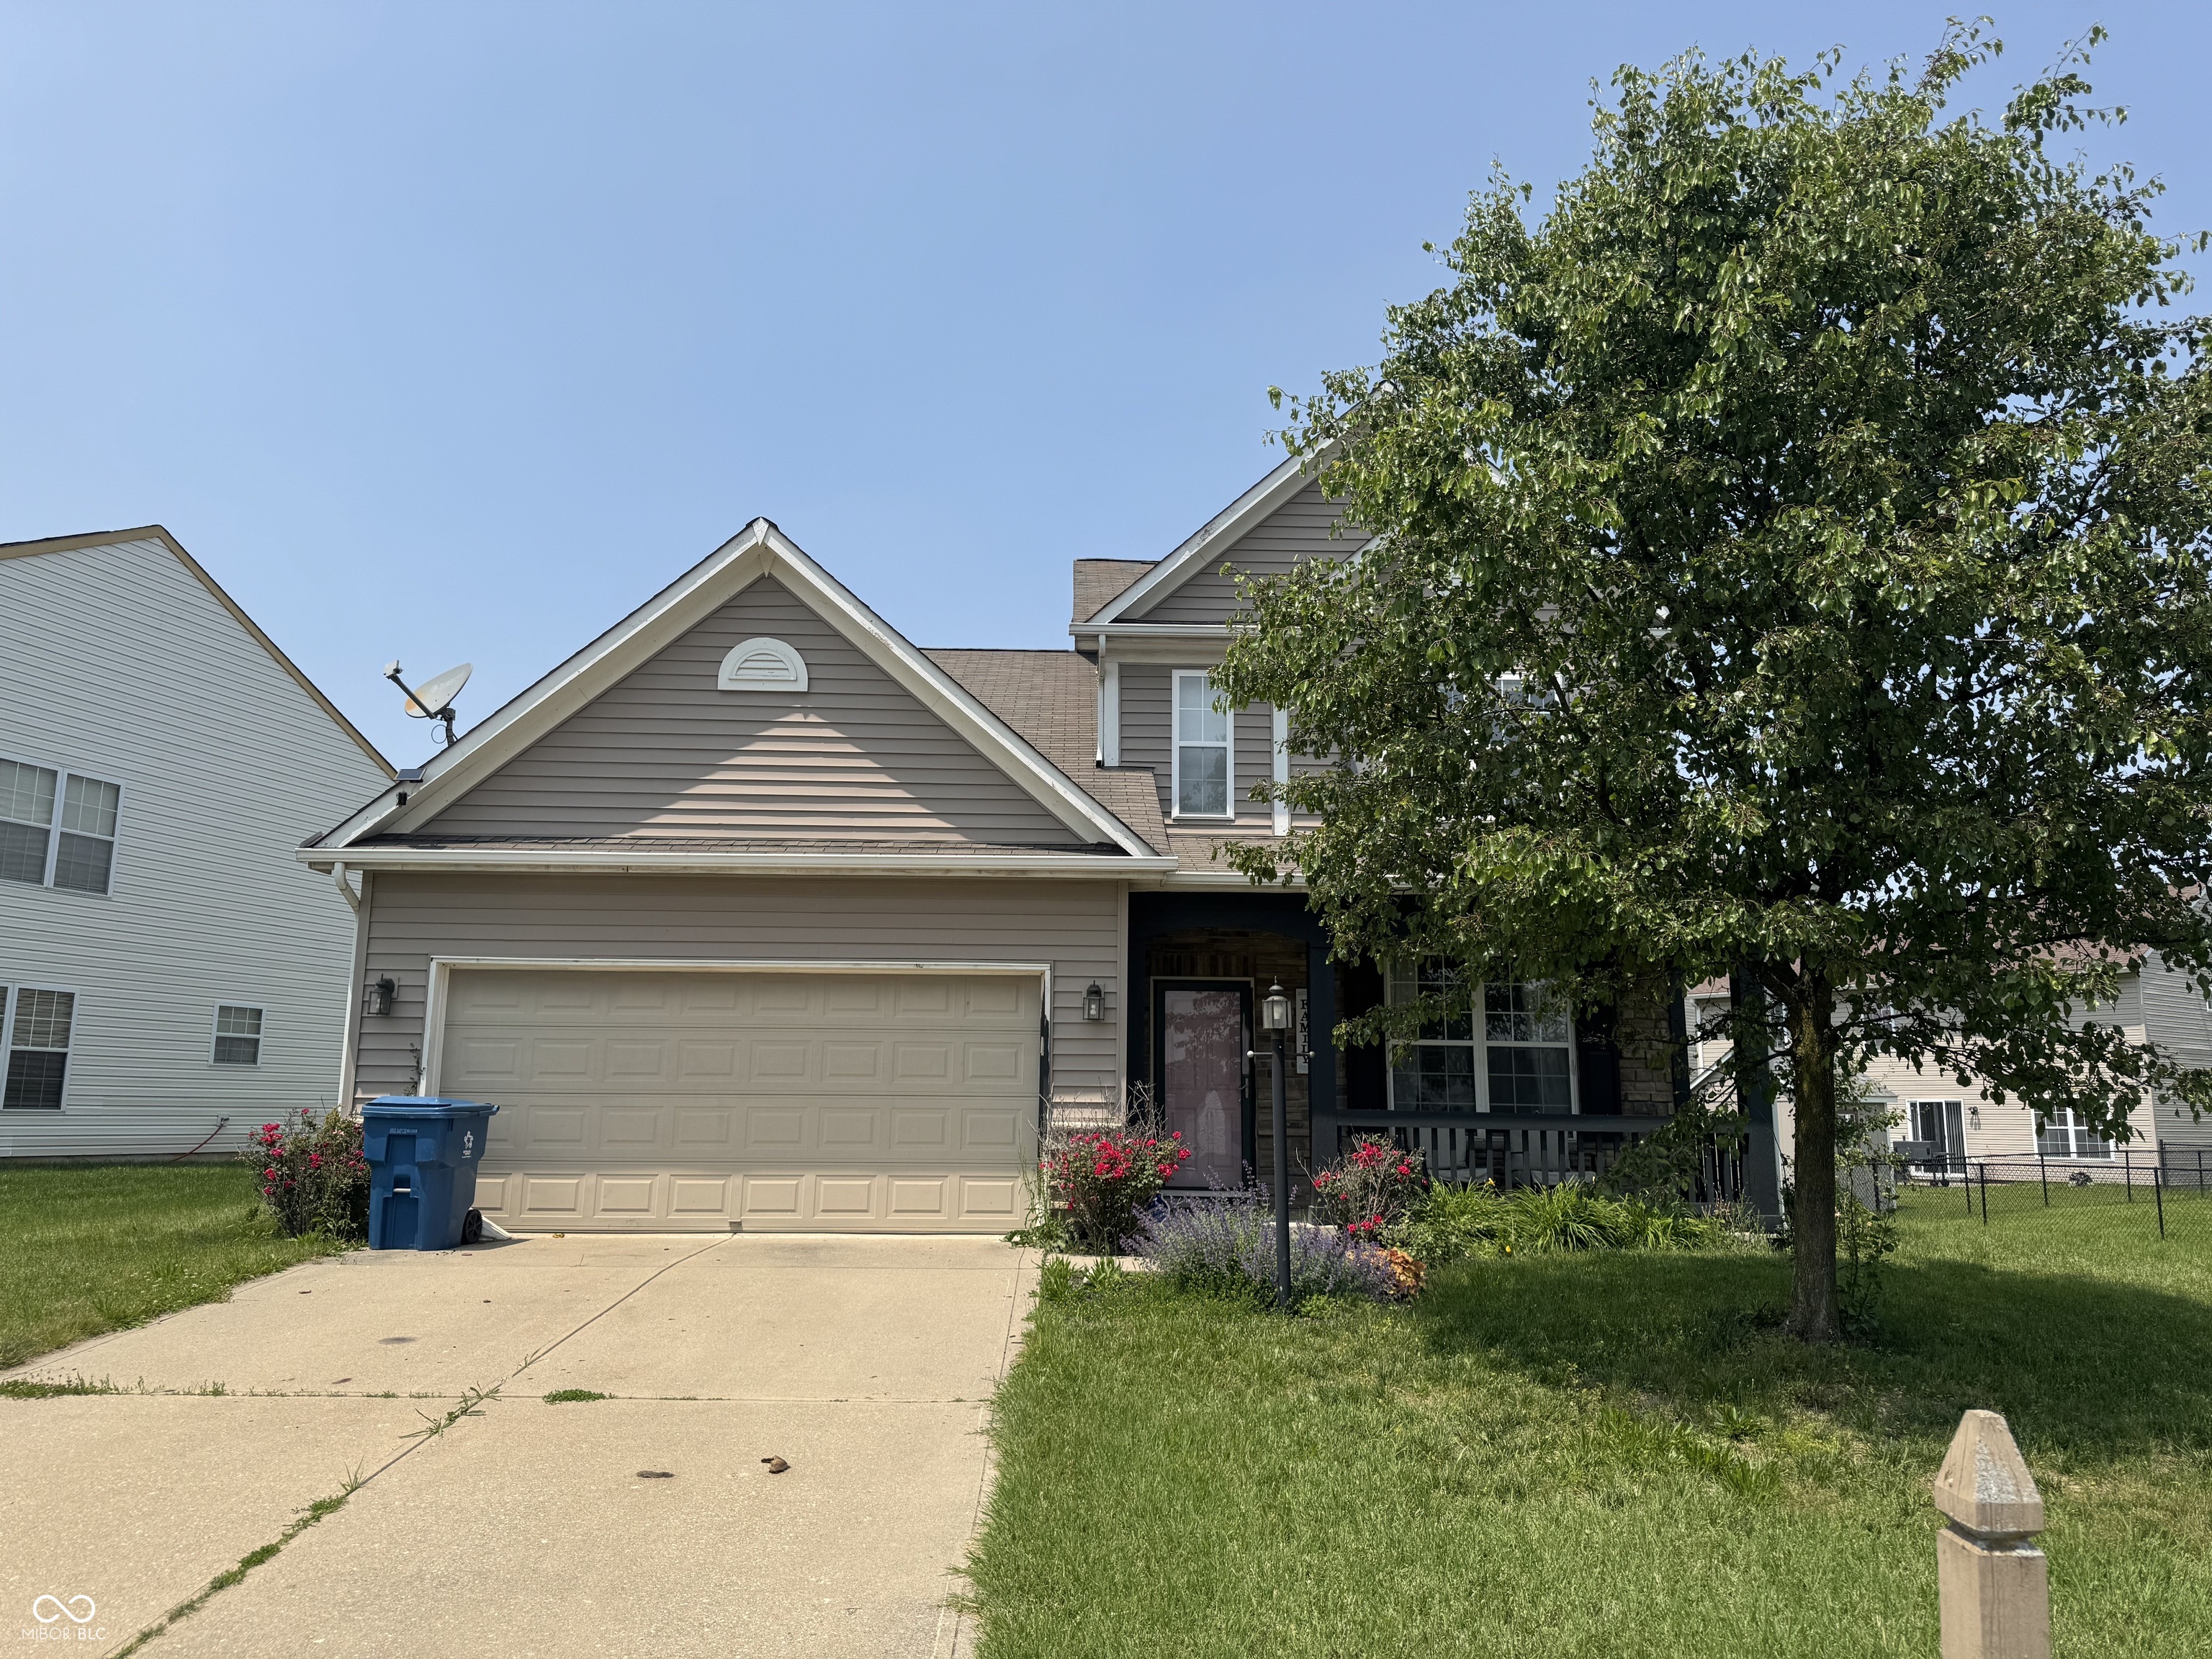
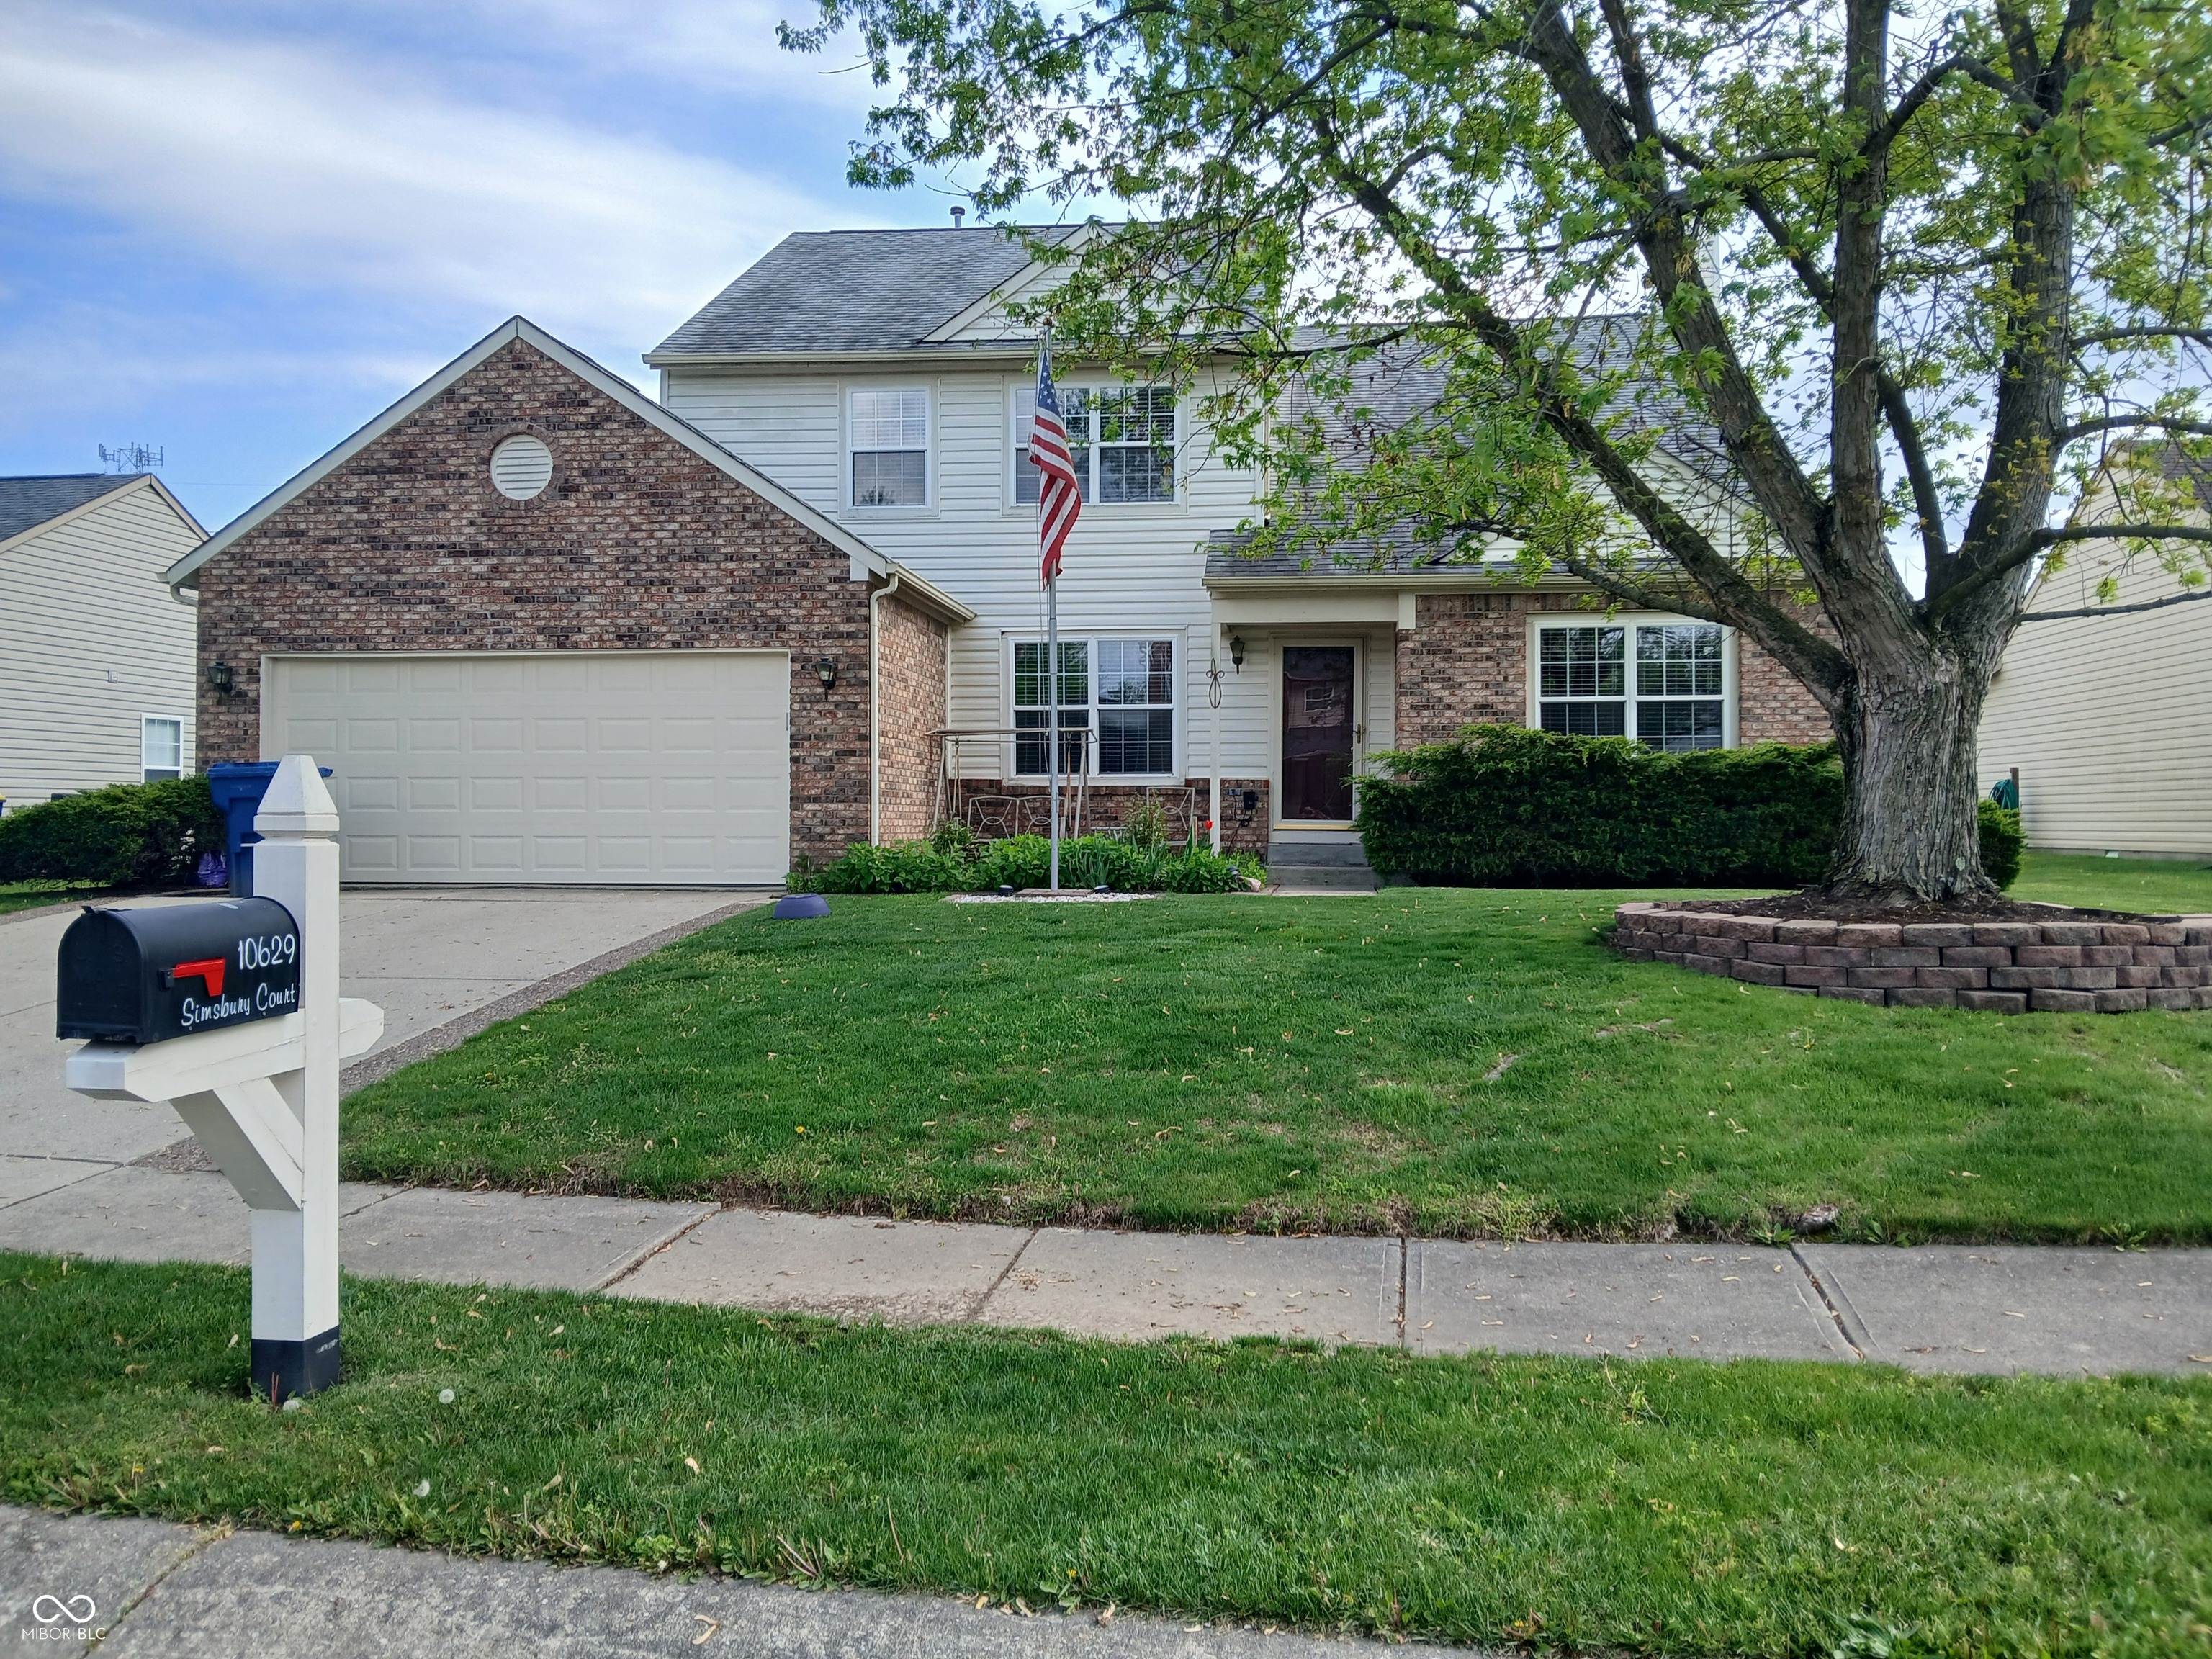
10629 Simsbury Ct, Indianapolis, IN 46236
$-378
Cash flow
-5.6%
Cash-on-Cash Return
5.0%
Cap rate
0.6%
Rent to Value Ratio
Active
$294,900
5
bds
|
3
ba
|
1,826
sqft
|
built
1988
8075 Cardinal Cv E, Indianapolis, IN 46256
$-95
Cash flow
-1.7%
Cash-on-Cash Return
5.9%
Cap rate
0.7%
Rent to Value Ratio
Pending
$145,000
3
bds
|
2
ba
|
1,706
sqft
|
built
1920
1130 Congress Ave, Indianapolis, IN 46208
$207
Cash flow
7.4%
Cash-on-Cash Return
8.0%
Cap rate
1.0%
Rent to Value Ratio
Active
$235,000
3
bds
|
0
ba
|
0
sqft
|
built
1910
3502 N Kenwood Ave, Indianapolis, IN 46208
$-472
Cash flow
-10.5%
Cash-on-Cash Return
3.9%
Cap rate
0.5%
Rent to Value Ratio
Active
$699,000
5
bds
|
4
ba
|
4,556
sqft
|
built
2008
608 E 21st St, Indianapolis, IN 46202
$-1,245
Cash flow
-9.3%
Cash-on-Cash Return
4.1%
Cap rate
0.5%
Rent to Value Ratio
Active
$224,900
2
bds
|
2
ba
|
1,008
sqft
|
built
1915
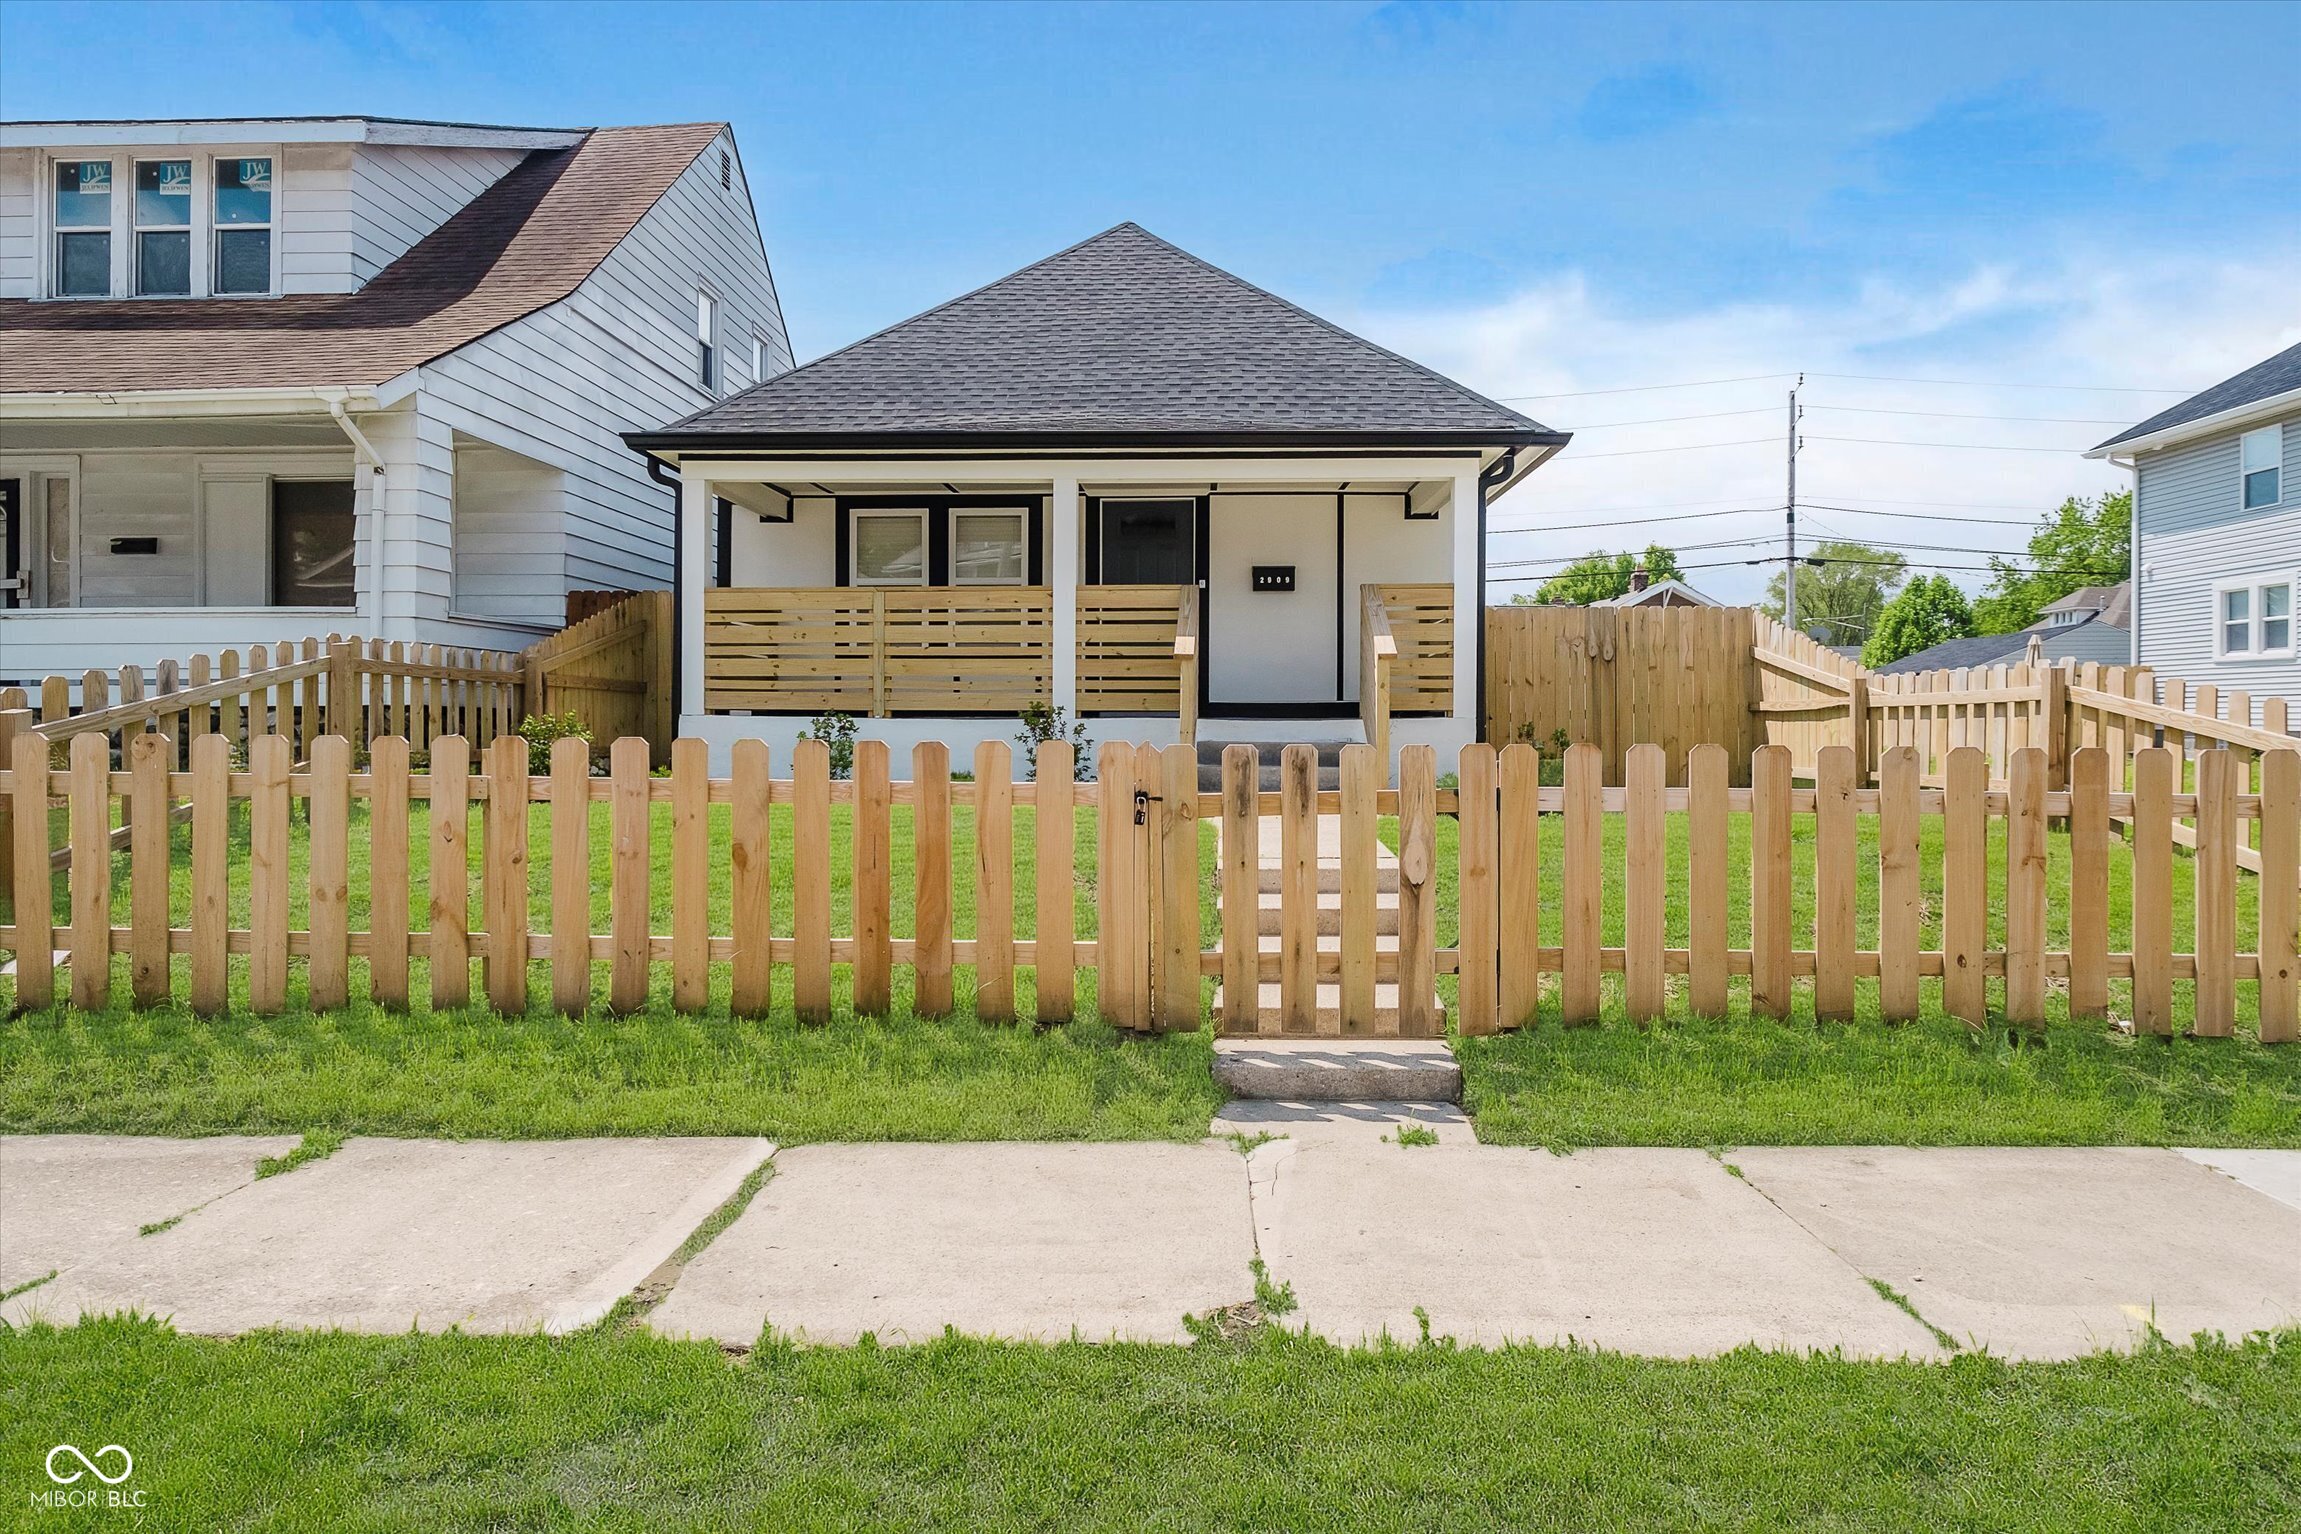
2909 E Michigan St, Indianapolis, IN 46201
$-488
Cash flow
-11.3%
Cash-on-Cash Return
3.7%
Cap rate
0.4%
Rent to Value Ratio
Active
$190,000
3
bds
|
1
ba
|
1,002
sqft
|
built
1940
1331 N Berwick Ave, Indianapolis, IN 46222
$-29
Cash flow
-0.8%
Cash-on-Cash Return
6.1%
Cap rate
0.7%
Rent to Value Ratio
Pending
$139,900
2
bds
|
1
ba
|
1,440
sqft
|
built
1930
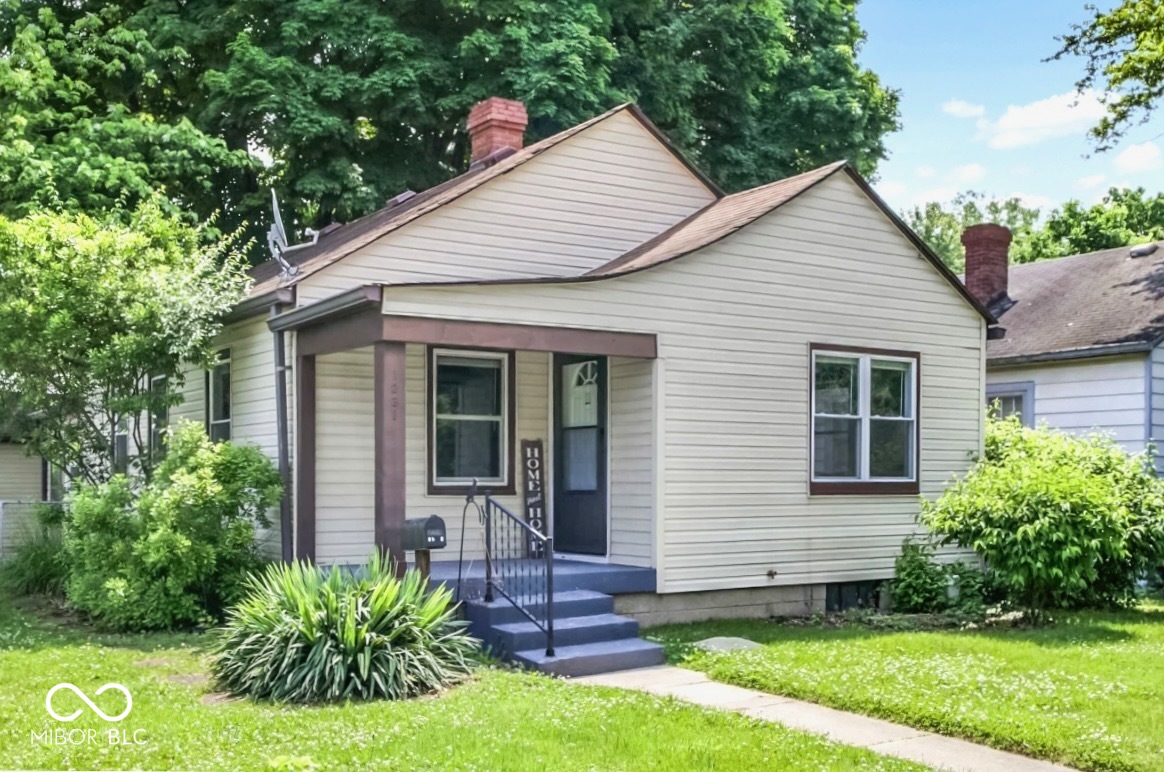
5209 Melrose Ave, Indianapolis, IN 46241
$371
Cash flow
13.8%
Cash-on-Cash Return
9.5%
Cap rate
1.1%
Rent to Value Ratio
Active
$215,000
3
bds
|
1
ba
|
1,482
sqft
|
built
1957
7725 E 52nd St, Indianapolis, IN 46226
$-22
Cash flow
-0.5%
Cash-on-Cash Return
6.2%
Cap rate
0.7%
Rent to Value Ratio