Indianapolis, IN Investment Properties for Sale
Browse homes for sale and investment properties in Indianapolis, IN. Refine your search by price, property type, or more.
Best cash flowing properties in Indianapolis, IN
Active
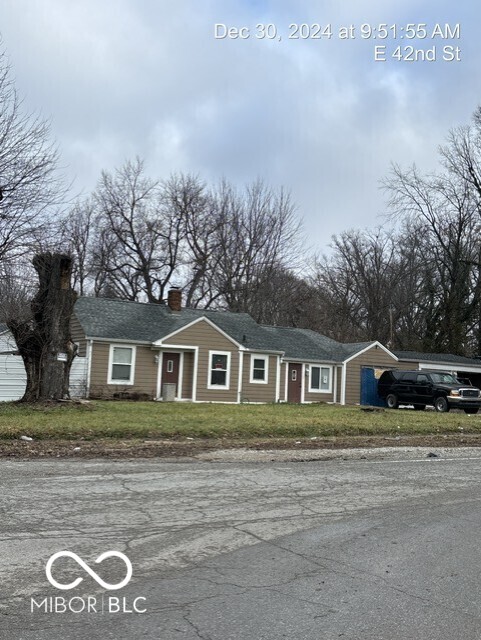
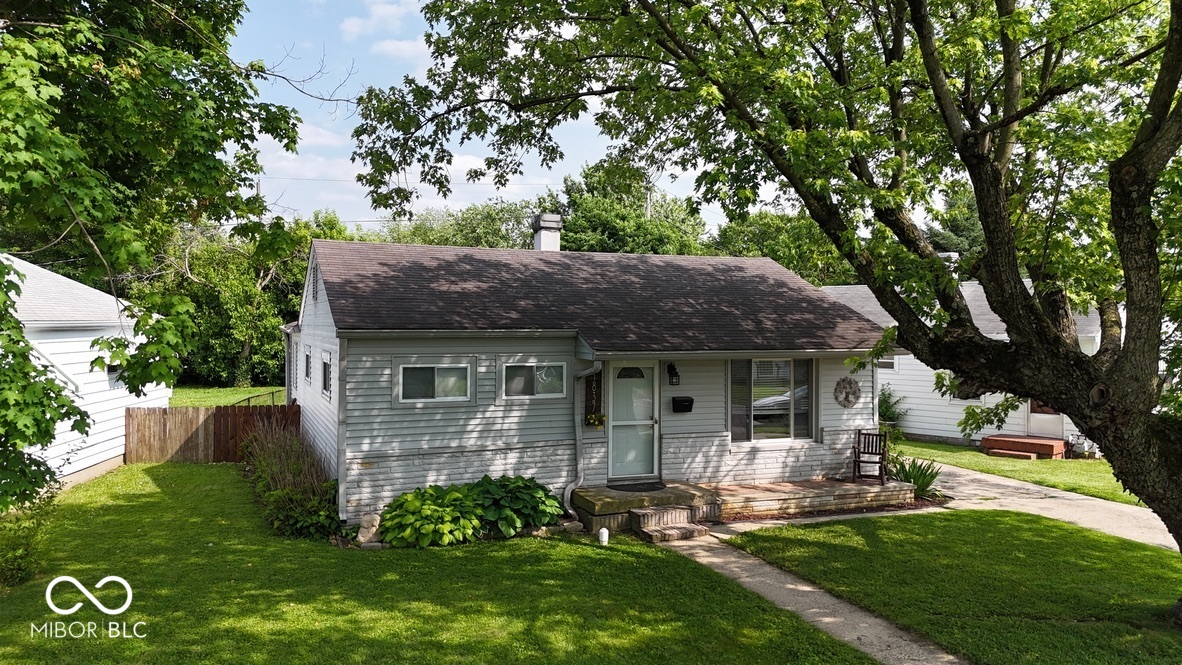
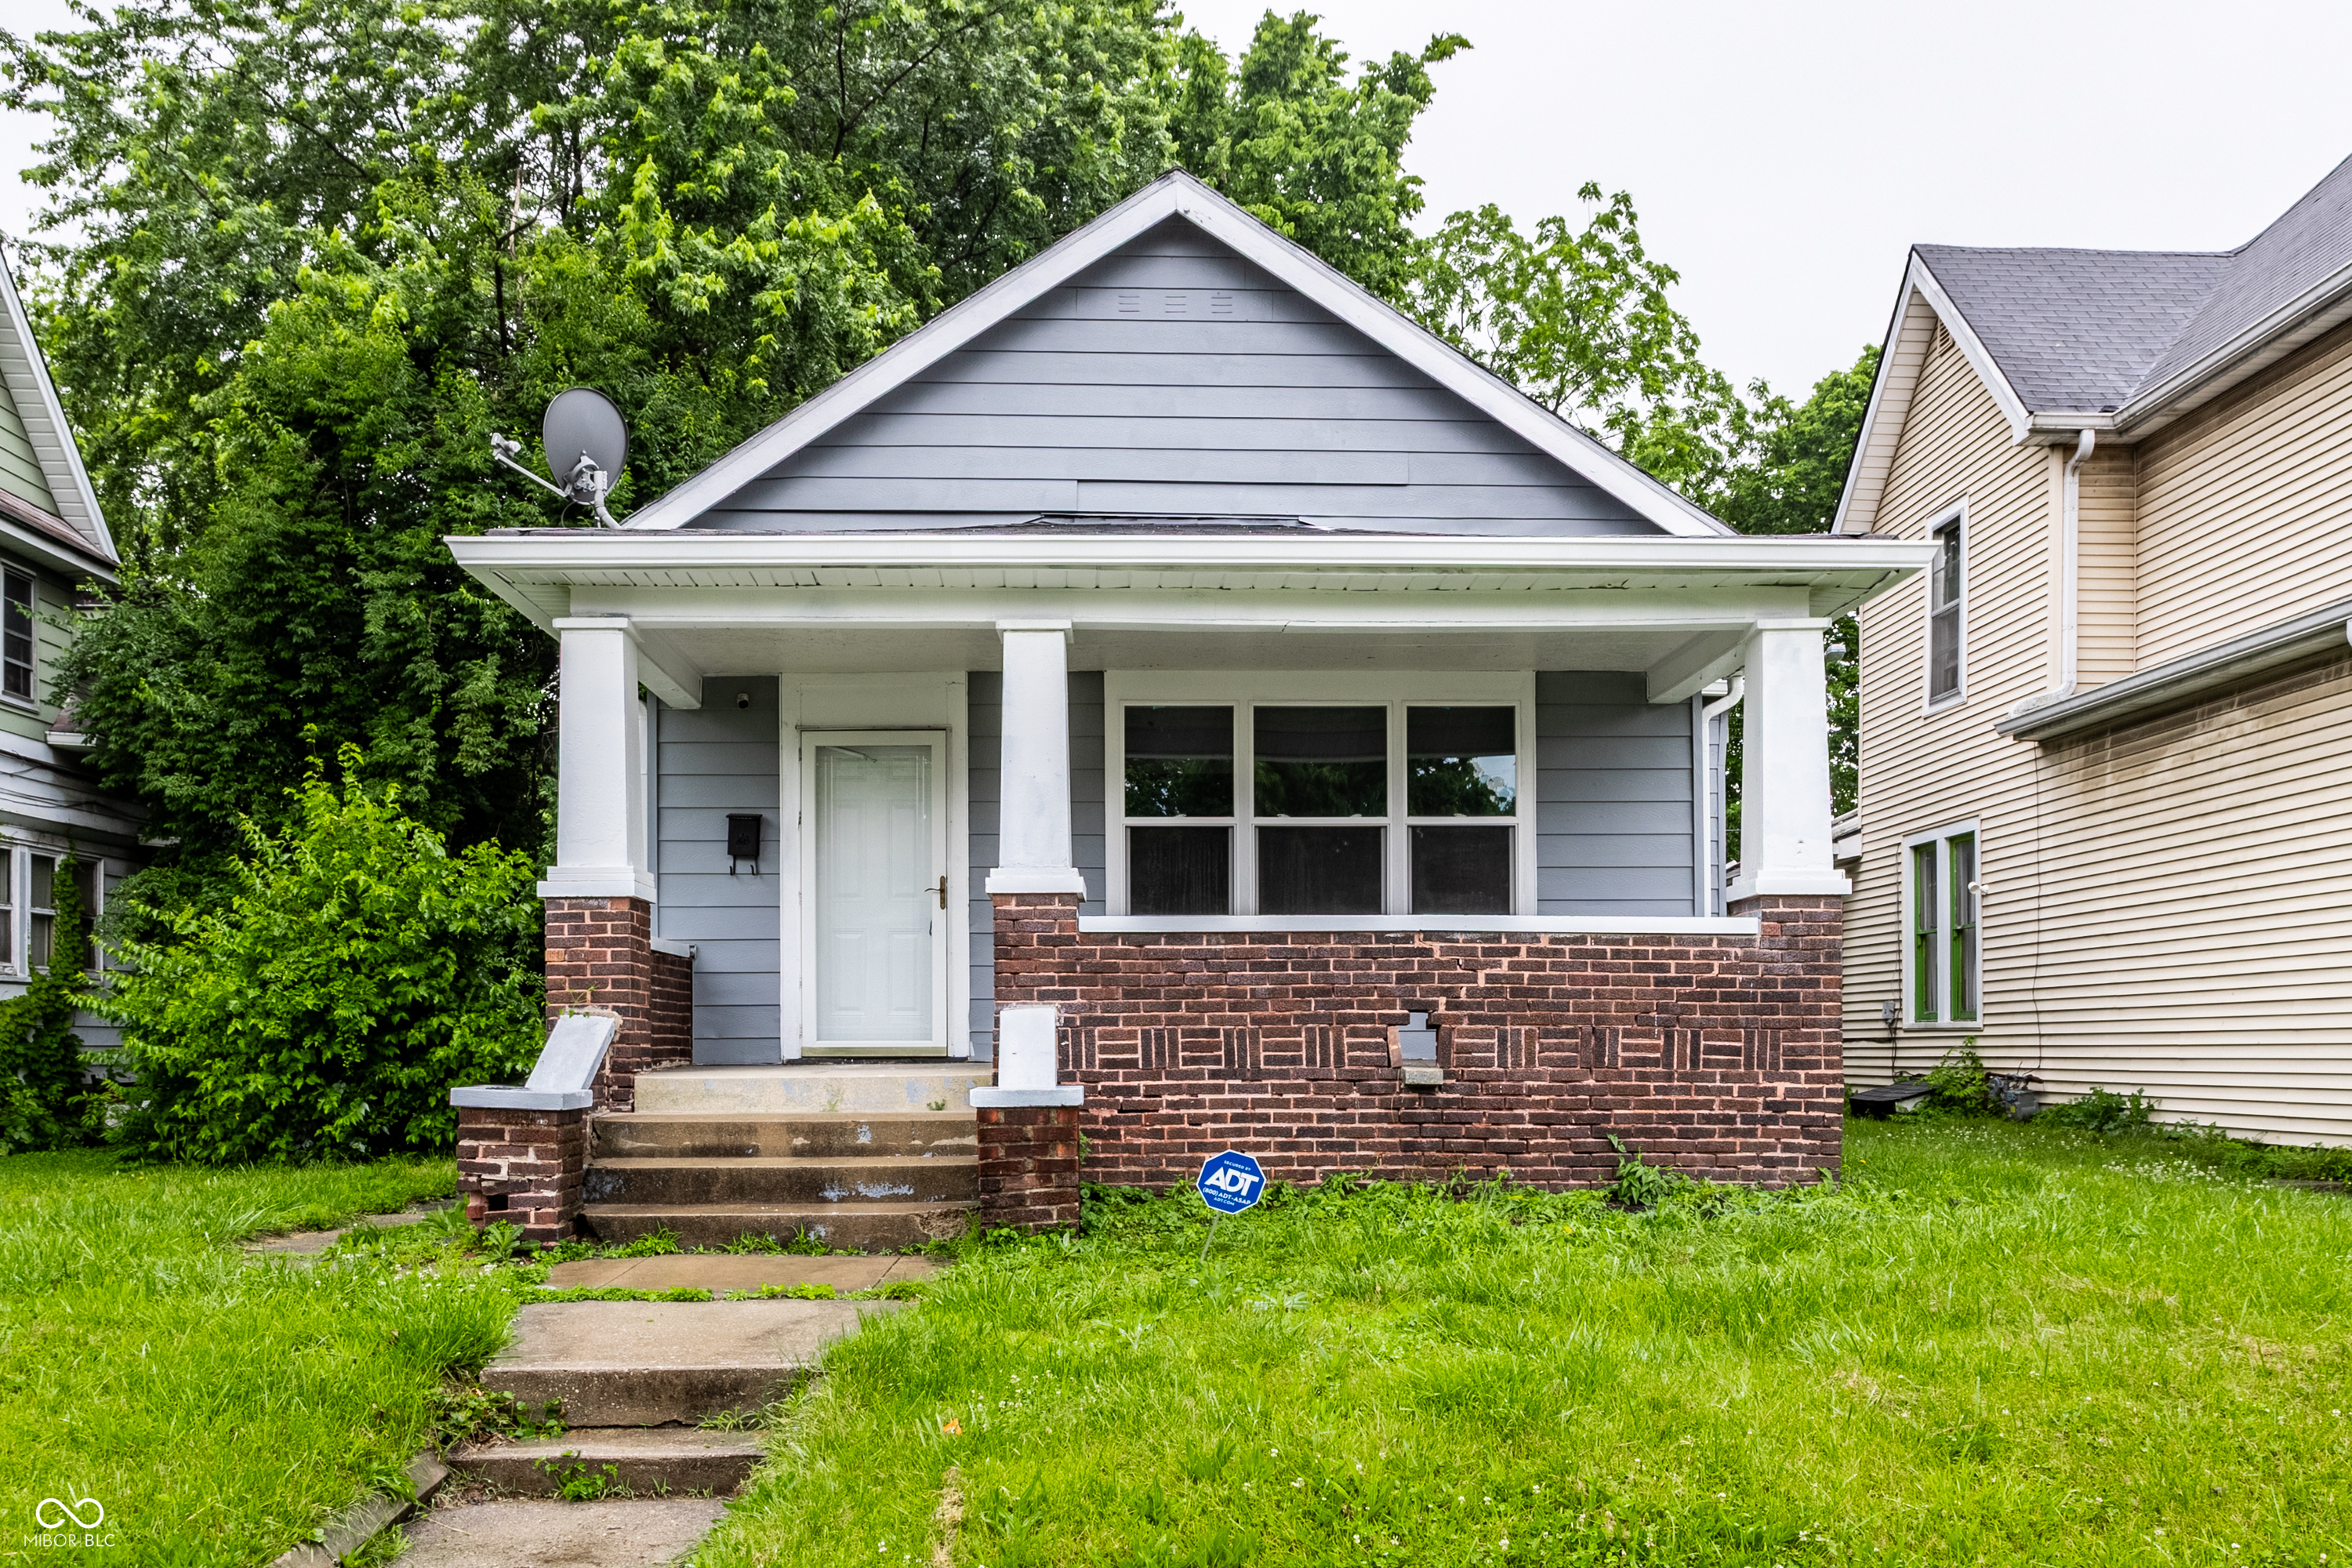
$140,000
3
bds
|
2
ba
|
1,204
sqft
|
built
1950
3302 E 42nd St, Indianapolis, IN 46205
$525
Cash flow
19.6%
Cash-on-Cash Return
10.6%
Cap rate
1.3%
Rent to Value Ratio
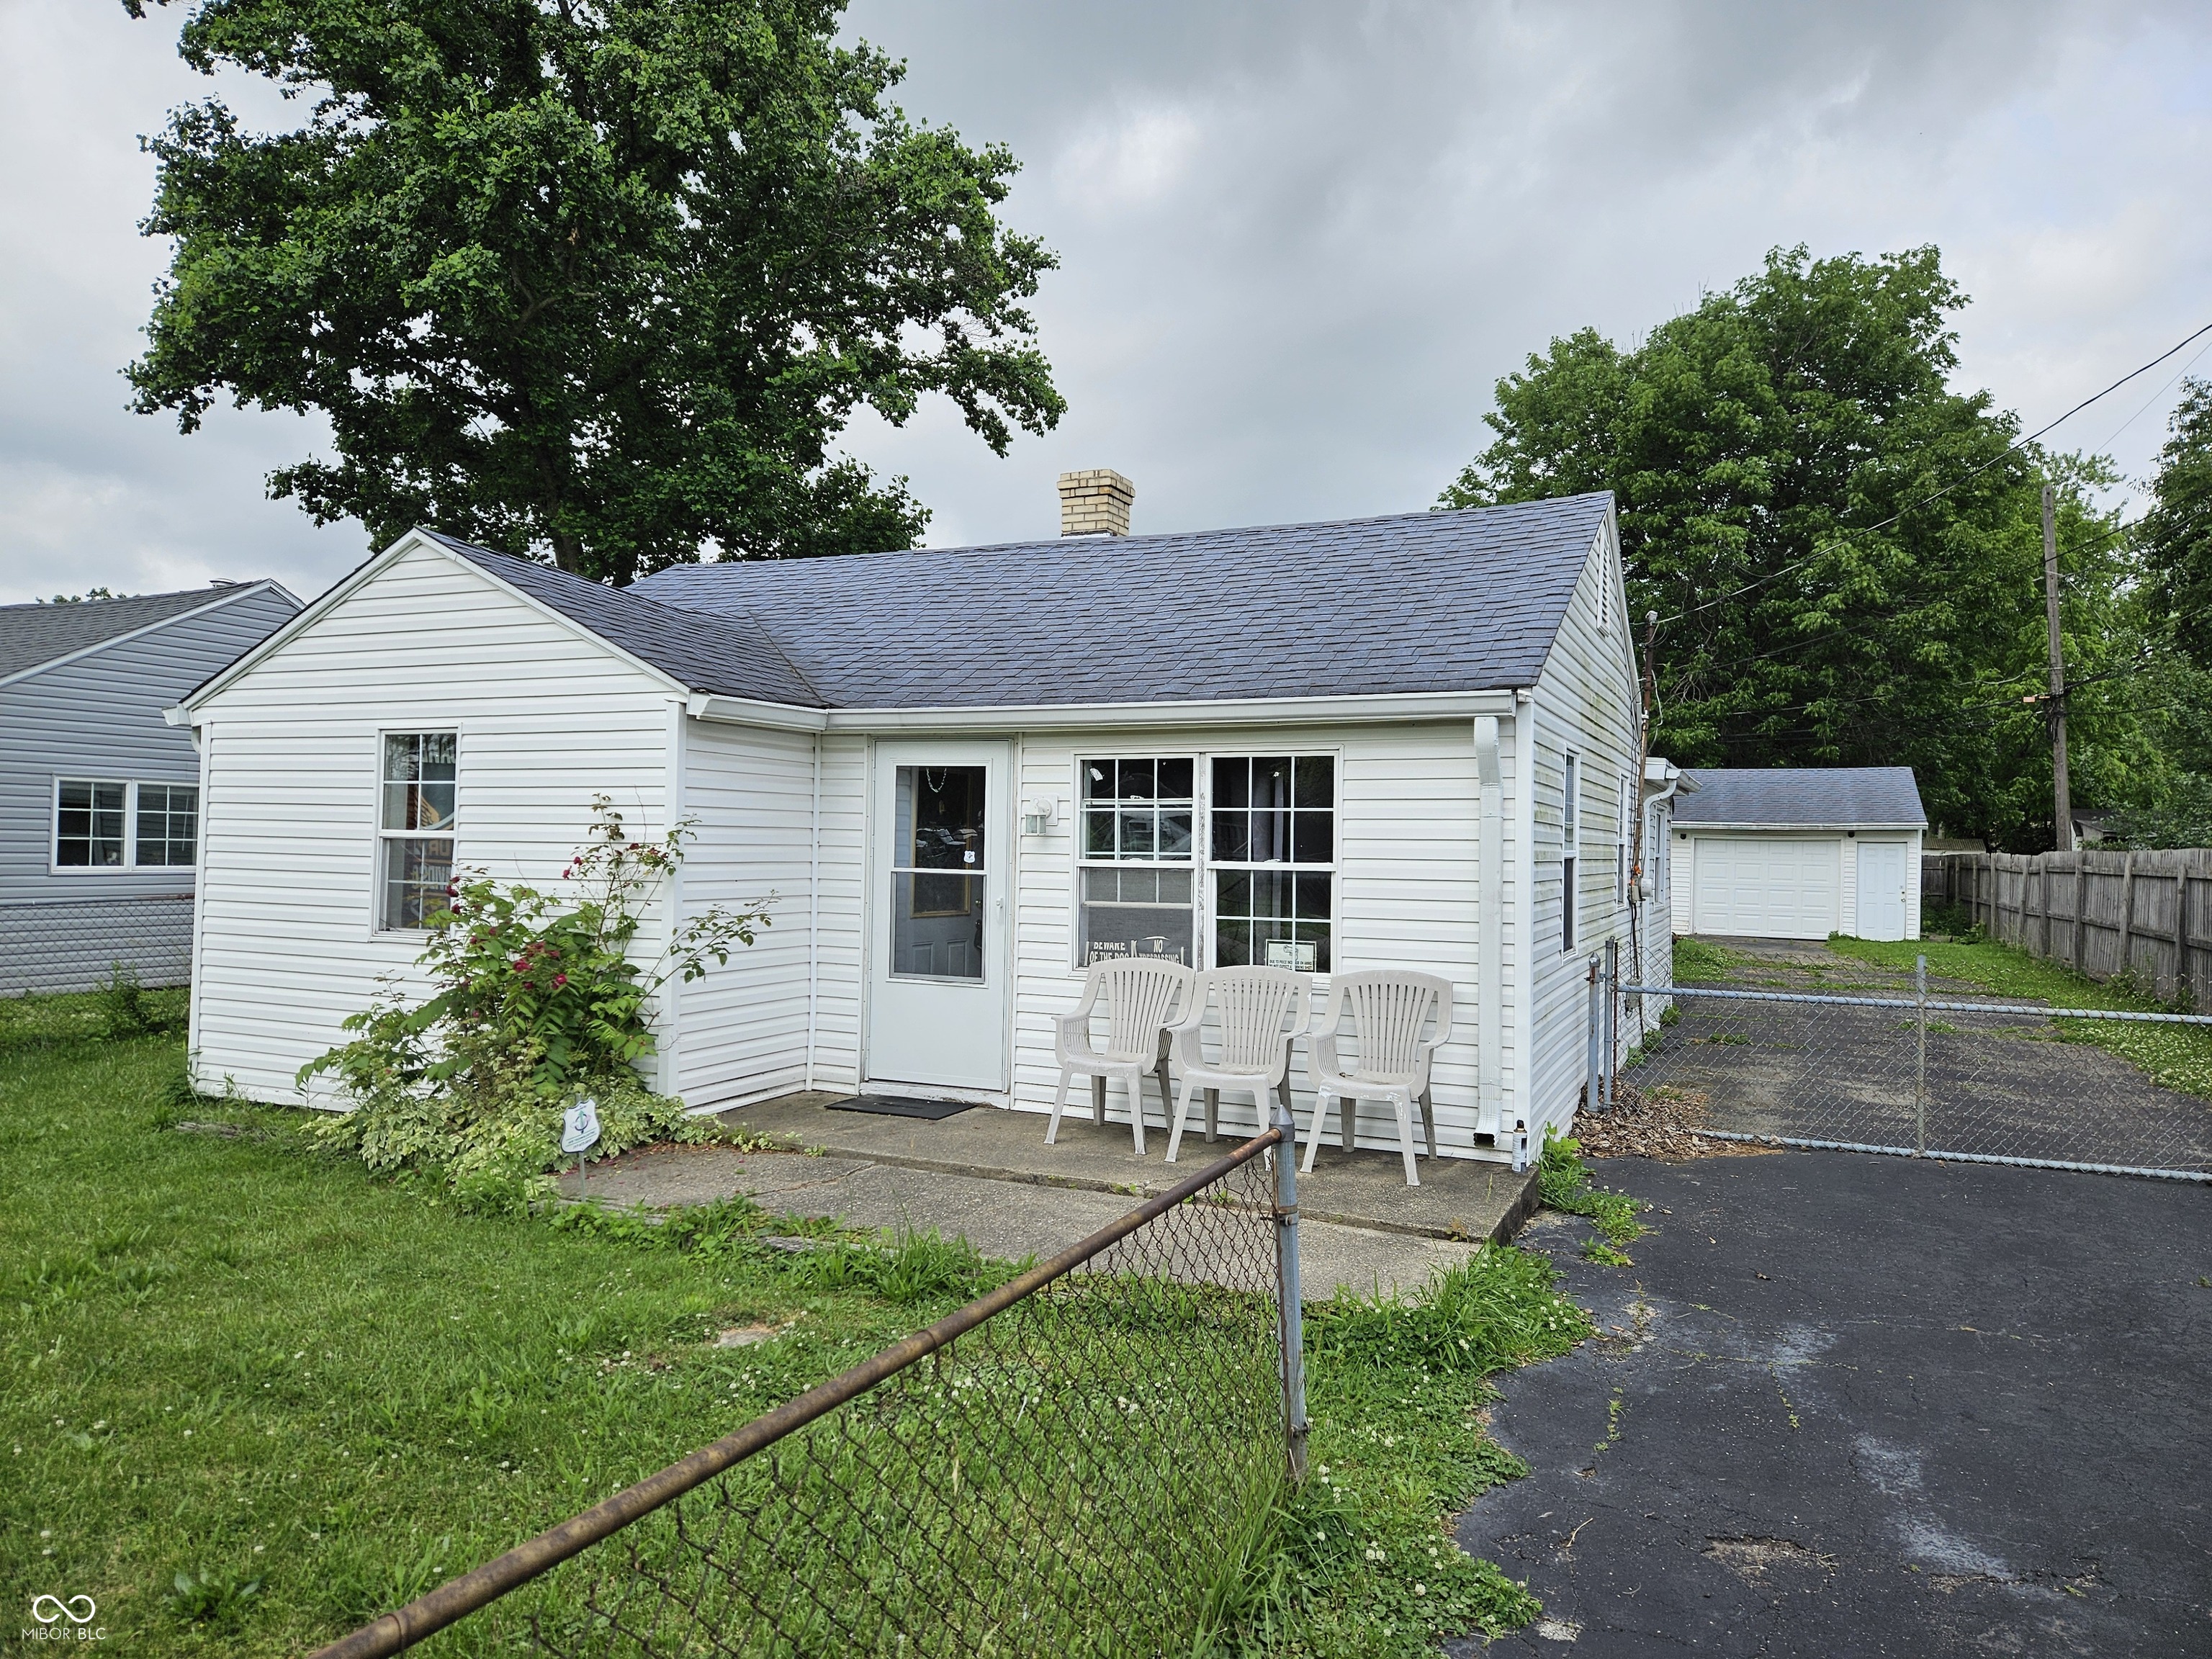
Active
$100,000
2
bds
|
1
ba
|
1,160
sqft
|
built
1950
1102 S Dequincy St, Indianapolis, IN 46203
$454
Cash flow
23.7%
Cash-on-Cash Return
11.6%
Cap rate
1.4%
Rent to Value Ratio
1,993 out of 2,135 properties for sale in Indianapolis, IN
Limited Results Shown
Create a free account, or log in to reveal all property listings and enjoy the complete experience.
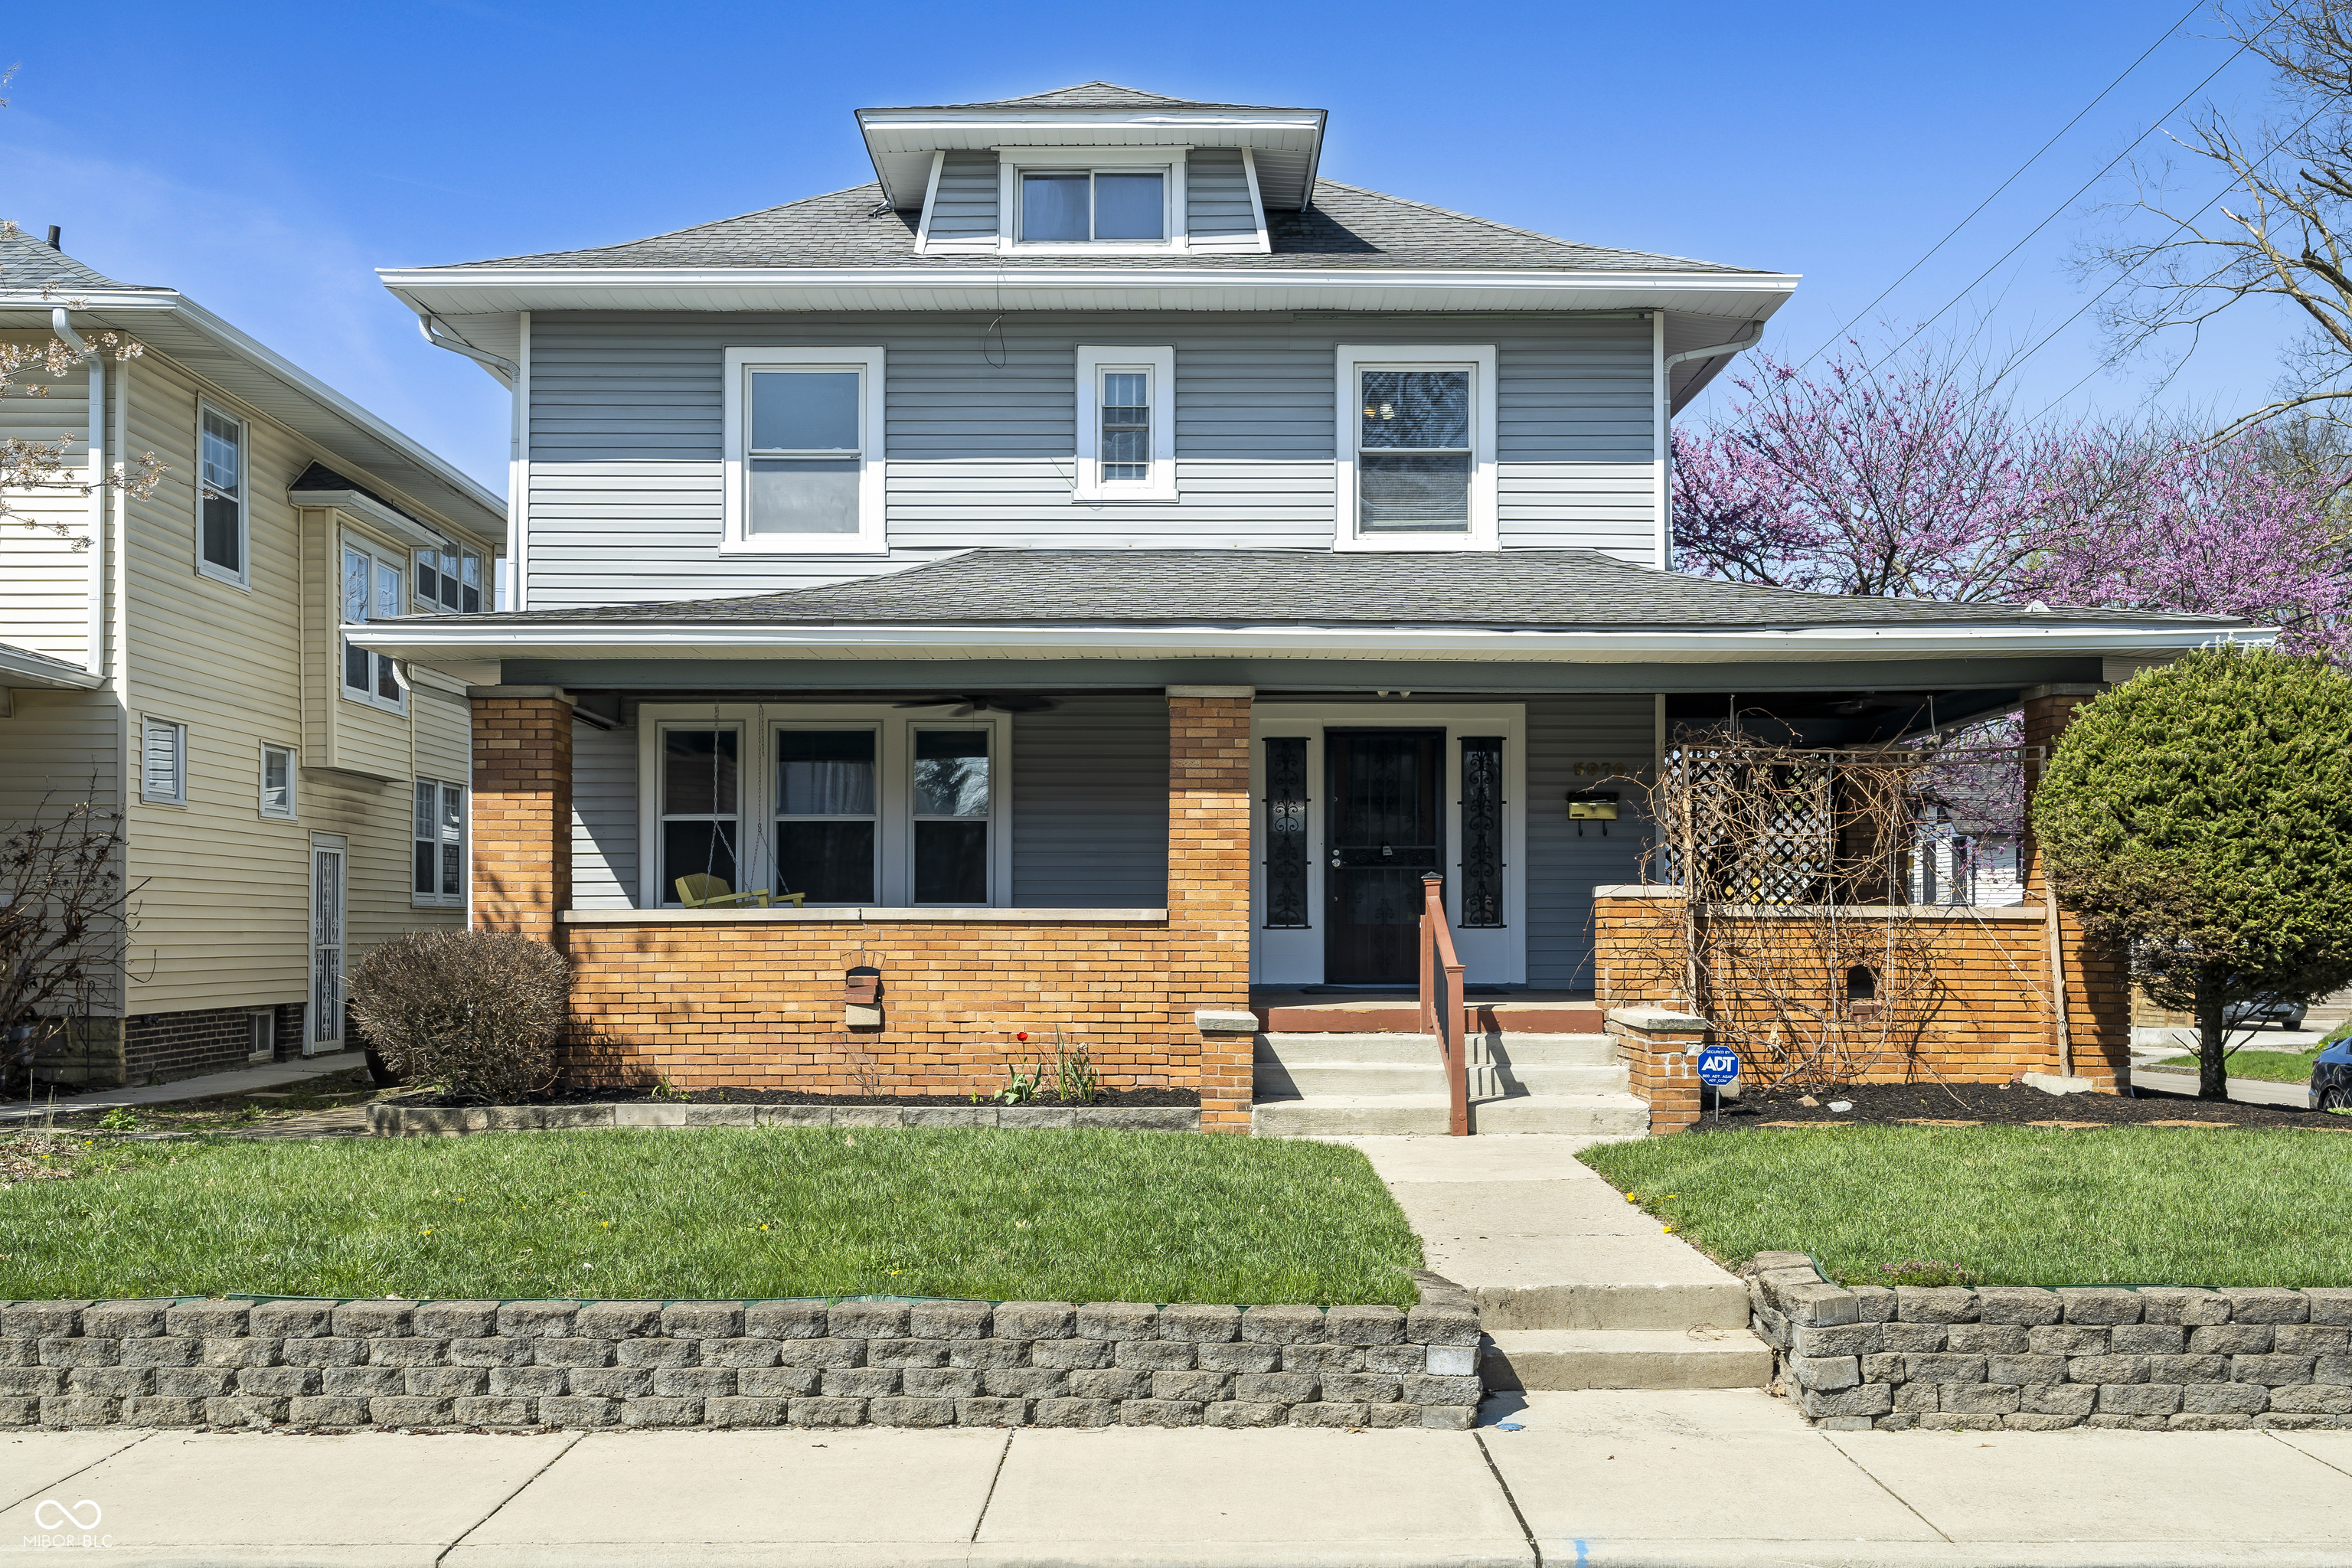
Active
$355,000
5
bds
|
4
ba
|
3,078
sqft
|
built
1925
3970 Broadway St, Indianapolis, IN 46205
$-300
Cash flow
-4.4%
Cash-on-Cash Return
5.1%
Cap rate
0.6%
Rent to Value Ratio
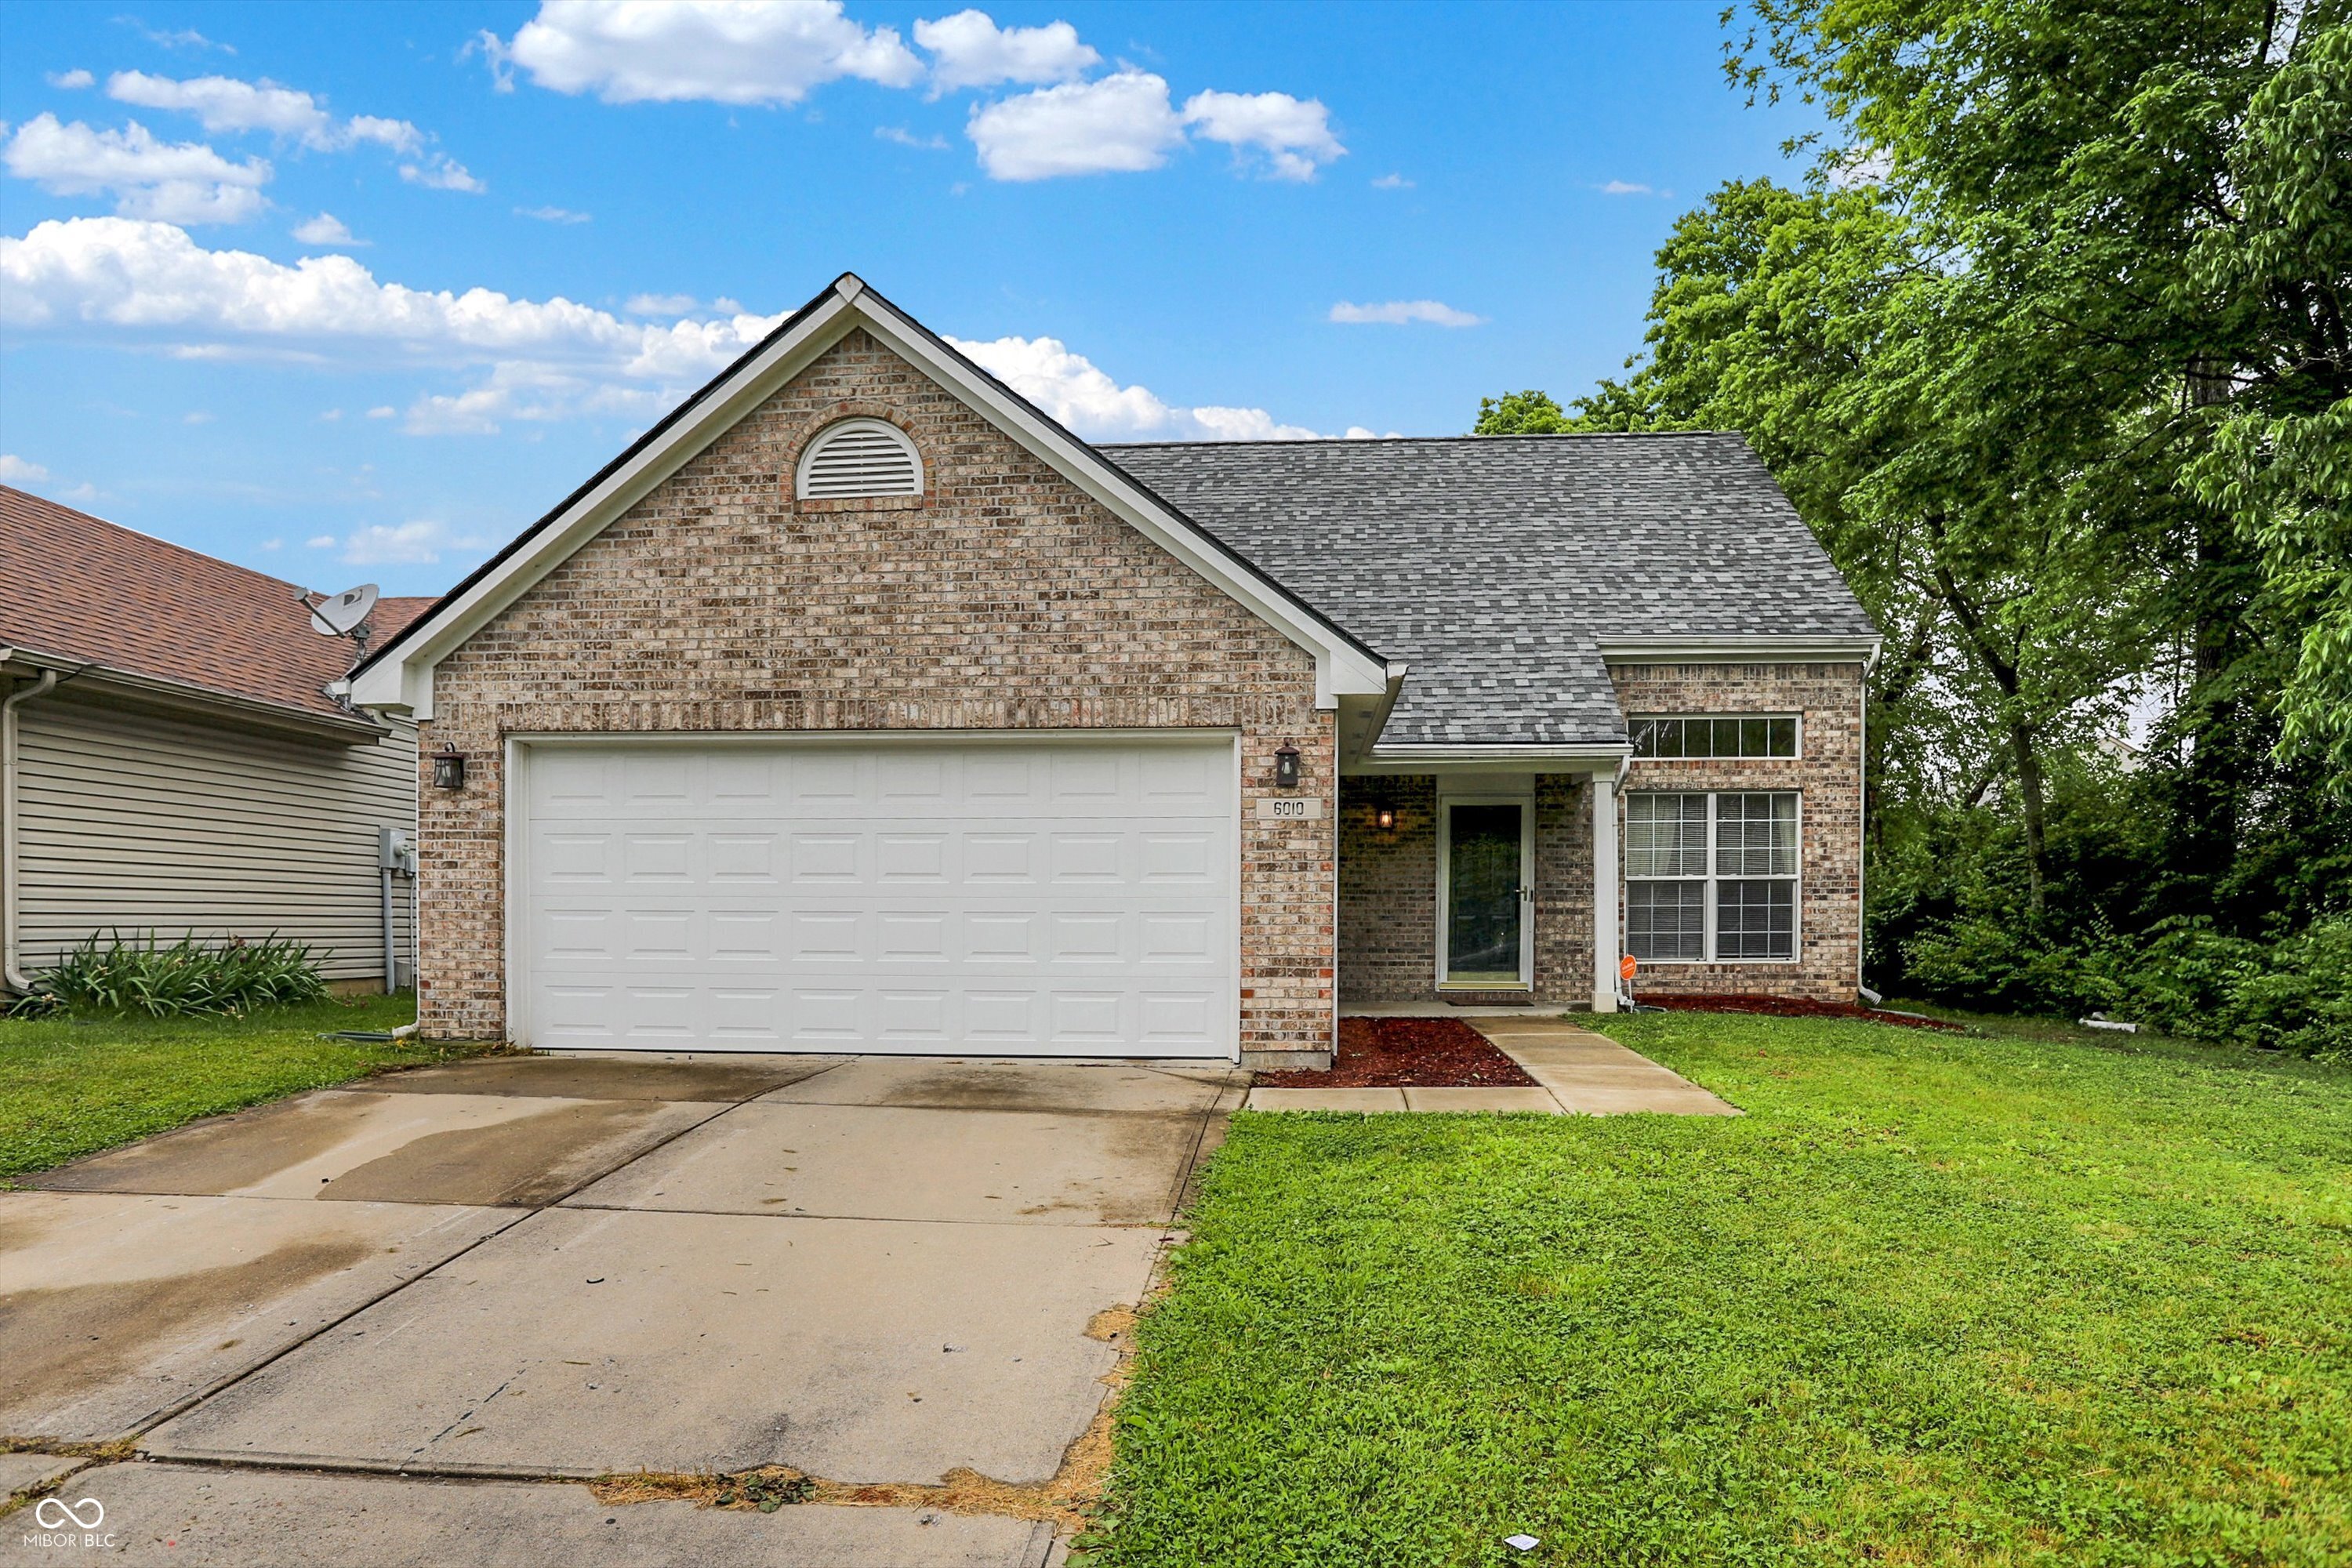
Active
$294,900
4
bds
|
3
ba
|
2,015
sqft
|
built
2000
6010 Lakeside Manor Ave, Indianapolis, IN 46254
$-13
Cash flow
-0.2%
Cash-on-Cash Return
6.1%
Cap rate
0.7%
Rent to Value Ratio
Active
$215,000
2
bds
|
1
ba
|
1,000
sqft
|
built
1920
2035 S Pennsylvania St, Indianapolis, IN 46225
$-135
Cash flow
-3.3%
Cash-on-Cash Return
5.4%
Cap rate
0.7%
Rent to Value Ratio
Pending
$450,000
3
bds
|
2
ba
|
2,200
sqft
|
built
1993
12231 Valley View Cir, Indianapolis, IN 46229
$-712
Cash flow
-8.3%
Cash-on-Cash Return
4.2%
Cap rate
0.5%
Rent to Value Ratio
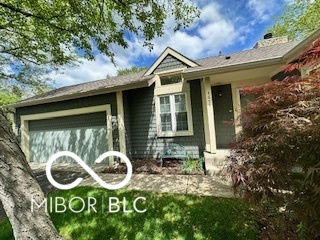
Active
$289,990
3
bds
|
2
ba
|
1,764
sqft
|
built
1997
6264 Whitaker Farms Dr, Indianapolis, IN 46237
$-122
Cash flow
-2.2%
Cash-on-Cash Return
5.6%
Cap rate
0.7%
Rent to Value Ratio
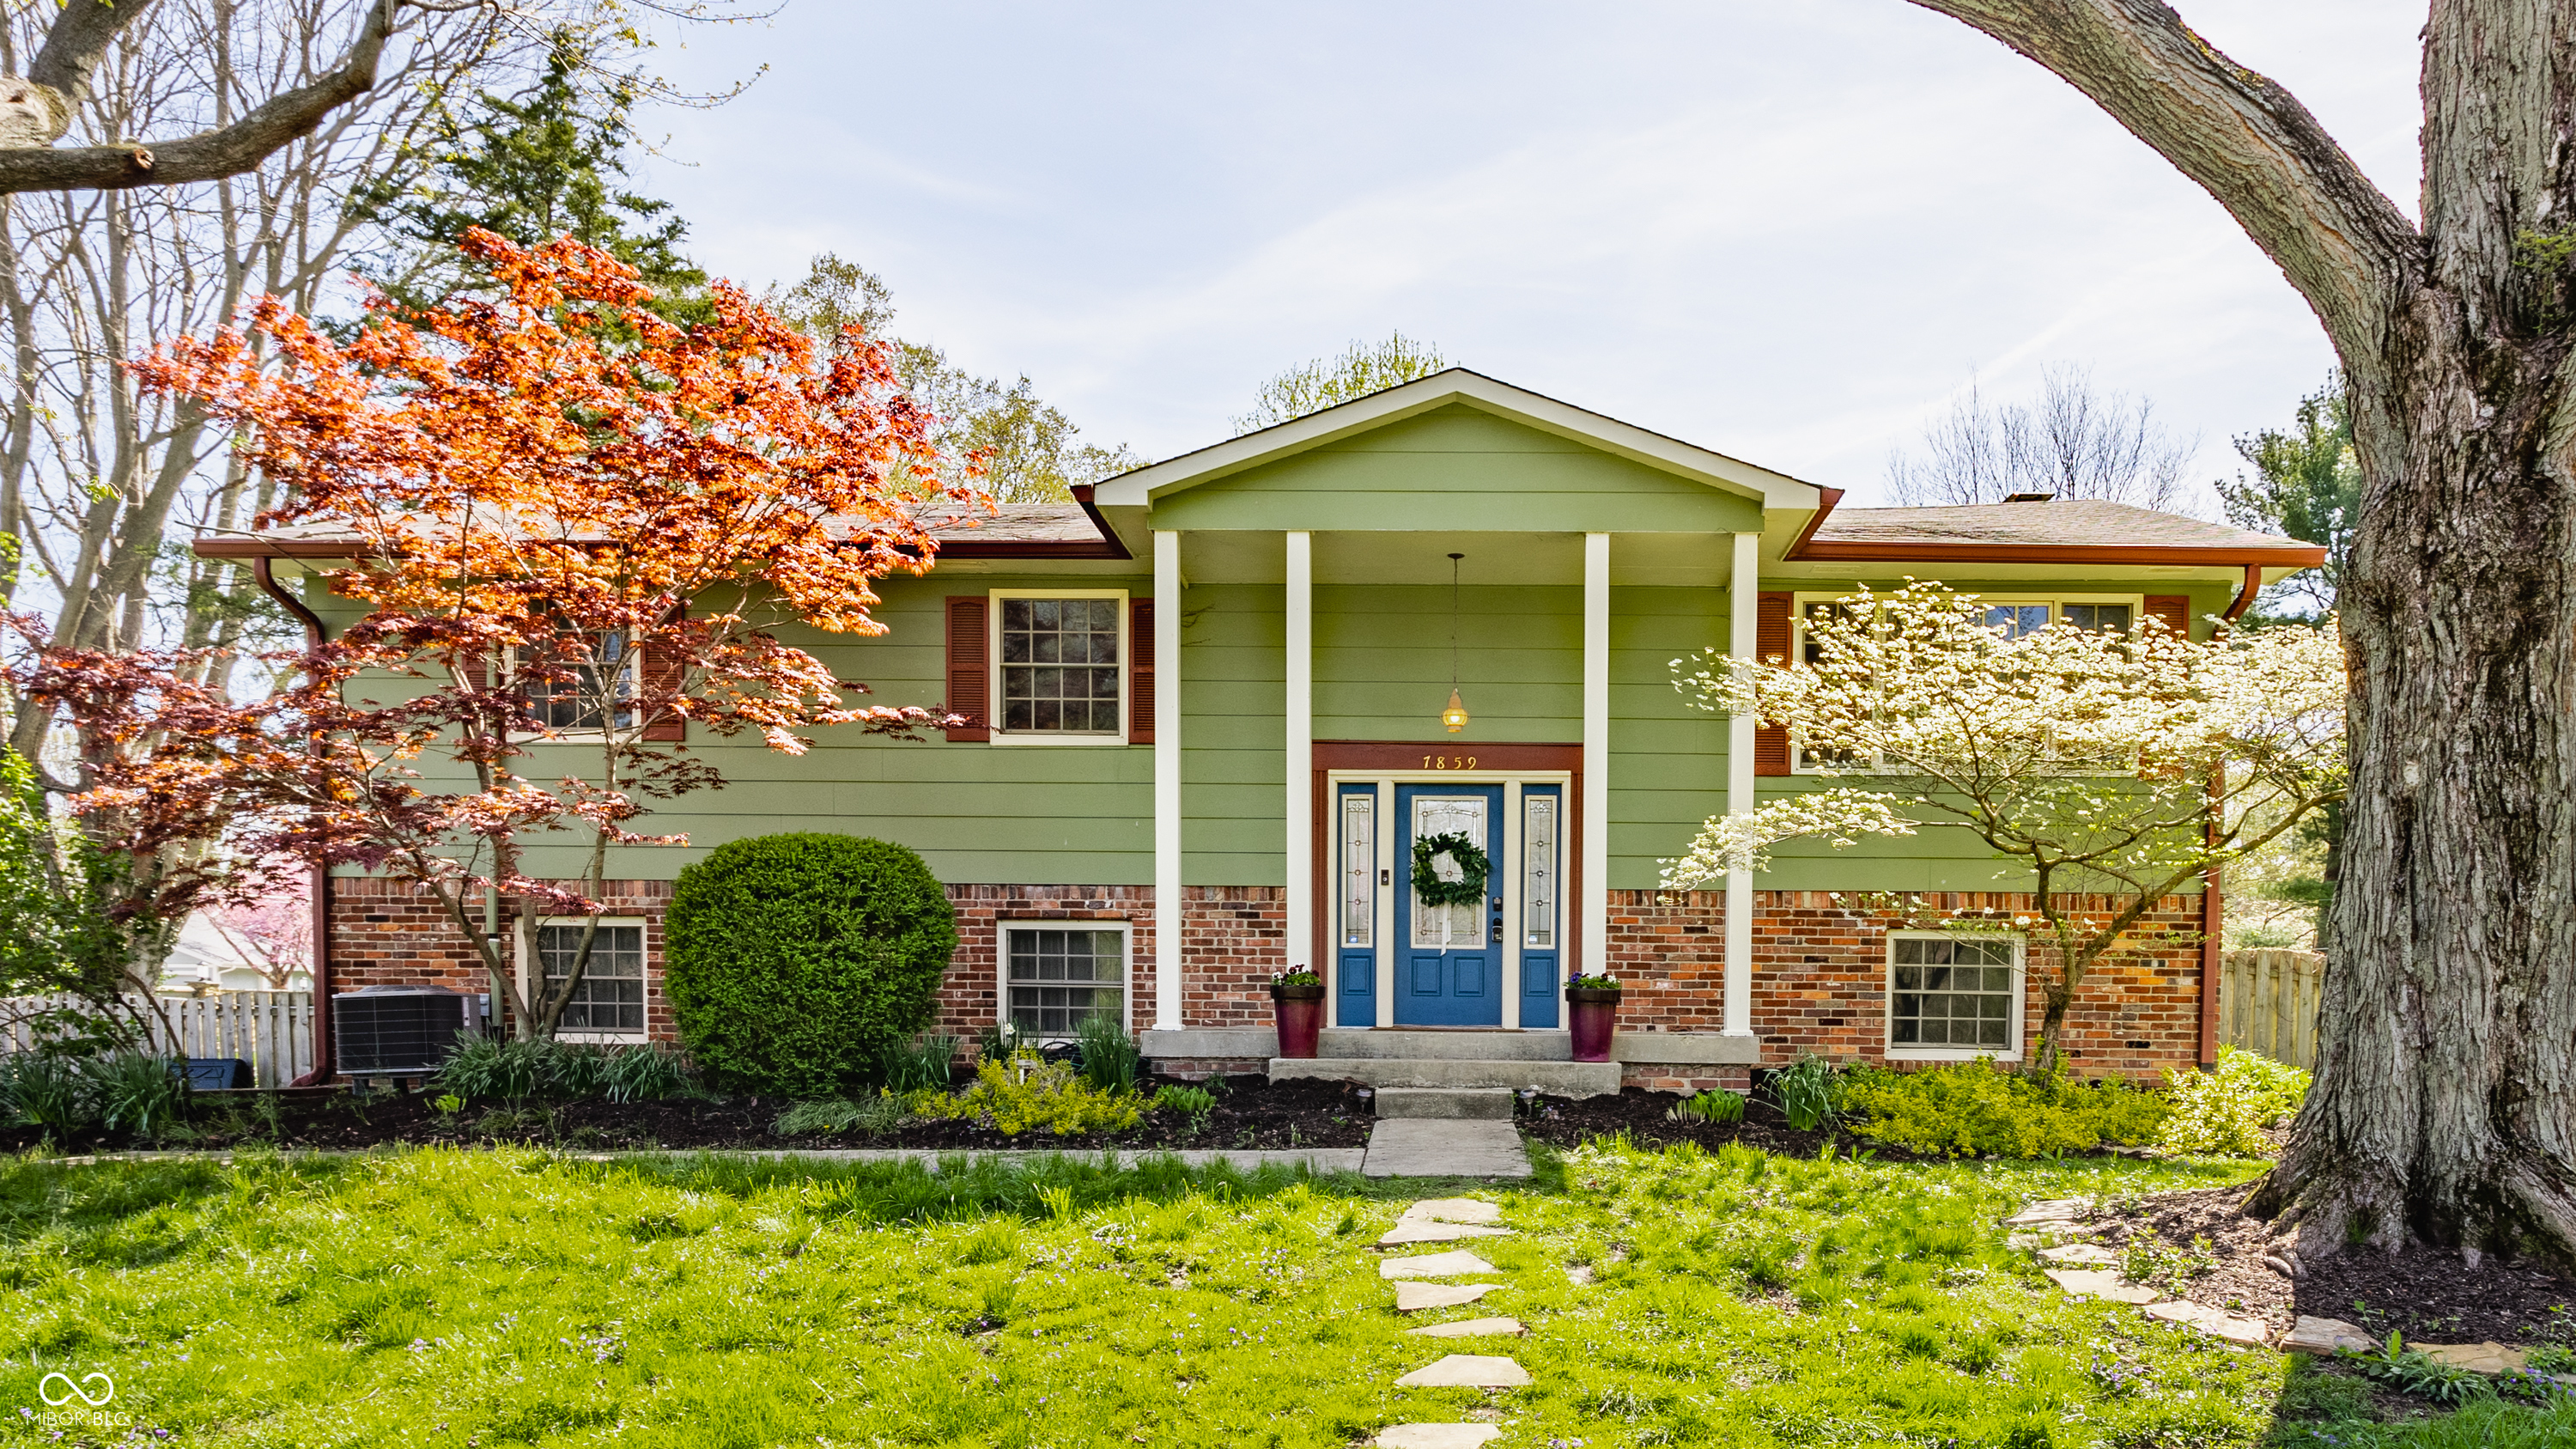
Active
$420,000
3
bds
|
3
ba
|
2,128
sqft
|
built
1962
7859 N Chester Ave, Indianapolis, IN 46240
$-150
Cash flow
-1.9%
Cash-on-Cash Return
5.7%
Cap rate
0.7%
Rent to Value Ratio
Active
$329,000
4
bds
|
3
ba
|
2,446
sqft
|
built
1954
10036 E Troy Ave, Indianapolis, IN 46239
$-167
Cash flow
-2.6%
Cash-on-Cash Return
5.5%
Cap rate
0.7%
Rent to Value Ratio
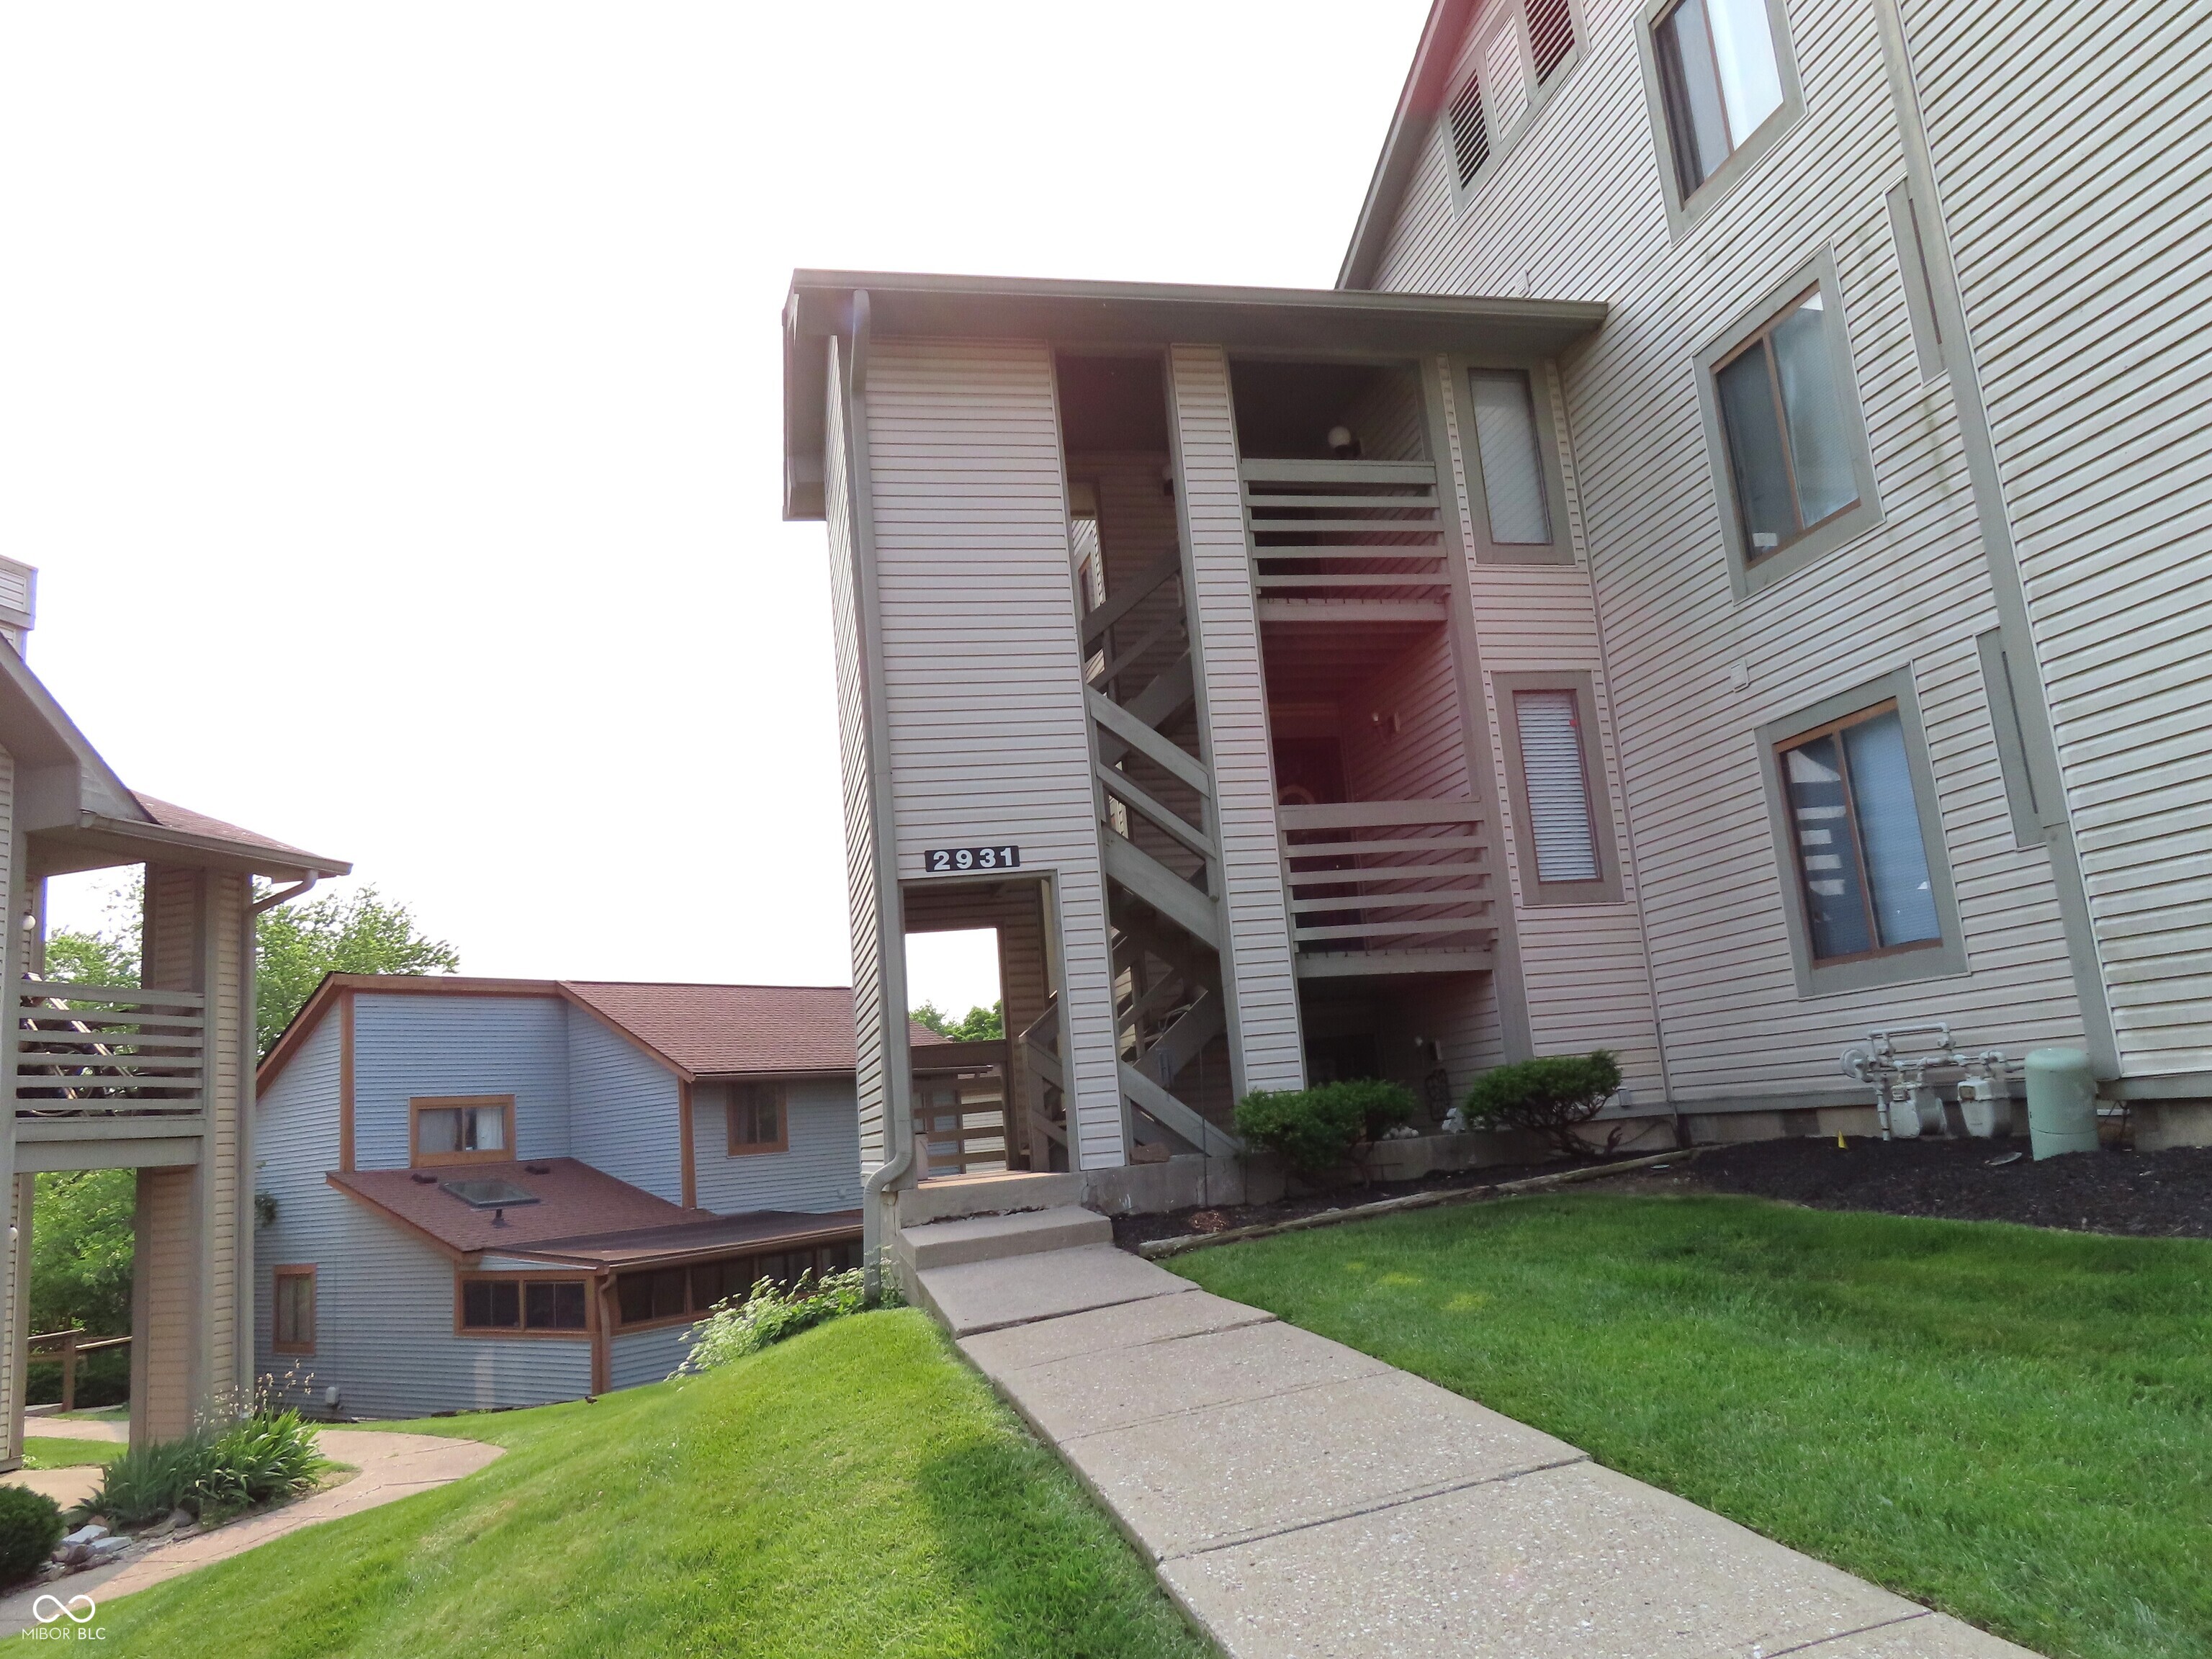
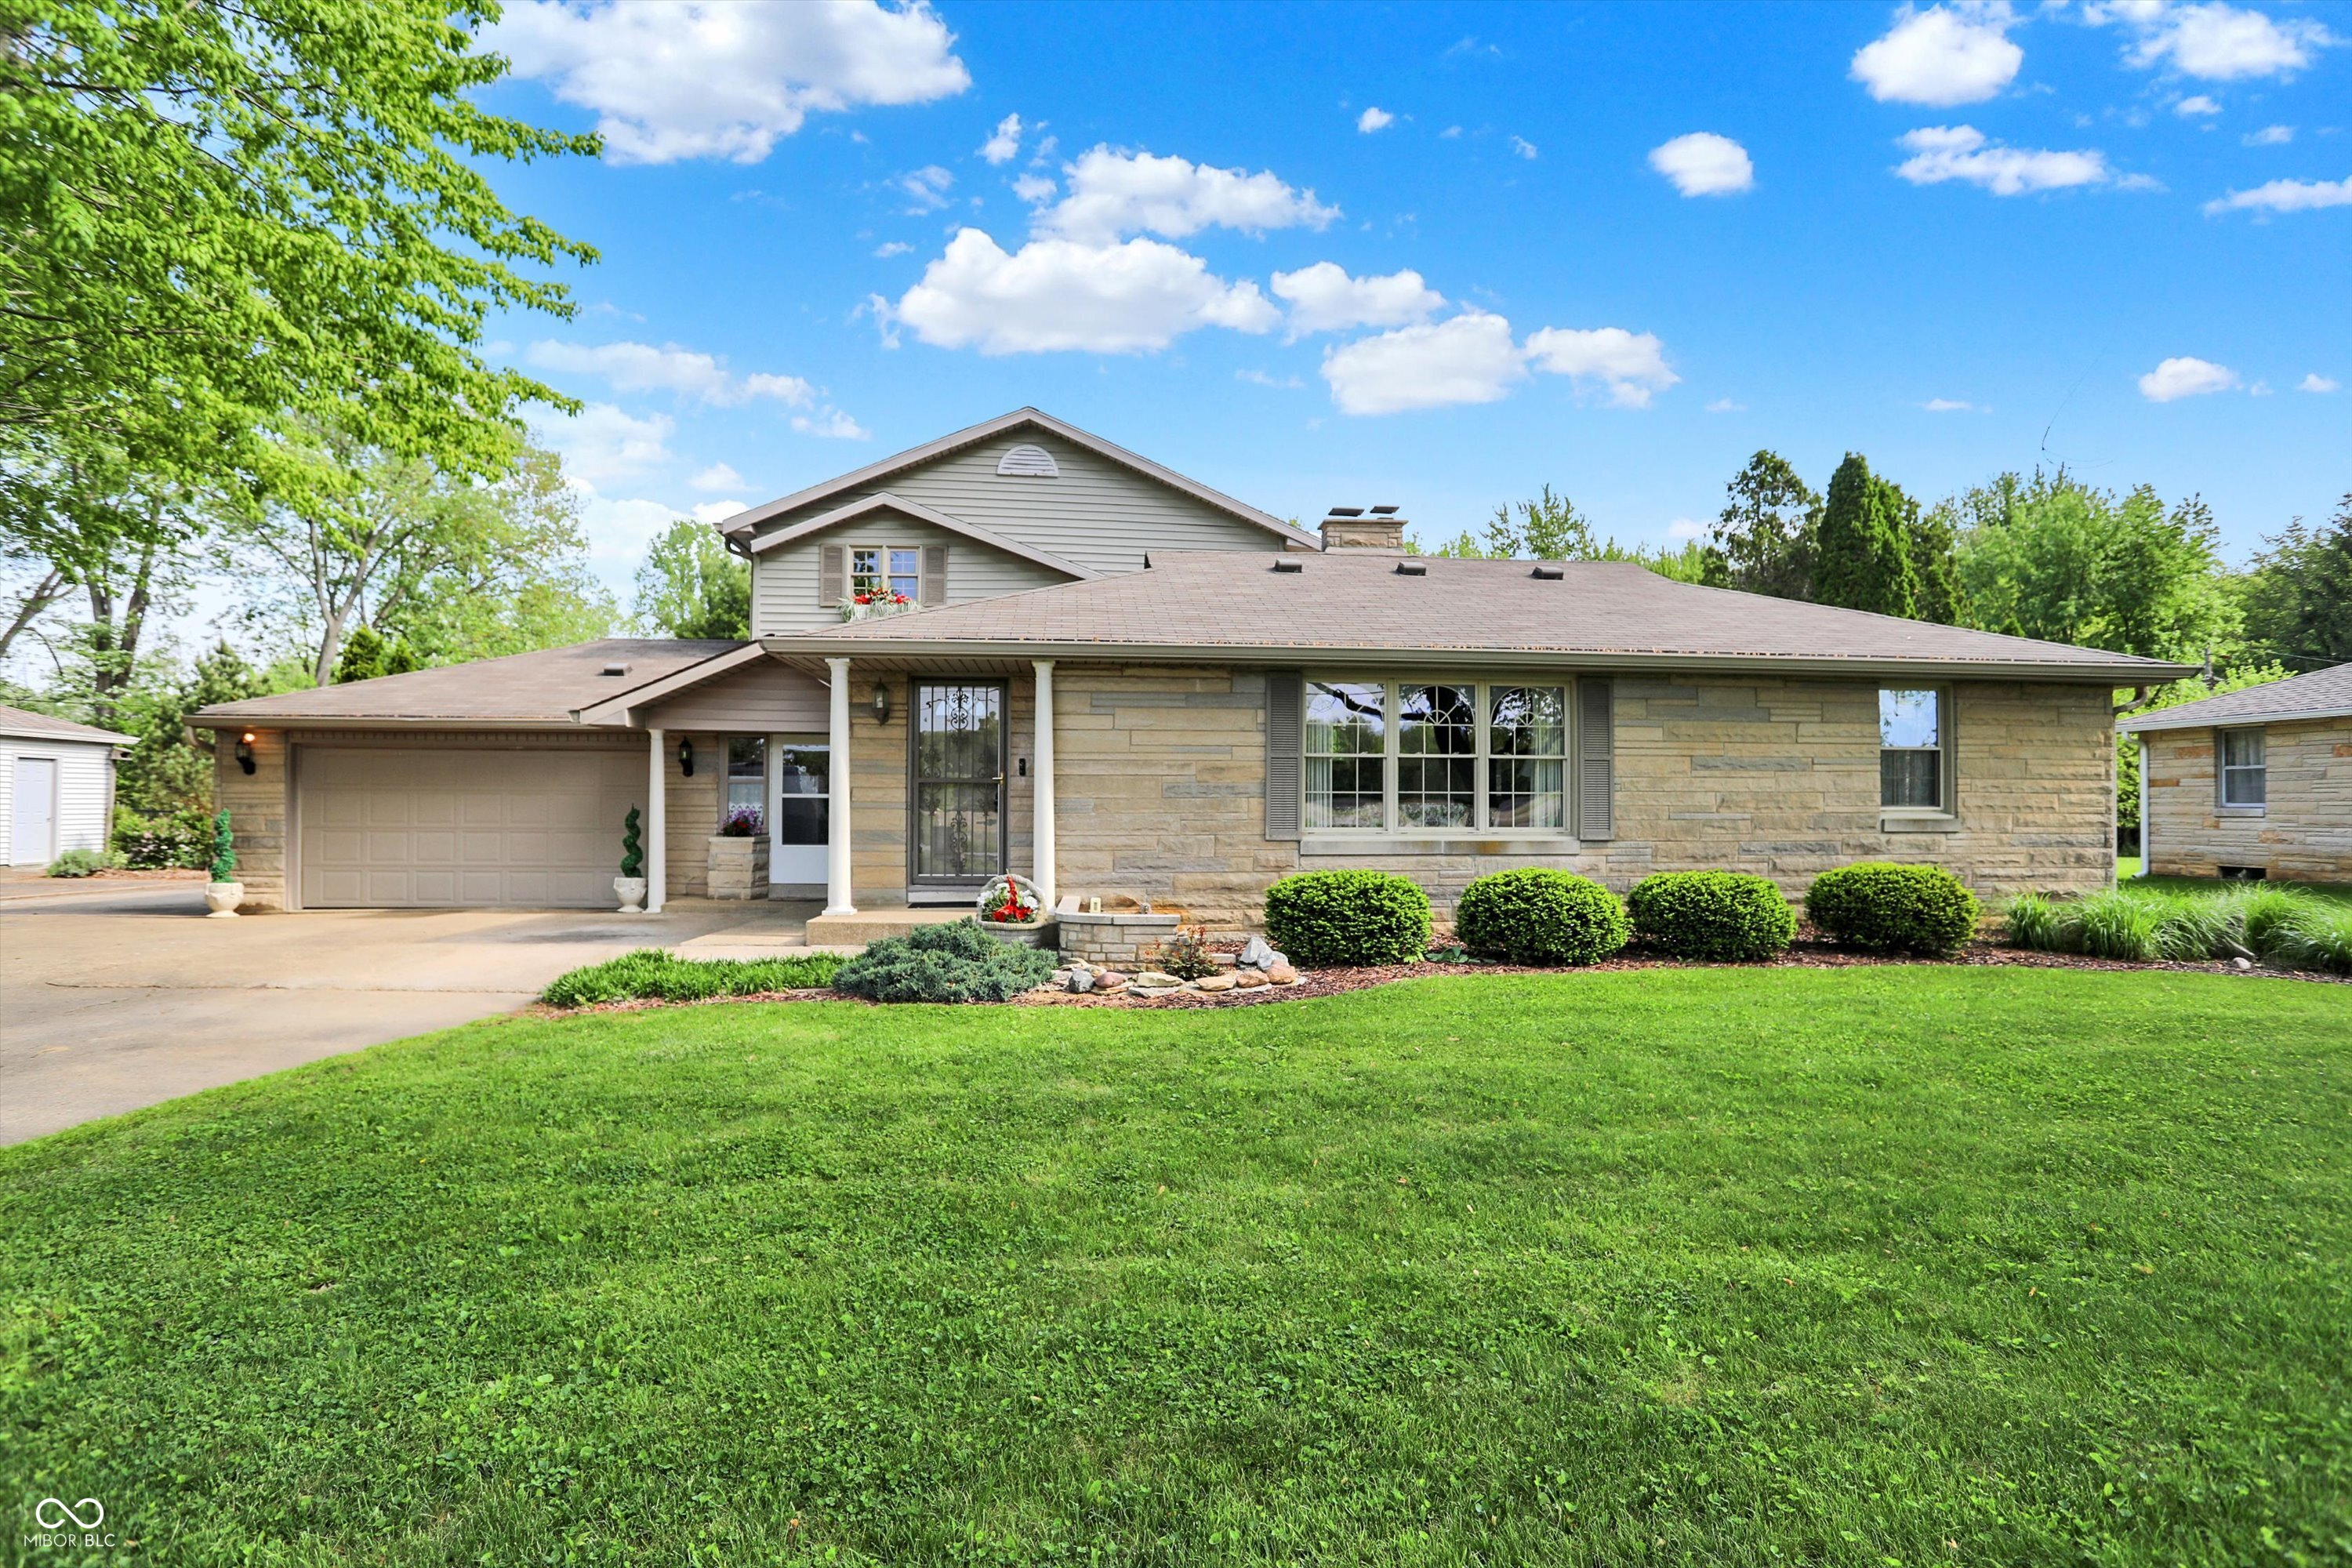
Active
$125,000
2
bds
|
1
ba
|
984
sqft
|
built
1983
2931 Eagles Crest Cir, Indianapolis, IN 46214
$101
Cash flow
4.2%
Cash-on-Cash Return
7.1%
Cap rate
1.1%
Rent to Value Ratio
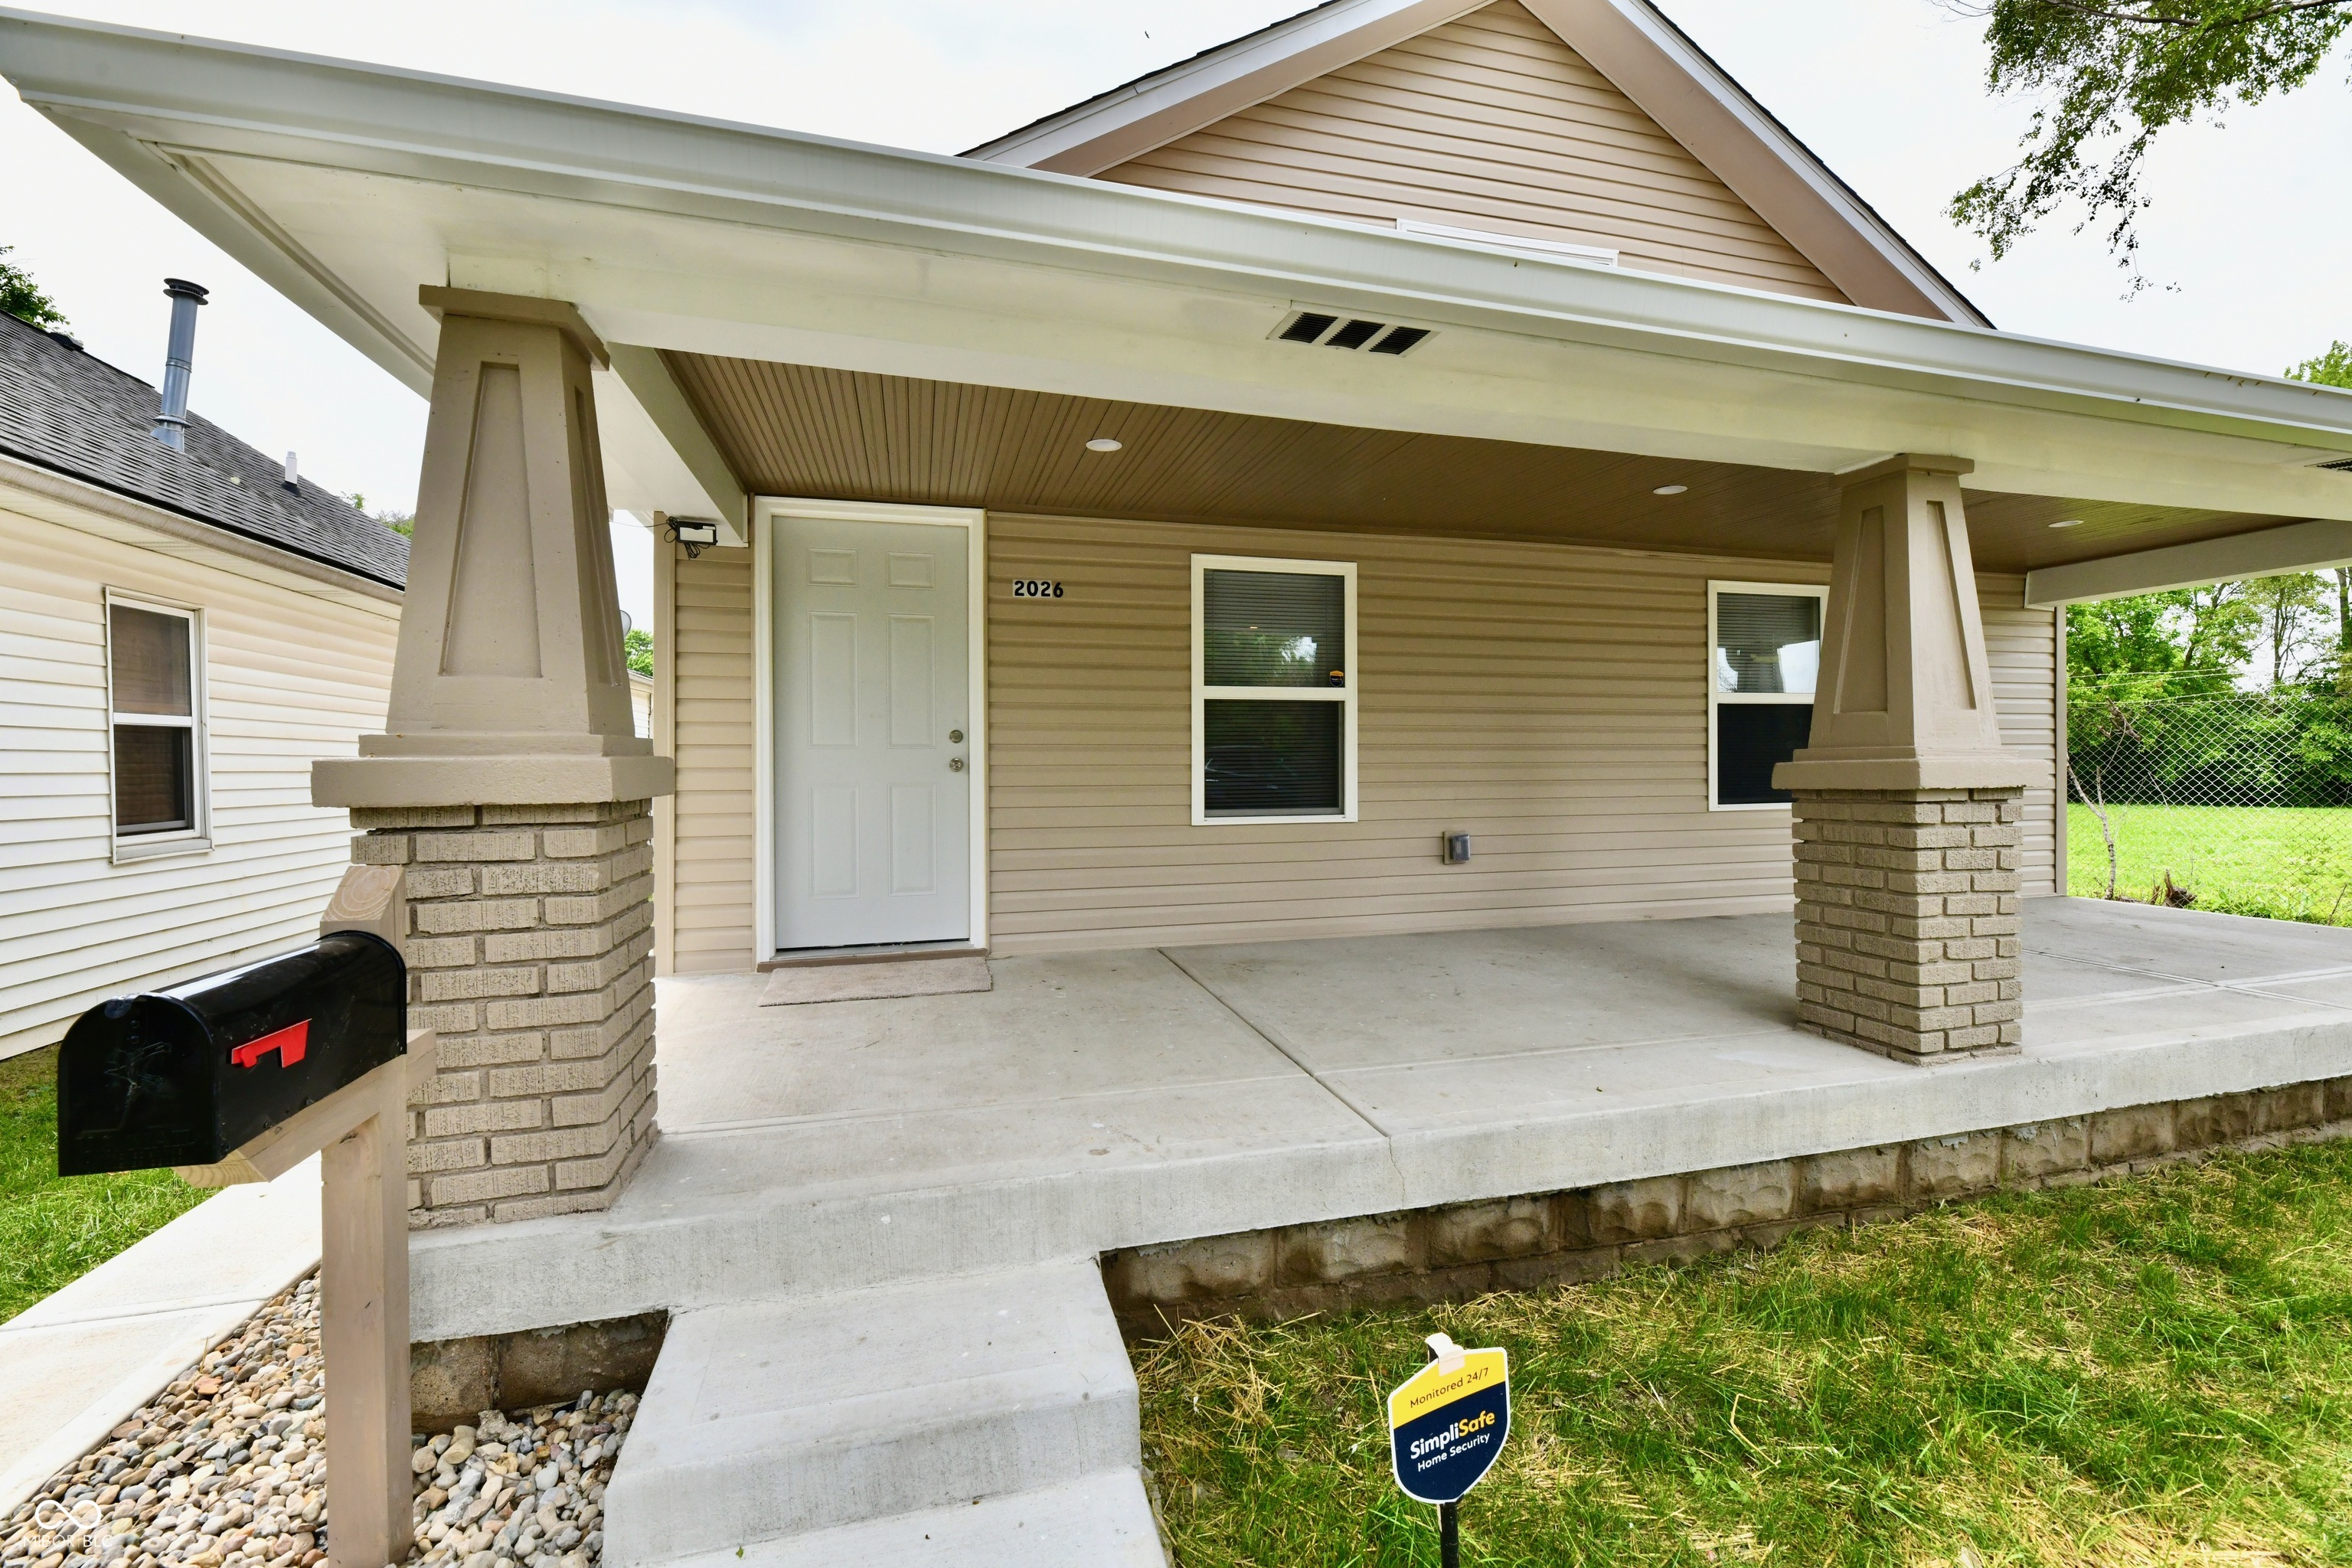
Active
$211,000
3
bds
|
2
ba
|
1,184
sqft
|
built
1926
2026 Spruce St, Indianapolis, IN 46203
$-667
Cash flow
-16.5%
Cash-on-Cash Return
2.4%
Cap rate
0.3%
Rent to Value Ratio
Active
$100,000
2
bds
|
1
ba
|
1,160
sqft
|
built
1950
1102 S Dequincy St, Indianapolis, IN 46203
$454
Cash flow
23.7%
Cash-on-Cash Return
11.6%
Cap rate
1.4%
Rent to Value Ratio
Pending
$155,000
3
bds
|
1
ba
|
968
sqft
|
built
1950
1837 Bauer Rd, Indianapolis, IN 46218
$172
Cash flow
5.8%
Cash-on-Cash Return
7.5%
Cap rate
0.9%
Rent to Value Ratio
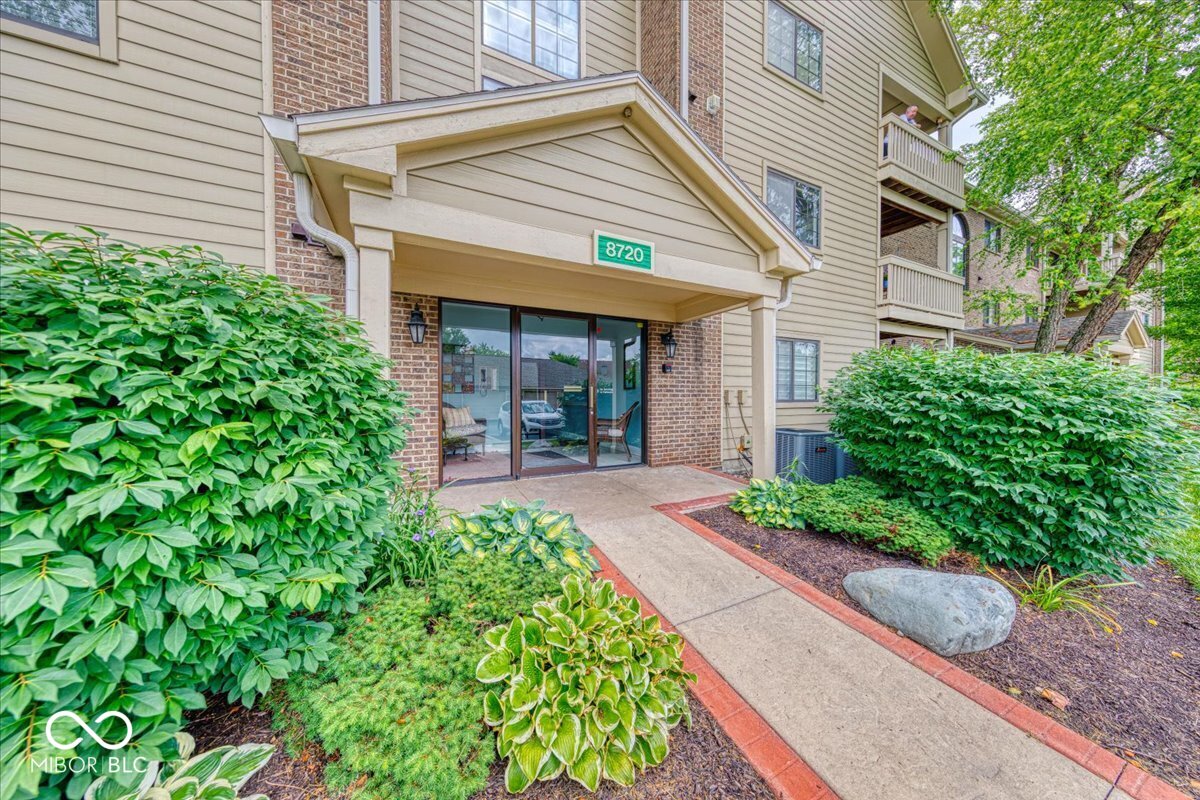
Pending
$192,000
2
bds
|
2
ba
|
1,175
sqft
|
built
1992
8720 Yardley Ct, Indianapolis, IN 46268
$-293
Cash flow
-8.0%
Cash-on-Cash Return
4.3%
Cap rate
0.8%
Rent to Value Ratio
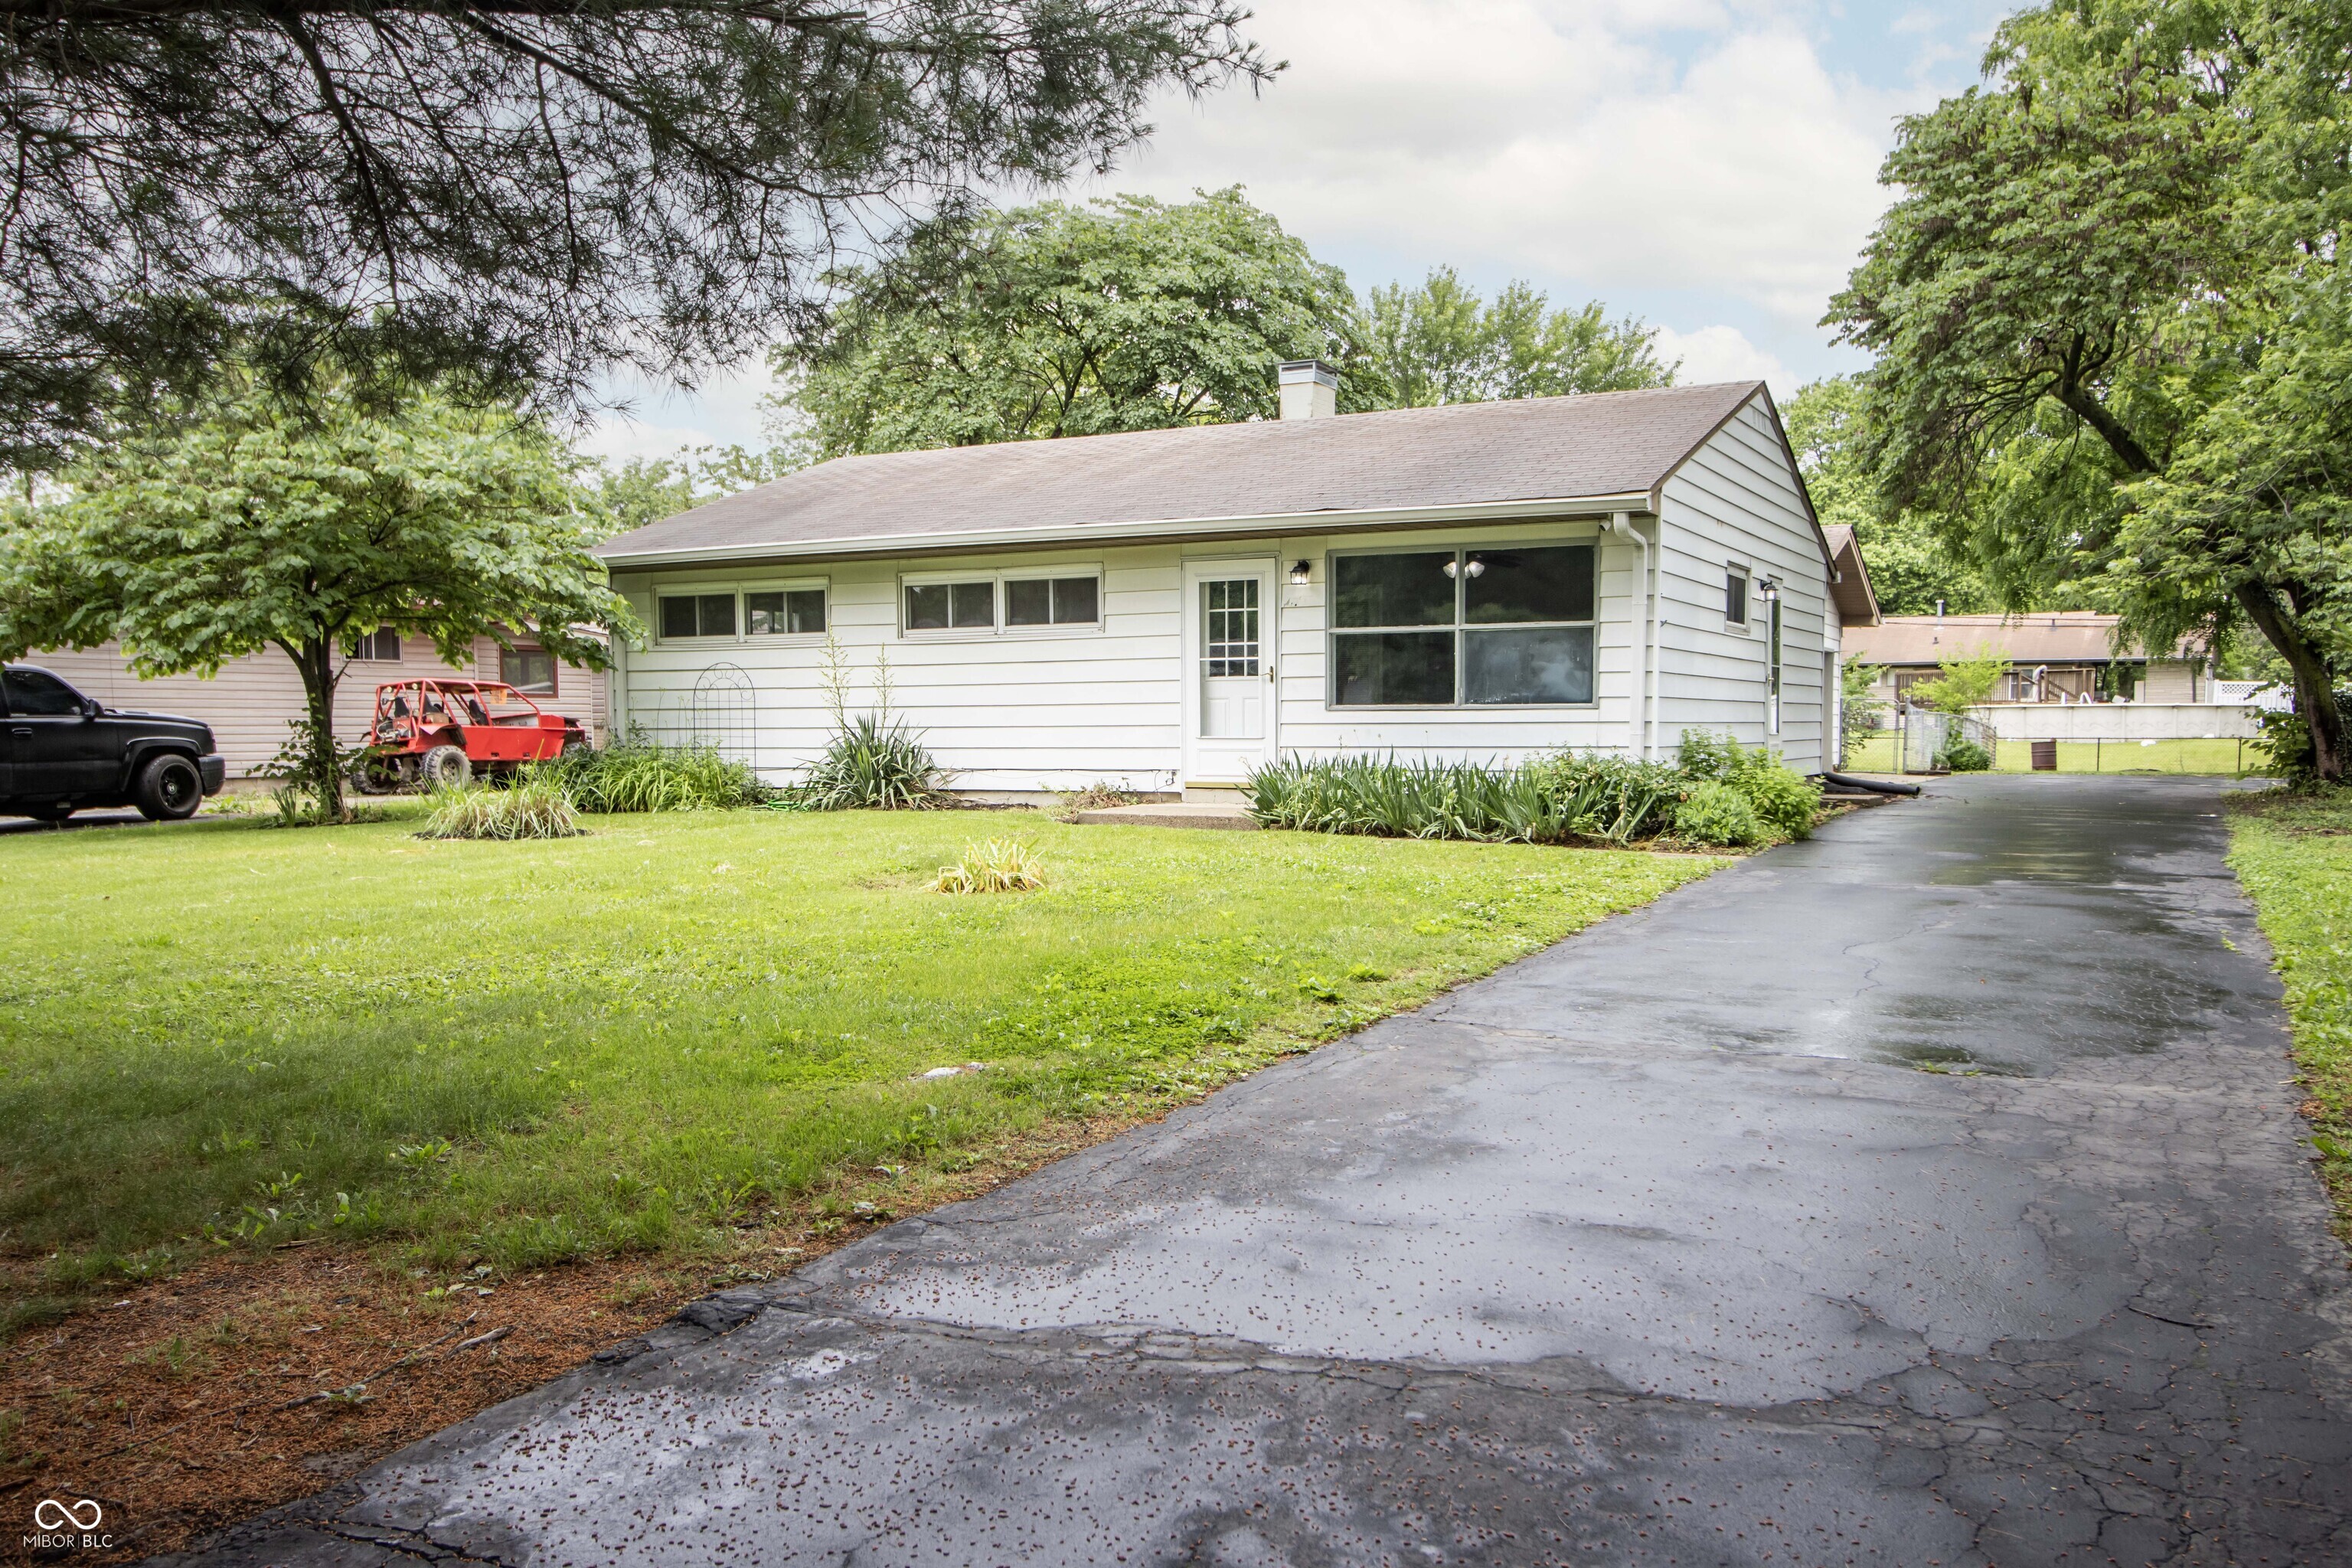
Pending
$185,000
3
bds
|
2
ba
|
1,091
sqft
|
built
1957
4020 Alden Ave, Indianapolis, IN 46221
$18
Cash flow
0.5%
Cash-on-Cash Return
6.3%
Cap rate
0.8%
Rent to Value Ratio
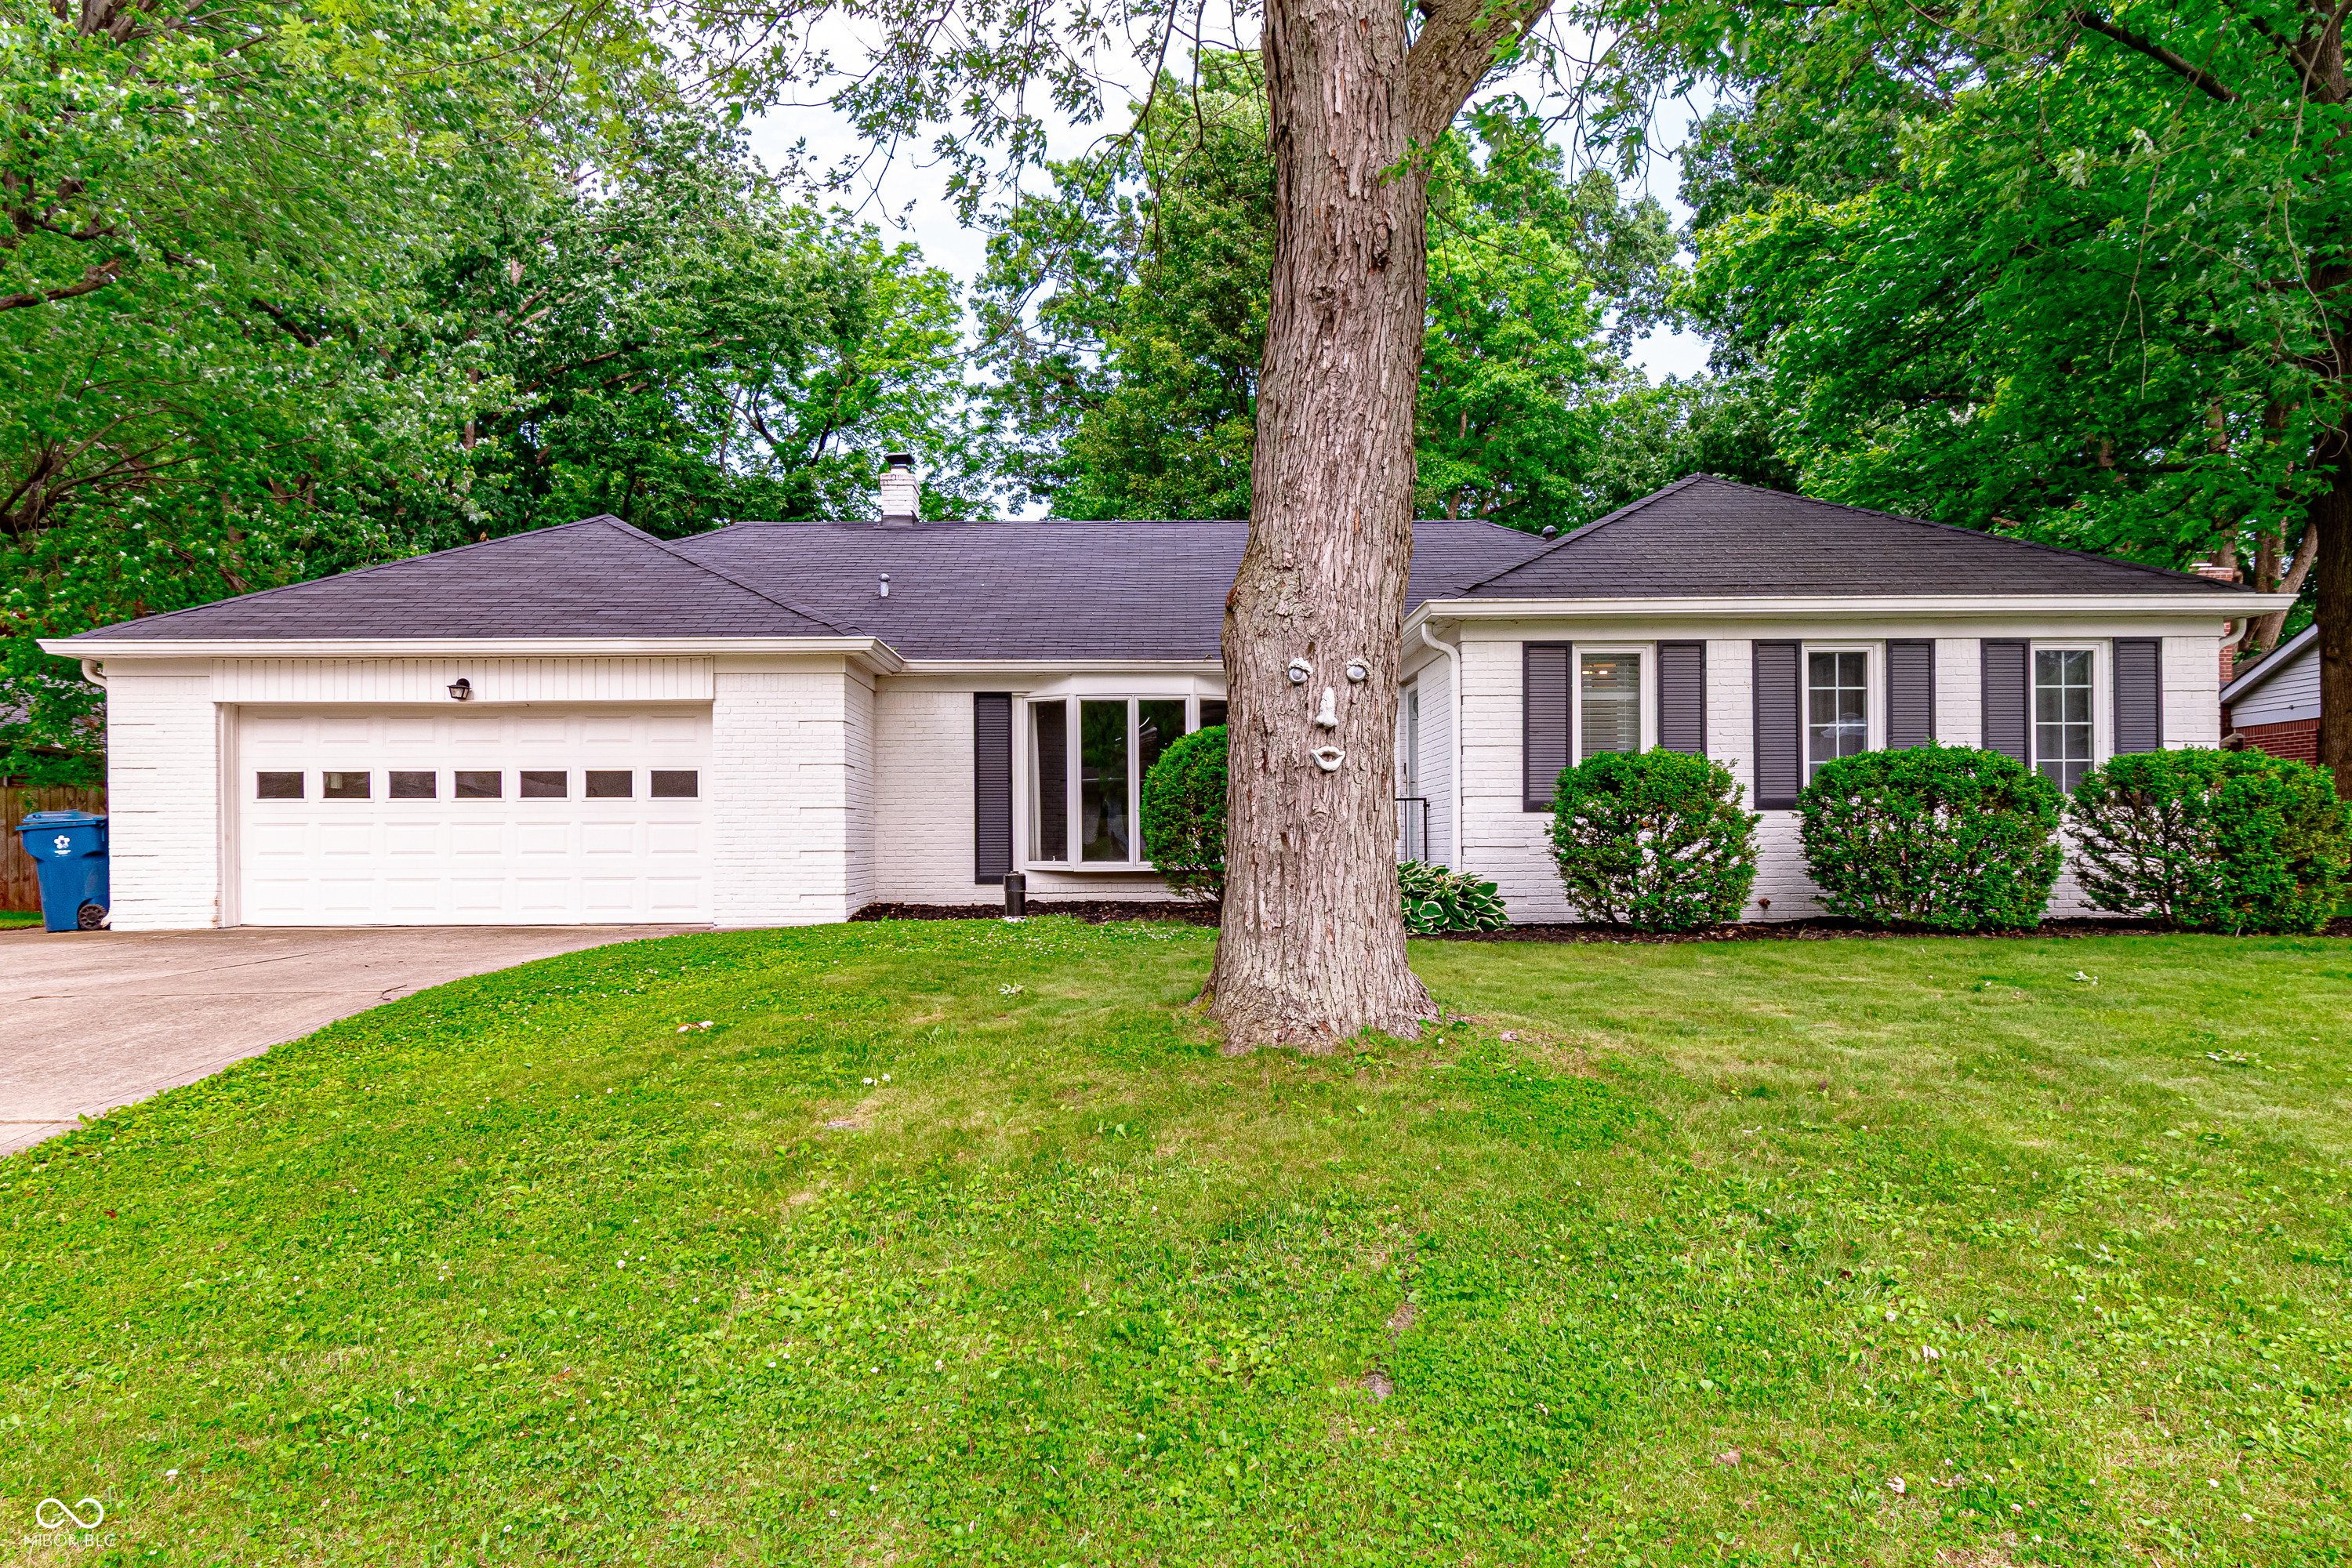
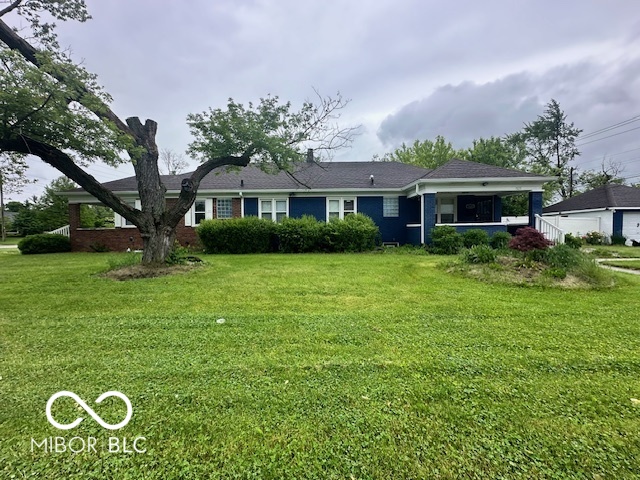
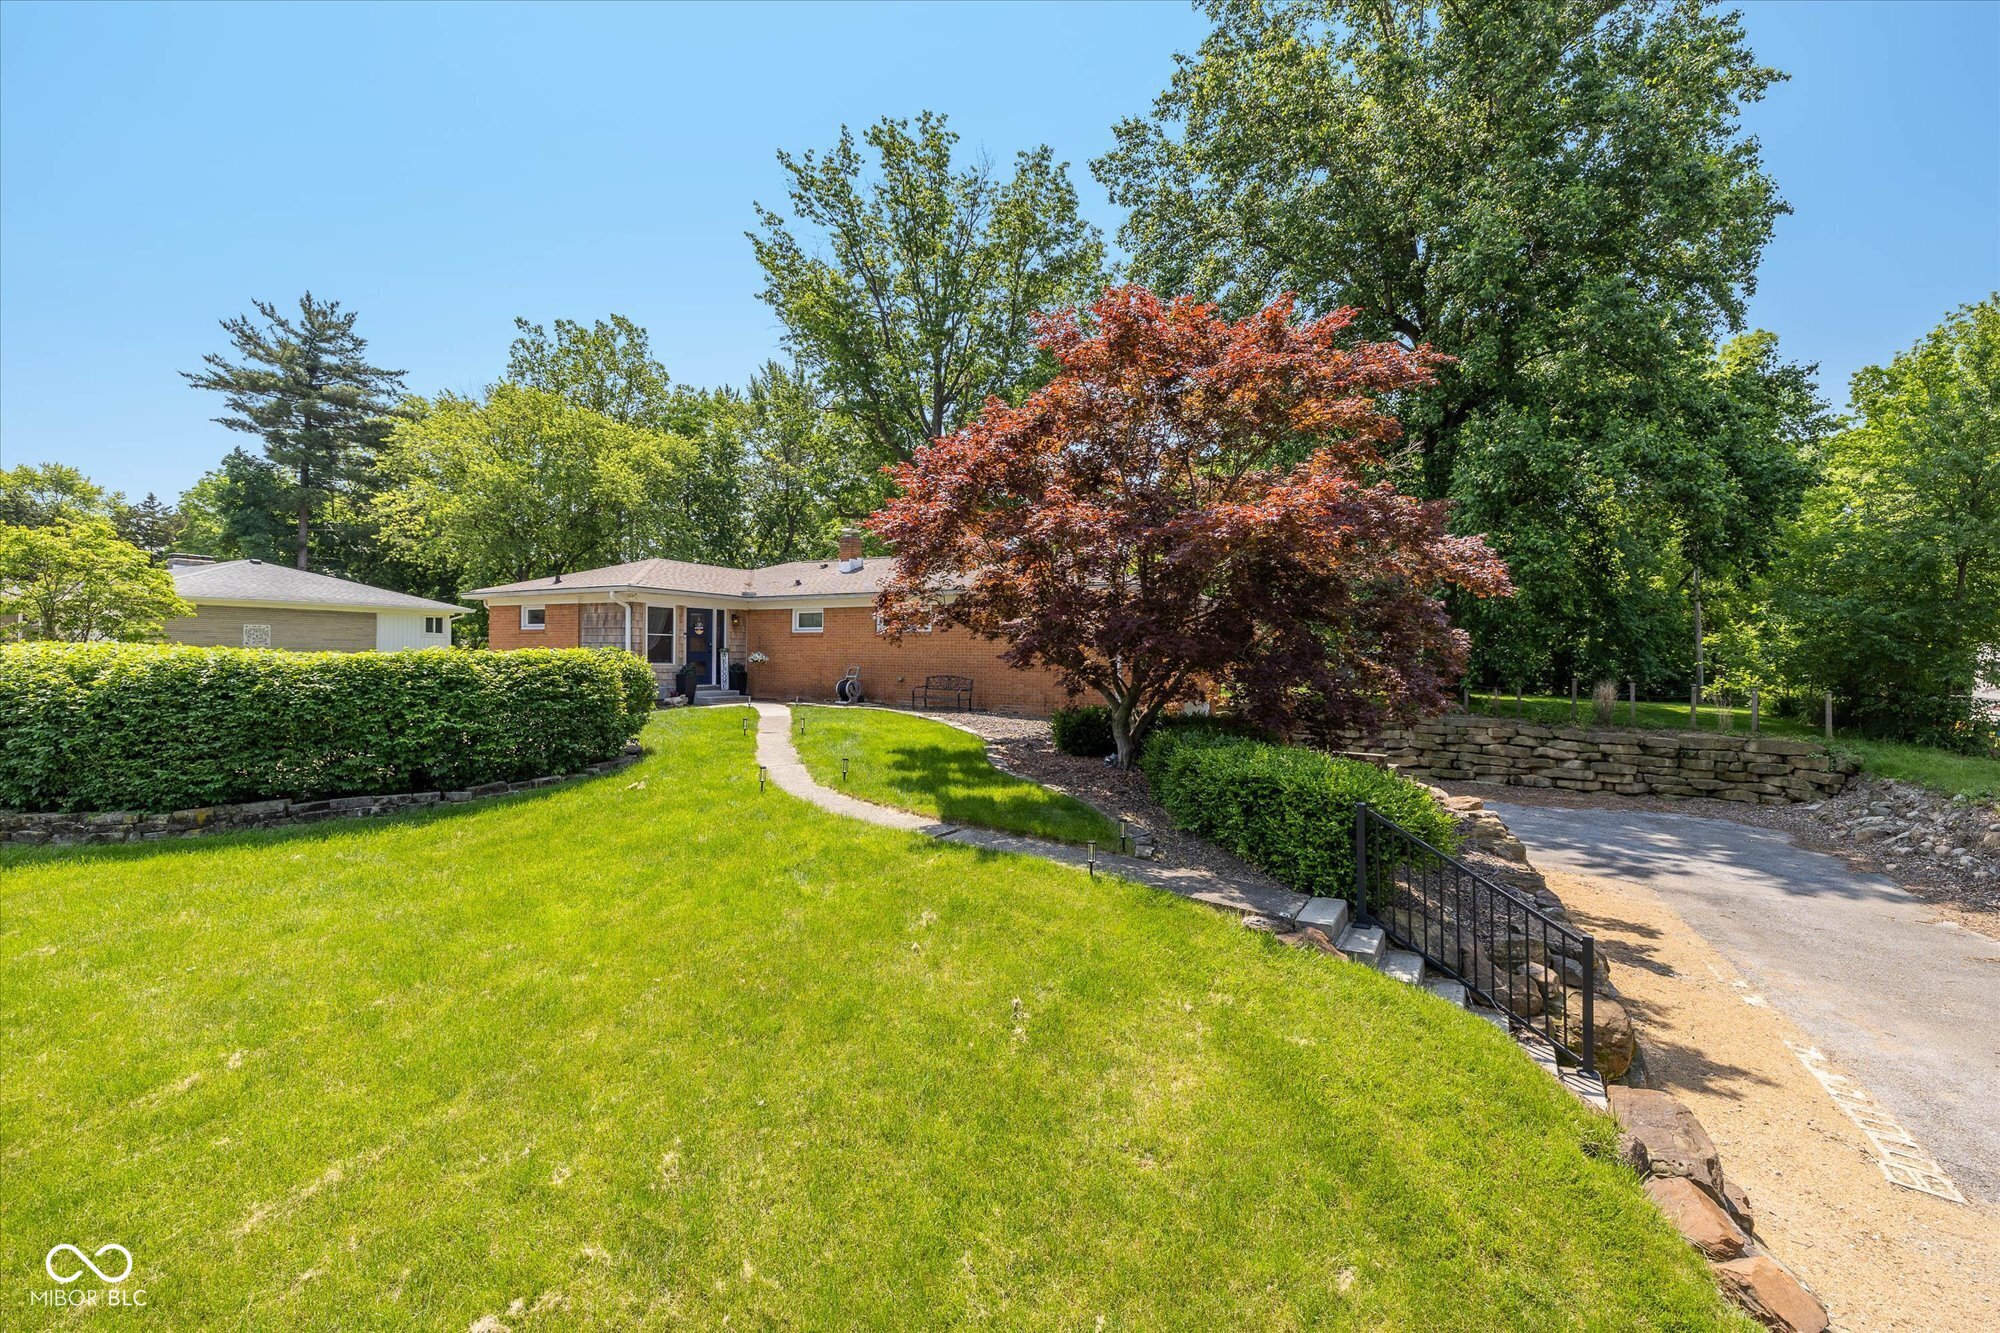
Active
$299,900
3
bds
|
2
ba
|
2,097
sqft
|
built
1965
535 Radburn Dr, Indianapolis, IN 46214
$-156
Cash flow
-2.7%
Cash-on-Cash Return
5.5%
Cap rate
0.7%
Rent to Value Ratio
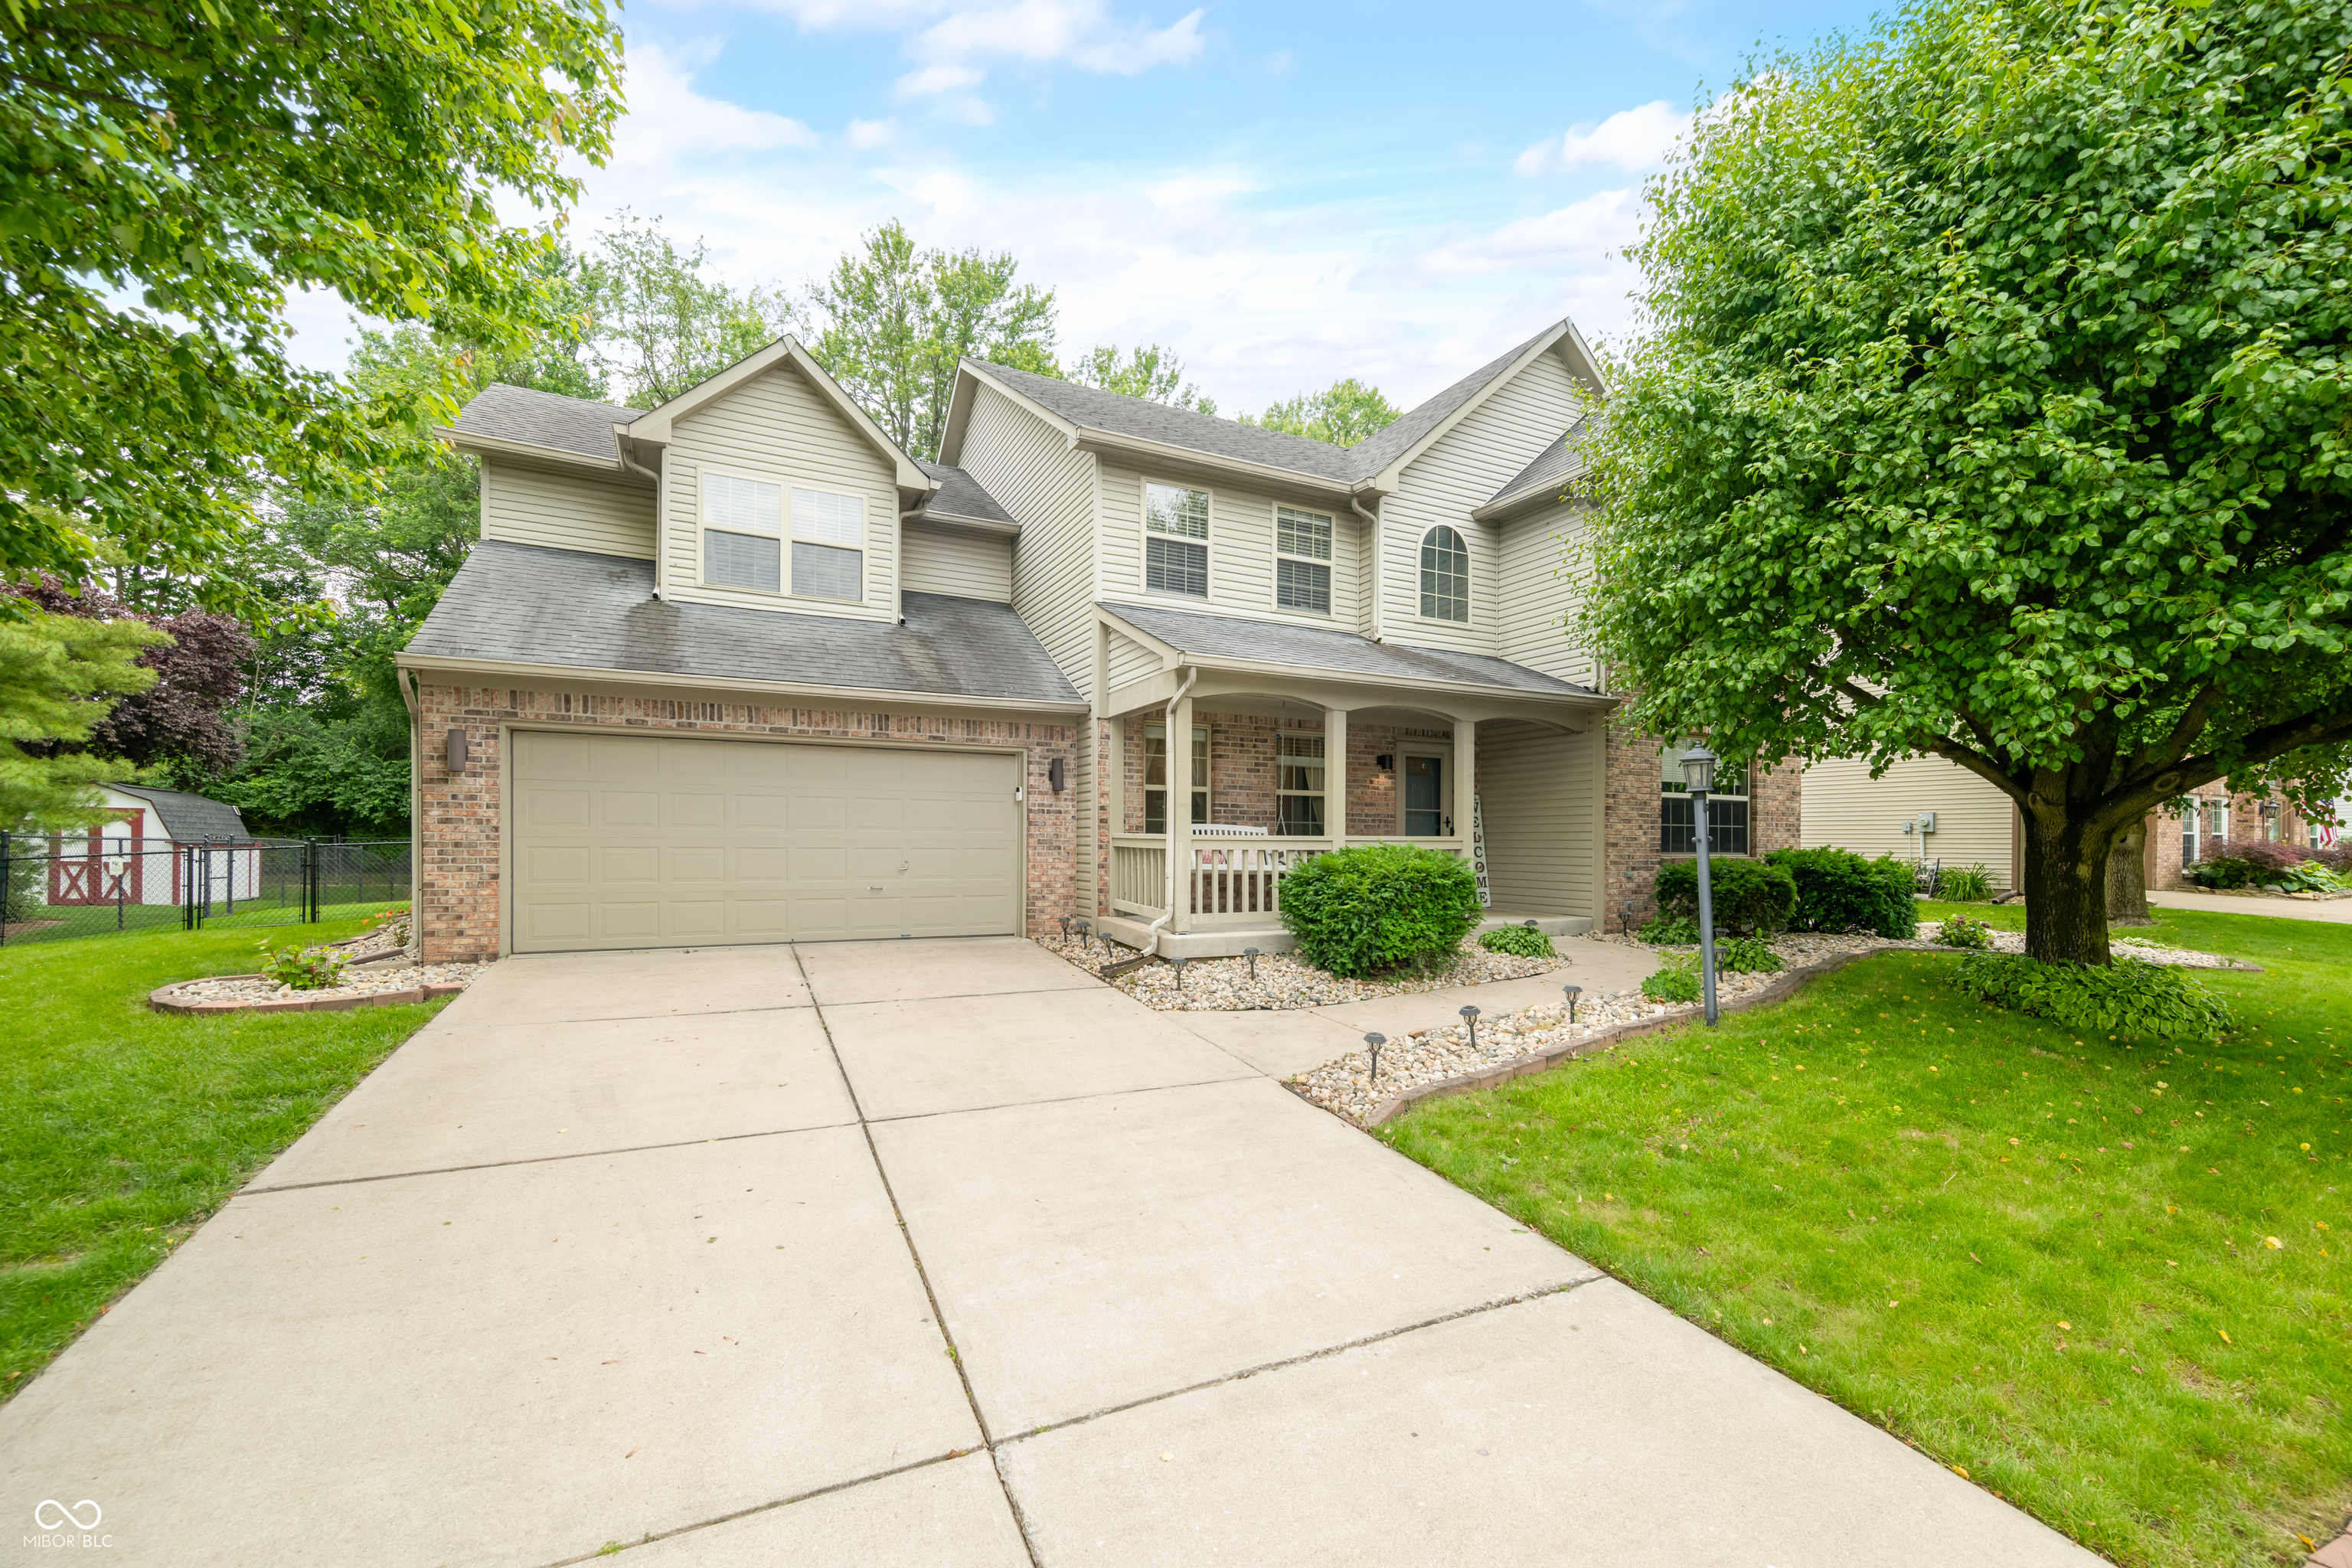
Pending
$385,000
3
bds
|
3
ba
|
2,625
sqft
|
built
1997
7833 Meadow Bend Dr, Indianapolis, IN 46259
$-202
Cash flow
-2.7%
Cash-on-Cash Return
5.5%
Cap rate
0.7%
Rent to Value Ratio
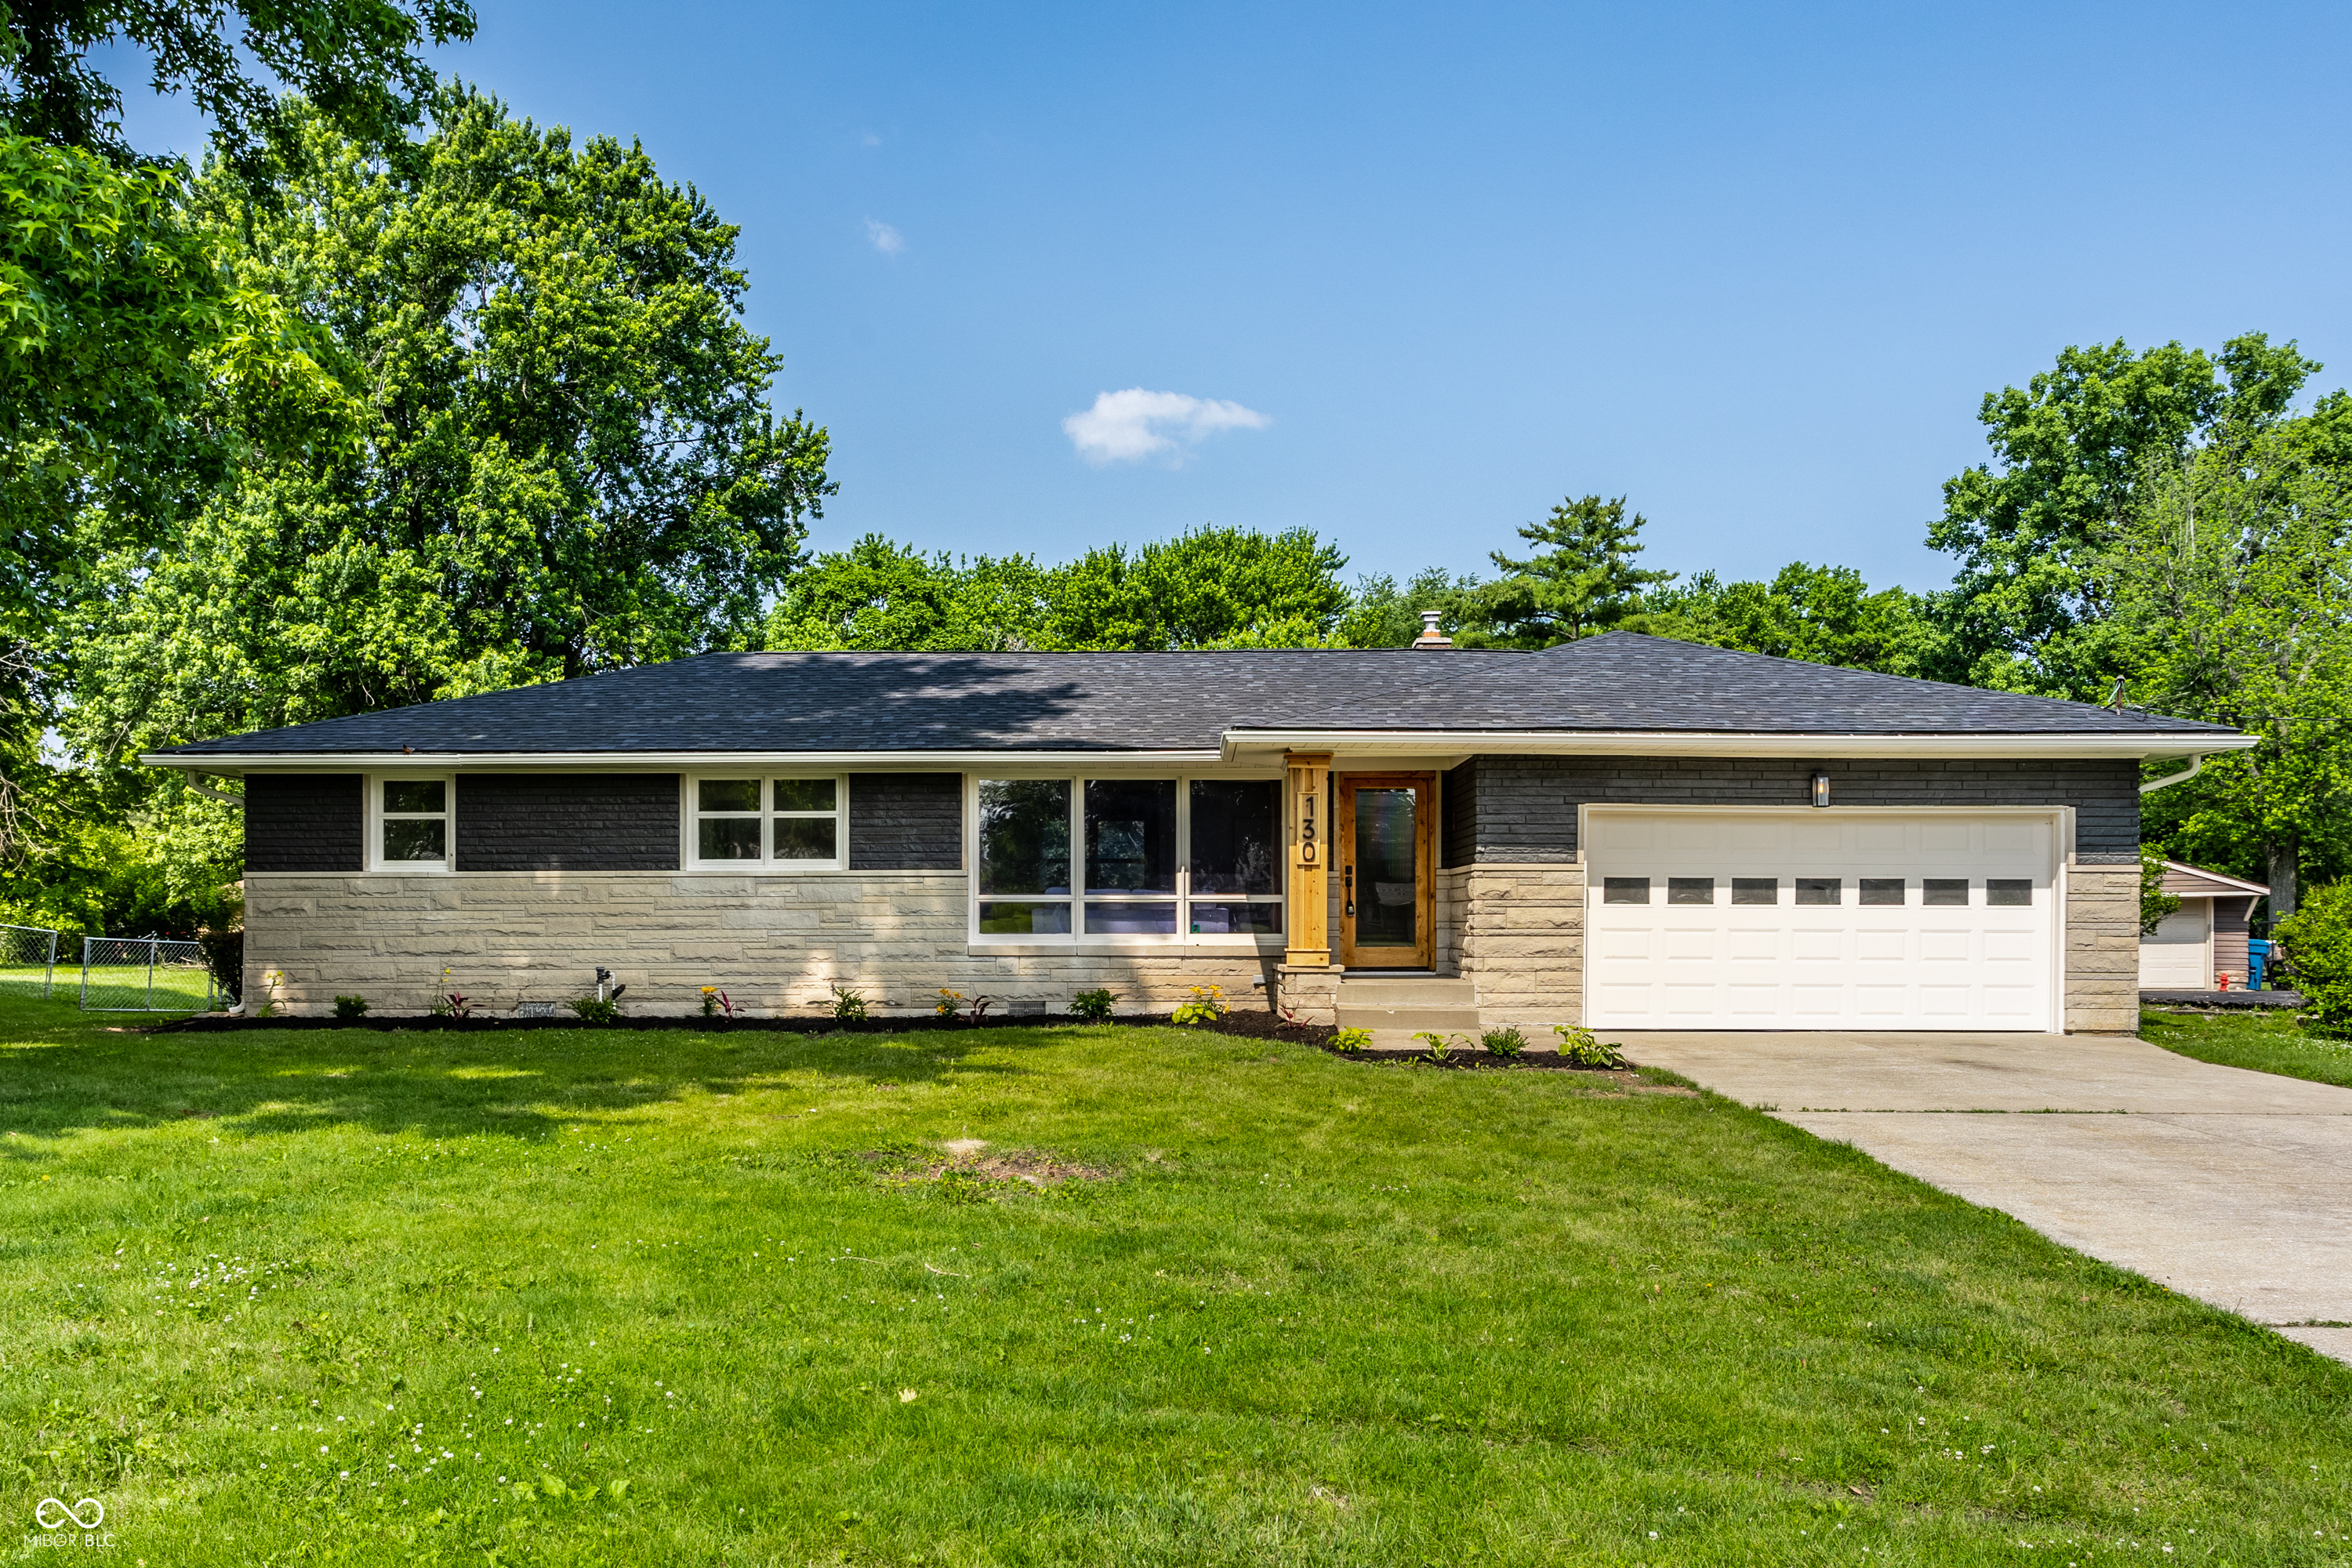
Active
$289,900
3
bds
|
2
ba
|
1,344
sqft
|
built
1959
130 N High School Rd, Indianapolis, IN 46214
$-243
Cash flow
-4.4%
Cash-on-Cash Return
5.1%
Cap rate
0.6%
Rent to Value Ratio
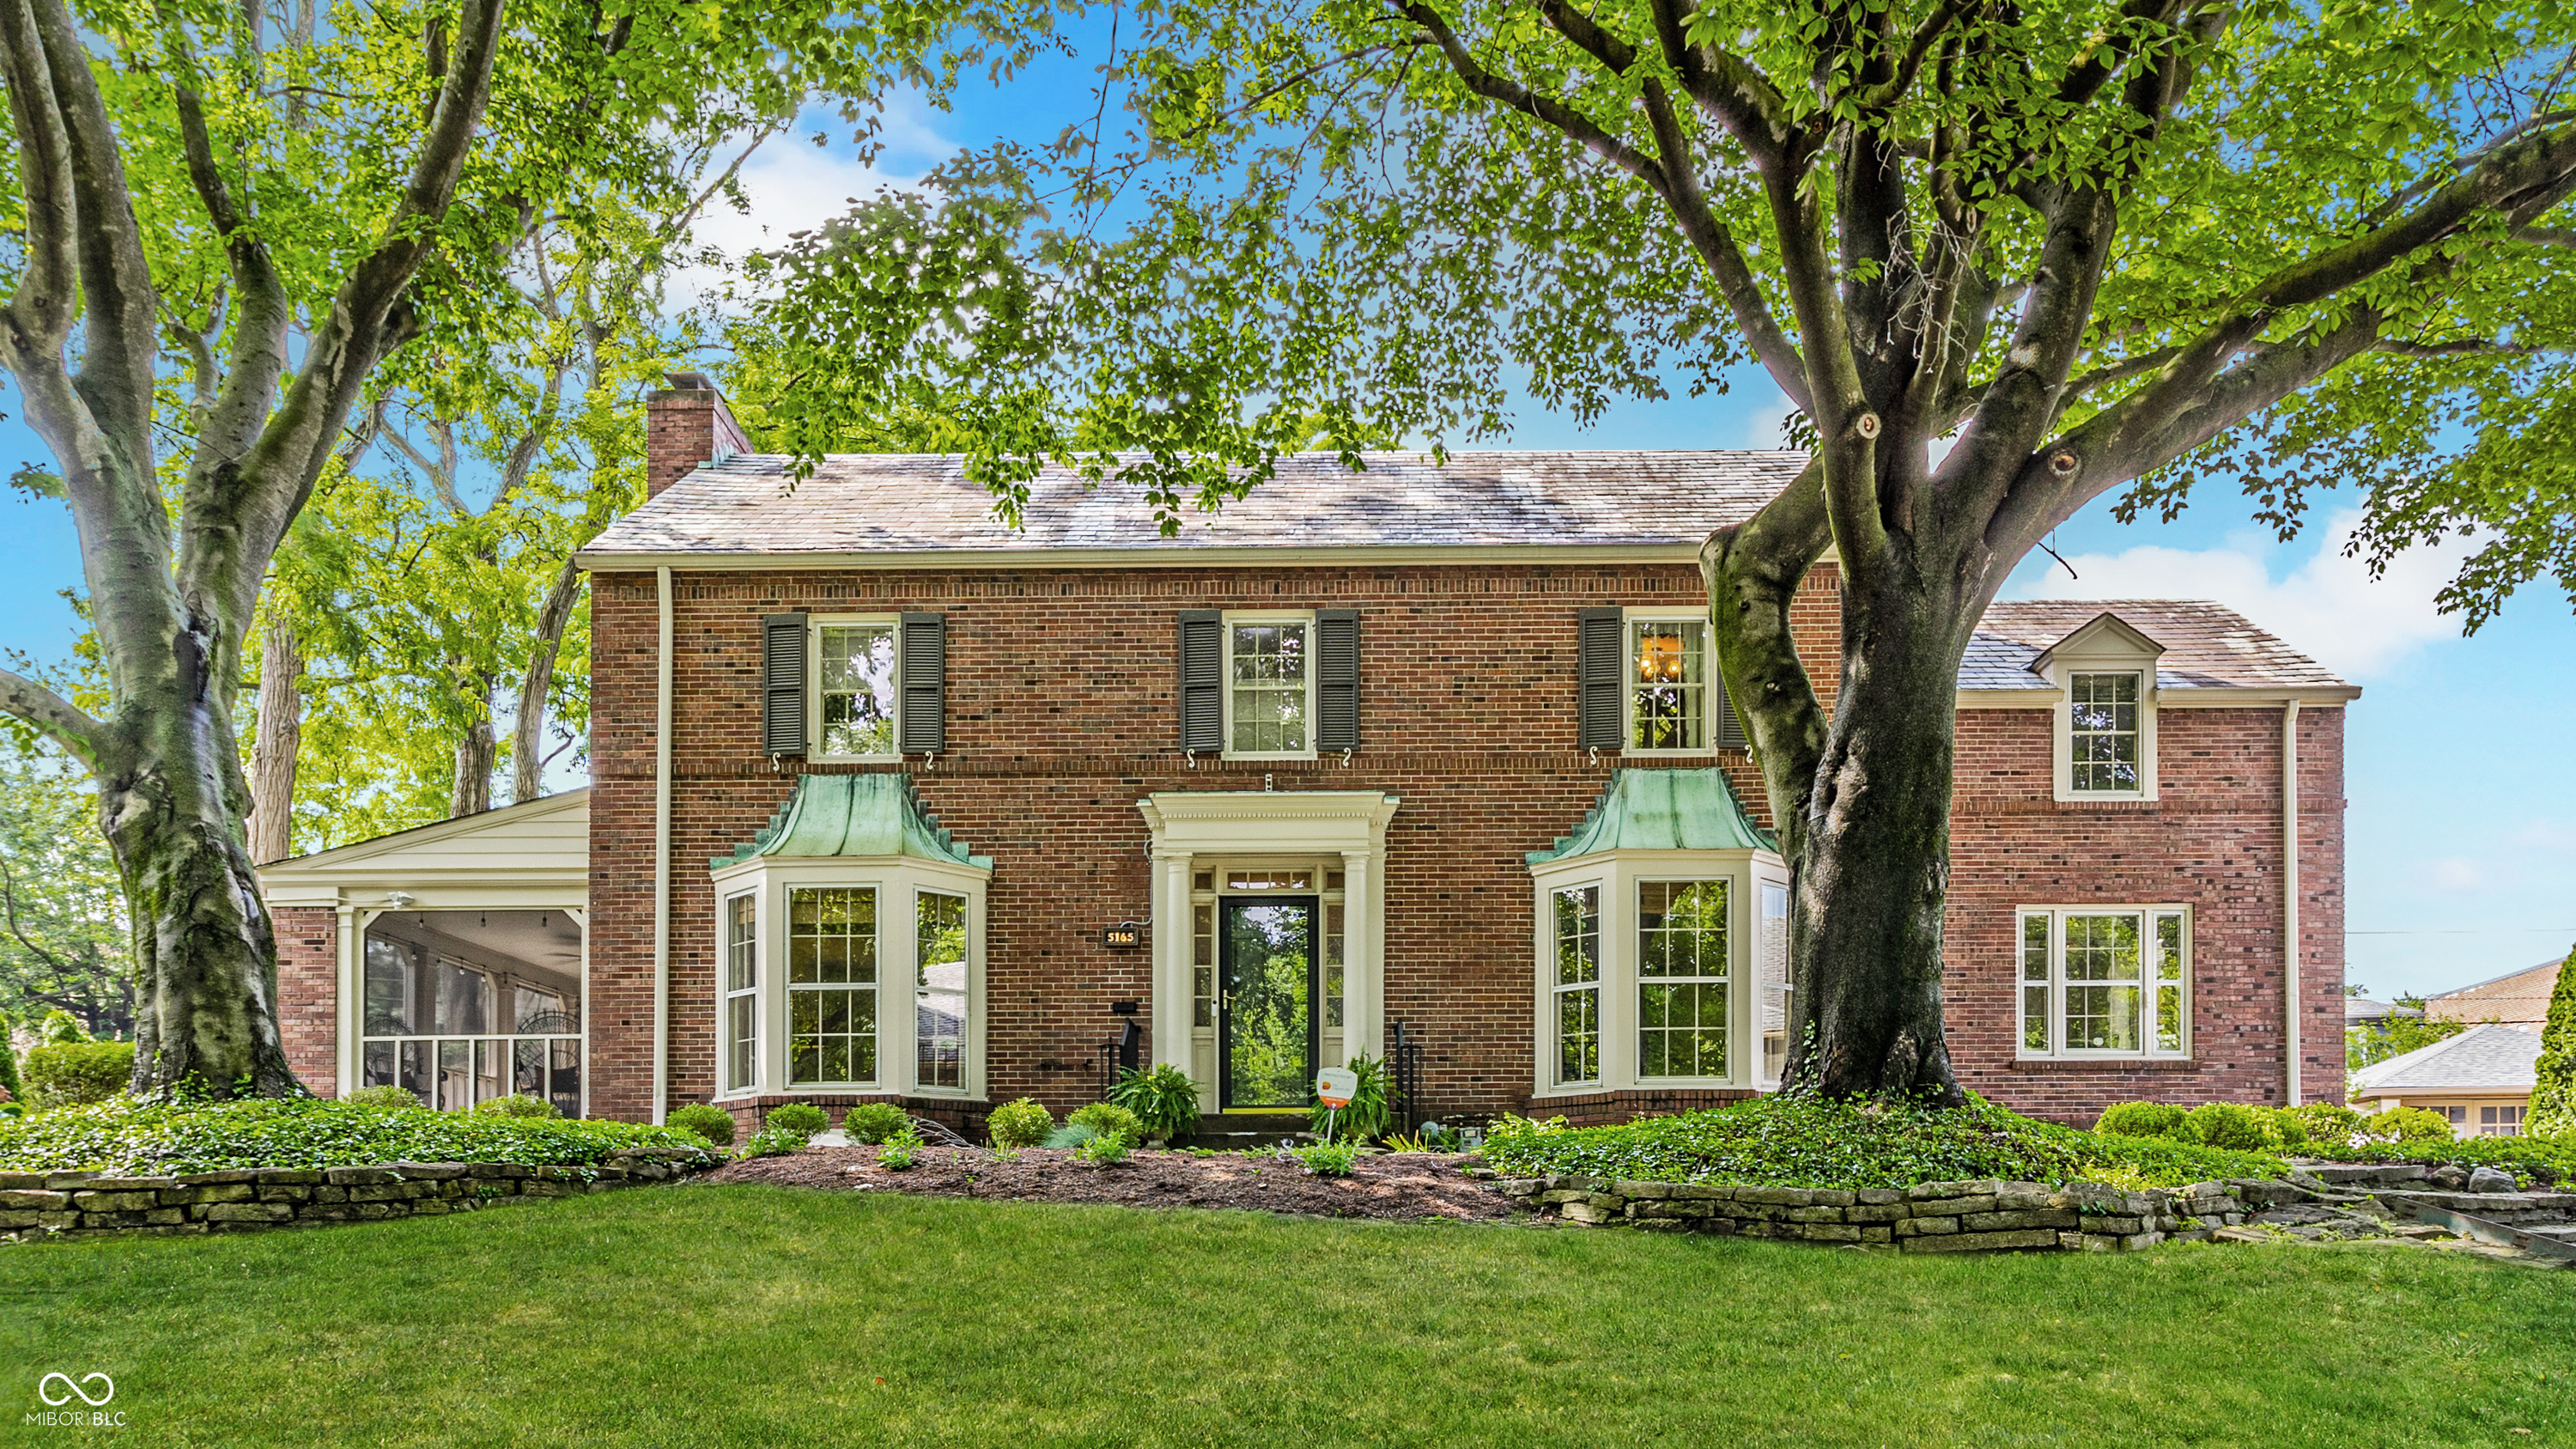
Pending
$525,000
5
bds
|
4
ba
|
4,283
sqft
|
built
1934
5165 E Pleasant Run Parkway South Dr, Indianapolis, IN 46219
$-481
Cash flow
-4.8%
Cash-on-Cash Return
5.0%
Cap rate
0.6%
Rent to Value Ratio
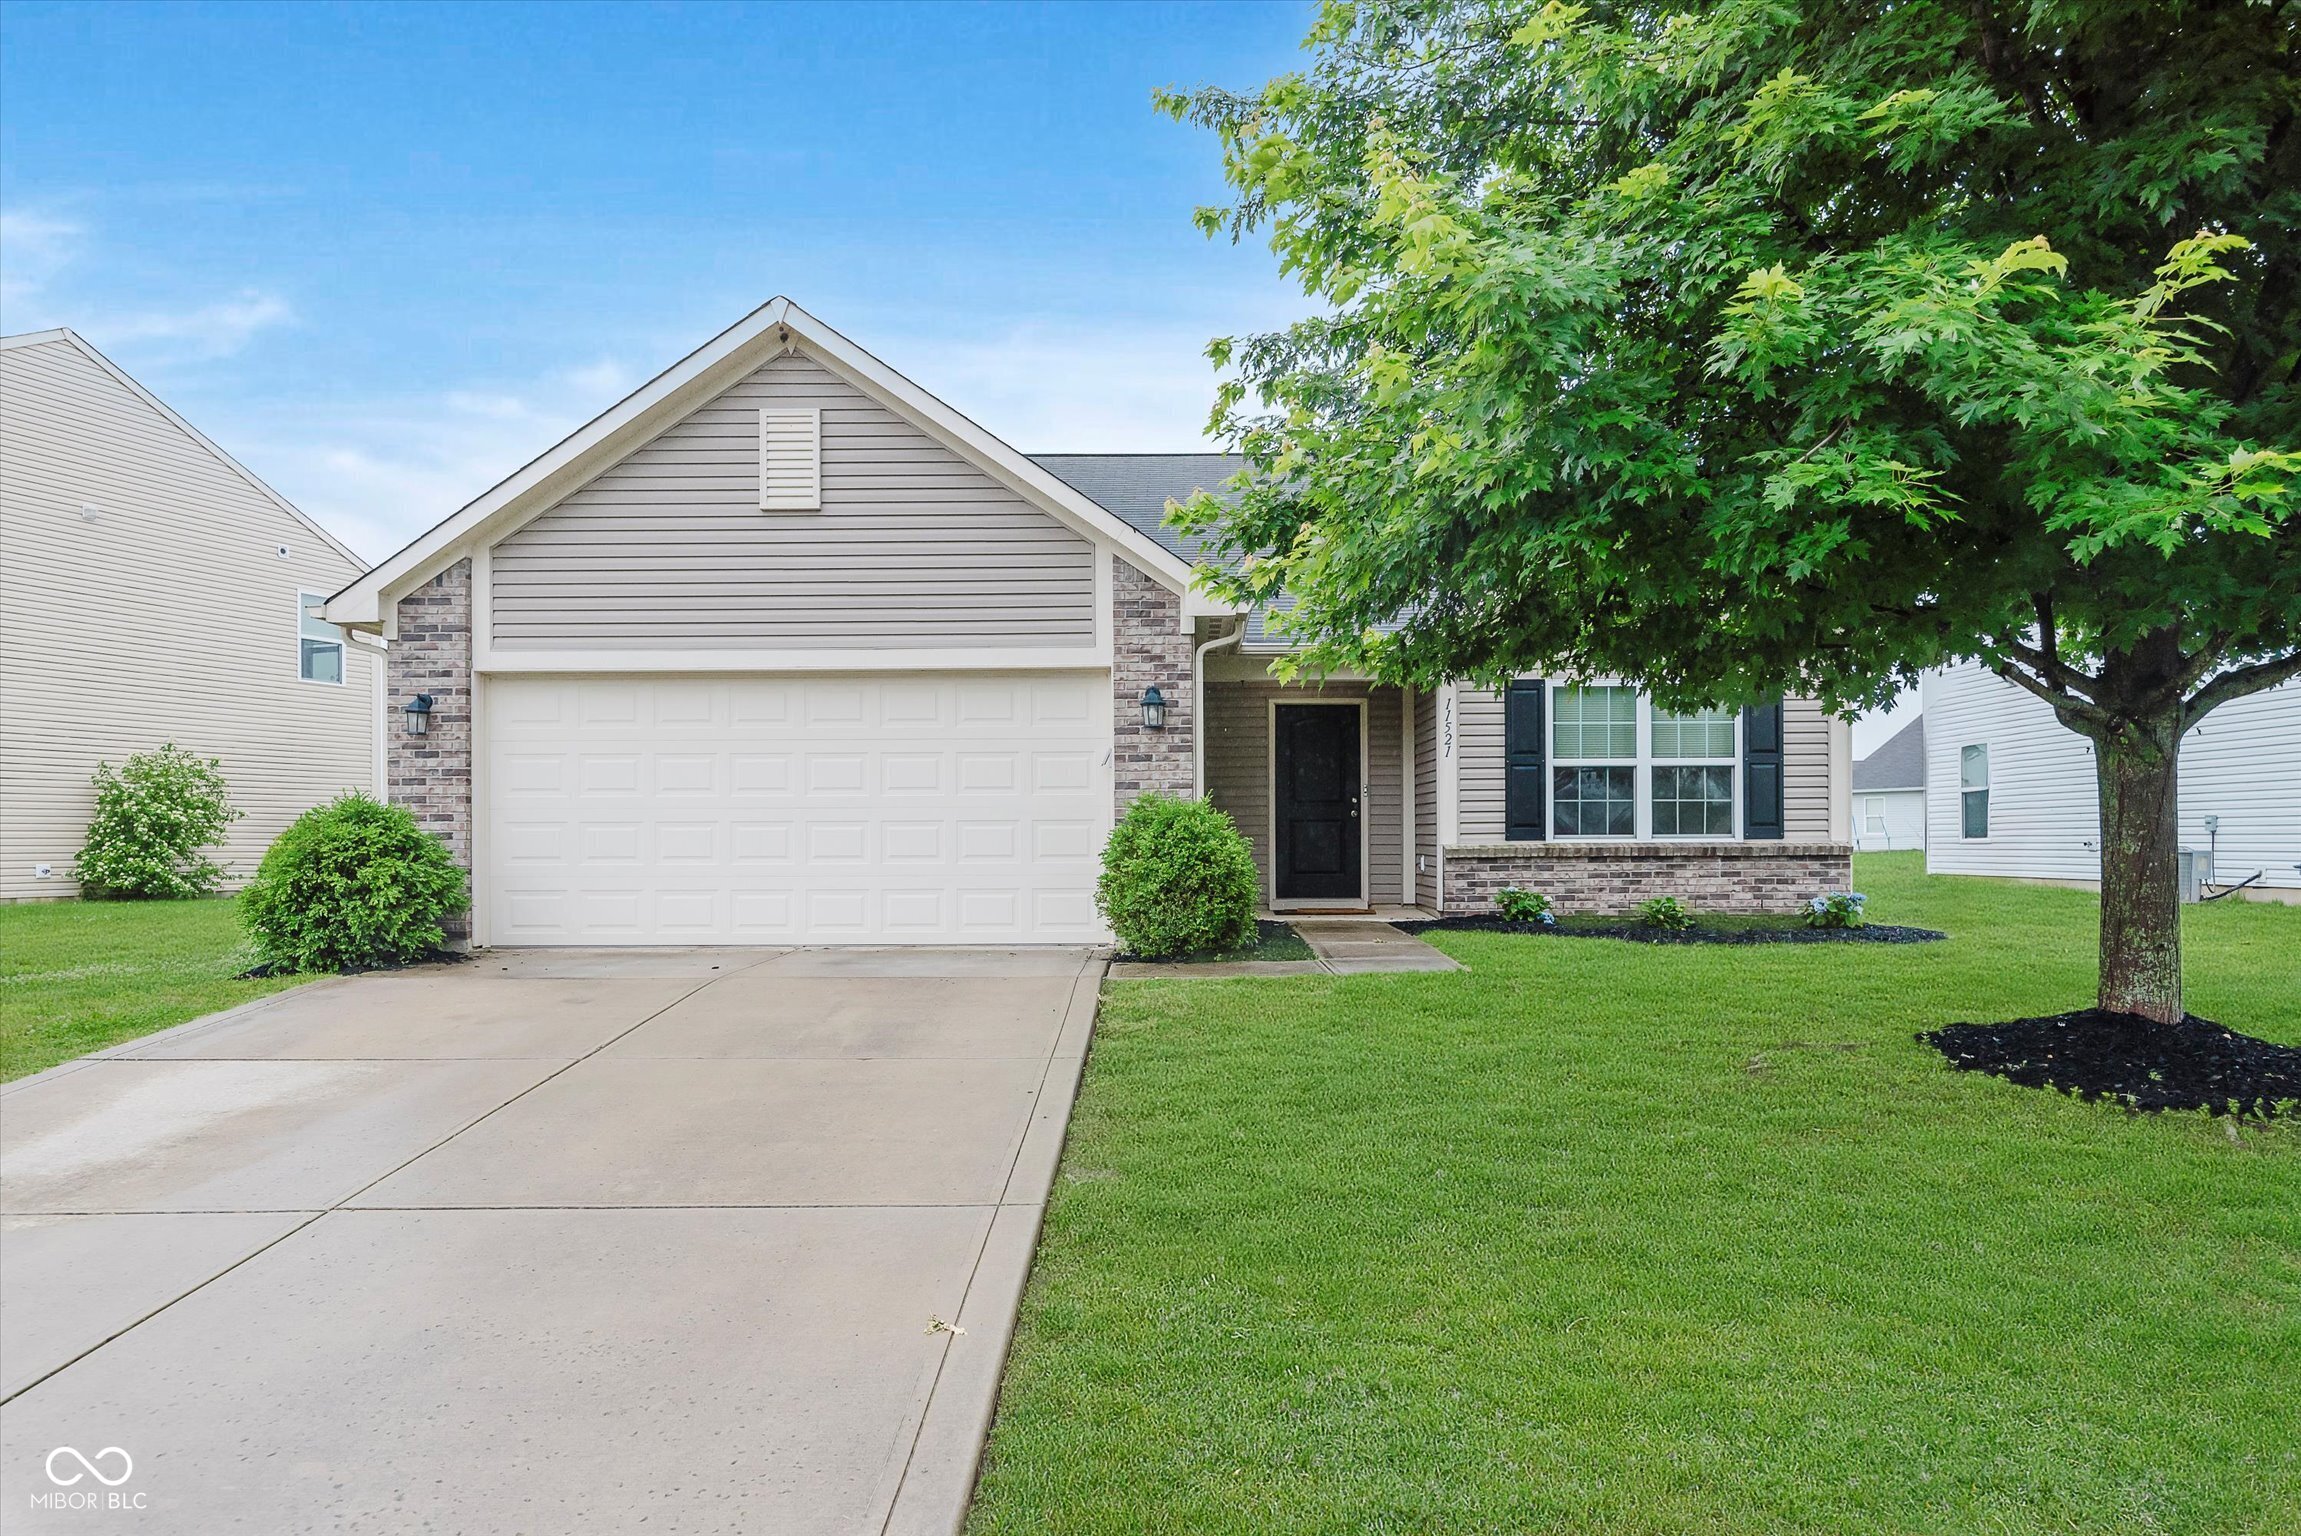
Pending
$259,500
3
bds
|
2
ba
|
1,585
sqft
|
built
2012
11521 Short Iron Ln, Indianapolis, IN 46235
$22
Cash flow
0.4%
Cash-on-Cash Return
6.2%
Cap rate
0.8%
Rent to Value Ratio
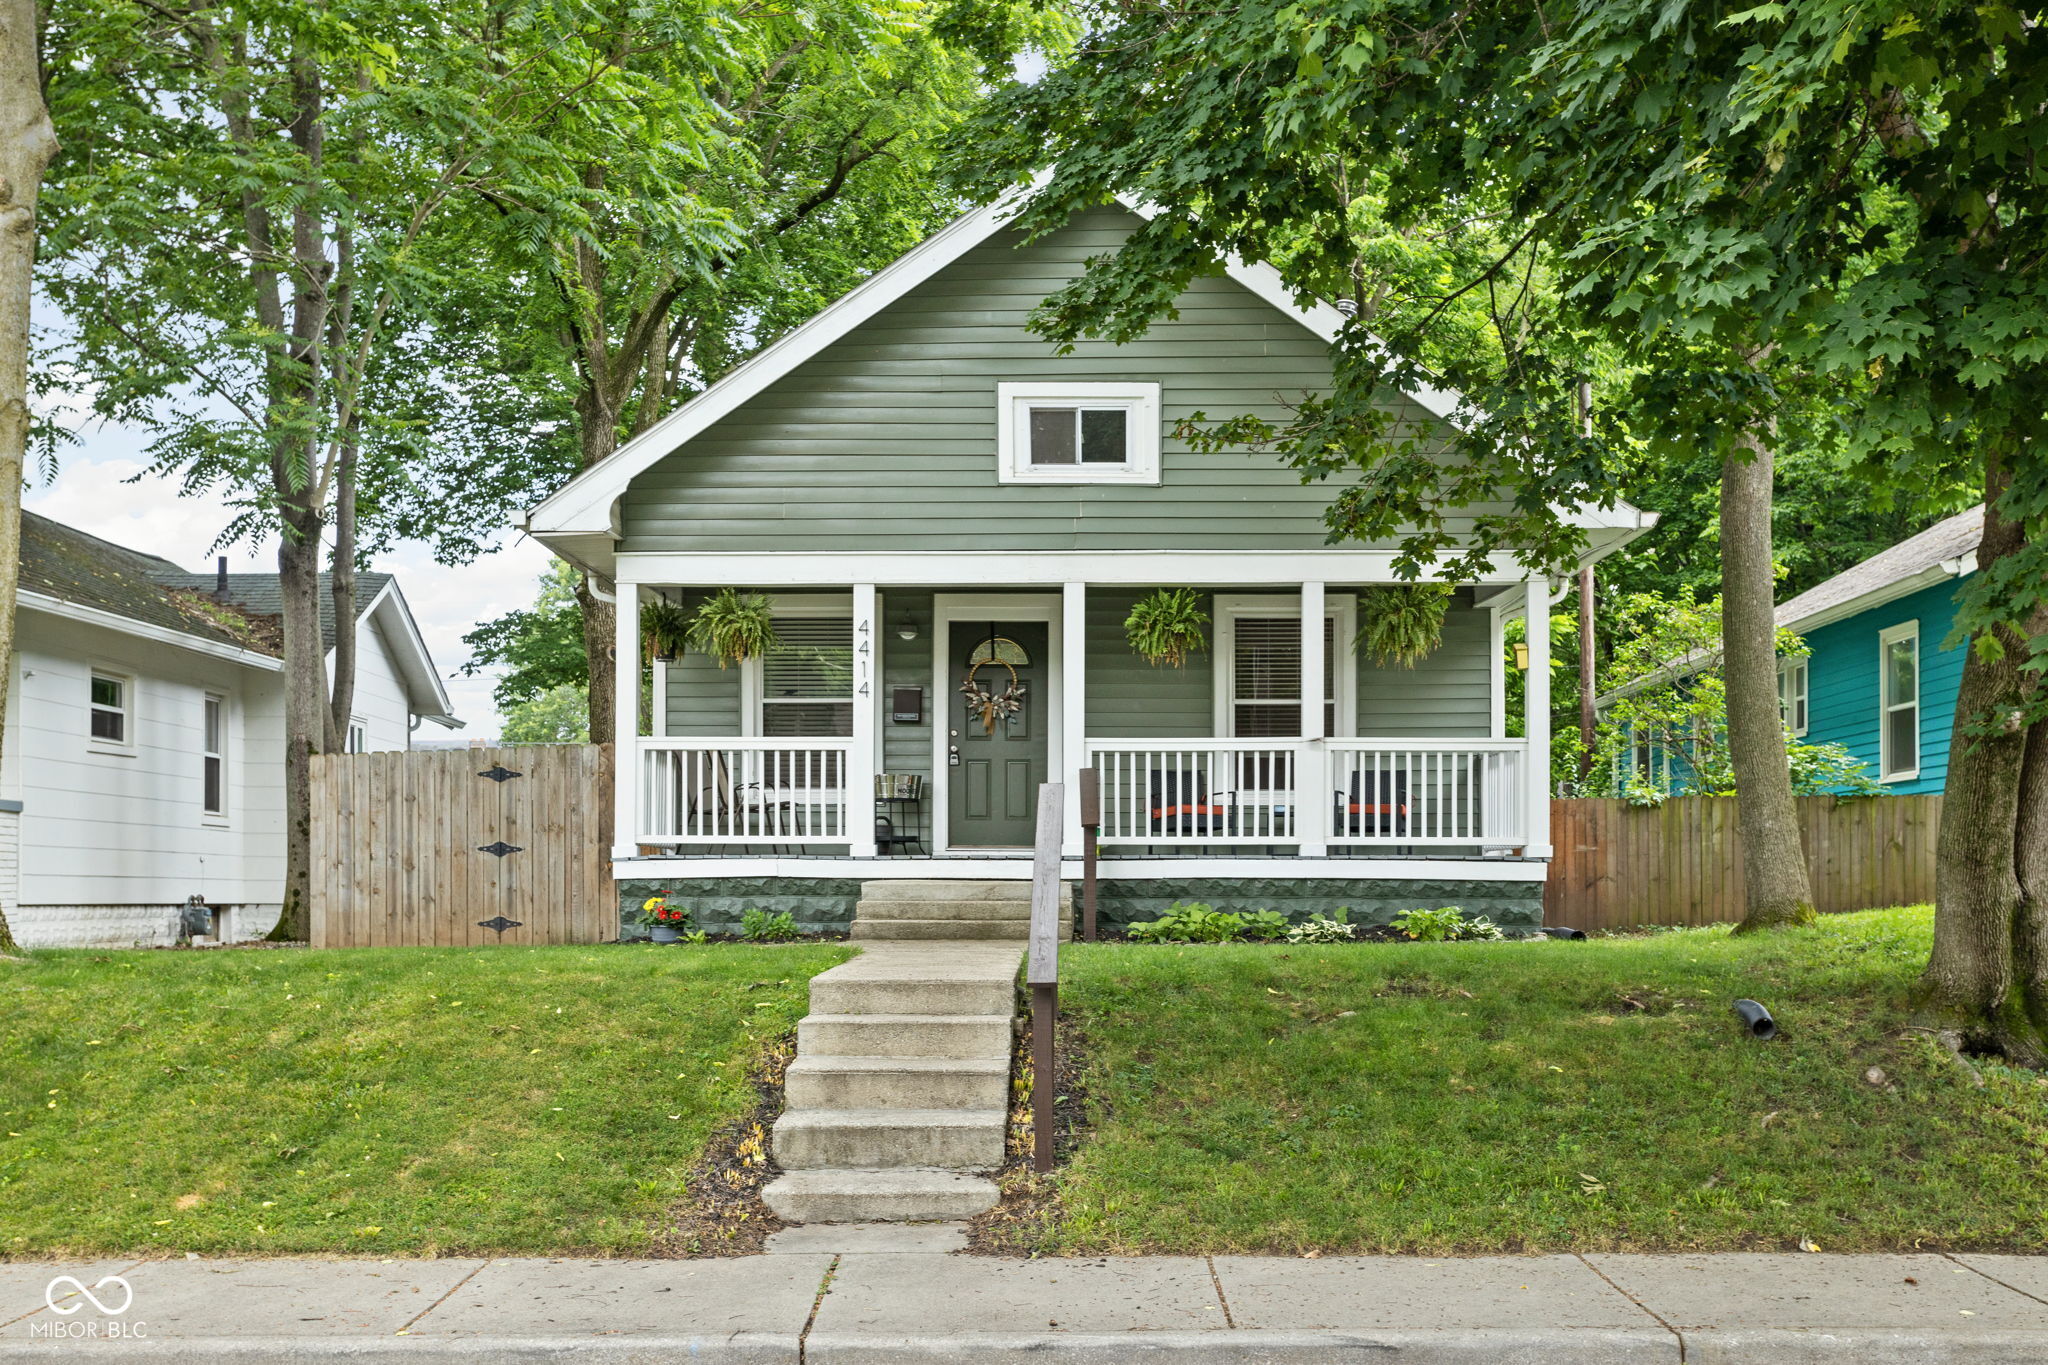
Pending
$279,900
2
bds
|
1
ba
|
1,090
sqft
|
built
1917
4414 Winthrop Ave, Indianapolis, IN 46205
$291
Cash flow
5.4%
Cash-on-Cash Return
7.4%
Cap rate
0.9%
Rent to Value Ratio
Active
$144,900
2
bds
|
1
ba
|
616
sqft
|
built
1938
4715 Normal Ave, Indianapolis, IN 46226
$17
Cash flow
0.6%
Cash-on-Cash Return
6.3%
Cap rate
0.8%
Rent to Value Ratio
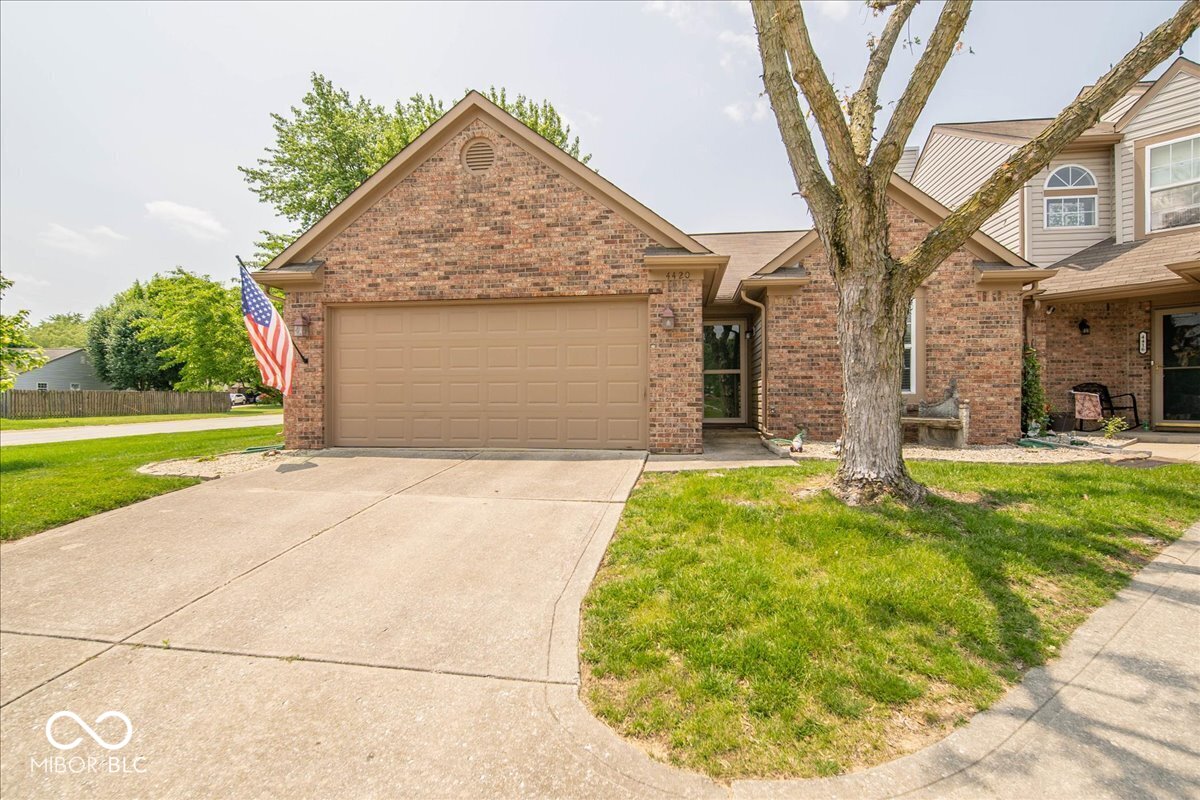
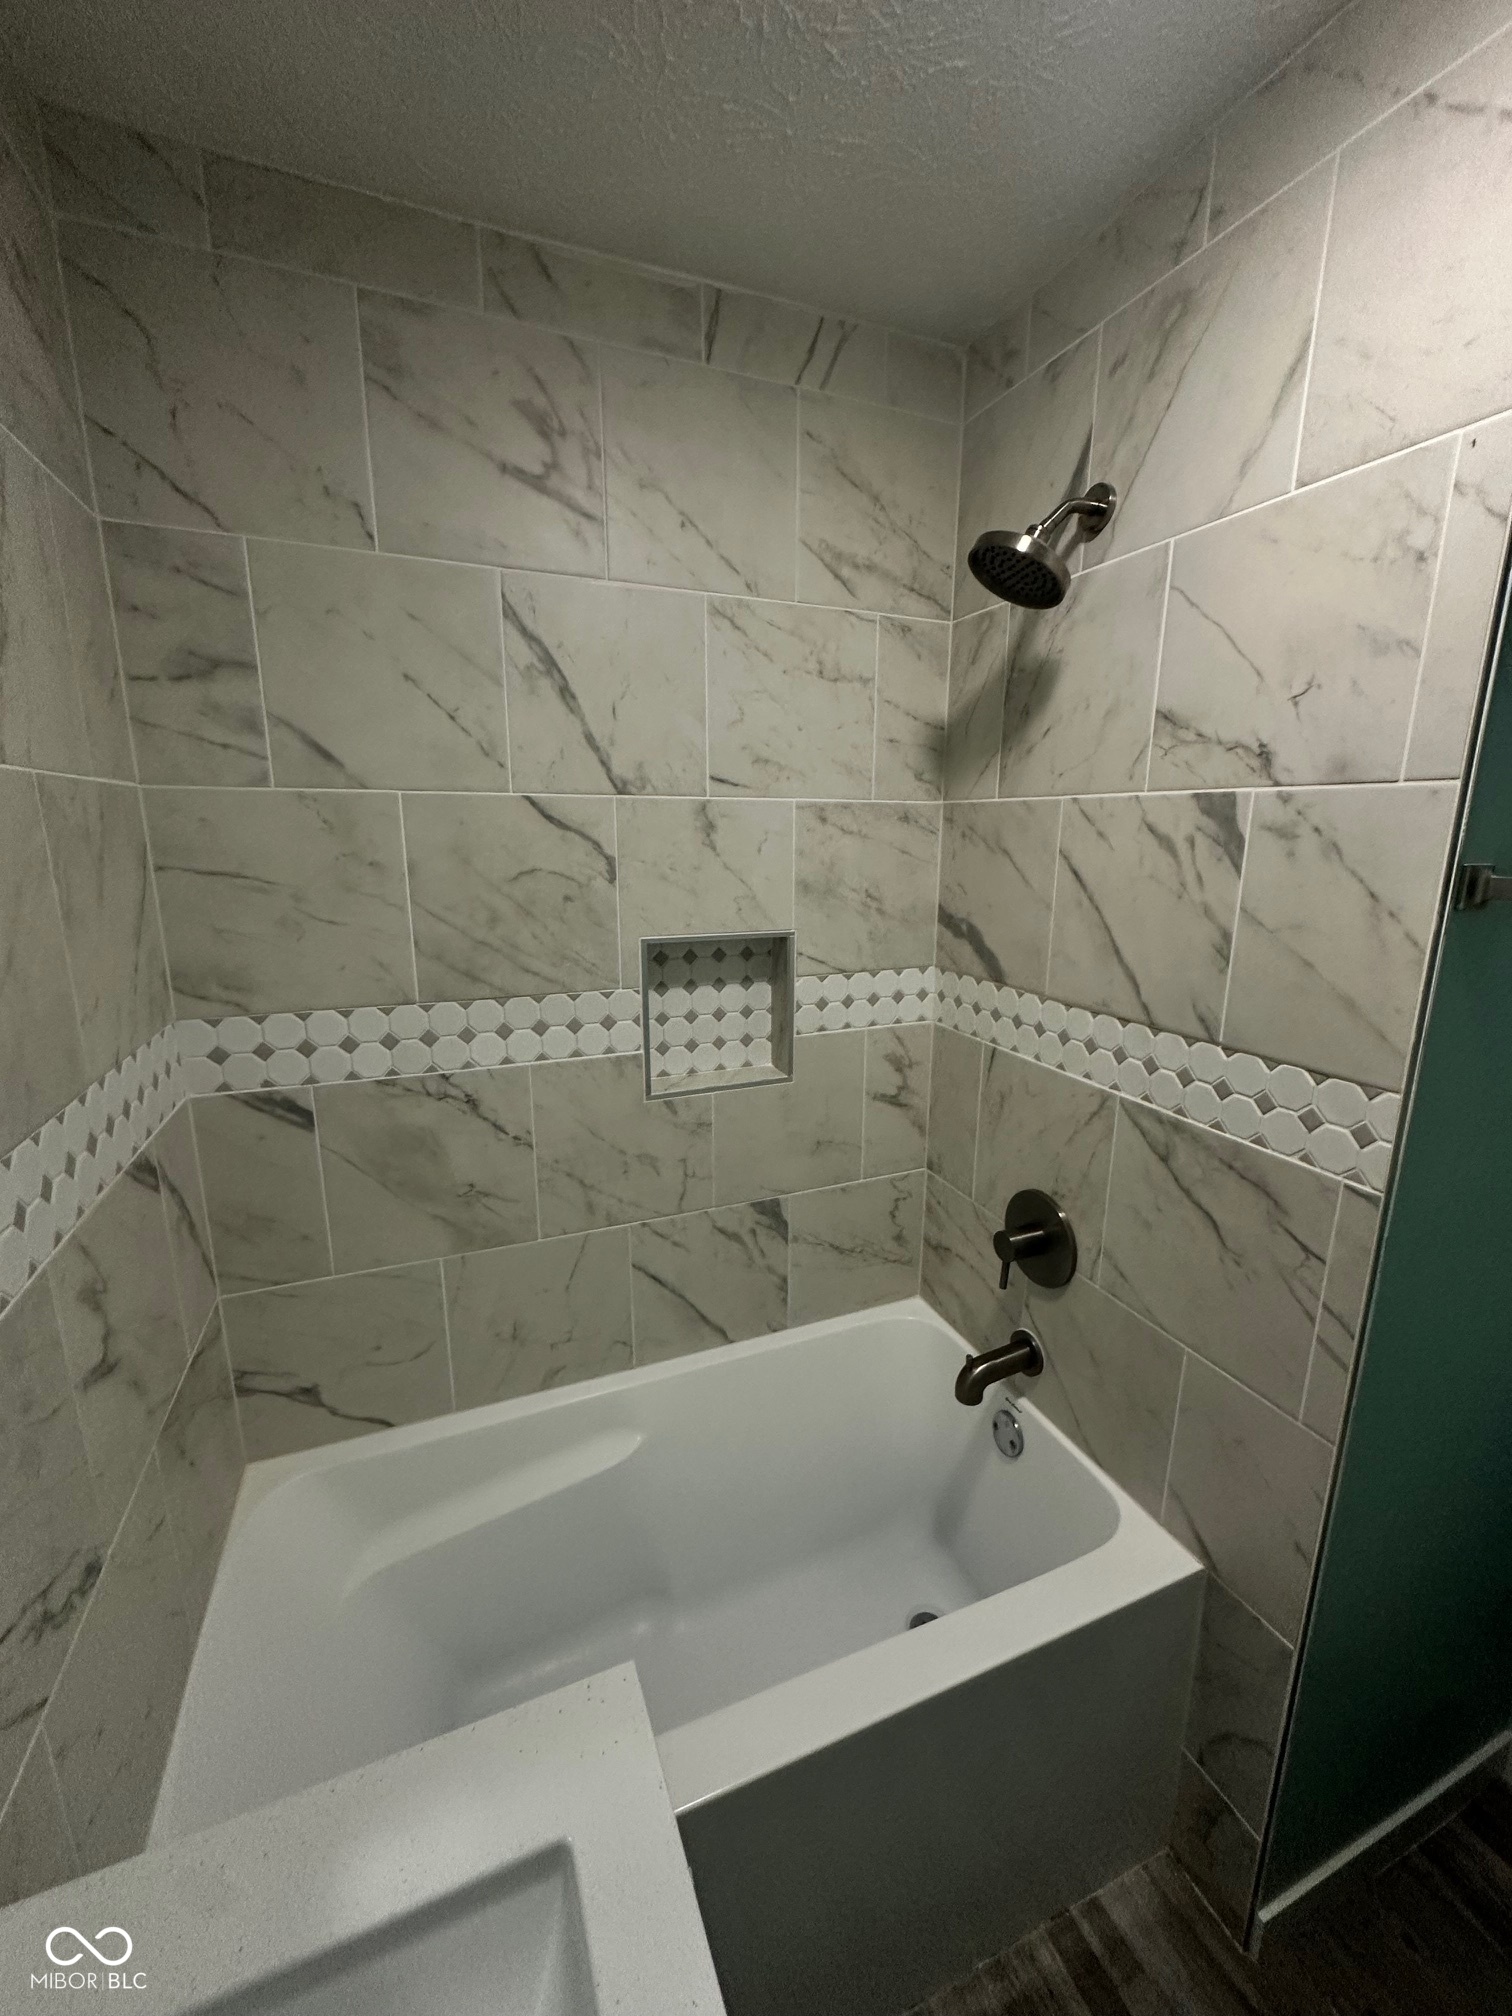
Active
$200,000
2
bds
|
2
ba
|
1,128
sqft
|
built
1995
4420 Victory Blvd, Indianapolis, IN 46203
$-208
Cash flow
-5.4%
Cash-on-Cash Return
4.9%
Cap rate
0.7%
Rent to Value Ratio
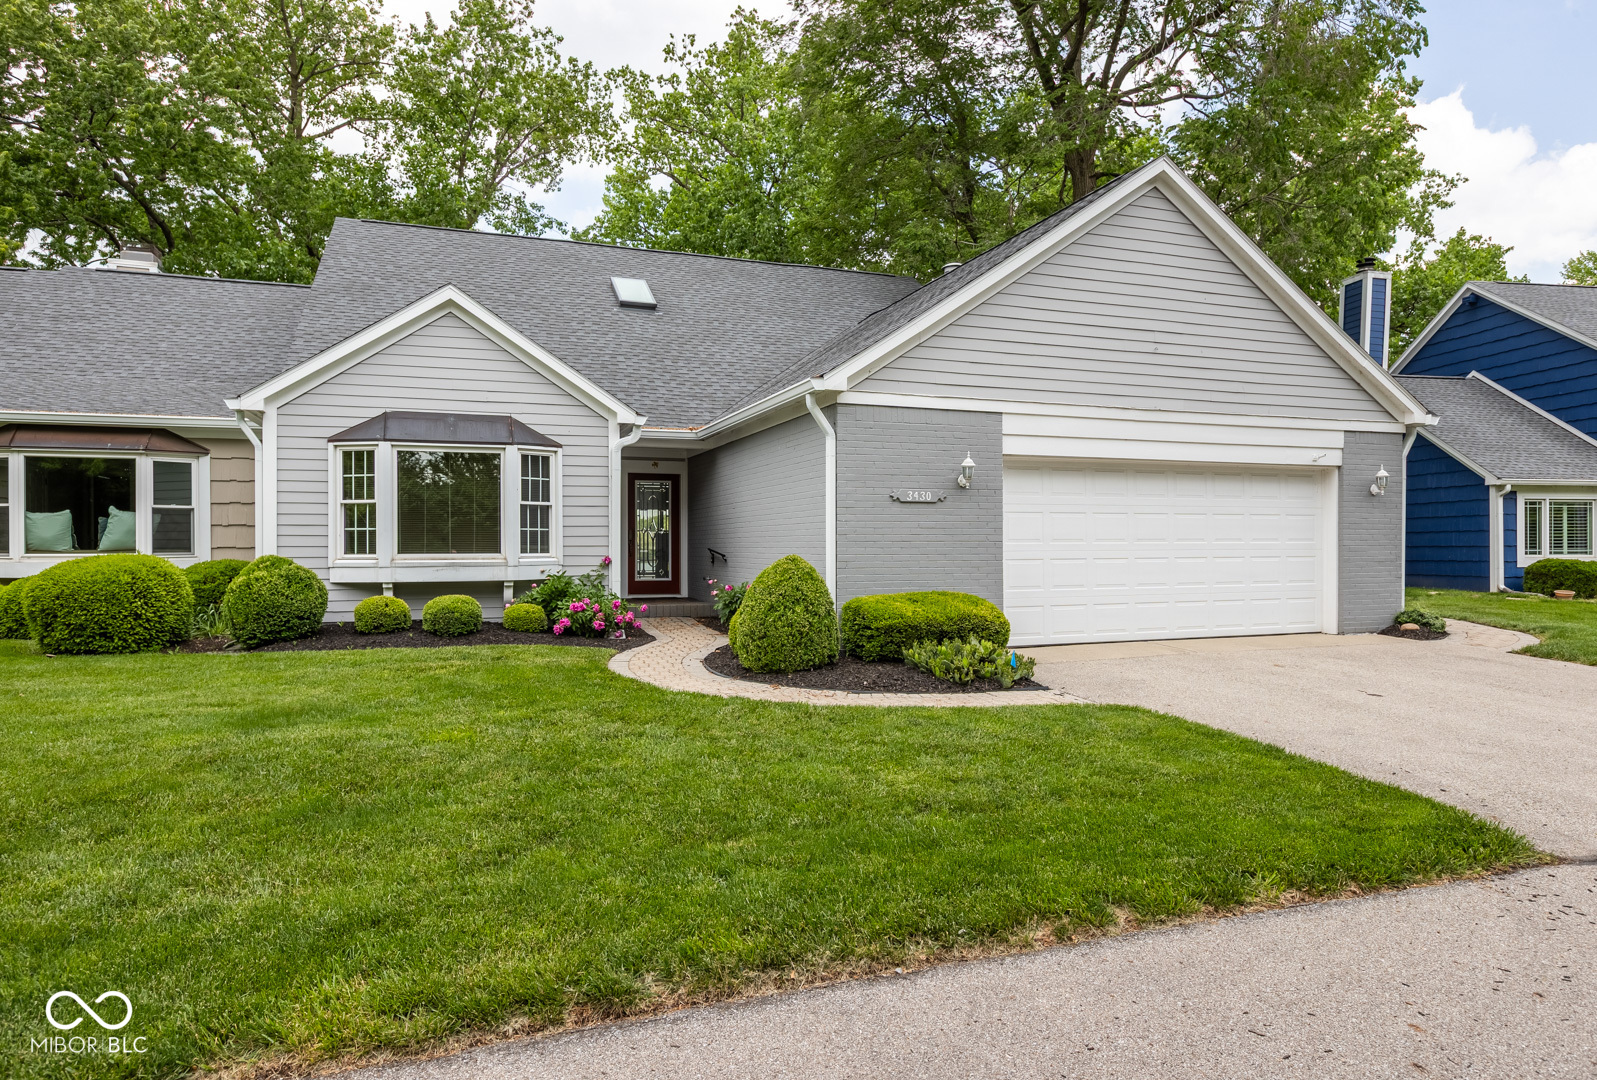
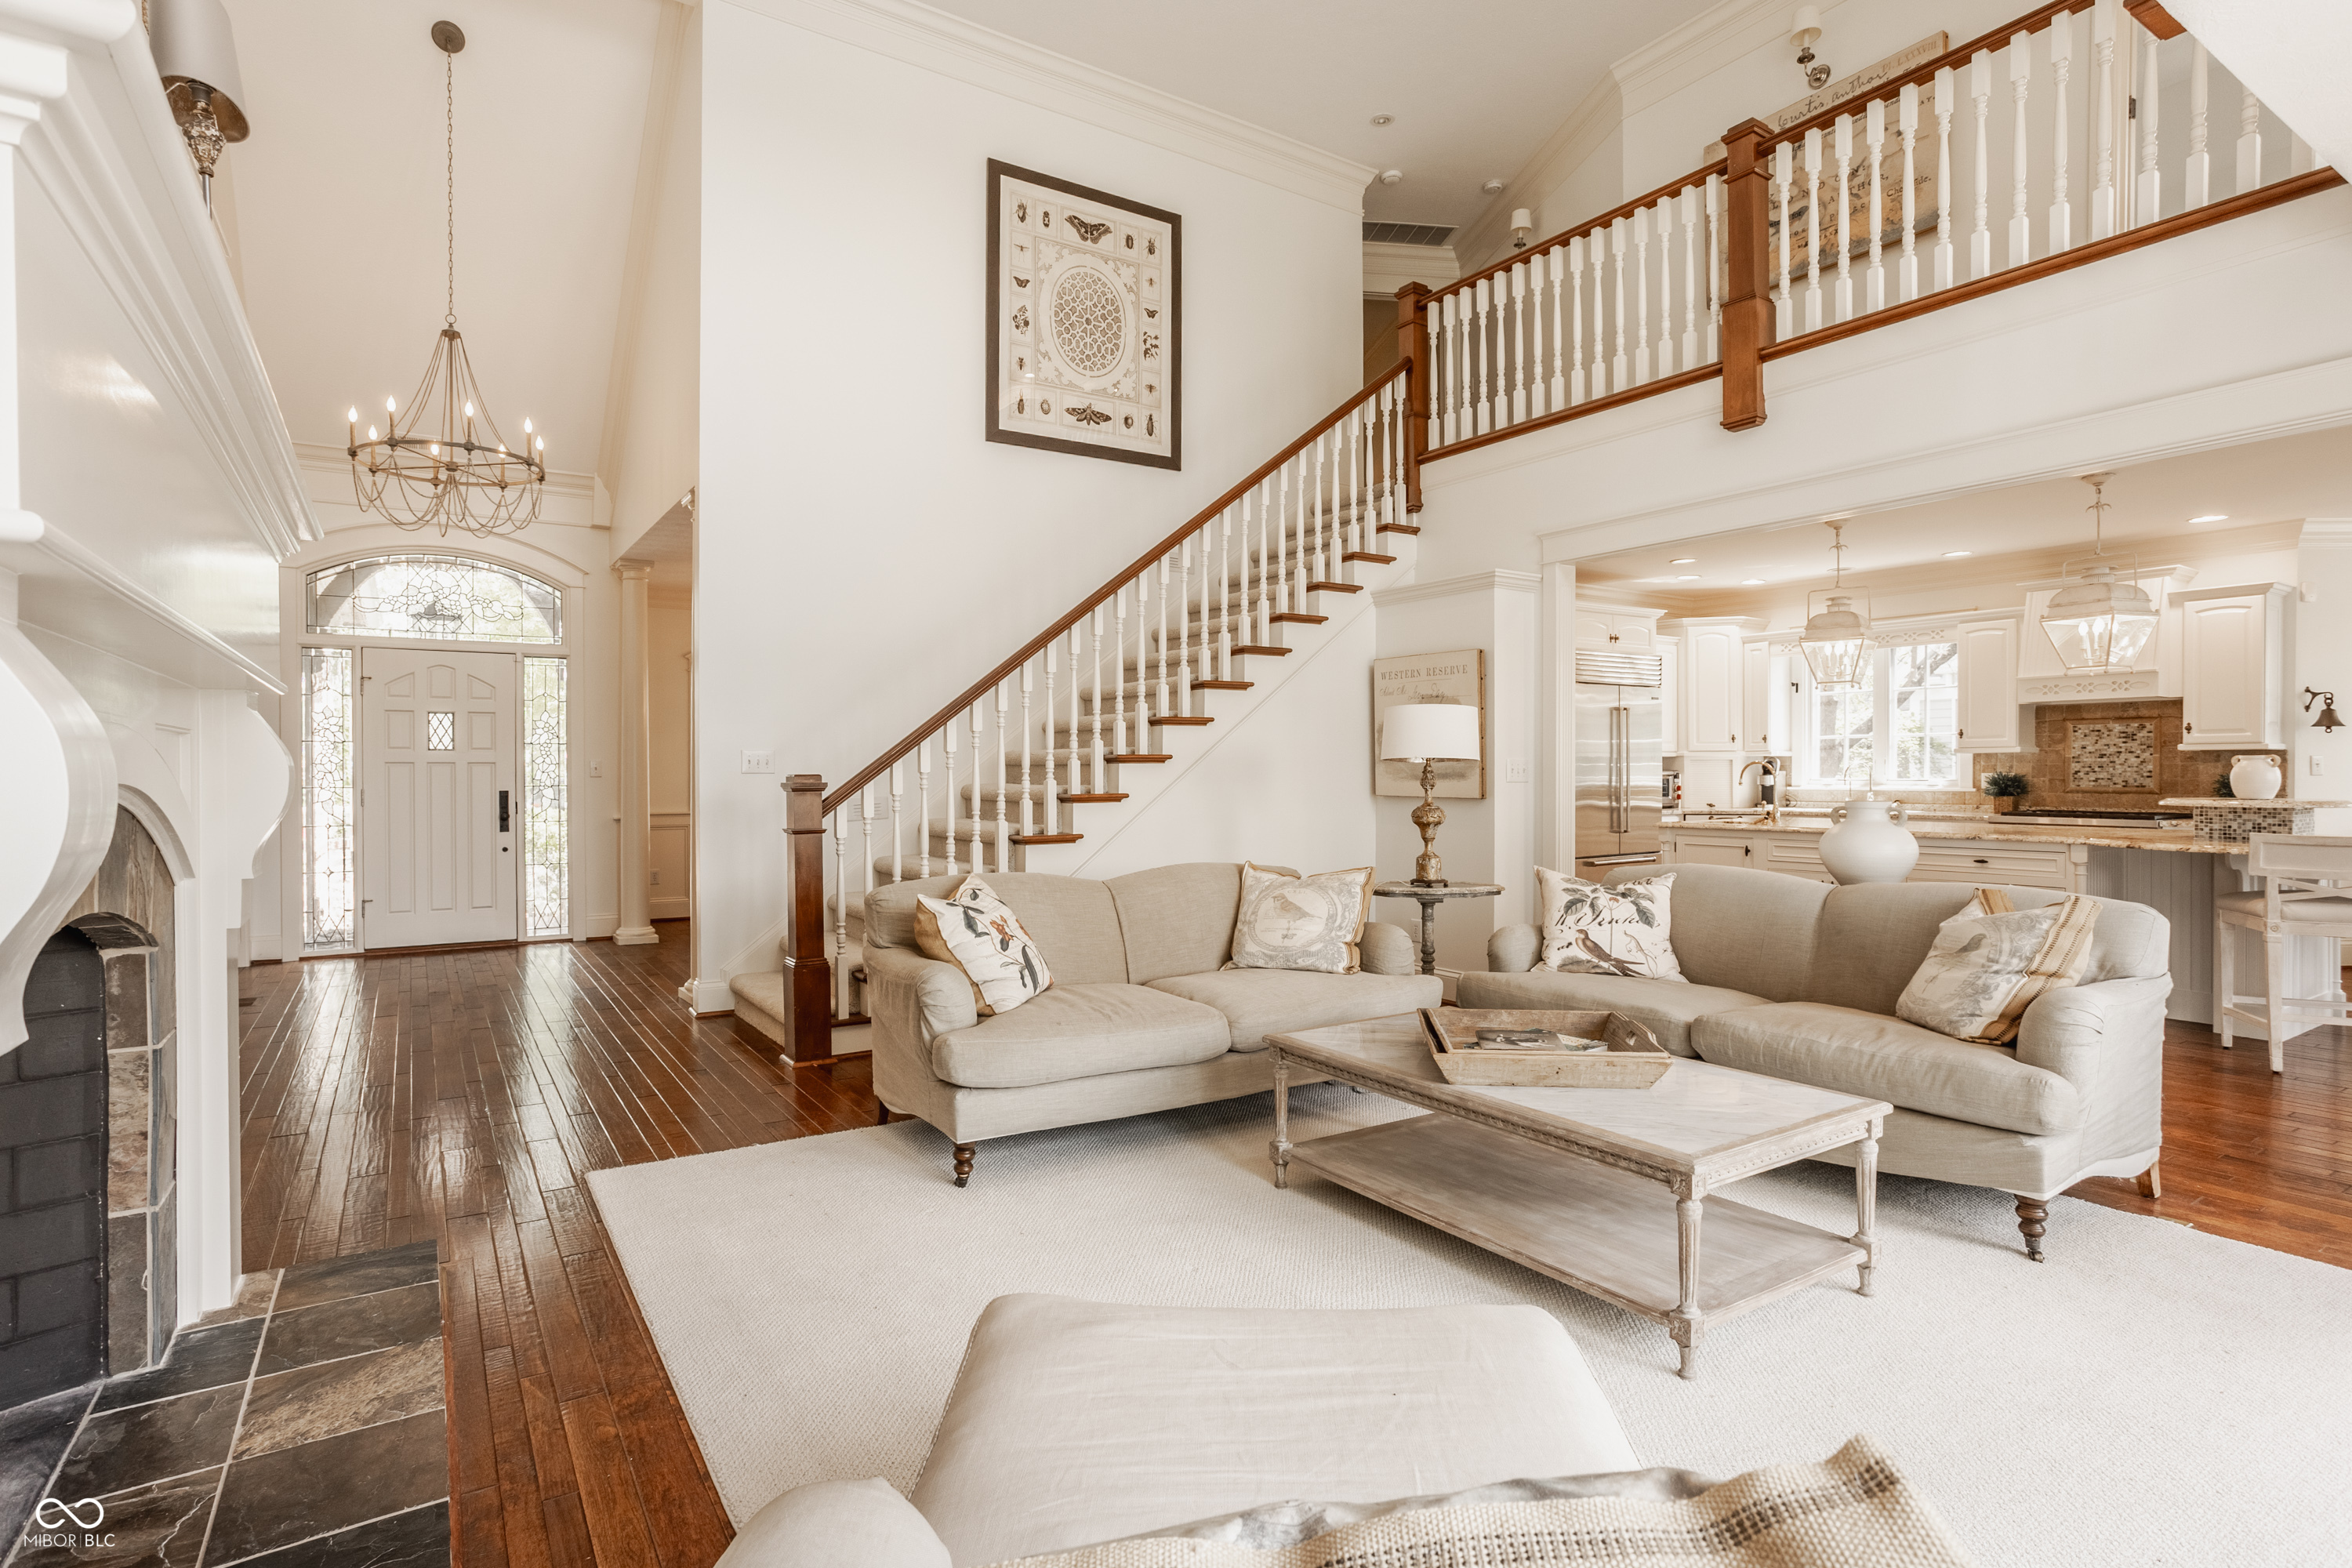
Active
$699,000
2
bds
|
2
ba
|
1,945
sqft
|
built
1986
3430 Bay Road South Dr, Indianapolis, IN 46240
$-2,274
Cash flow
-17.0%
Cash-on-Cash Return
2.2%
Cap rate
0.4%
Rent to Value Ratio
Active
$1,795,000
4
bds
|
4
ba
|
5,207
sqft
|
built
2002
6560 Dawson Lake Dr, Indianapolis, IN 46220
$-3,979
Cash flow
-11.6%
Cash-on-Cash Return
3.5%
Cap rate
0.4%
Rent to Value Ratio
Active
$329,900
4
bds
|
3
ba
|
2,509
sqft
|
built
2013
8404 Alcona Dr, Indianapolis, IN 46237
$-208
Cash flow
-3.3%
Cash-on-Cash Return
5.4%
Cap rate
0.7%
Rent to Value Ratio
Active
$140,000
3
bds
|
2
ba
|
1,204
sqft
|
built
1950
3302 E 42nd St, Indianapolis, IN 46205
$525
Cash flow
19.6%
Cash-on-Cash Return
10.6%
Cap rate
1.3%
Rent to Value Ratio
Active
$340,000
5
bds
|
3
ba
|
2,192
sqft
|
built
1995
6714 Colleens Way, Indianapolis, IN 46221
$-376
Cash flow
-5.8%
Cash-on-Cash Return
4.8%
Cap rate
0.6%
Rent to Value Ratio
Active
$619,000
4
bds
|
4
ba
|
3,899
sqft
|
built
2001
11036 Ravenna Way, Indianapolis, IN 46236
$-980
Cash flow
-8.3%
Cash-on-Cash Return
4.2%
Cap rate
0.5%
Rent to Value Ratio
Pending
$335,000
2
bds
|
2
ba
|
1,573
sqft
|
built
2021
6350 Stallion Way, Indianapolis, IN 46260
$-521
Cash flow
-8.1%
Cash-on-Cash Return
4.3%
Cap rate
0.6%
Rent to Value Ratio
Active
$144,900
2
bds
|
1
ba
|
1,059
sqft
|
built
1920
3652 N Kenwood Ave, Indianapolis, IN 46208
$224
Cash flow
8.1%
Cash-on-Cash Return
8.0%
Cap rate
1.0%
Rent to Value Ratio
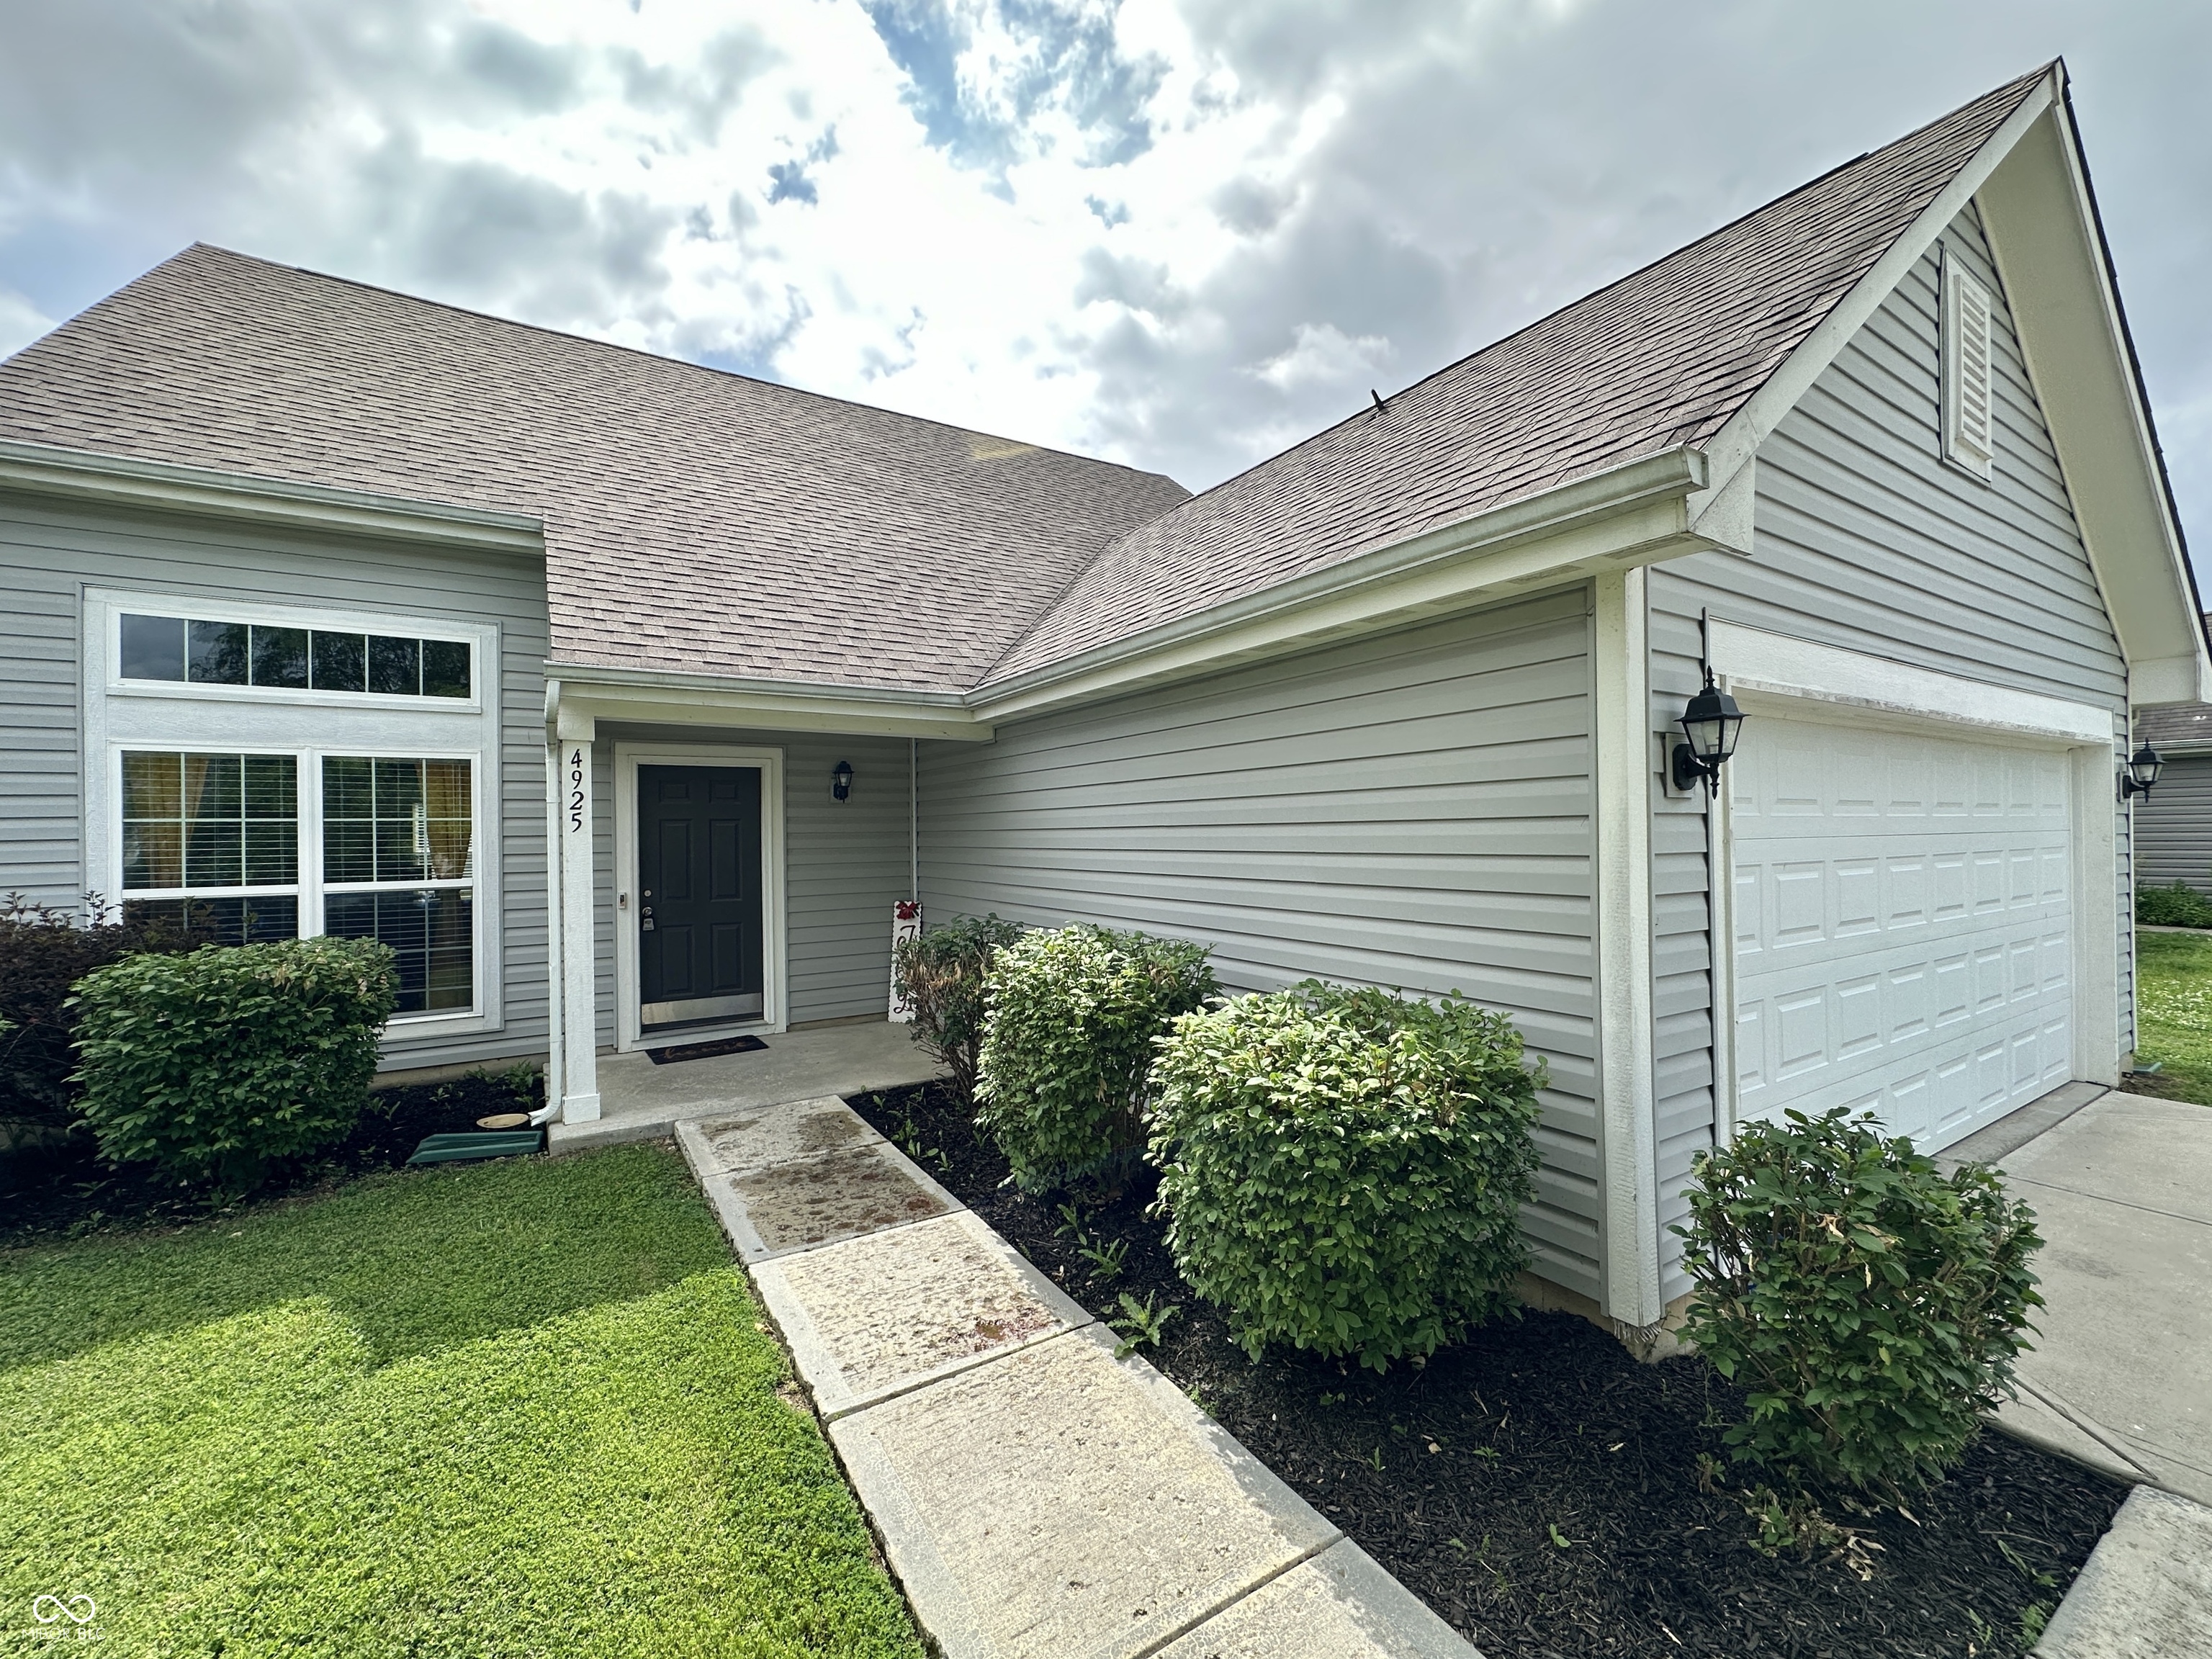
Pending
$260,000
3
bds
|
3
ba
|
1,685
sqft
|
built
2016
4925 Chip Shot Ln, Indianapolis, IN 46235
$186
Cash flow
3.7%
Cash-on-Cash Return
7.0%
Cap rate
0.8%
Rent to Value Ratio
Active
$270,000
2
bds
|
0
ba
|
0
sqft
|
built
1948
5147 E 16th St, Indianapolis, IN 46218
$-624
Cash flow
-12.1%
Cash-on-Cash Return
3.4%
Cap rate
0.4%
Rent to Value Ratio
Active
$250,000
2
bds
|
2
ba
|
1,297
sqft
|
built
1984
4655 Framington Ct, Indianapolis, IN 46254
$30
Cash flow
0.6%
Cash-on-Cash Return
6.3%
Cap rate
0.8%
Rent to Value Ratio
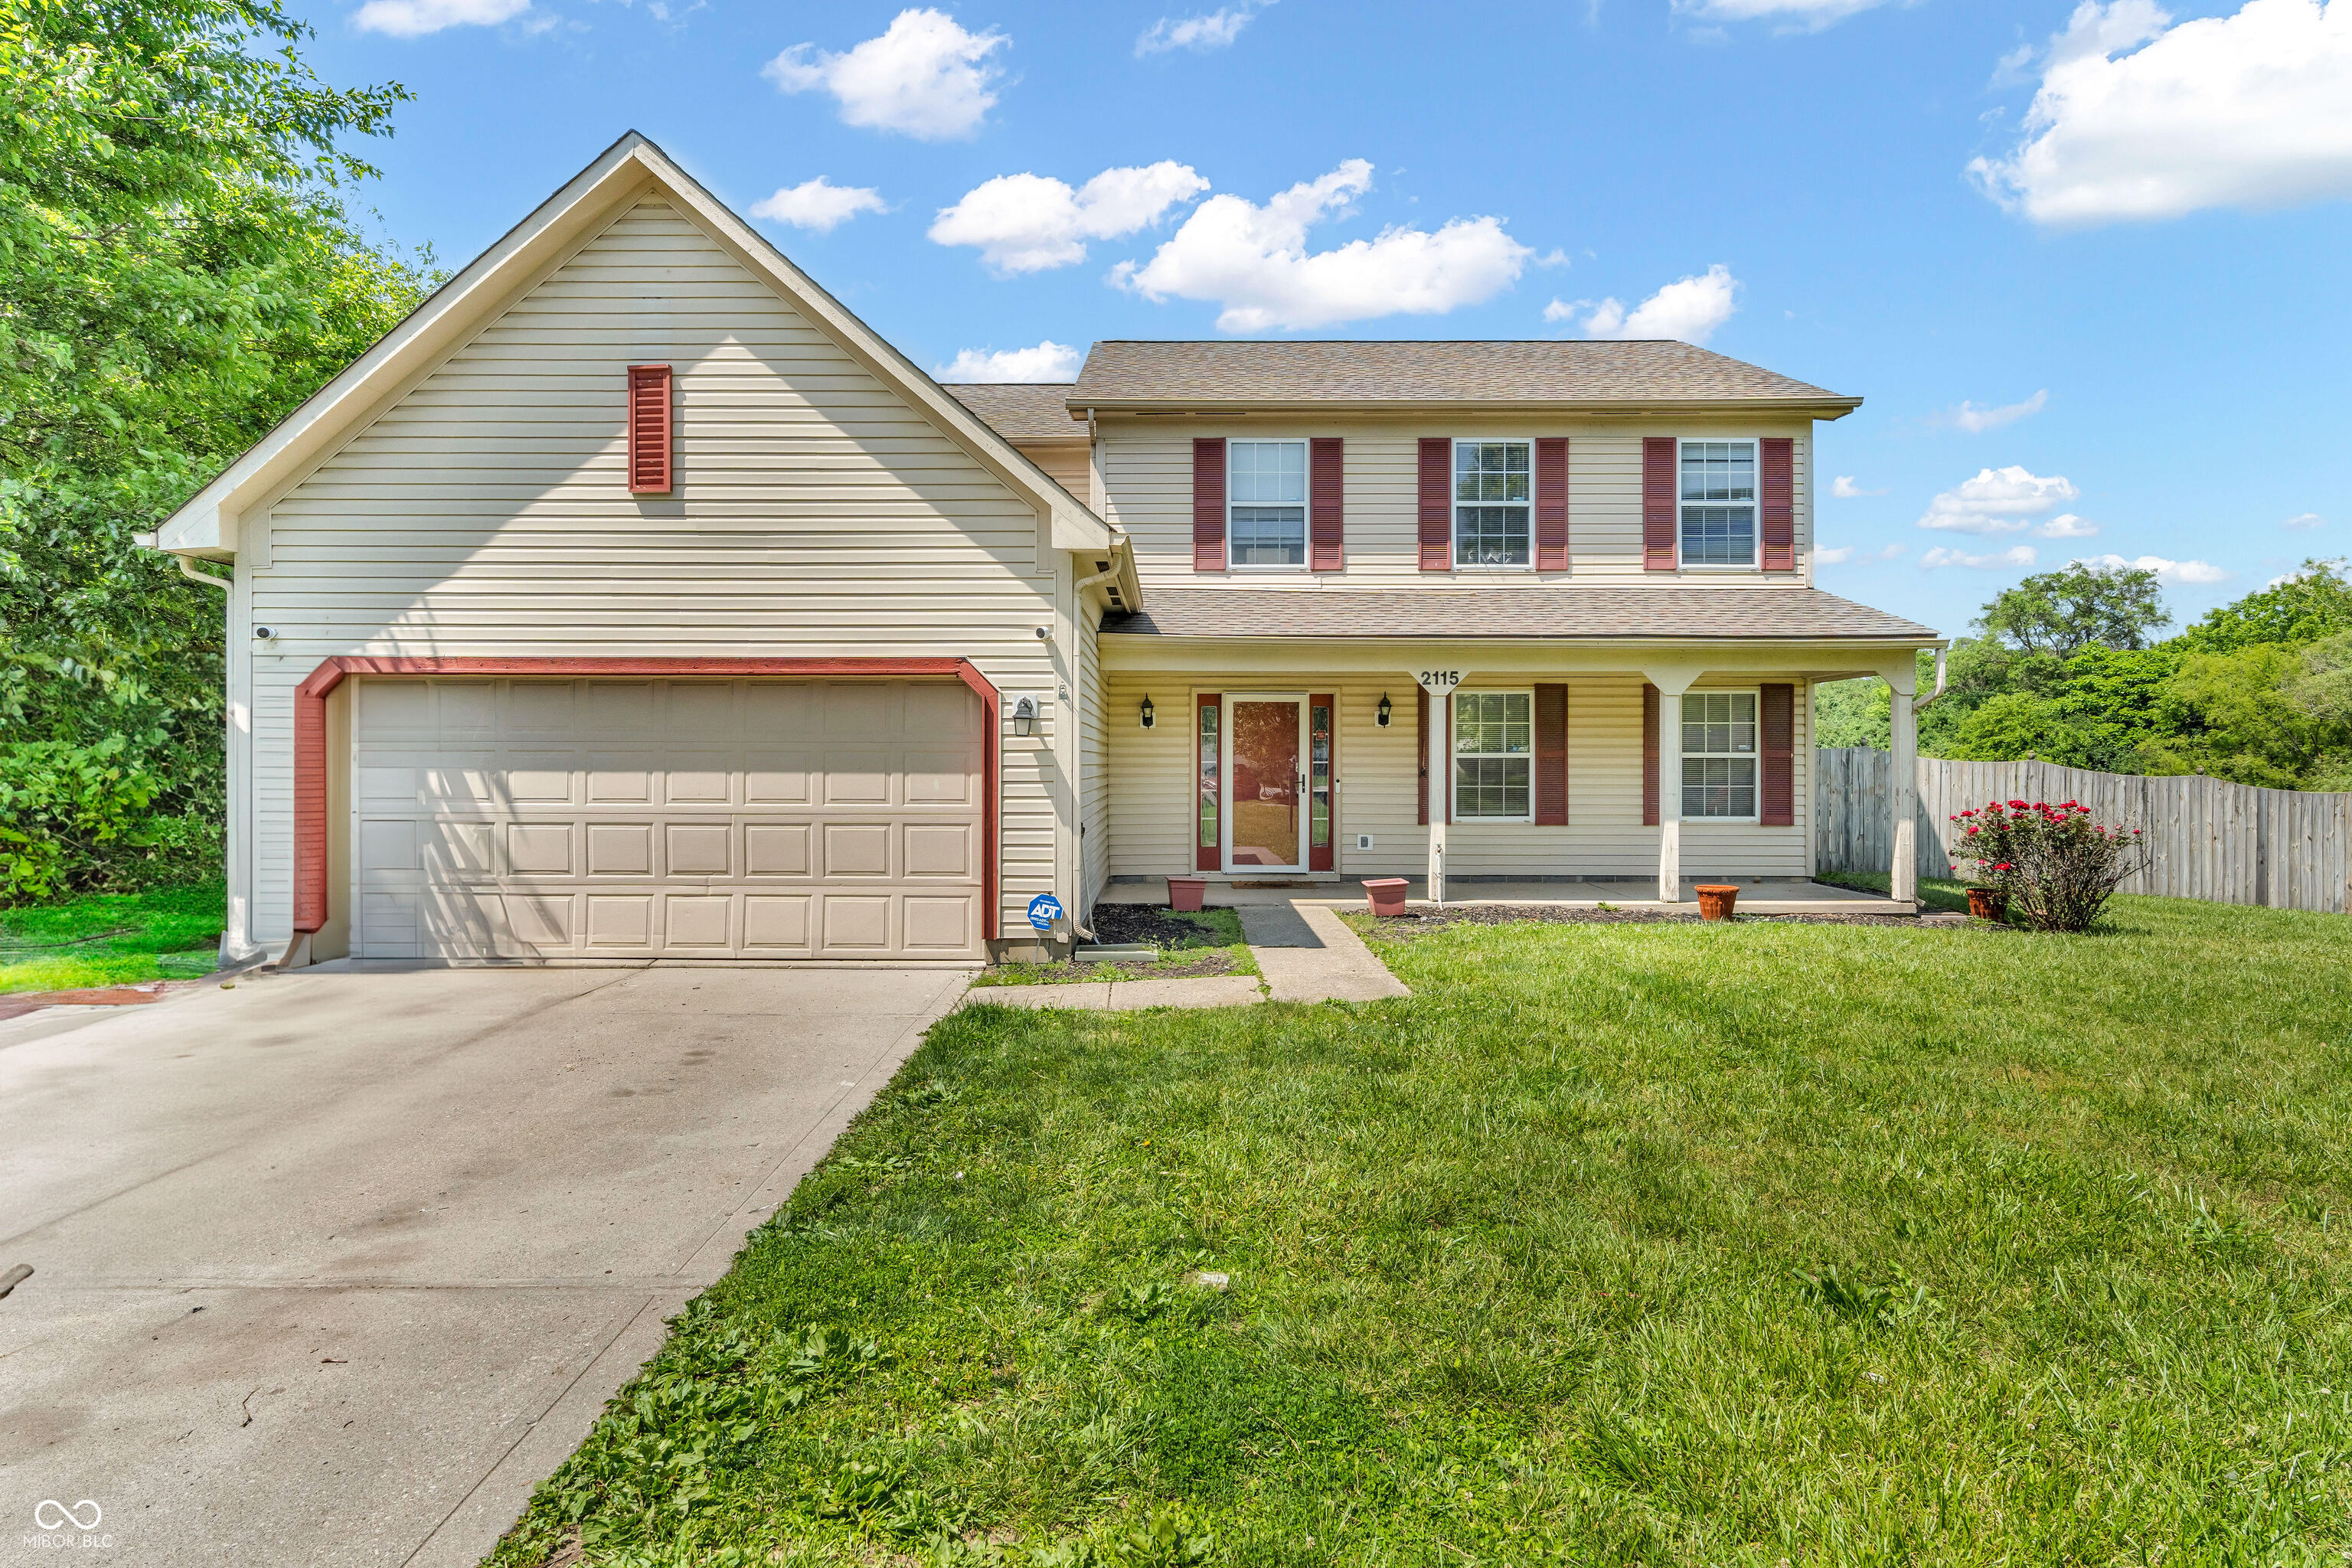
Active
$300,000
4
bds
|
3
ba
|
2,416
sqft
|
built
1995
2115 Napa Cir, Indianapolis, IN 46214
$50
Cash flow
0.9%
Cash-on-Cash Return
6.3%
Cap rate
0.8%
Rent to Value Ratio
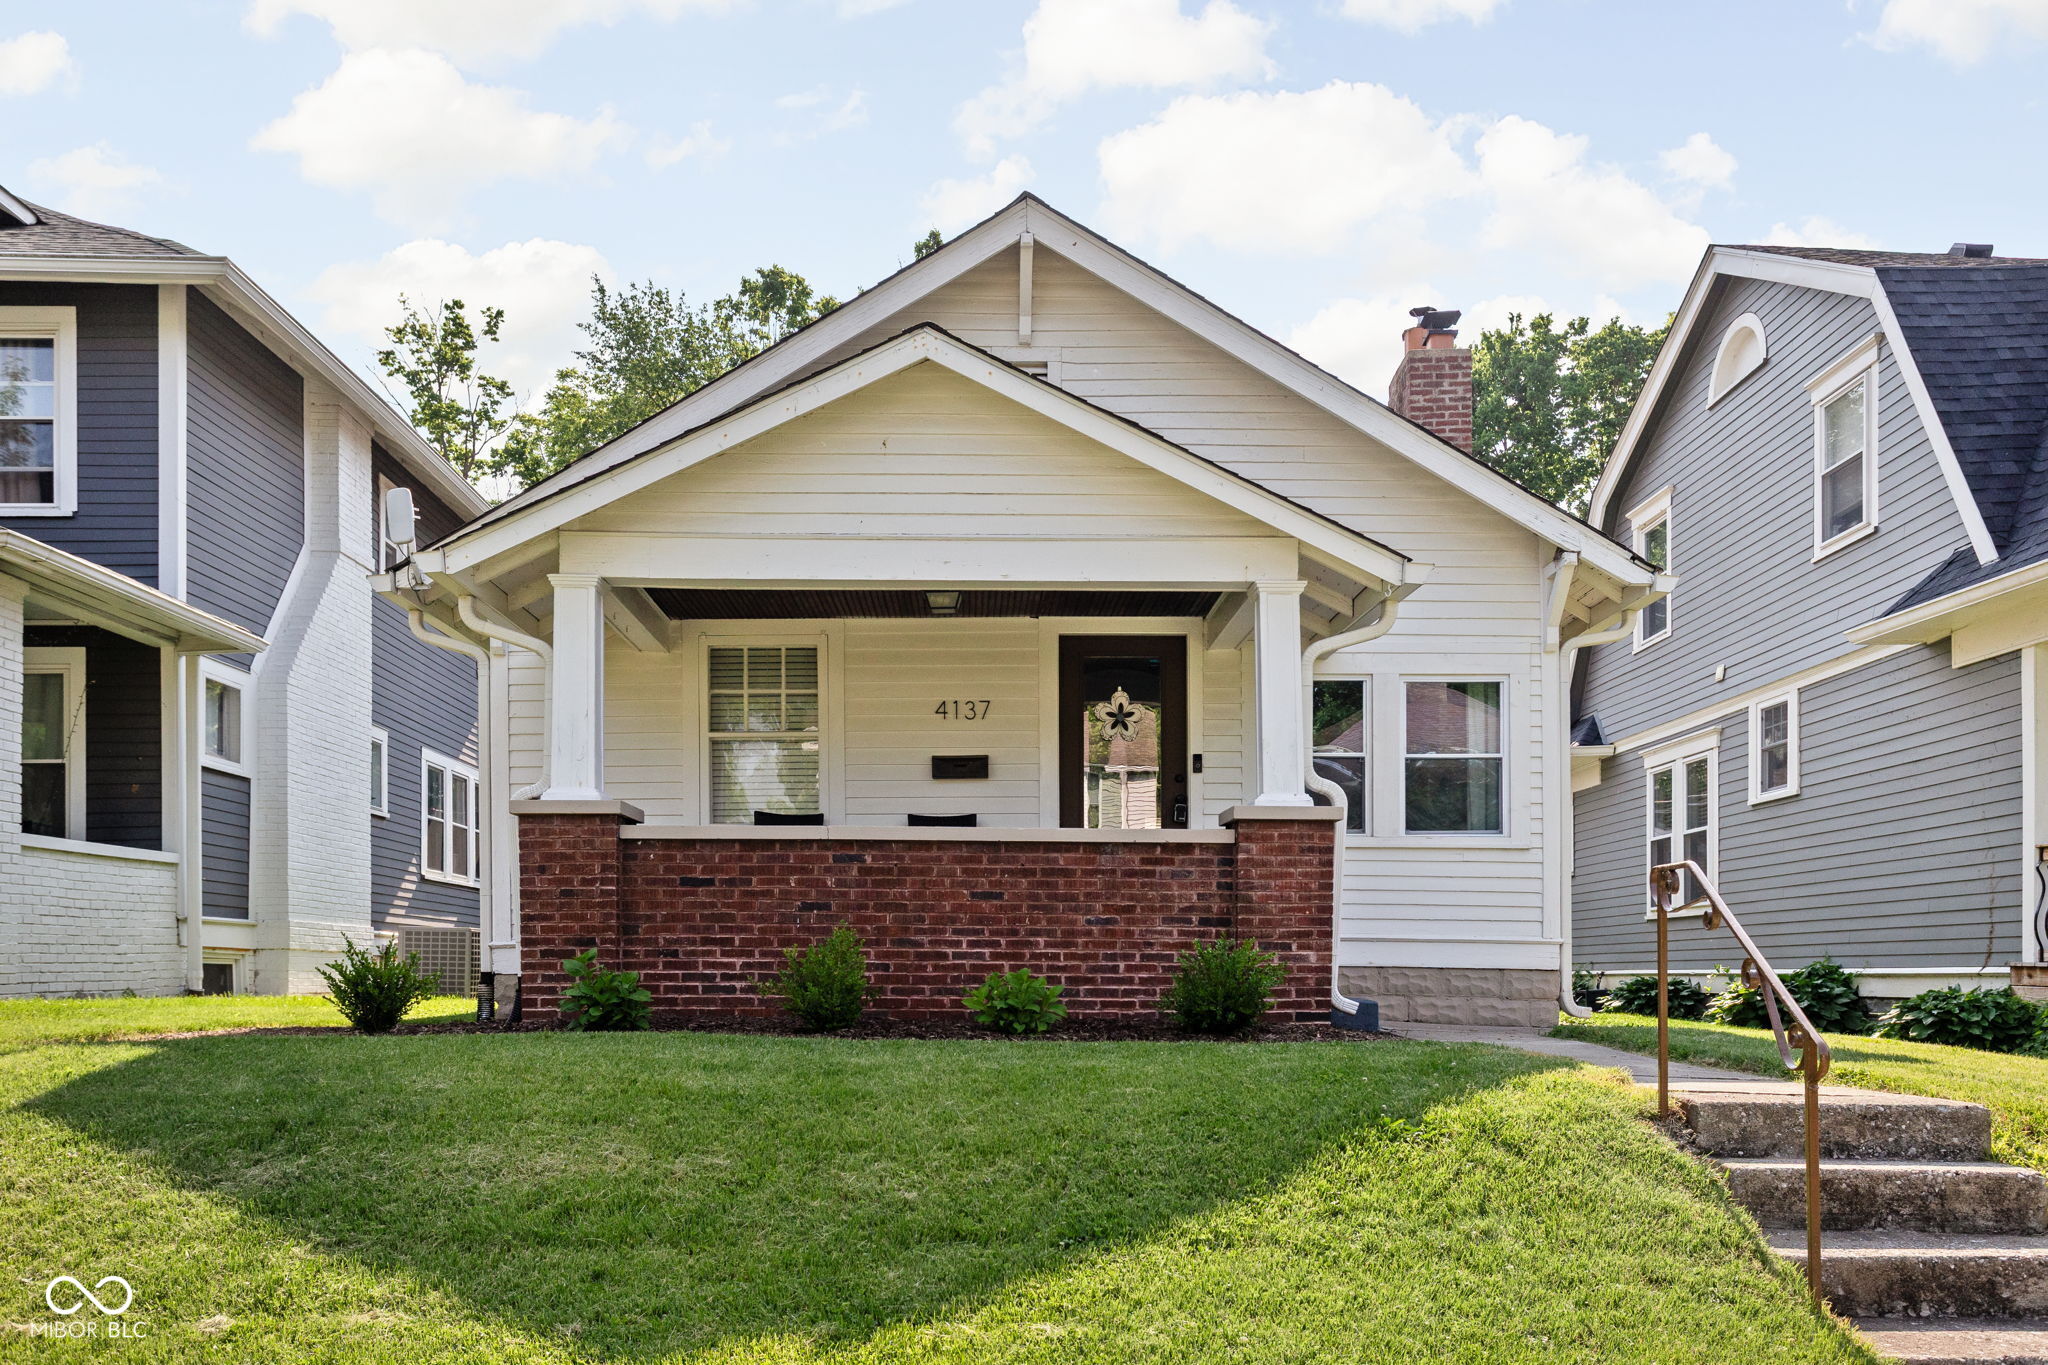
Active
$279,900
2
bds
|
1
ba
|
1,008
sqft
|
built
1923
4137 Rookwood Ave, Indianapolis, IN 46208
$-54
Cash flow
-1.0%
Cash-on-Cash Return
5.9%
Cap rate
0.7%
Rent to Value Ratio
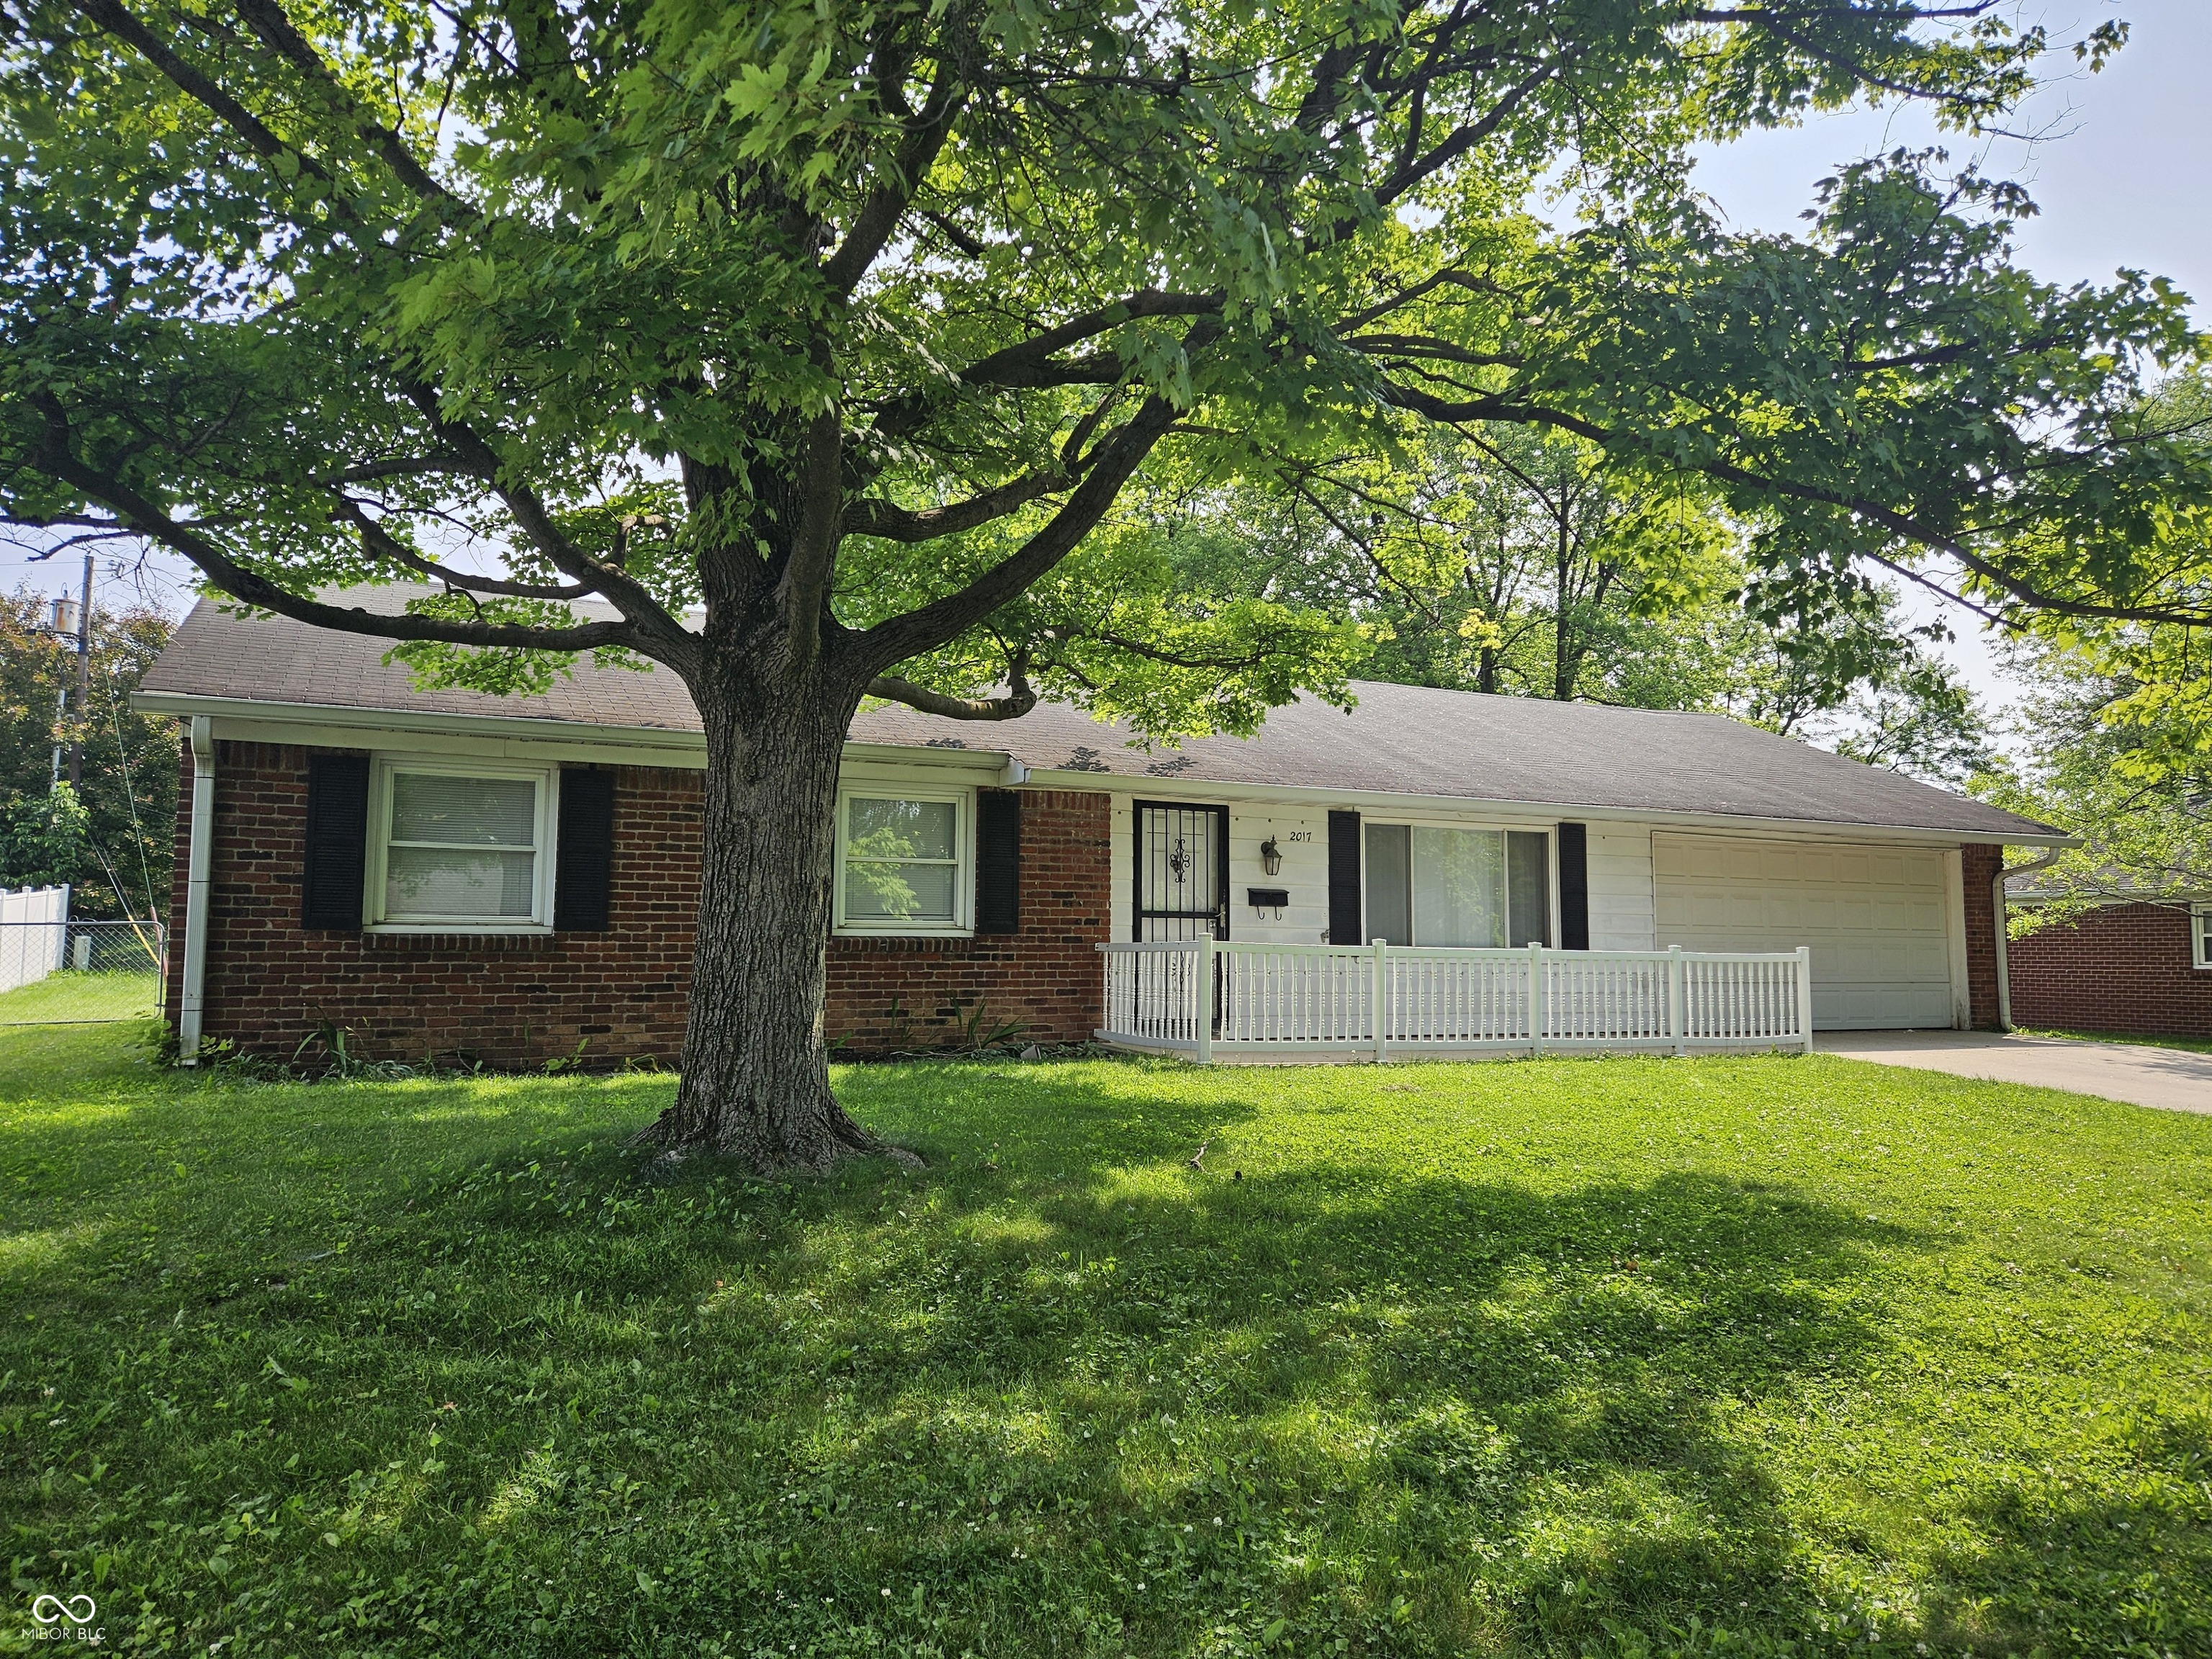
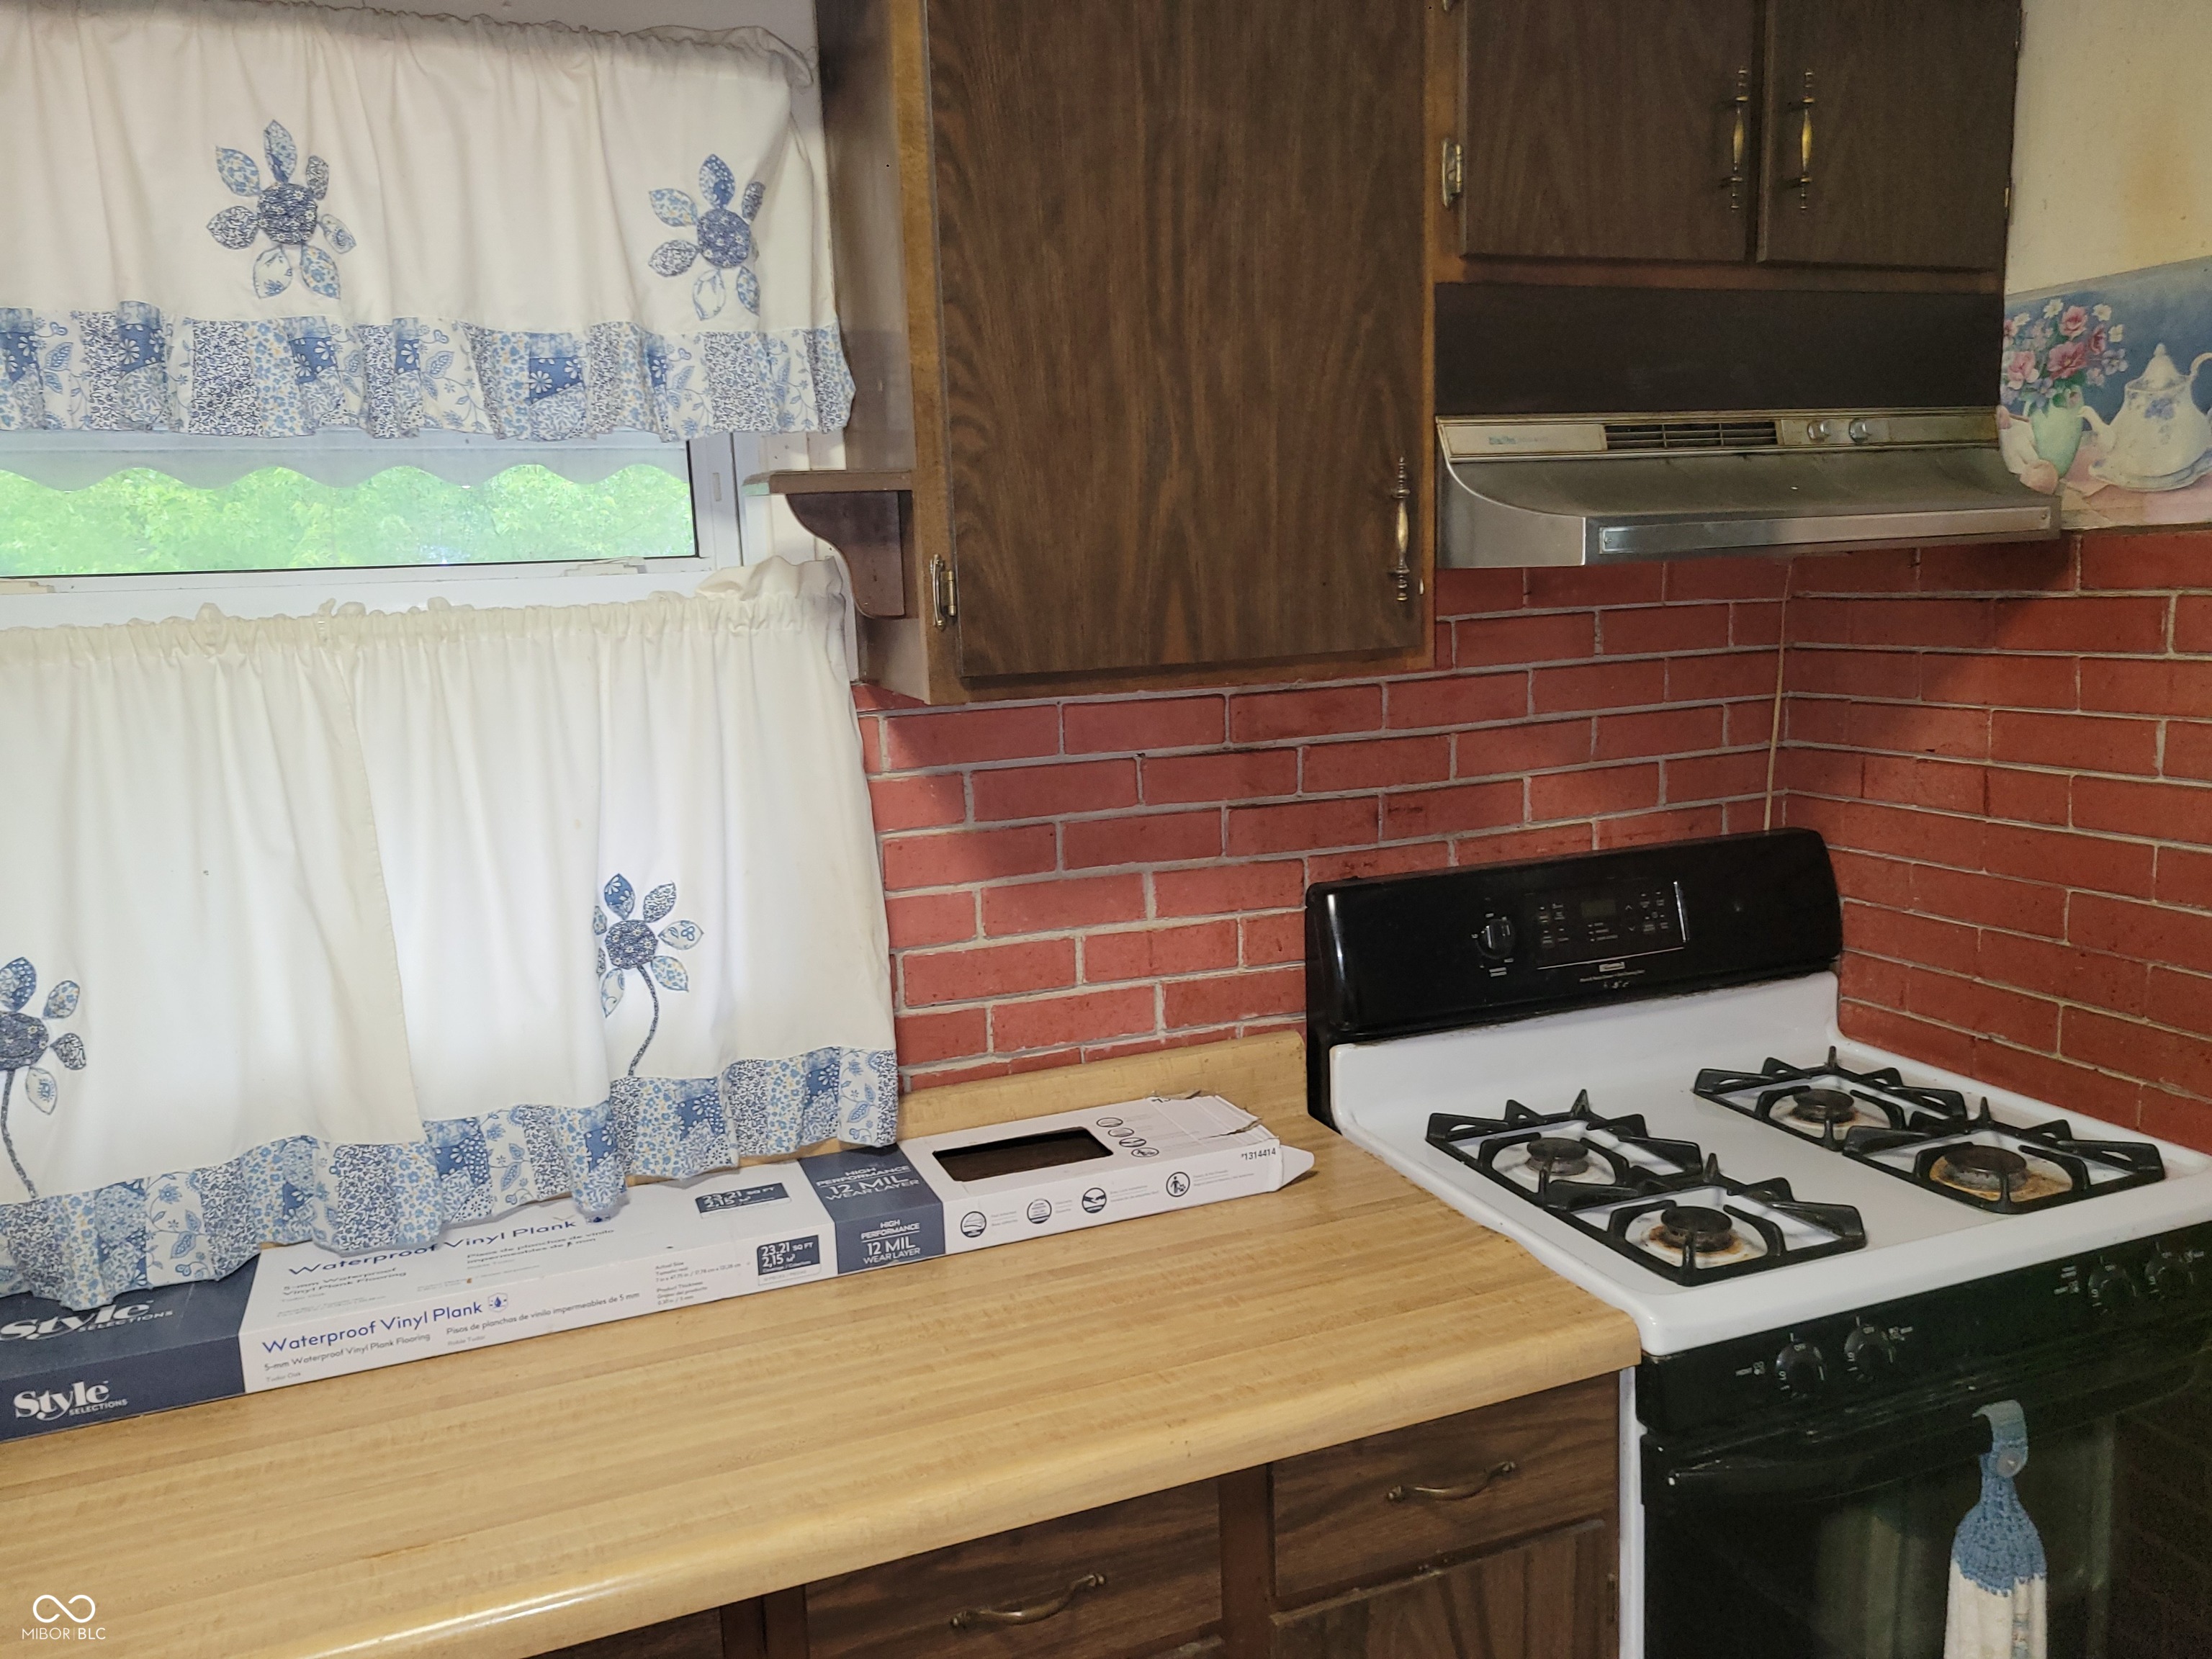
Active
$225,000
3
bds
|
2
ba
|
1,470
sqft
|
built
1962
2017 Schwier Ct, Indianapolis, IN 46229
$-49
Cash flow
-1.1%
Cash-on-Cash Return
5.9%
Cap rate
0.7%
Rent to Value Ratio
Active
$179,900
3
bds
|
2
ba
|
1,050
sqft
|
built
1957
267 S Grant Ave, Indianapolis, IN 46201
$44
Cash flow
1.3%
Cash-on-Cash Return
6.4%
Cap rate
0.8%
Rent to Value Ratio
Active
$325,000
3
bds
|
2
ba
|
1,744
sqft
|
built
1951
6204 Madison Ave, Indianapolis, IN 46227
$-492
Cash flow
-7.9%
Cash-on-Cash Return
4.3%
Cap rate
0.5%
Rent to Value Ratio
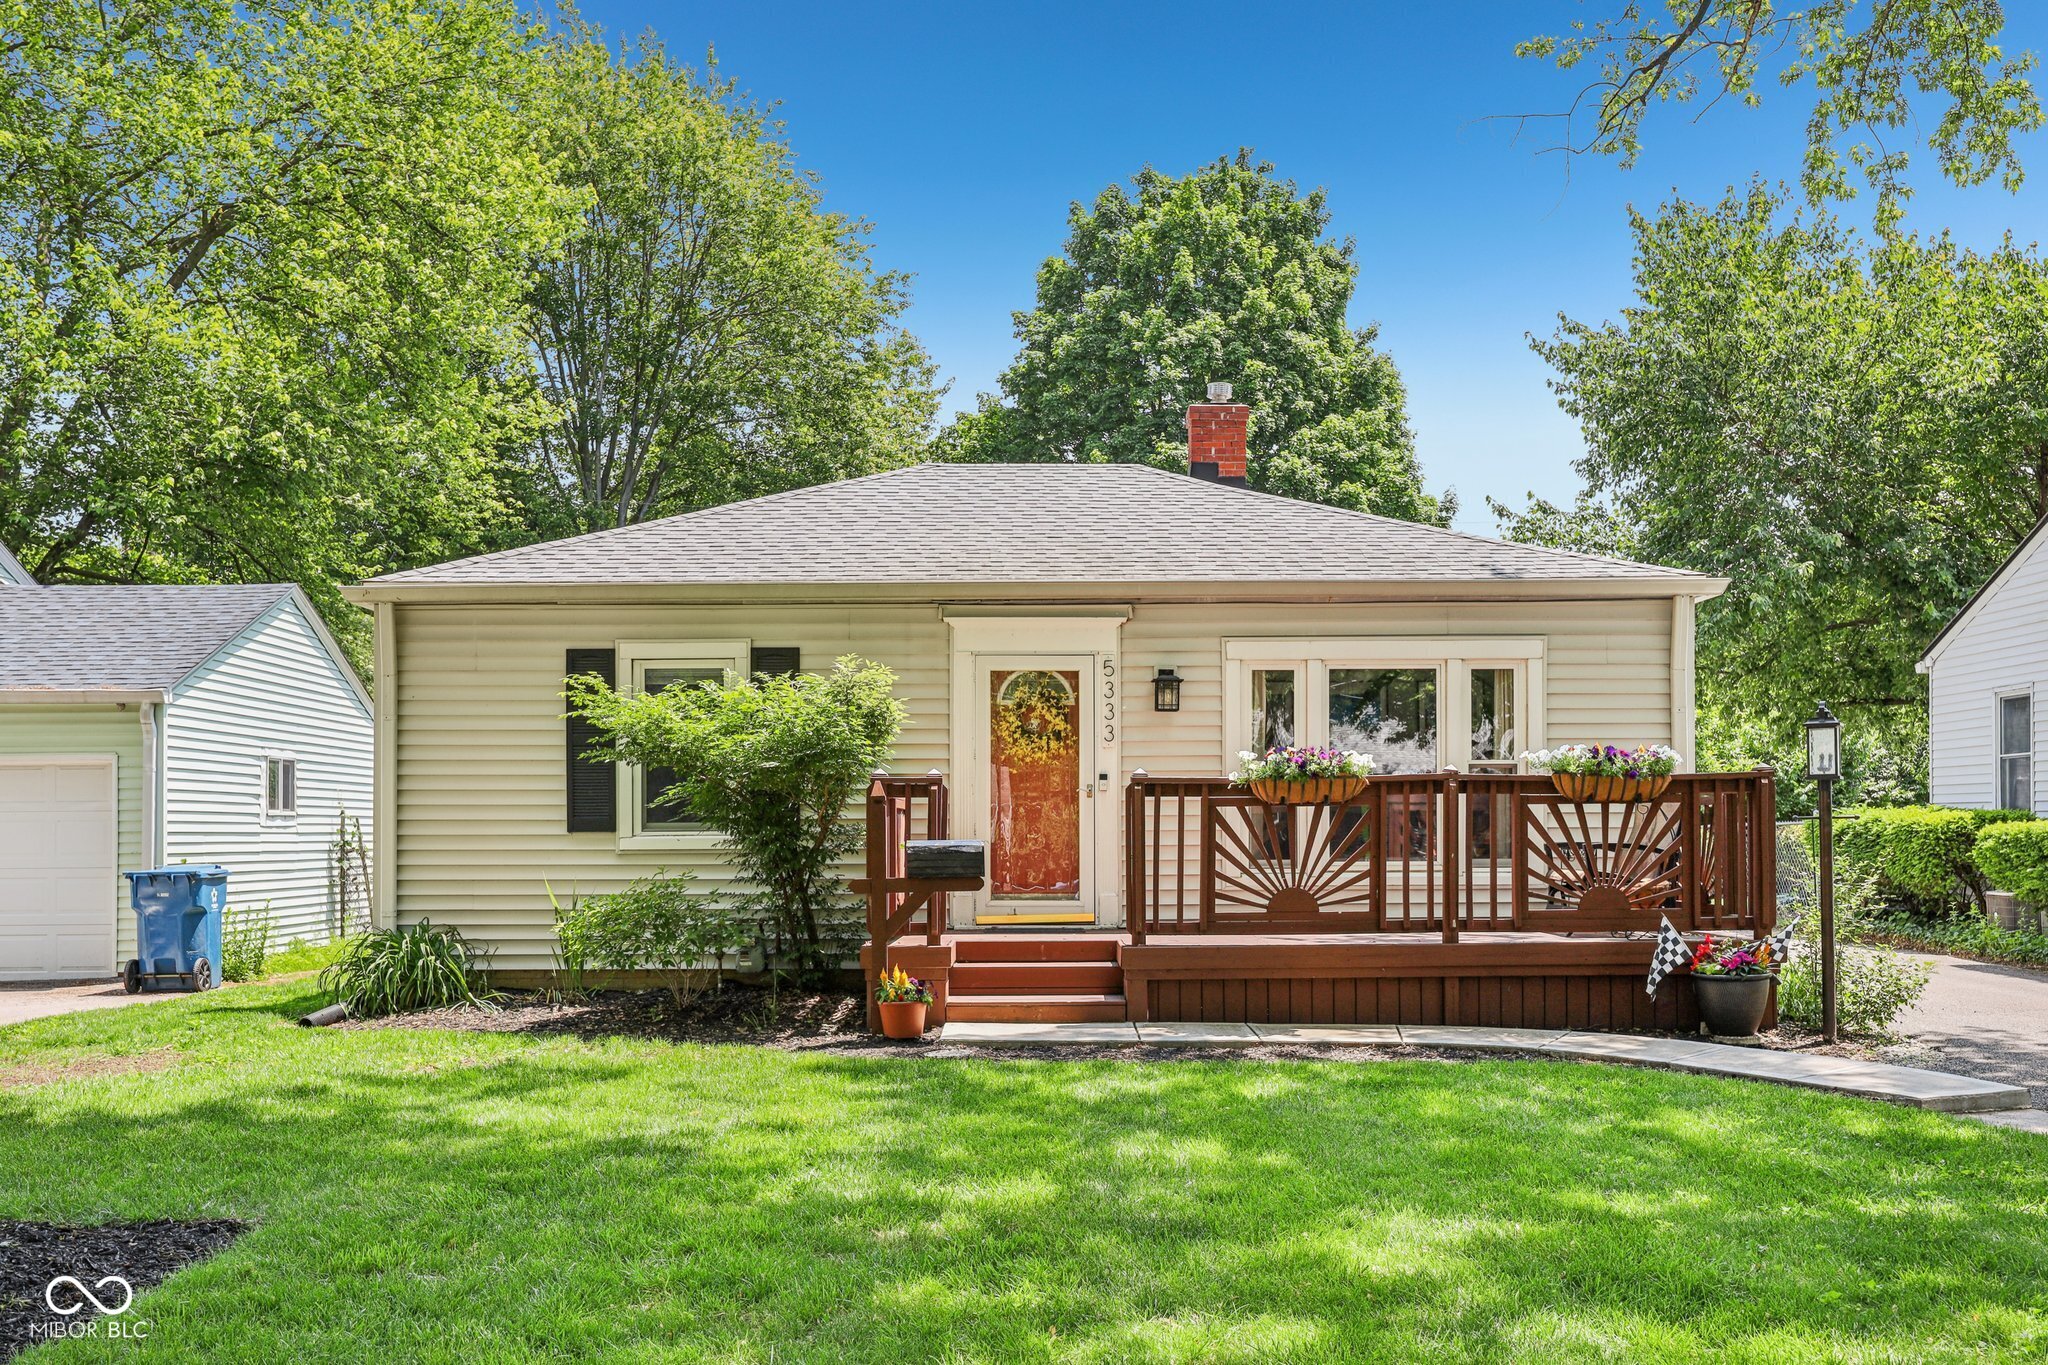
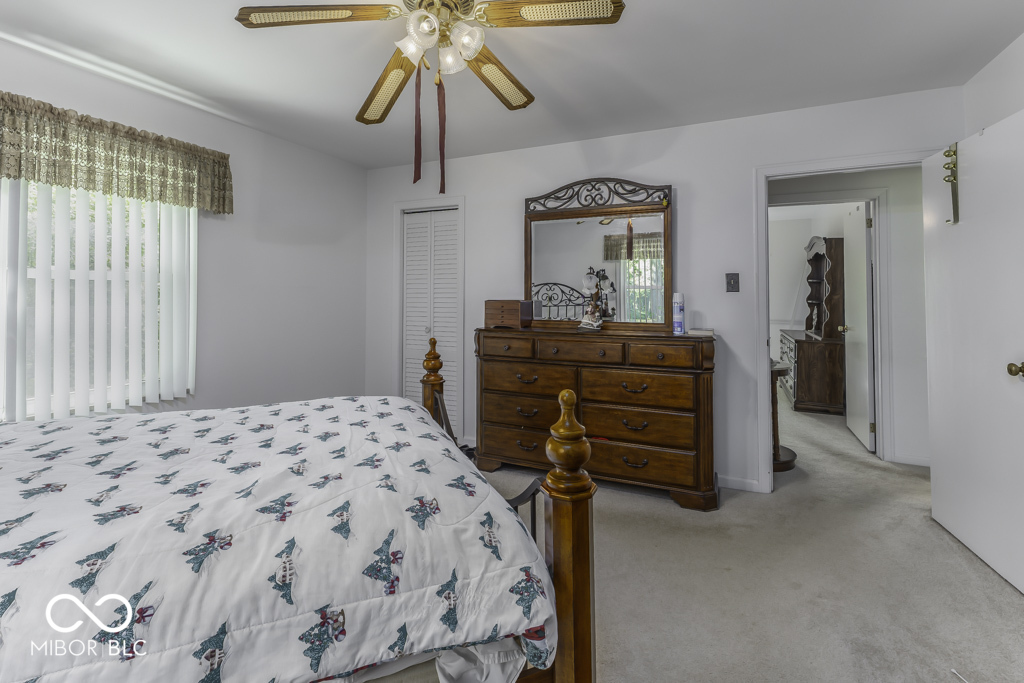
Active
$315,000
2
bds
|
1
ba
|
881
sqft
|
built
1951
5333 Ralston Ave, Indianapolis, IN 46220
$-96
Cash flow
-1.6%
Cash-on-Cash Return
5.8%
Cap rate
0.7%
Rent to Value Ratio
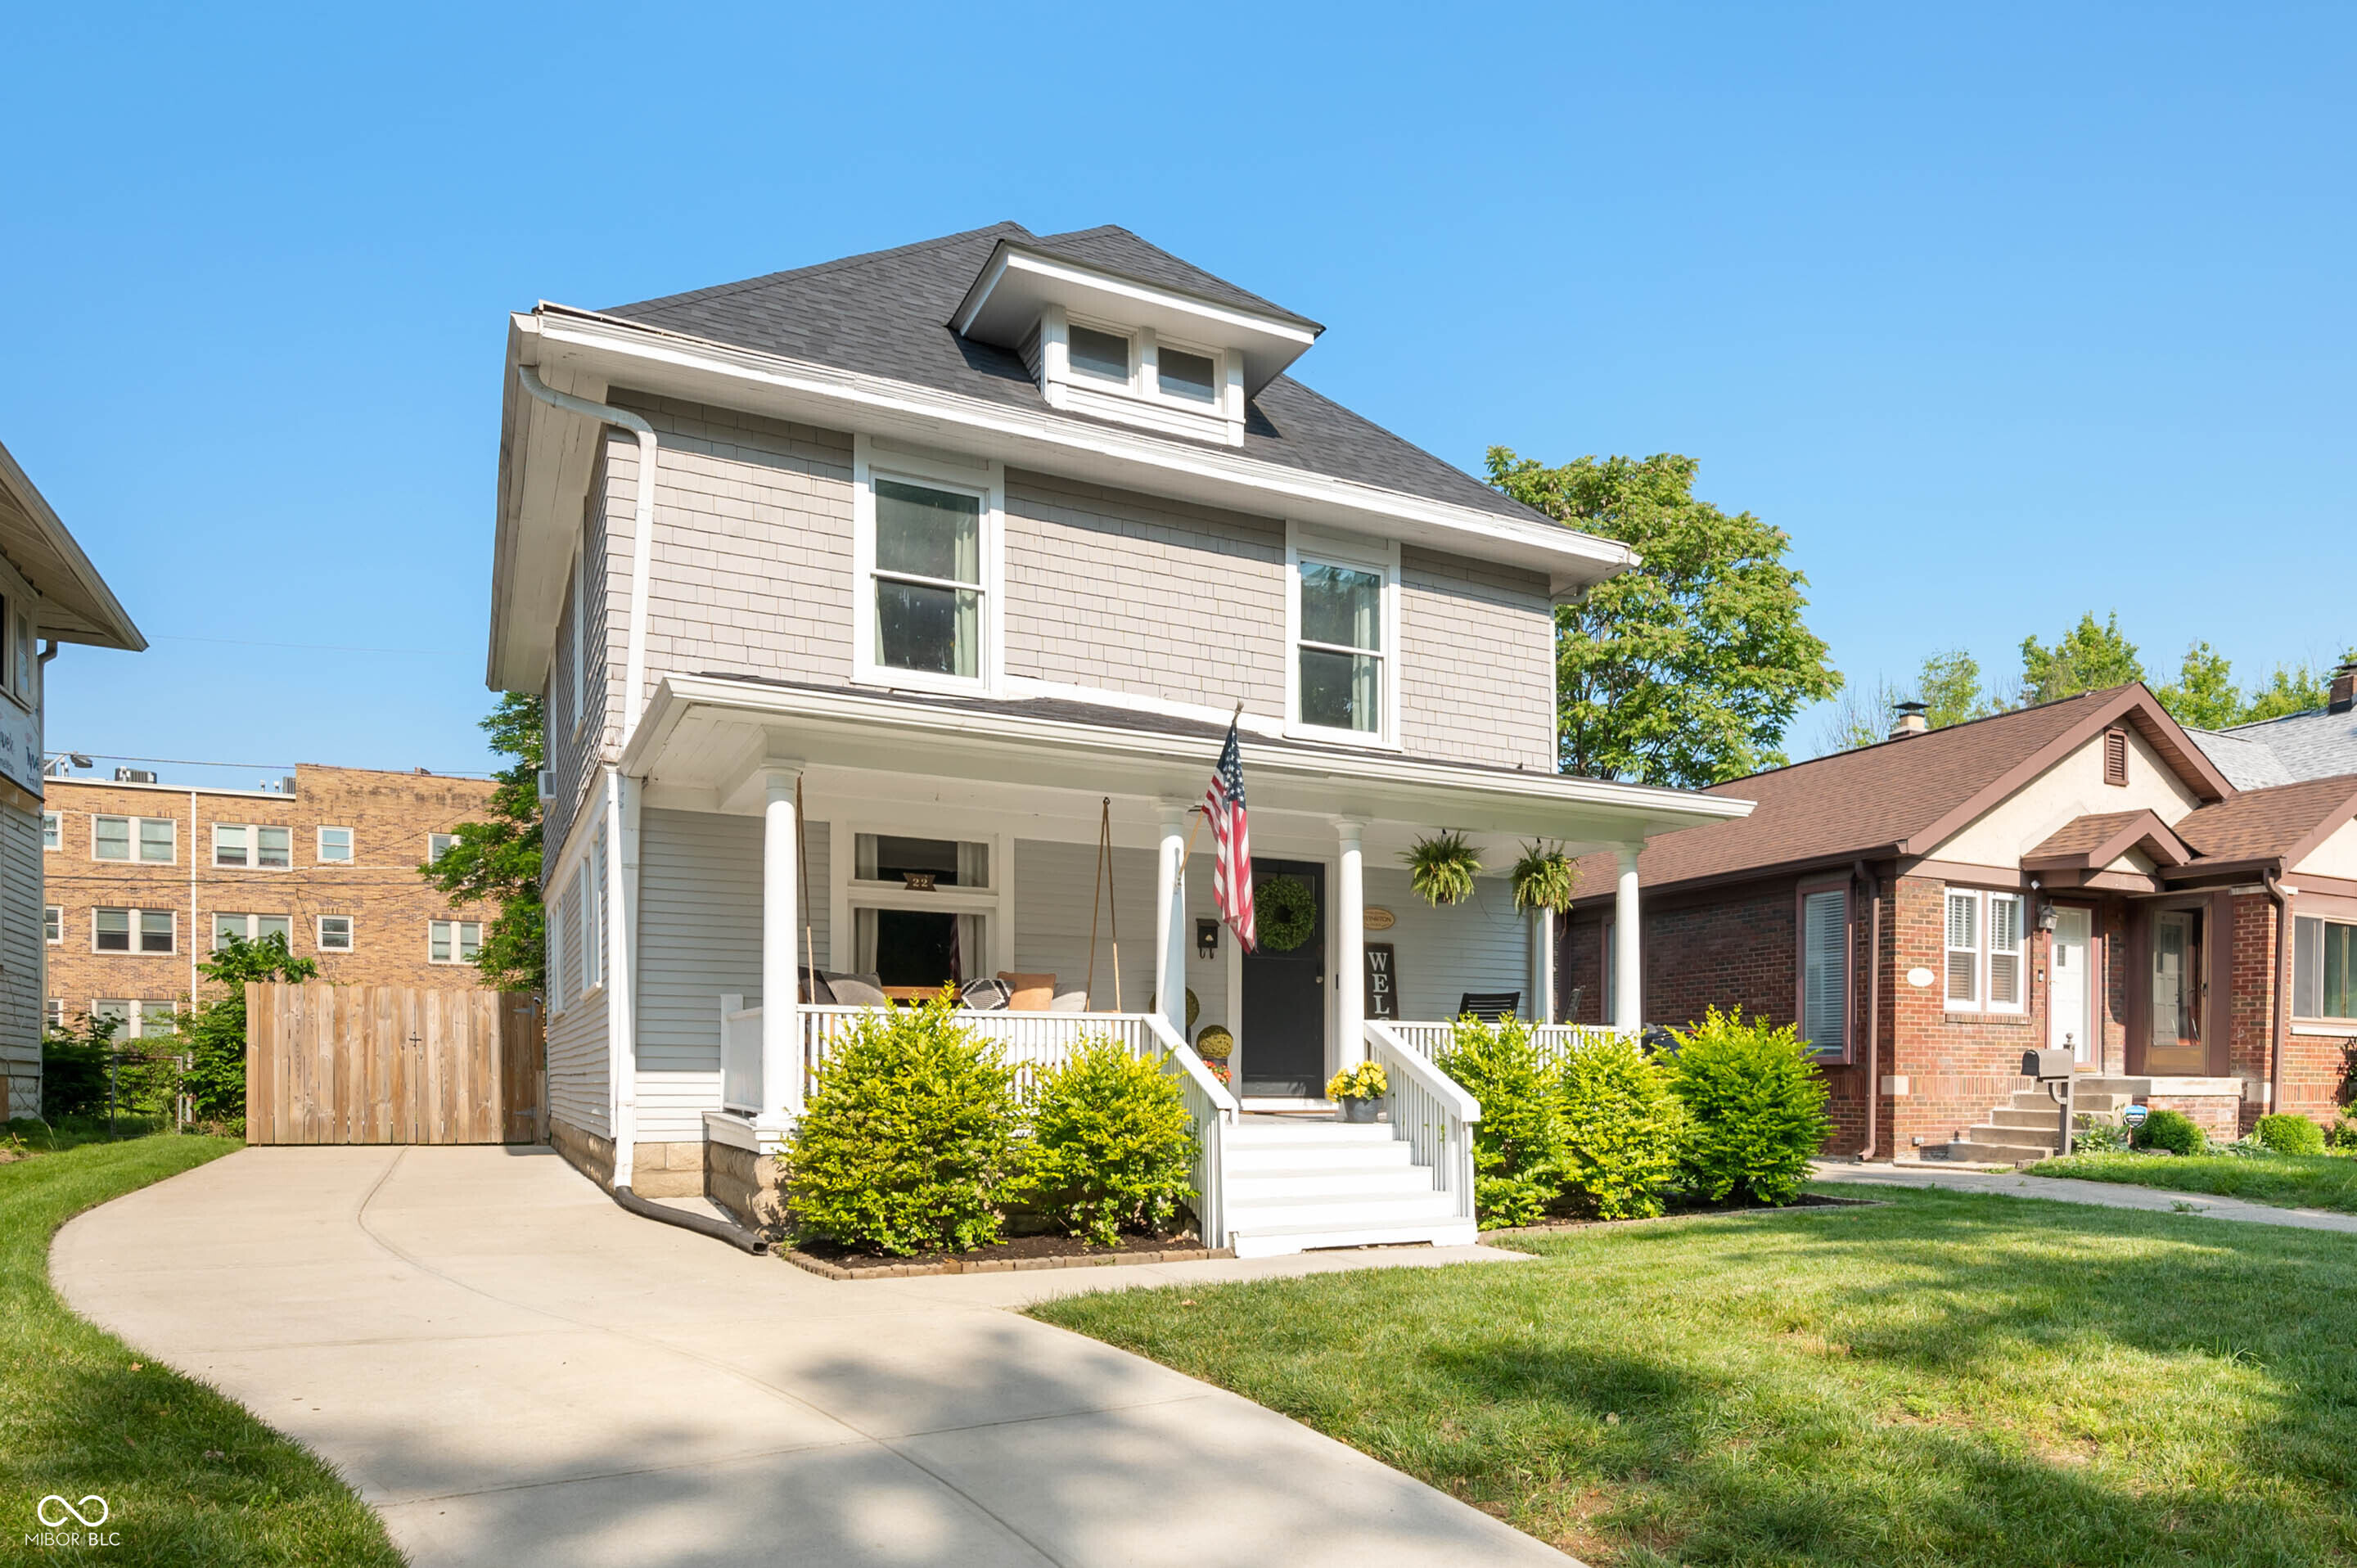
Active
$375,000
4
bds
|
3
ba
|
2,712
sqft
|
built
1898
22 N Bolton Ave, Indianapolis, IN 46219
$11
Cash flow
0.2%
Cash-on-Cash Return
6.2%
Cap rate
0.7%
Rent to Value Ratio
Pending
$315,000
3
bds
|
2
ba
|
2,952
sqft
|
built
1955
3105 E Banta Rd, Indianapolis, IN 46227
$-96
Cash flow
-1.6%
Cash-on-Cash Return
5.8%
Cap rate
0.7%
Rent to Value Ratio