Indianapolis, IN Investment Properties for Sale
Browse homes for sale and investment properties in Indianapolis, IN. Refine your search by price, property type, or more.
Best cash flowing properties in Indianapolis, IN
Active
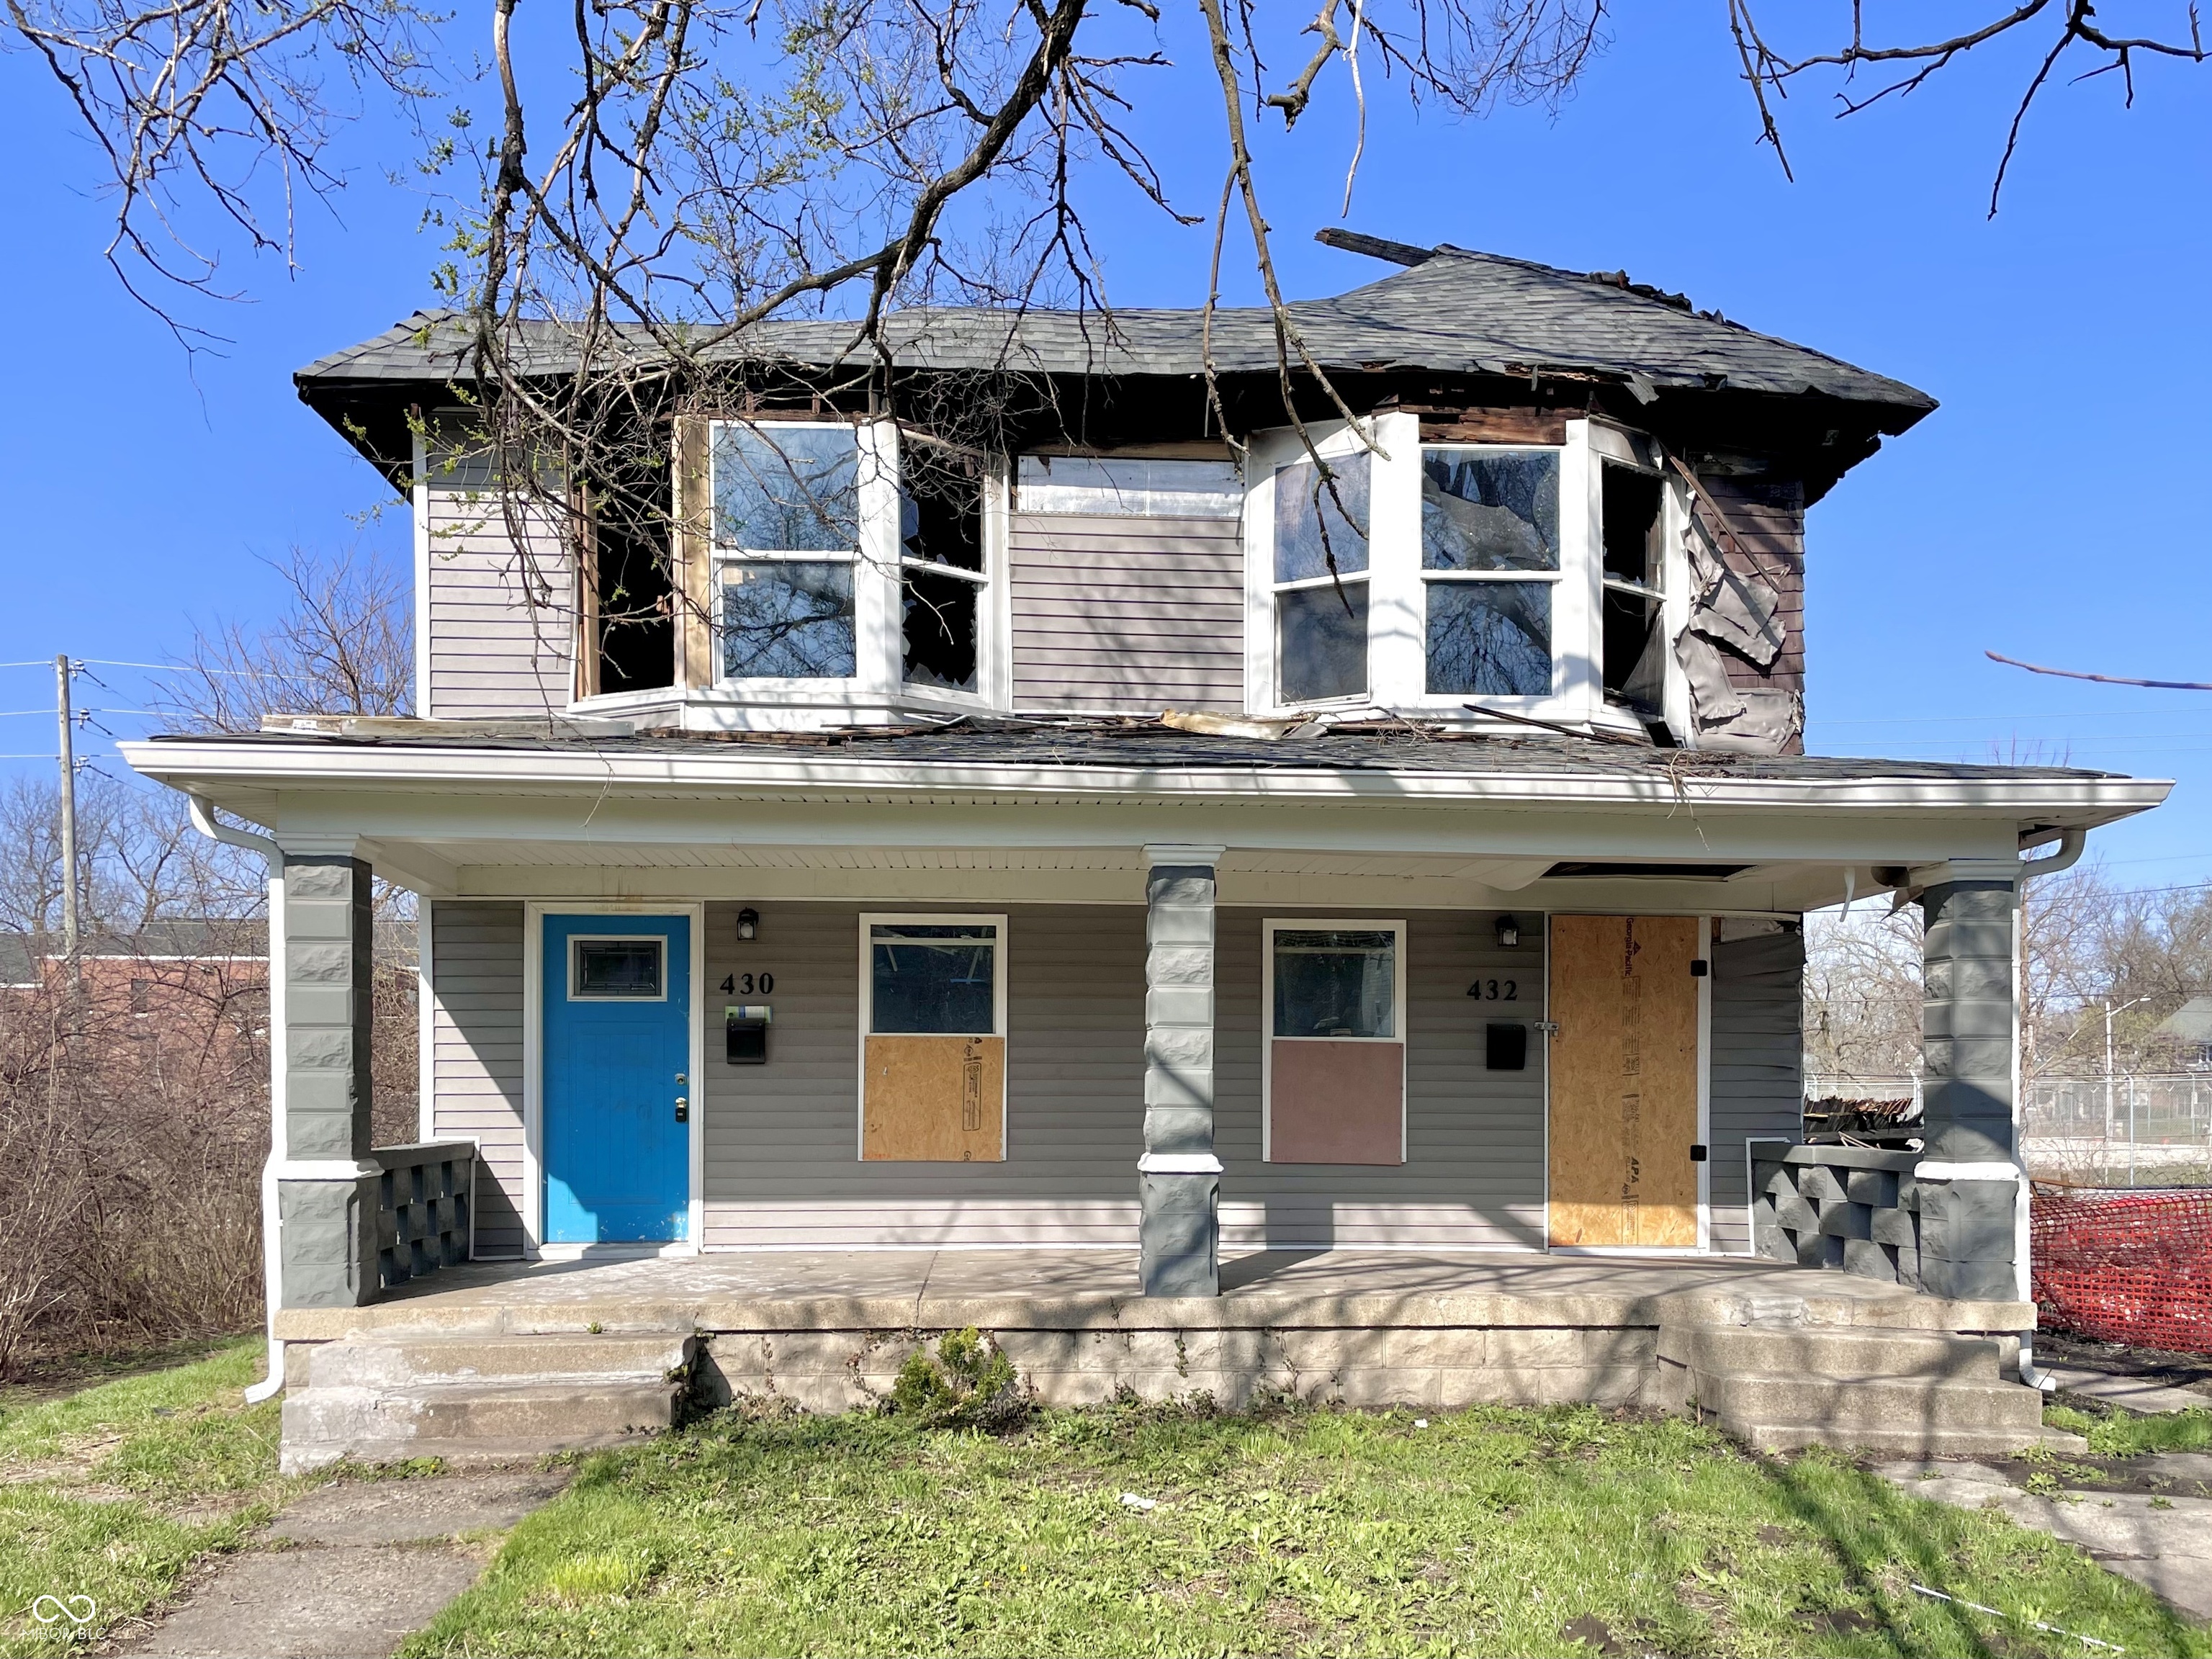
$57,800
bds
|
0
ba
|
0
sqft
|
built
1899
432 N Hamilton Ave, Indianapolis, IN 46201
$1,104
Cash flow
22.3%
Cash-on-Cash Return
22.9%
Cap rate
2.8%
Rent to Value Ratio
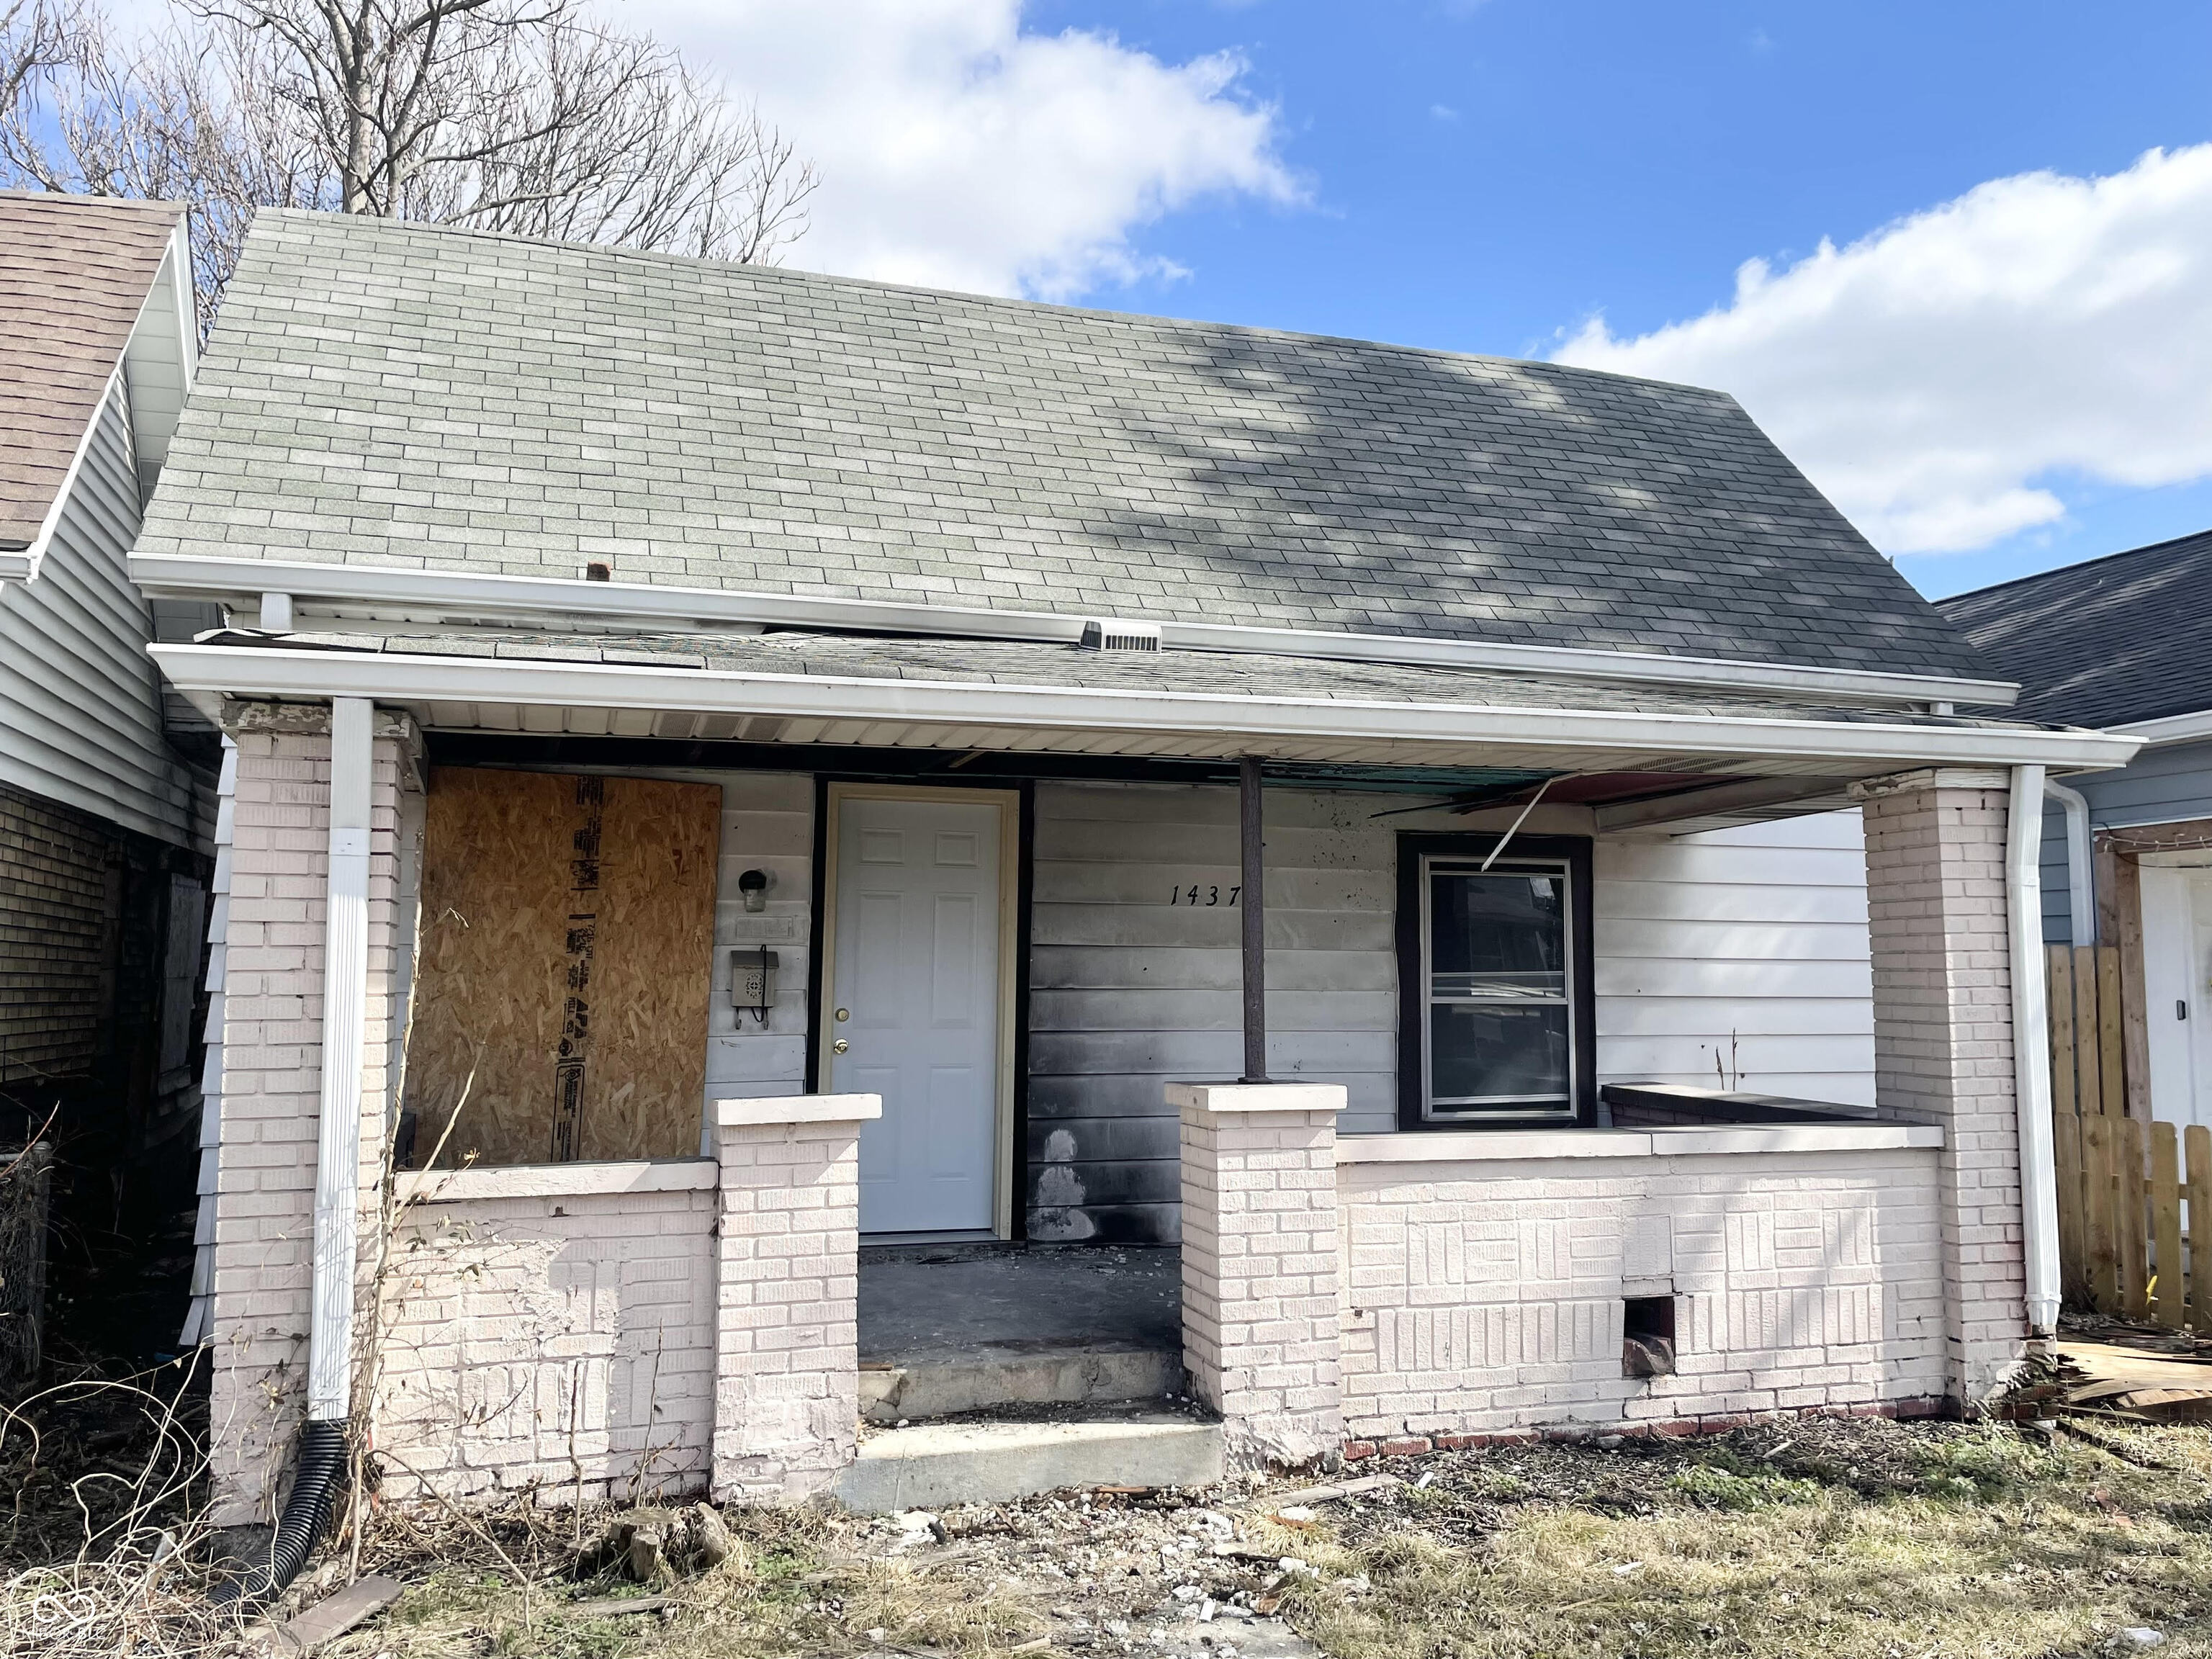
Pending
$49,900
2
bds
|
1
ba
|
728
sqft
|
built
1955
1437 Kappes St, Indianapolis, IN 46221
$966
Cash flow
22.6%
Cash-on-Cash Return
23.2%
Cap rate
2.8%
Rent to Value Ratio
1,993 out of 2,135 properties for sale in Indianapolis, IN
Limited Results Shown
Create a free account, or log in to reveal all property listings and enjoy the complete experience.
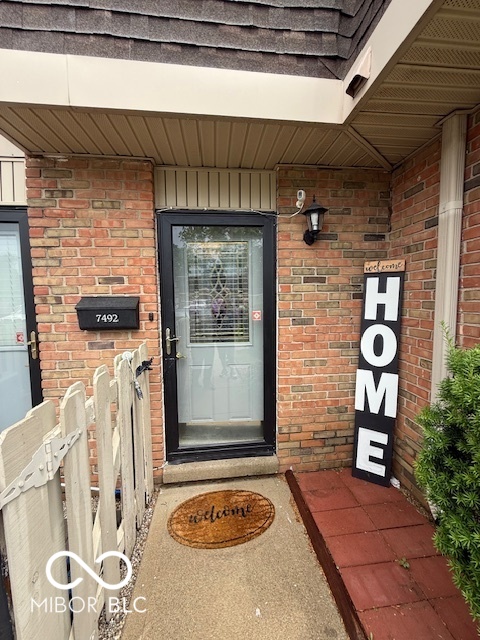
Pending
$134,900
2
bds
|
2
ba
|
1,216
sqft
|
built
1966
7492 Country Brook Dr, Indianapolis, IN 46260
$54
Cash flow
2.1%
Cash-on-Cash Return
6.6%
Cap rate
1.2%
Rent to Value Ratio
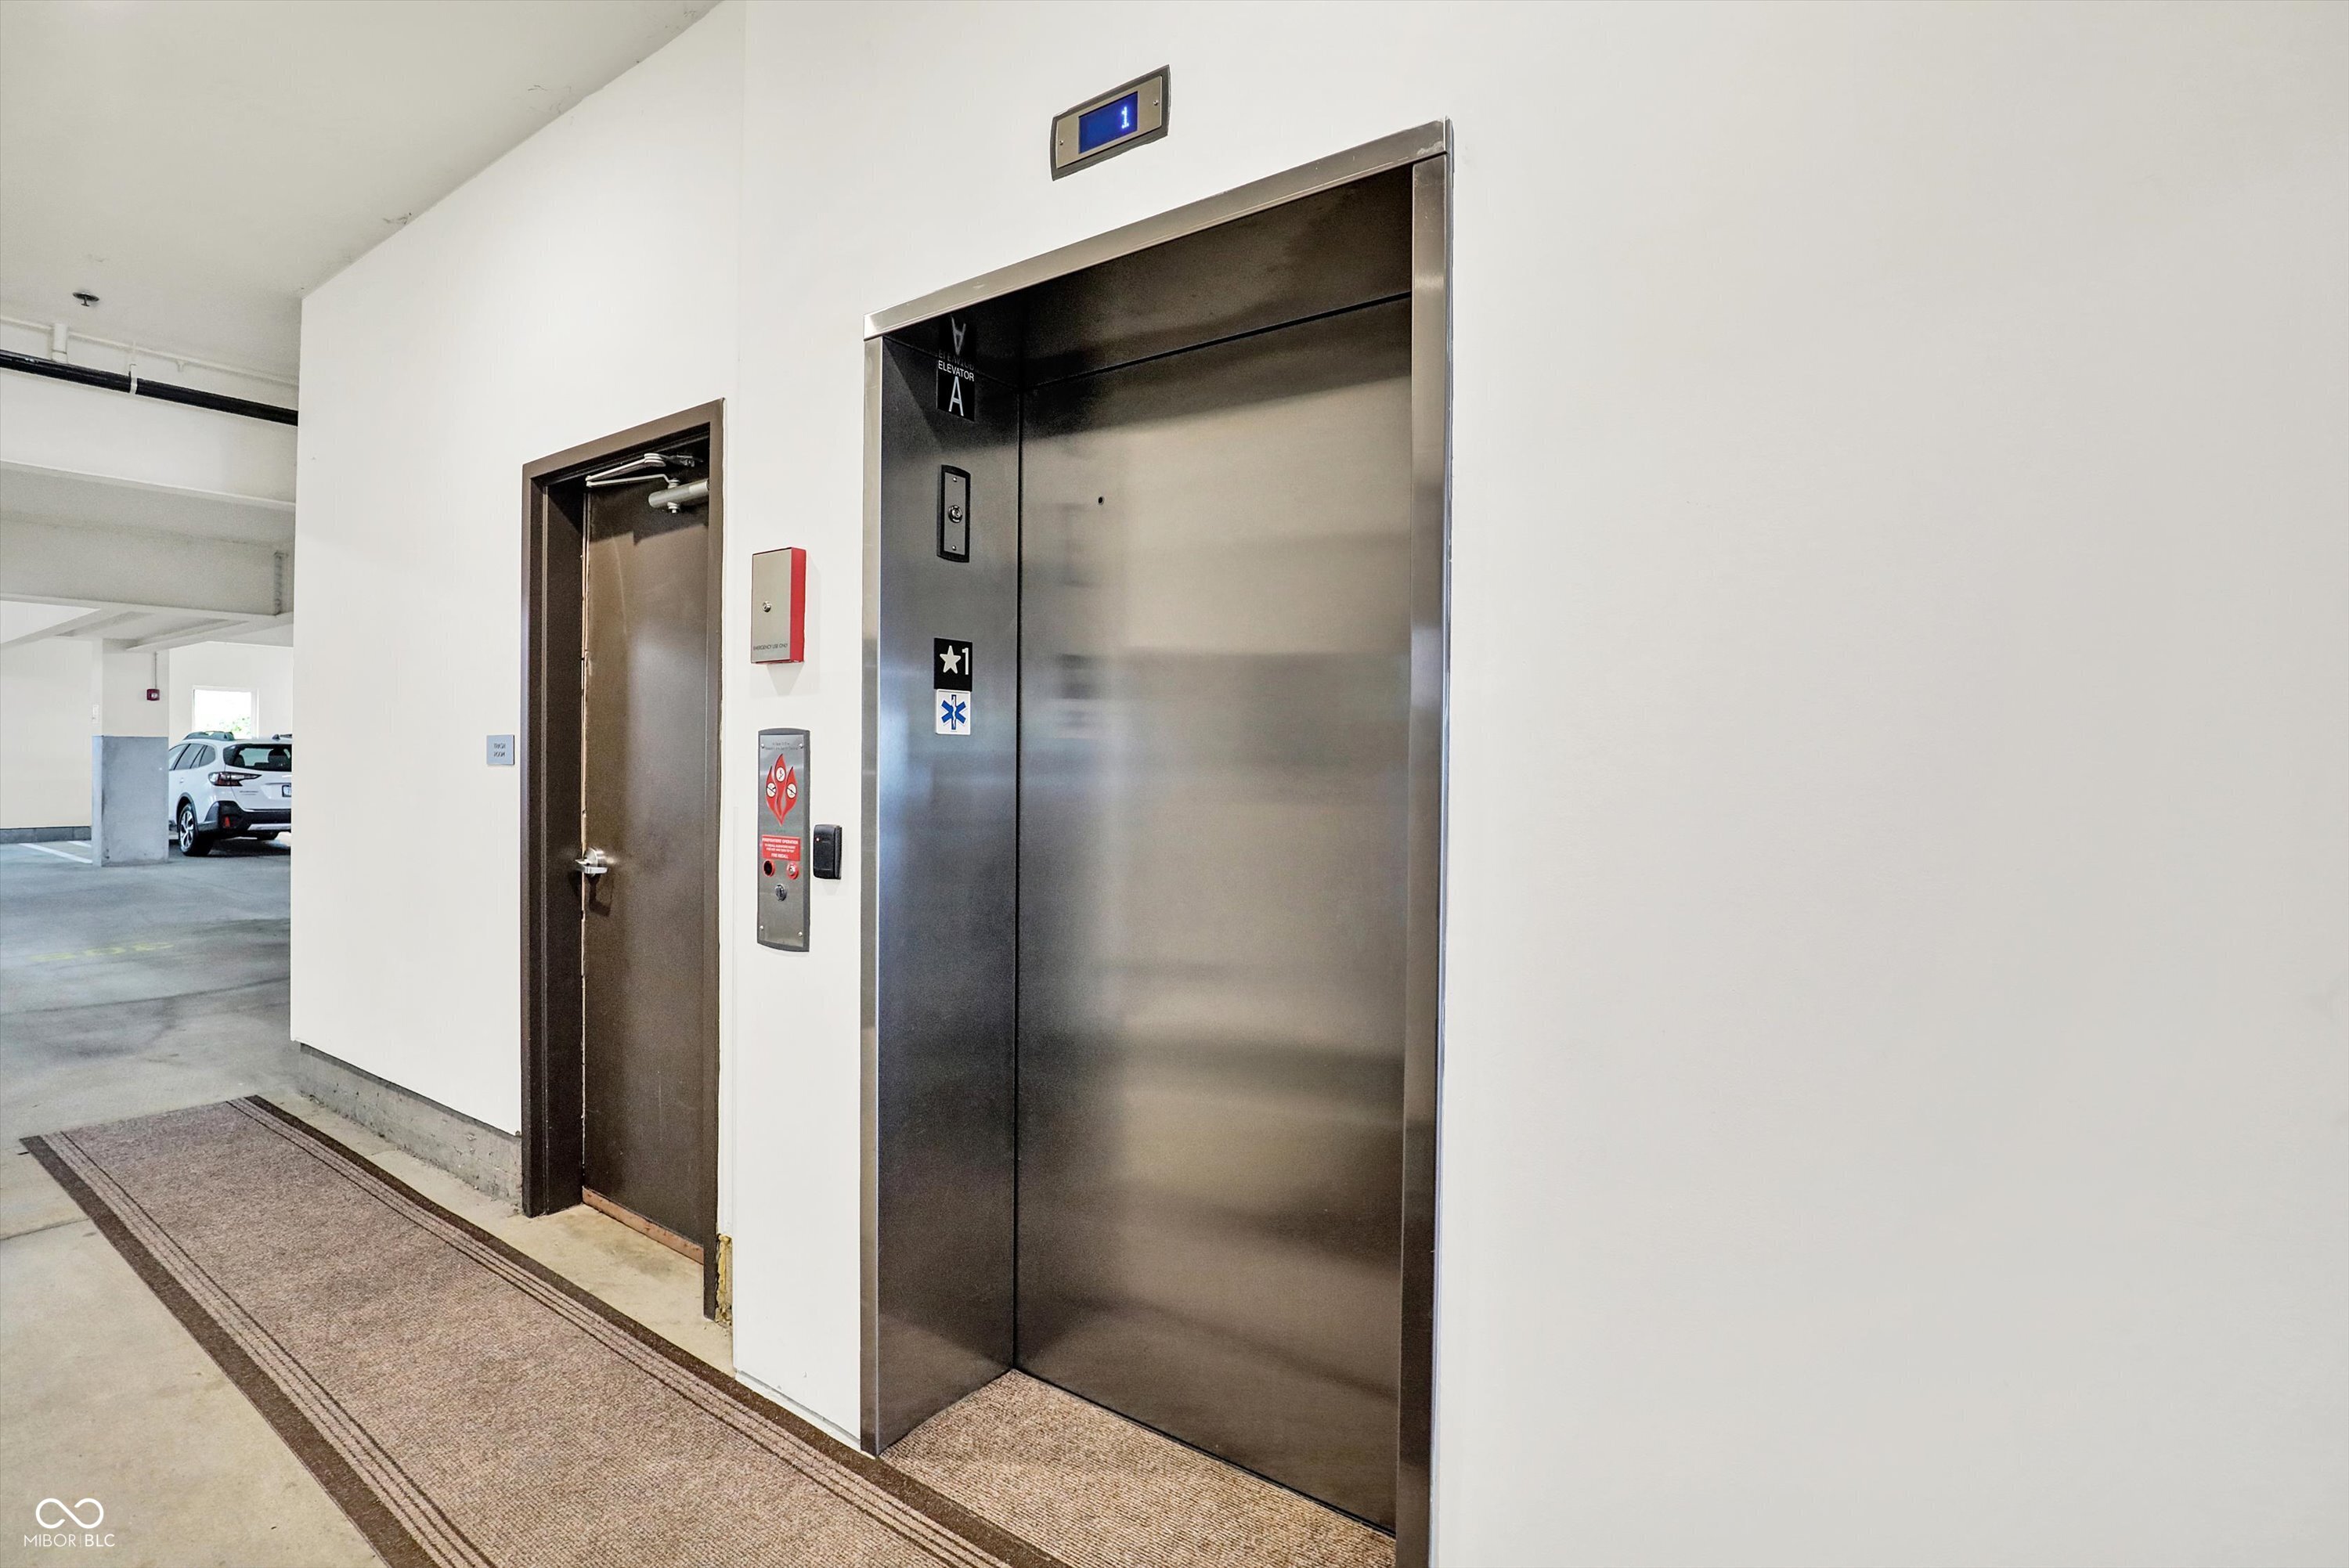
Pending
$299,000
1
bds
|
1
ba
|
981
sqft
|
built
2015
622 E 10th St, Indianapolis, IN 46202
$-543
Cash flow
-9.5%
Cash-on-Cash Return
4.0%
Cap rate
0.7%
Rent to Value Ratio
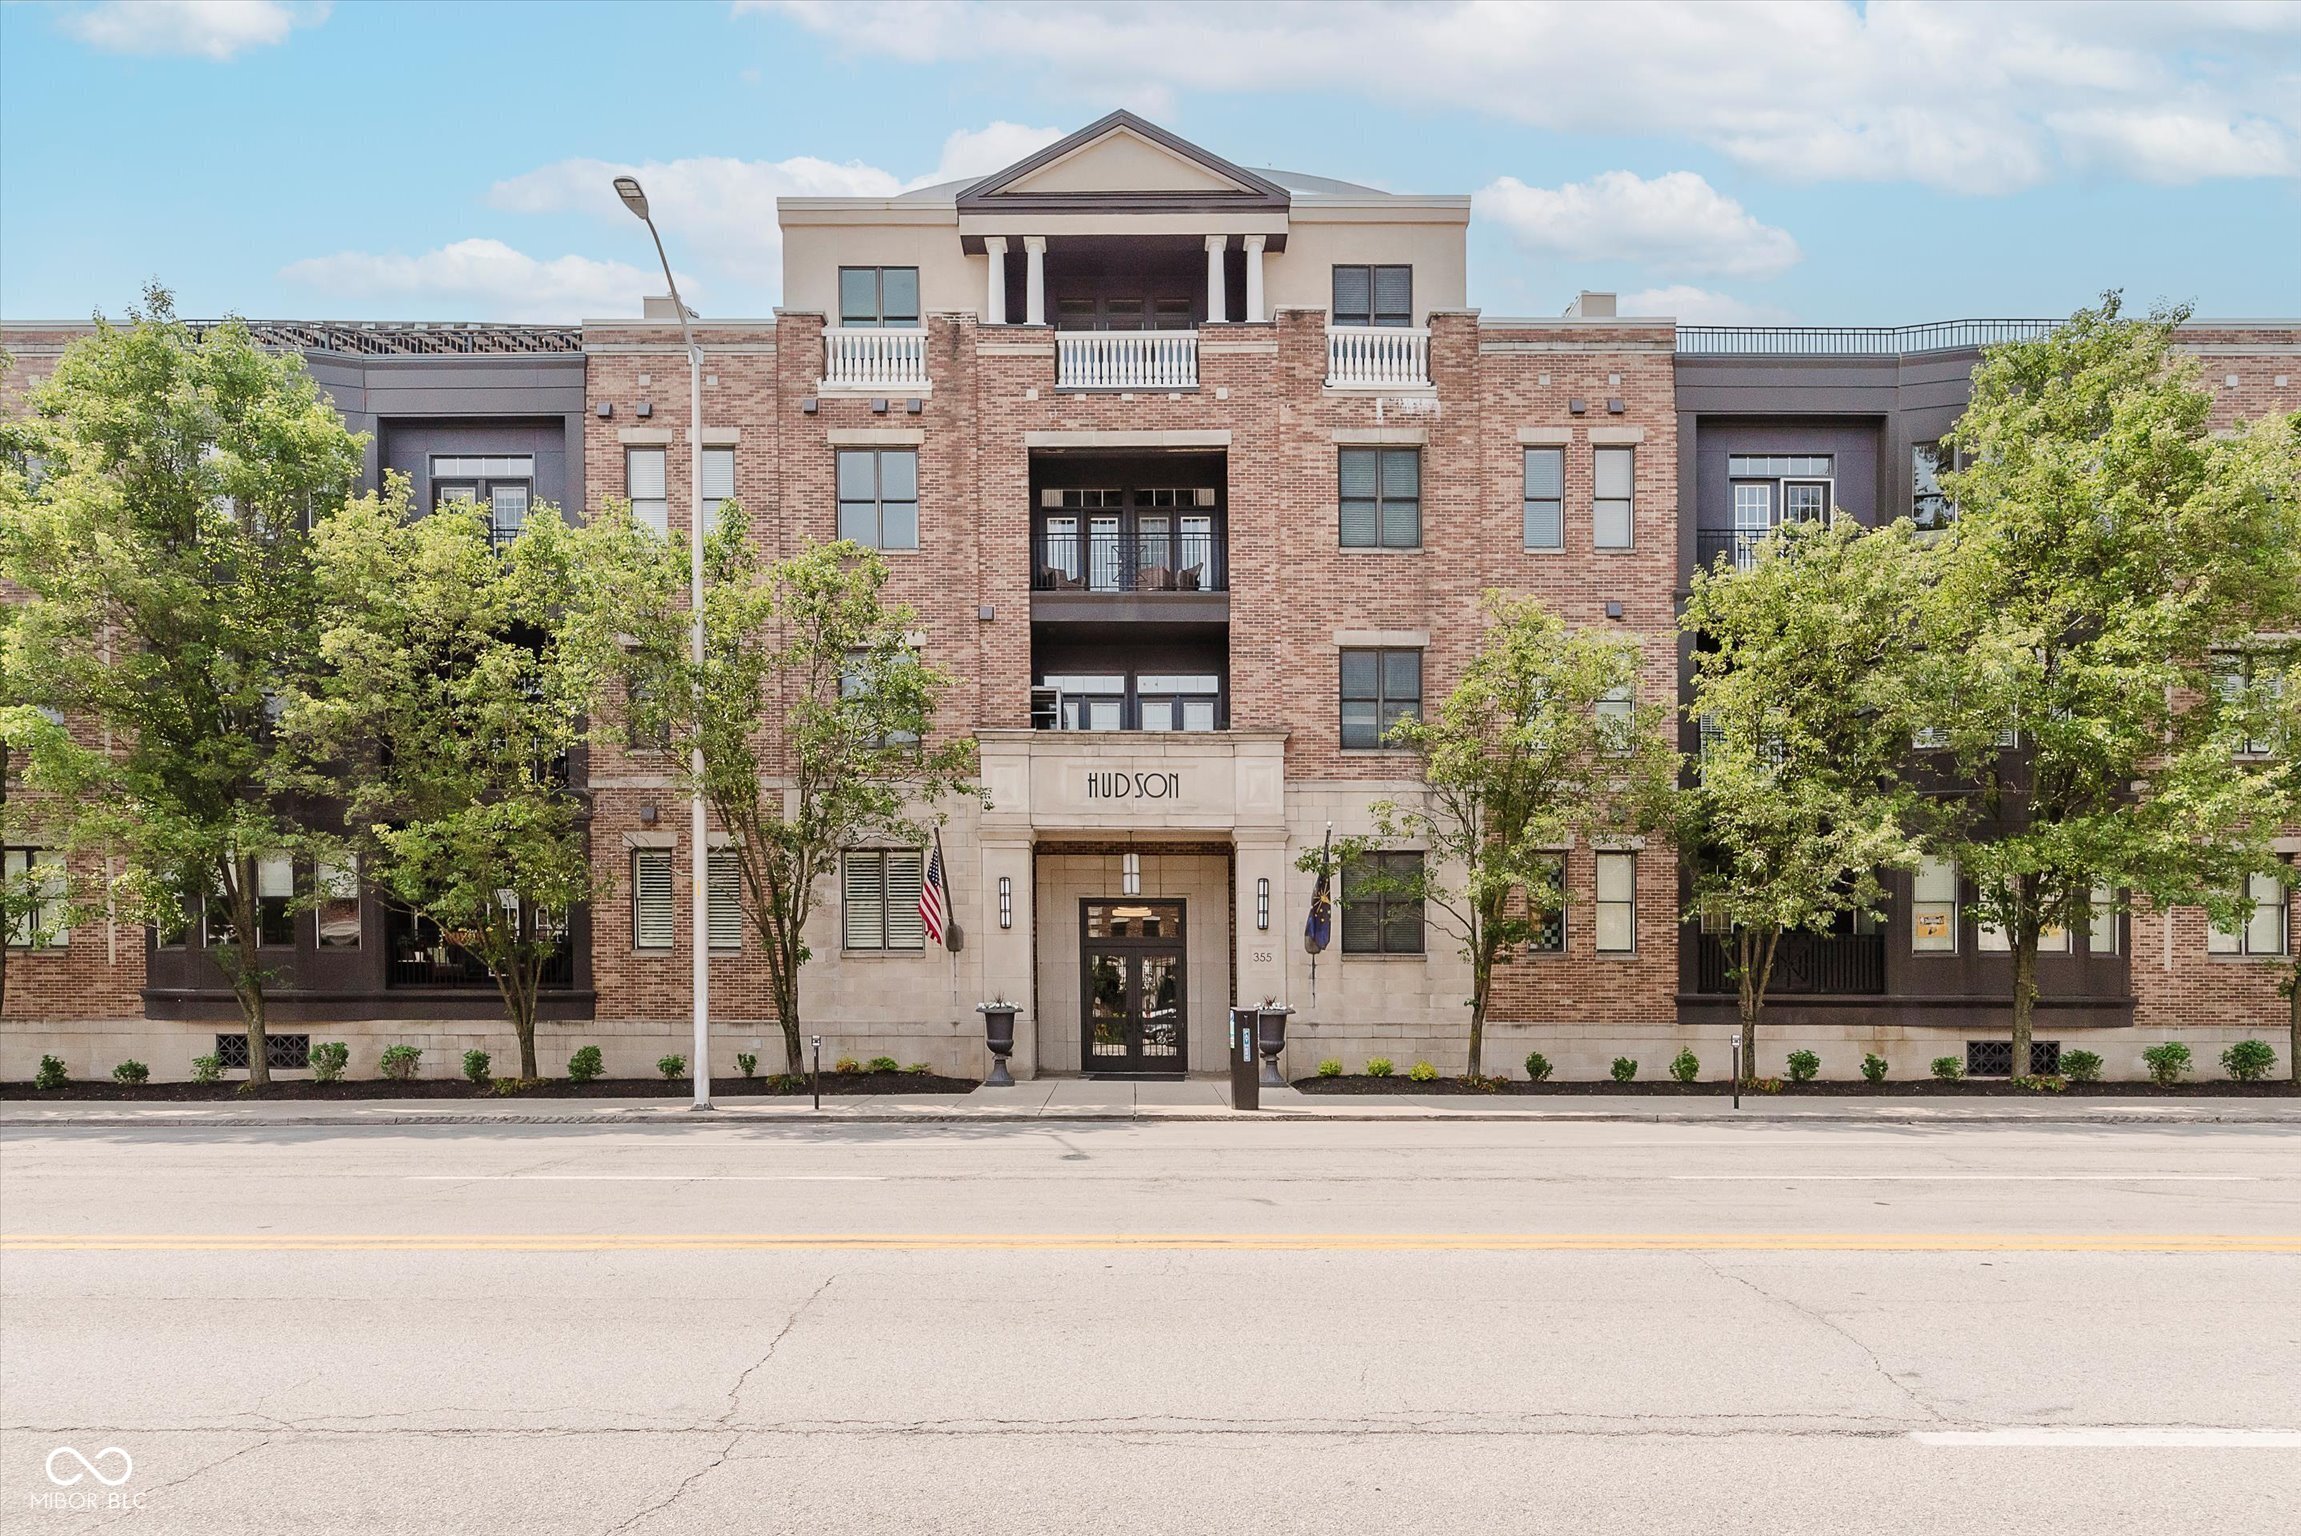
Active
$254,900
1
bds
|
2
ba
|
882
sqft
|
built
2006
355 E Ohio St, Indianapolis, IN 46204
$-507
Cash flow
-10.4%
Cash-on-Cash Return
3.8%
Cap rate
0.6%
Rent to Value Ratio
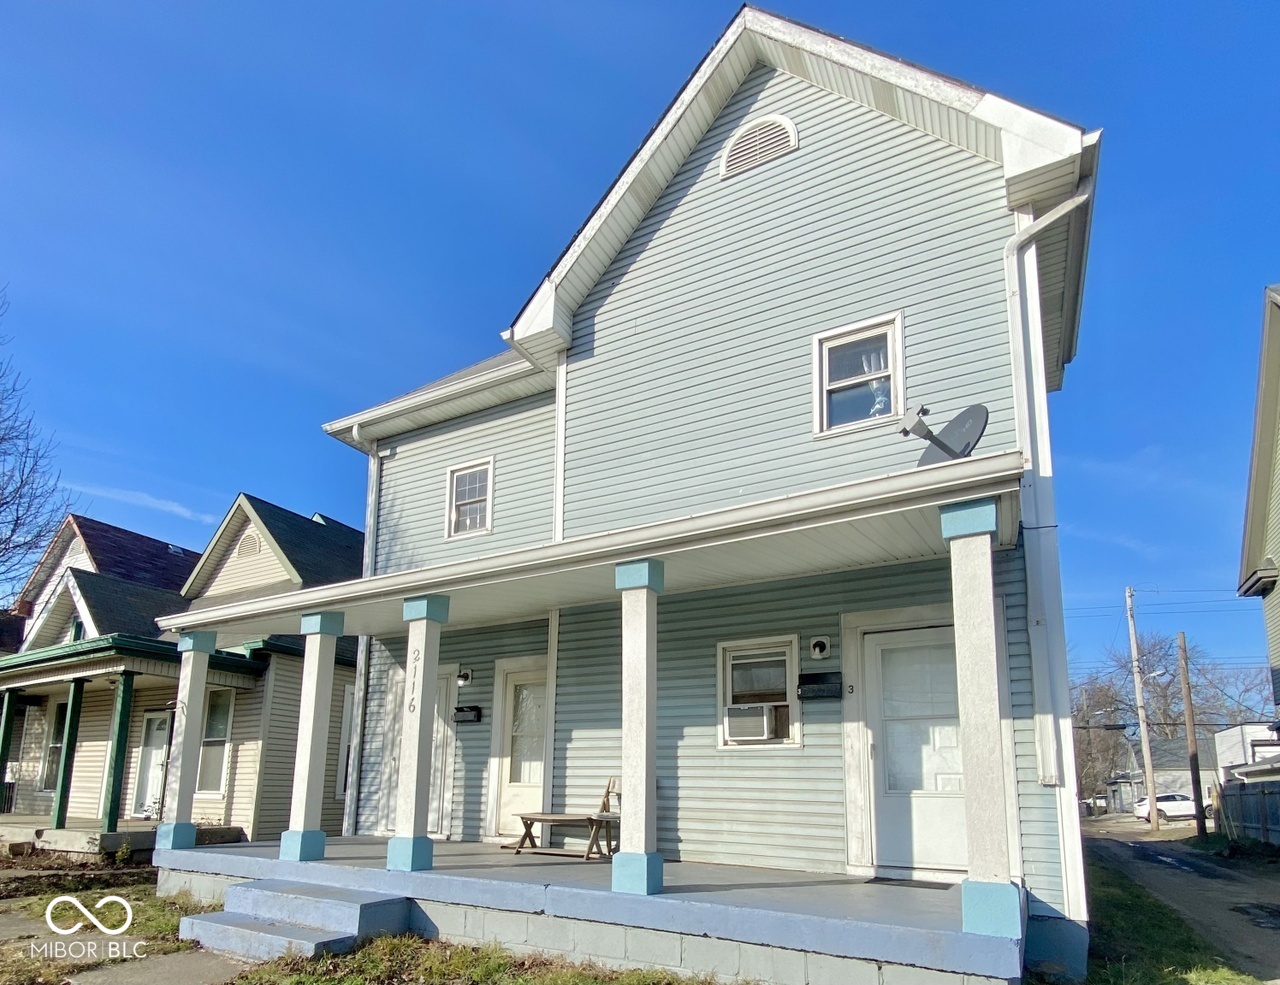
Pending
$299,900
2
bds
|
0
ba
|
0
sqft
|
built
1895
2116 Prospect St, Indianapolis, IN 46203
$-708
Cash flow
-12.3%
Cash-on-Cash Return
3.3%
Cap rate
0.4%
Rent to Value Ratio
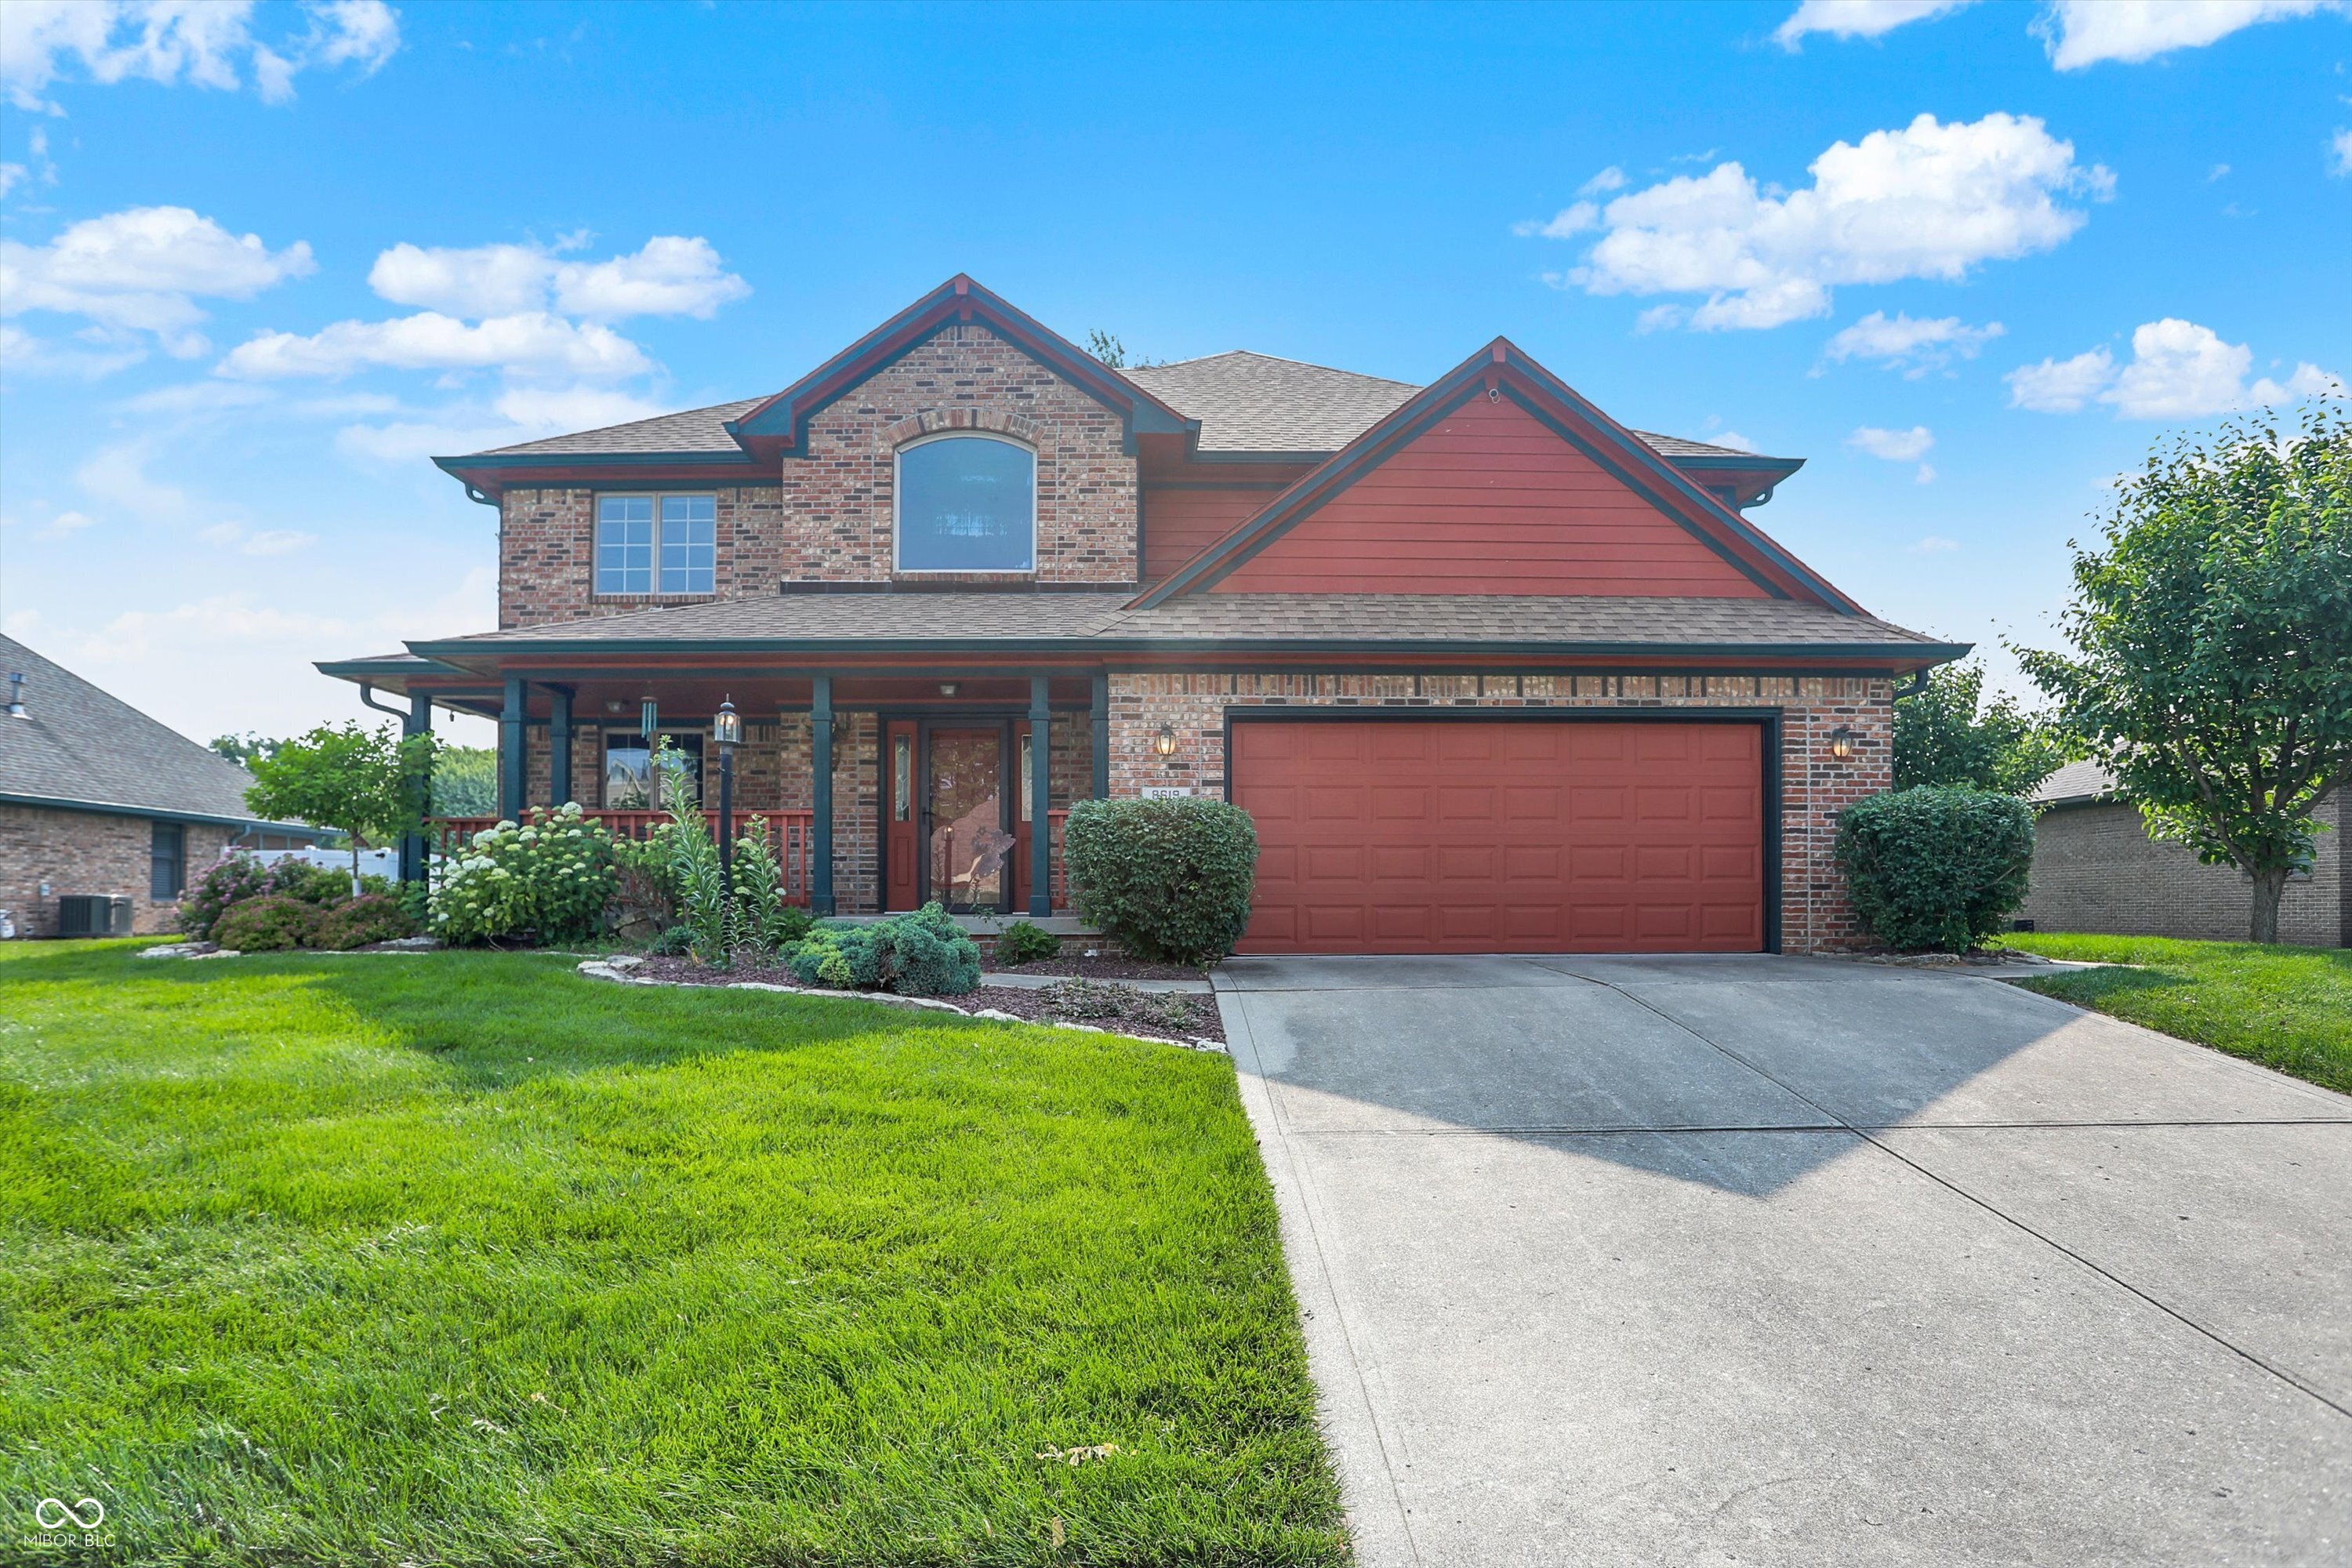
Pending
$449,000
4
bds
|
4
ba
|
2,670
sqft
|
built
1994
8619 Wrangler Ct, Indianapolis, IN 46217
$-782
Cash flow
-9.1%
Cash-on-Cash Return
4.1%
Cap rate
0.5%
Rent to Value Ratio
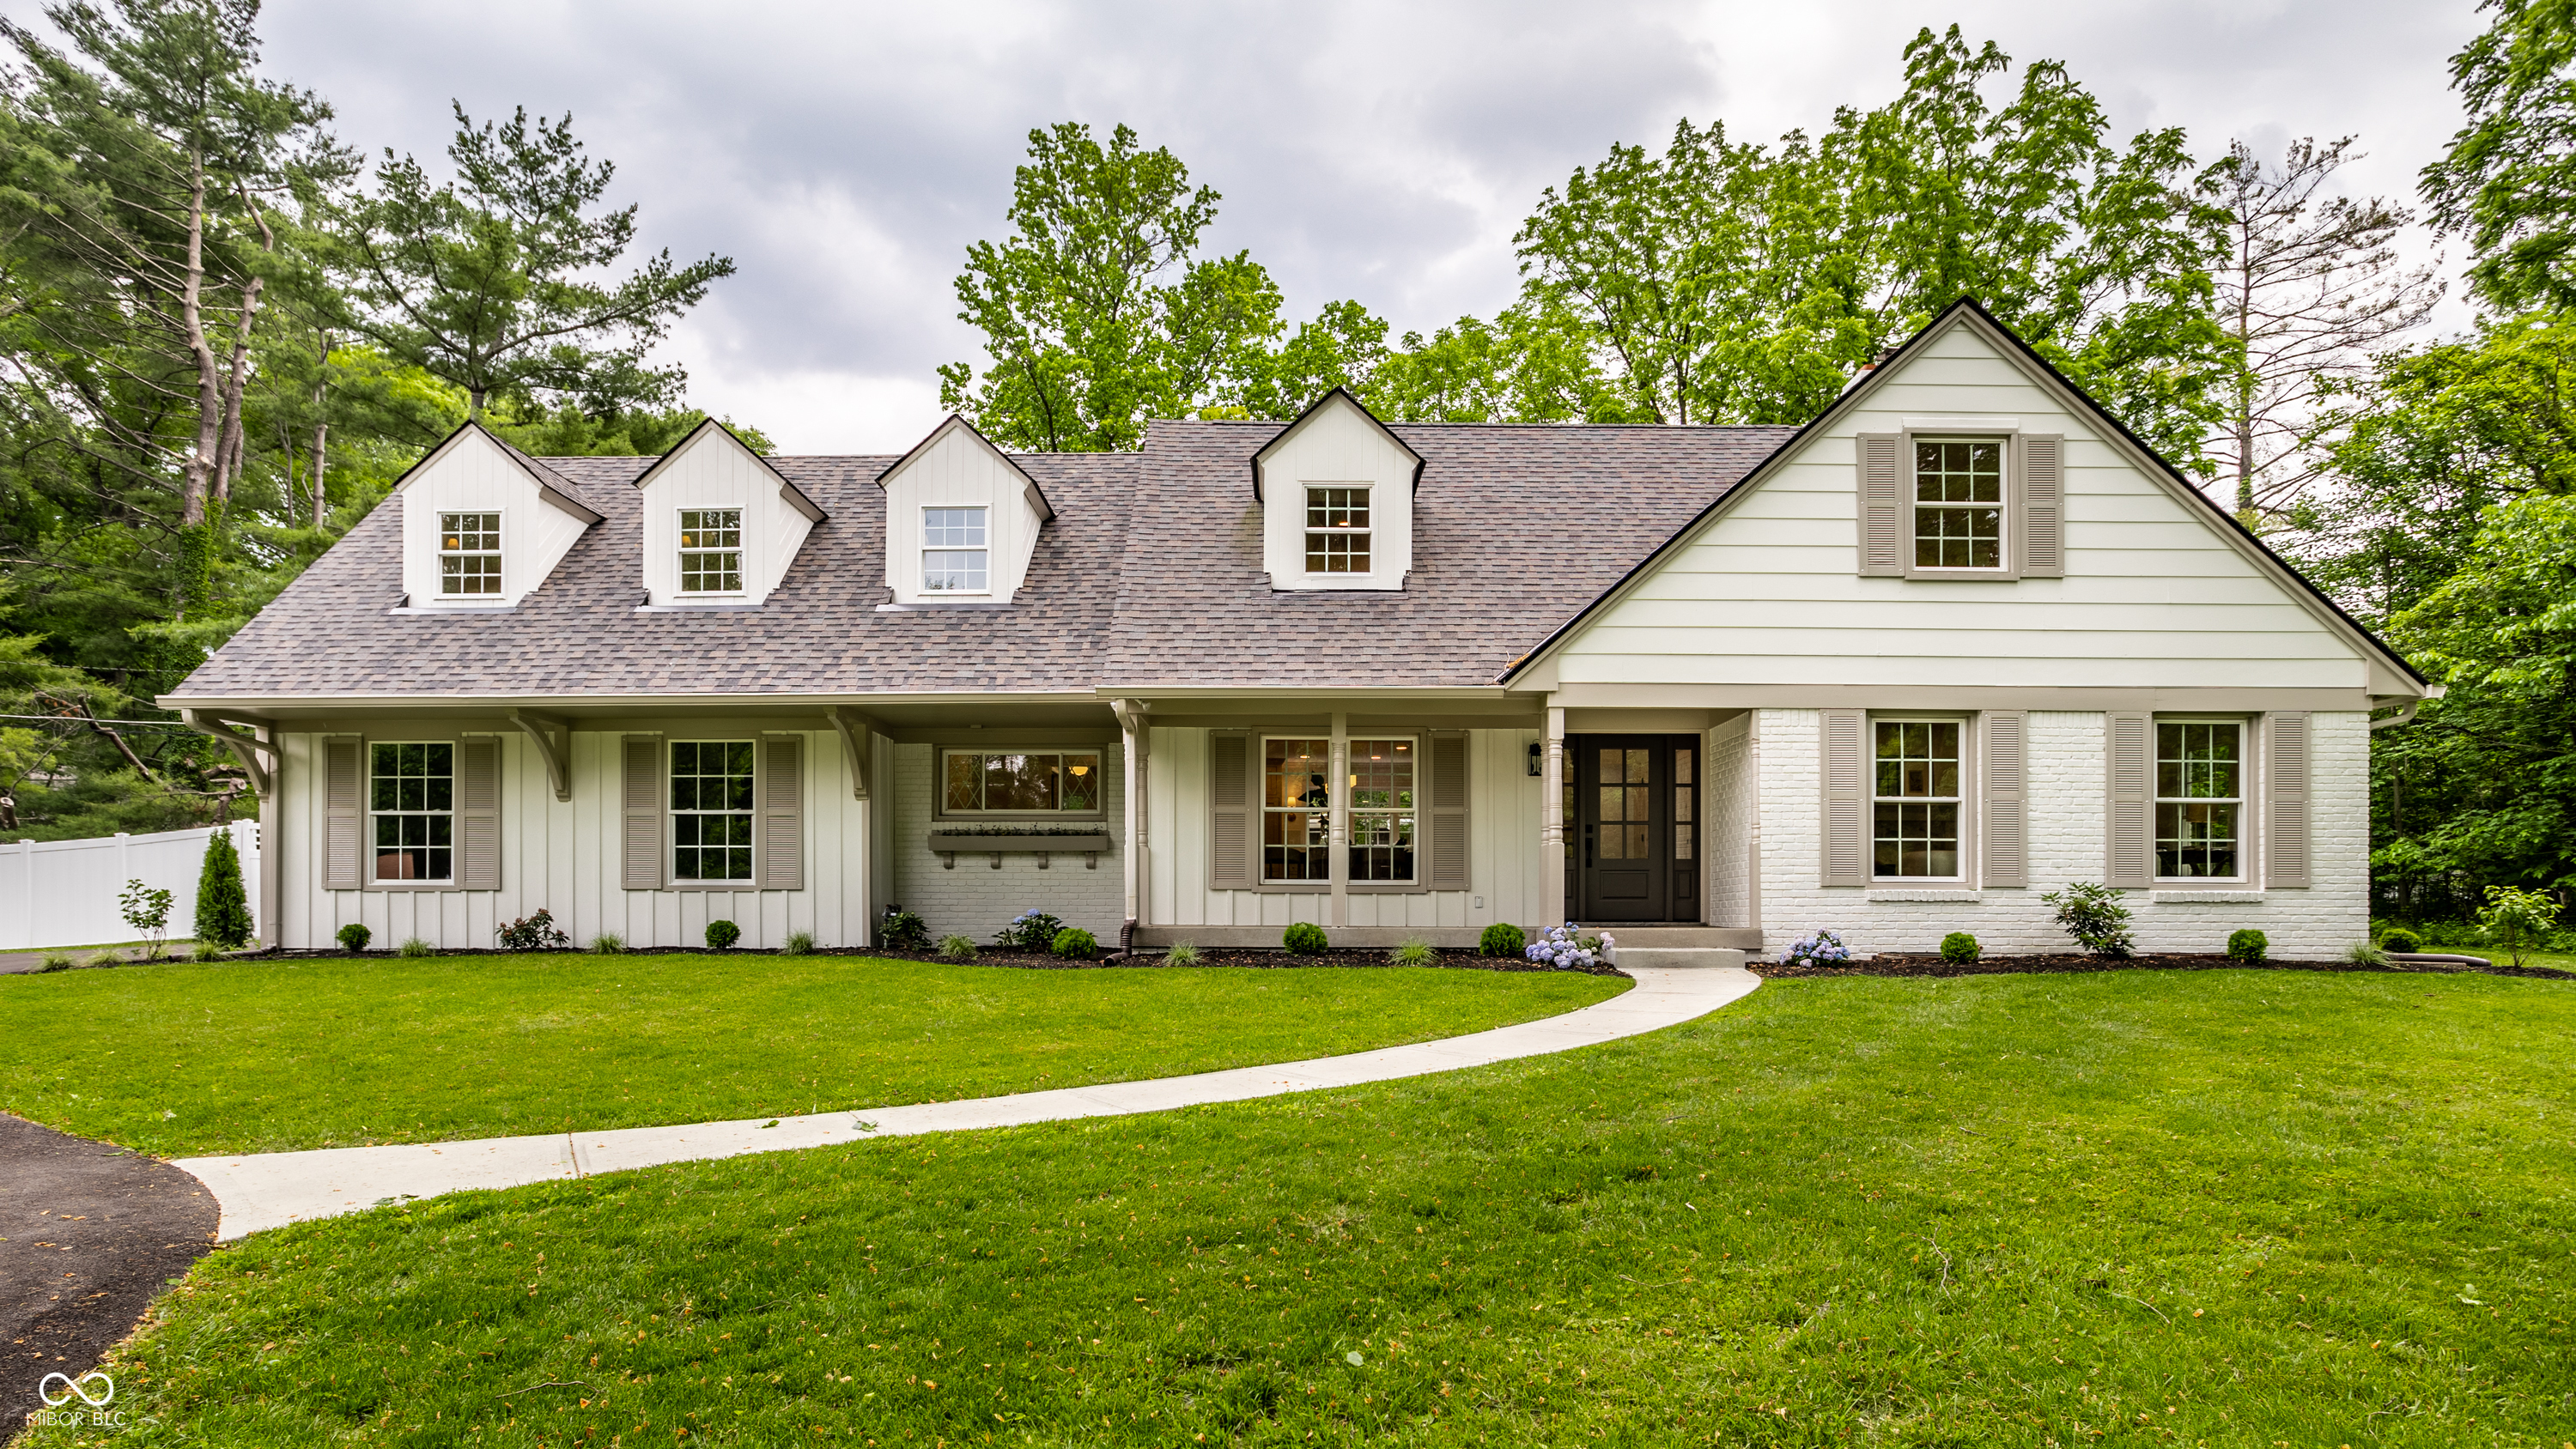
Active
$1,125,000
5
bds
|
4
ba
|
4,410
sqft
|
built
1967
7105 Sylvan Ridge Rd, Indianapolis, IN 46240
$-3,844
Cash flow
-17.8%
Cash-on-Cash Return
2.0%
Cap rate
0.2%
Rent to Value Ratio
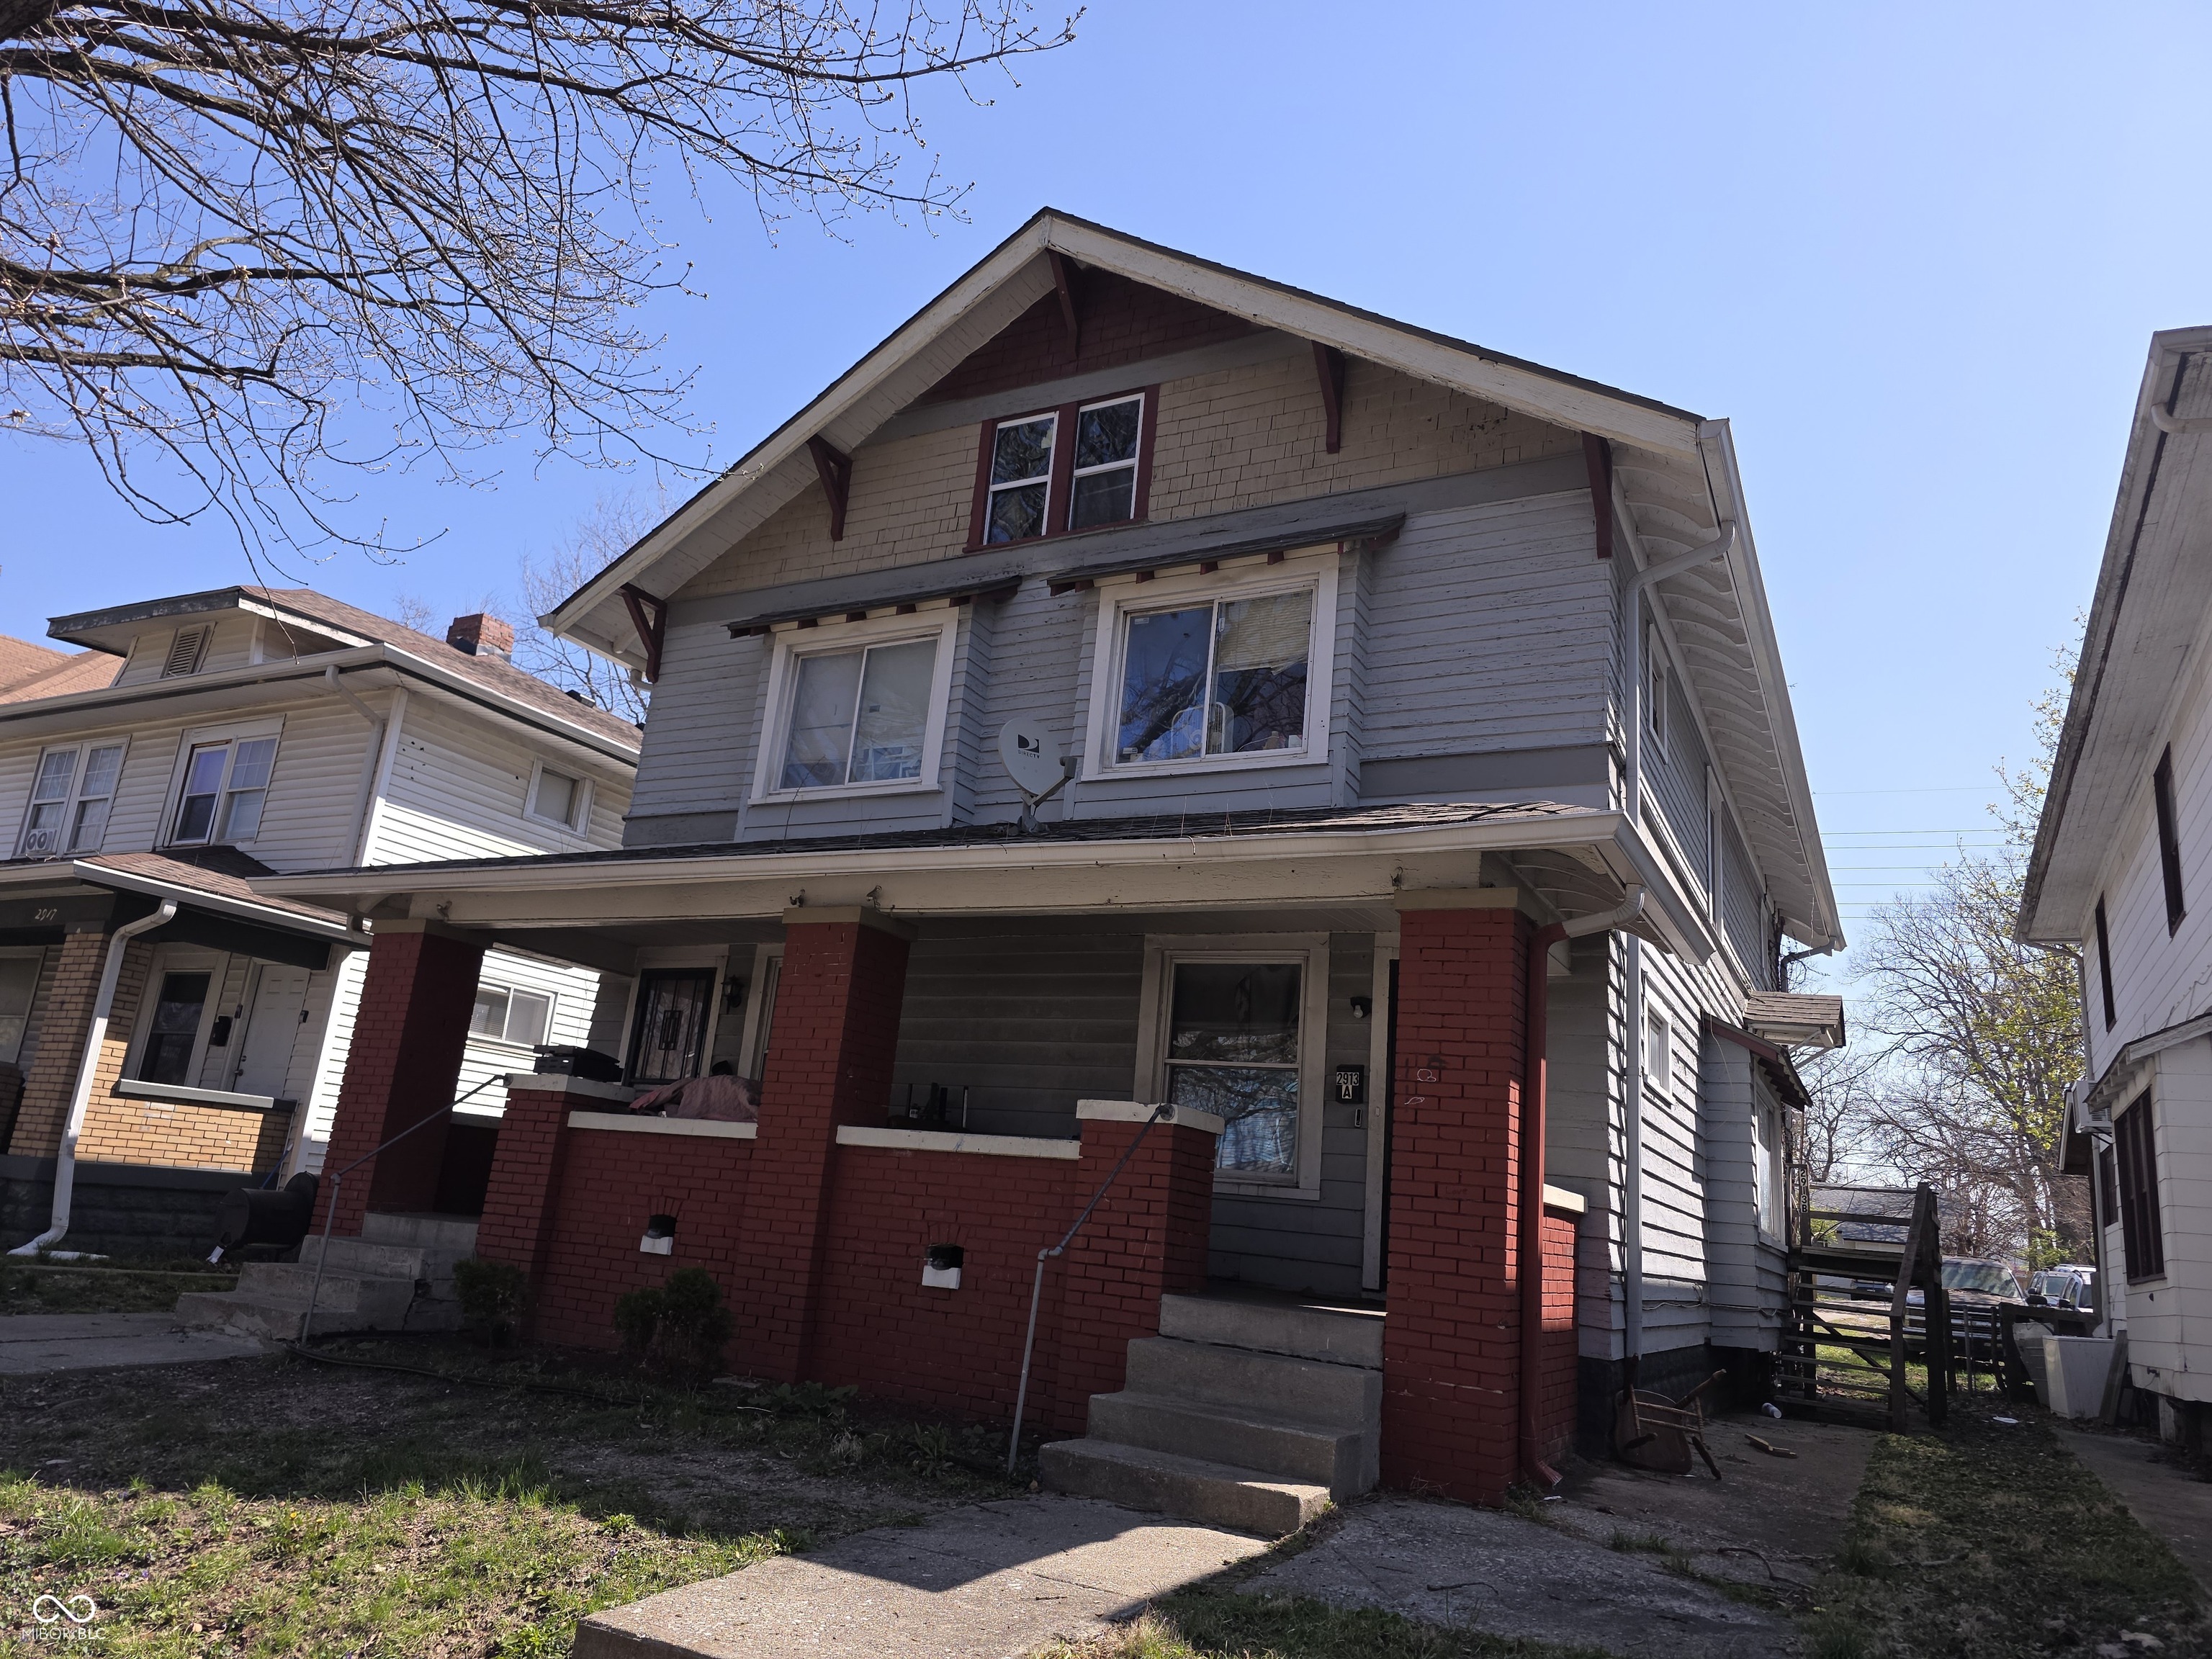
Active
$185,000
0
bds
|
0
ba
|
0
sqft
|
built
1917
2913 Boulevard Pl, Indianapolis, IN 46208
$-120
Cash flow
-3.4%
Cash-on-Cash Return
5.4%
Cap rate
0.6%
Rent to Value Ratio
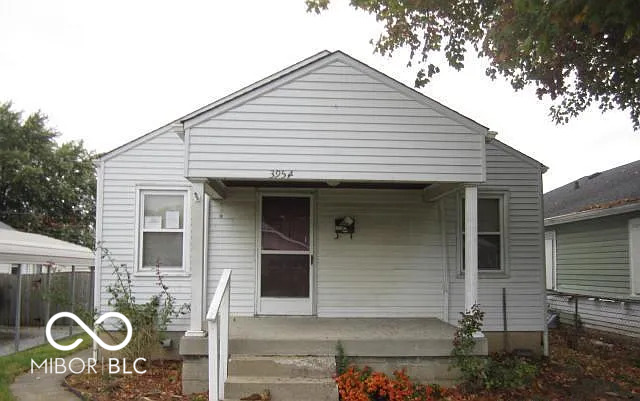
Active
$119,000
2
bds
|
1
ba
|
979
sqft
|
built
1948
3954 Fletcher Ave, Indianapolis, IN 46203
$218
Cash flow
9.6%
Cash-on-Cash Return
8.3%
Cap rate
1.0%
Rent to Value Ratio
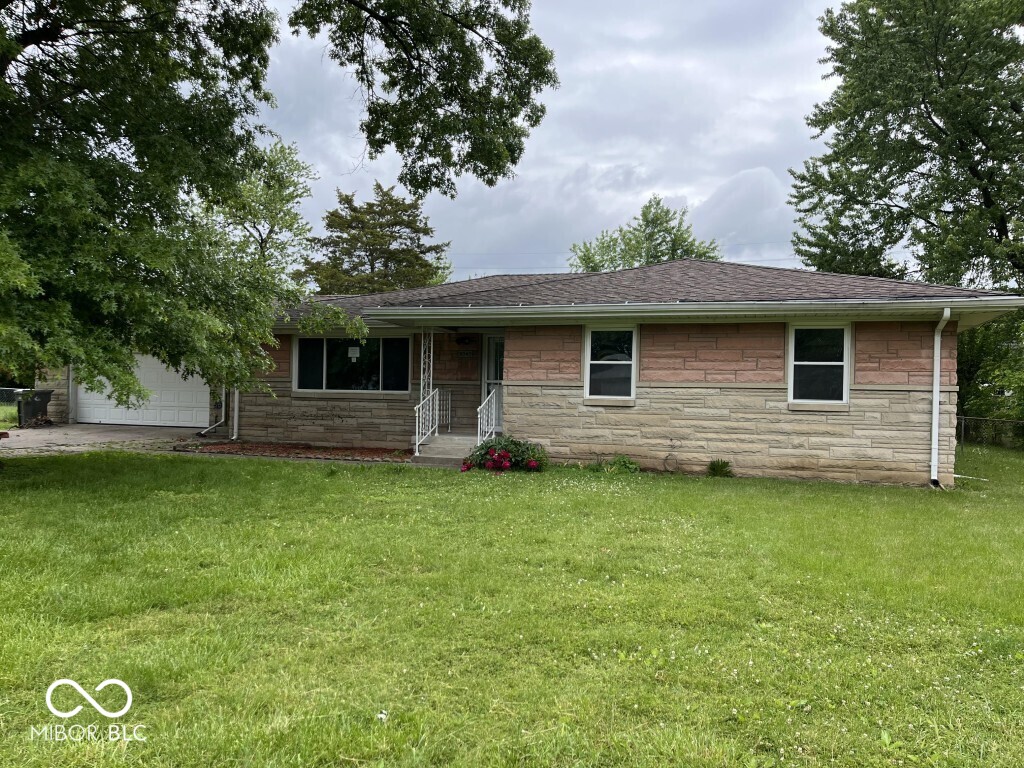
Active
$264,900
3
bds
|
2
ba
|
1,776
sqft
|
built
1958
8045 Briarwood Dr, Indianapolis, IN 46227
$-115
Cash flow
-2.3%
Cash-on-Cash Return
5.6%
Cap rate
0.7%
Rent to Value Ratio
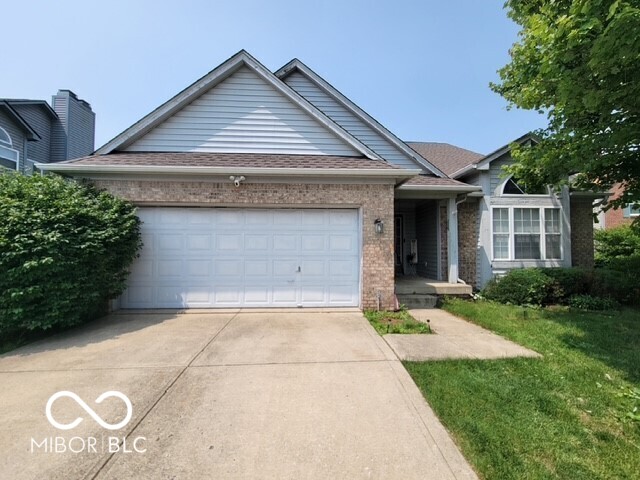
Active
$379,900
3
bds
|
4
ba
|
3,528
sqft
|
built
1996
3714 Turfway Ct, Indianapolis, IN 46228
$-183
Cash flow
-2.5%
Cash-on-Cash Return
5.6%
Cap rate
0.7%
Rent to Value Ratio
Active
$779,900
5
bds
|
3
ba
|
4,078
sqft
|
built
1972
6337 Cardinal Ln, Indianapolis, IN 46220
$-2,063
Cash flow
-13.8%
Cash-on-Cash Return
3.0%
Cap rate
0.4%
Rent to Value Ratio
Pending
$280,000
3
bds
|
2
ba
|
2,317
sqft
|
built
2002
10712 Cardinal Cir, Indianapolis, IN 46231
$-152
Cash flow
-2.8%
Cash-on-Cash Return
5.5%
Cap rate
0.7%
Rent to Value Ratio
Active
$216,000
3
bds
|
2
ba
|
1,586
sqft
|
built
1999
3149 Carson Ave, Indianapolis, IN 46227
$-71
Cash flow
-1.7%
Cash-on-Cash Return
5.8%
Cap rate
0.7%
Rent to Value Ratio
Active
$649,900
3
bds
|
3
ba
|
2,607
sqft
|
built
1986
8429 Catamaran Dr, Indianapolis, IN 46236
$-337
Cash flow
-2.7%
Cash-on-Cash Return
5.5%
Cap rate
0.7%
Rent to Value Ratio
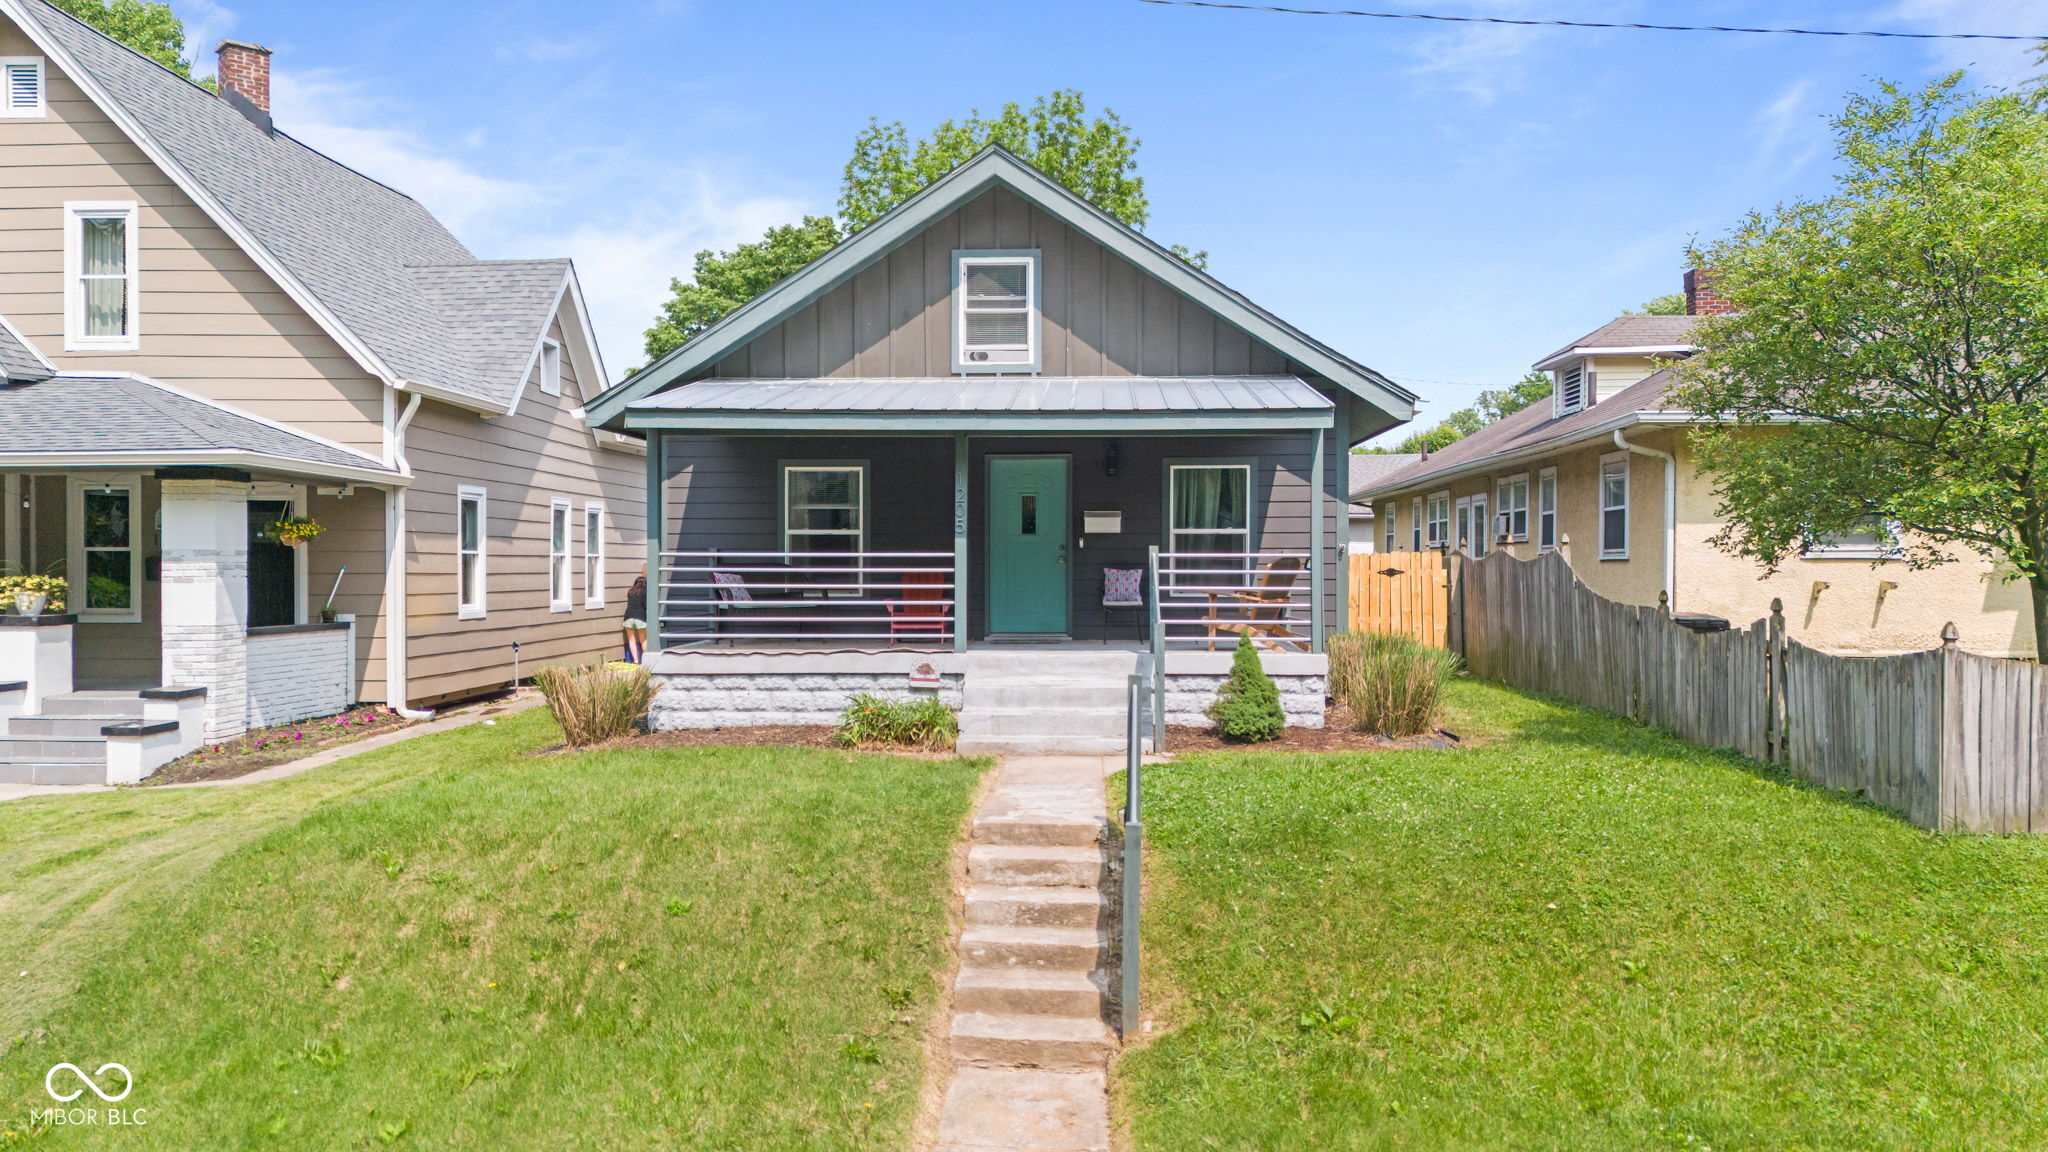
Active
$329,000
3
bds
|
2
ba
|
1,575
sqft
|
built
1910
1205 N Temple Ave, Indianapolis, IN 46201
$40
Cash flow
0.6%
Cash-on-Cash Return
6.3%
Cap rate
0.8%
Rent to Value Ratio
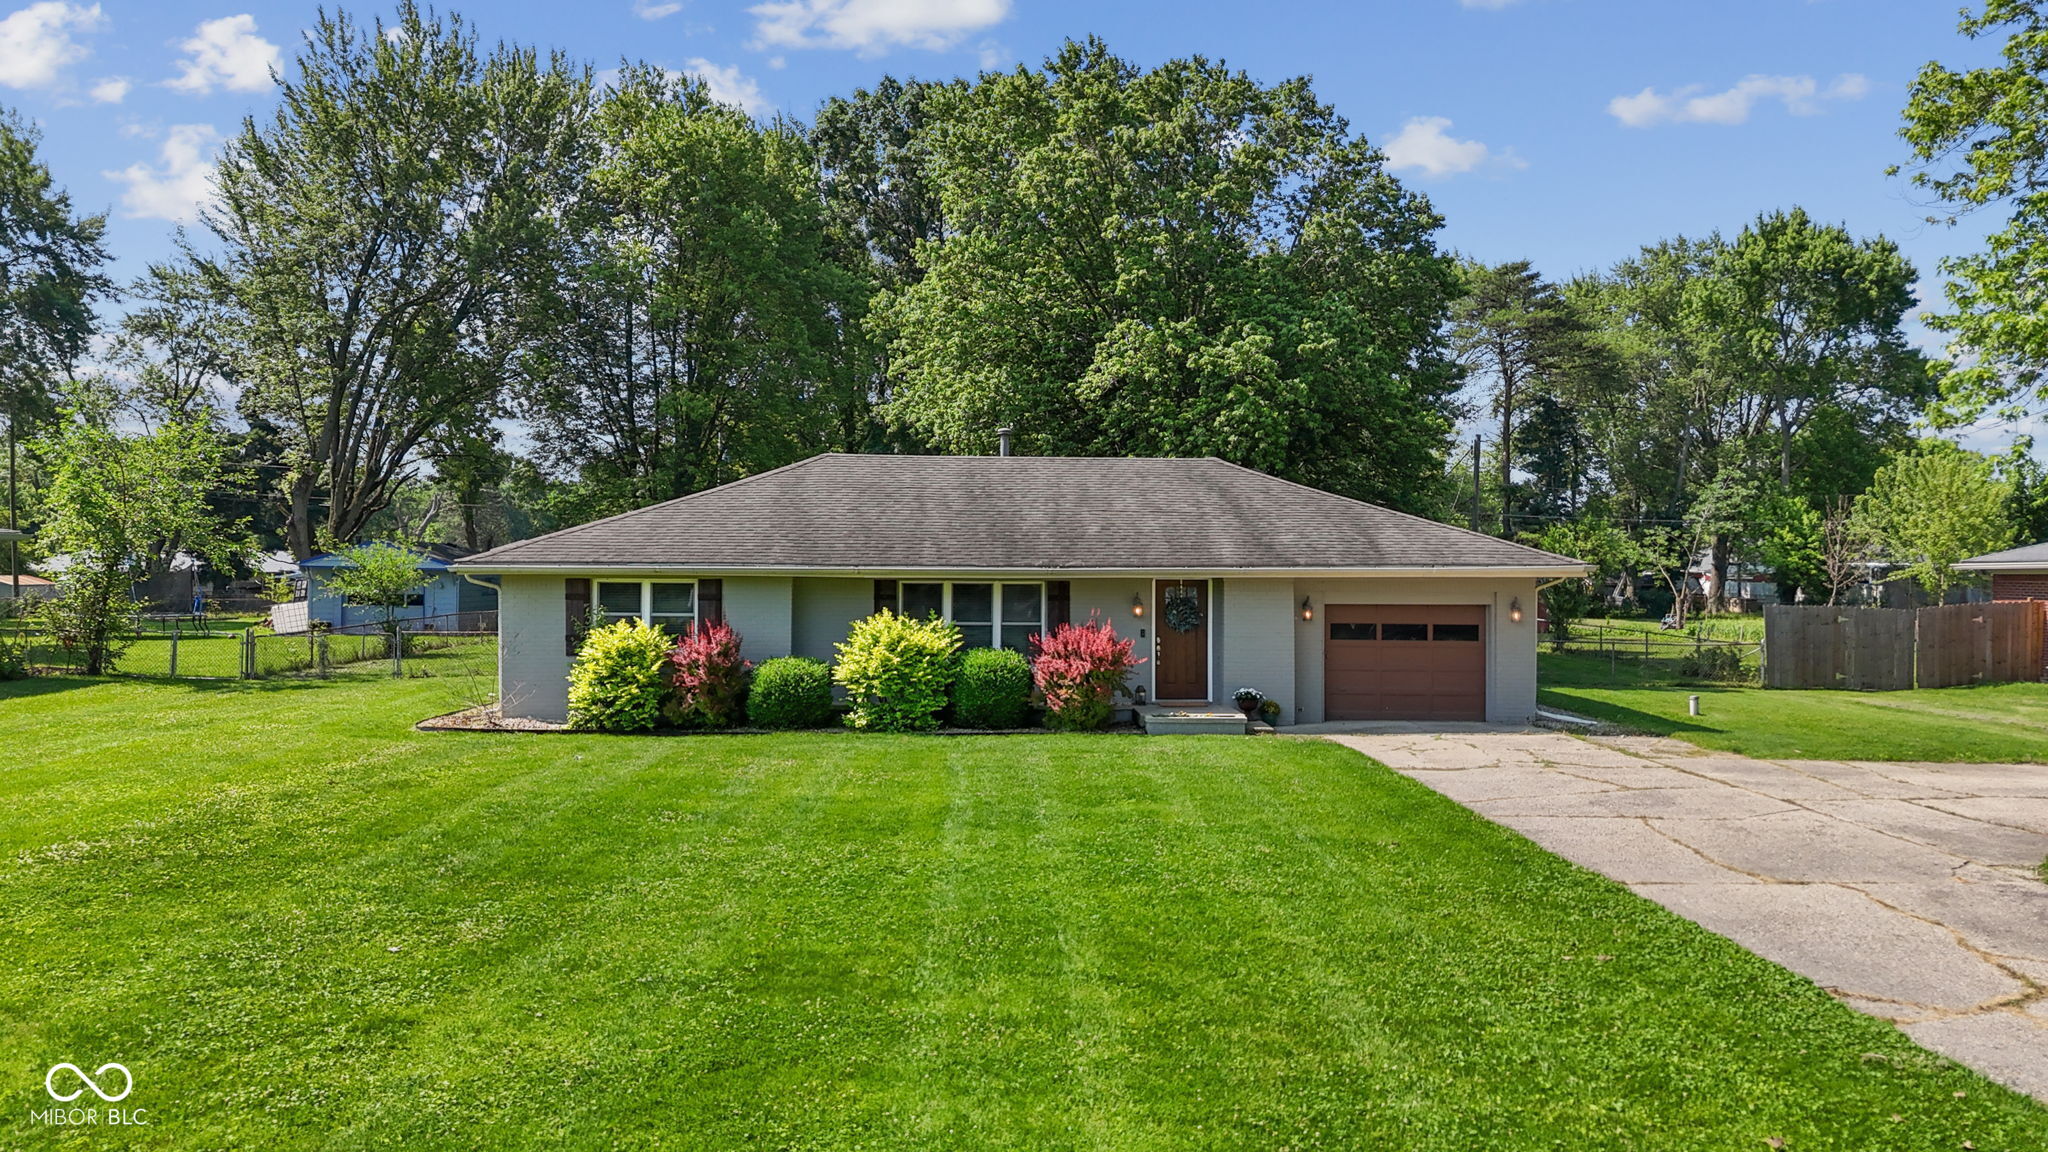
Pending
$275,000
3
bds
|
2
ba
|
1,810
sqft
|
built
1955
105 Tulip Dr, Indianapolis, IN 46227
$-29
Cash flow
-0.6%
Cash-on-Cash Return
6.0%
Cap rate
0.7%
Rent to Value Ratio
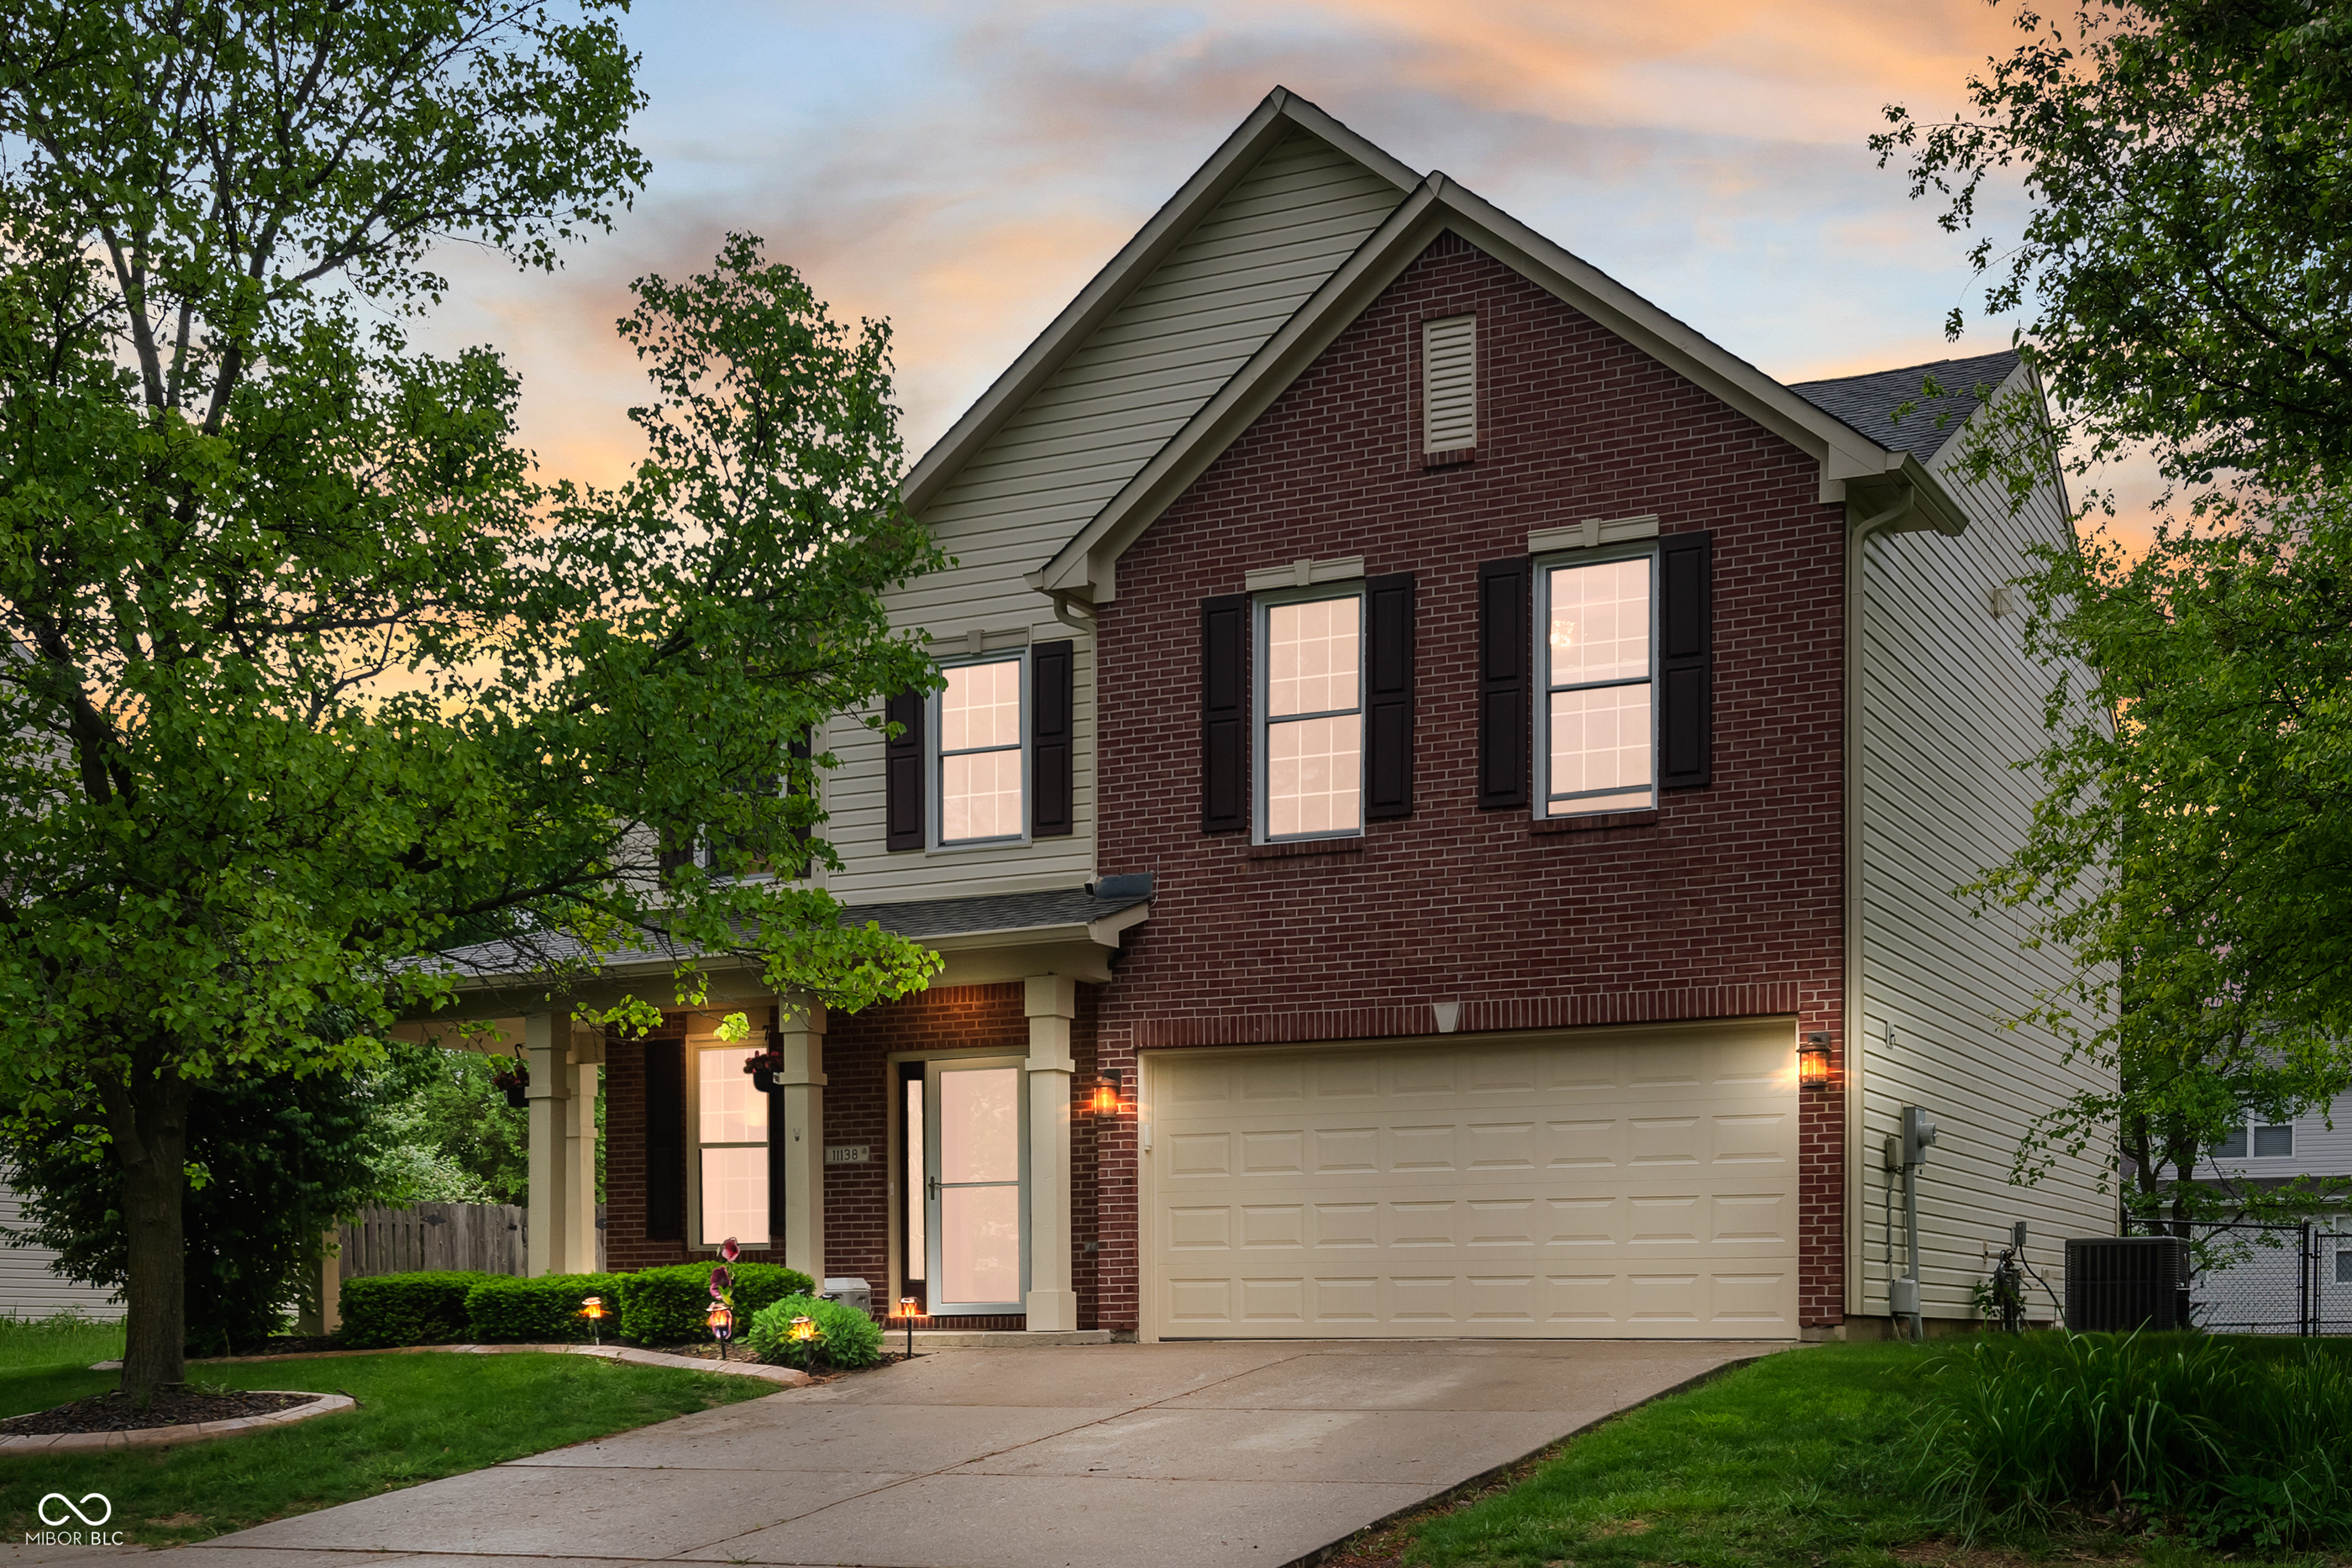
Active
$299,000
3
bds
|
3
ba
|
2,172
sqft
|
built
2002
11138 Bear Hollow Dr, Indianapolis, IN 46229
$-36
Cash flow
-0.6%
Cash-on-Cash Return
6.0%
Cap rate
0.7%
Rent to Value Ratio
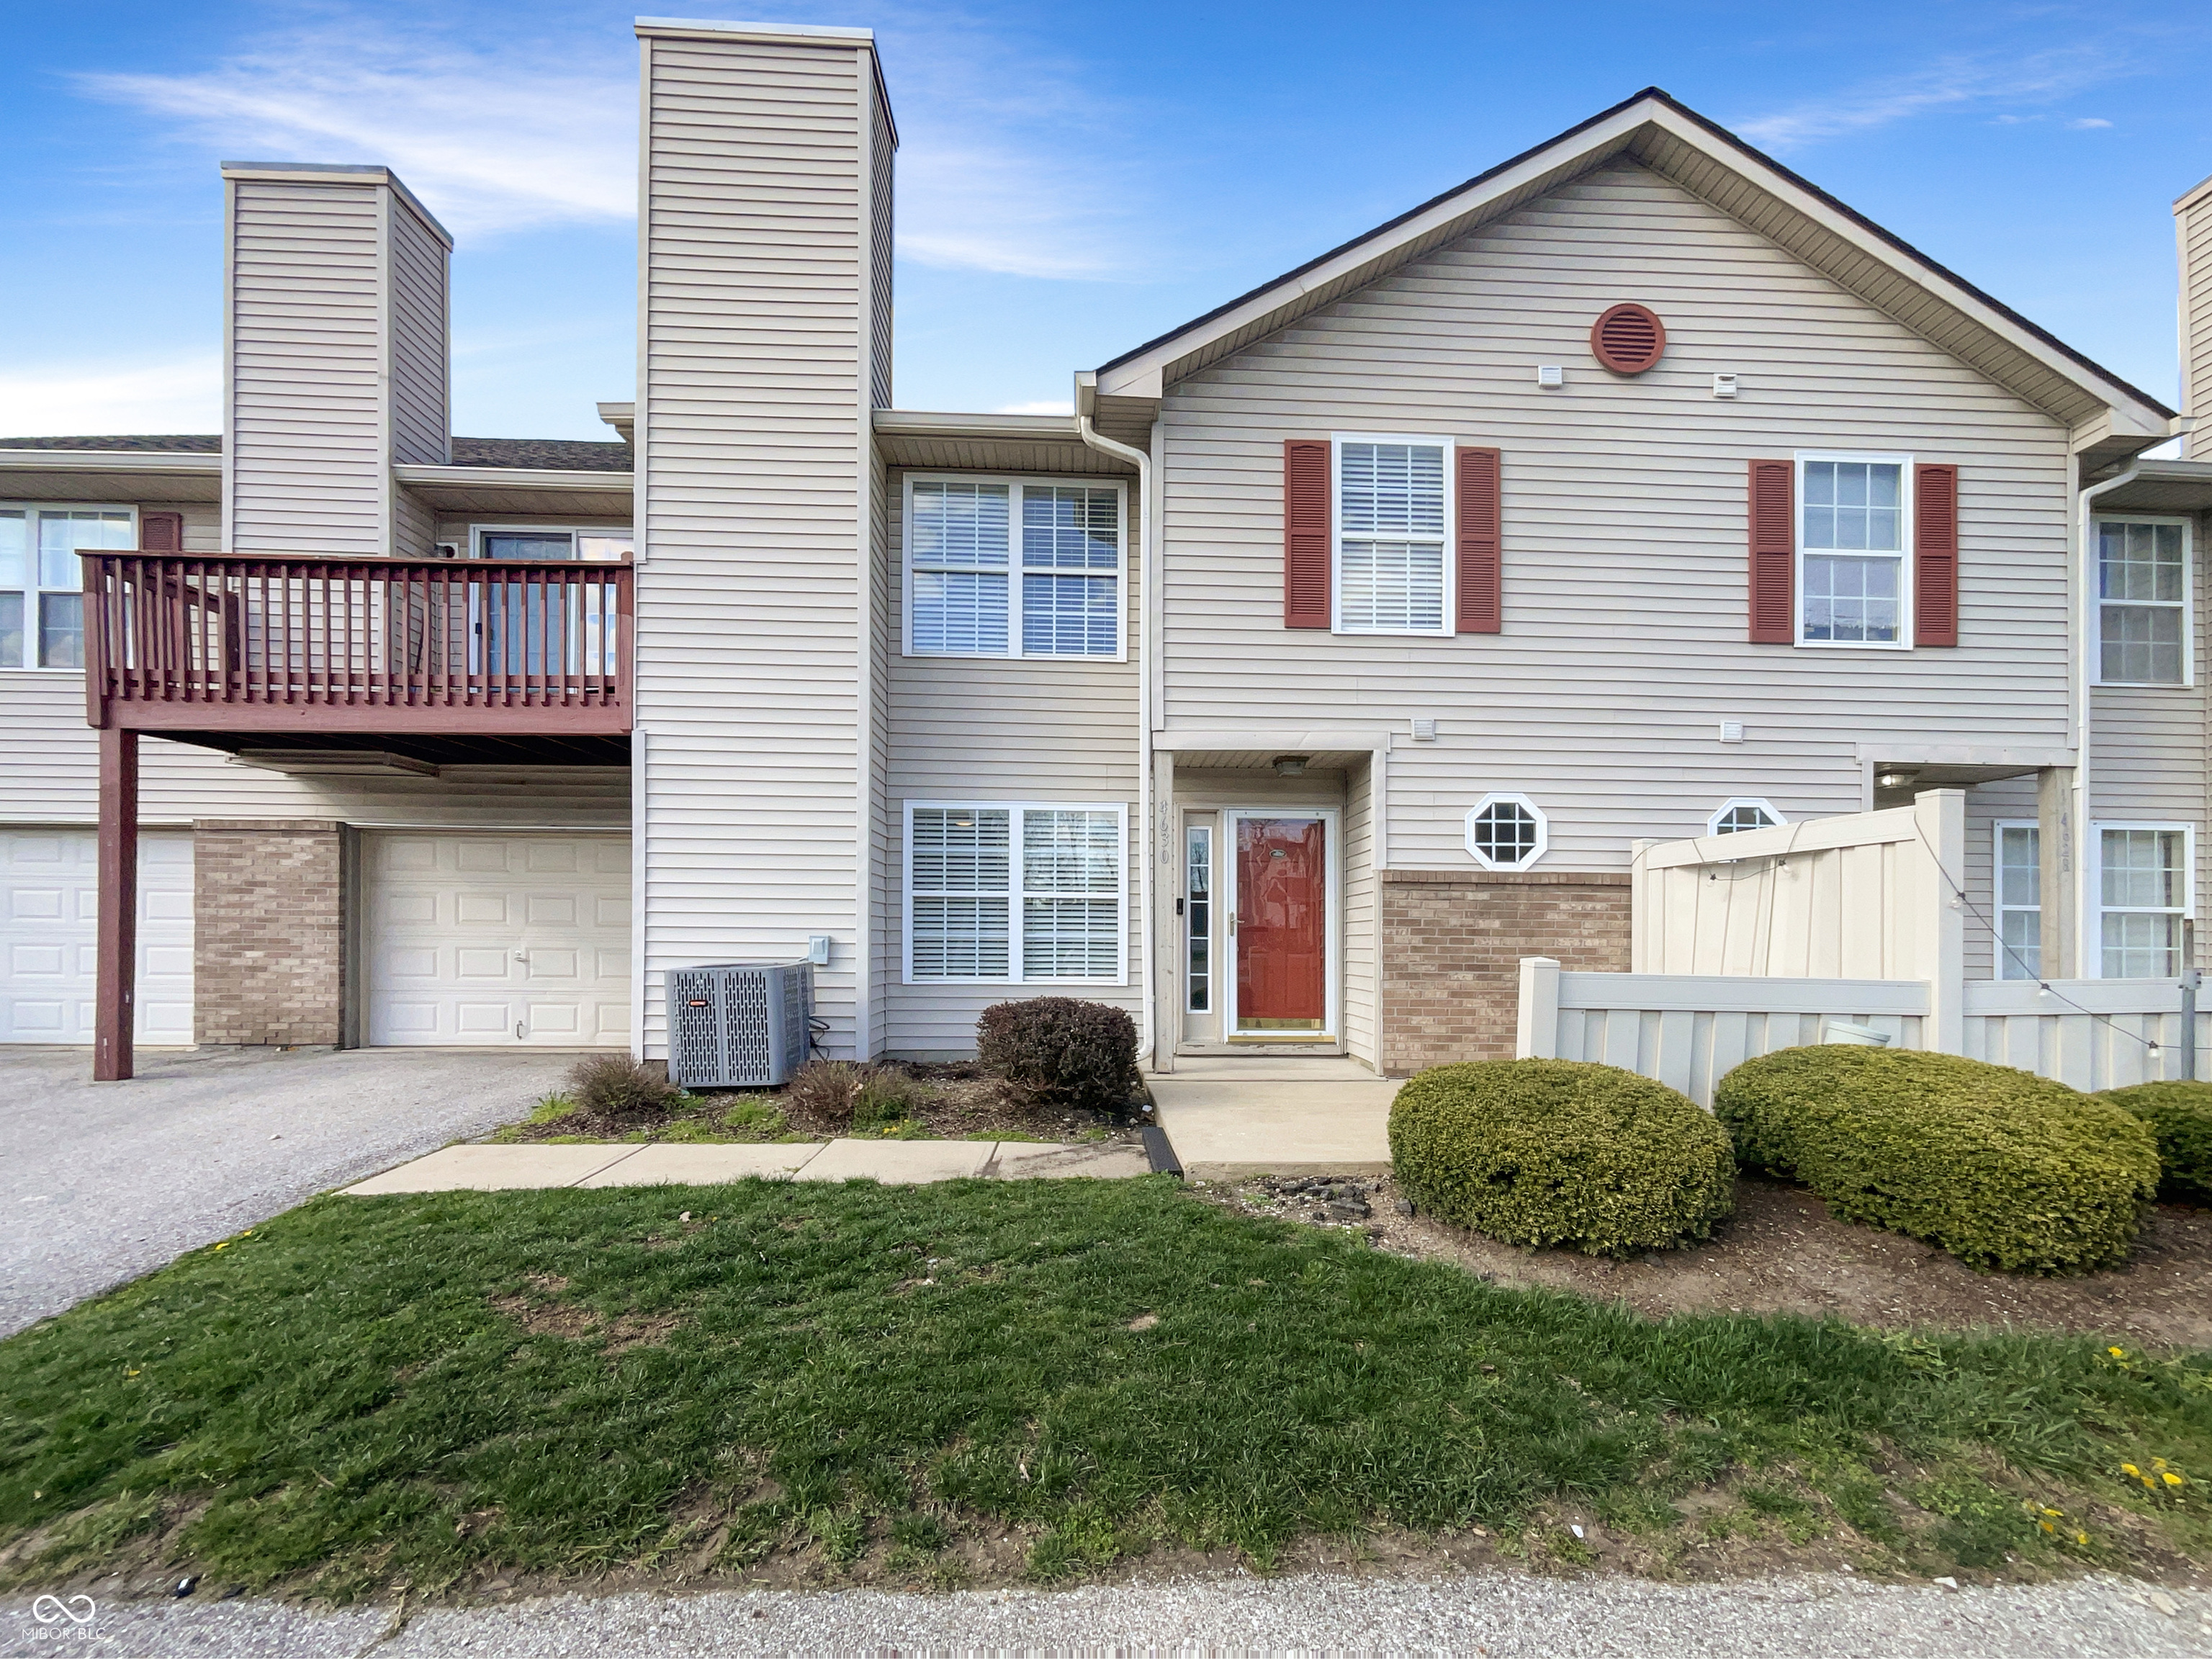
Active
$179,000
2
bds
|
2
ba
|
1,197
sqft
|
built
2001
4630 Kelvington Dr, Indianapolis, IN 46254
$9
Cash flow
0.3%
Cash-on-Cash Return
6.2%
Cap rate
0.9%
Rent to Value Ratio
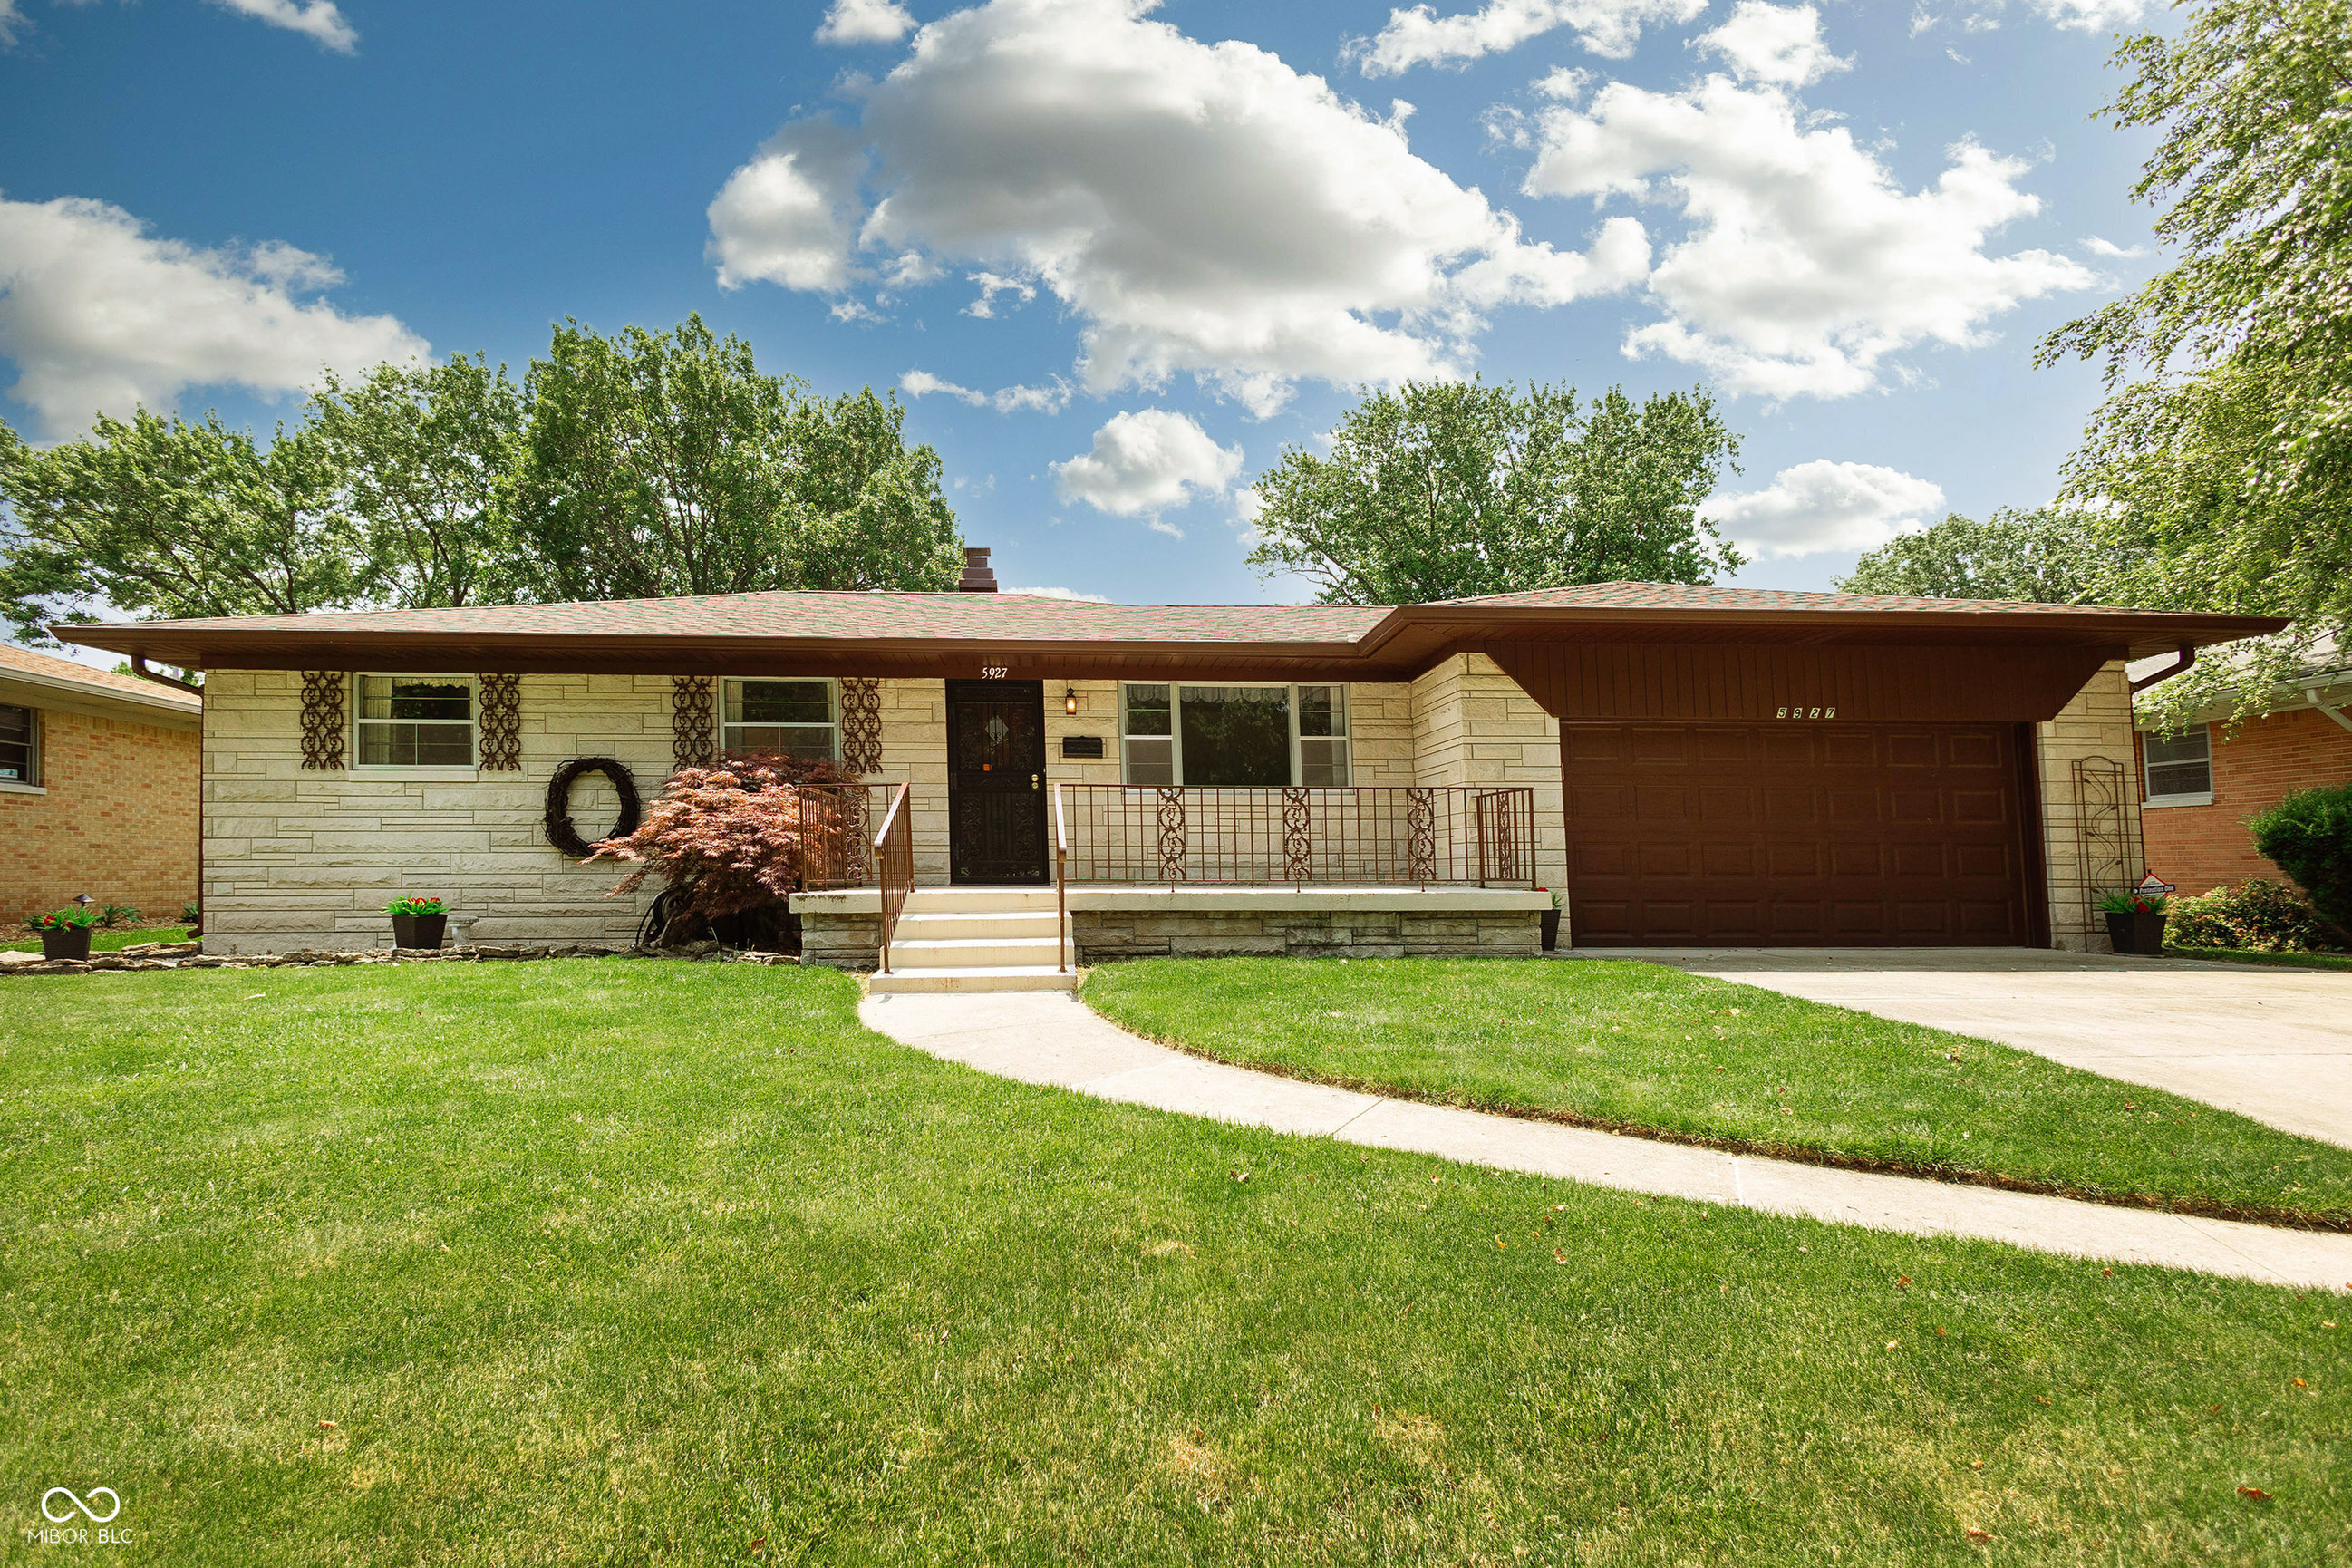
Pending
$275,000
3
bds
|
3
ba
|
2,320
sqft
|
built
1958
5927 Meadowood Dr, Indianapolis, IN 46224
$-305
Cash flow
-5.8%
Cash-on-Cash Return
4.8%
Cap rate
0.6%
Rent to Value Ratio
Active
$57,800
bds
|
0
ba
|
0
sqft
|
built
1899
432 N Hamilton Ave, Indianapolis, IN 46201
$1,104
Cash flow
22.3%
Cash-on-Cash Return
22.9%
Cap rate
2.8%
Rent to Value Ratio
Pending
$49,900
2
bds
|
1
ba
|
728
sqft
|
built
1955
1437 Kappes St, Indianapolis, IN 46221
$966
Cash flow
22.6%
Cash-on-Cash Return
23.2%
Cap rate
2.8%
Rent to Value Ratio
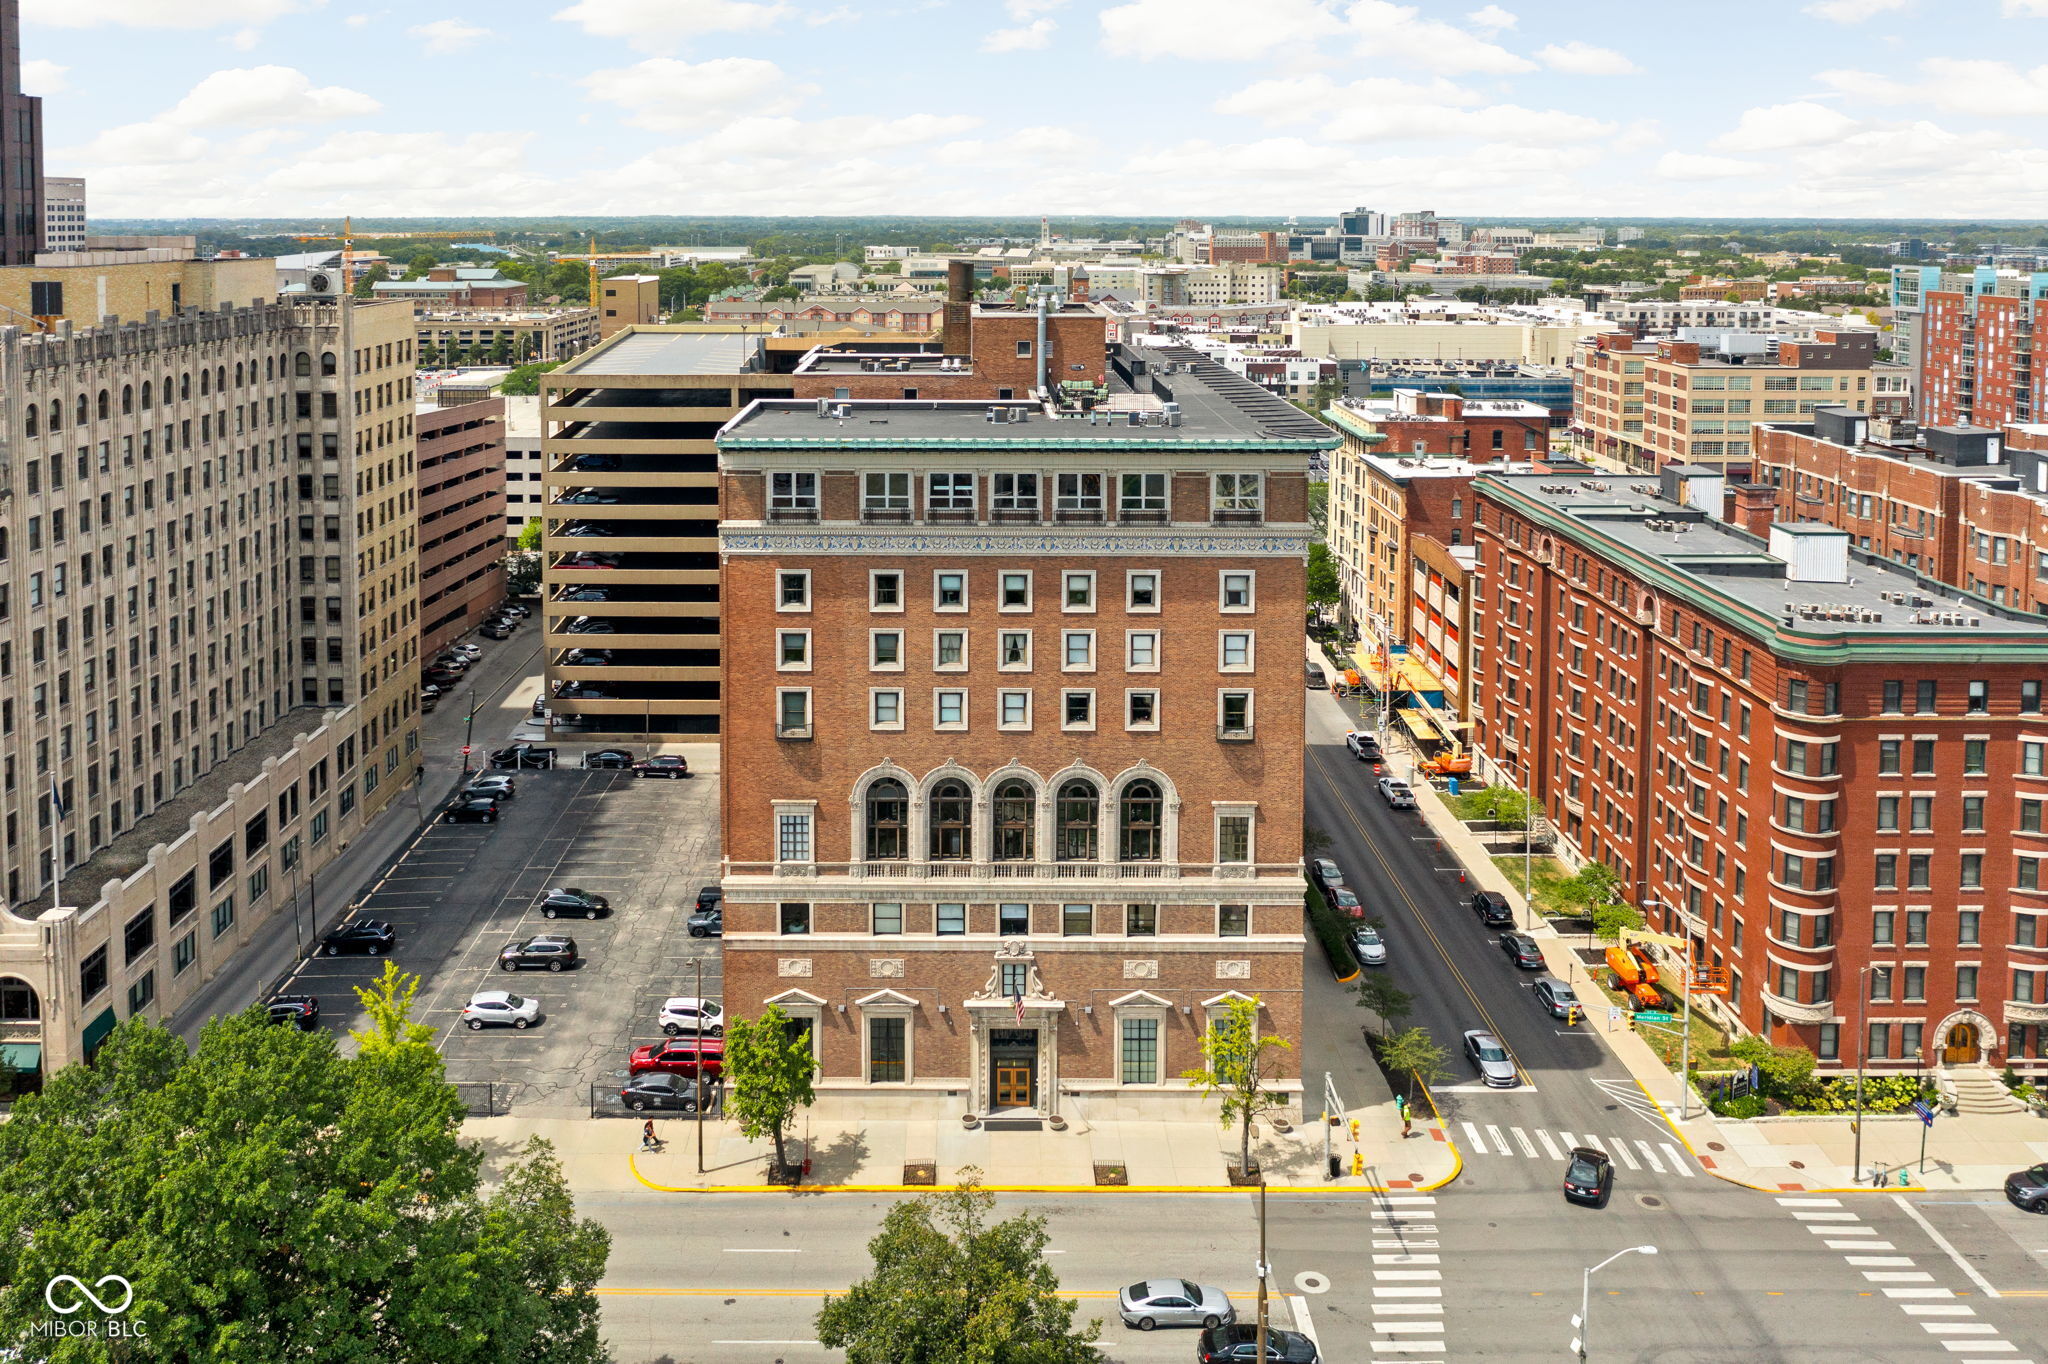
Active
$950,000
3
bds
|
3
ba
|
3,000
sqft
|
built
1924
350 N Meridian St, Indianapolis, IN 46204
$-3,666
Cash flow
-20.1%
Cash-on-Cash Return
1.5%
Cap rate
0.4%
Rent to Value Ratio
Active
$535,000
4
bds
|
4
ba
|
2,439
sqft
|
built
1910
560 Jefferson Ave, Indianapolis, IN 46201
$-602
Cash flow
-5.9%
Cash-on-Cash Return
4.8%
Cap rate
0.6%
Rent to Value Ratio
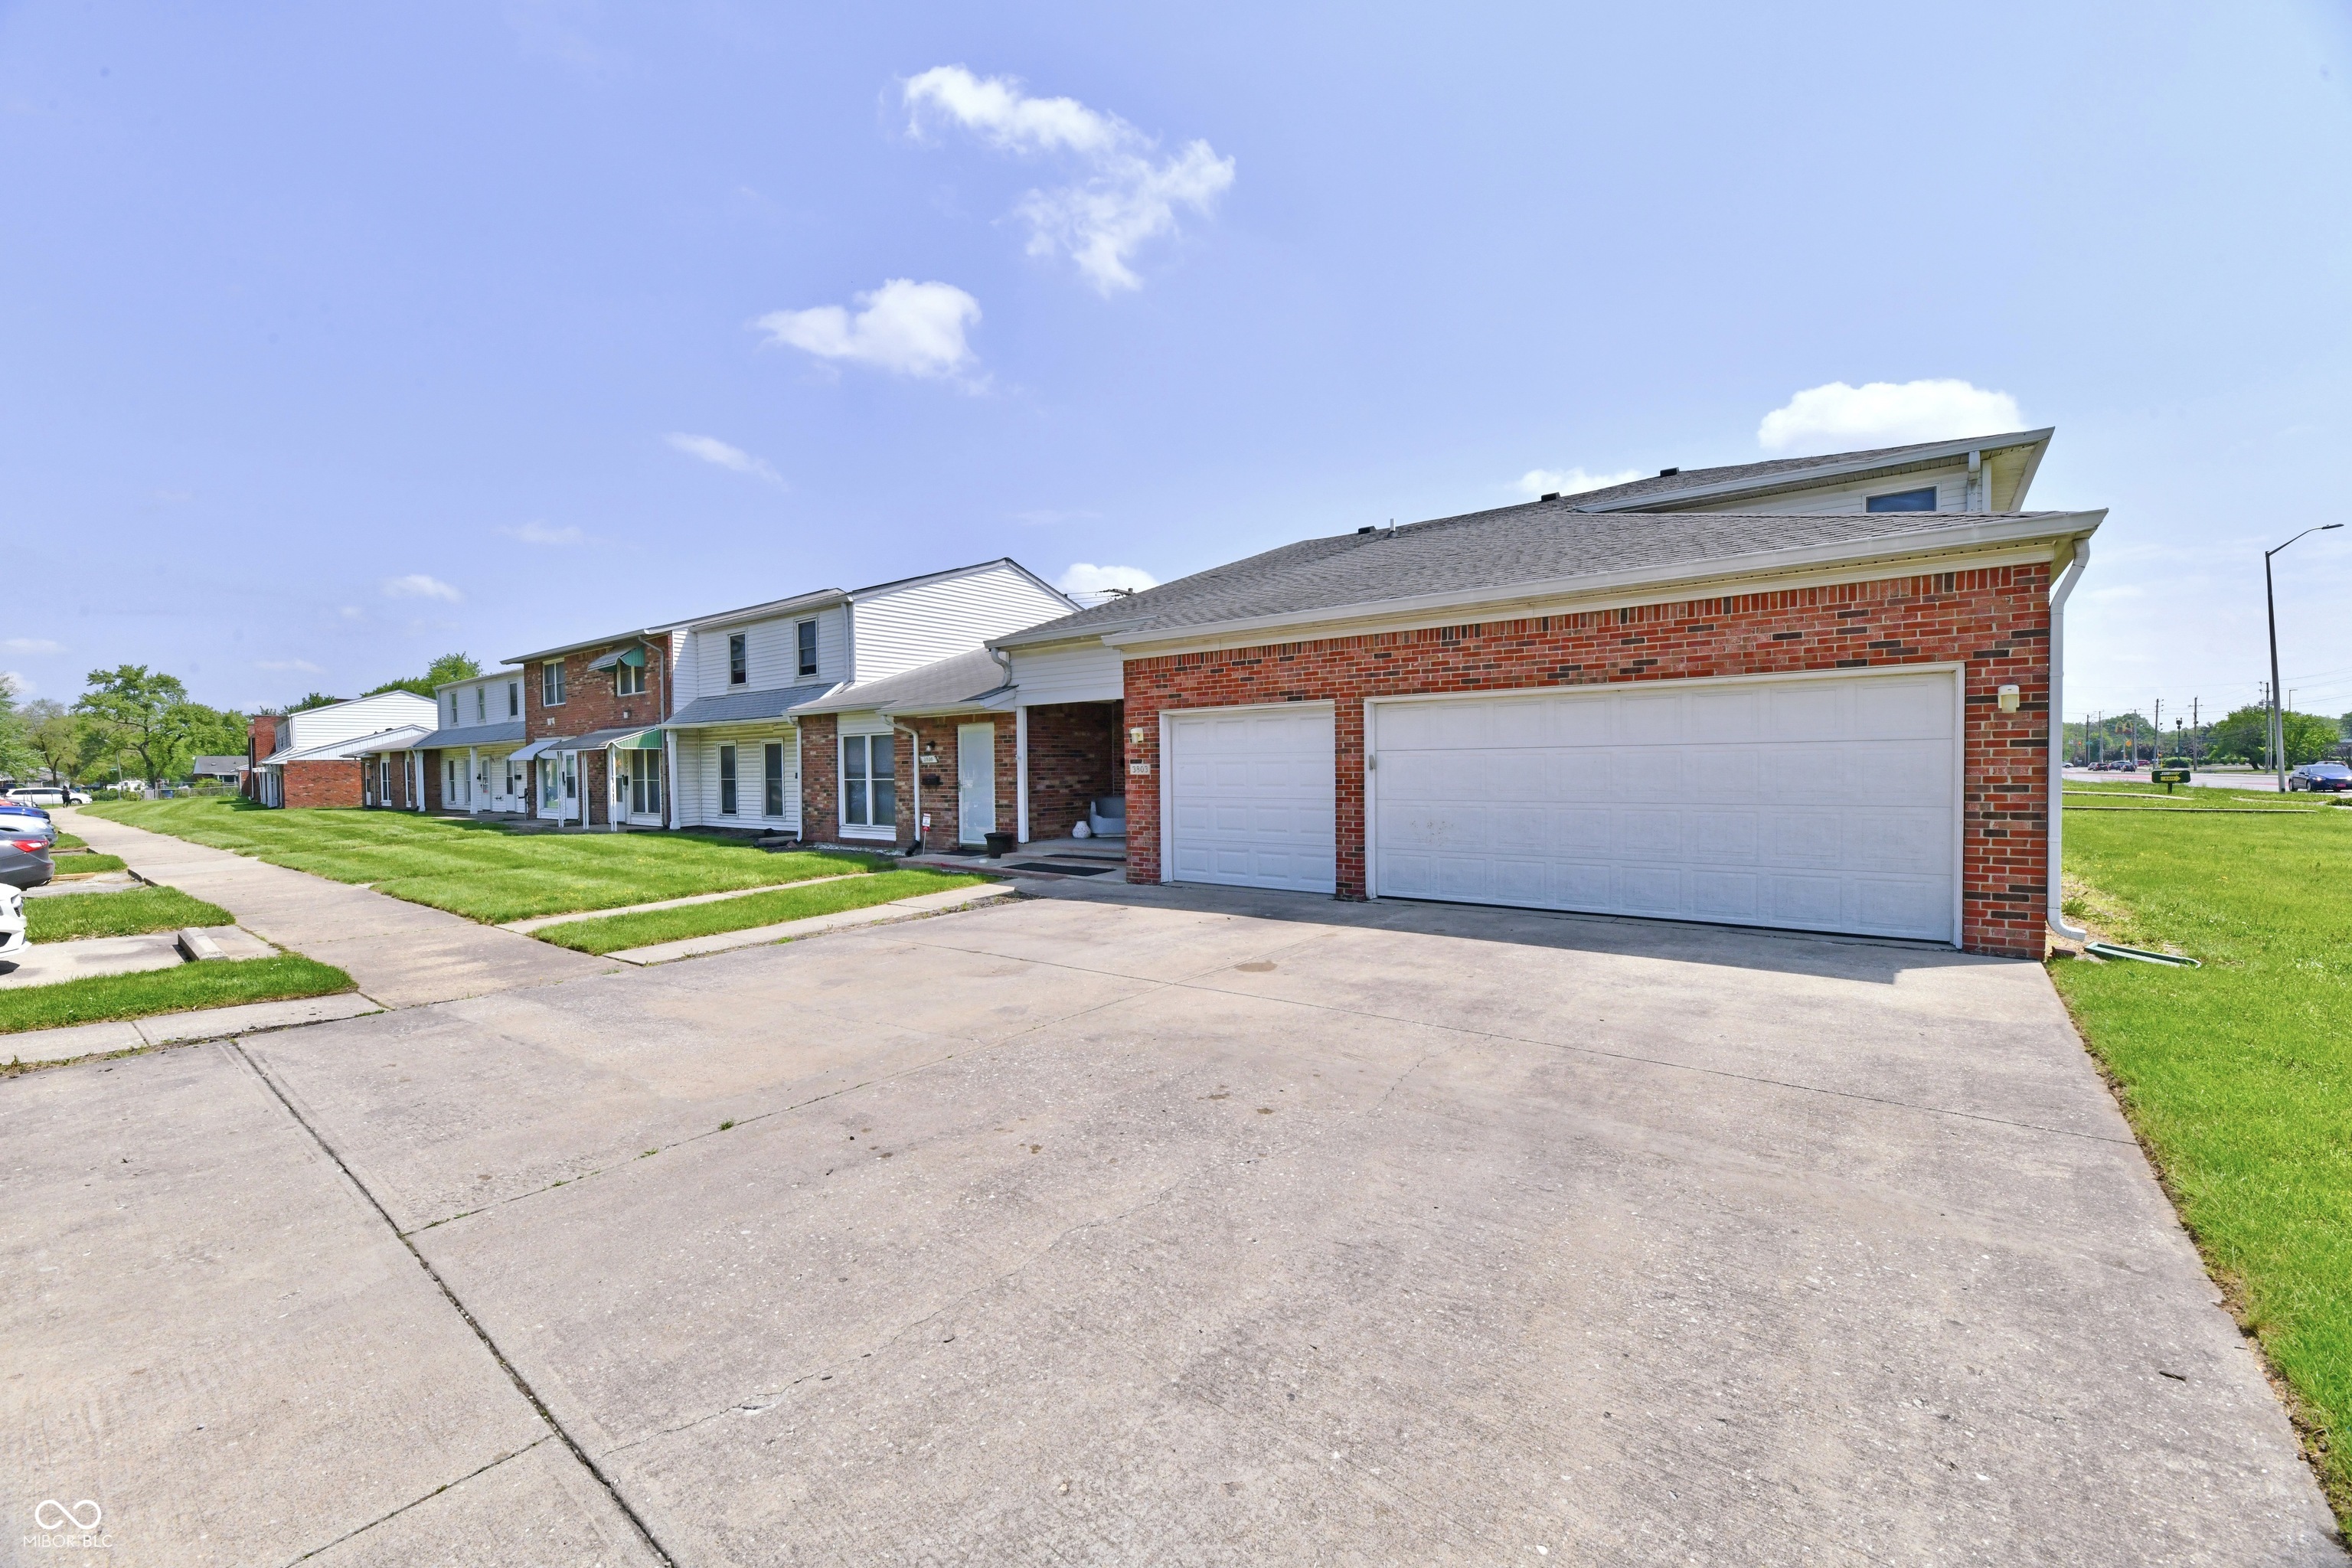
Active
$1,999,900
bds
|
0
ba
|
0
sqft
|
built
1964
3805 Biscayne Rd, Indianapolis, IN 46226
$-9,623
Cash flow
-25.1%
Cash-on-Cash Return
0.4%
Cap rate
0.0%
Rent to Value Ratio
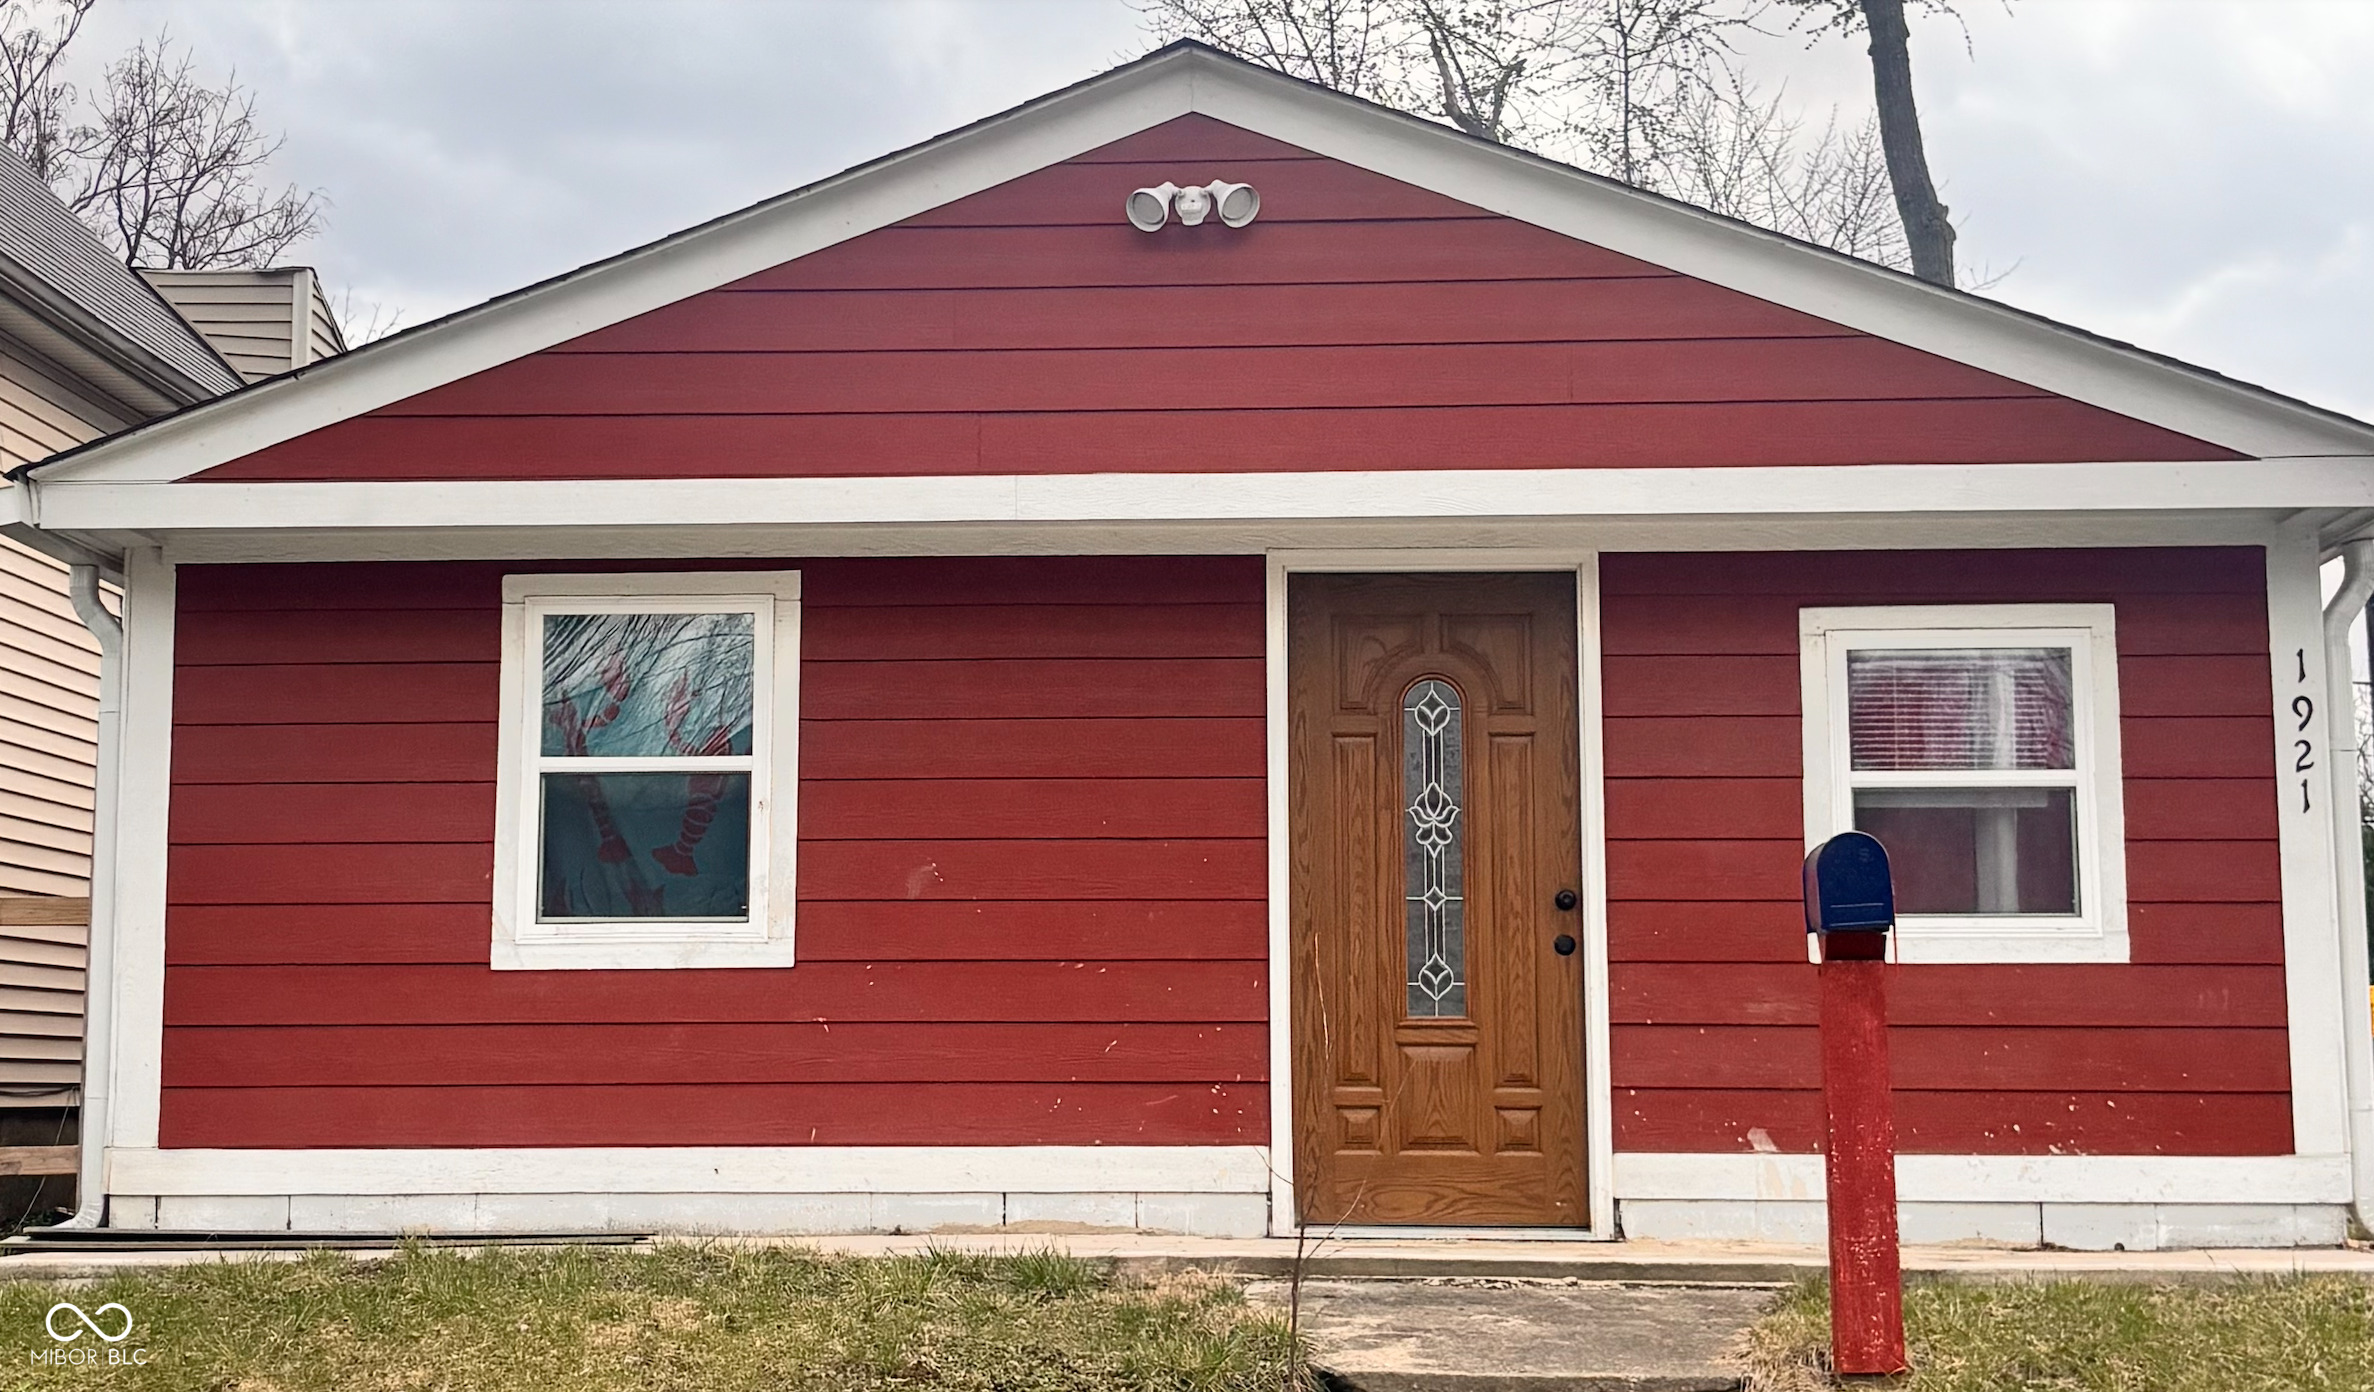
Active
$180,000
3
bds
|
2
ba
|
1,856
sqft
|
built
1955
1921 W Michigan St, Indianapolis, IN 46222
$-439
Cash flow
-12.7%
Cash-on-Cash Return
3.2%
Cap rate
0.4%
Rent to Value Ratio
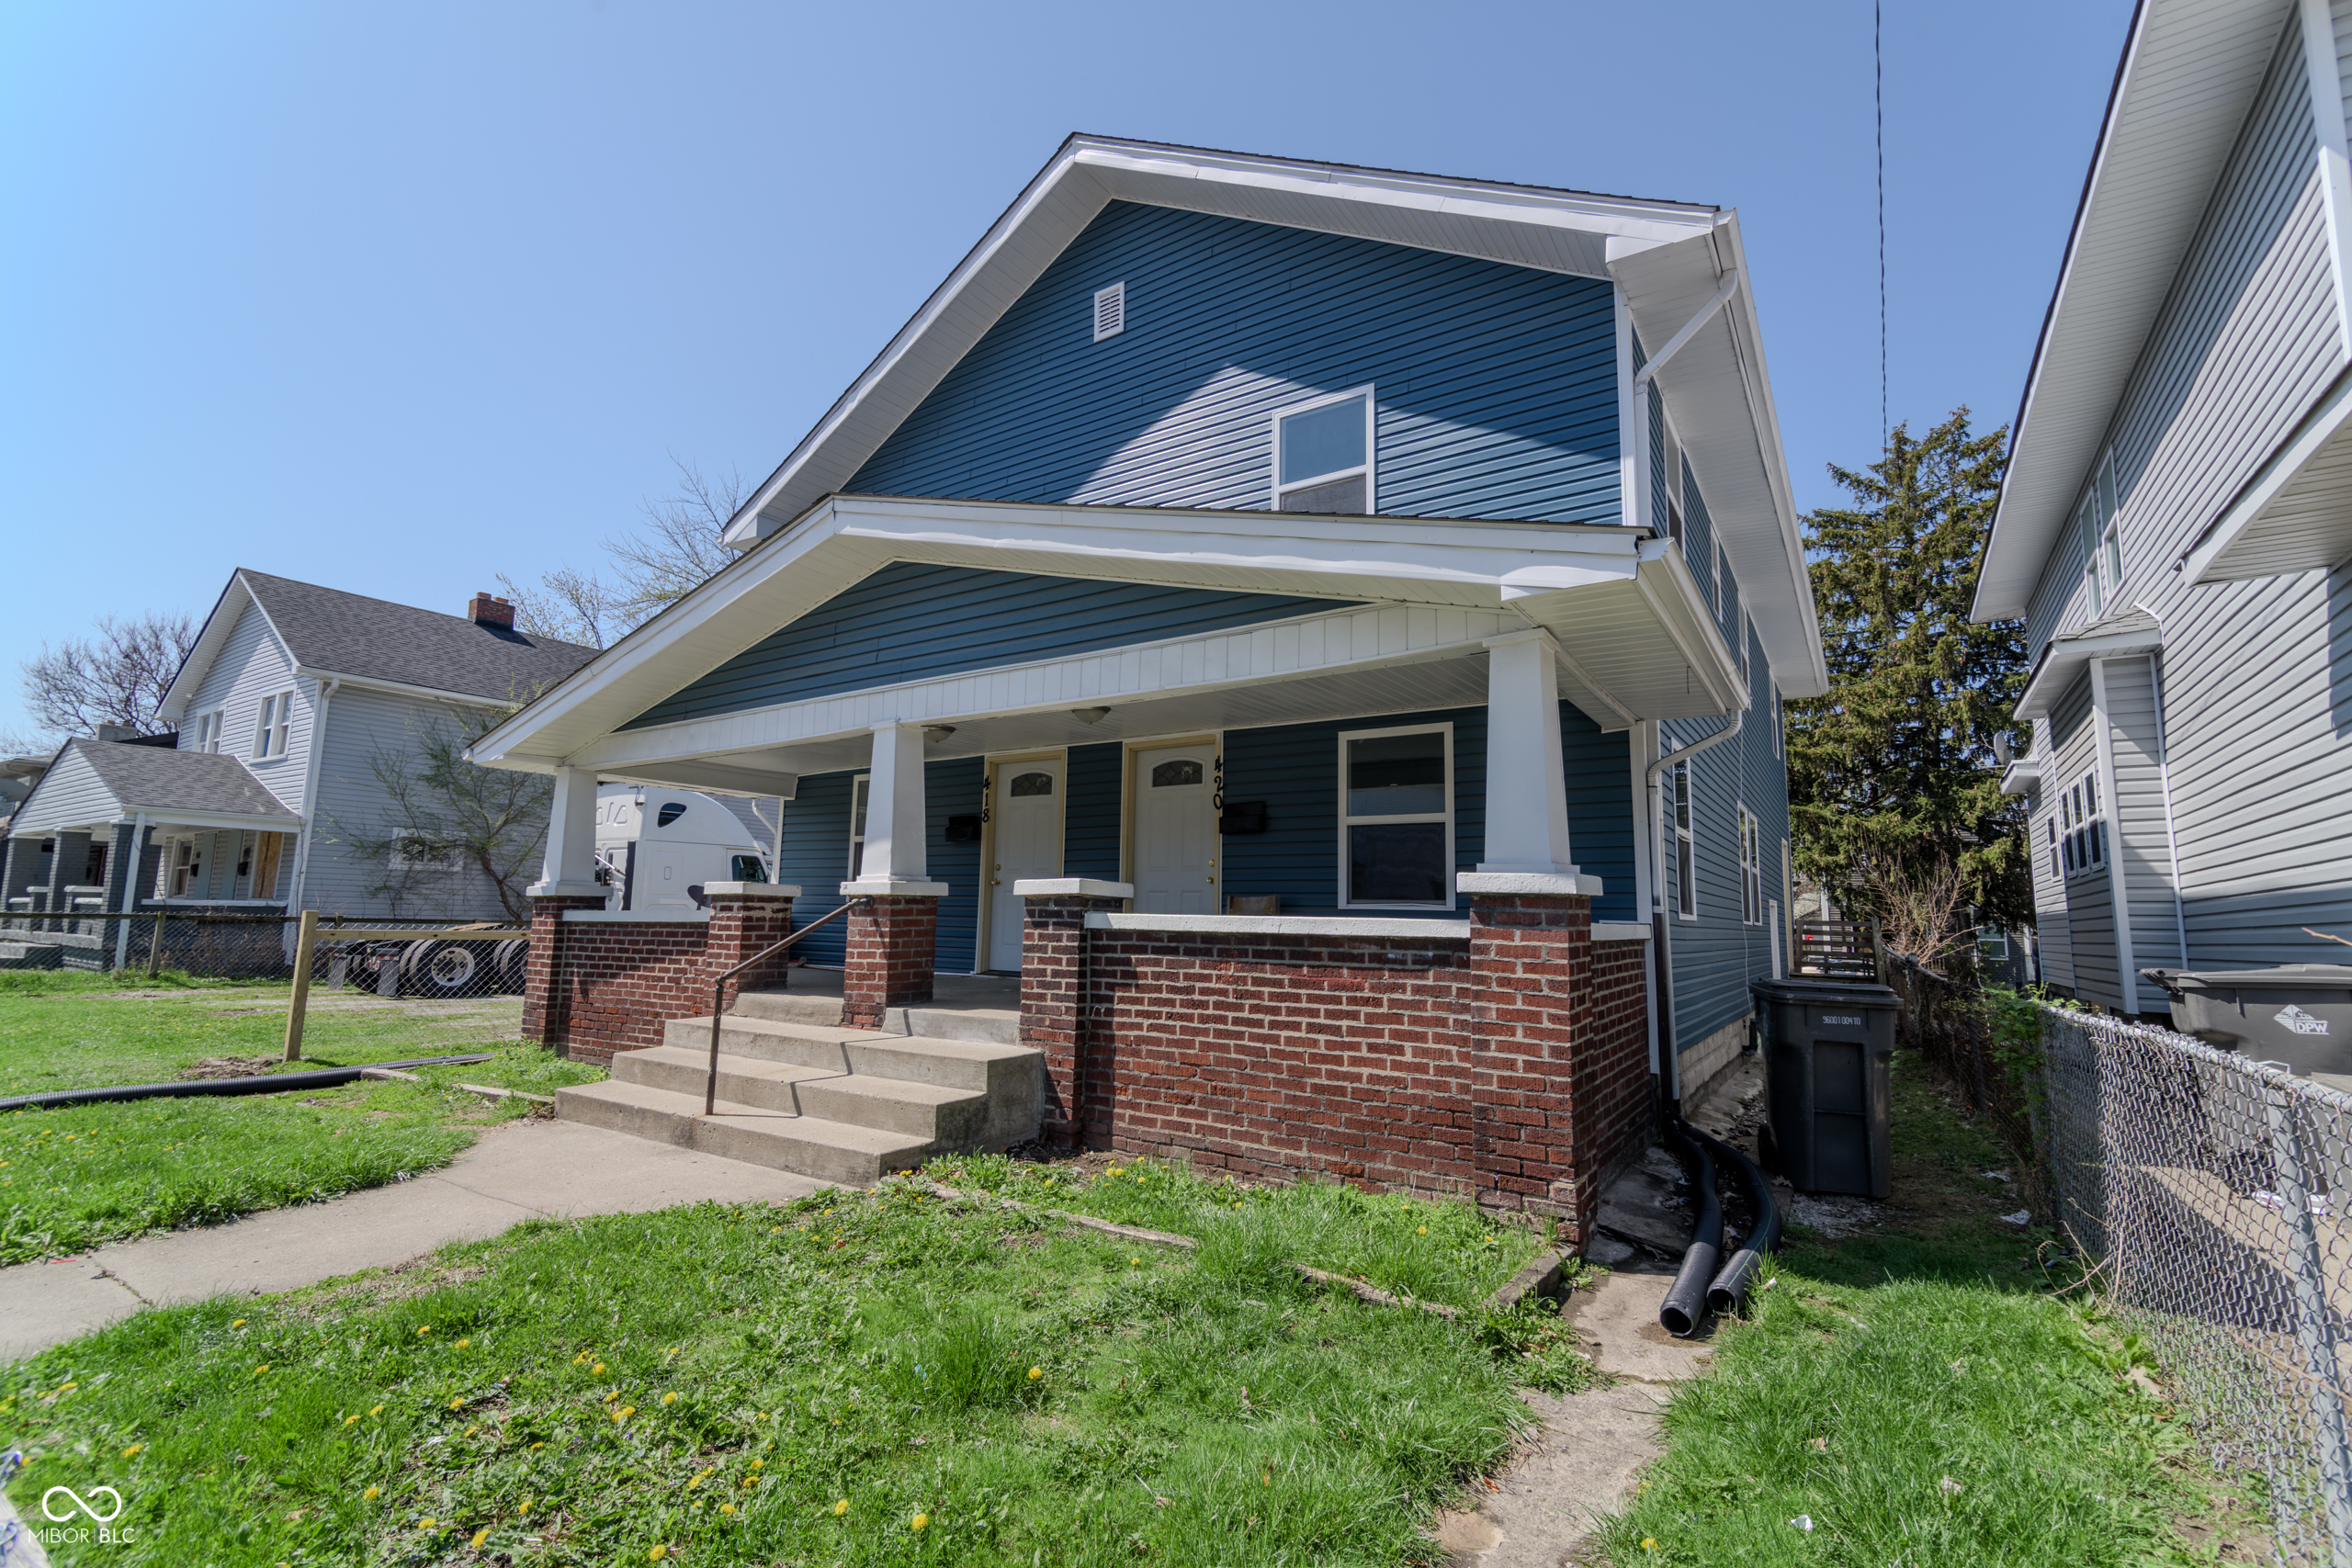
Active
$249,000
3
bds
|
0
ba
|
0
sqft
|
built
1920
418 N Oakland Ave, Indianapolis, IN 46201
$-517
Cash flow
-10.8%
Cash-on-Cash Return
3.7%
Cap rate
0.4%
Rent to Value Ratio

Active
$399,000
3
bds
|
3
ba
|
2,087
sqft
|
built
1925
5814 Beechwood Ave, Indianapolis, IN 46219
$-664
Cash flow
-8.7%
Cash-on-Cash Return
4.2%
Cap rate
0.5%
Rent to Value Ratio
Active
$925,000
4
bds
|
4
ba
|
4,176
sqft
|
built
1910
2828 N Illinois St, Indianapolis, IN 46208
$-3,496
Cash flow
-19.7%
Cash-on-Cash Return
1.6%
Cap rate
0.2%
Rent to Value Ratio
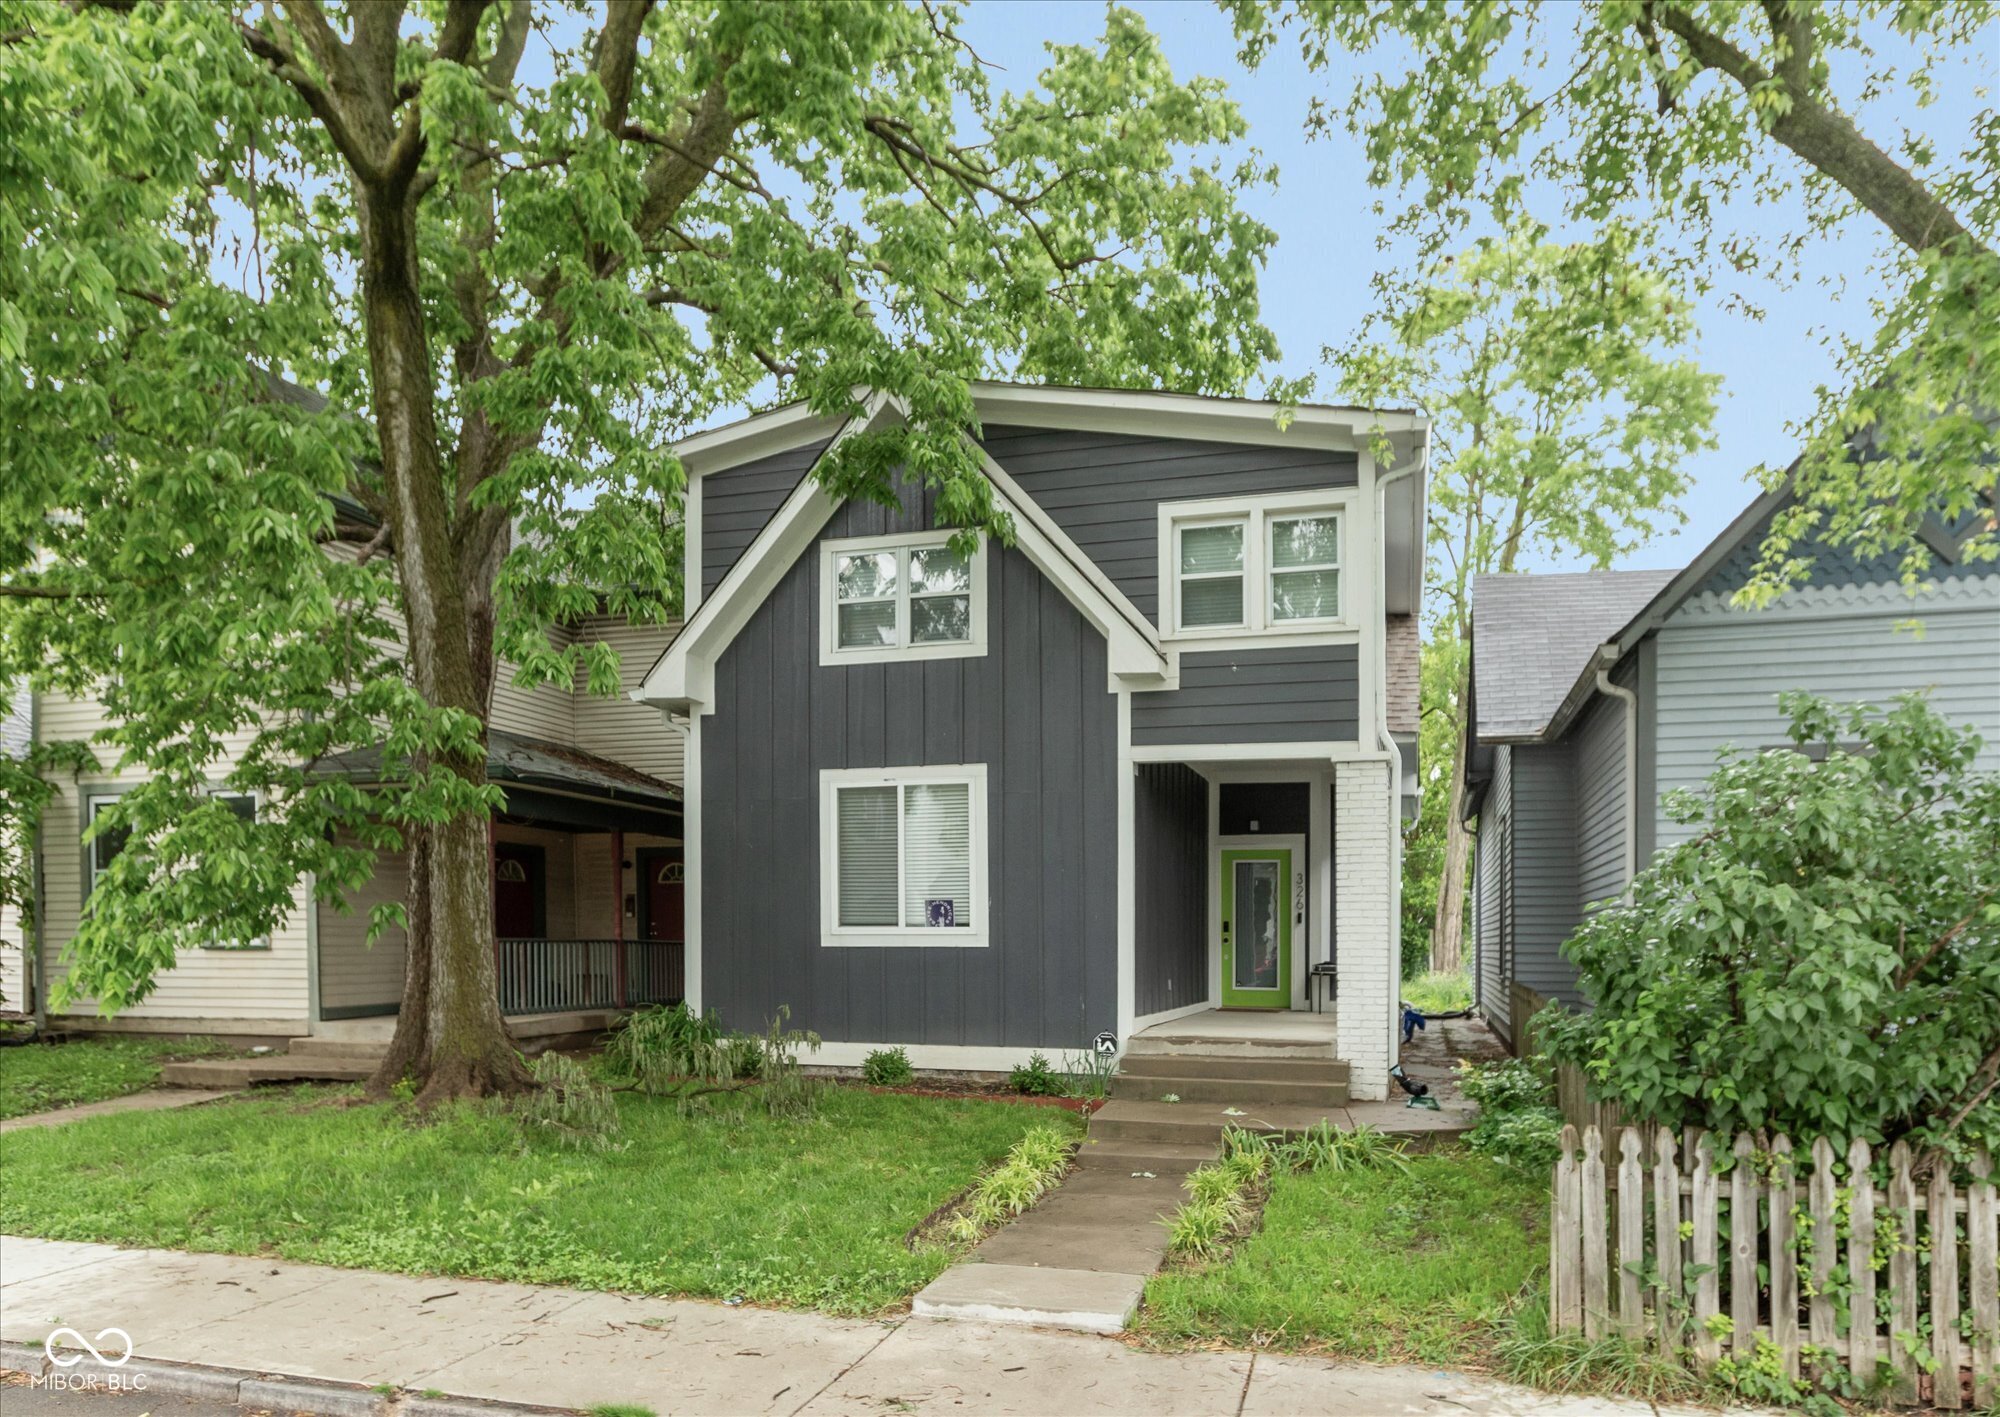
Active
$372,000
4
bds
|
3
ba
|
2,412
sqft
|
built
1920
326 Parkway Ave, Indianapolis, IN 46225
$26
Cash flow
0.4%
Cash-on-Cash Return
6.2%
Cap rate
0.8%
Rent to Value Ratio
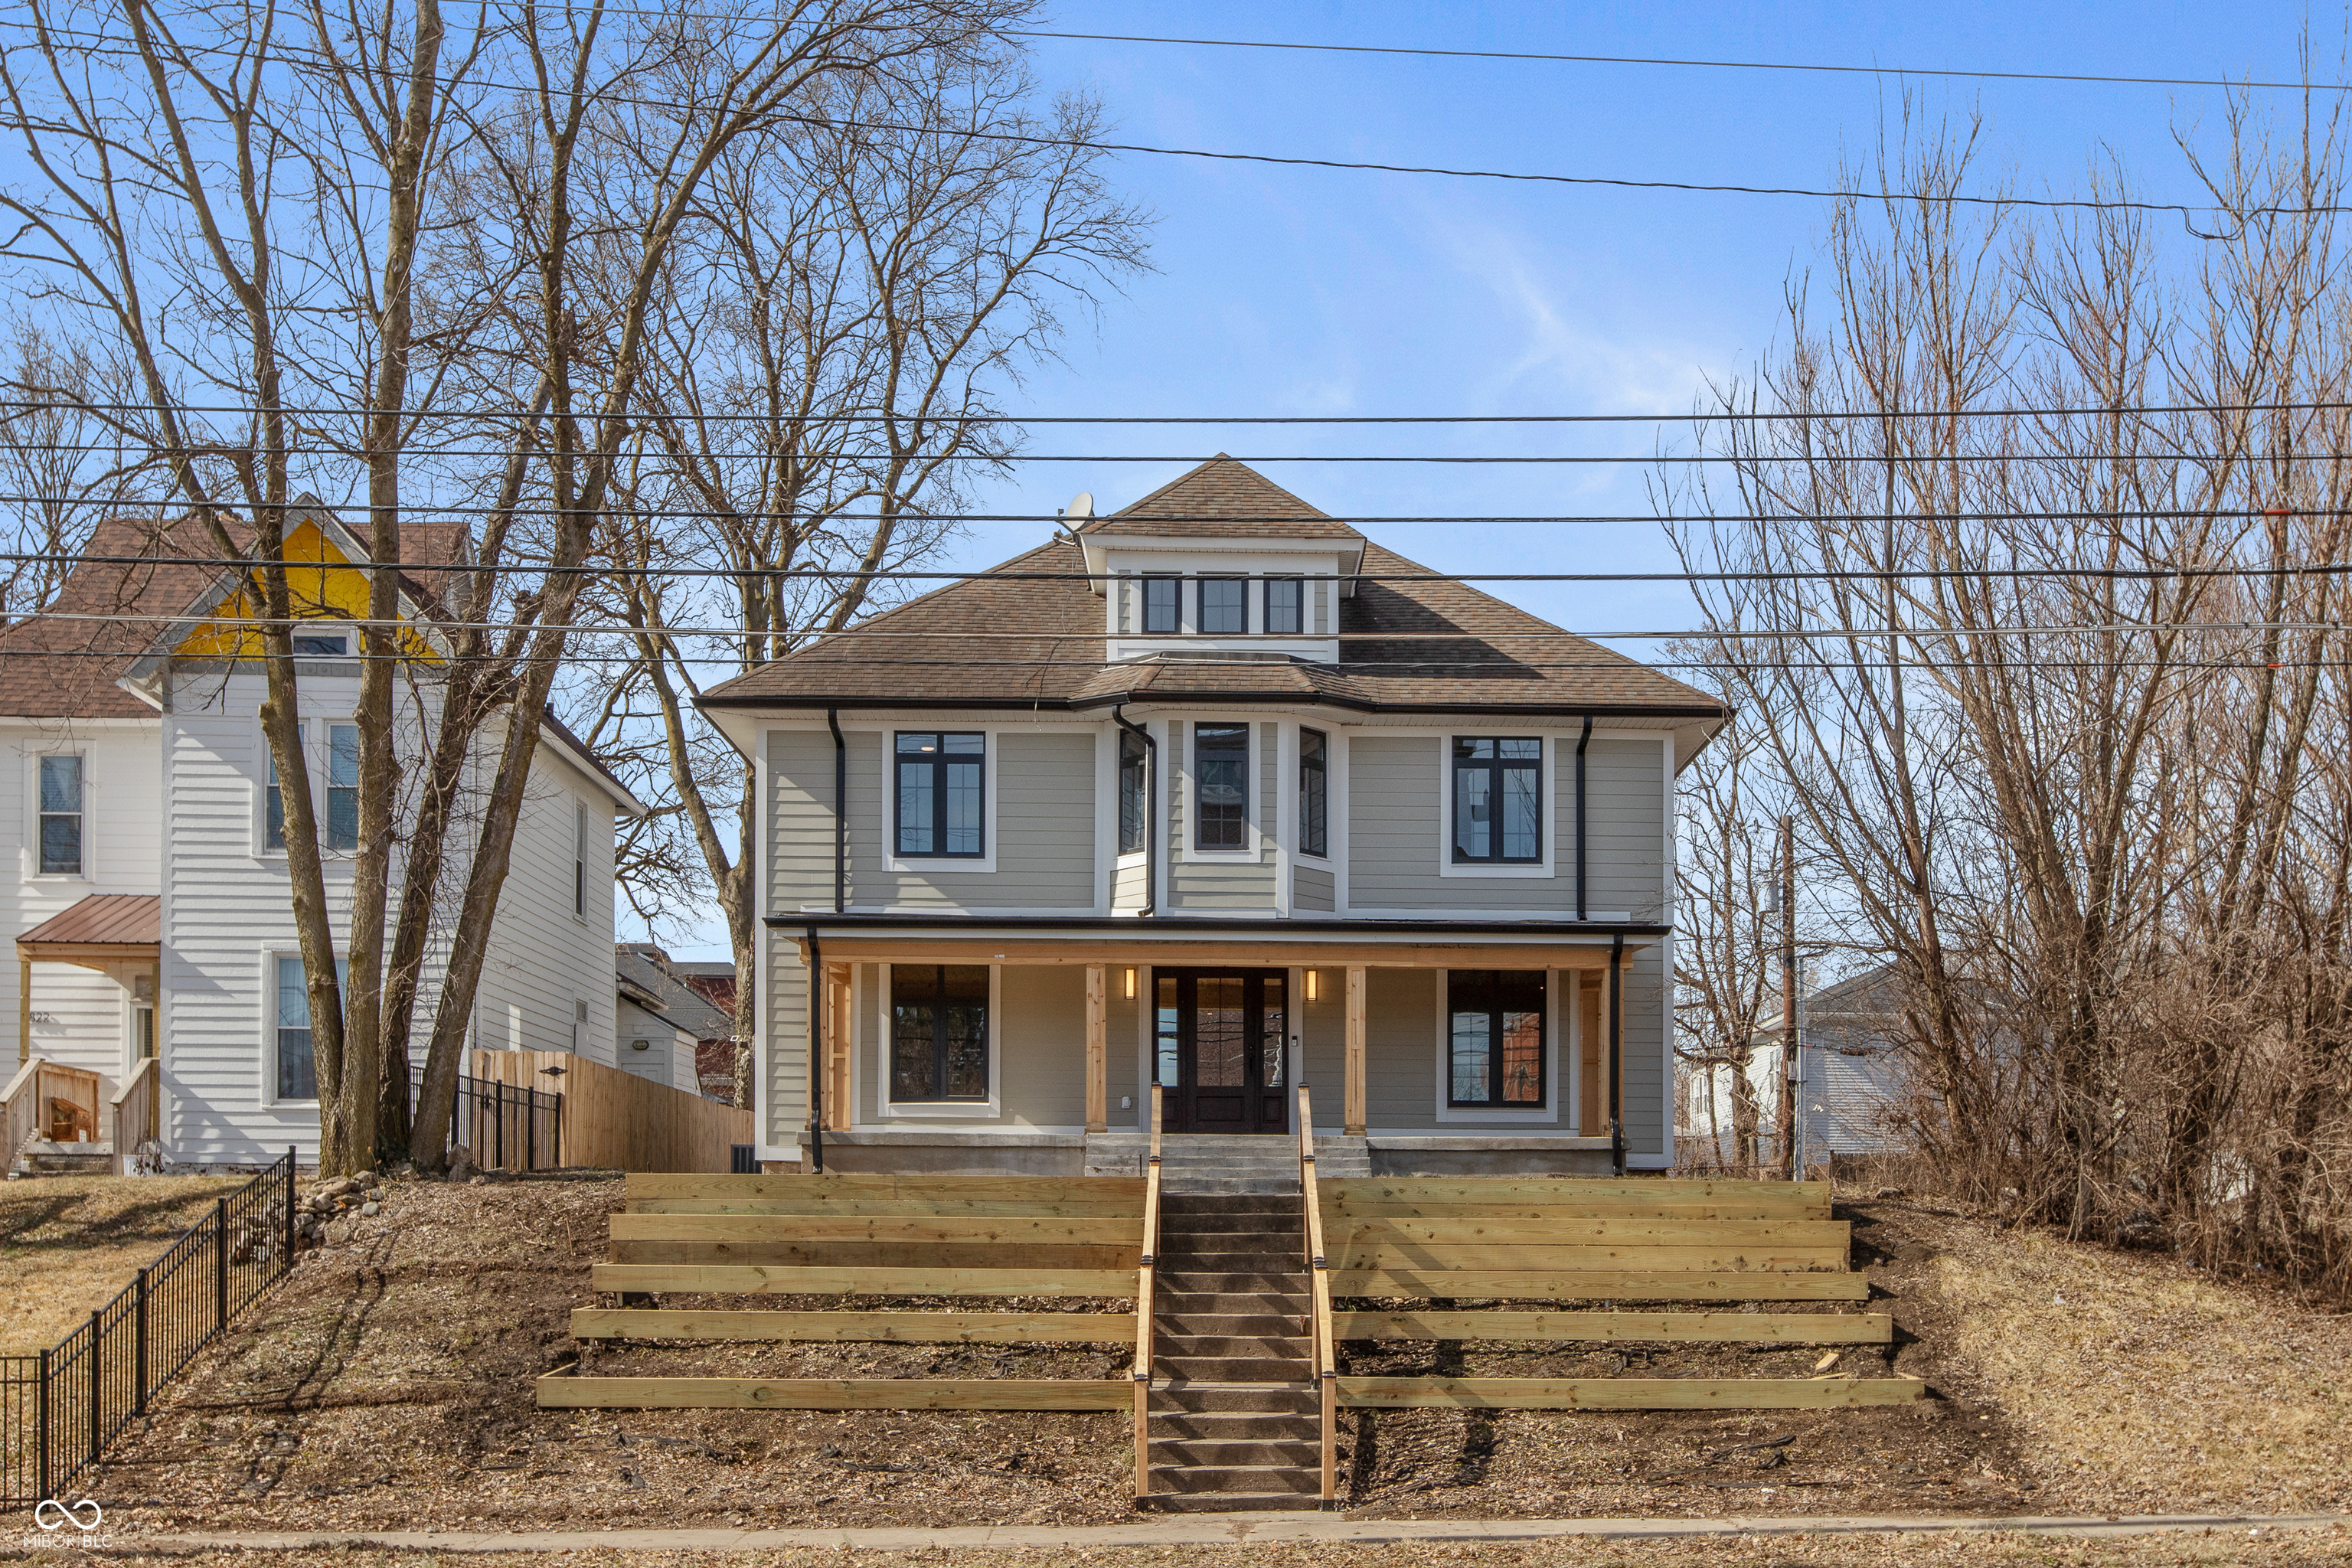
Active
$344,900
3
bds
|
2
ba
|
2,940
sqft
|
built
2022
2428 N Gale St, Indianapolis, IN 46218
$-525
Cash flow
-7.9%
Cash-on-Cash Return
4.3%
Cap rate
0.5%
Rent to Value Ratio
Pending
$615,000
4
bds
|
4
ba
|
3,956
sqft
|
built
1997
12608 E 86th St, Indianapolis, IN 46236
$-775
Cash flow
-6.6%
Cash-on-Cash Return
4.6%
Cap rate
0.6%
Rent to Value Ratio
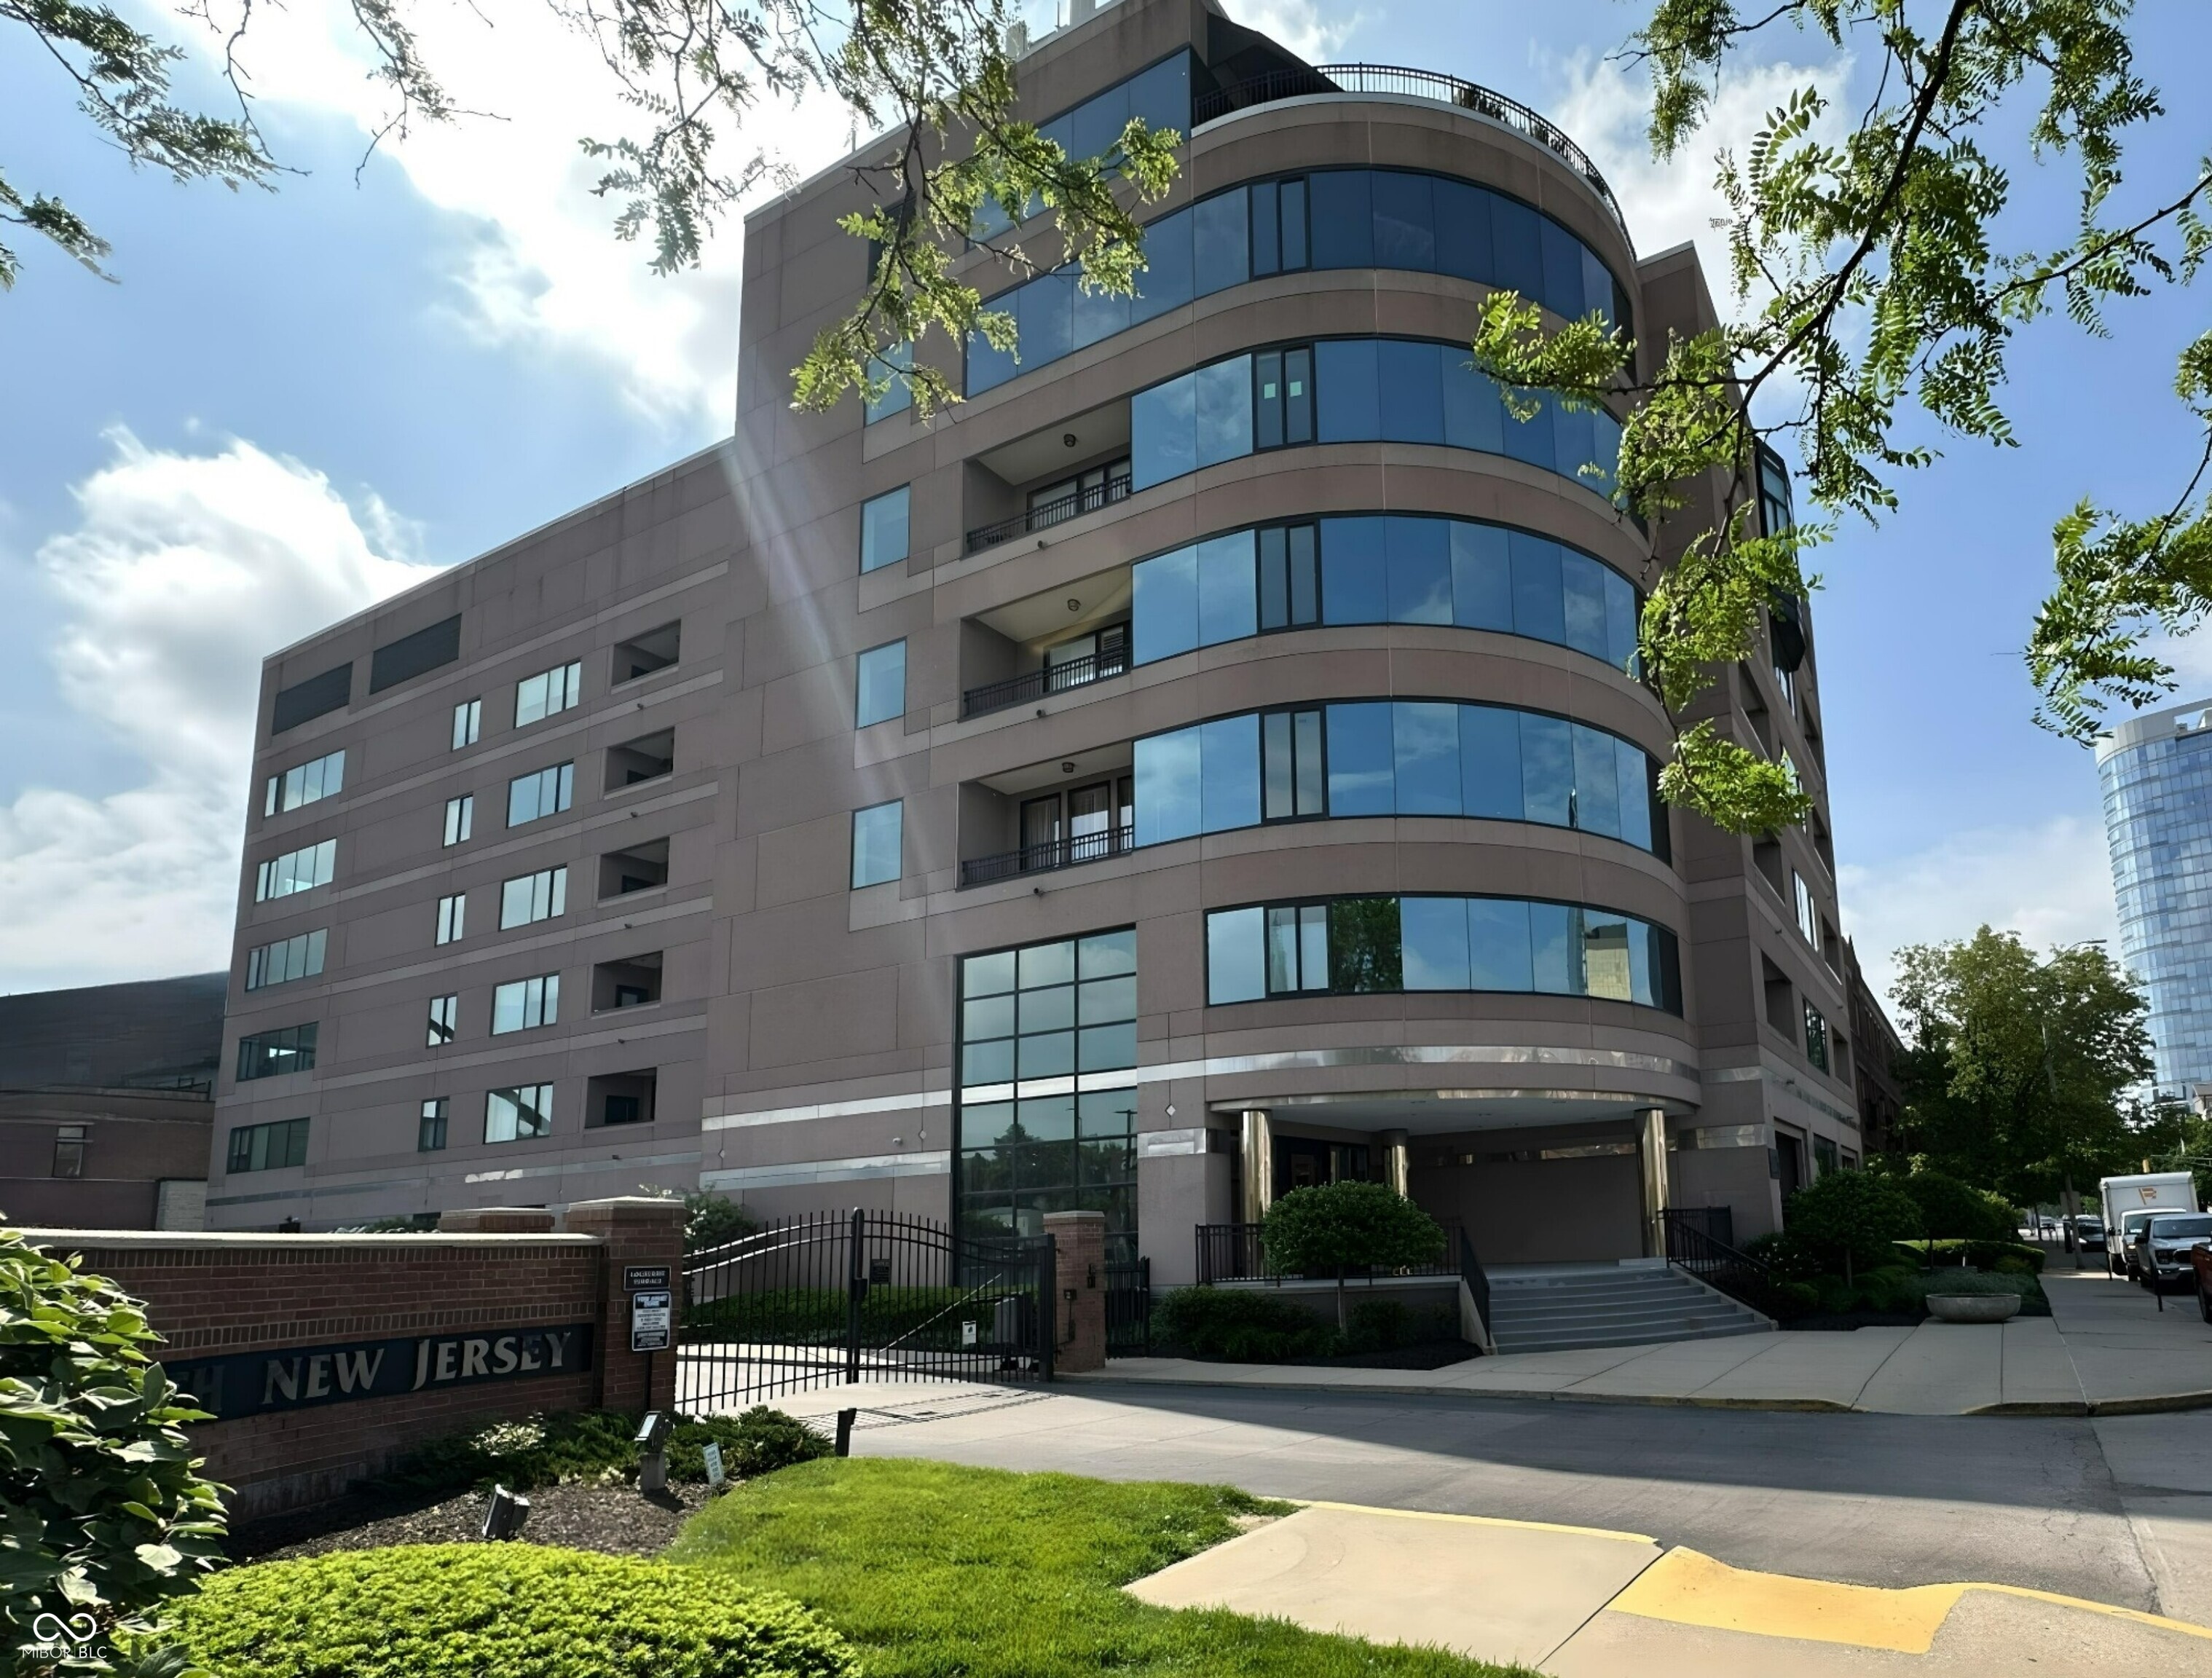
Active
$499,000
2
bds
|
2
ba
|
1,977
sqft
|
built
2003
225 N New Jersey St, Indianapolis, IN 46204
$-1,569
Cash flow
-16.4%
Cash-on-Cash Return
2.4%
Cap rate
0.6%
Rent to Value Ratio
Active
$169,990
3
bds
|
1
ba
|
902
sqft
|
built
1973
4910 W Caven St, Indianapolis, IN 46241
$26
Cash flow
0.8%
Cash-on-Cash Return
6.3%
Cap rate
0.8%
Rent to Value Ratio
Pending
$1,595,000
6
bds
|
7
ba
|
12,420
sqft
|
built
1995
8804 Waterside Dr, Indianapolis, IN 46278
$-3,965
Cash flow
-13.0%
Cash-on-Cash Return
3.2%
Cap rate
0.4%
Rent to Value Ratio
Active
$799,000
5
bds
|
4
ba
|
4,036
sqft
|
built
1992
8845 Otter Cove Cir, Indianapolis, IN 46236
$-1,375
Cash flow
-9.0%
Cash-on-Cash Return
4.1%
Cap rate
0.5%
Rent to Value Ratio
Active
$395,000
3
bds
|
3
ba
|
2,128
sqft
|
built
1925
5718 E Pleasant Run Parkway North Dr, Indianapolis, IN 46219
$-505
Cash flow
-6.7%
Cash-on-Cash Return
4.6%
Cap rate
0.6%
Rent to Value Ratio
Active
$725,000
5
bds
|
5
ba
|
5,022
sqft
|
built
1988
10350 Courageous Dr, Indianapolis, IN 46236
$-377
Cash flow
-2.7%
Cash-on-Cash Return
5.5%
Cap rate
0.7%
Rent to Value Ratio
Active
$375,000
2
bds
|
3
ba
|
1,554
sqft
|
built
1991
3260 Eddy Ct, Indianapolis, IN 46214
$-582
Cash flow
-8.1%
Cash-on-Cash Return
4.3%
Cap rate
0.5%
Rent to Value Ratio
Active
$925,000
2
bds
|
3
ba
|
3,078
sqft
|
built
1940
610 N Park Ave, Indianapolis, IN 46204
$-1,702
Cash flow
-9.6%
Cash-on-Cash Return
3.9%
Cap rate
0.5%
Rent to Value Ratio
Active
$1,175,000
4
bds
|
4
ba
|
6,316
sqft
|
built
1947
6230 E 56th St, Indianapolis, IN 46226
$-1,569
Cash flow
-7.0%
Cash-on-Cash Return
4.5%
Cap rate
0.6%
Rent to Value Ratio