Indianapolis, IN Investment Properties for Sale
Browse homes for sale and investment properties in Indianapolis, IN. Refine your search by price, property type, or more.
Best cash flowing properties in Indianapolis, IN
Active
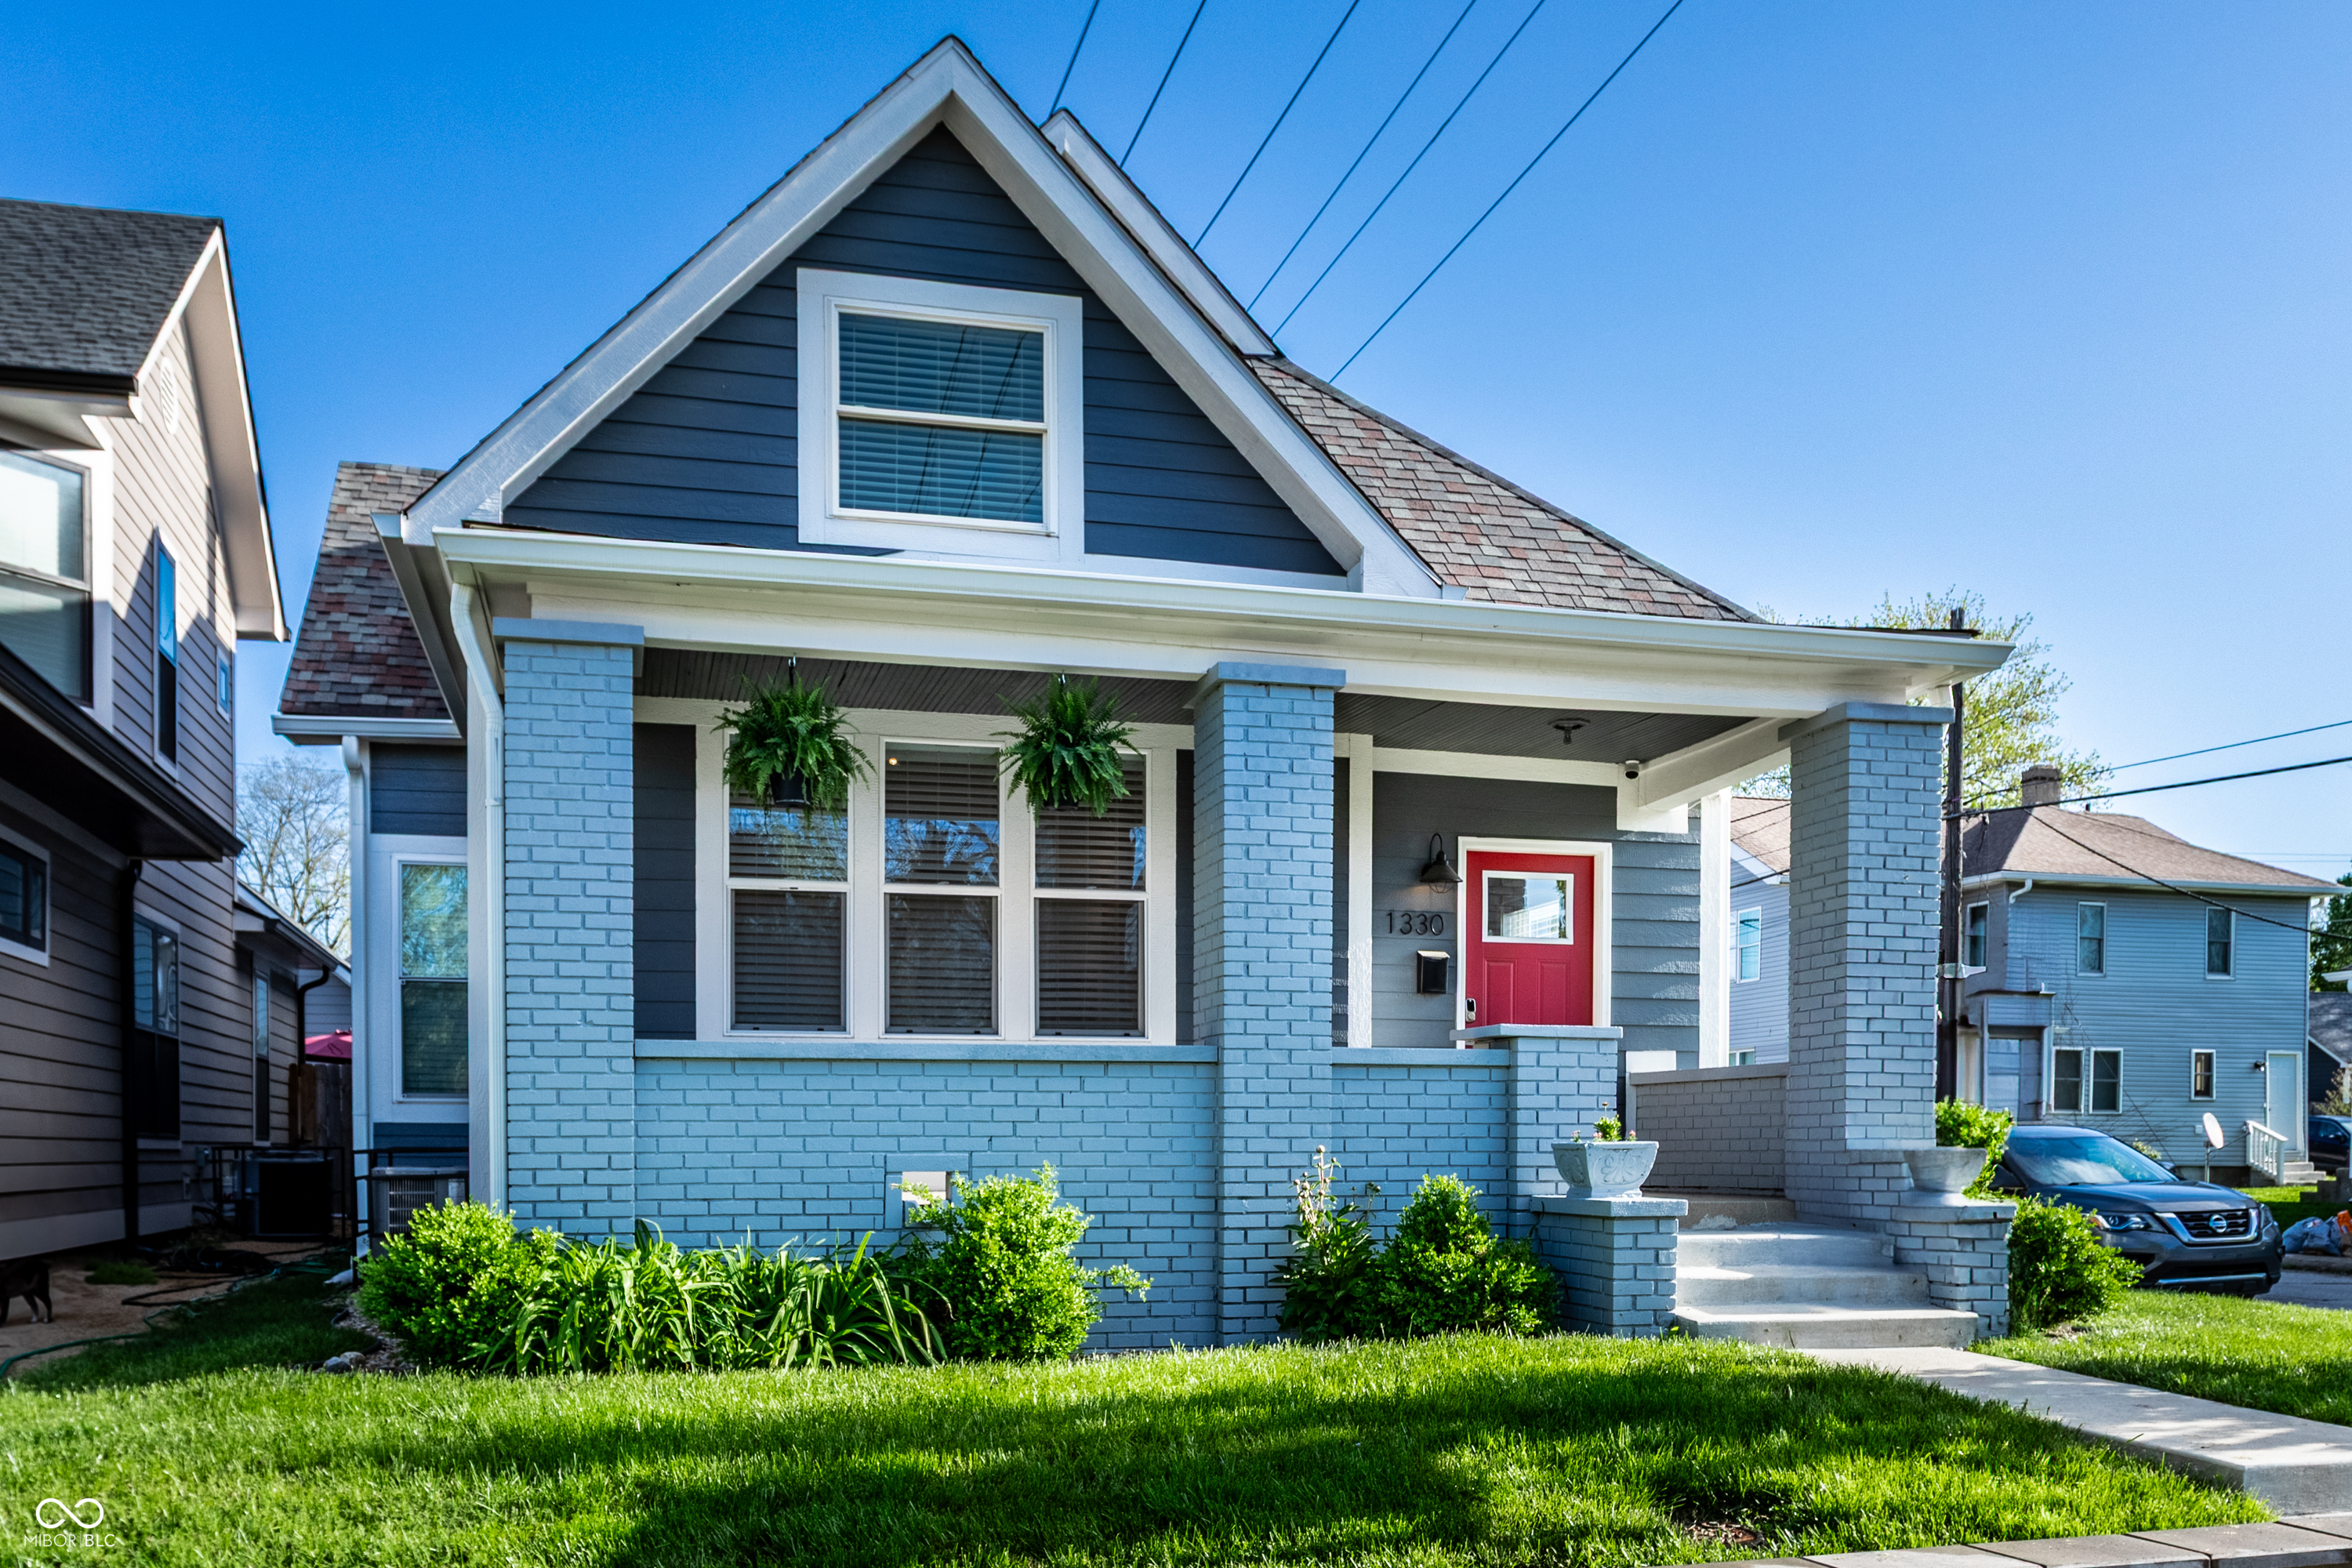
$415,000
3
bds
|
3
ba
|
2,767
sqft
|
built
1910
1330 Marlowe Ave, Indianapolis, IN 46202
$358
Cash flow
4.5%
Cash-on-Cash Return
7.2%
Cap rate
0.9%
Rent to Value Ratio
Active
$109,900
3
bds
|
1
ba
|
1,808
sqft
|
built
1910
2165 S Meridian St, Indianapolis, IN 46225
$334
Cash flow
15.9%
Cash-on-Cash Return
9.8%
Cap rate
1.2%
Rent to Value Ratio
1,984 out of 2,125 properties for sale in Indianapolis, IN
Limited Results Shown
Create a free account, or log in to reveal all property listings and enjoy the complete experience.
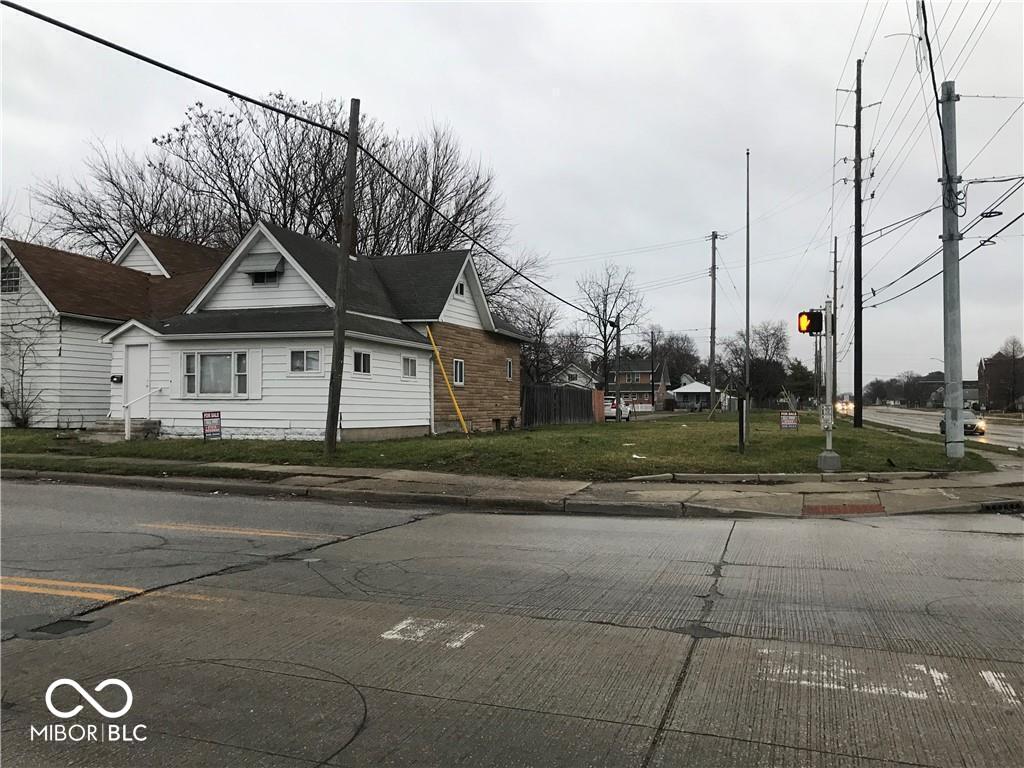
Active
$215,000
2
bds
|
0
ba
|
0
sqft
|
built
1920
626 N Euclid Ave, Indianapolis, IN 46201
$-411
Cash flow
-10.0%
Cash-on-Cash Return
3.9%
Cap rate
0.5%
Rent to Value Ratio
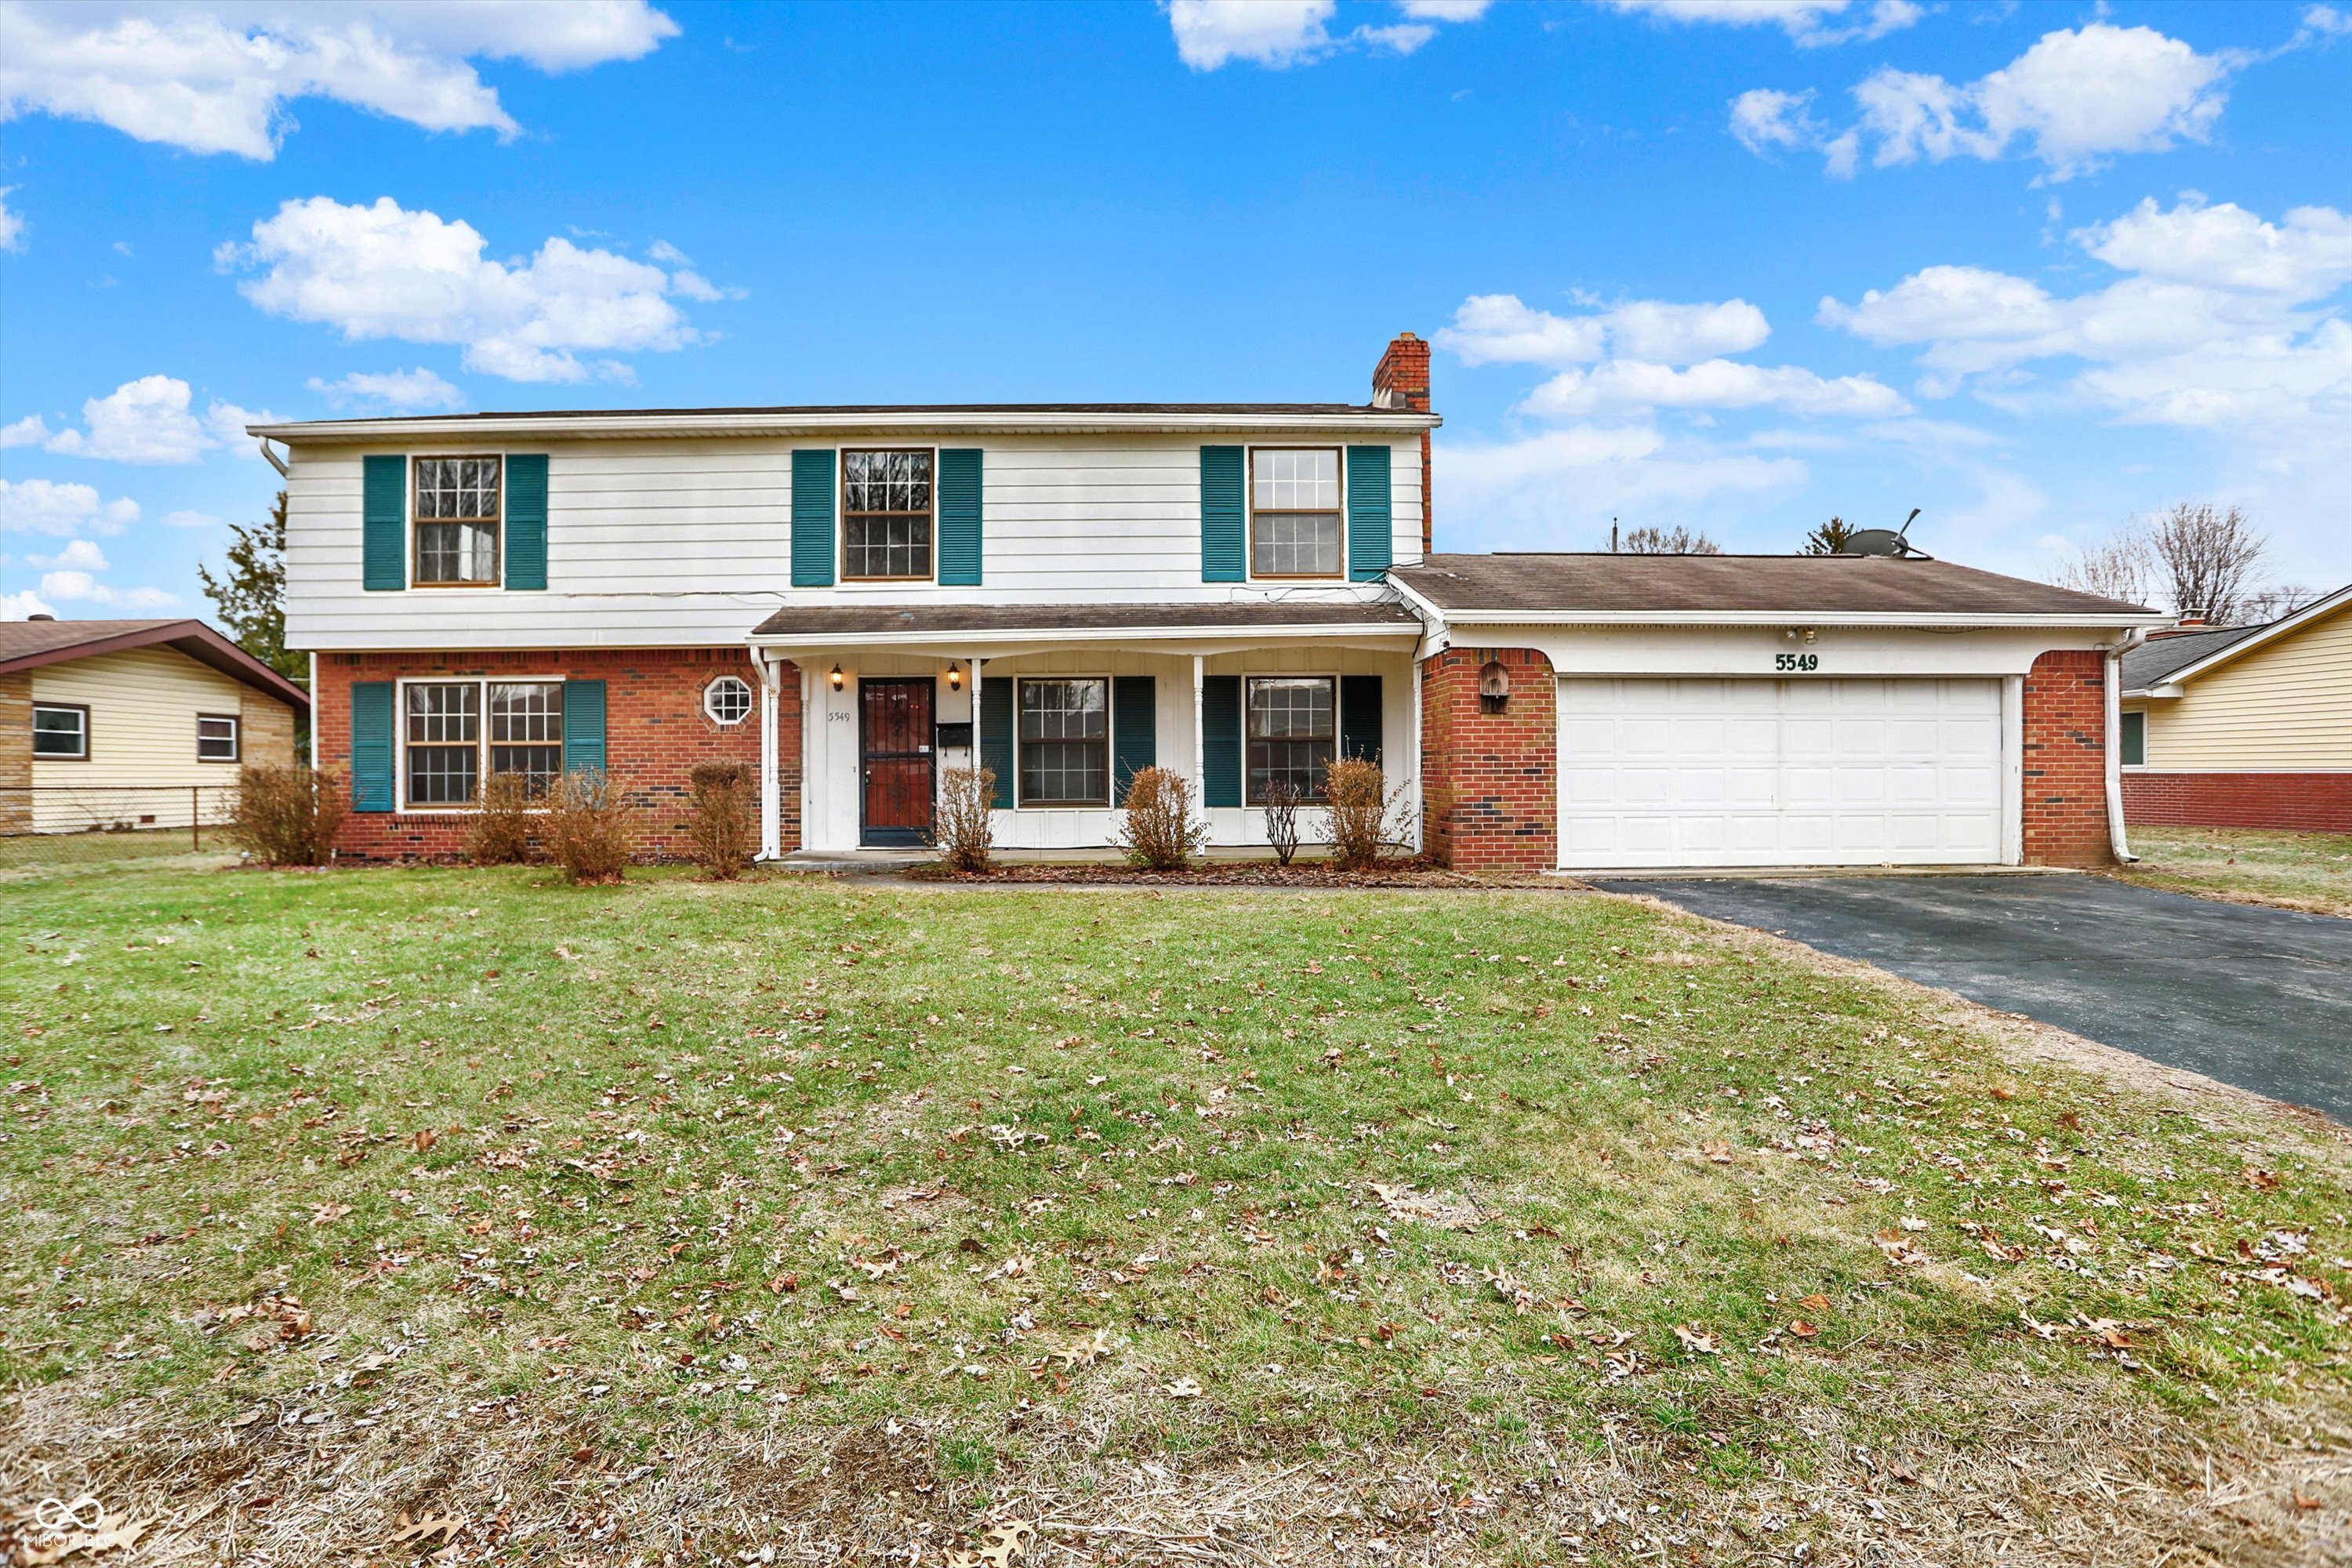
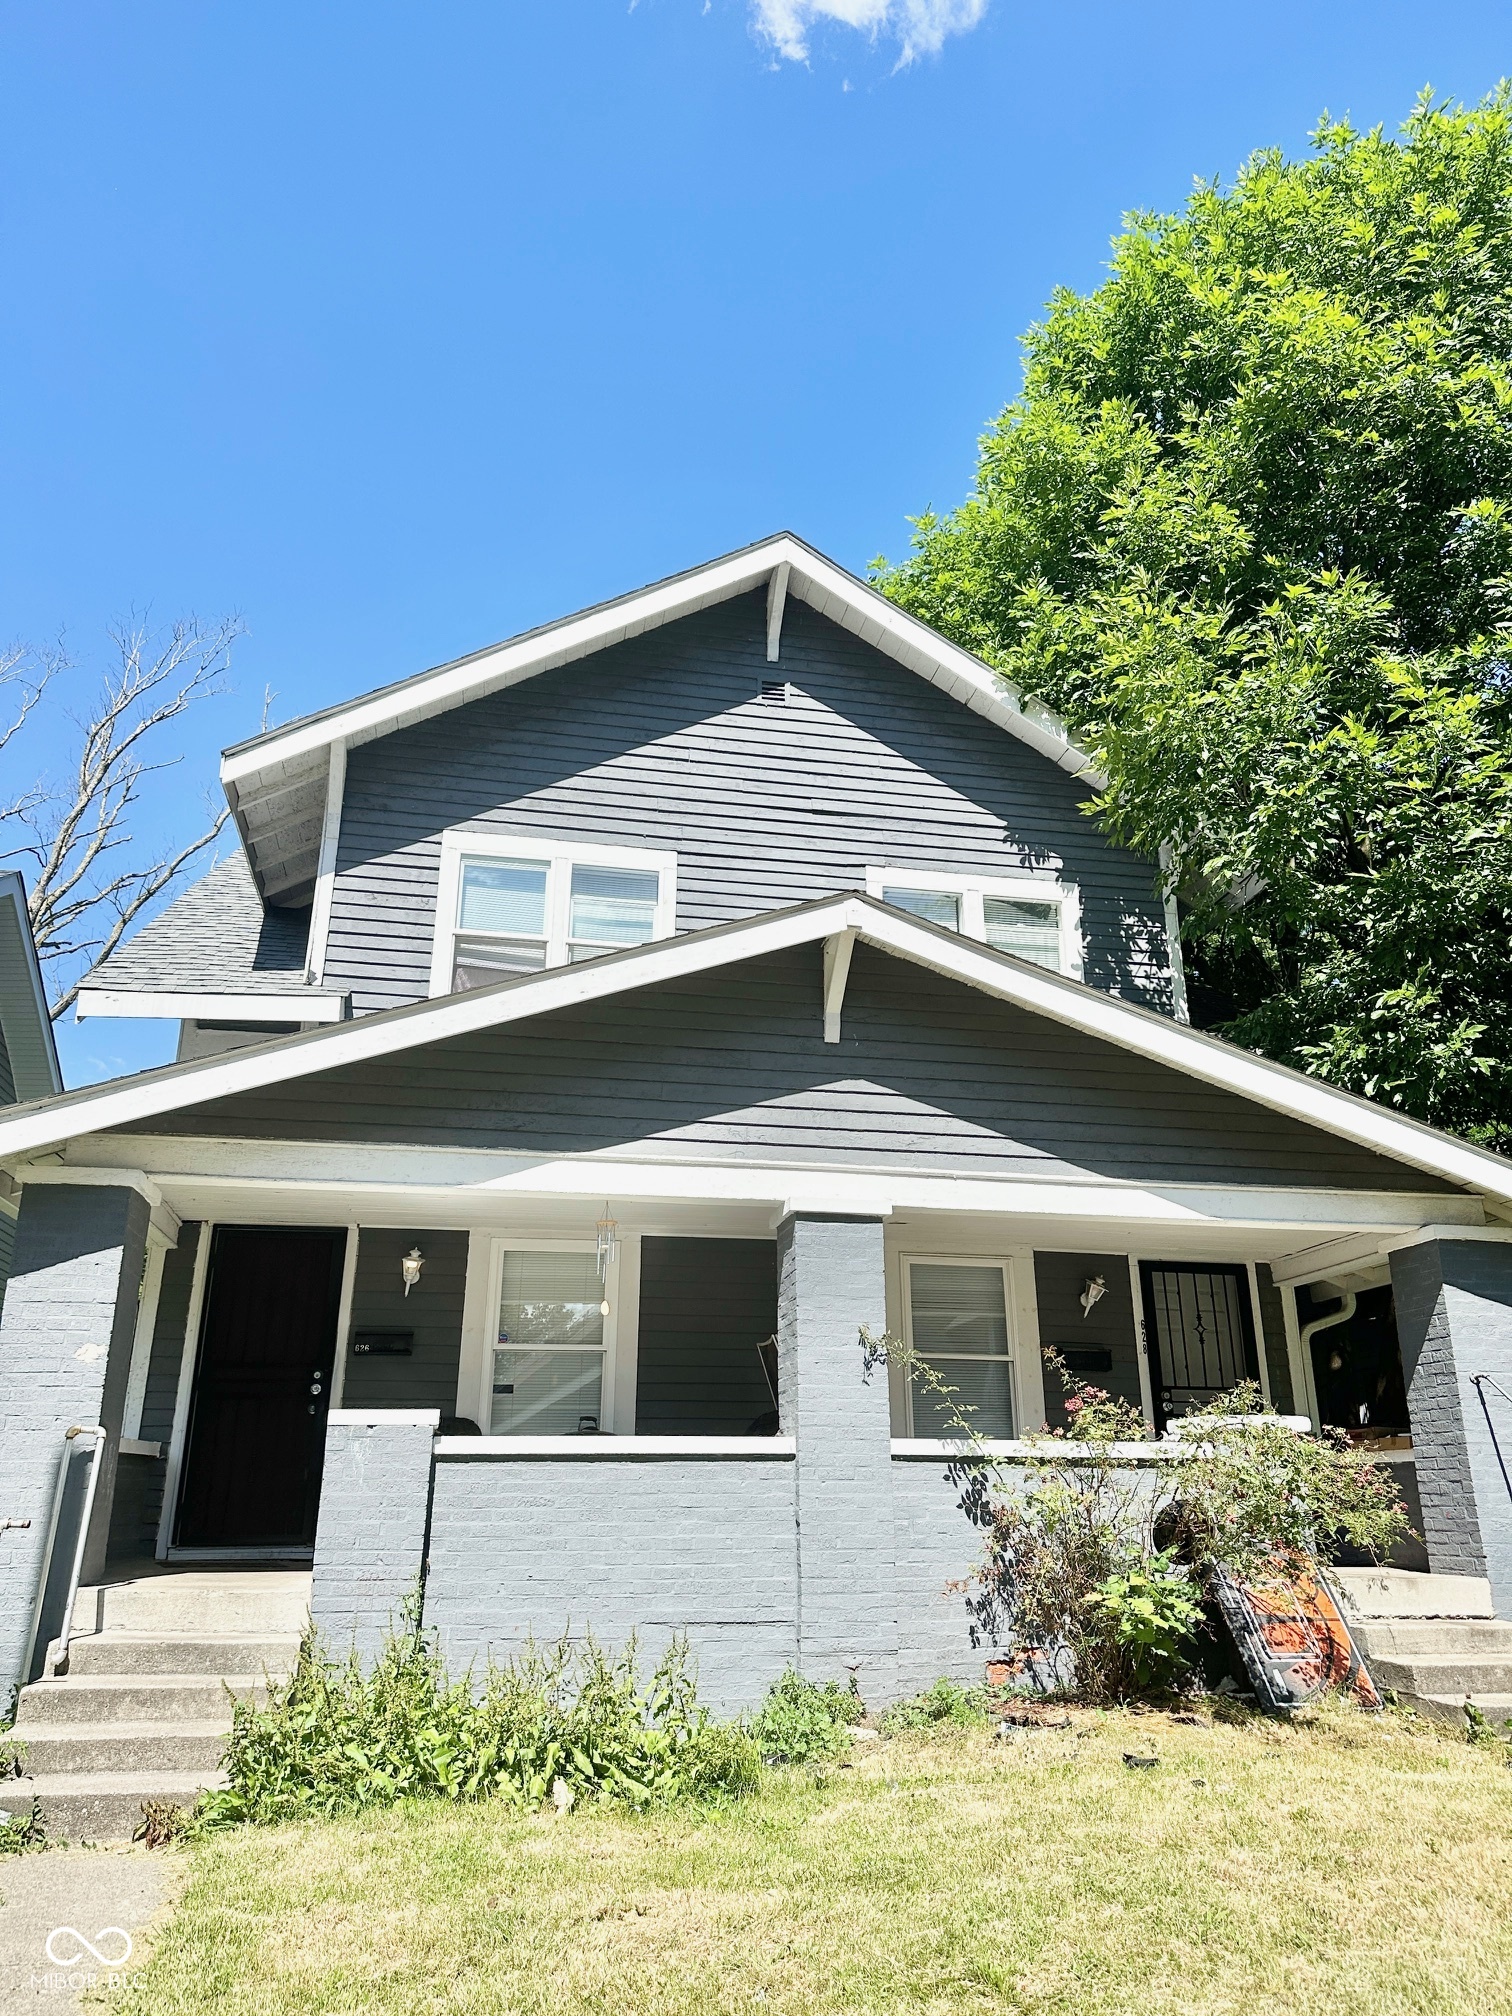
Active
$295,900
4
bds
|
3
ba
|
2,666
sqft
|
built
1962
5549 Hollister Dr, Indianapolis, IN 46224
$-136
Cash flow
-2.4%
Cash-on-Cash Return
5.6%
Cap rate
0.7%
Rent to Value Ratio
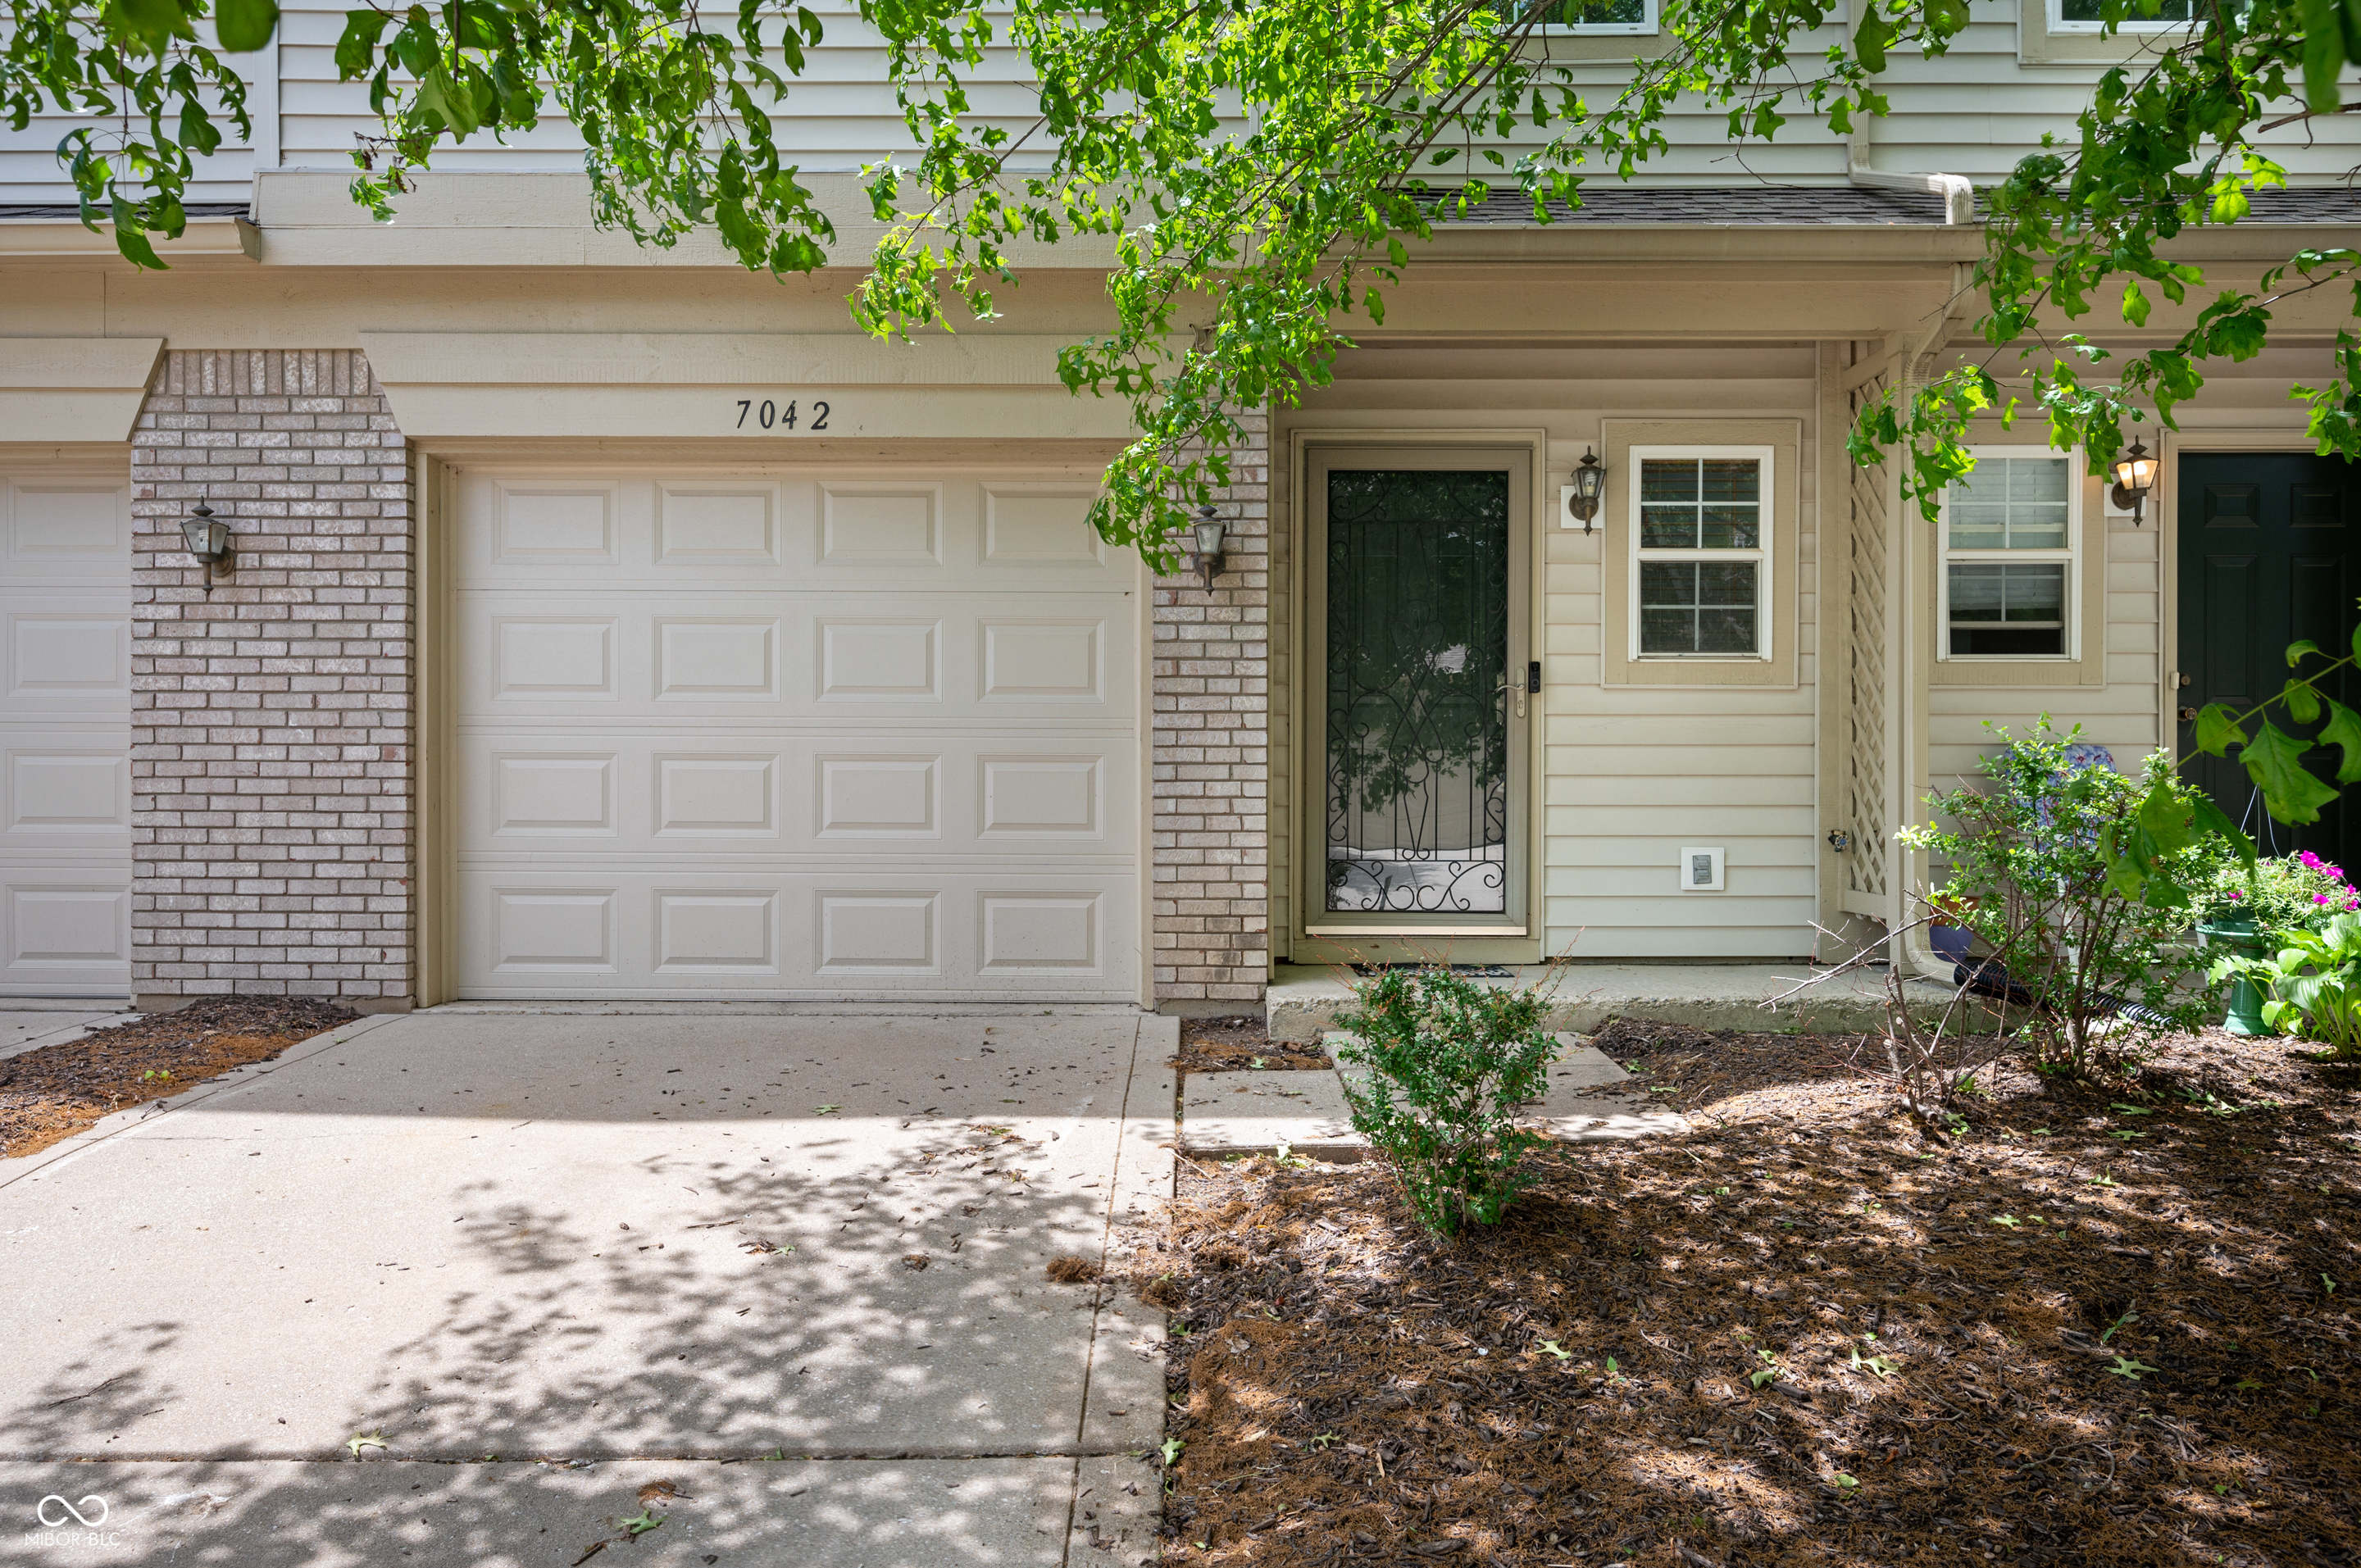
Active
$204,900
2
bds
|
3
ba
|
1,386
sqft
|
built
2000
7042 Tyler Ln, Indianapolis, IN 46217
$-241
Cash flow
-6.1%
Cash-on-Cash Return
4.7%
Cap rate
0.8%
Rent to Value Ratio
Active
$210,000
2
bds
|
1
ba
|
1,462
sqft
|
built
1930
1924 E Maryland St, Indianapolis, IN 46201
$-248
Cash flow
-6.2%
Cash-on-Cash Return
4.7%
Cap rate
0.6%
Rent to Value Ratio
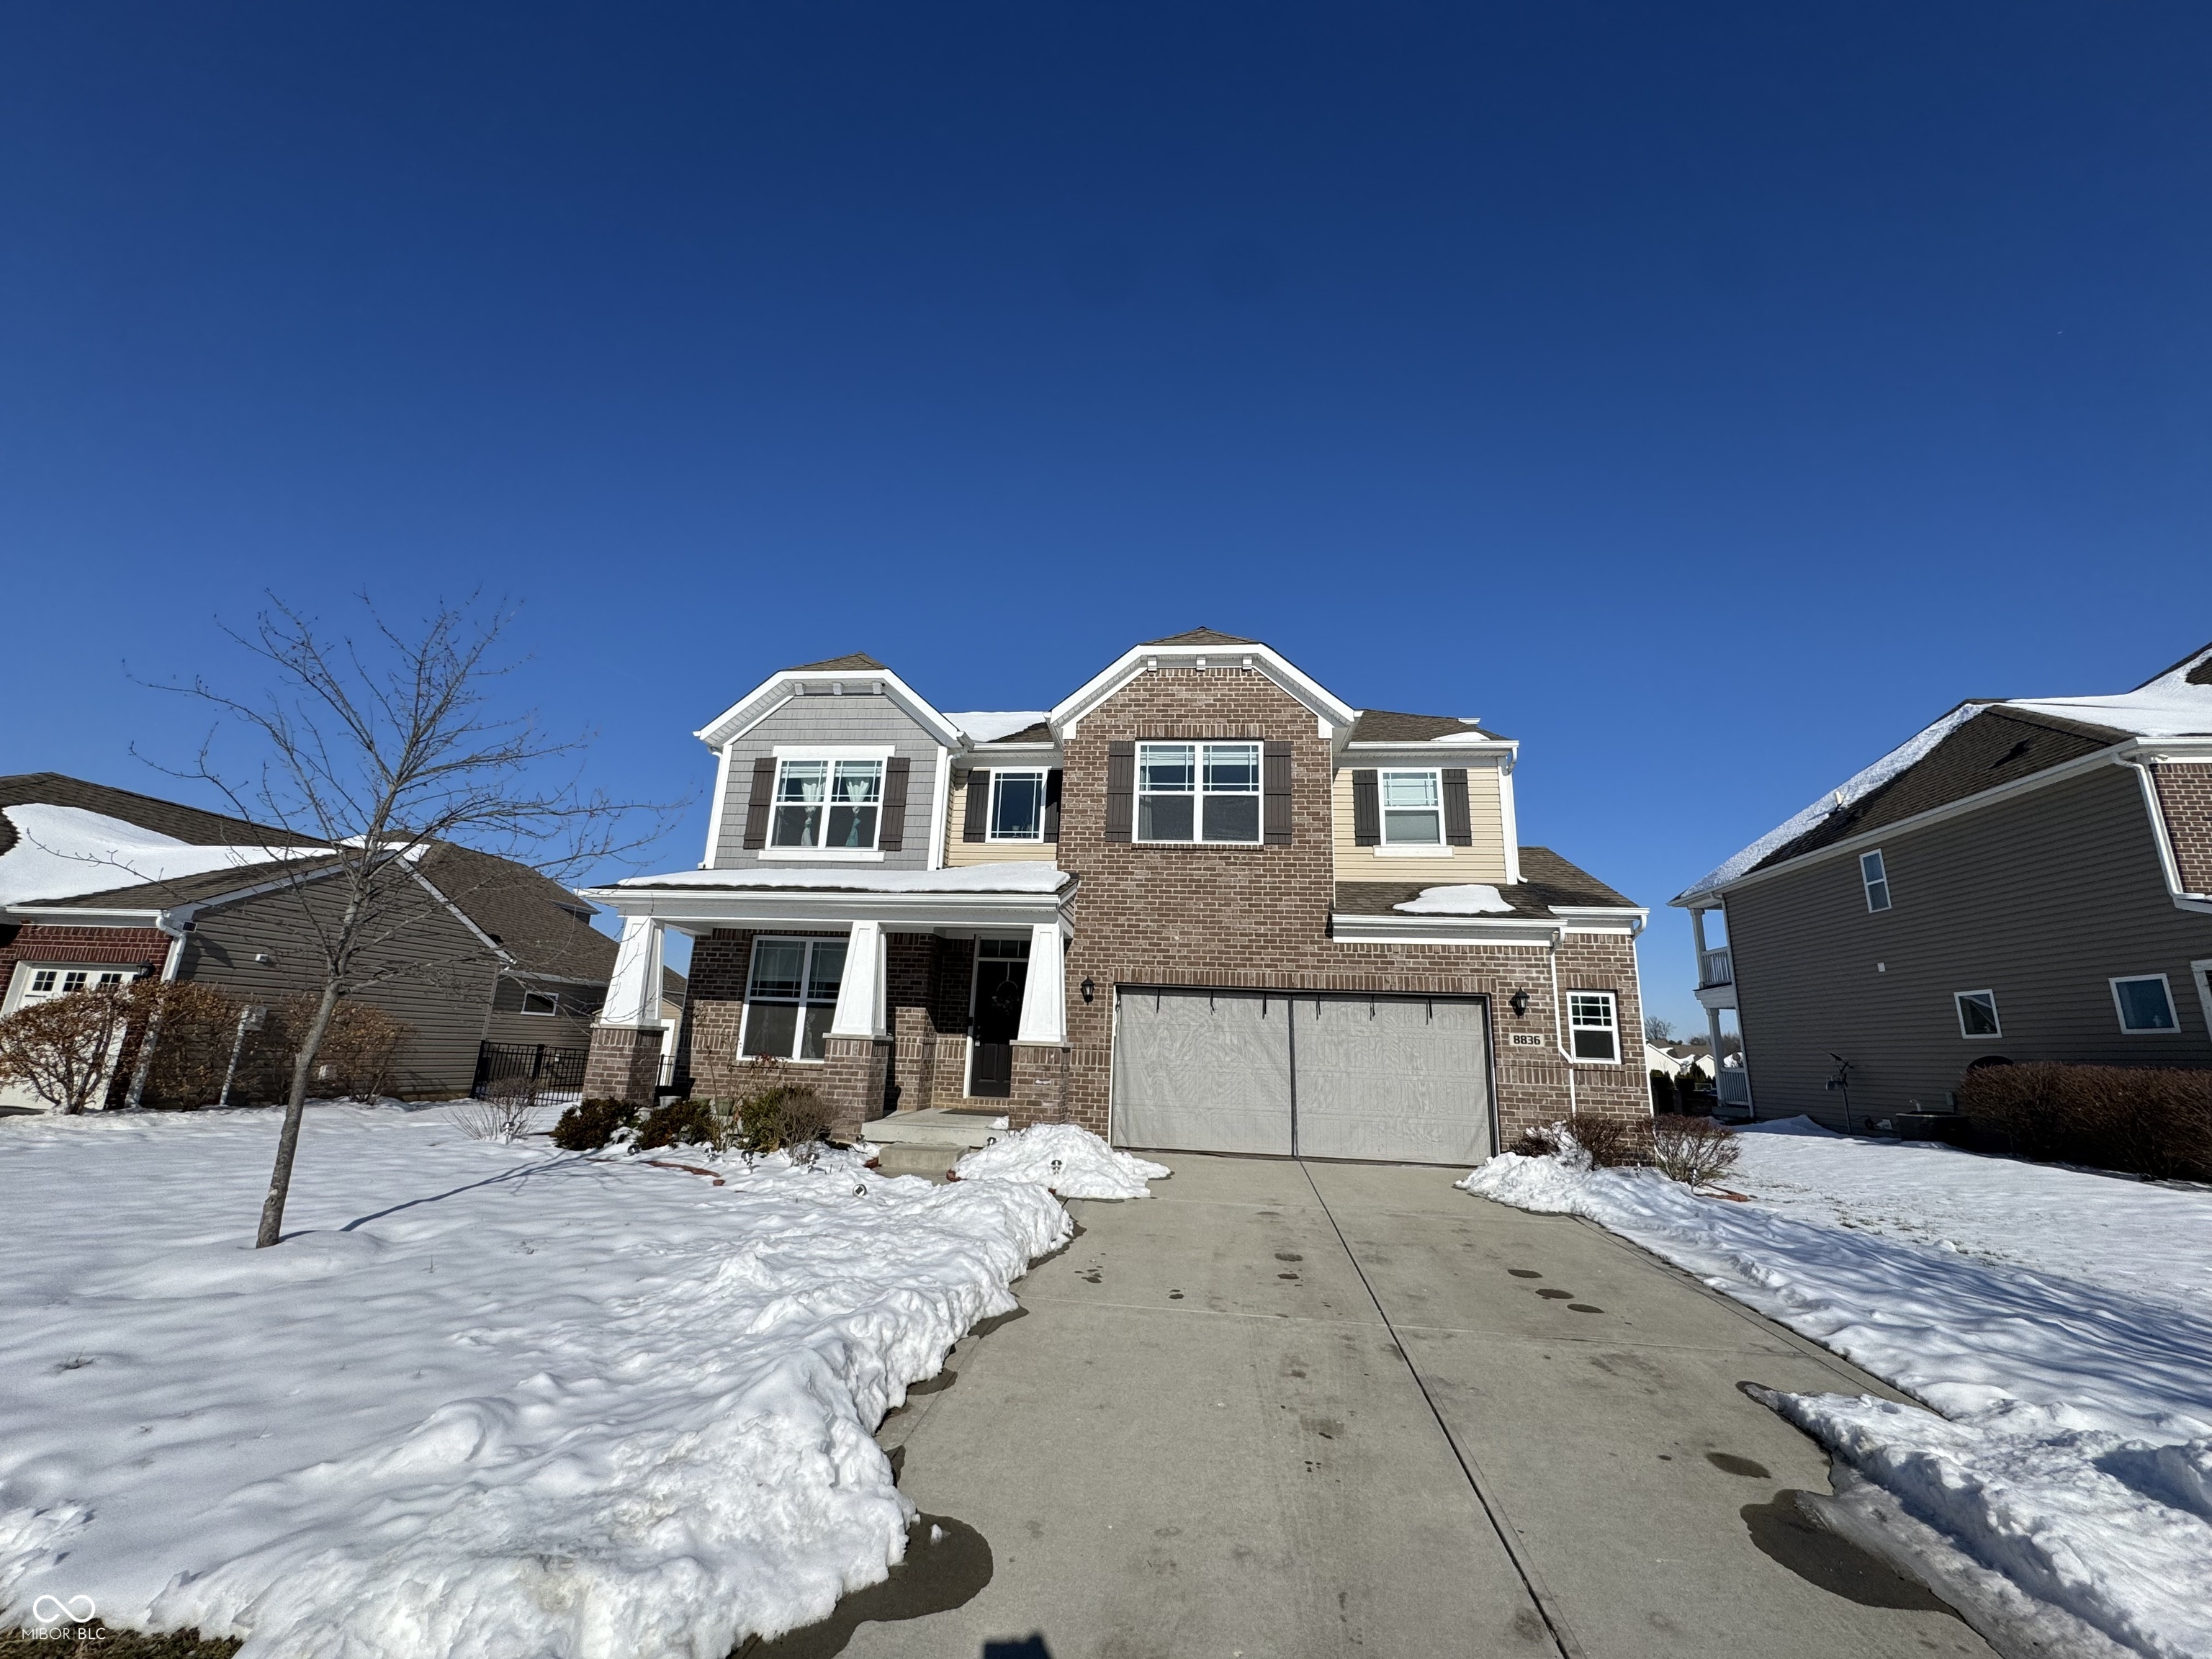
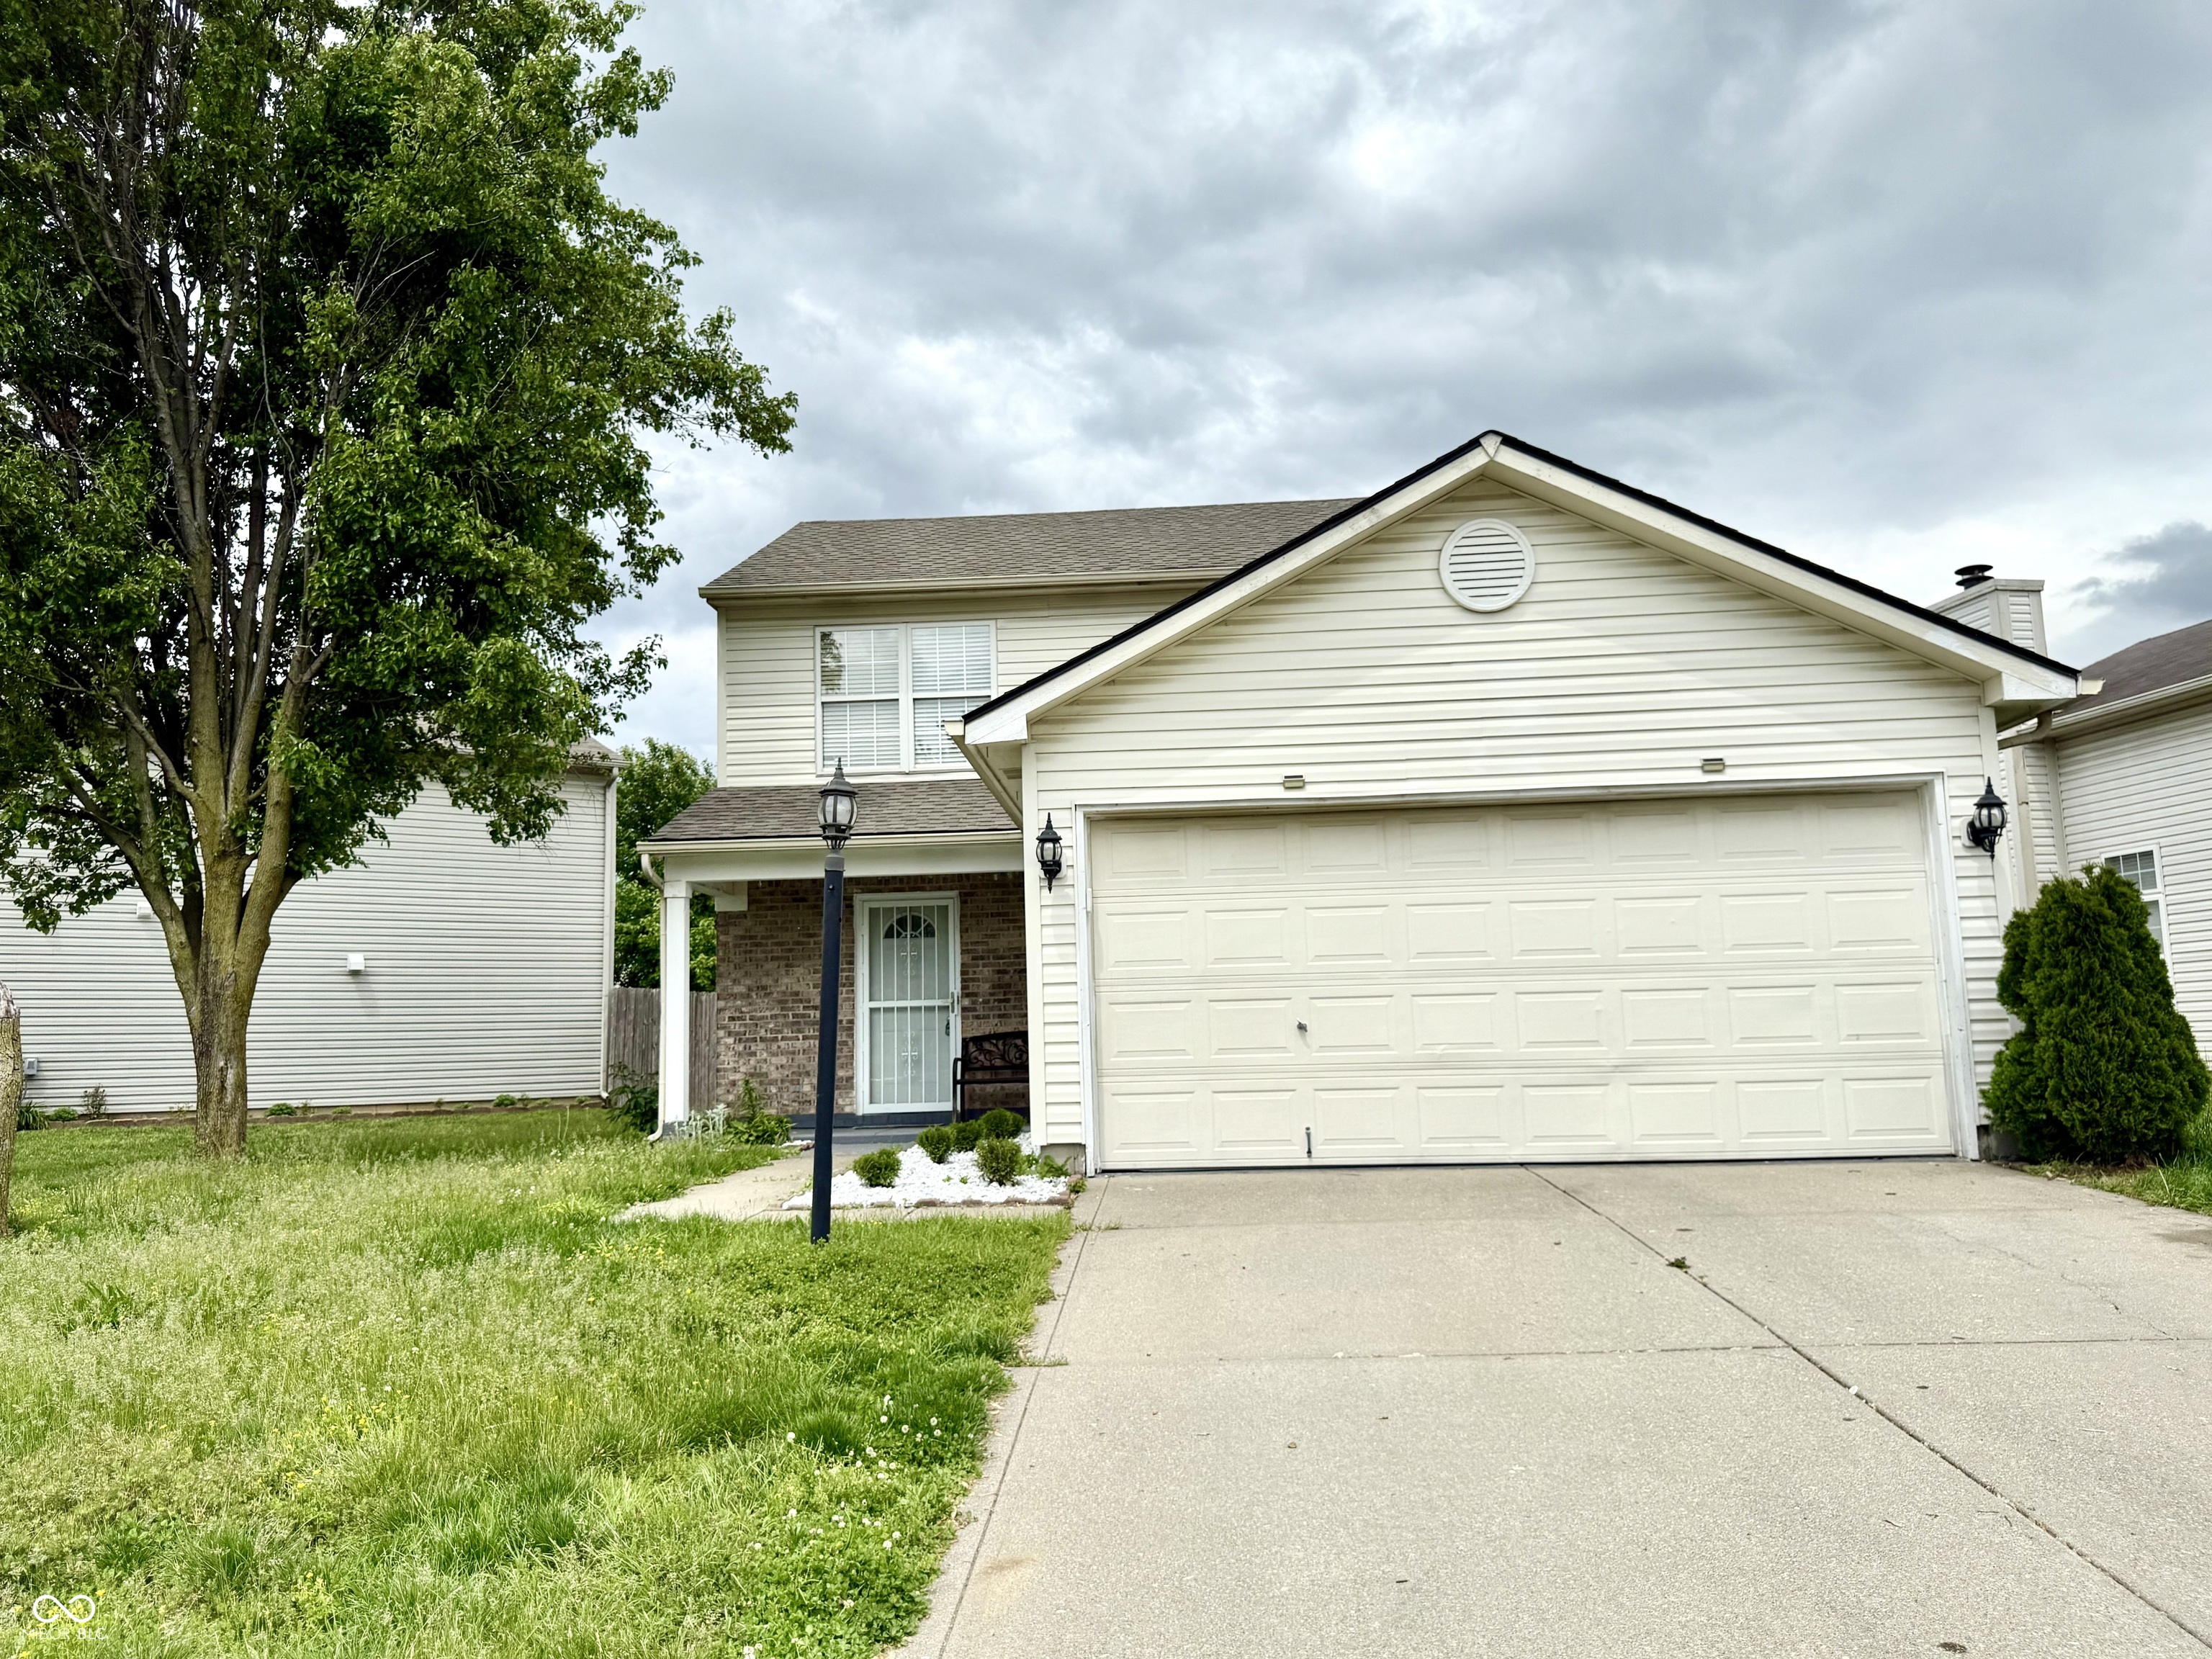
Active
$399,900
4
bds
|
3
ba
|
3,651
sqft
|
built
2016
8836 Hornady Ct, Indianapolis, IN 46239
$-145
Cash flow
-1.9%
Cash-on-Cash Return
5.7%
Cap rate
0.7%
Rent to Value Ratio
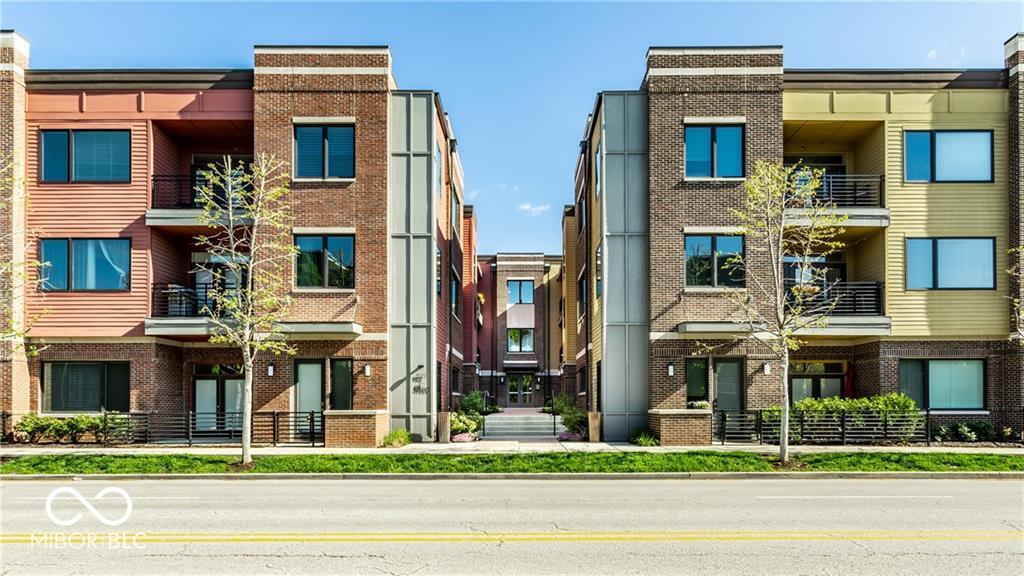
Active
$319,000
1
bds
|
1
ba
|
1,041
sqft
|
built
2015
622 E 10th St, Indianapolis, IN 46202
$-445
Cash flow
-7.3%
Cash-on-Cash Return
4.5%
Cap rate
0.7%
Rent to Value Ratio
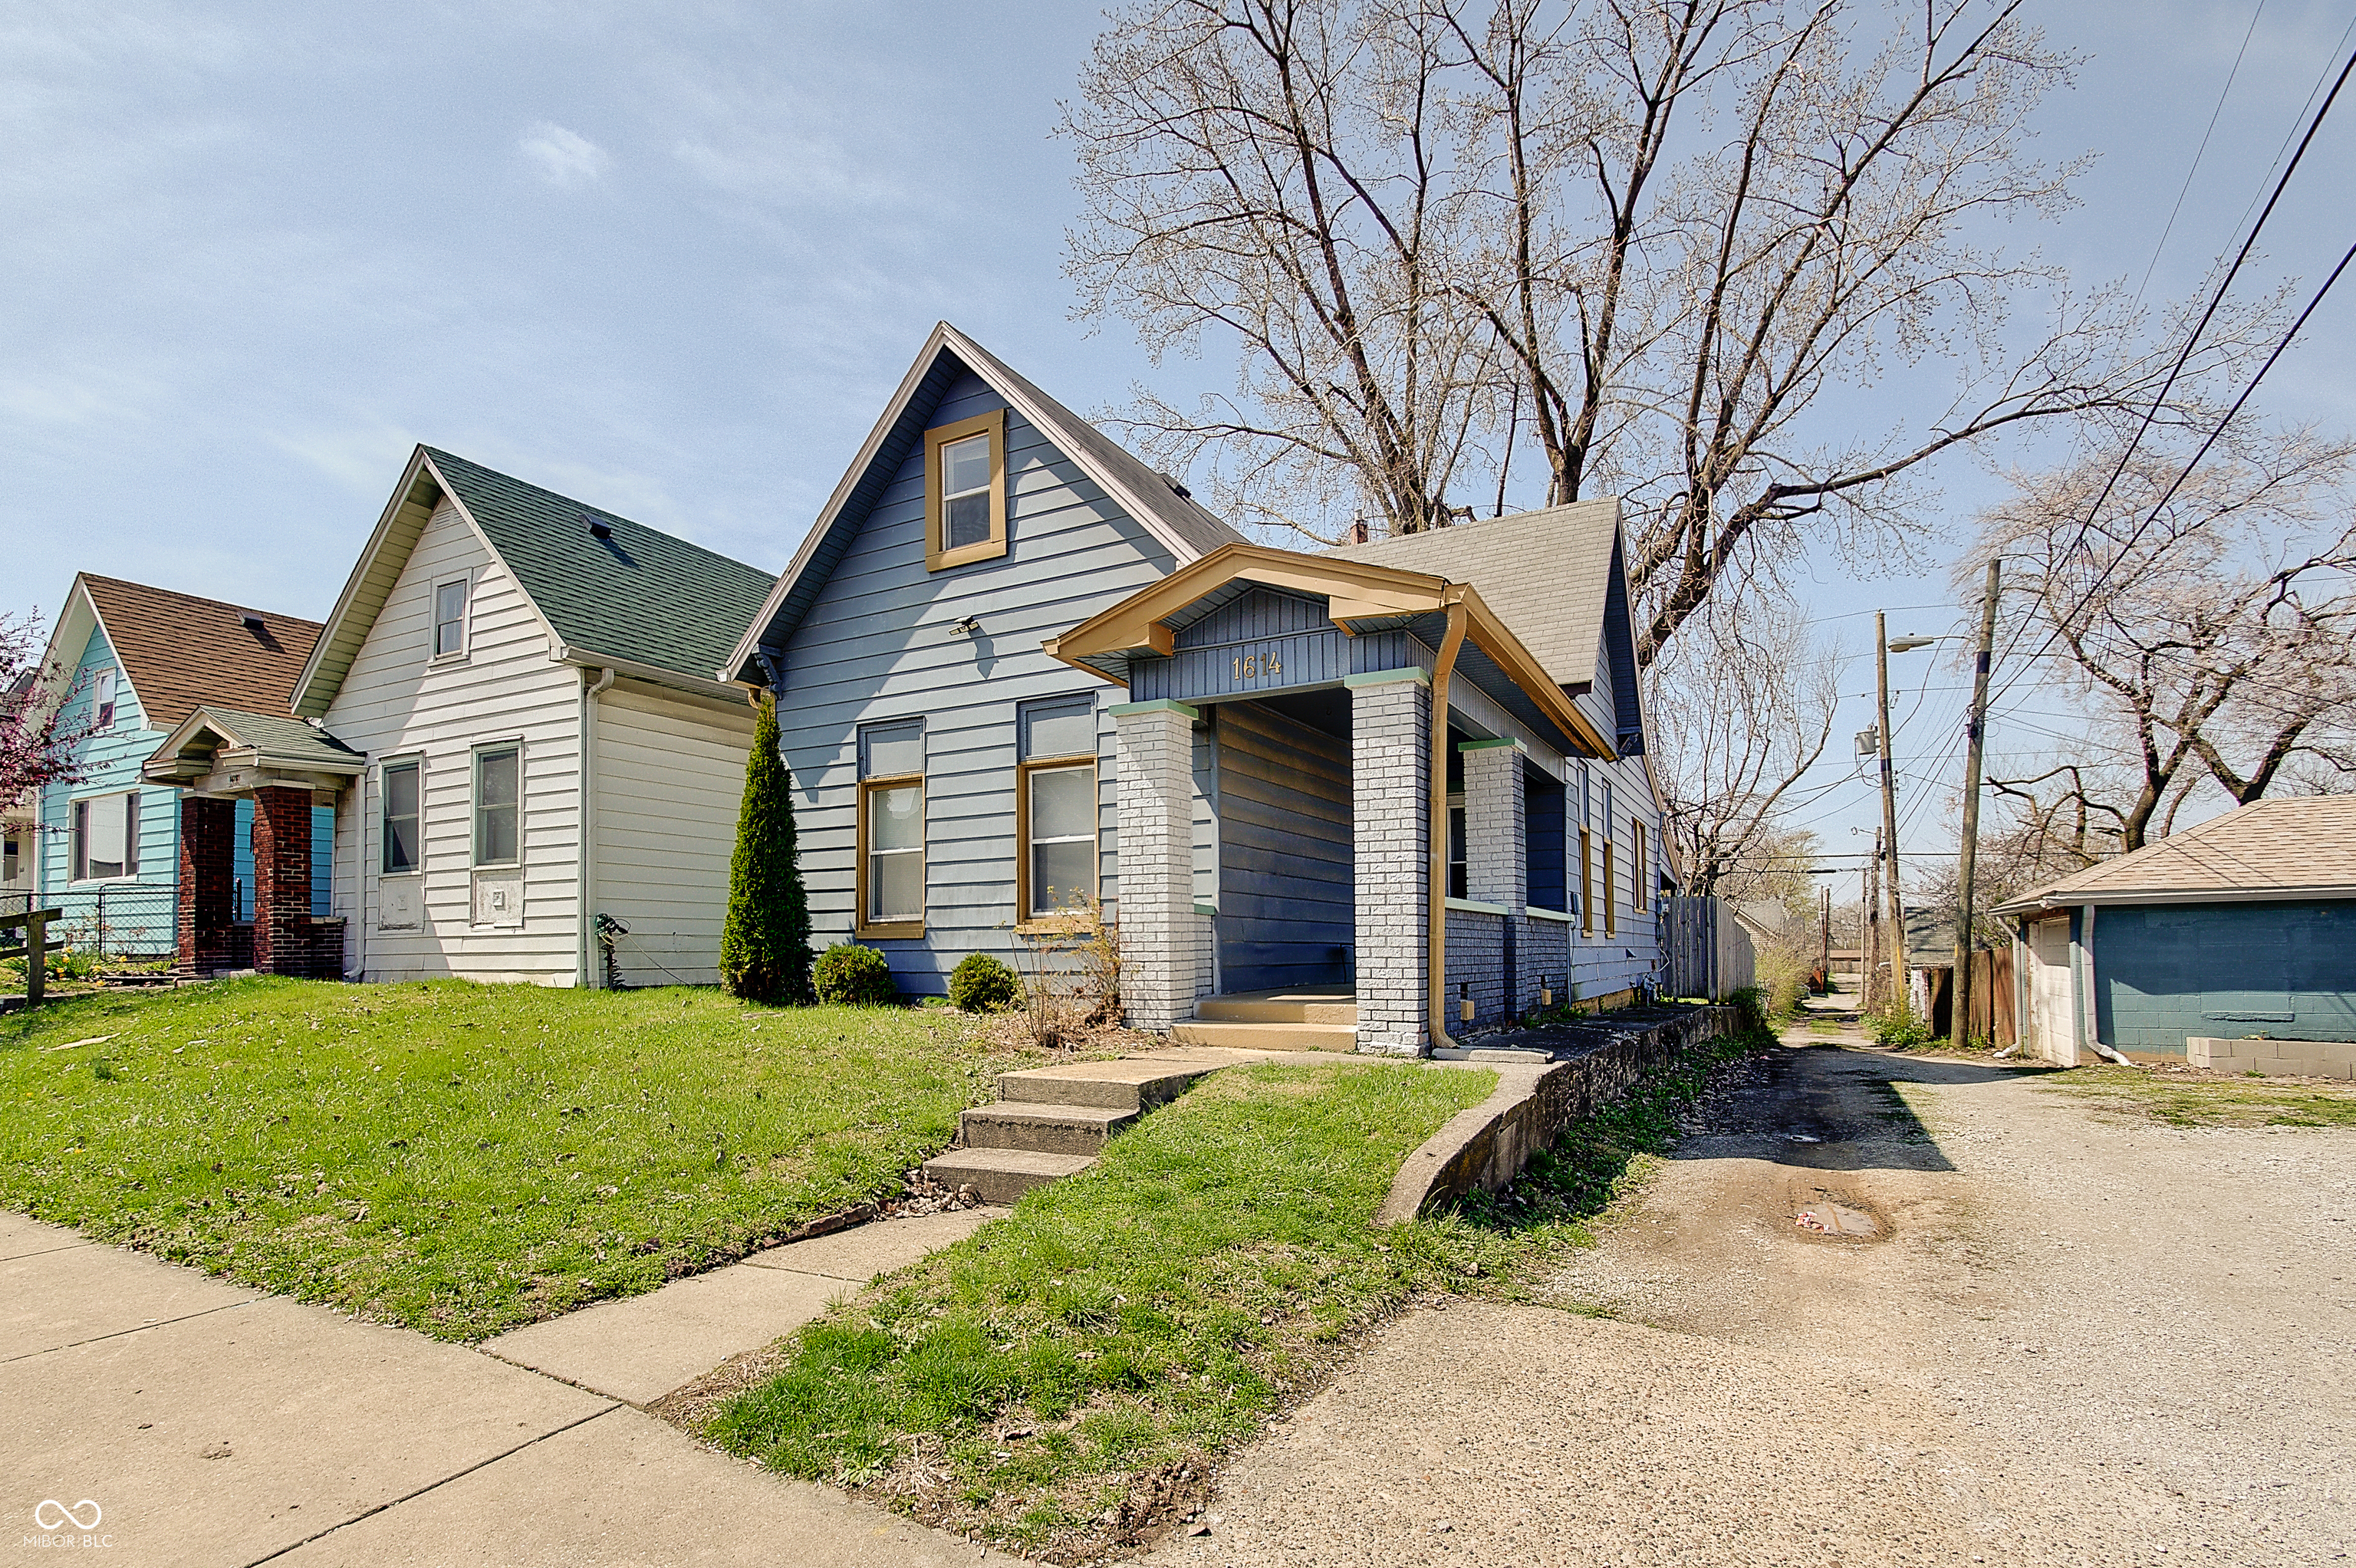
Active
$234,900
4
bds
|
1
ba
|
1,617
sqft
|
built
1900
1614 S Talbott St, Indianapolis, IN 46225
$-99
Cash flow
-2.2%
Cash-on-Cash Return
5.6%
Cap rate
0.7%
Rent to Value Ratio
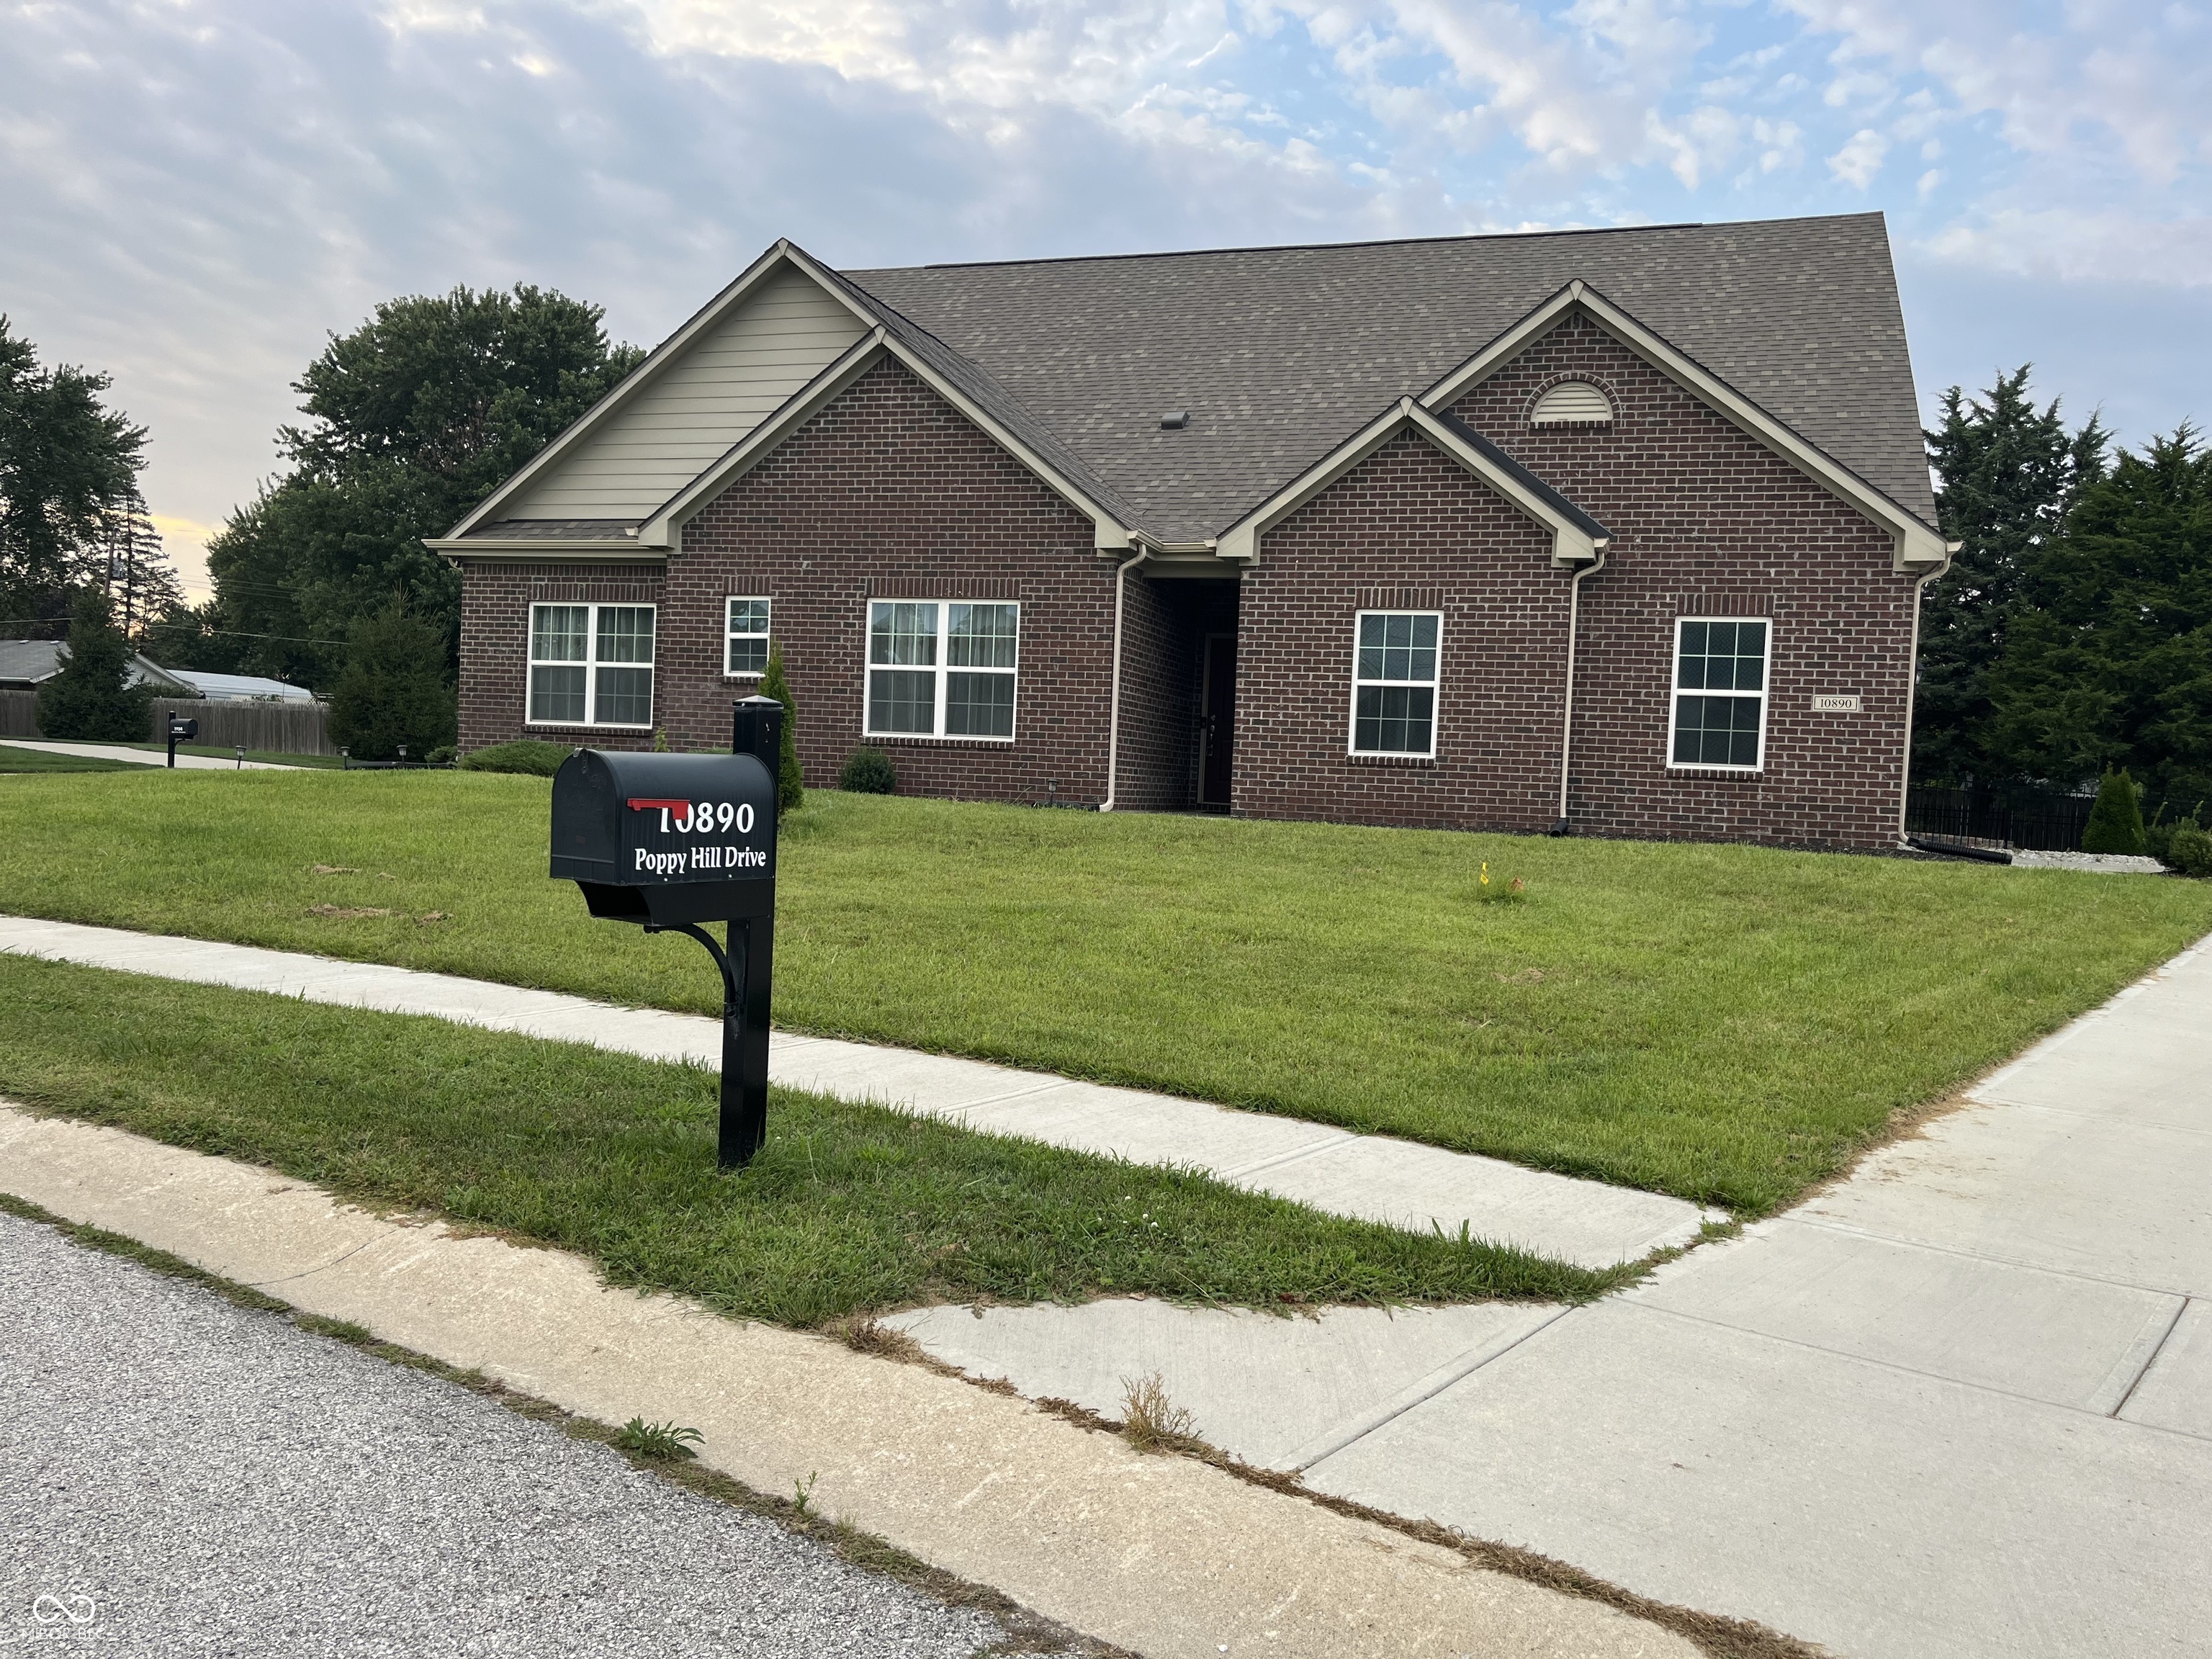
Active
$393,000
4
bds
|
4
ba
|
2,488
sqft
|
built
2020
10890 Poppy Hill Dr, Indianapolis, IN 46234
$-123
Cash flow
-1.6%
Cash-on-Cash Return
5.8%
Cap rate
0.7%
Rent to Value Ratio
Pending
$325,000
4
bds
|
3
ba
|
2,512
sqft
|
built
2018
10448 Pintail Ln, Indianapolis, IN 46239
$25
Cash flow
0.4%
Cash-on-Cash Return
6.2%
Cap rate
0.8%
Rent to Value Ratio

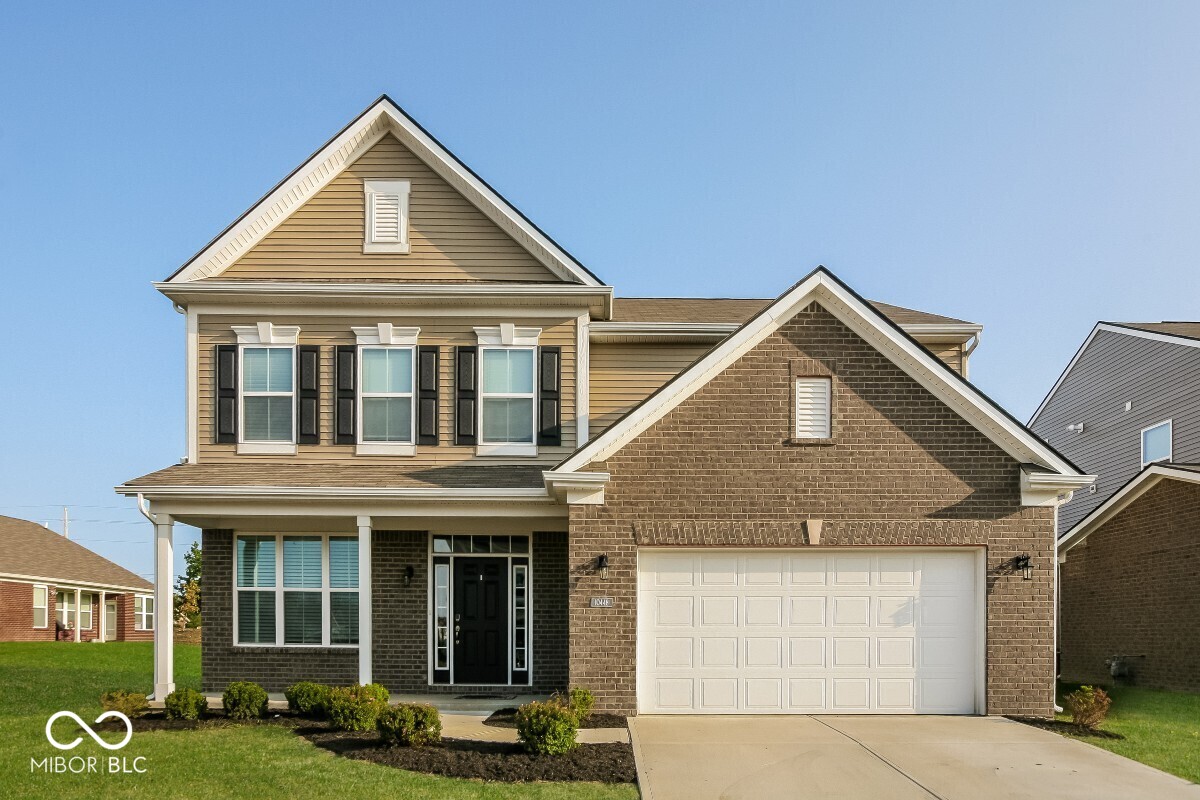
Active
$329,000
5
bds
|
3
ba
|
3,125
sqft
|
built
2011
3529 Miesha Dr, Indianapolis, IN 46217
$-131
Cash flow
-2.1%
Cash-on-Cash Return
5.7%
Cap rate
0.7%
Rent to Value Ratio
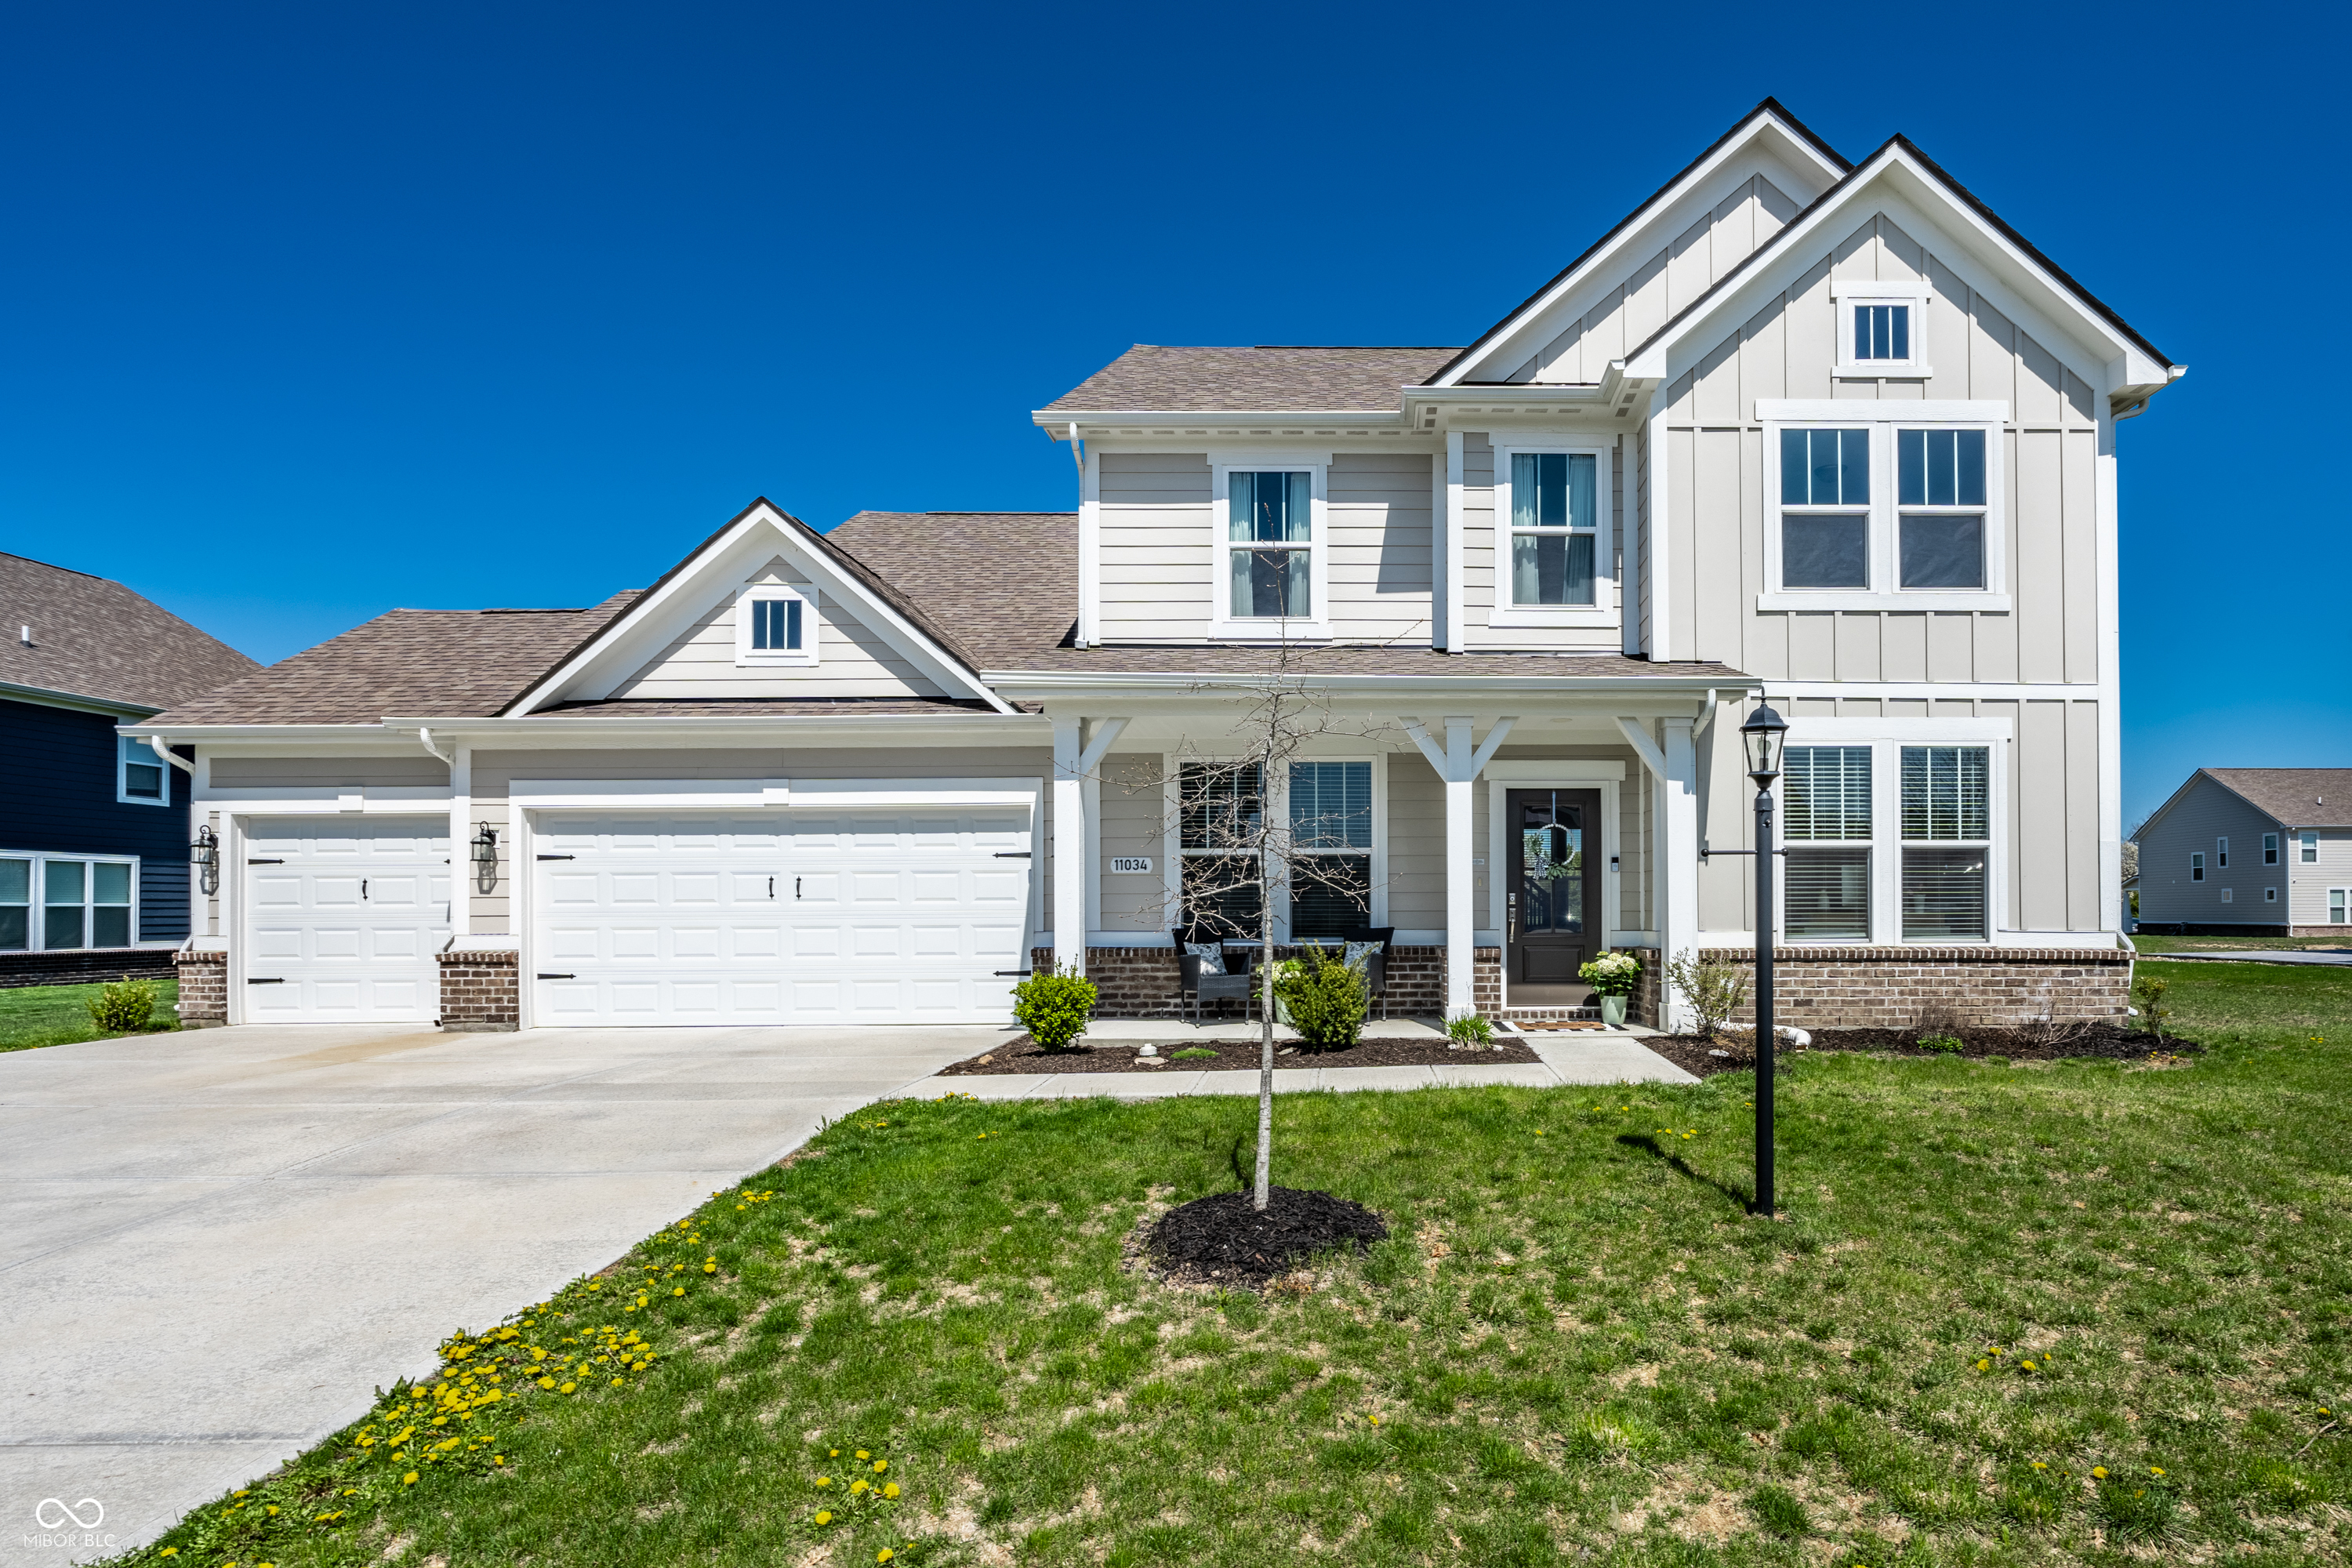
Active
$395,000
4
bds
|
3
ba
|
2,470
sqft
|
built
2021
11034 Saddlebred Dr, Indianapolis, IN 46239
$-351
Cash flow
-4.6%
Cash-on-Cash Return
5.1%
Cap rate
0.6%
Rent to Value Ratio
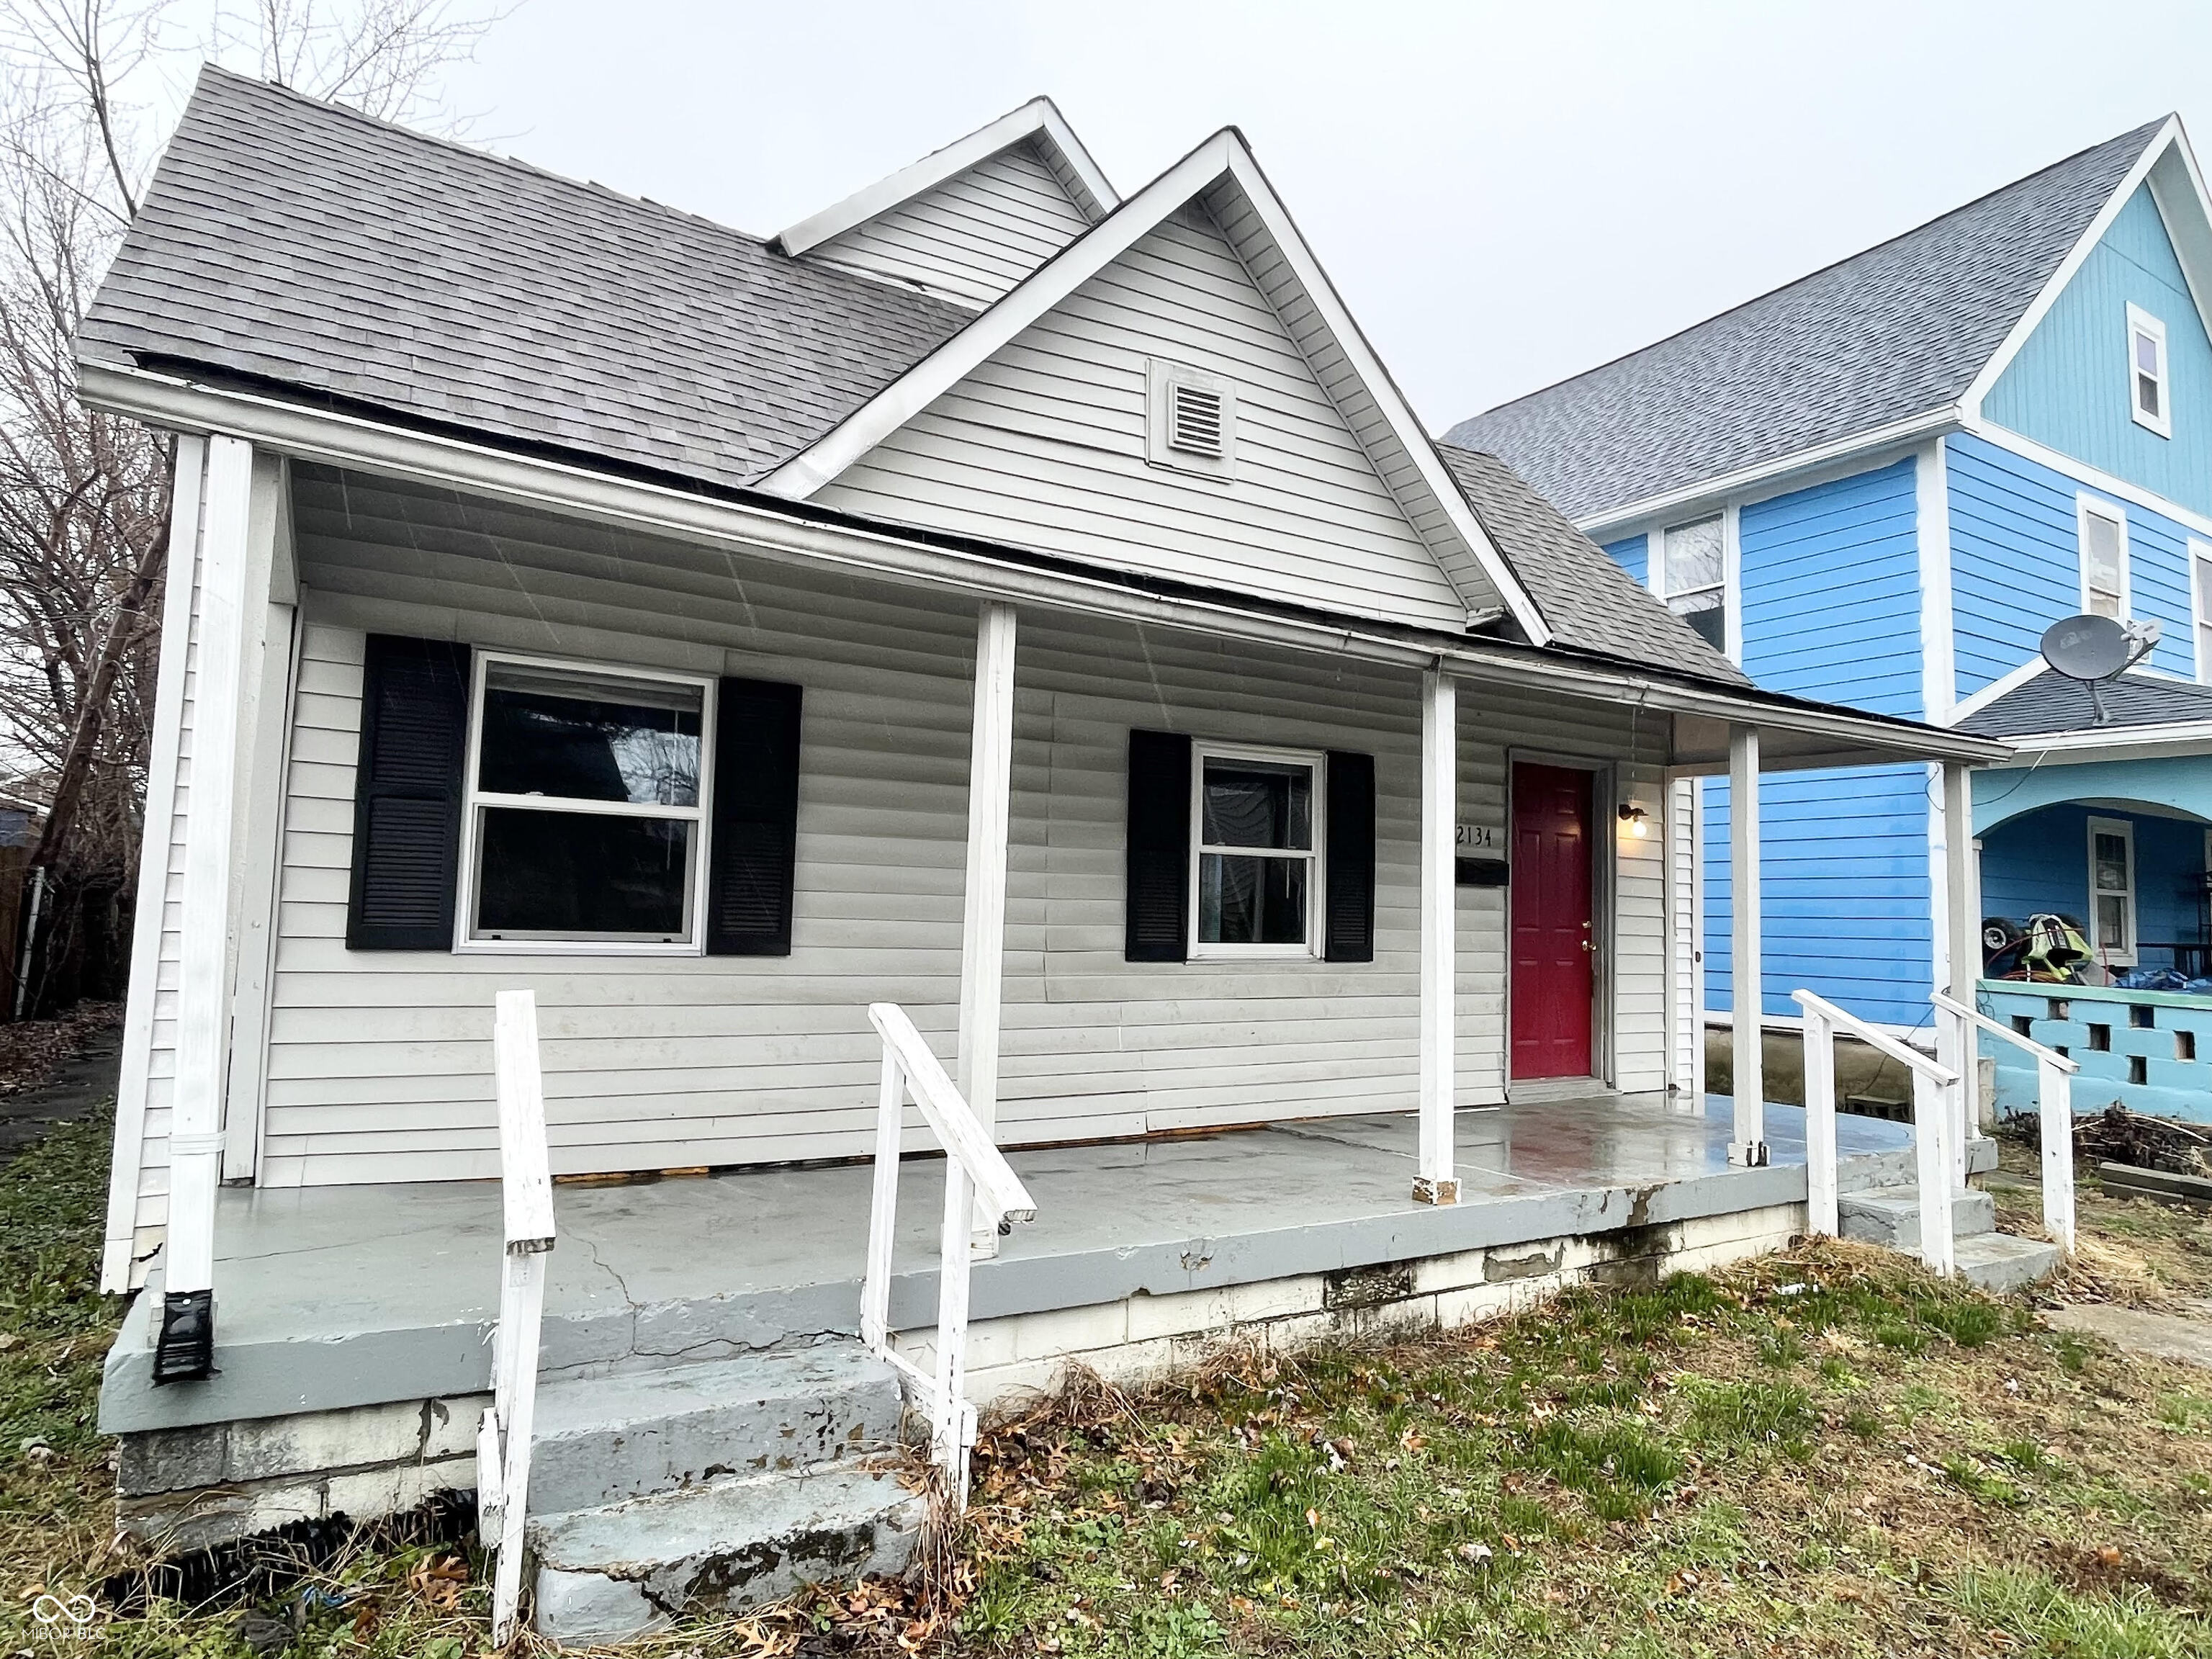
Active
$139,900
3
bds
|
1
ba
|
1,344
sqft
|
built
1920
2134 Pleasant St, Indianapolis, IN 46203
$-27
Cash flow
-1.0%
Cash-on-Cash Return
5.9%
Cap rate
0.7%
Rent to Value Ratio
Active
$209,900
2
bds
|
2
ba
|
1,260
sqft
|
built
1987
7459 Quincy Ct, Indianapolis, IN 46254
$-206
Cash flow
-5.1%
Cash-on-Cash Return
5.0%
Cap rate
0.9%
Rent to Value Ratio
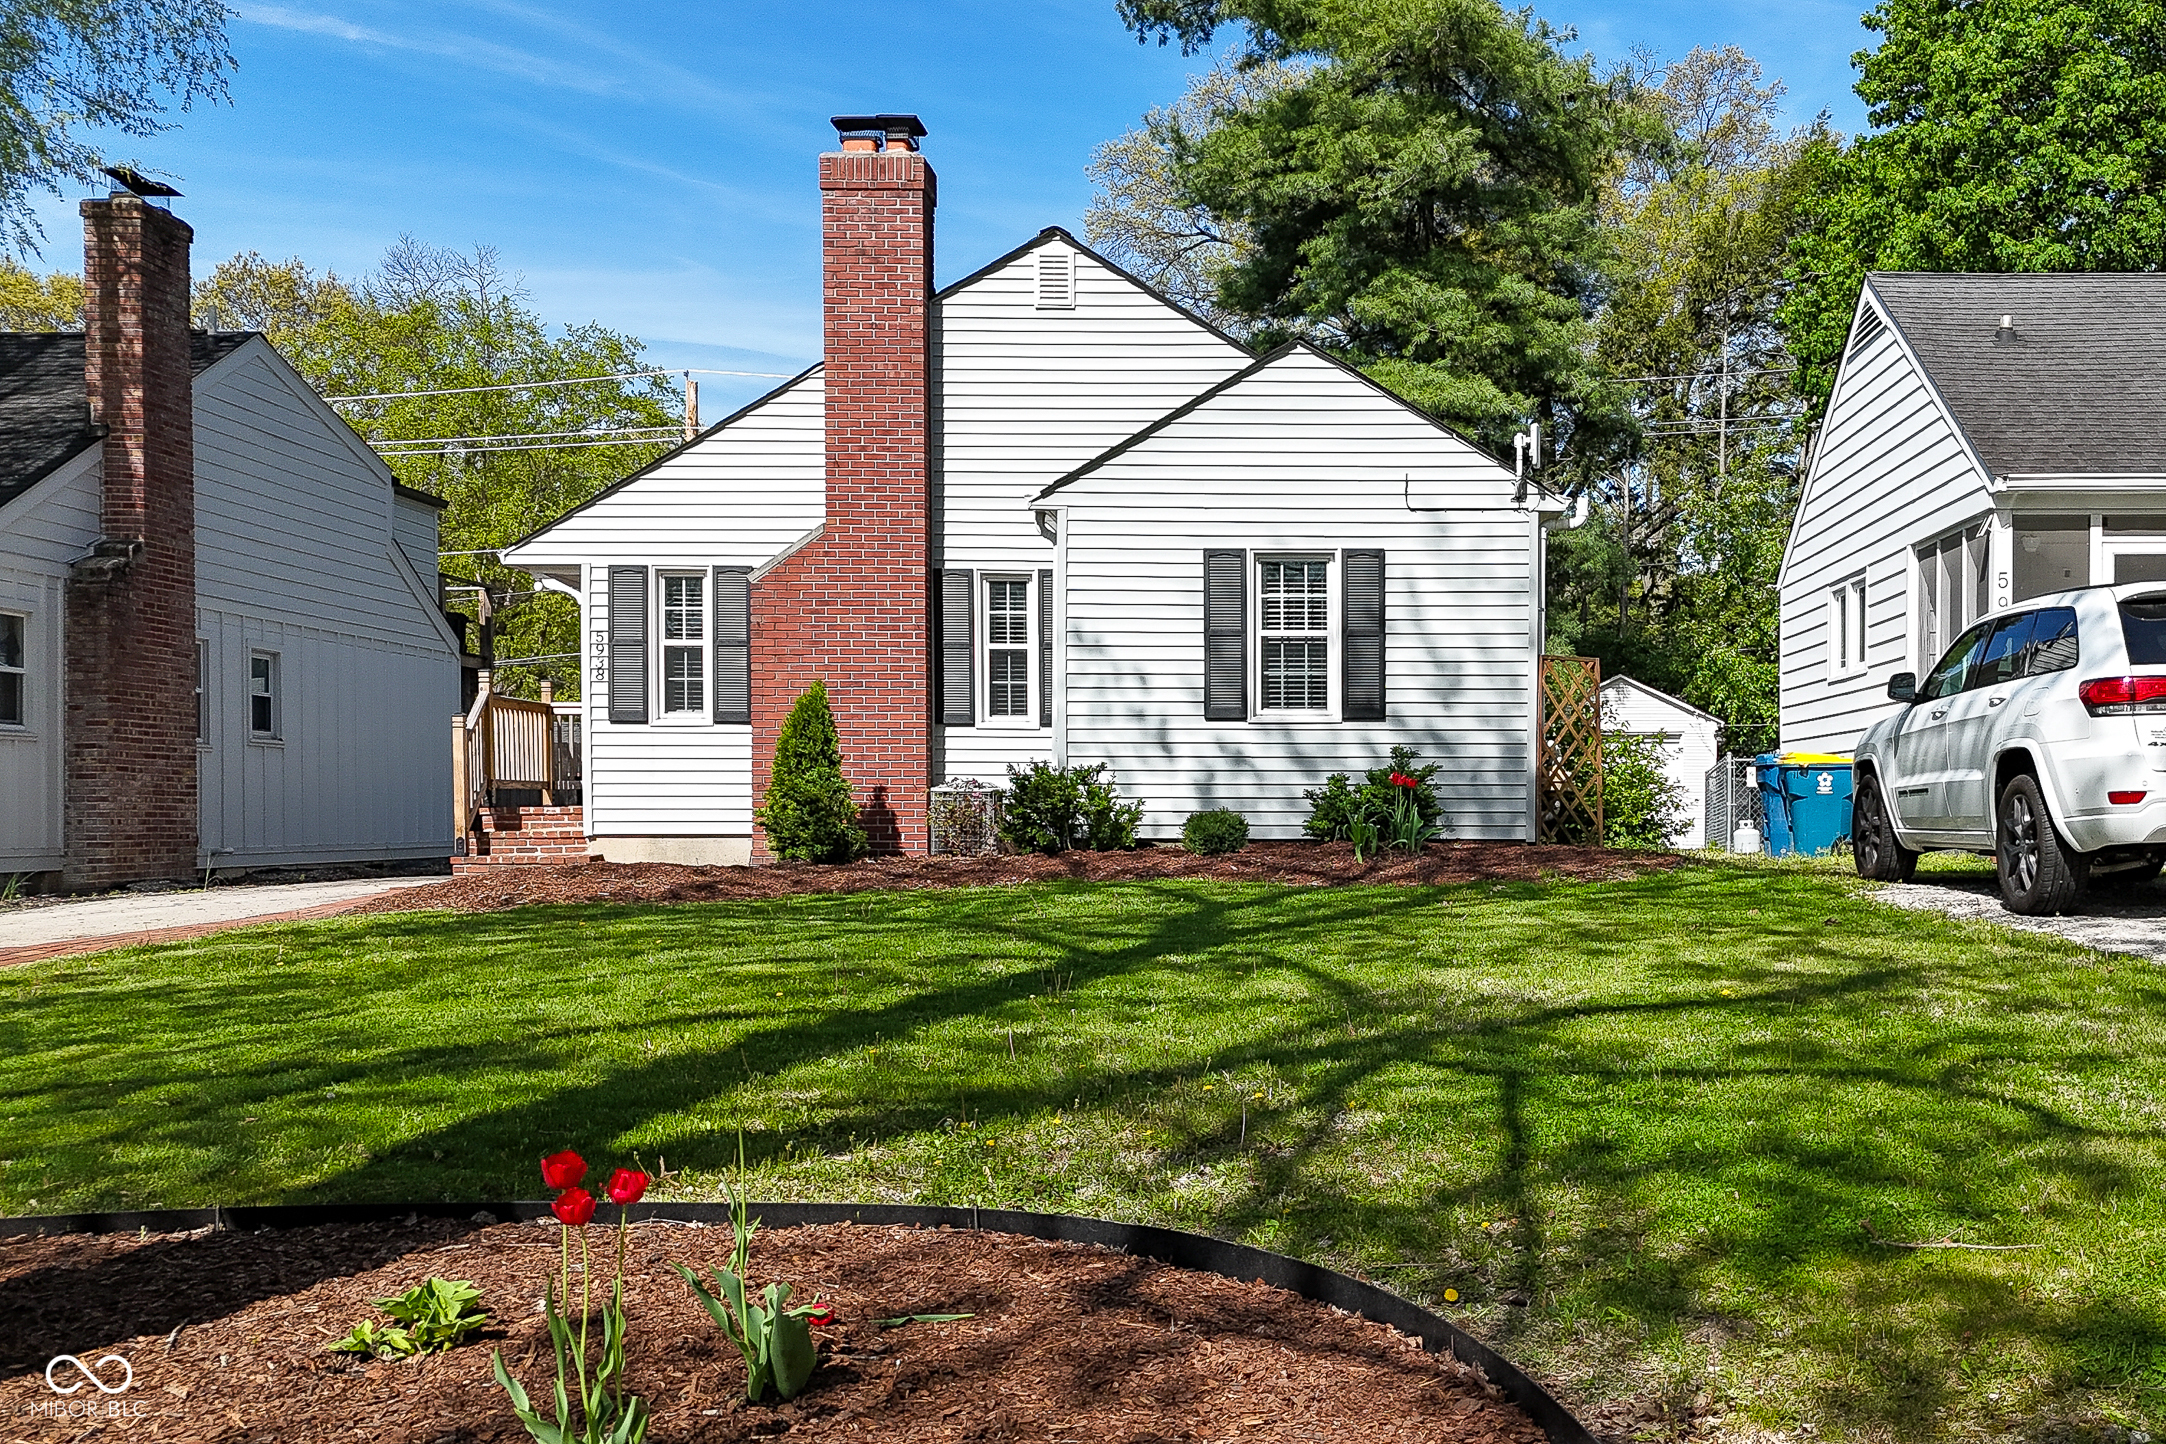
Active
$394,000
3
bds
|
2
ba
|
1,722
sqft
|
built
1940
5938 Haverford Ave, Indianapolis, IN 46220
$-293
Cash flow
-3.9%
Cash-on-Cash Return
5.3%
Cap rate
0.6%
Rent to Value Ratio

Active
$189,900
2
bds
|
2
ba
|
1,046
sqft
|
built
1989
4112 Eagle Cove East Dr, Indianapolis, IN 46254
$1
Cash flow
0.0%
Cash-on-Cash Return
6.2%
Cap rate
0.9%
Rent to Value Ratio
Active
$276,900
3
bds
|
3
ba
|
1,542
sqft
|
built
2015
3224 N Capitol Ave, Indianapolis, IN 46208
$-176
Cash flow
-3.3%
Cash-on-Cash Return
5.4%
Cap rate
0.7%
Rent to Value Ratio
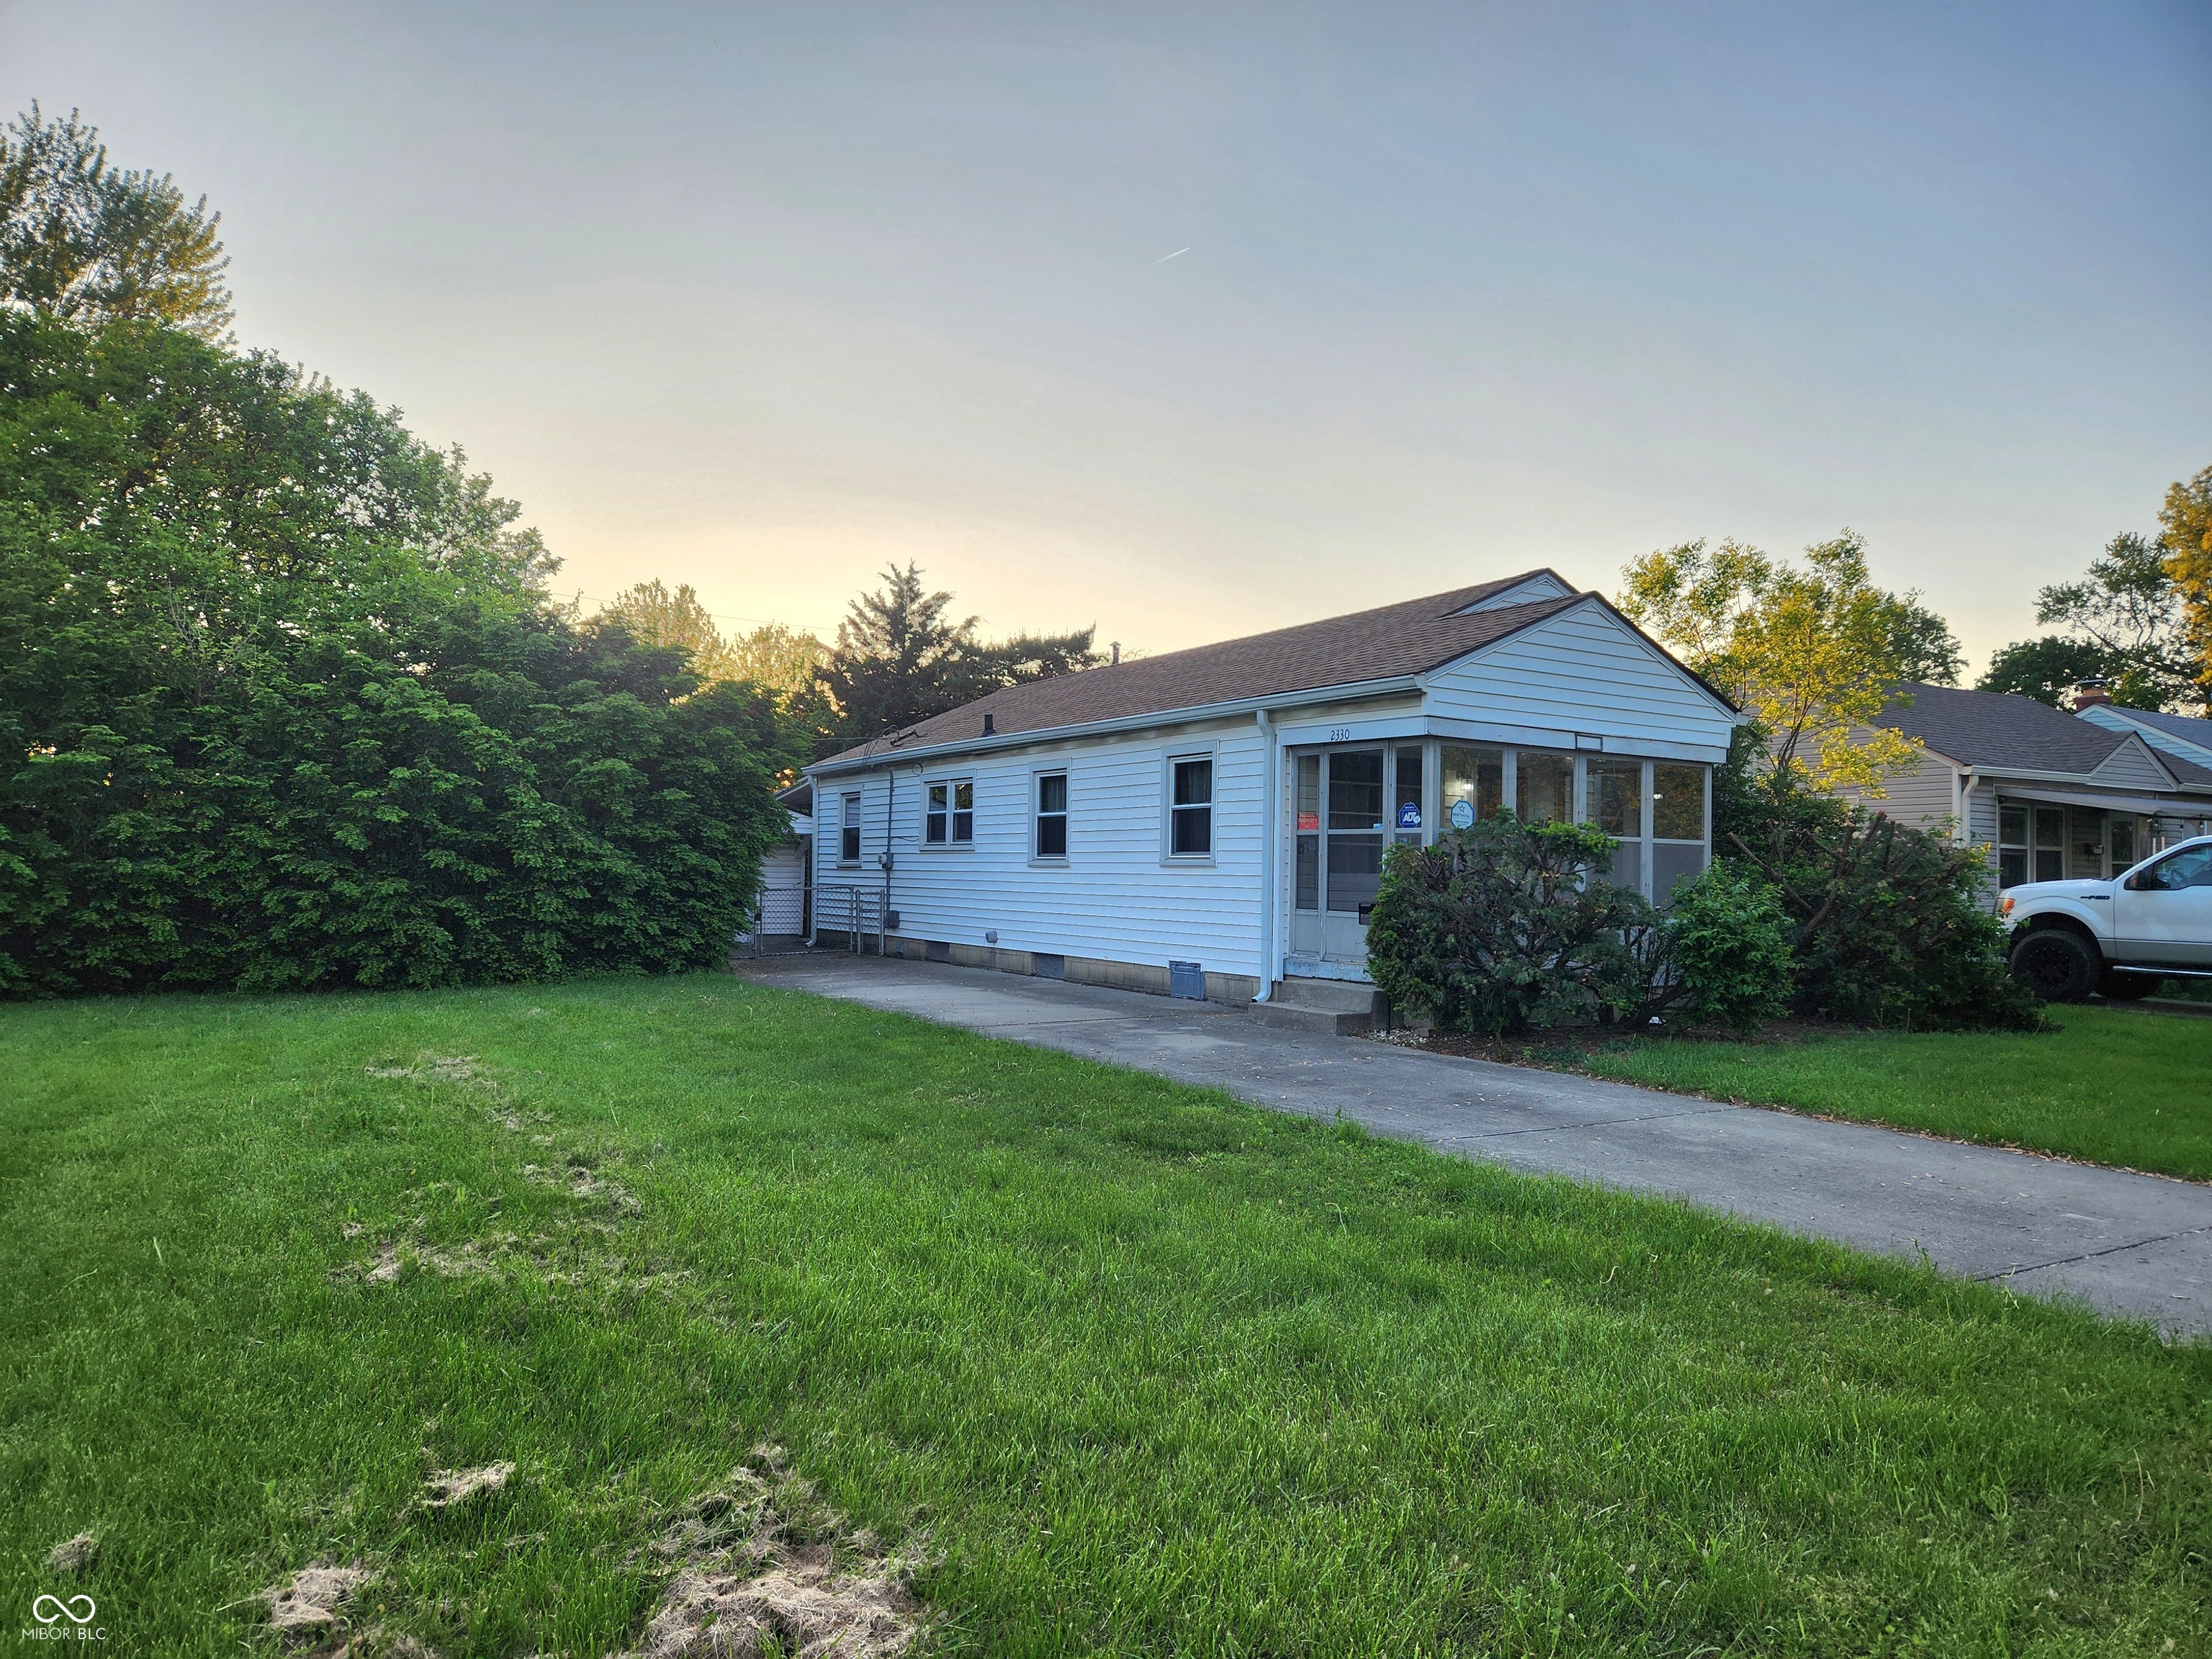
Pending
$168,000
2
bds
|
1
ba
|
1,008
sqft
|
built
1949
2330 Harlan St, Indianapolis, IN 46203
$36
Cash flow
1.1%
Cash-on-Cash Return
6.4%
Cap rate
0.8%
Rent to Value Ratio
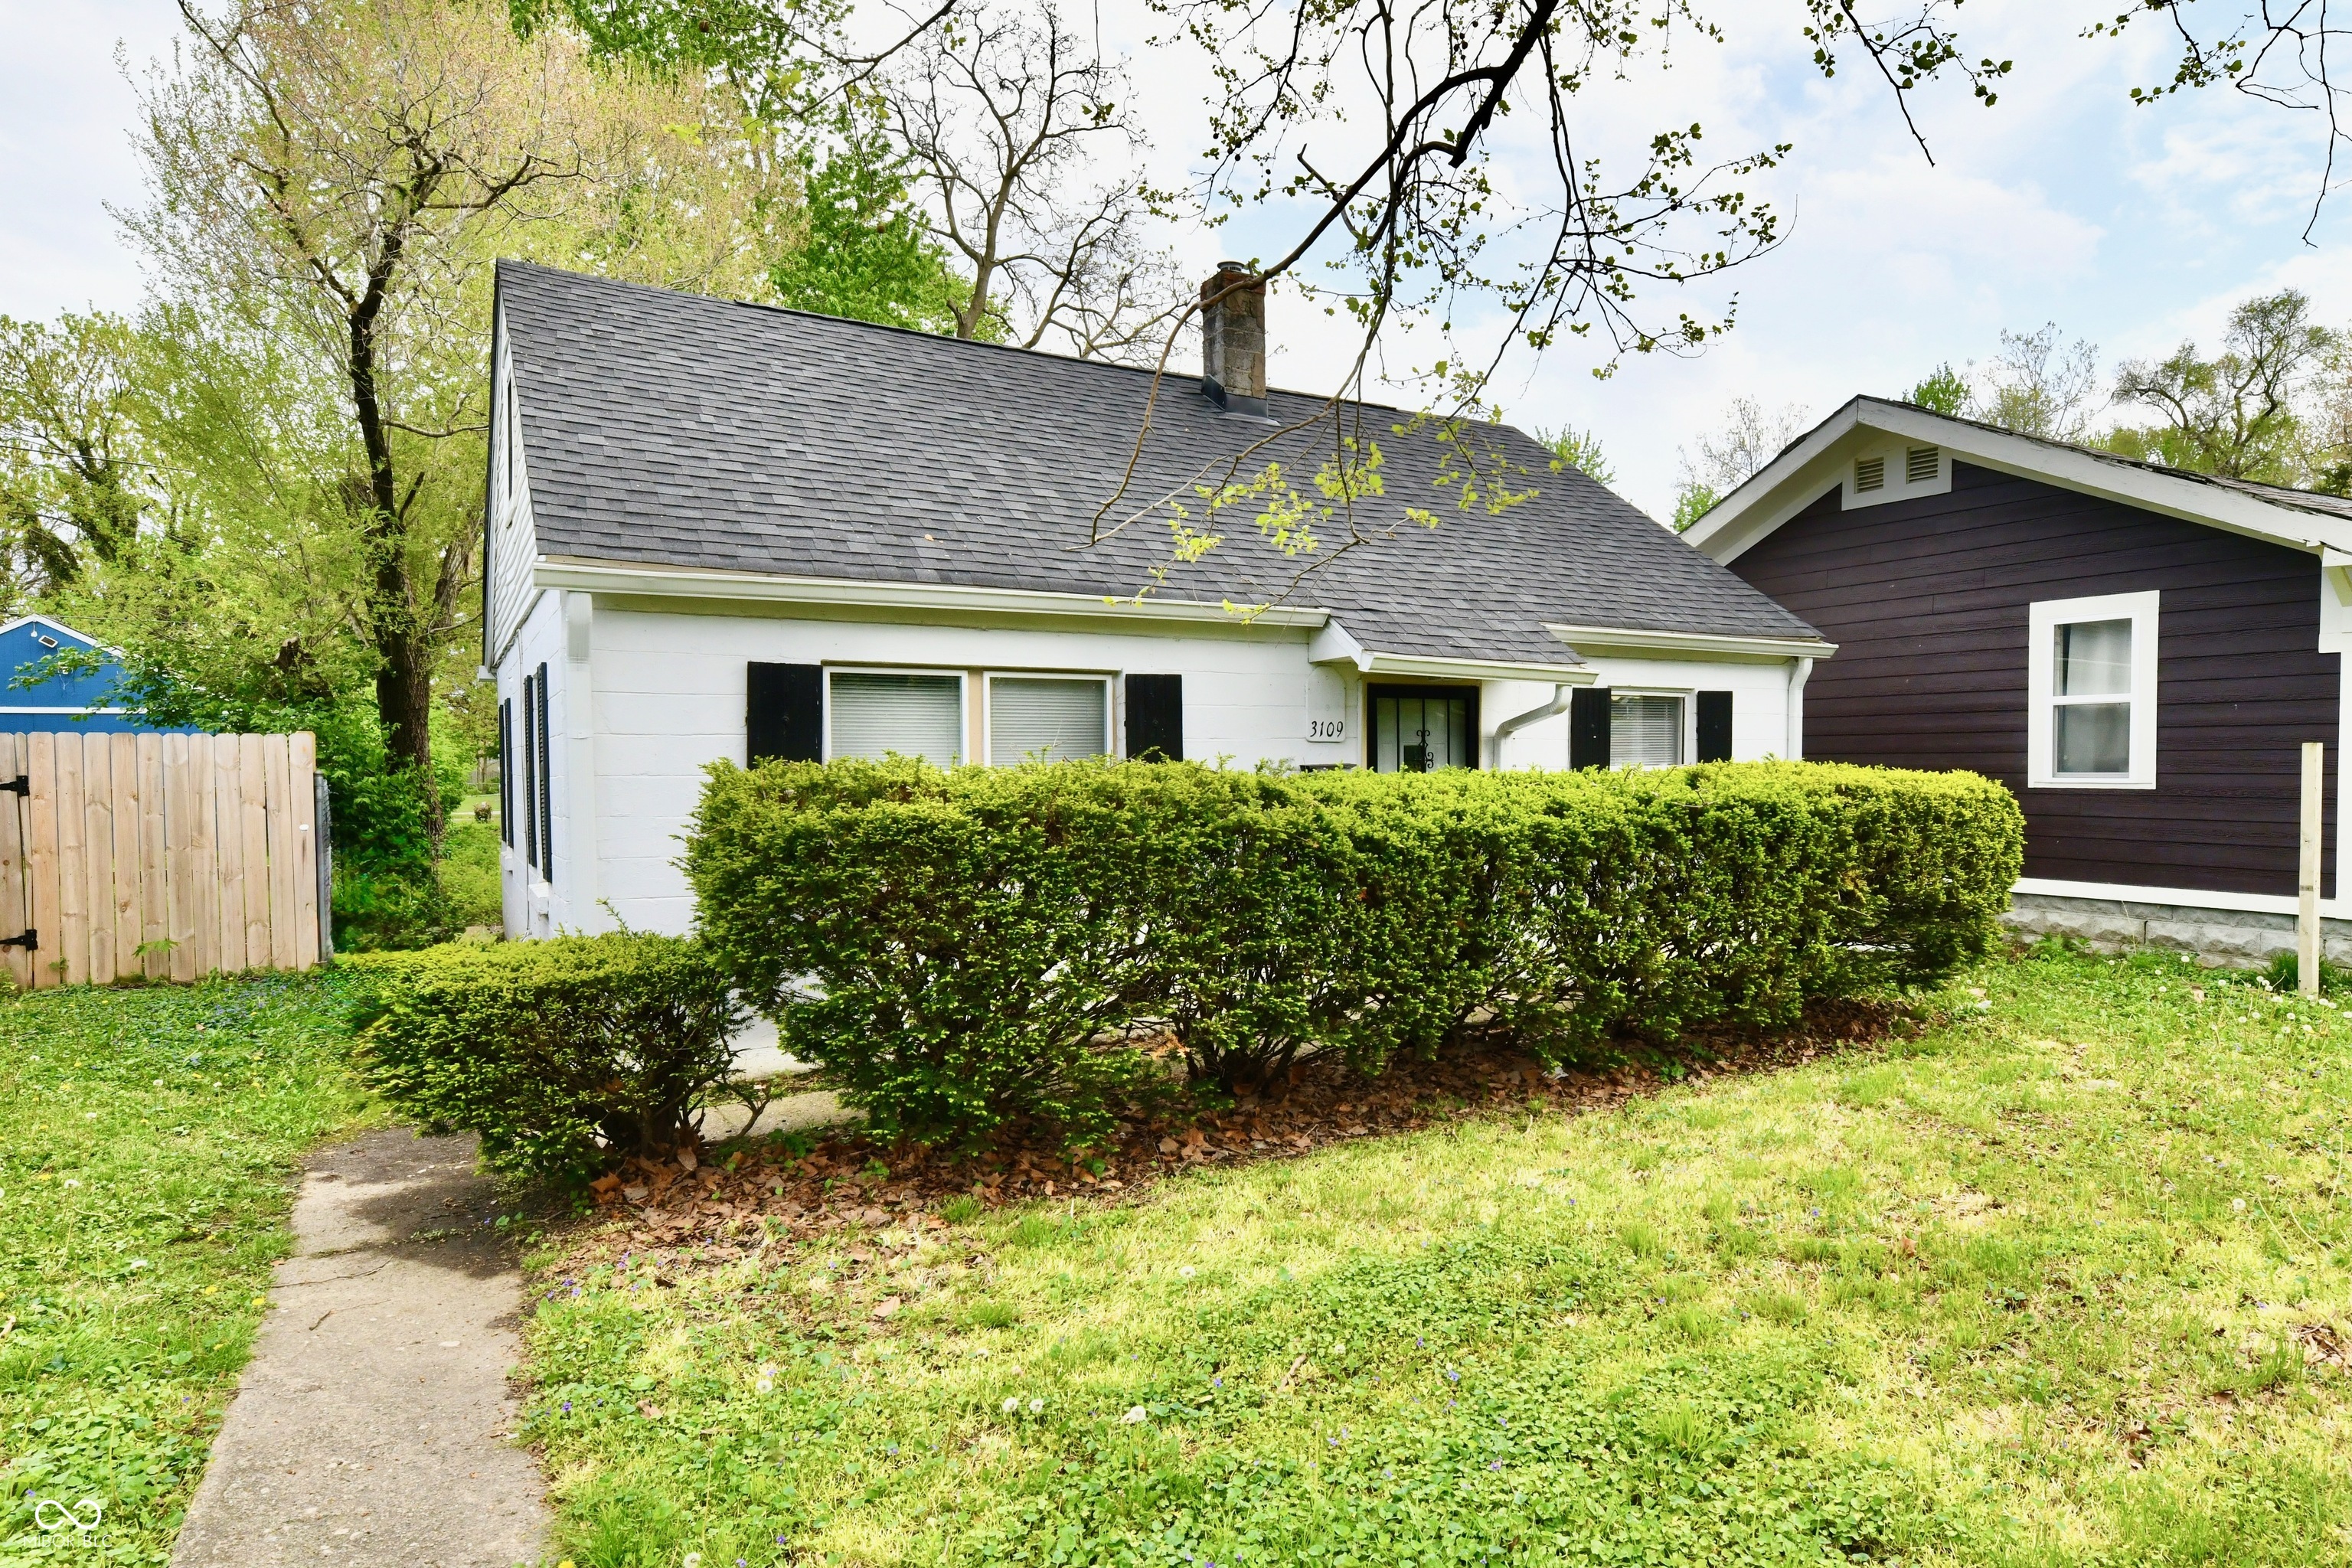
Active
$134,000
2
bds
|
1
ba
|
750
sqft
|
built
1947
3109 Forest Manor Ave, Indianapolis, IN 46218
$4
Cash flow
0.2%
Cash-on-Cash Return
6.2%
Cap rate
0.7%
Rent to Value Ratio
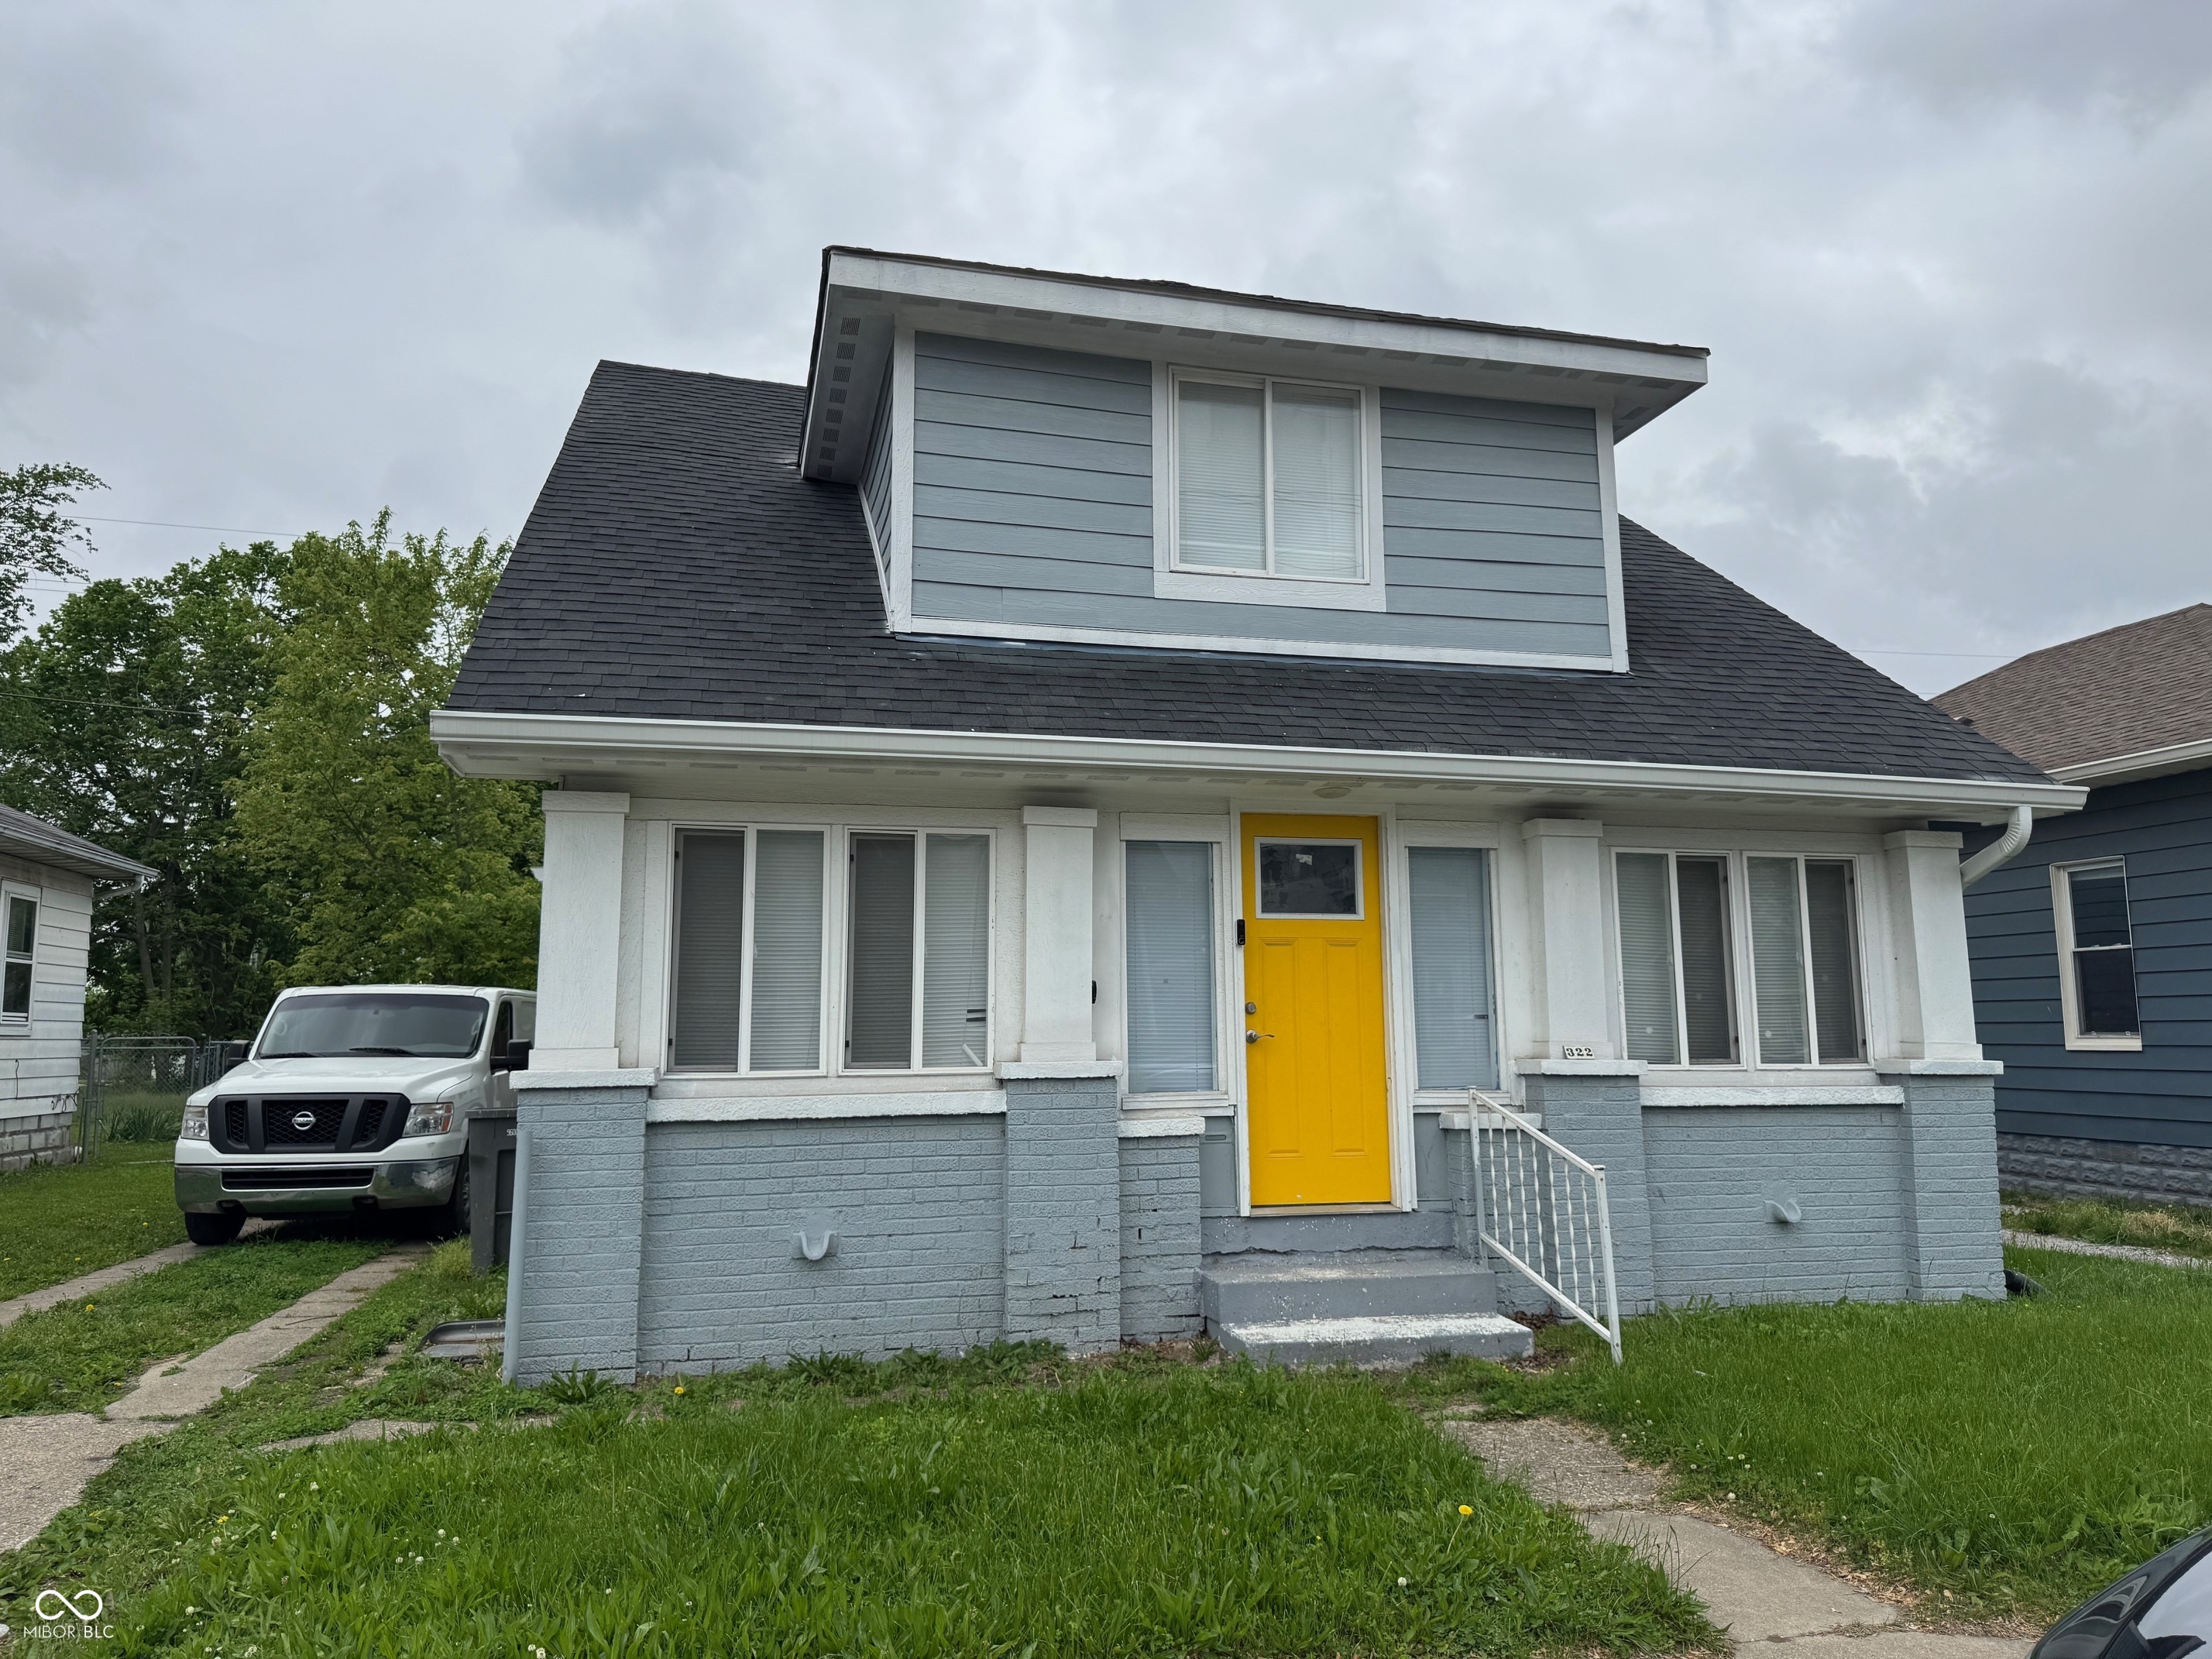
Active
$169,900
3
bds
|
2
ba
|
1,625
sqft
|
built
1920
322 S Rural St, Indianapolis, IN 46201
$-42
Cash flow
-1.3%
Cash-on-Cash Return
5.8%
Cap rate
0.7%
Rent to Value Ratio
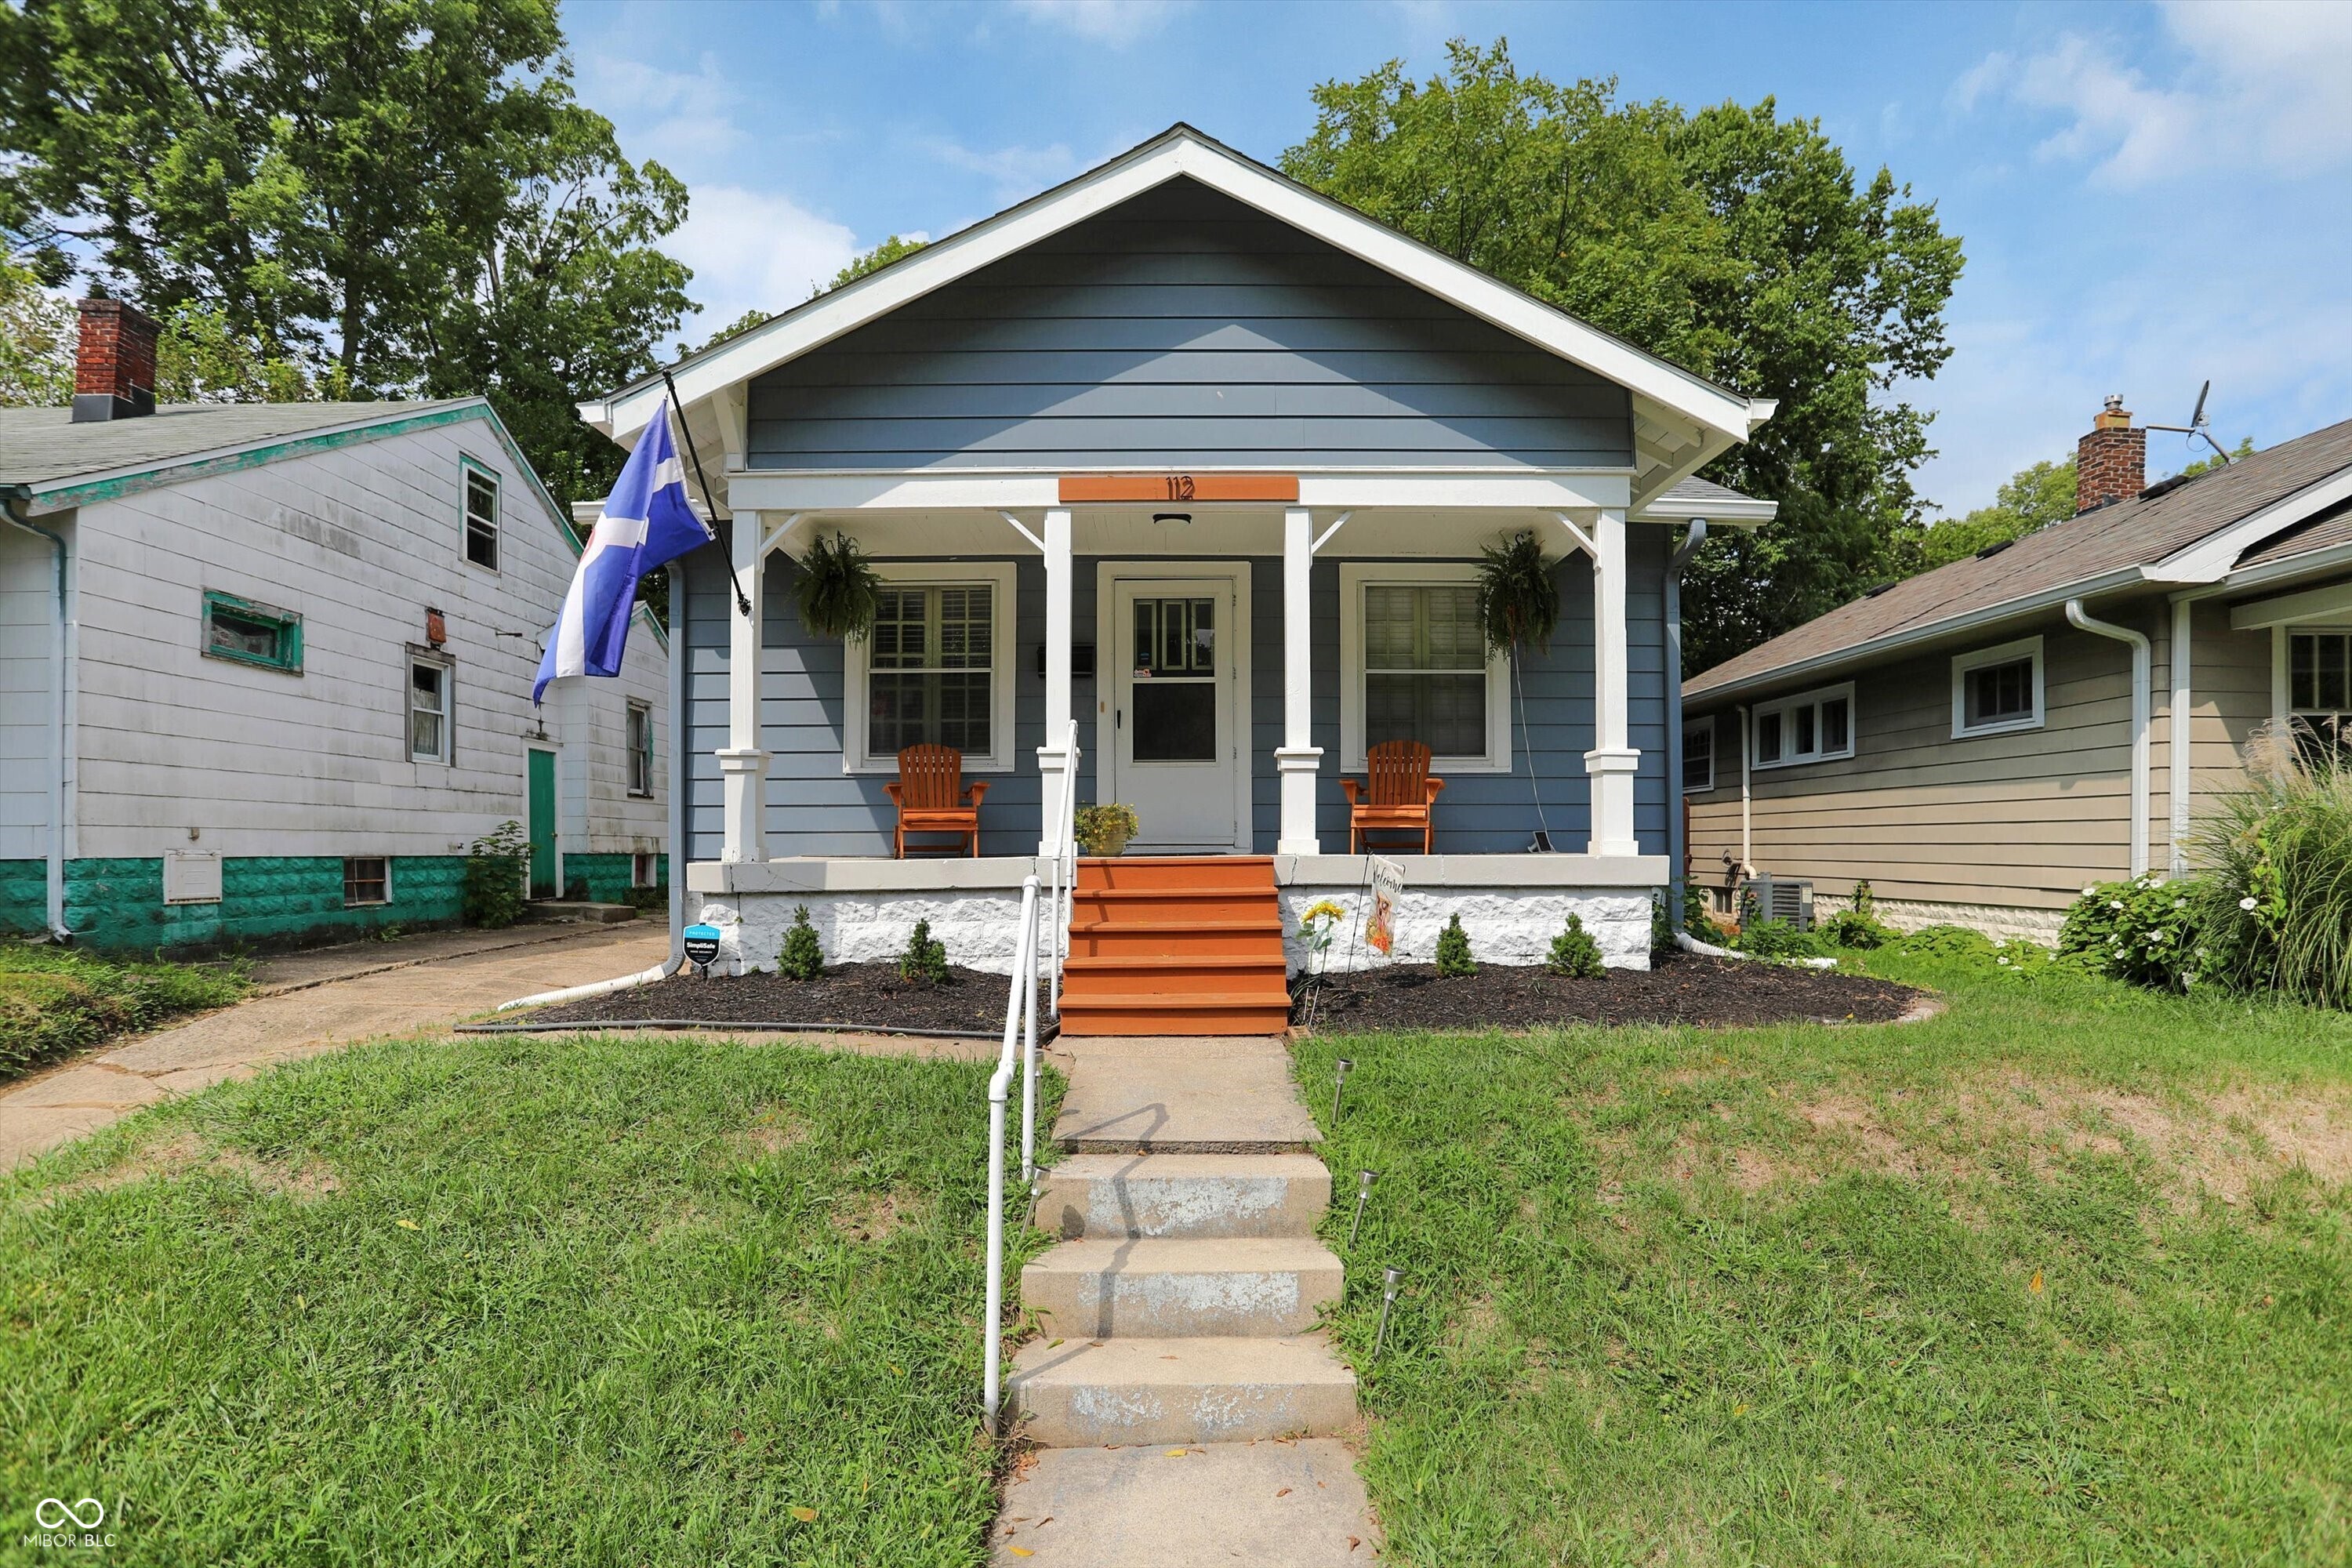
Active
$229,900
3
bds
|
1
ba
|
1,680
sqft
|
built
1932
112 S Spencer Ave, Indianapolis, IN 46219
$-212
Cash flow
-4.8%
Cash-on-Cash Return
5.0%
Cap rate
0.6%
Rent to Value Ratio
Active
$260,000
4
bds
|
3
ba
|
1,966
sqft
|
built
1998
4322 Par Dr, Indianapolis, IN 46268
$-90
Cash flow
-1.8%
Cash-on-Cash Return
5.7%
Cap rate
0.7%
Rent to Value Ratio
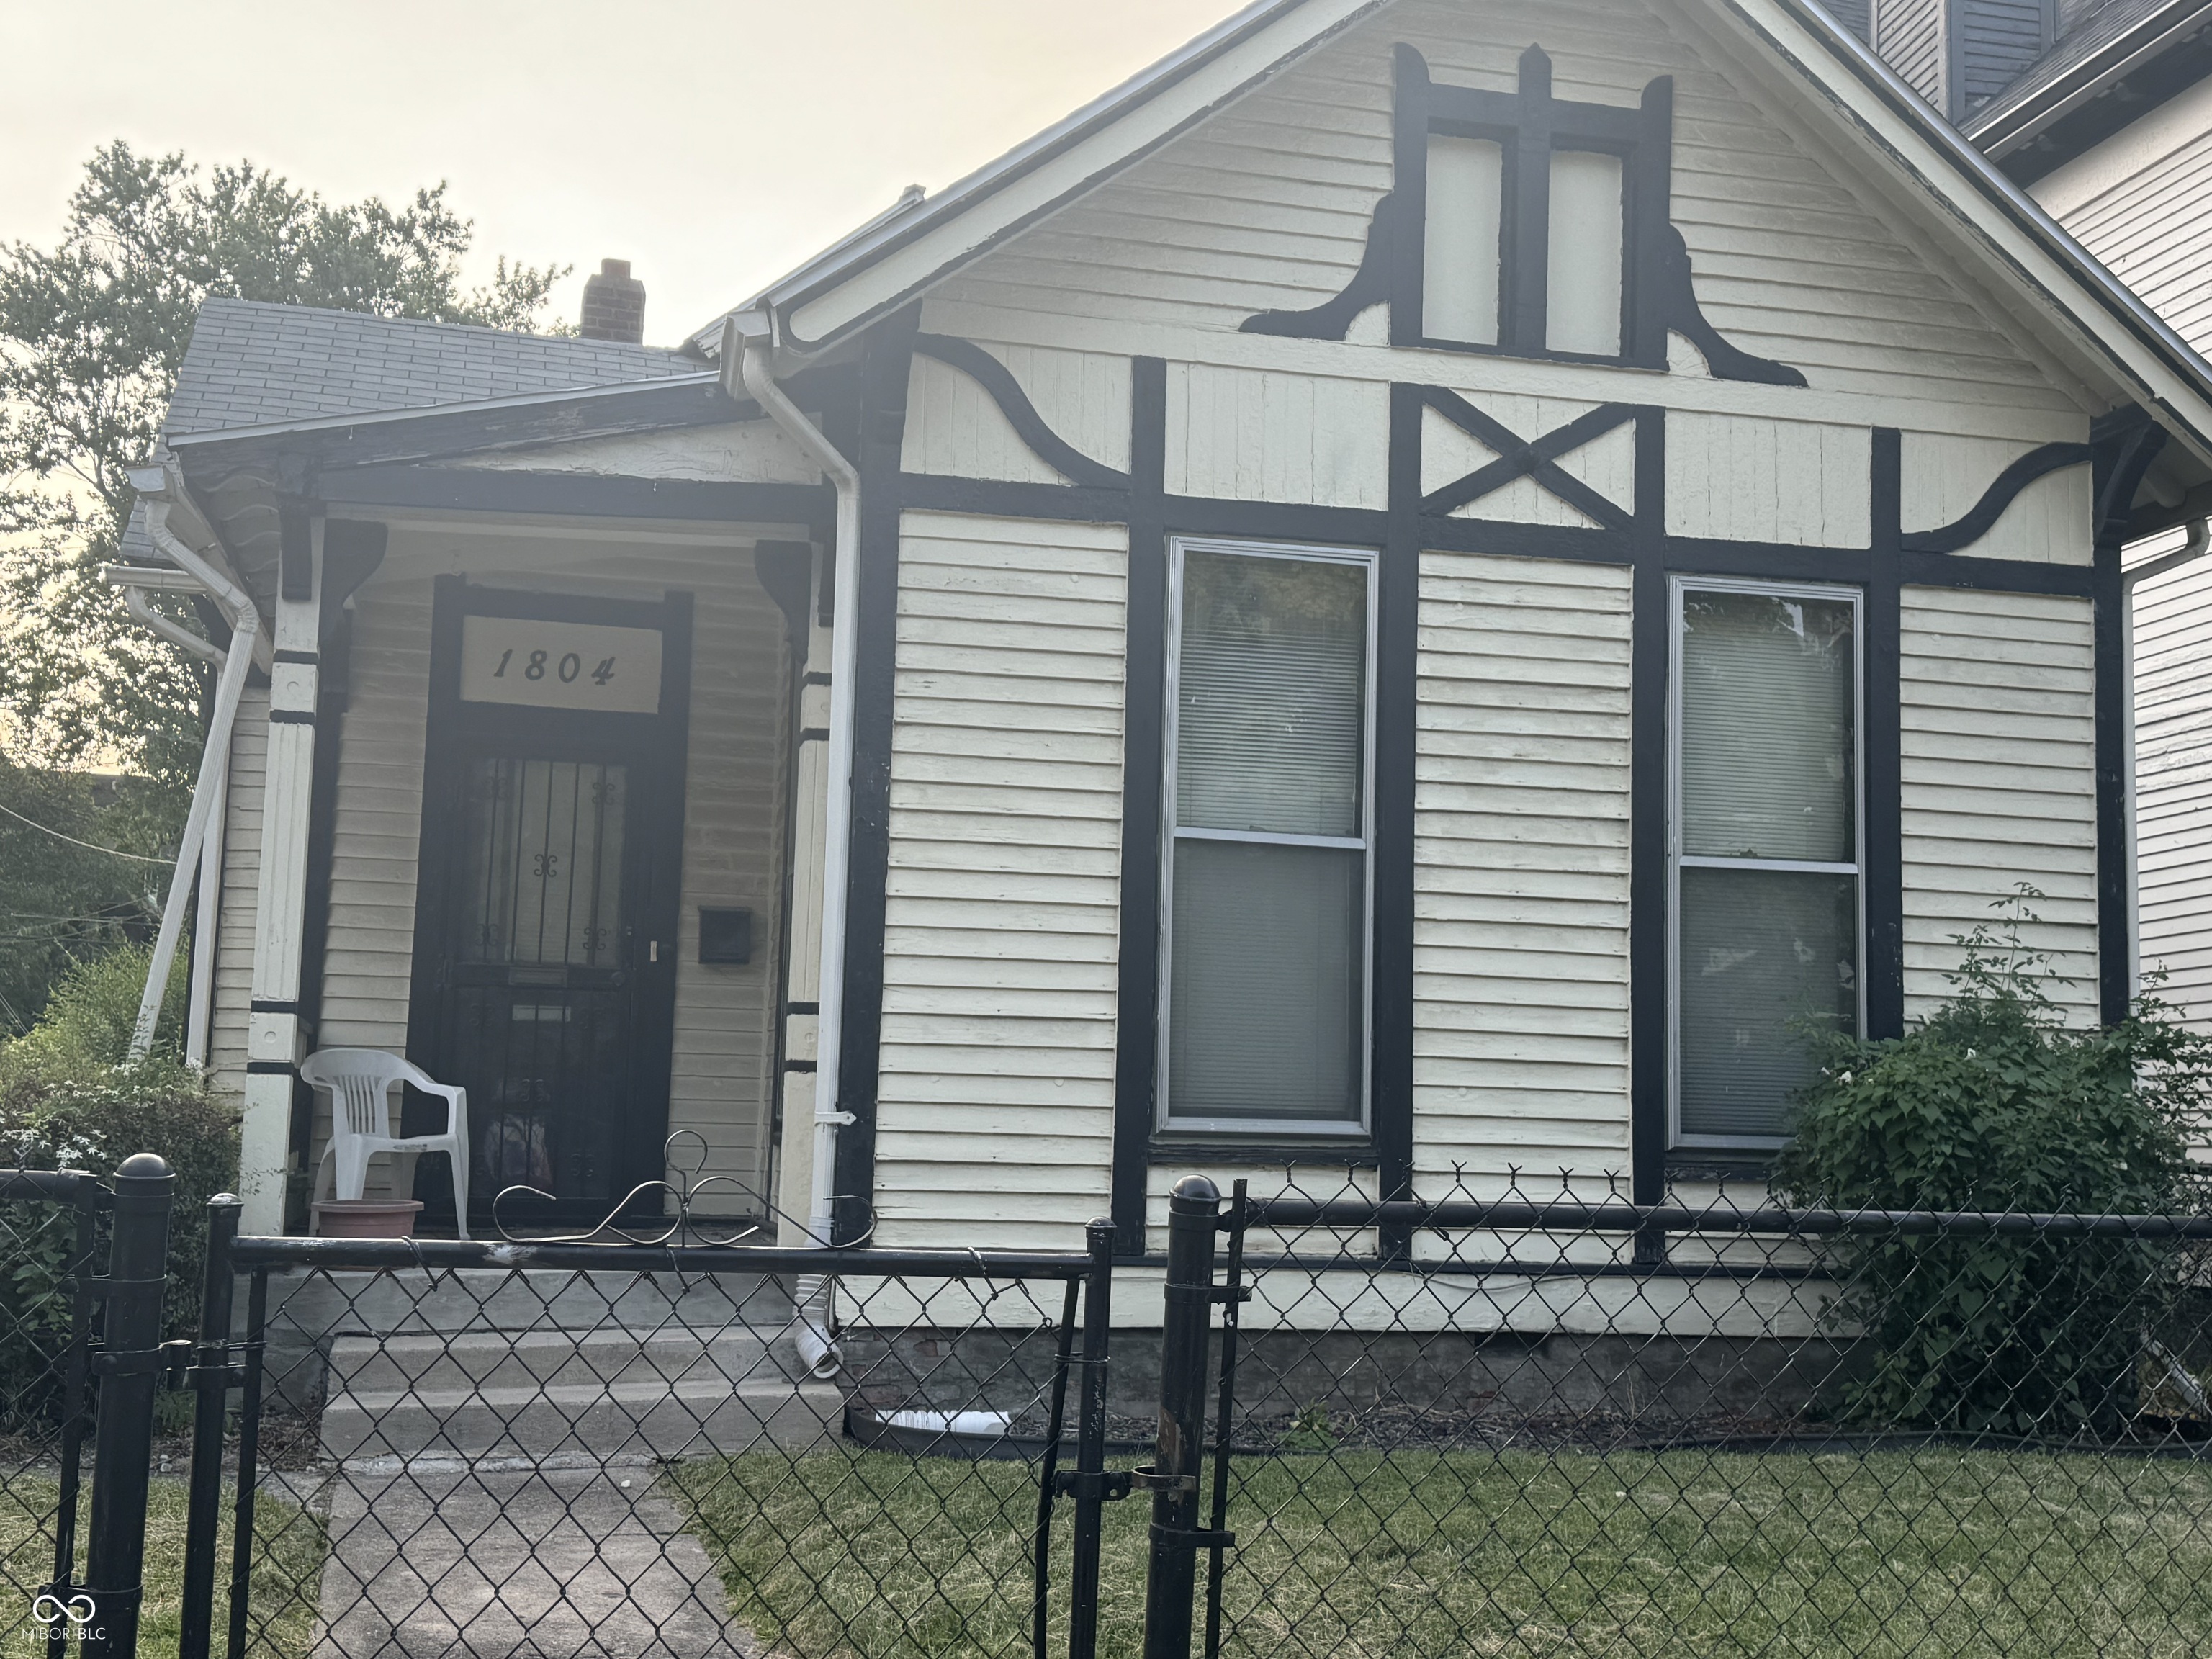
Active
$250,000
3
bds
|
1
ba
|
1,080
sqft
|
built
1955
1804 N Delaware St, Indianapolis, IN 46202
$-177
Cash flow
-3.7%
Cash-on-Cash Return
5.3%
Cap rate
0.6%
Rent to Value Ratio
Active
$160,000
3
bds
|
2
ba
|
1,322
sqft
|
built
1911
3532 E 10th St, Indianapolis, IN 46201
$-61
Cash flow
-2.0%
Cash-on-Cash Return
5.7%
Cap rate
0.7%
Rent to Value Ratio
Active
$199,900
3
bds
|
3
ba
|
1,721
sqft
|
built
2005
7218 Forrester Ln, Indianapolis, IN 46217
$-111
Cash flow
-2.9%
Cash-on-Cash Return
5.5%
Cap rate
0.9%
Rent to Value Ratio
Active
$135,000
2
bds
|
2
ba
|
993
sqft
|
built
1987
4291 Village Parkway Cir W, Indianapolis, IN 46254
$-38
Cash flow
-1.5%
Cash-on-Cash Return
5.8%
Cap rate
1.0%
Rent to Value Ratio
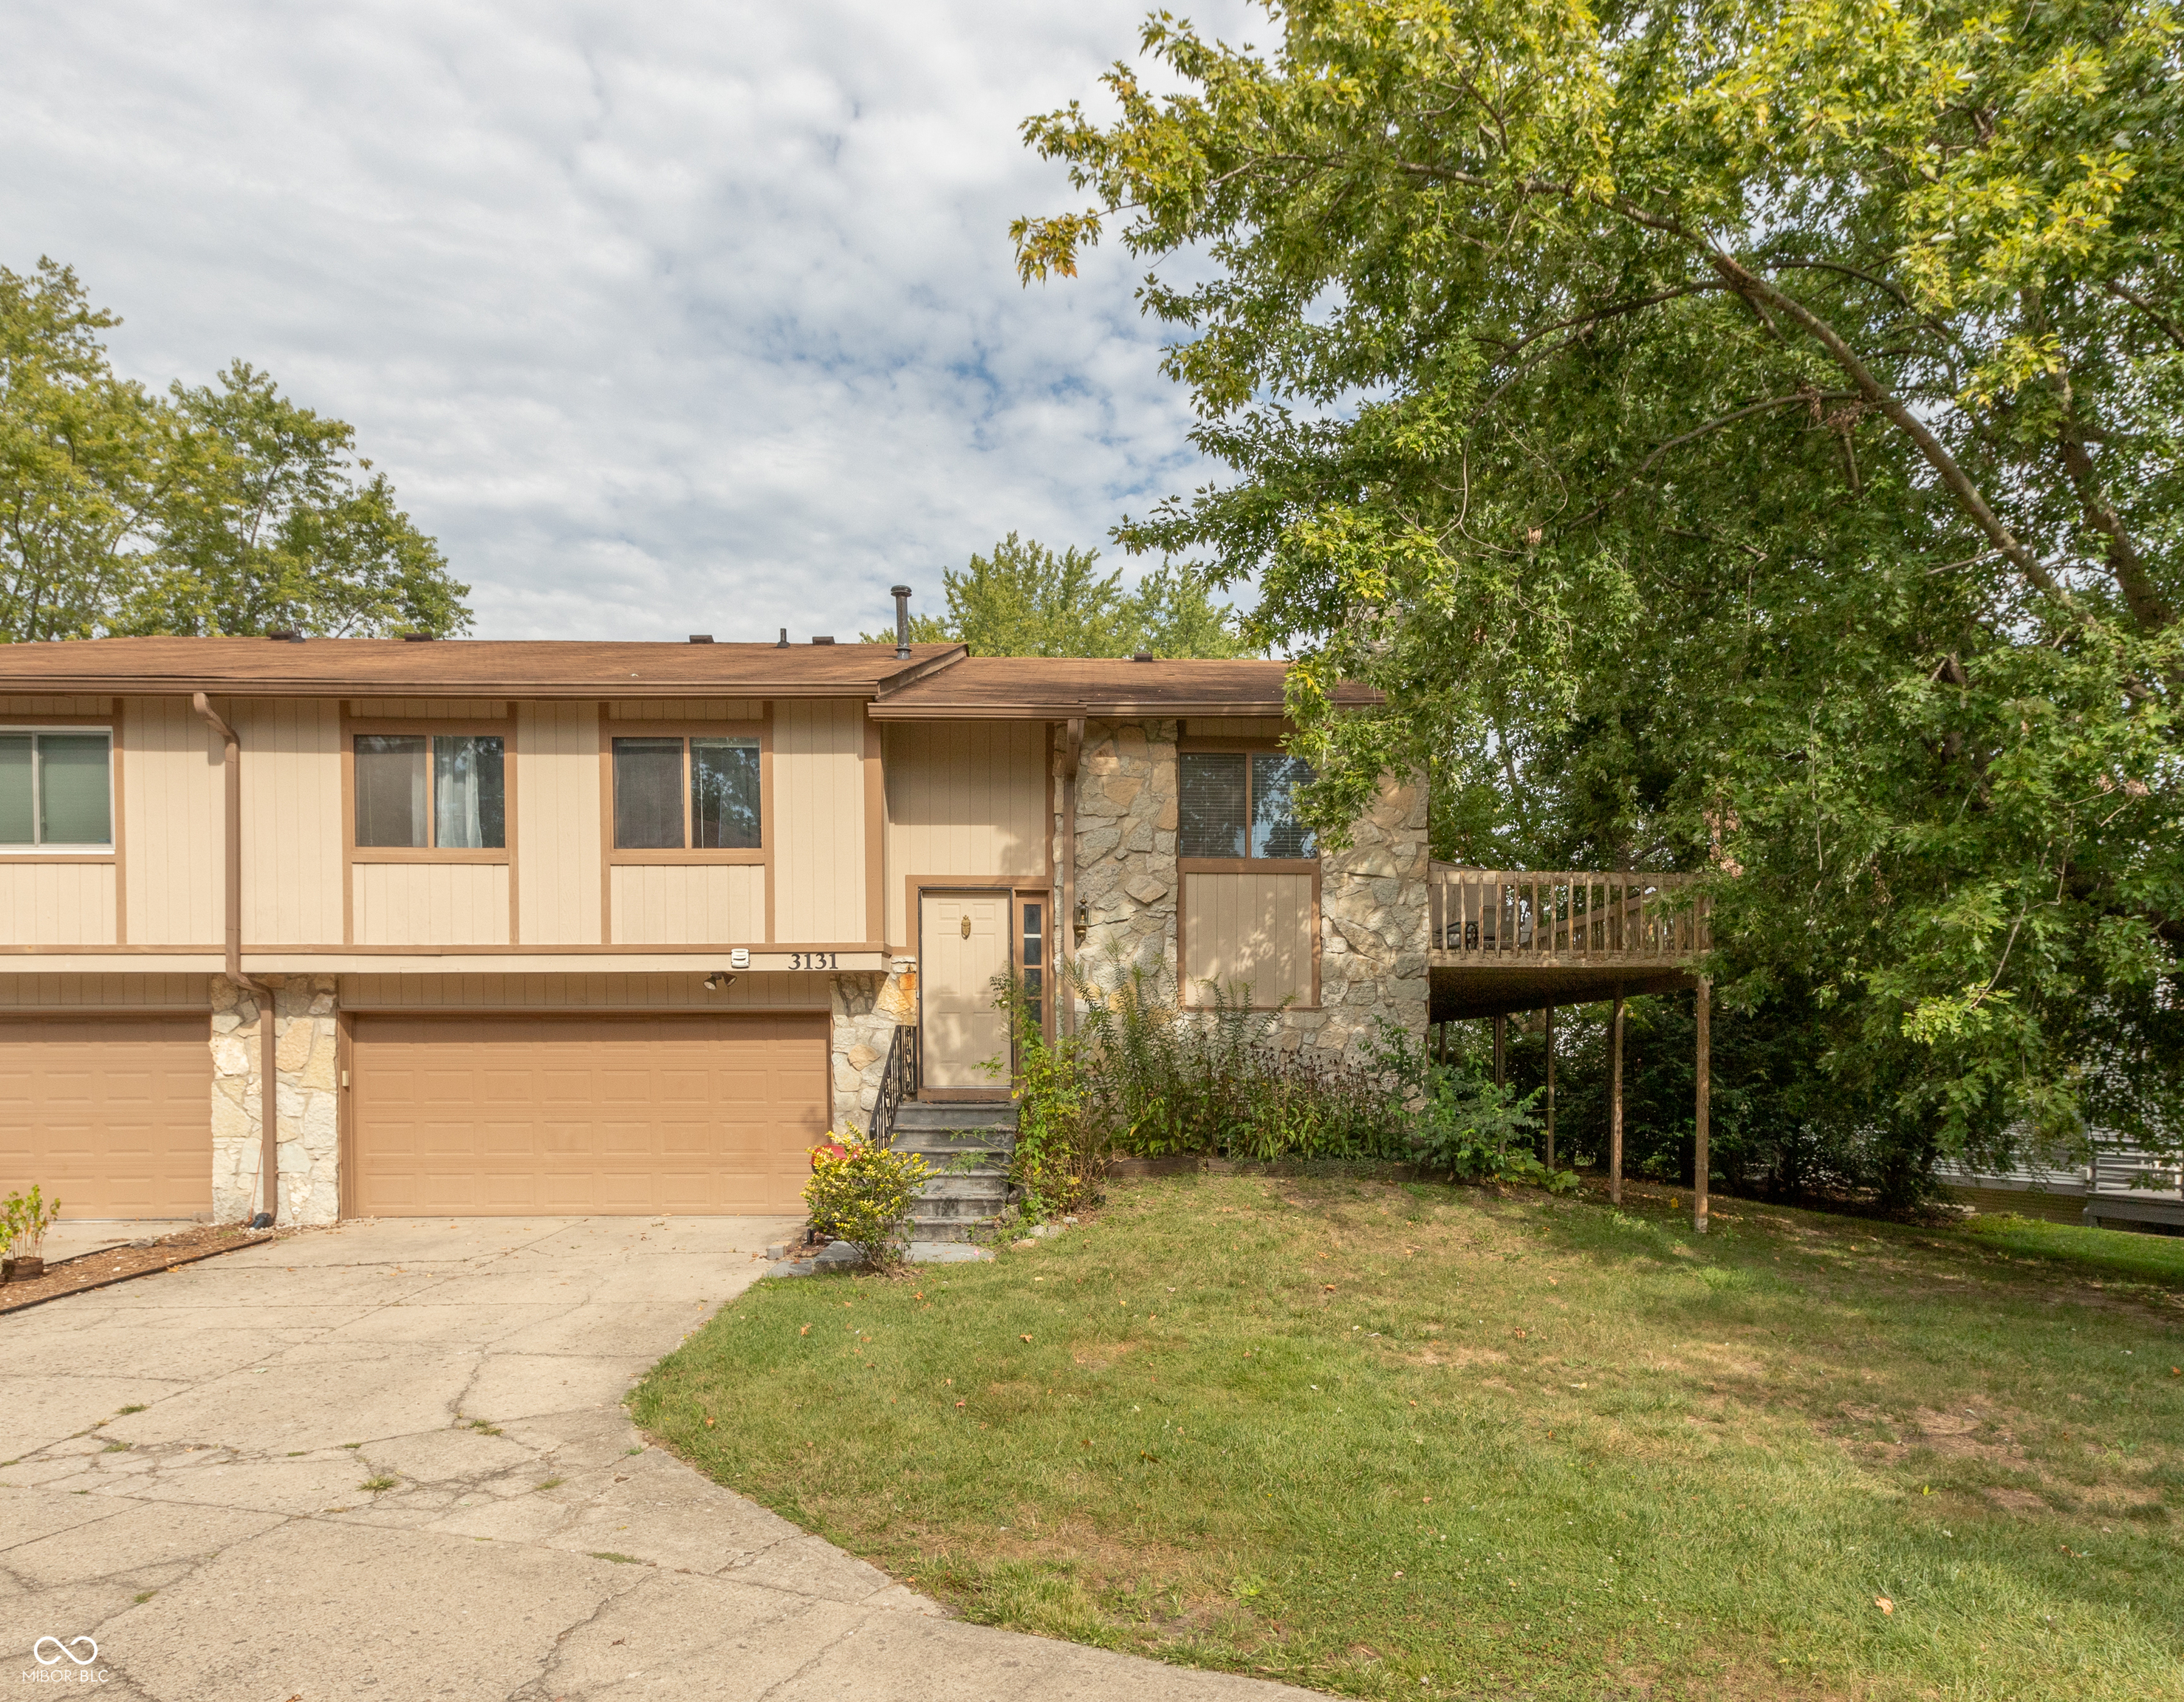
Active
$185,000
3
bds
|
2
ba
|
2,016
sqft
|
built
1979
3131 Stillmeadow Dr, Indianapolis, IN 46214
$-56
Cash flow
-1.6%
Cash-on-Cash Return
5.8%
Cap rate
0.9%
Rent to Value Ratio
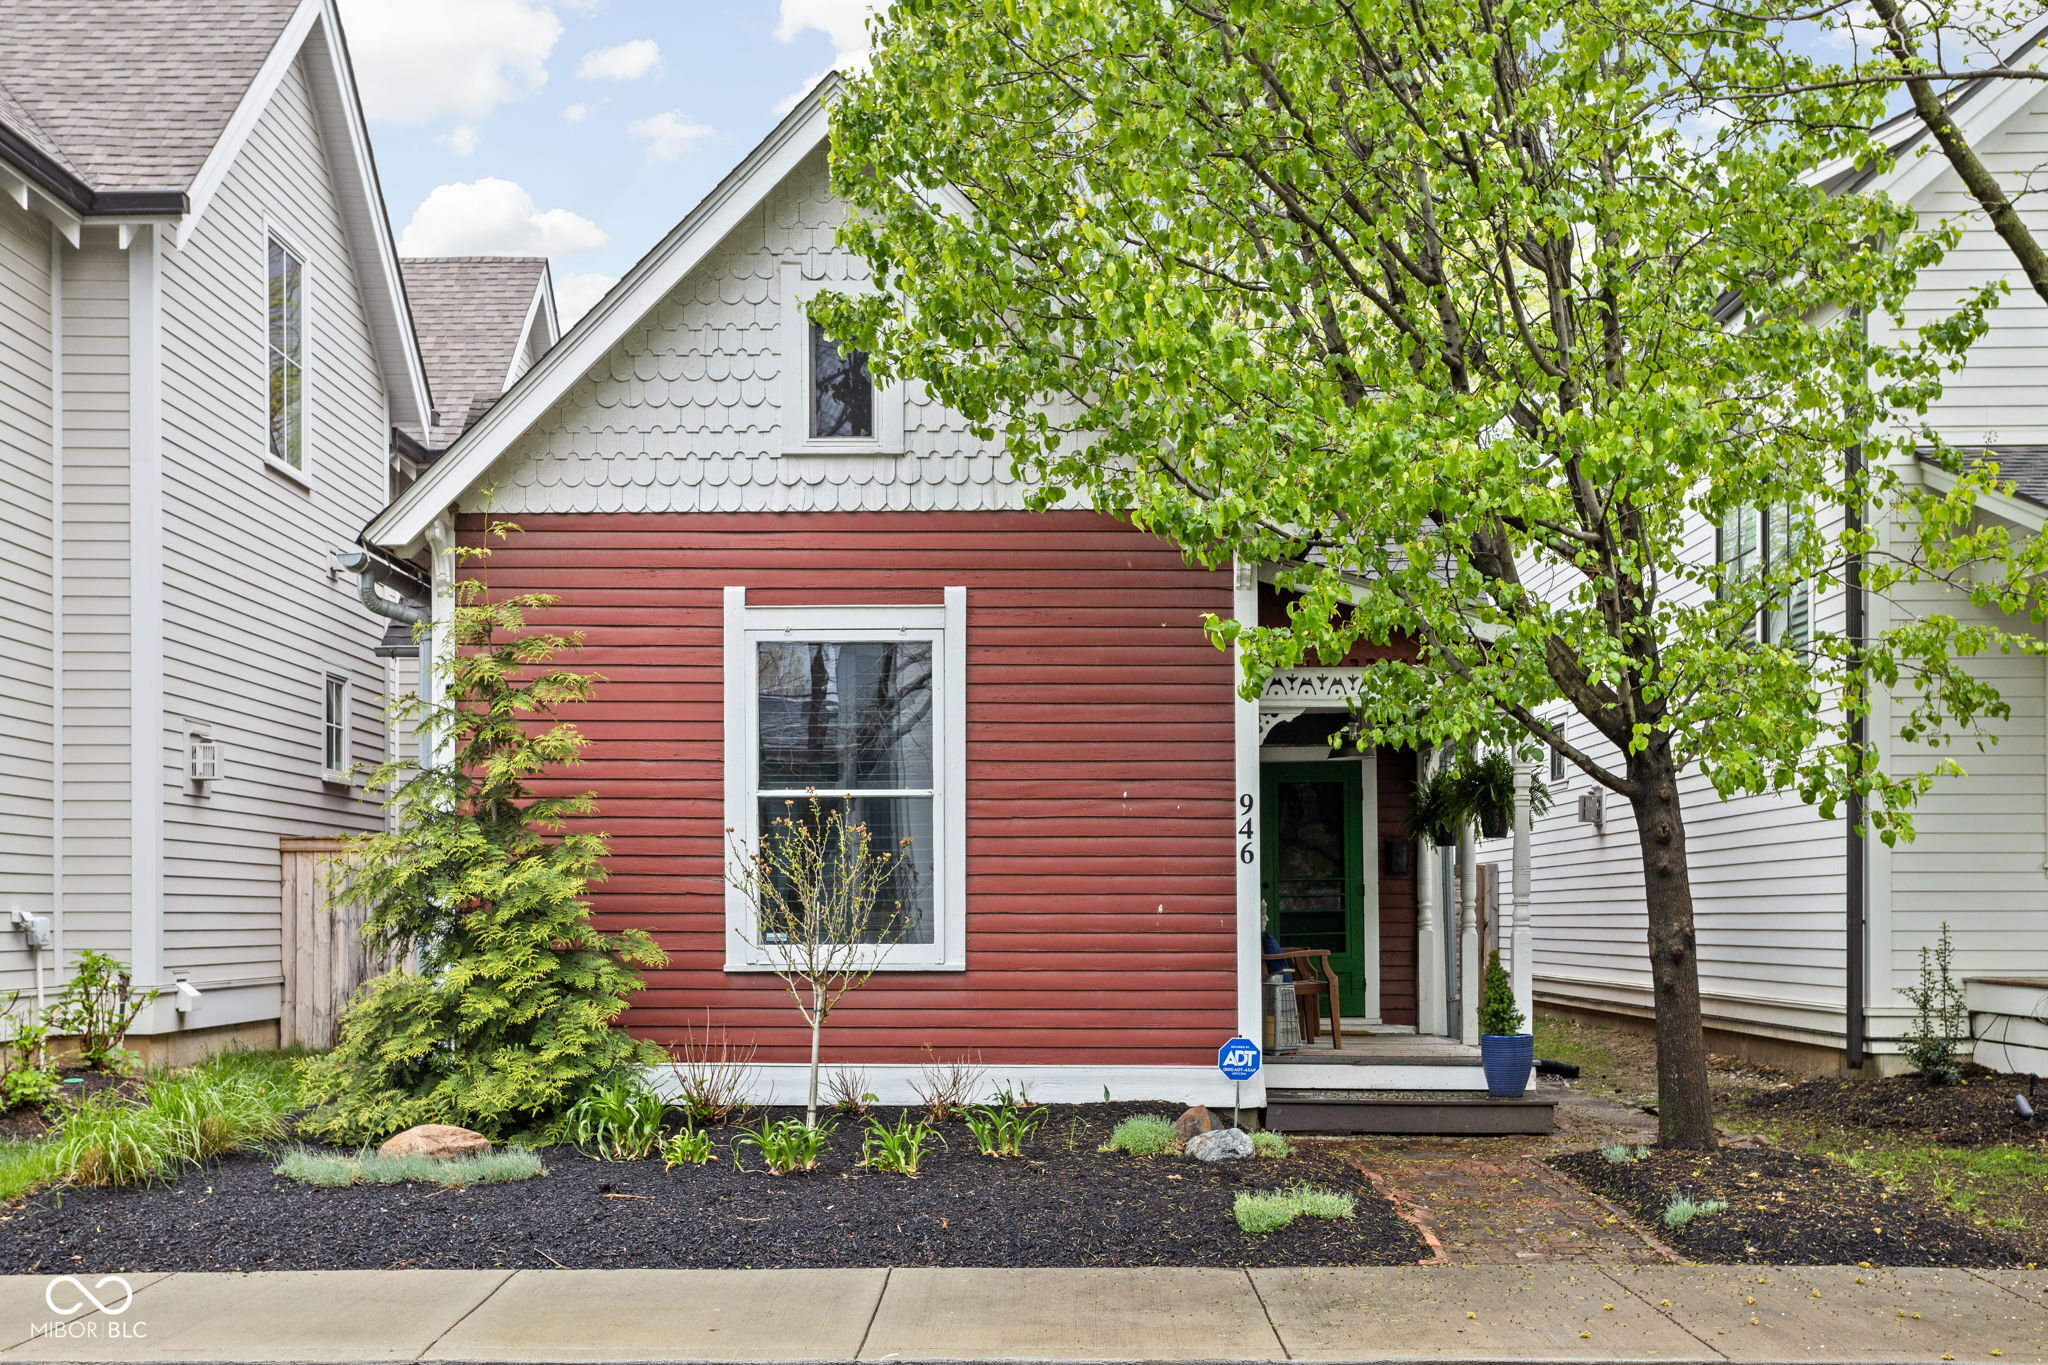
Active
$509,900
2
bds
|
3
ba
|
1,947
sqft
|
built
2012
946 Stillwell St, Indianapolis, IN 46202
$-197
Cash flow
-2.0%
Cash-on-Cash Return
5.7%
Cap rate
0.7%
Rent to Value Ratio
Active
$215,000
2
bds
|
0
ba
|
0
sqft
|
built
1927
2862 Highland Pl, Indianapolis, IN 46208
$-411
Cash flow
-10.0%
Cash-on-Cash Return
3.9%
Cap rate
0.5%
Rent to Value Ratio
Active
$277,500
3
bds
|
3
ba
|
1,970
sqft
|
built
1984
8072 Foxchase Dr, Indianapolis, IN 46256
$-11
Cash flow
-0.2%
Cash-on-Cash Return
6.1%
Cap rate
0.9%
Rent to Value Ratio
Active
$252,000
3
bds
|
2
ba
|
1,564
sqft
|
built
1975
7108 Hearthstone Way, Indianapolis, IN 46227
$-187
Cash flow
-3.9%
Cash-on-Cash Return
5.3%
Cap rate
0.6%
Rent to Value Ratio
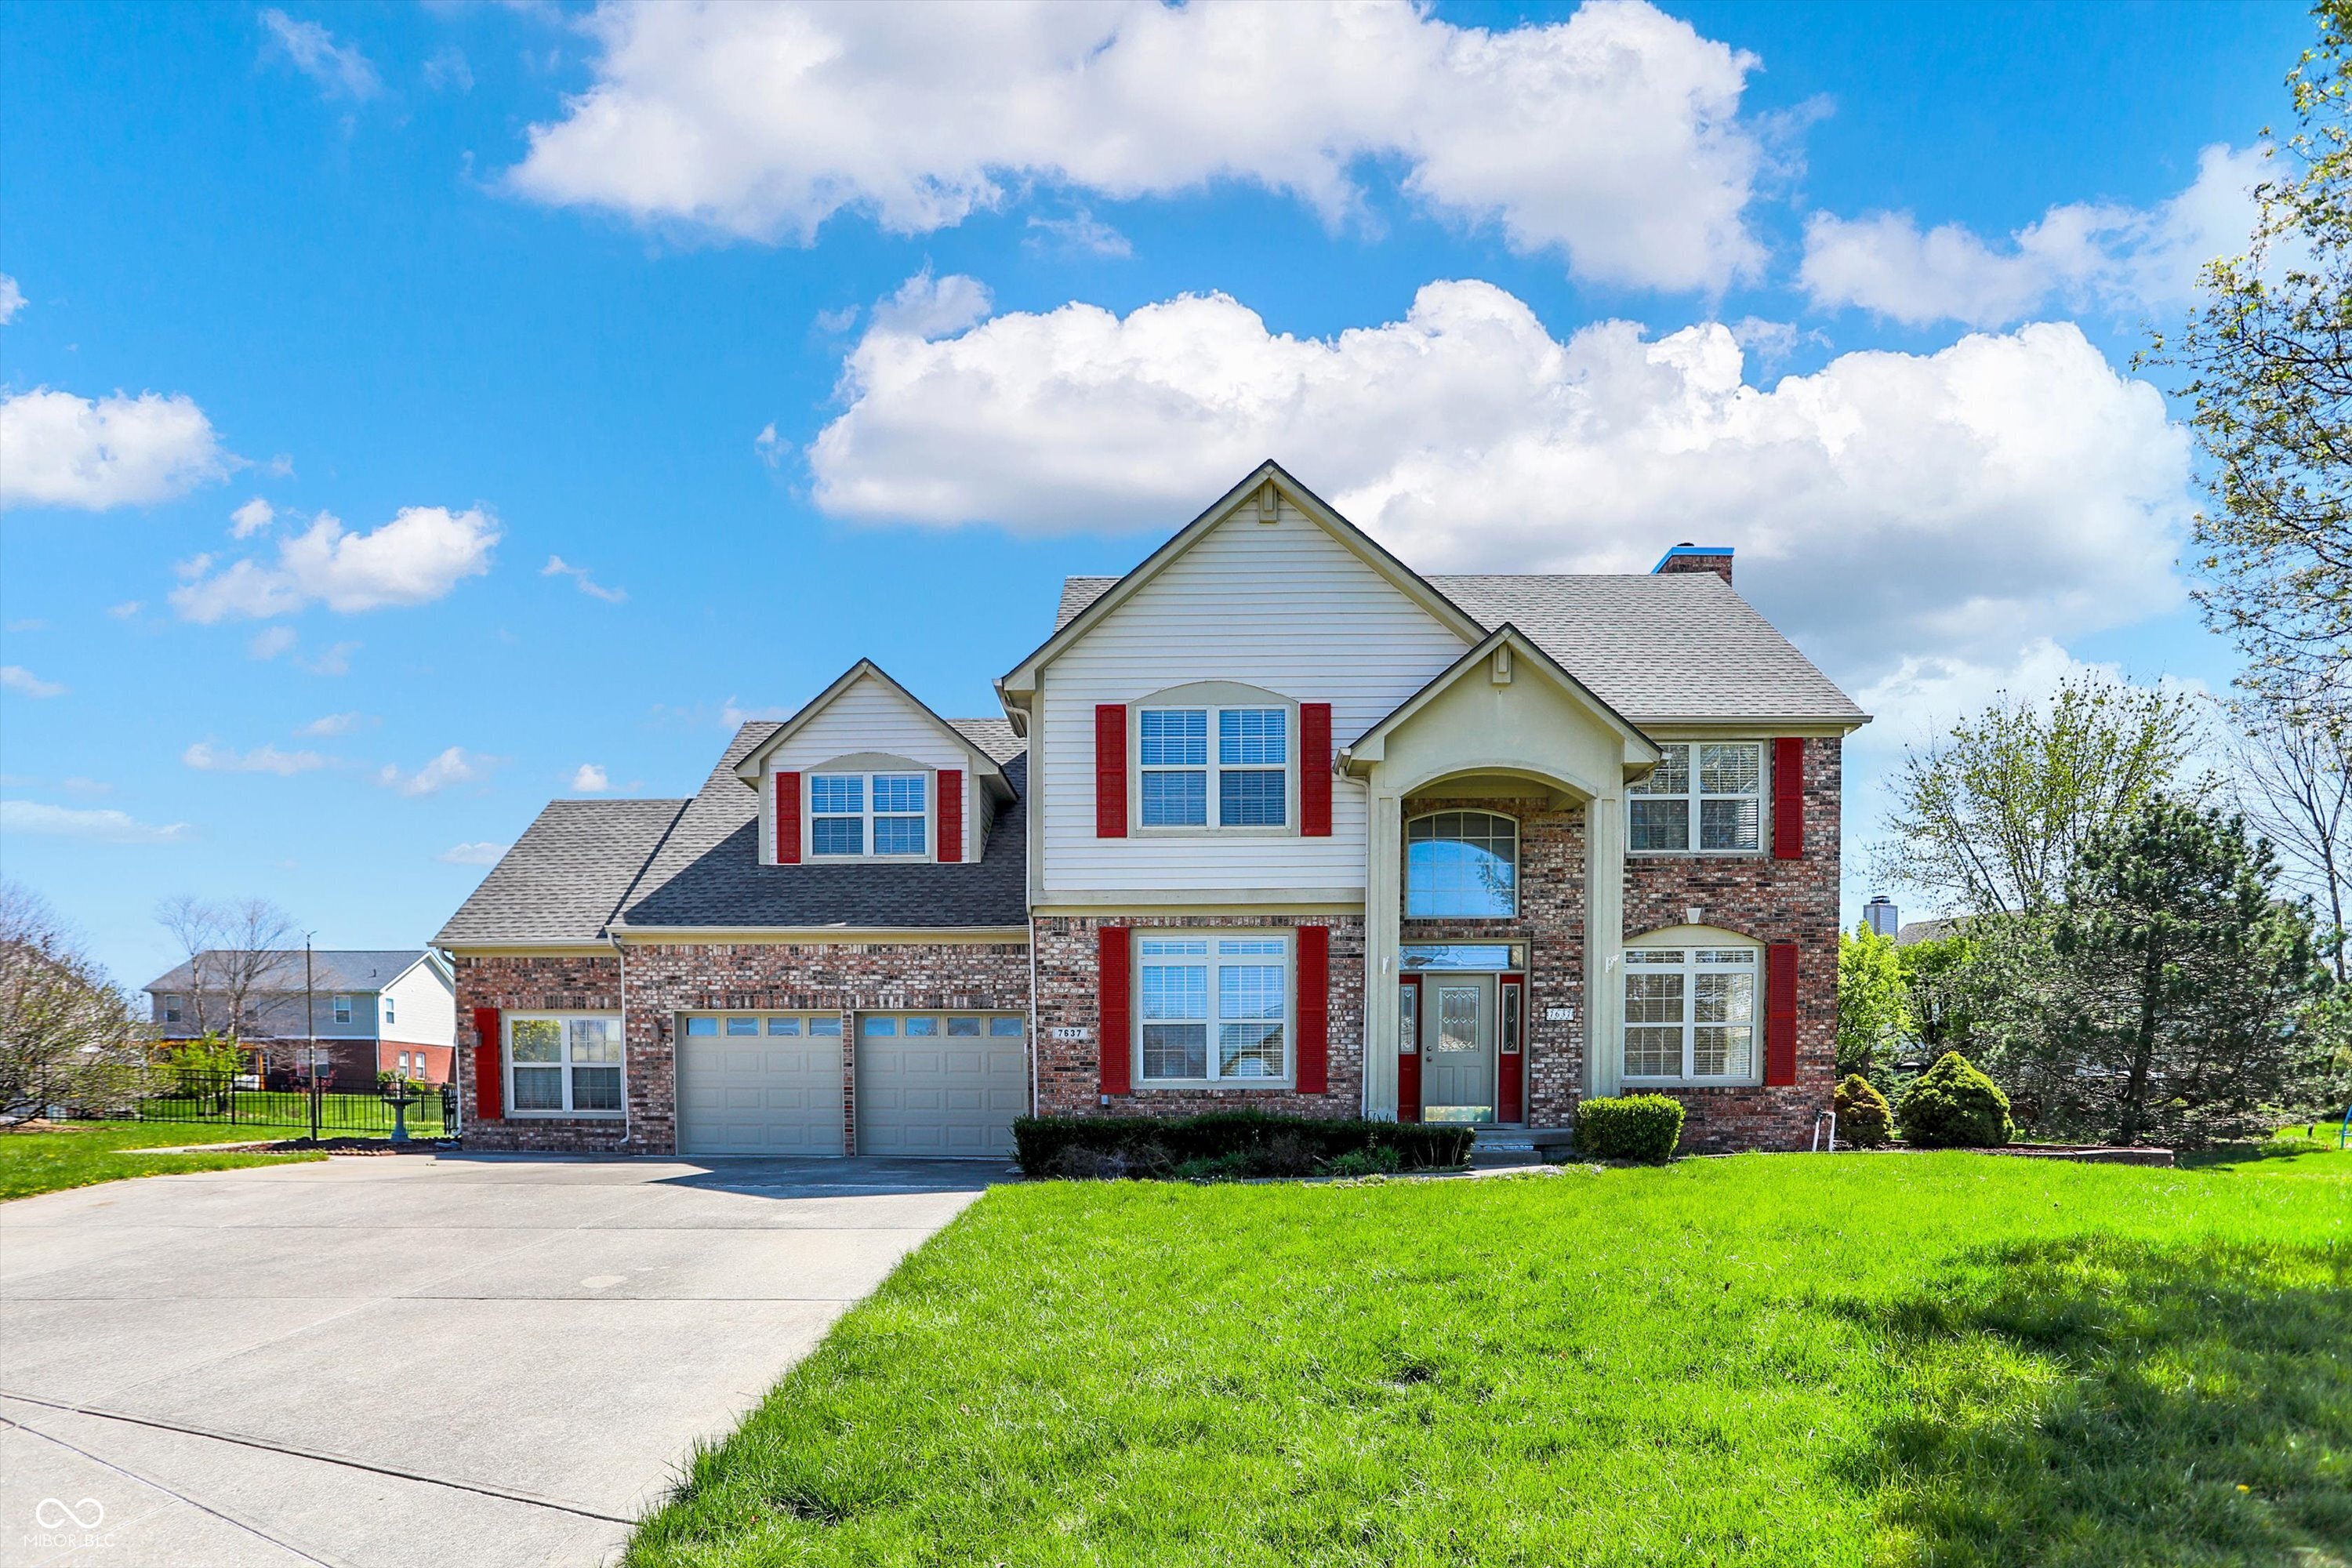
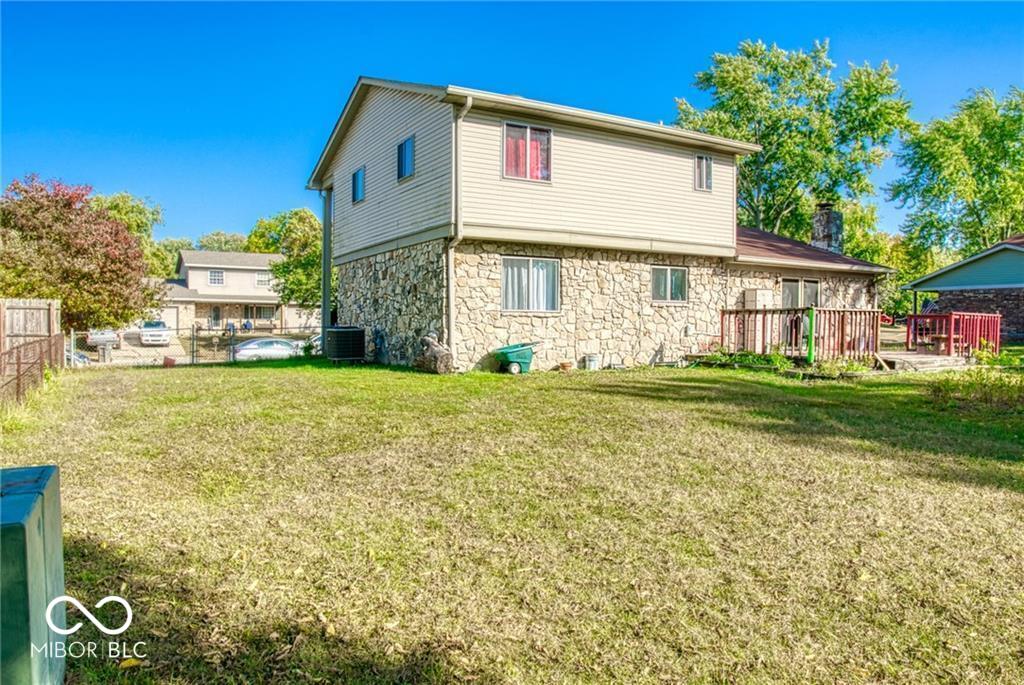
Active
$442,900
4
bds
|
4
ba
|
3,164
sqft
|
built
1999
7637 Sand Run Ct, Indianapolis, IN 46259
$-94
Cash flow
-1.1%
Cash-on-Cash Return
5.9%
Cap rate
0.7%
Rent to Value Ratio
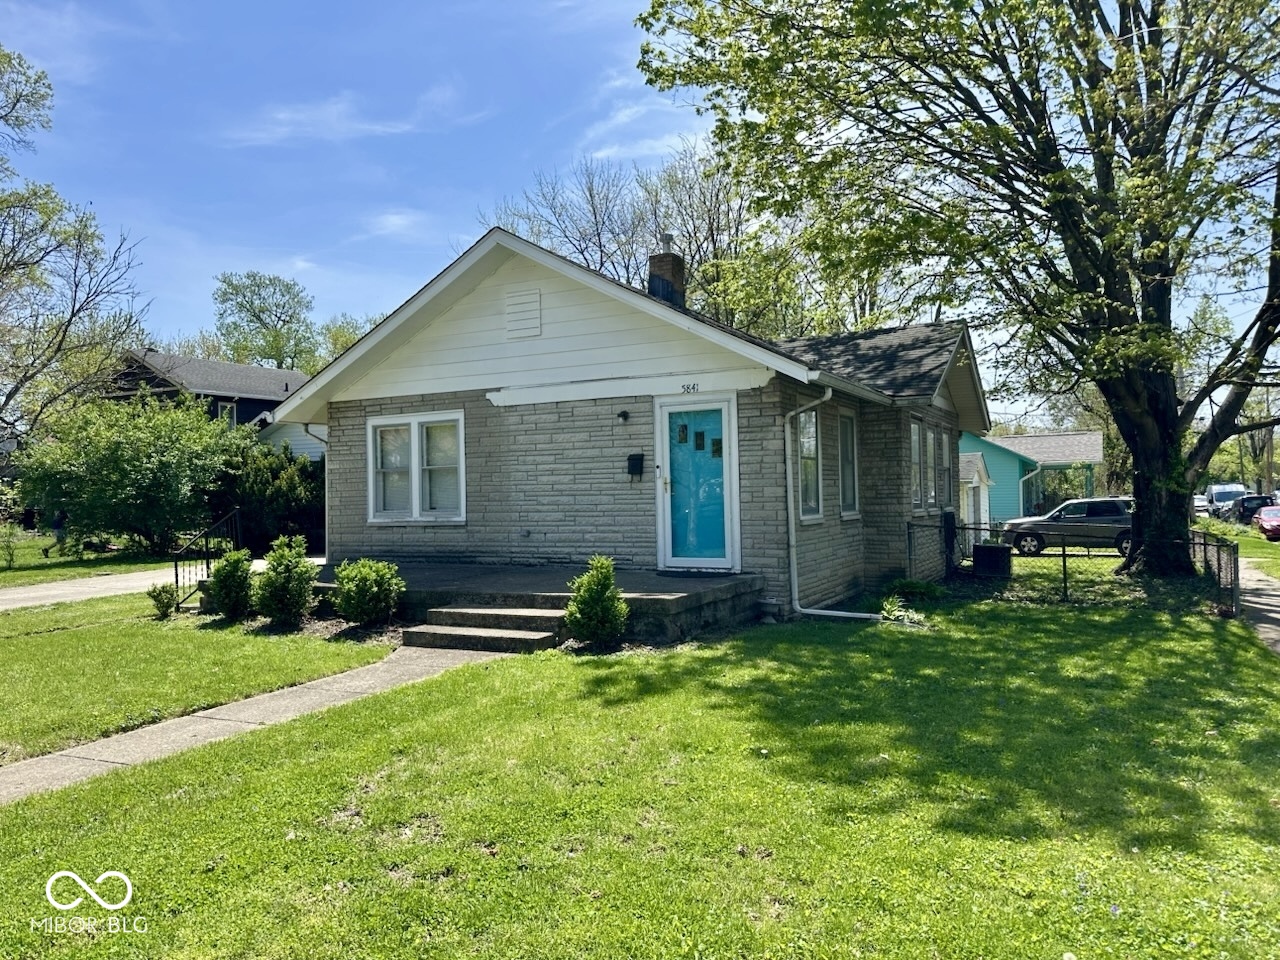
Active
$199,000
2
bds
|
1
ba
|
994
sqft
|
built
1925
5841 Julian Ave, Indianapolis, IN 46219
$-53
Cash flow
-1.4%
Cash-on-Cash Return
5.8%
Cap rate
0.7%
Rent to Value Ratio
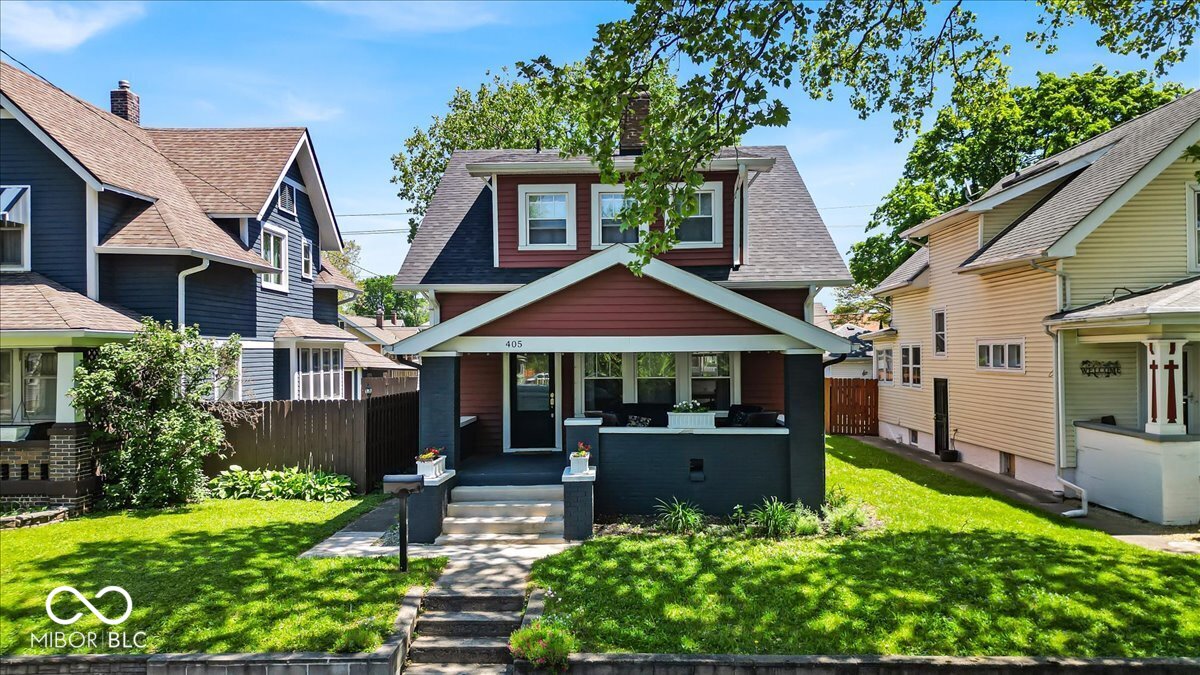
Active
$295,000
4
bds
|
2
ba
|
1,796
sqft
|
built
1923
405 N Drexel Ave, Indianapolis, IN 46201
$-131
Cash flow
-2.3%
Cash-on-Cash Return
5.6%
Cap rate
0.7%
Rent to Value Ratio
Active
$109,900
3
bds
|
1
ba
|
1,808
sqft
|
built
1910
2165 S Meridian St, Indianapolis, IN 46225
$334
Cash flow
15.9%
Cash-on-Cash Return
9.8%
Cap rate
1.2%
Rent to Value Ratio
Pending
$224,900
3
bds
|
2
ba
|
1,651
sqft
|
built
1940
2709 E Troy Ave, Indianapolis, IN 46203
$90
Cash flow
2.1%
Cash-on-Cash Return
6.6%
Cap rate
0.8%
Rent to Value Ratio
Active
$415,000
3
bds
|
3
ba
|
2,767
sqft
|
built
1910
1330 Marlowe Ave, Indianapolis, IN 46202
$358
Cash flow
4.5%
Cash-on-Cash Return
7.2%
Cap rate
0.9%
Rent to Value Ratio
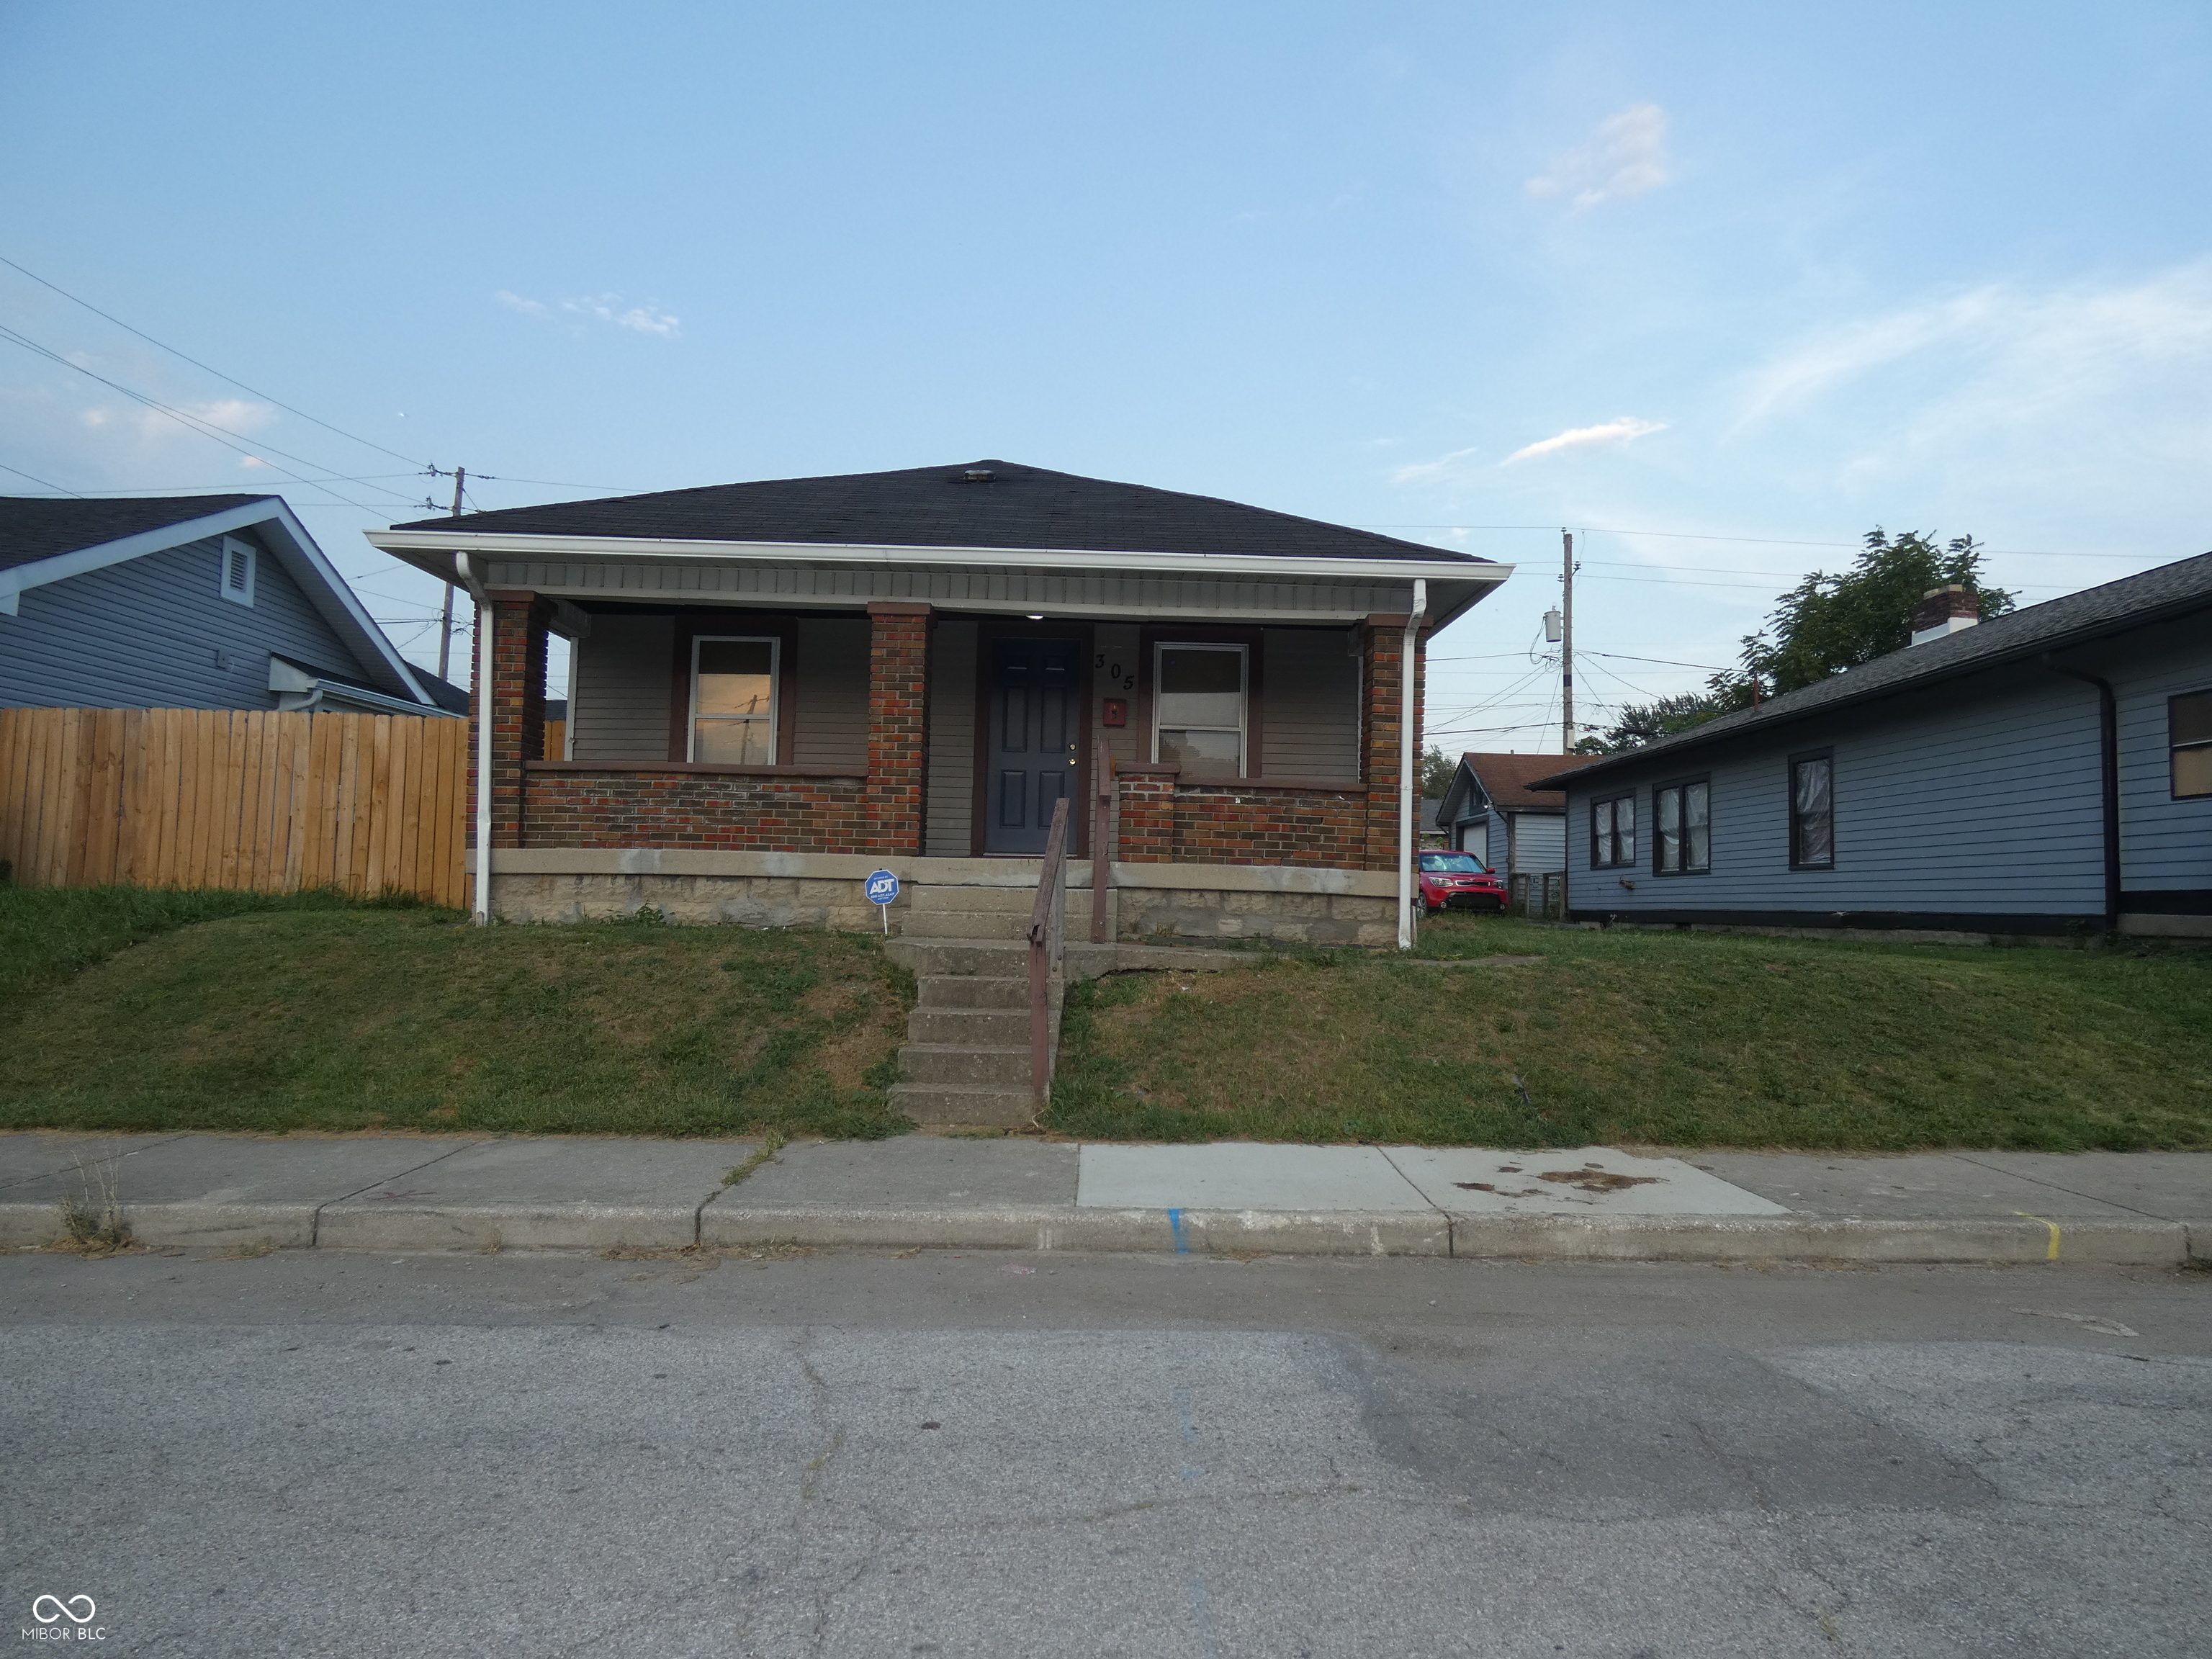
Active
$138,800
2
bds
|
1
ba
|
942
sqft
|
built
1914
305 Leeds Ave, Indianapolis, IN 46201
$255
Cash flow
9.6%
Cash-on-Cash Return
8.4%
Cap rate
1.0%
Rent to Value Ratio
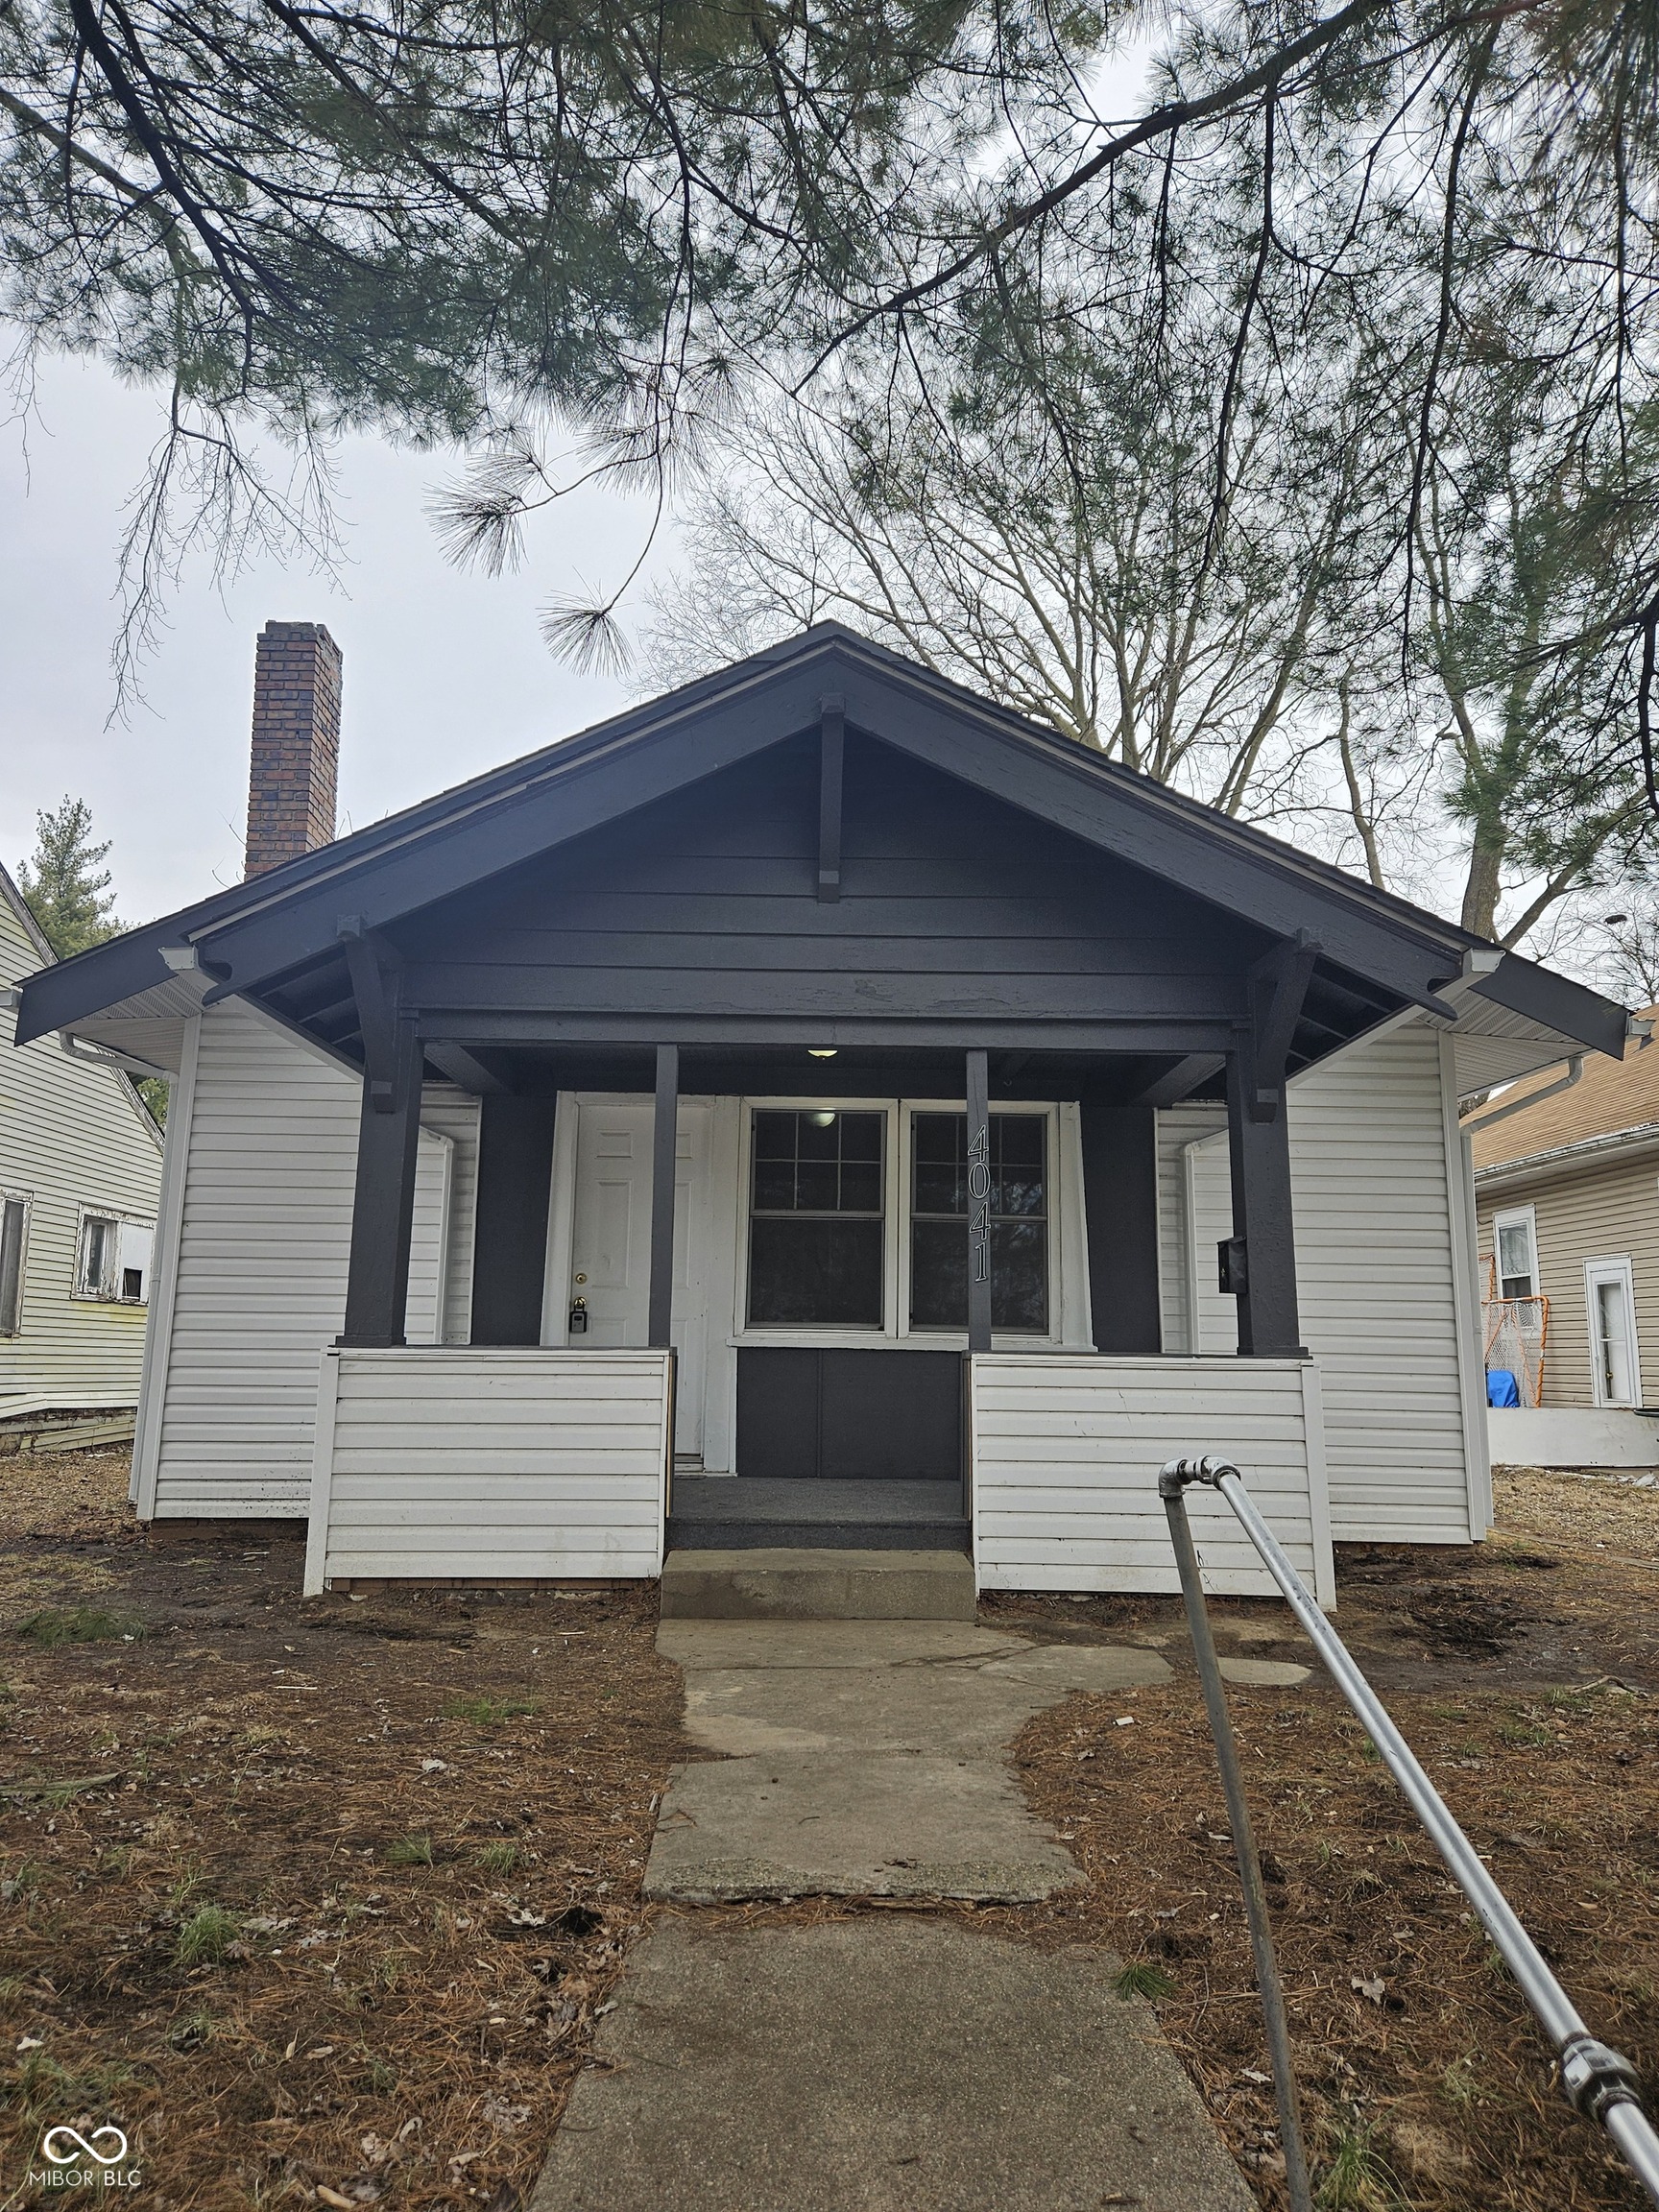
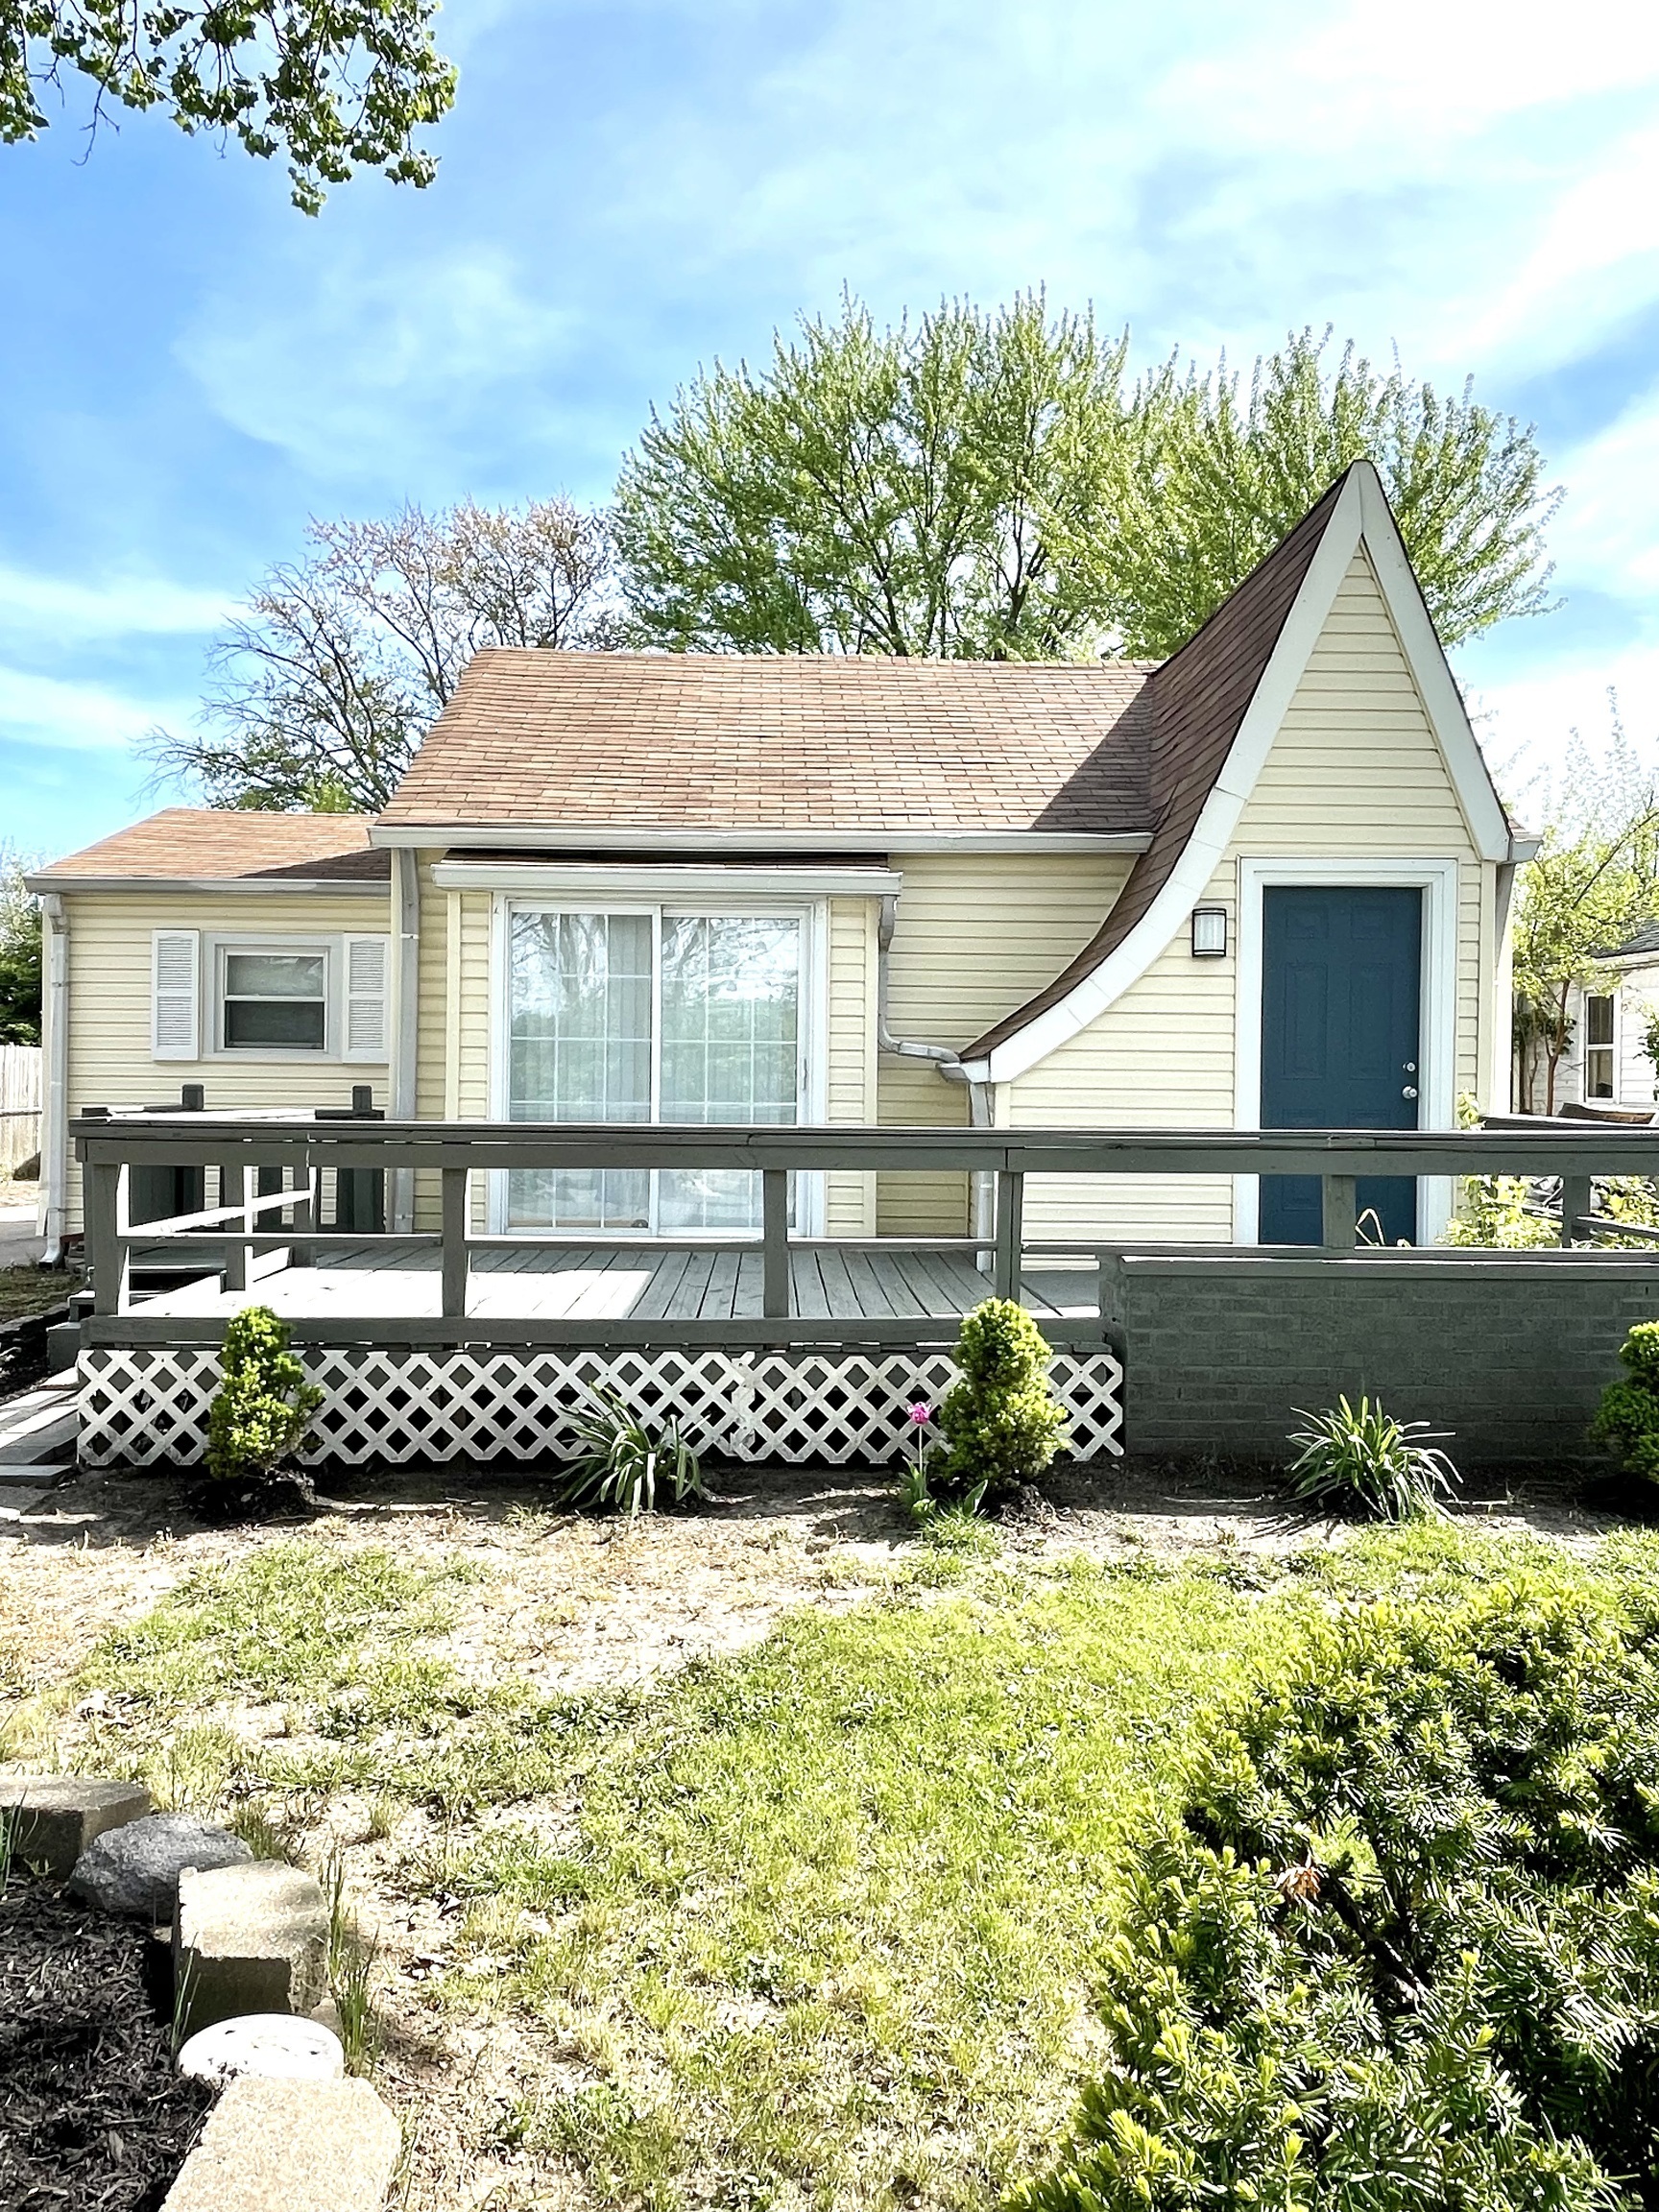
Active
$134,900
2
bds
|
1
ba
|
1,196
sqft
|
built
1920
4041 Boulevard Pl, Indianapolis, IN 46208
$275
Cash flow
10.6%
Cash-on-Cash Return
8.6%
Cap rate
1.0%
Rent to Value Ratio
Pending
$219,900
3
bds
|
3
ba
|
1,440
sqft
|
built
2000
5411 Cliff Ridge Dr, Indianapolis, IN 46217
$29
Cash flow
0.7%
Cash-on-Cash Return
6.3%
Cap rate
0.8%
Rent to Value Ratio
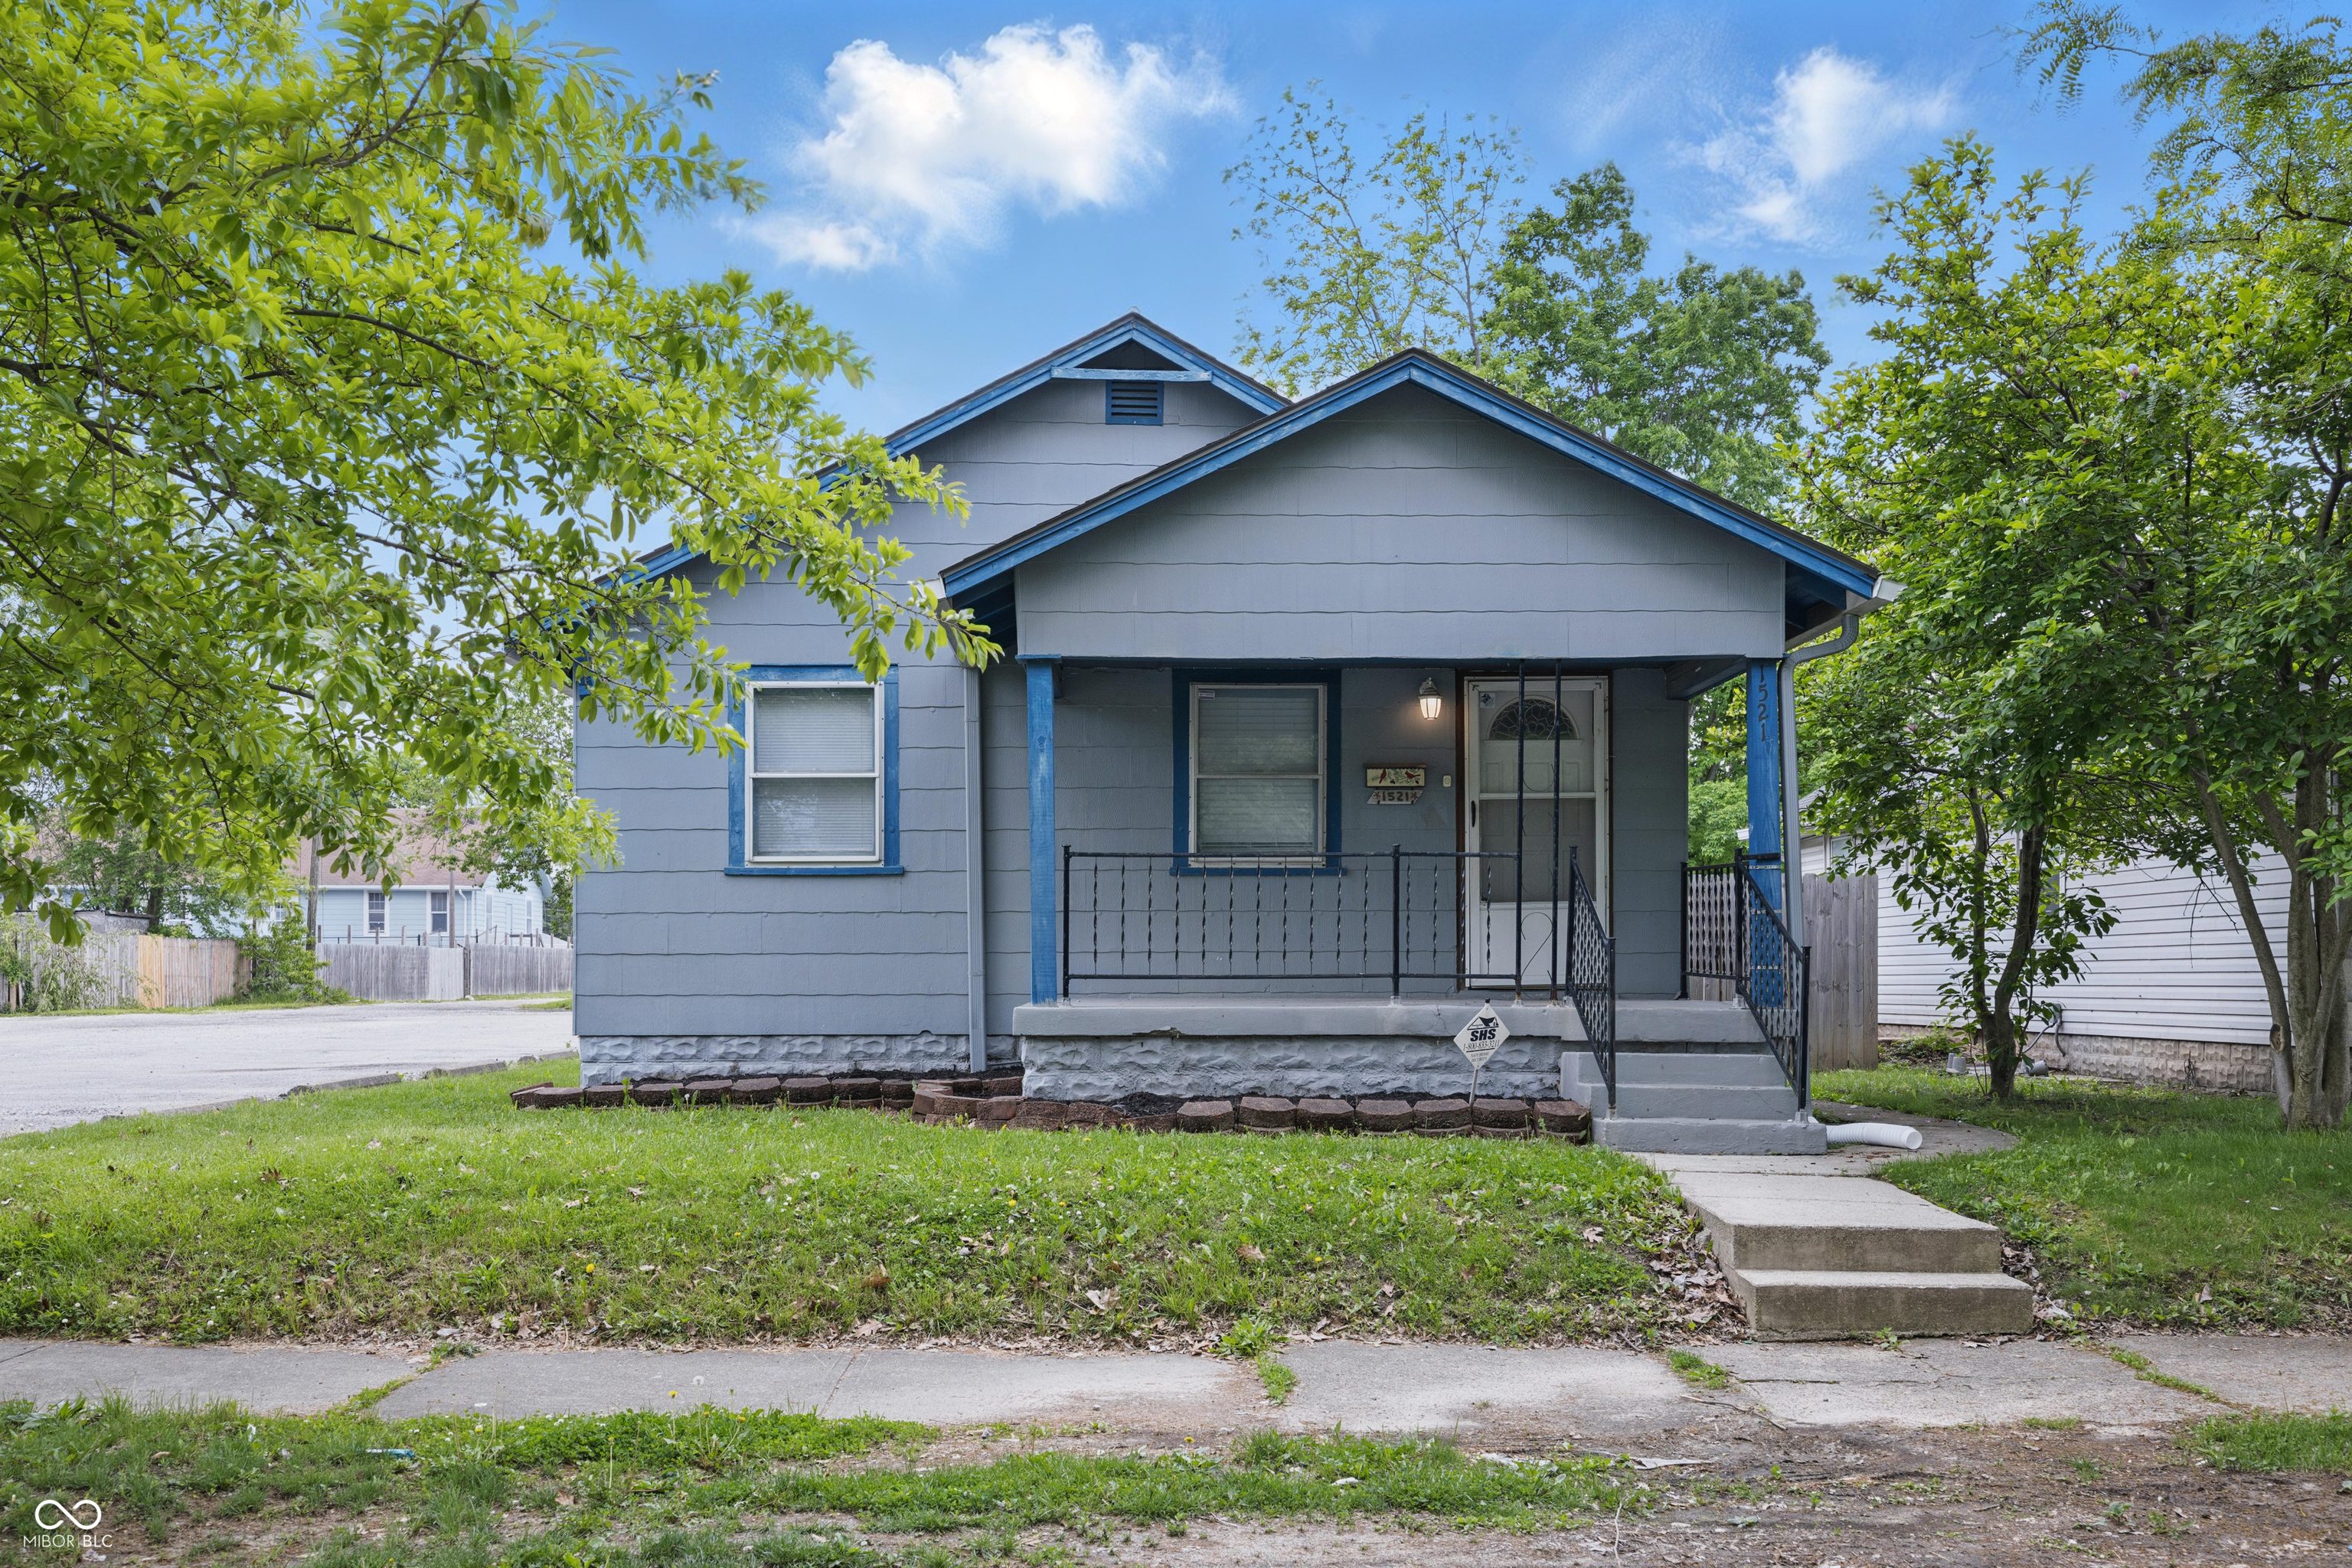
Active
$157,000
2
bds
|
1
ba
|
856
sqft
|
built
1919
1521 N Gladstone Ave, Indianapolis, IN 46201
$162
Cash flow
5.4%
Cash-on-Cash Return
7.4%
Cap rate
0.9%
Rent to Value Ratio