Indianapolis, IN Investment Properties for Sale
Browse homes for sale and investment properties in Indianapolis, IN. Refine your search by price, property type, or more.
Best cash flowing properties in Indianapolis, IN
Active
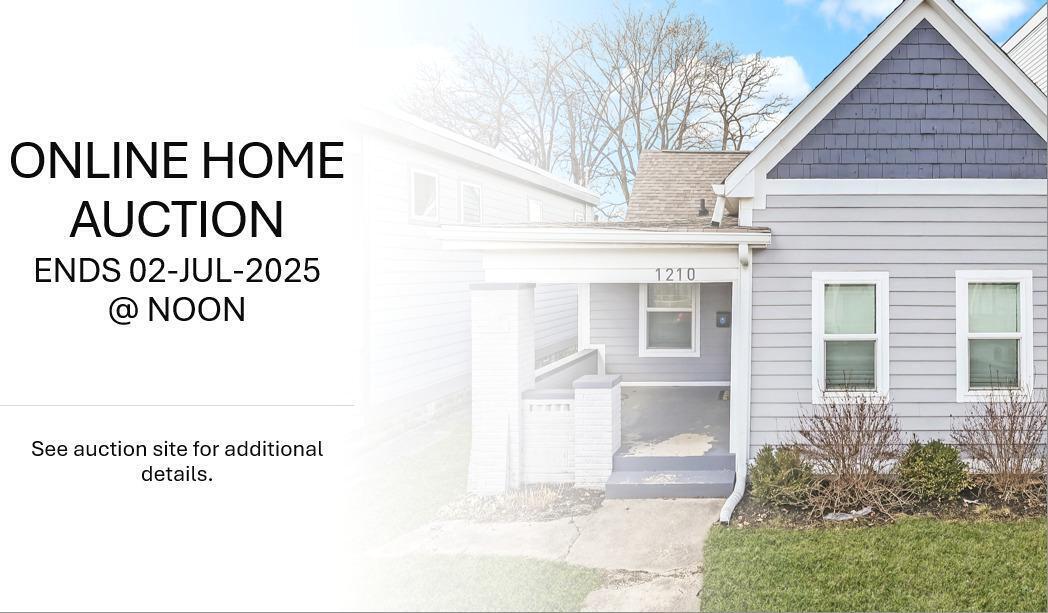
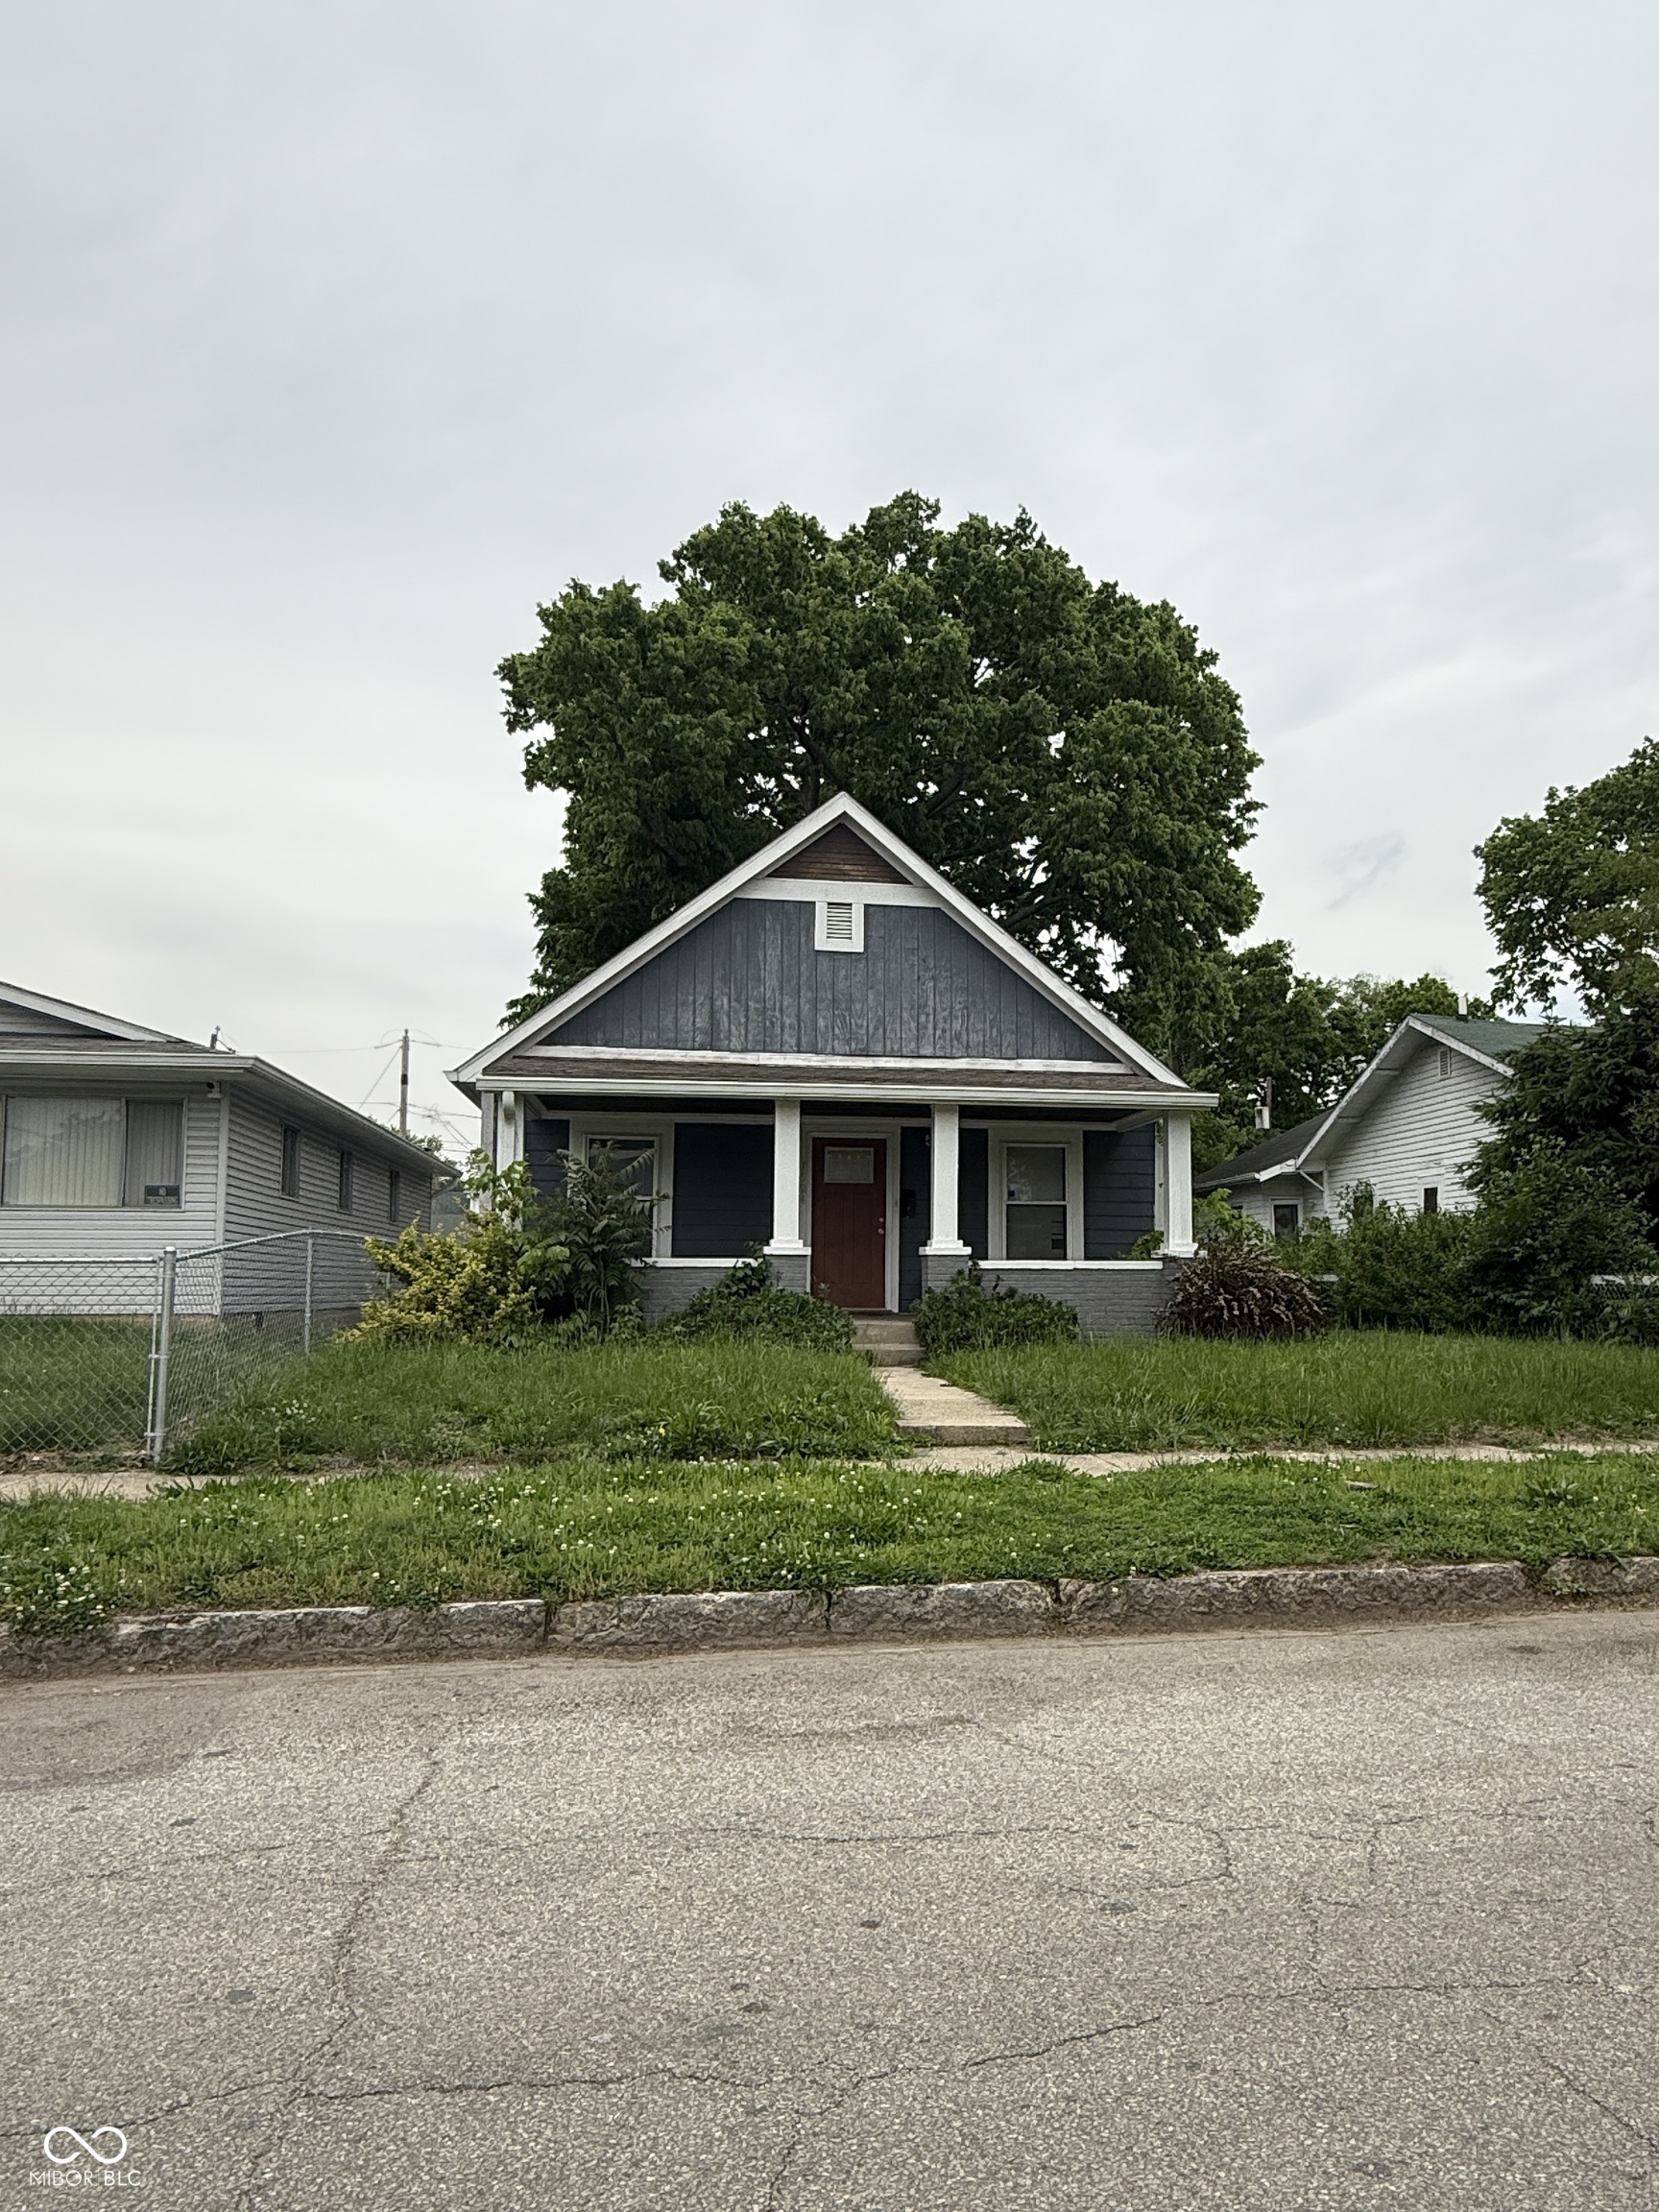
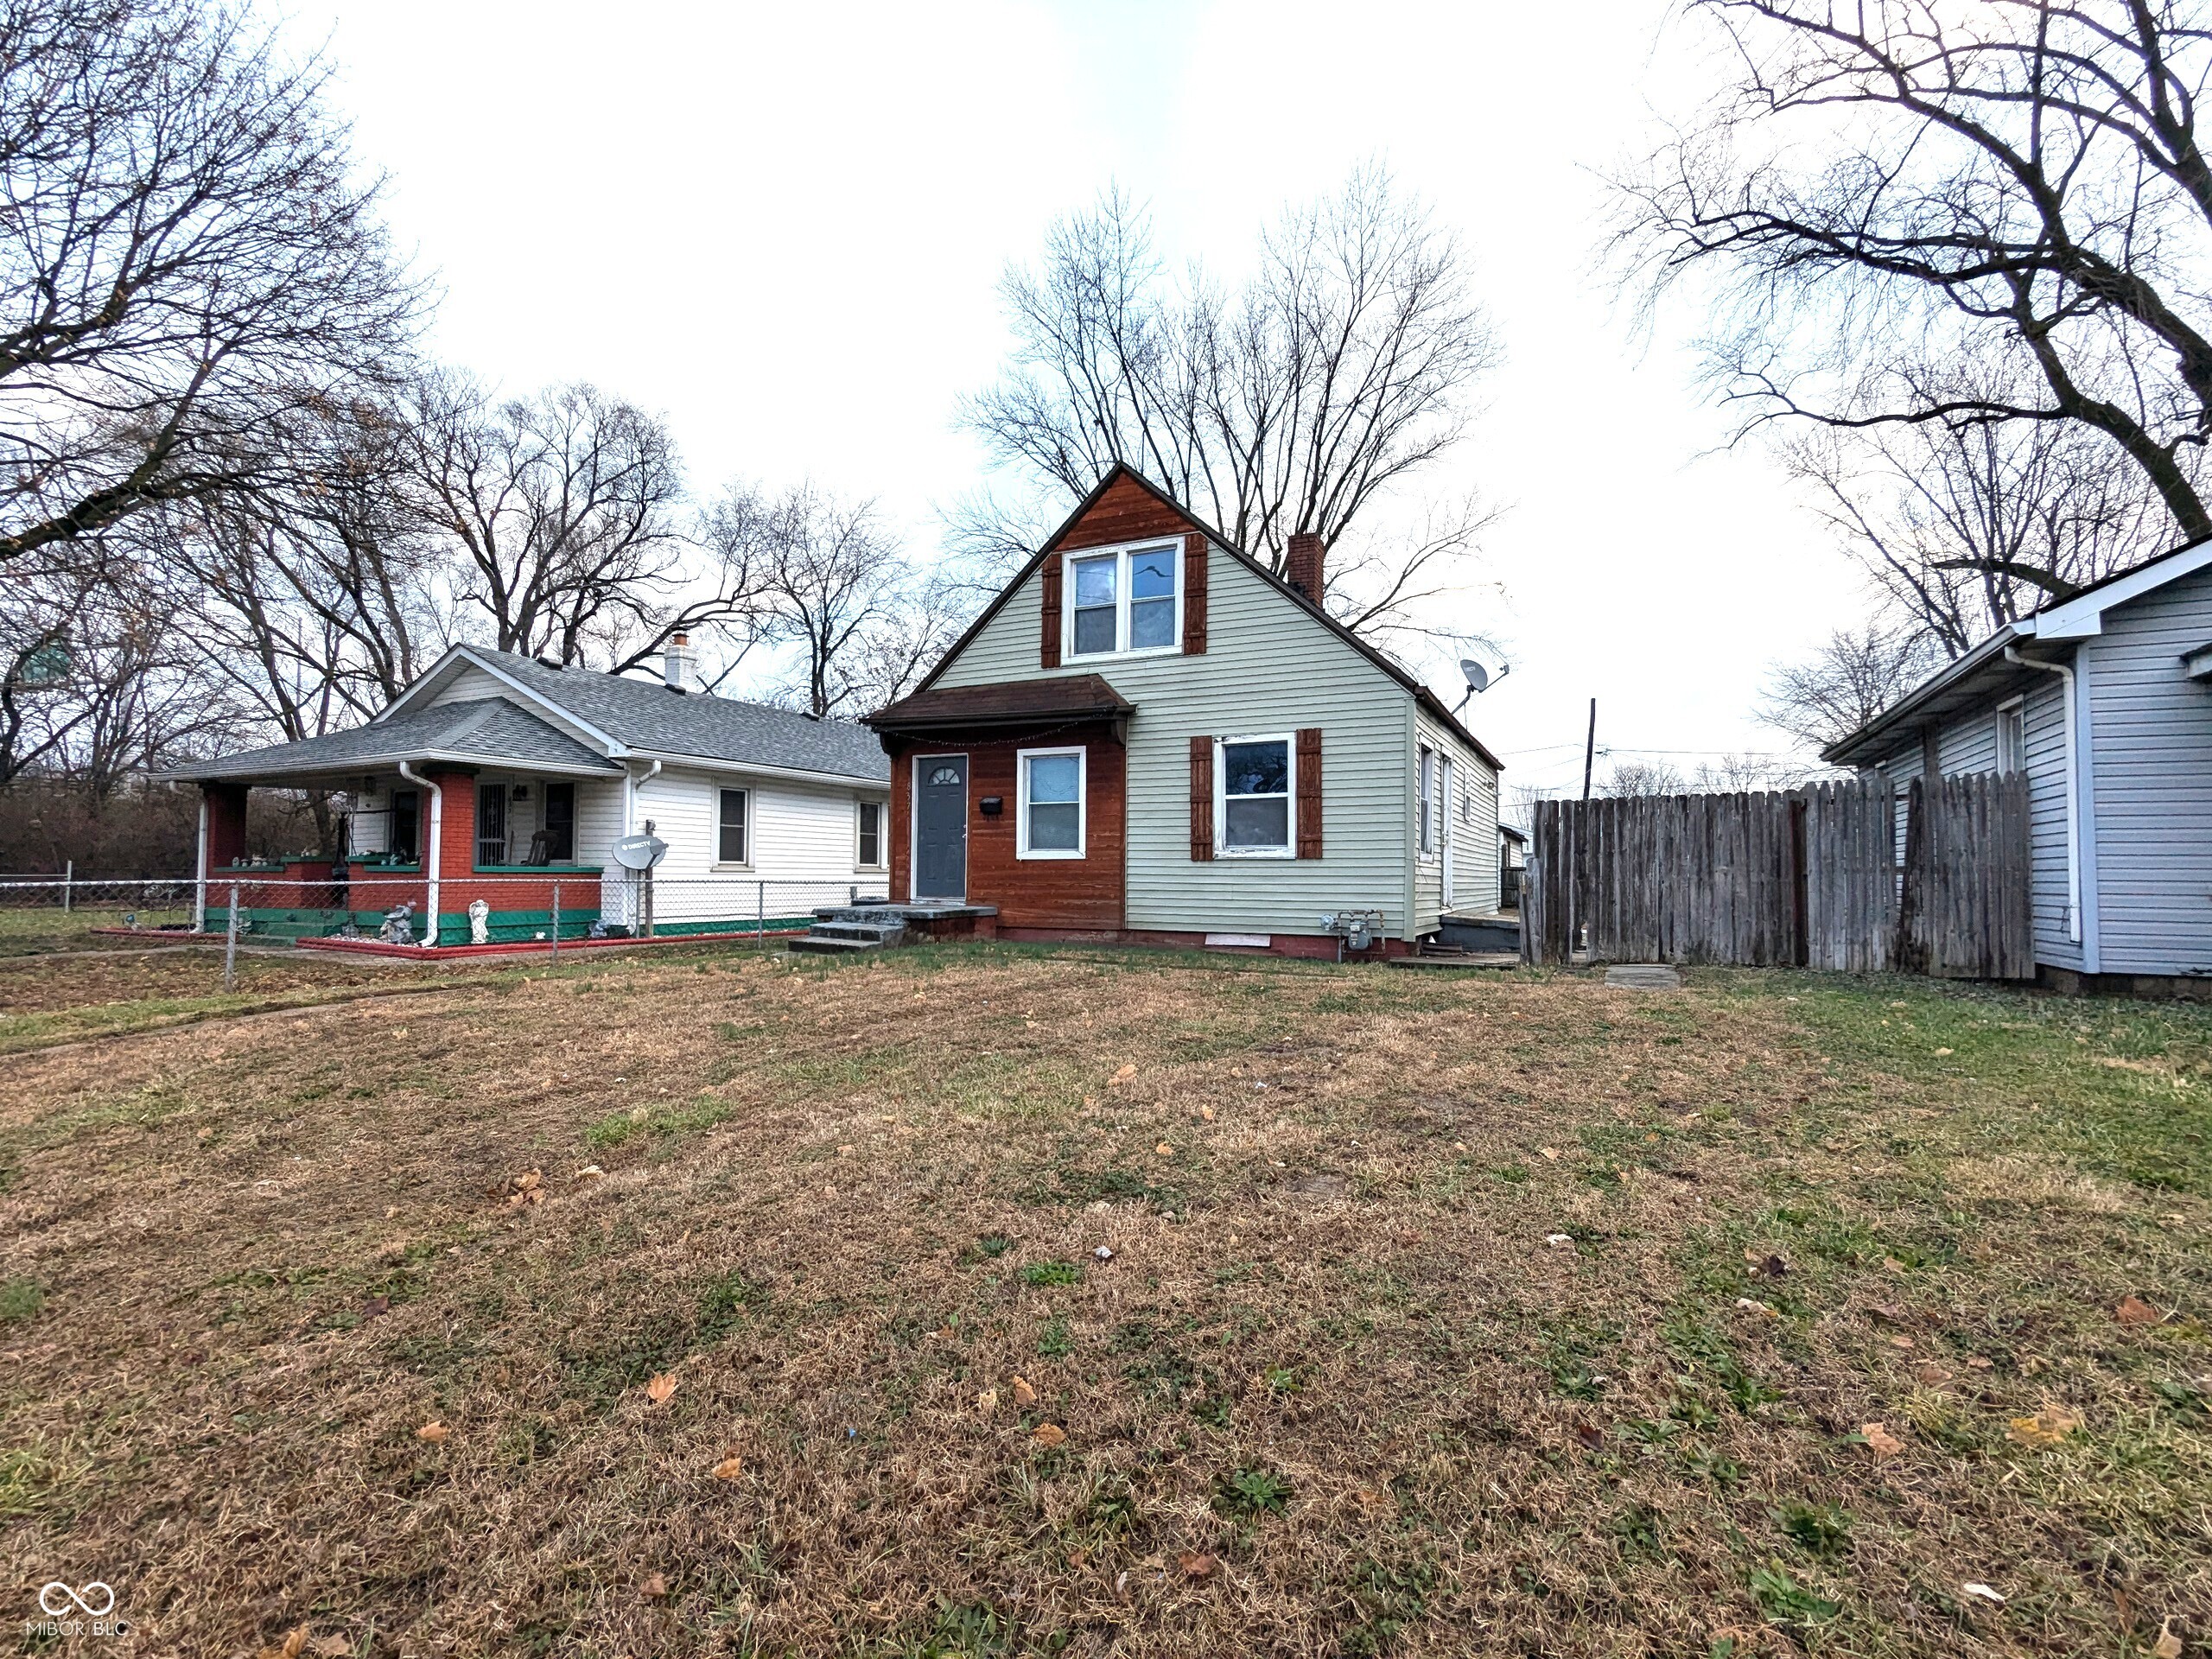
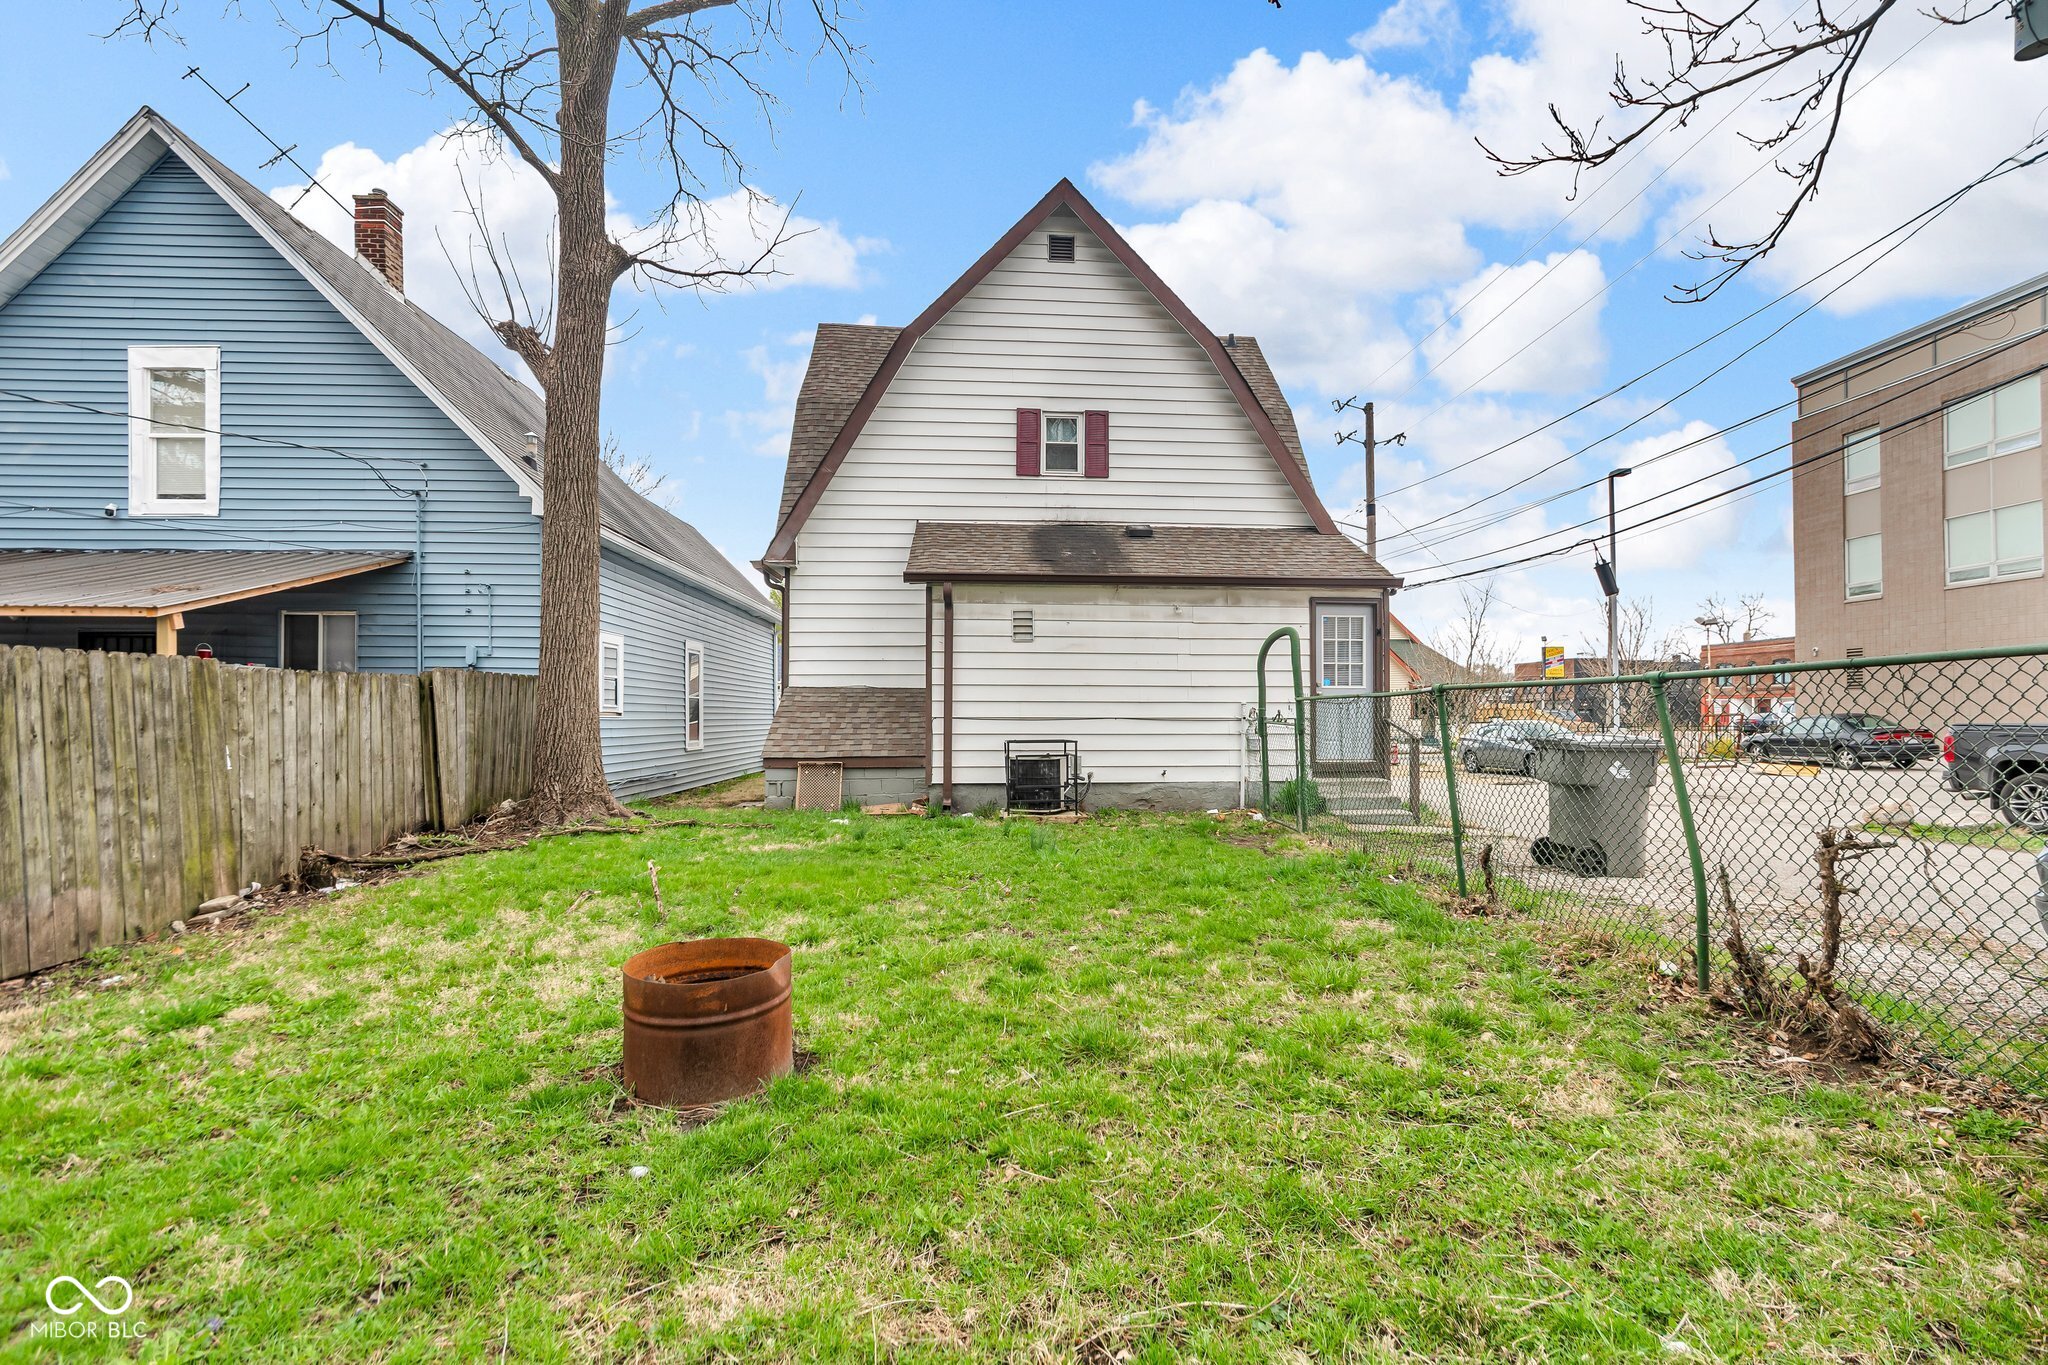
$149,900
3
bds
|
2
ba
|
910
sqft
|
built
1910
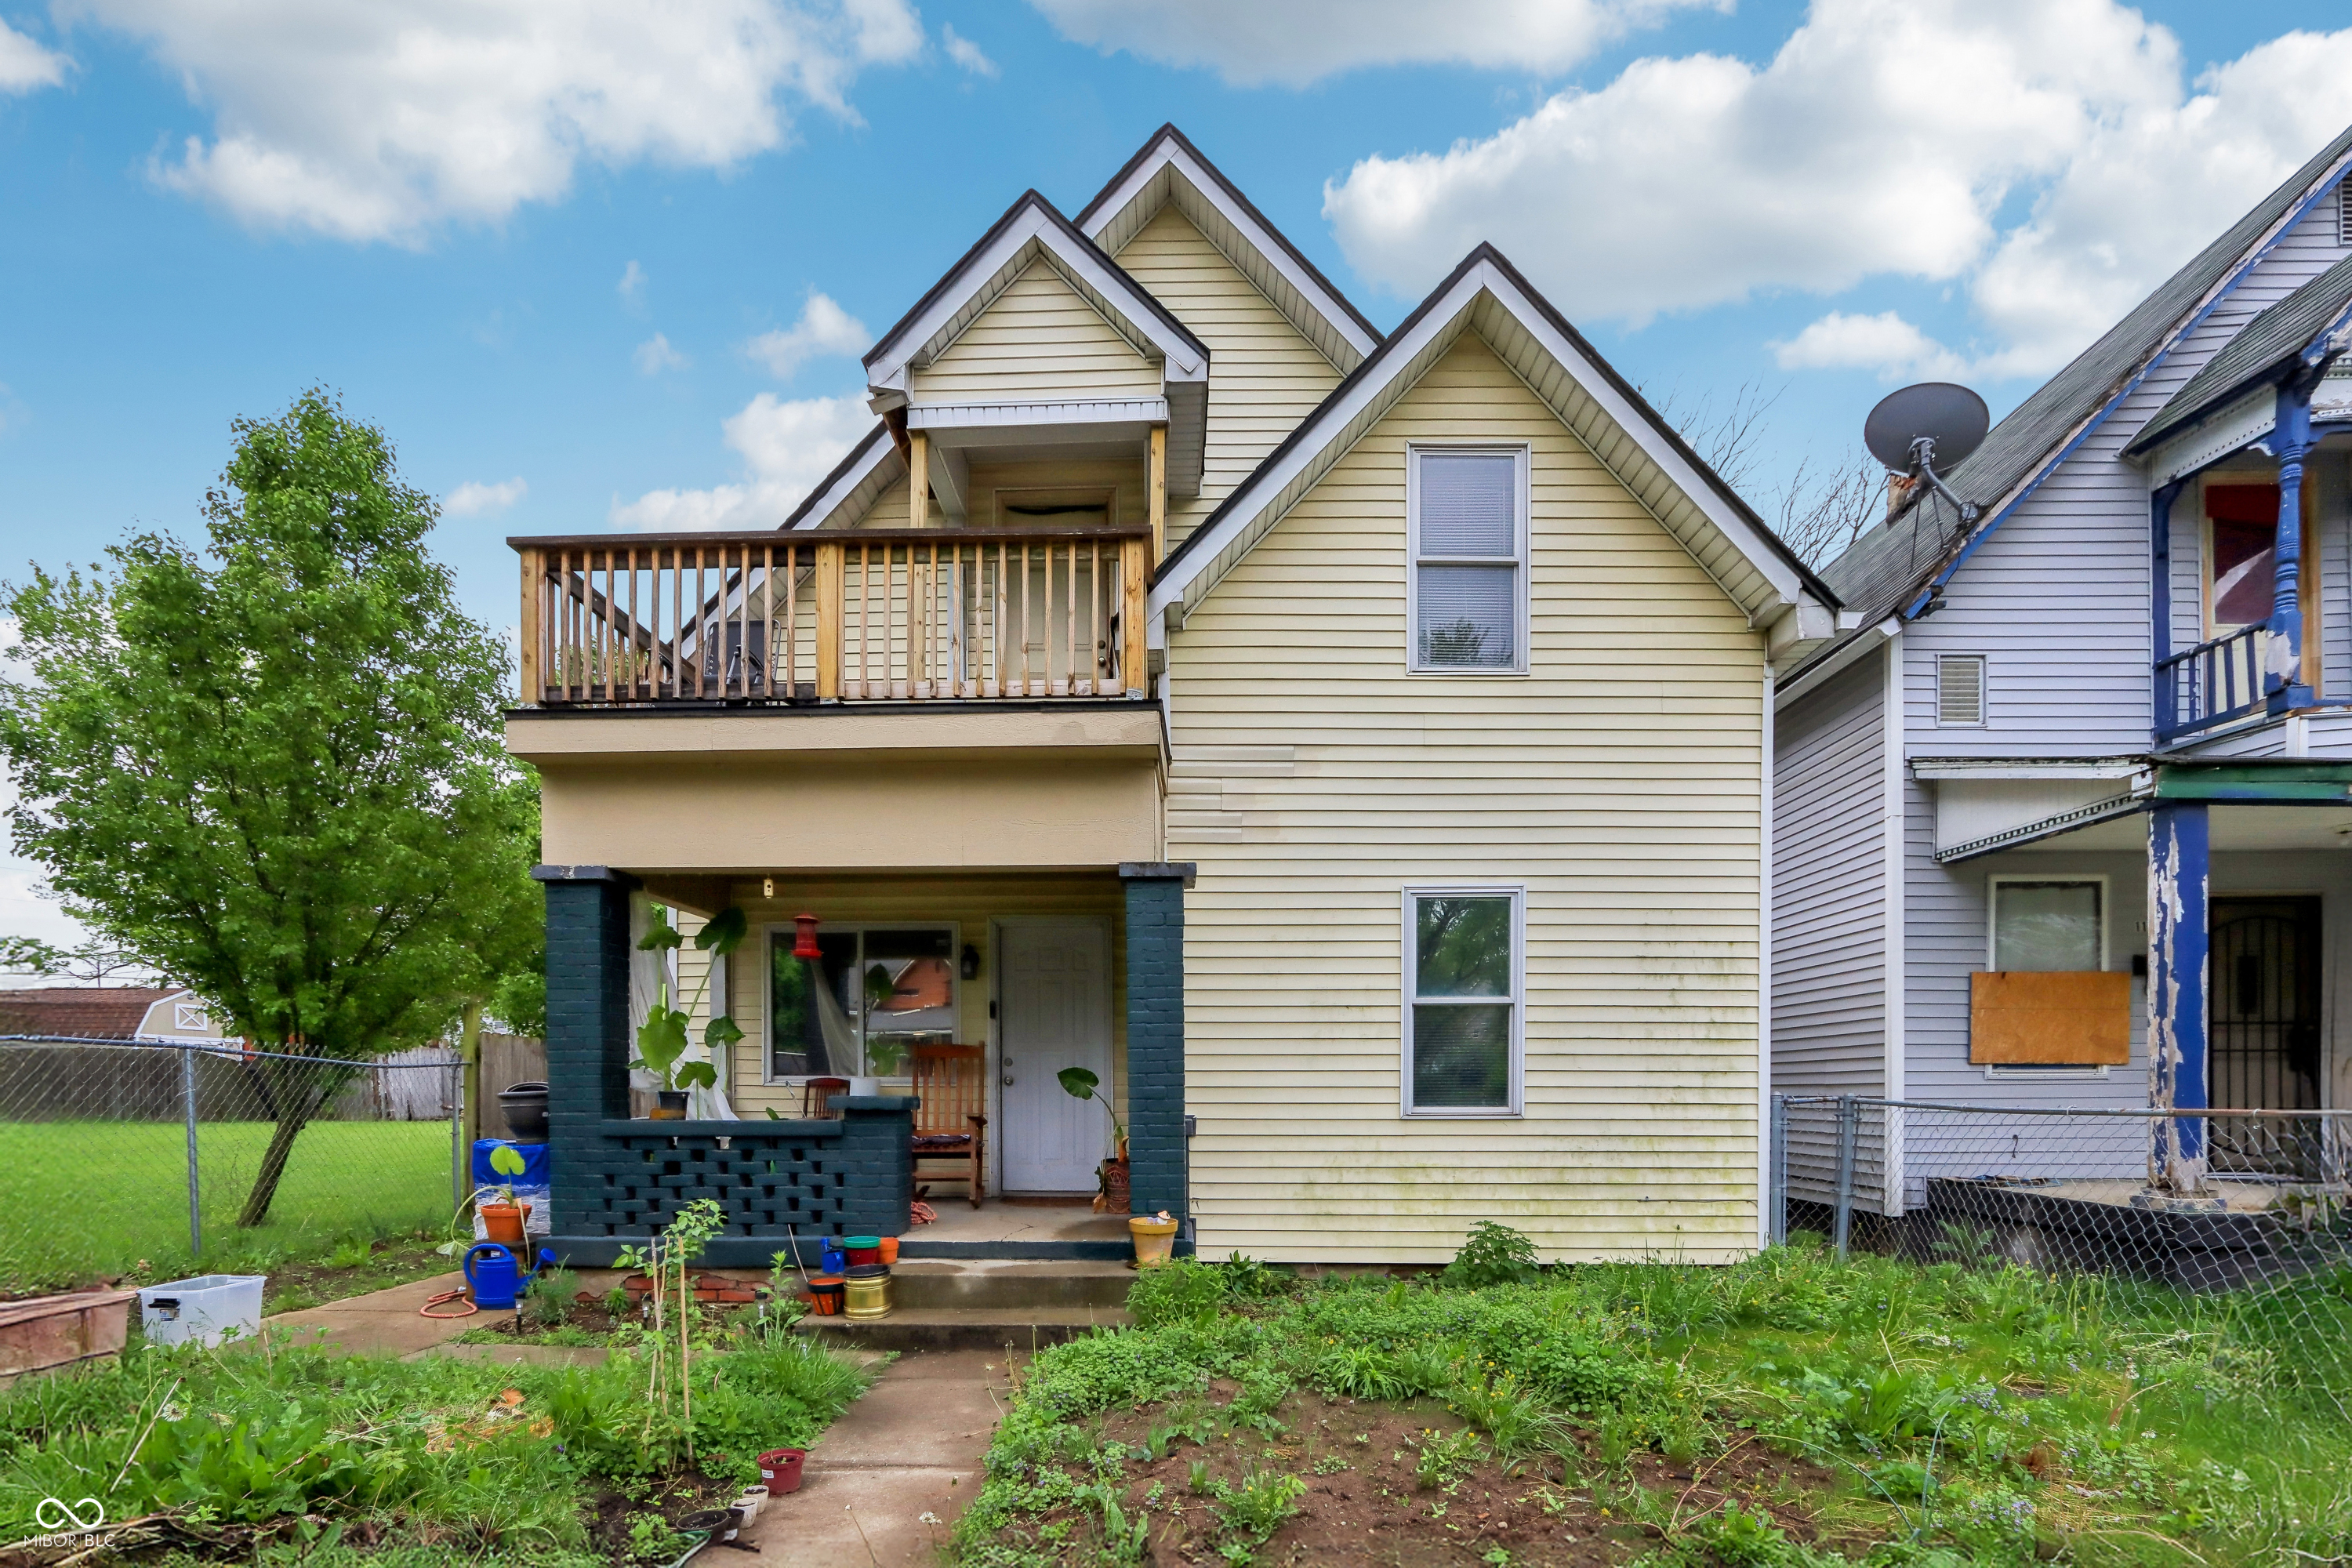
1210 S State Ave, Indianapolis, IN 46203
$750
Cash flow
26.1%
Cash-on-Cash Return
12.2%
Cap rate
1.5%
Rent to Value Ratio
Active
$104,900
2
bds
|
1
ba
|
868
sqft
|
built
1920
1524 W 21st St, Indianapolis, IN 46202
$498
Cash flow
24.8%
Cash-on-Cash Return
11.8%
Cap rate
1.4%
Rent to Value Ratio
1,984 out of 2,125 properties for sale in Indianapolis, IN
Limited Results Shown
Create a free account, or log in to reveal all property listings and enjoy the complete experience.
Active
$79,900
2
bds
|
1
ba
|
1,040
sqft
|
built
1950
837 S Warman Ave, Indianapolis, IN 46221
$350
Cash flow
22.9%
Cash-on-Cash Return
11.4%
Cap rate
1.4%
Rent to Value Ratio
Active
$169,900
4
bds
|
2
ba
|
1,944
sqft
|
built
1910
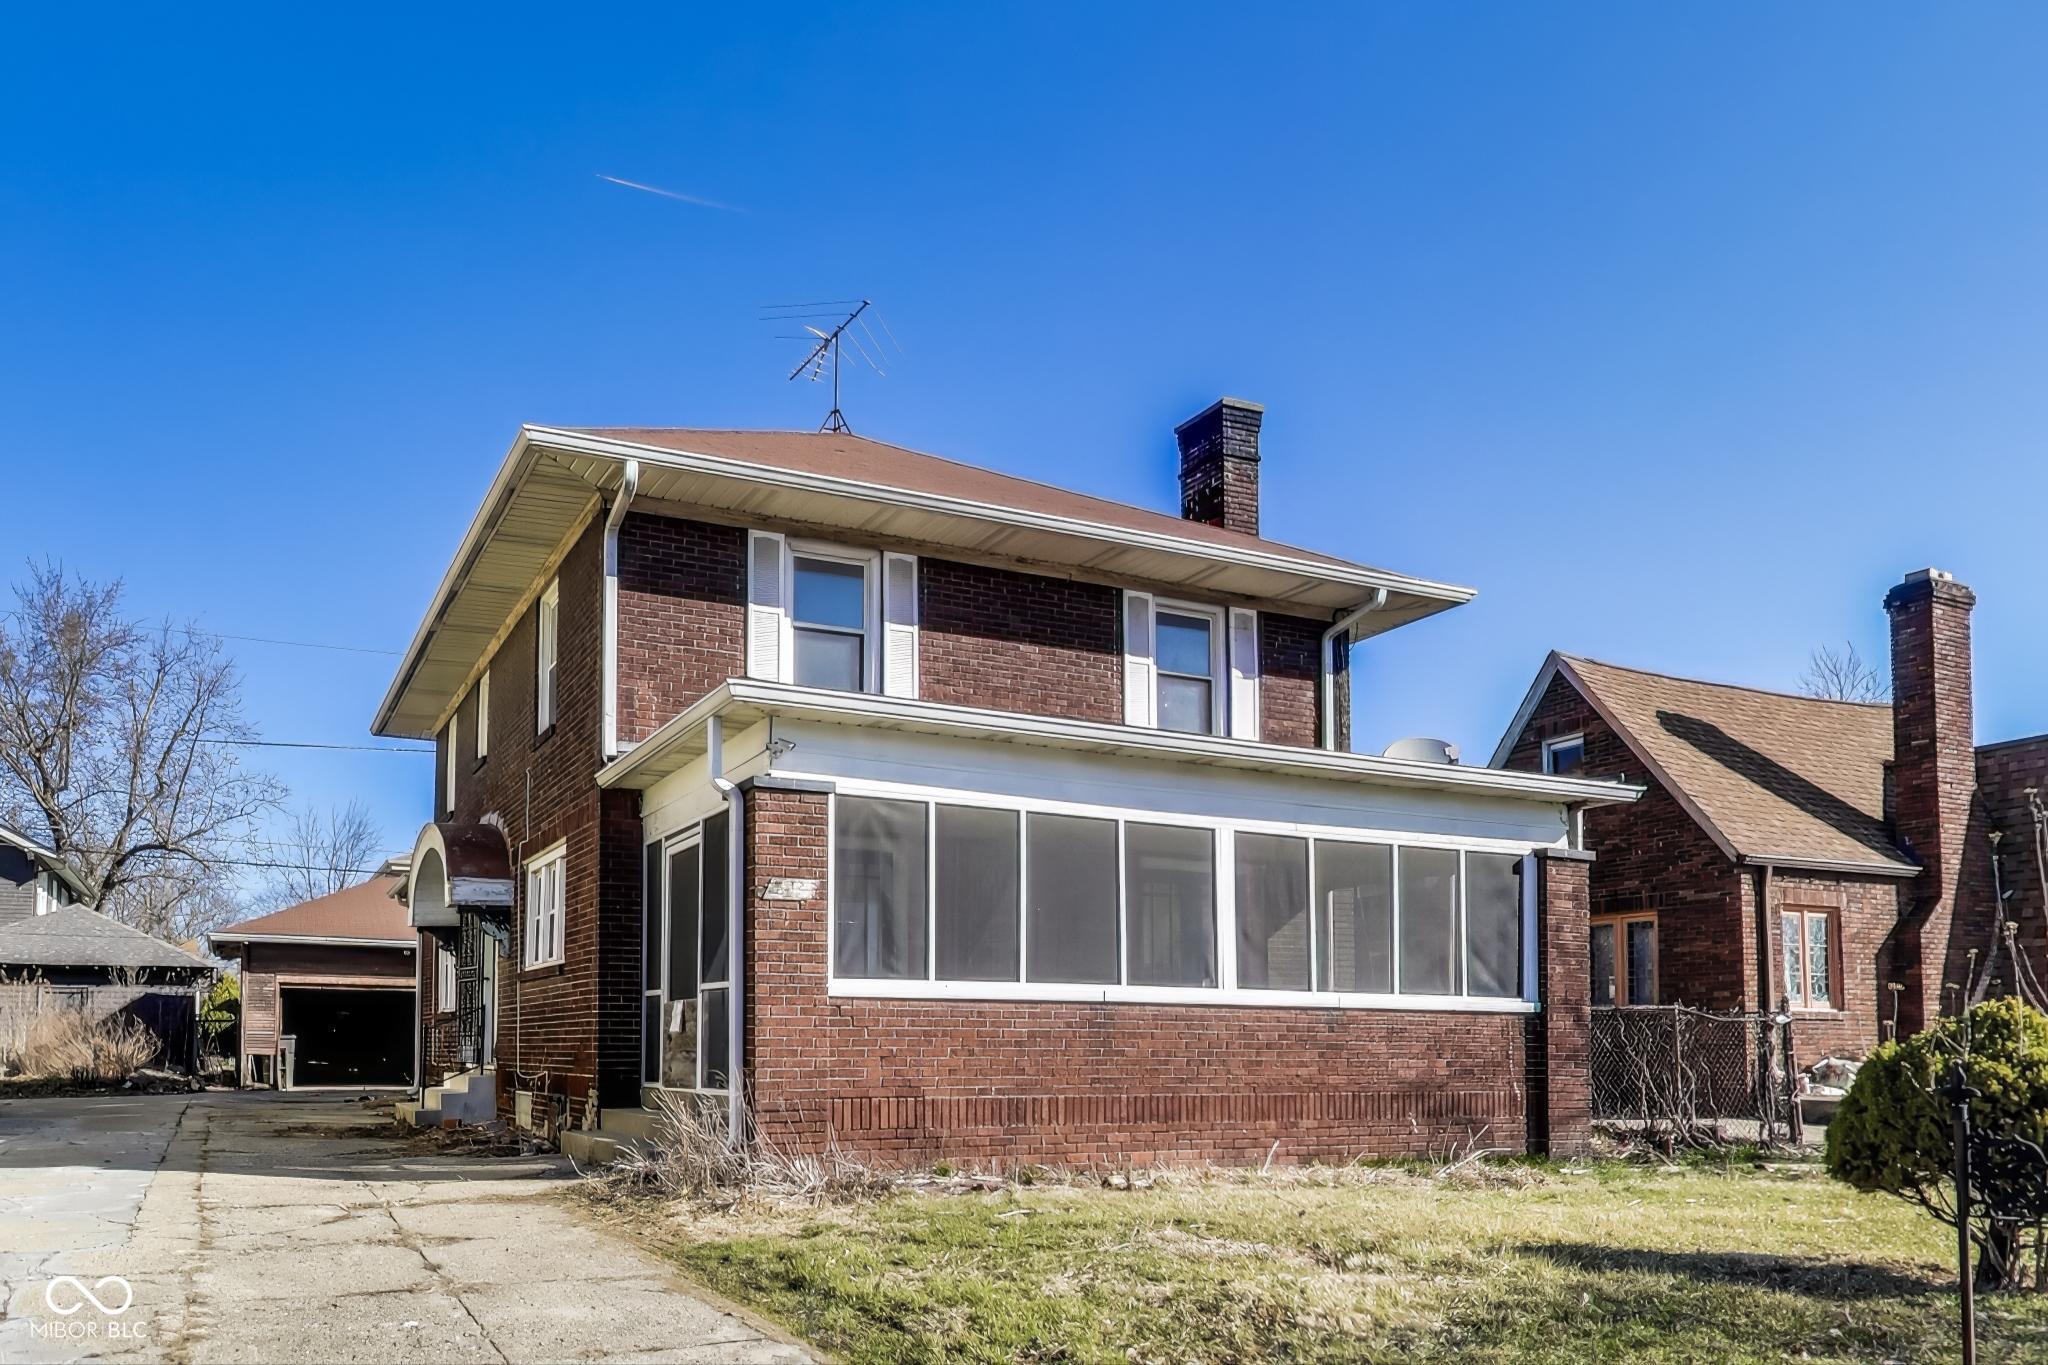
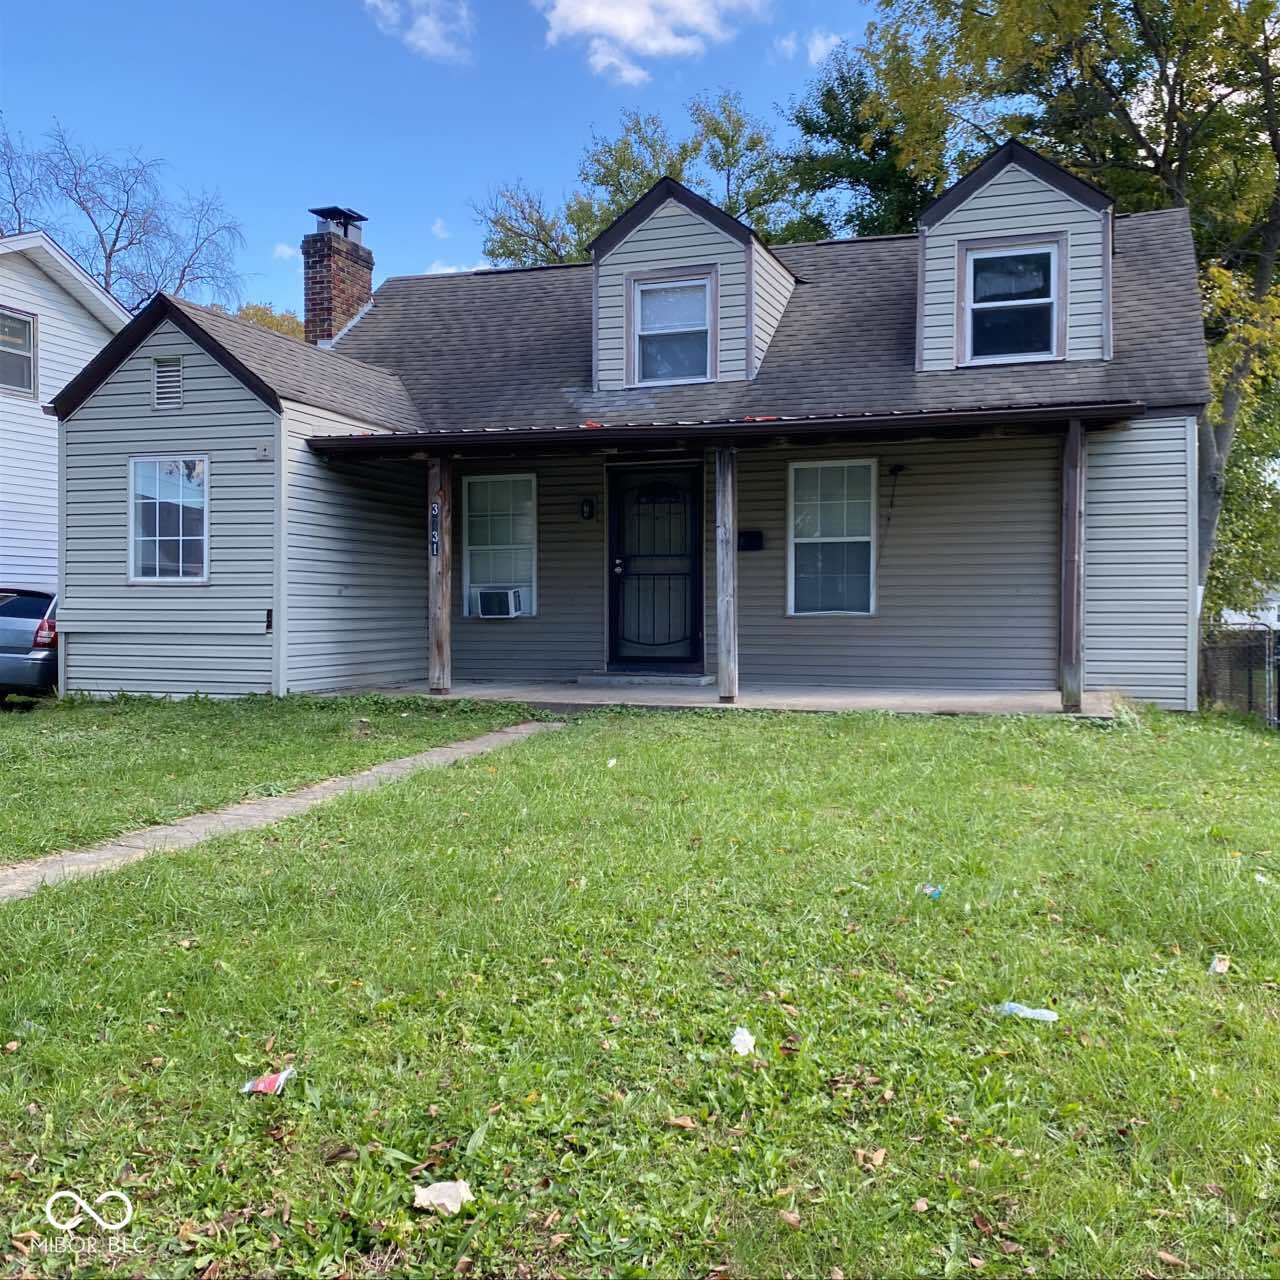
953 N Oakland Ave, Indianapolis, IN 46201
$372
Cash flow
11.4%
Cash-on-Cash Return
8.8%
Cap rate
1.1%
Rent to Value Ratio
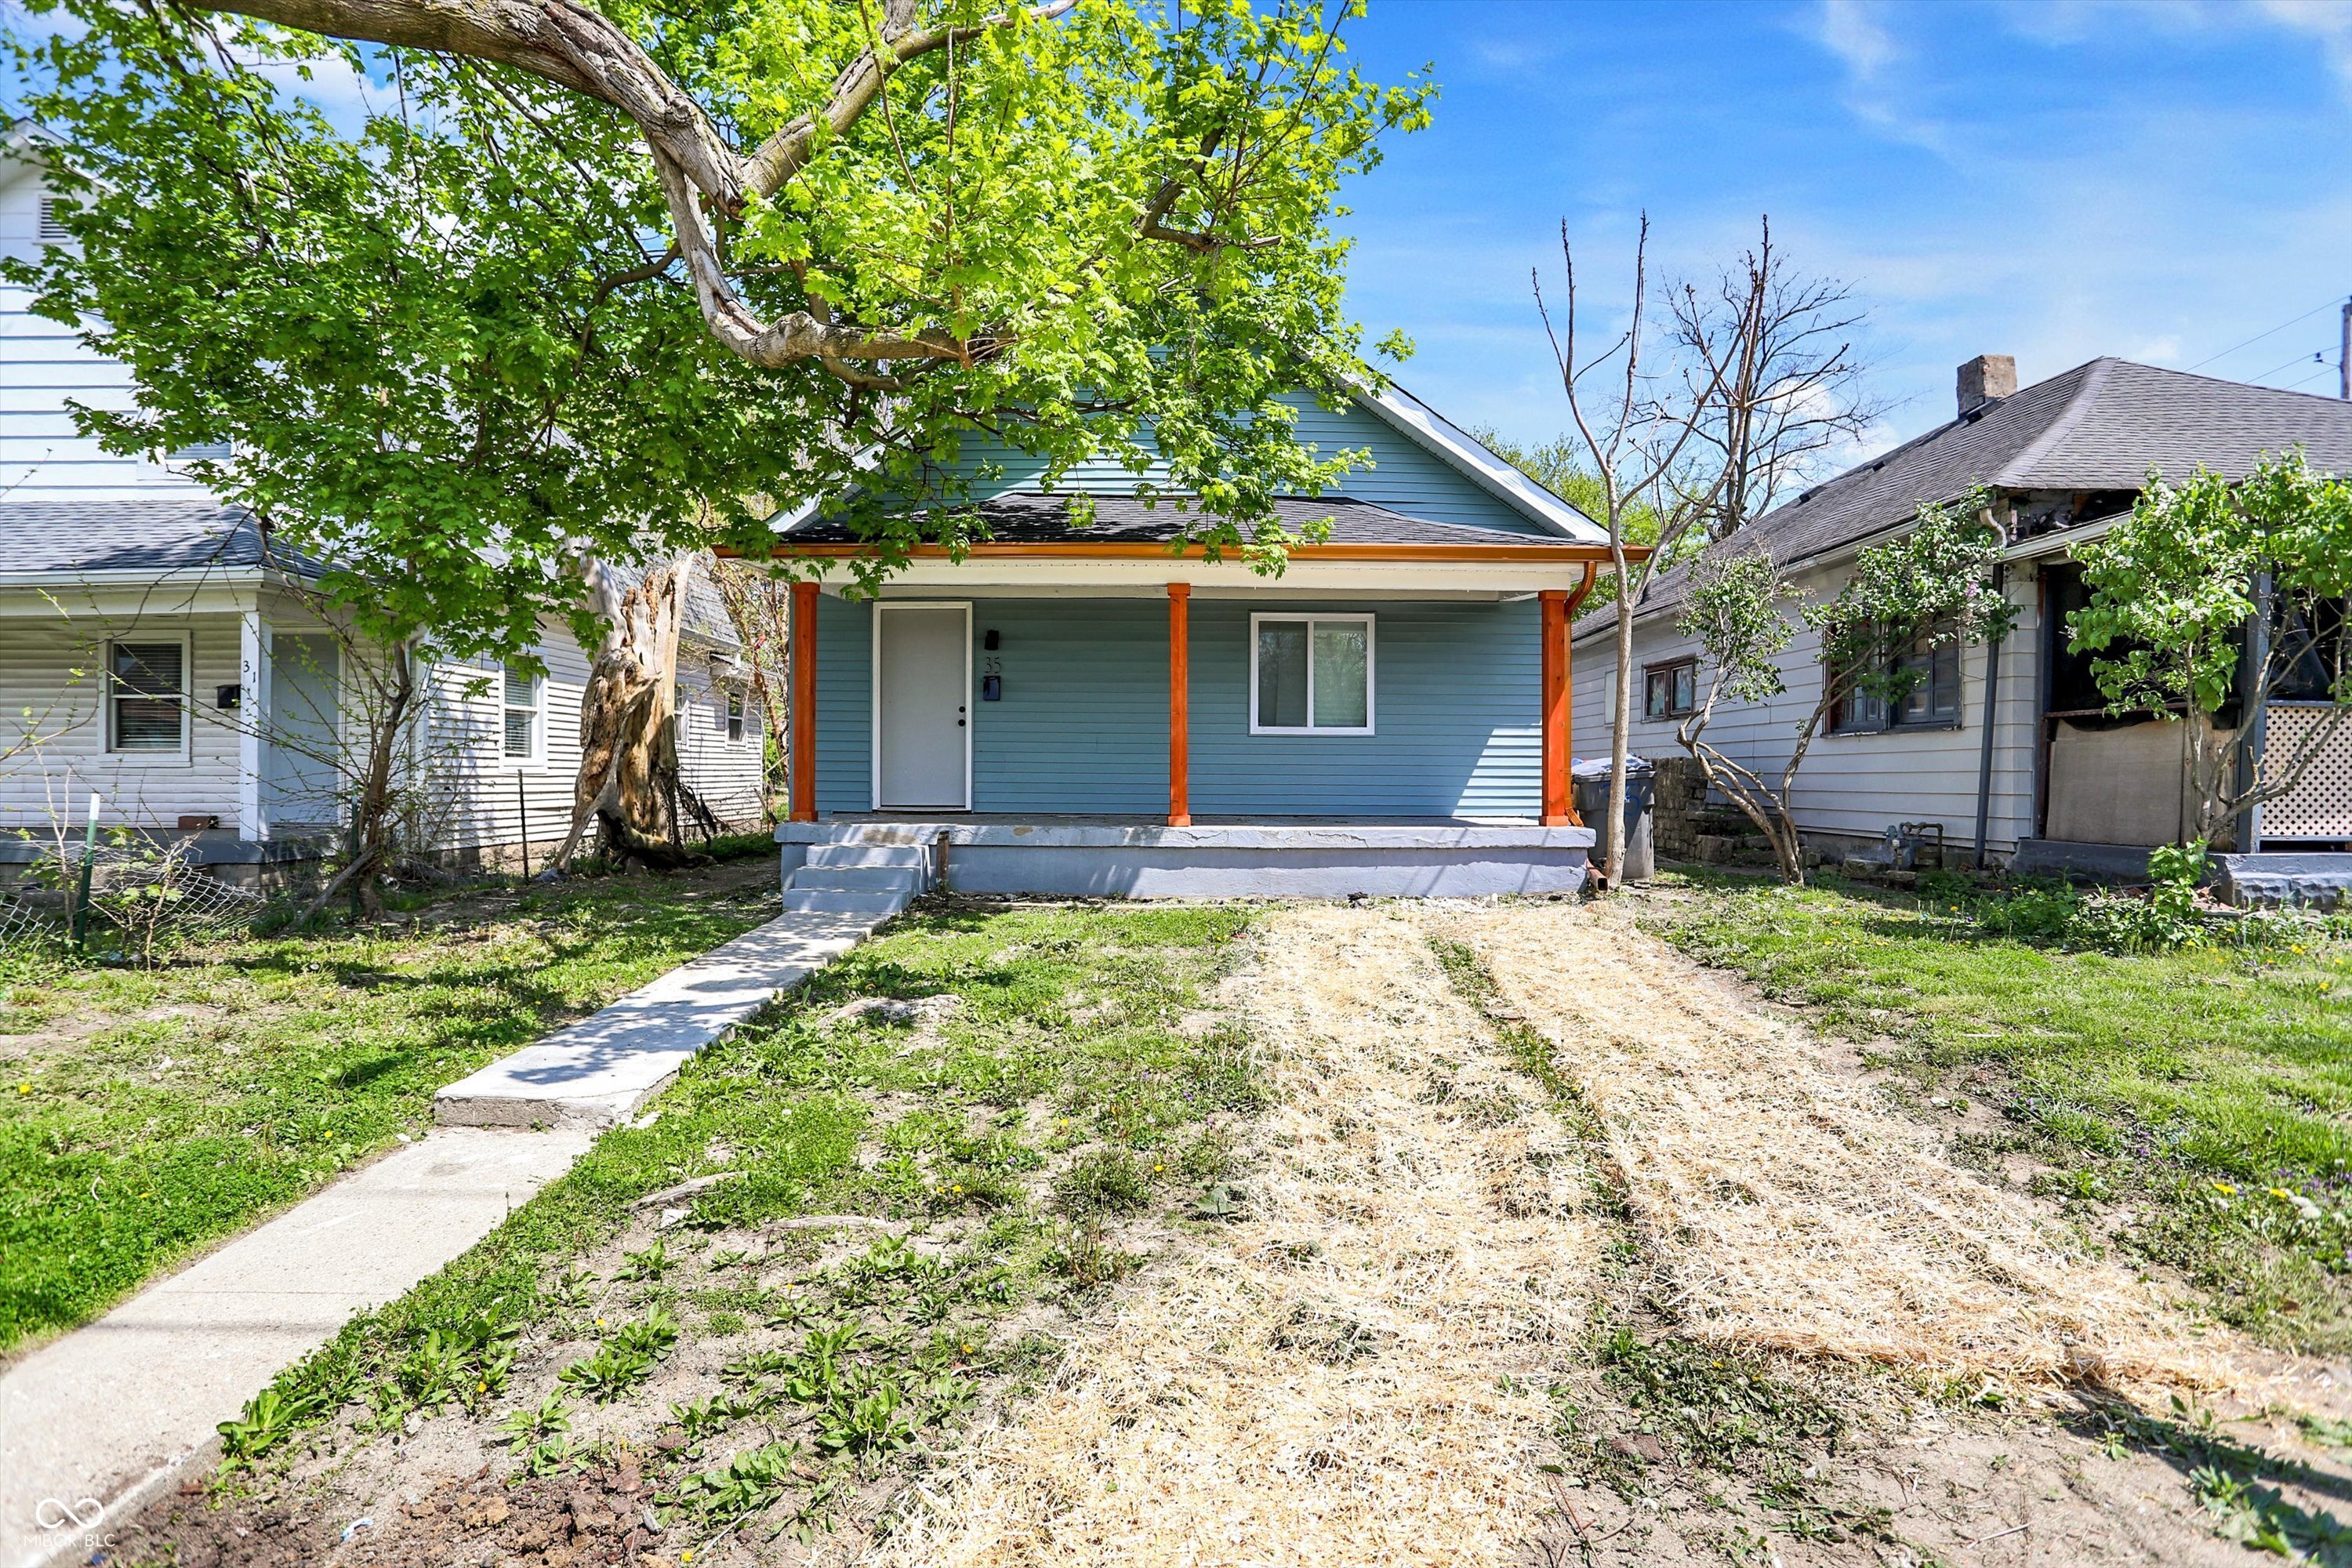
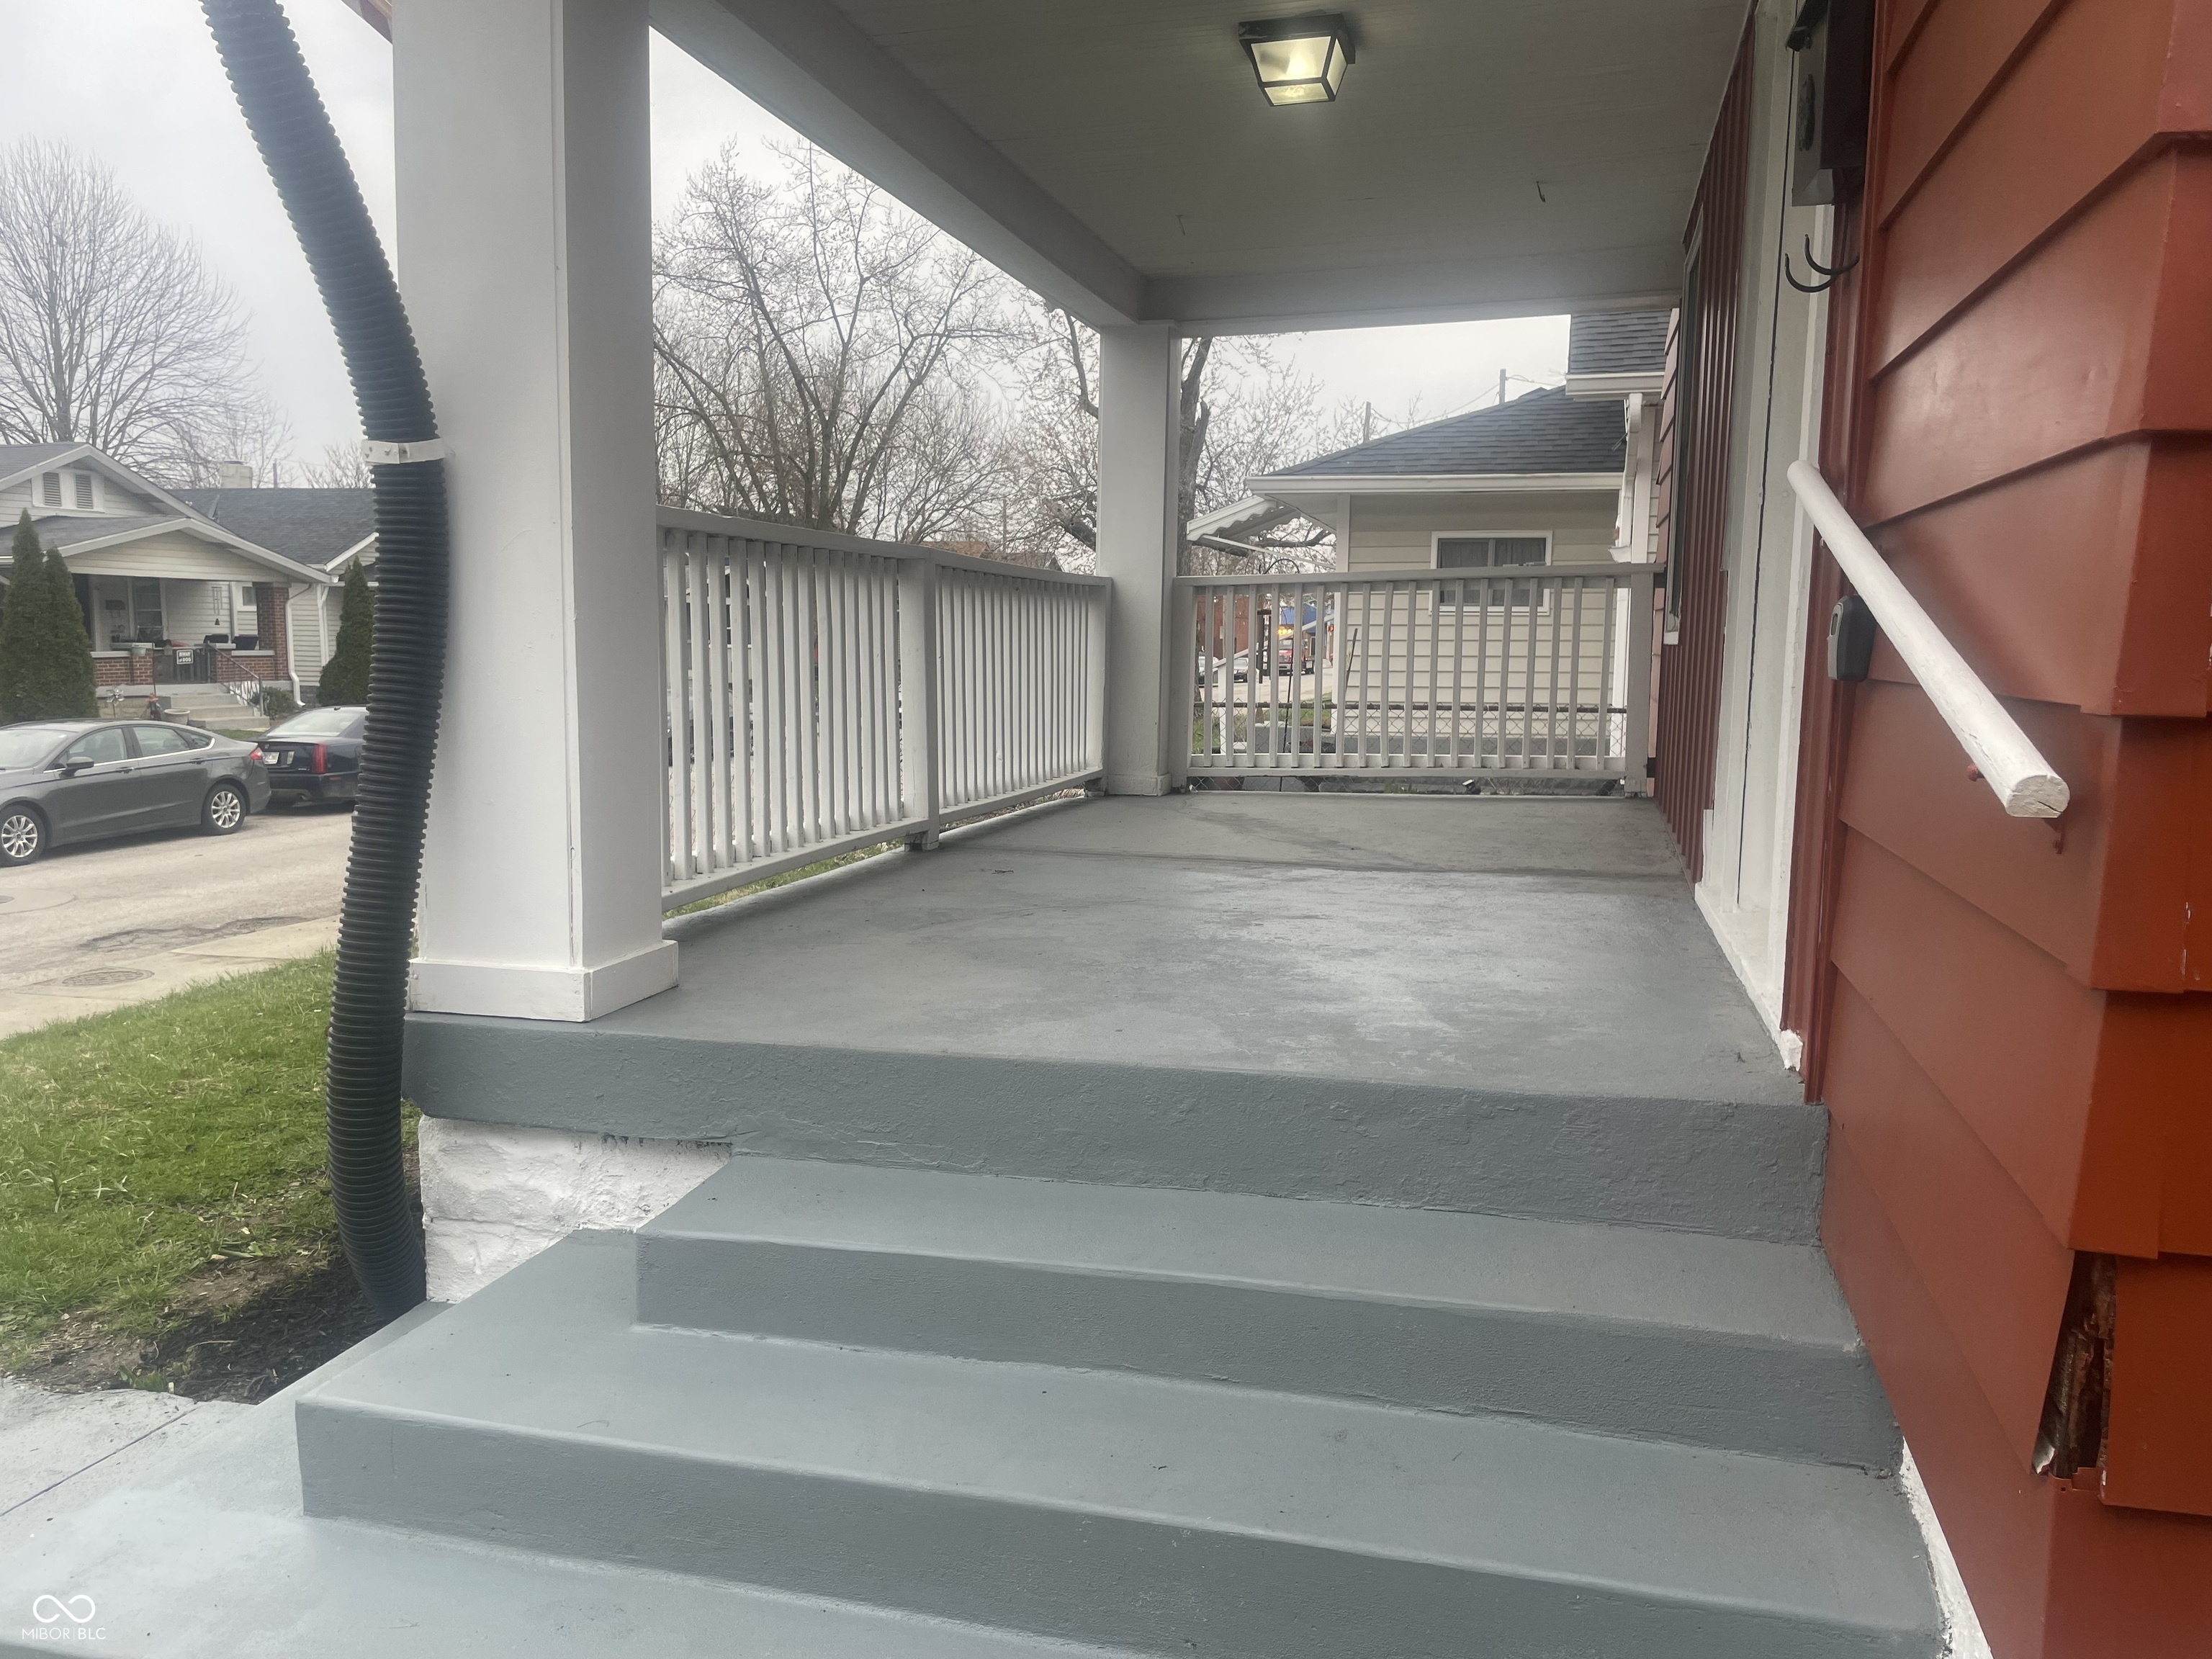
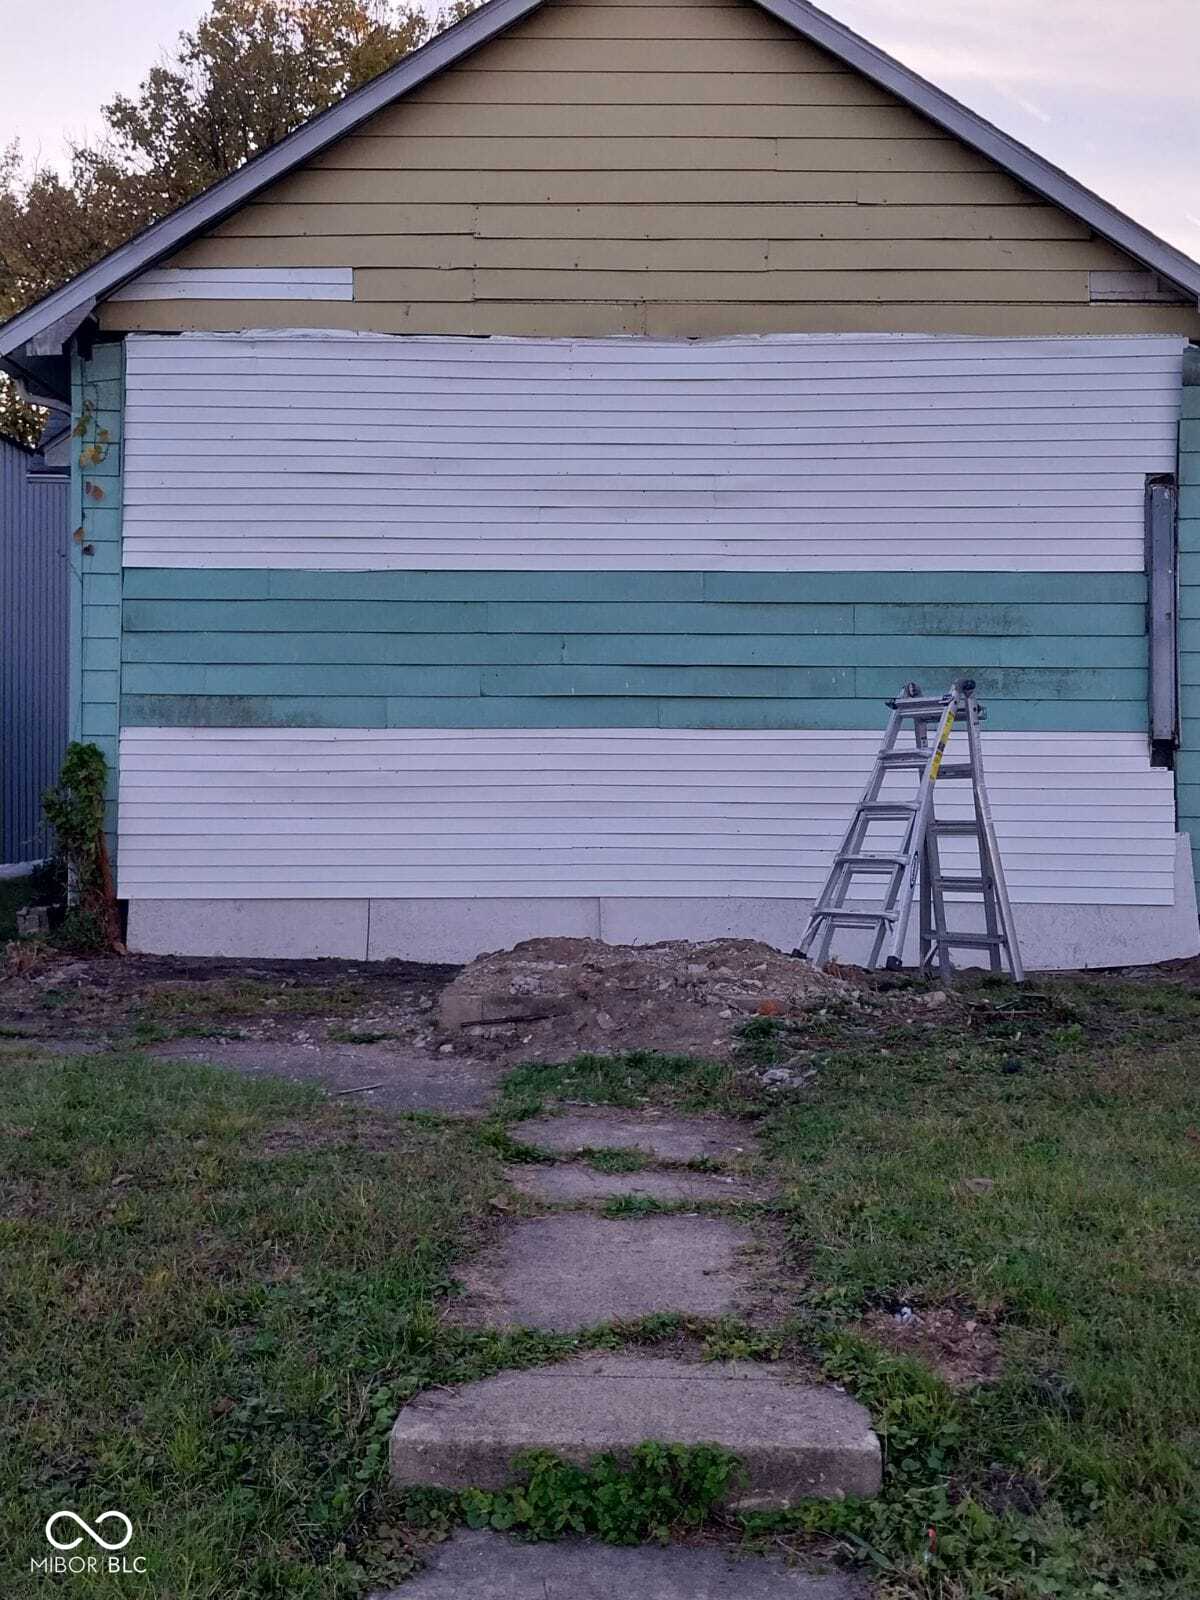
Active
$159,499
3
bds
|
1
ba
|
1,025
sqft
|
built
1900
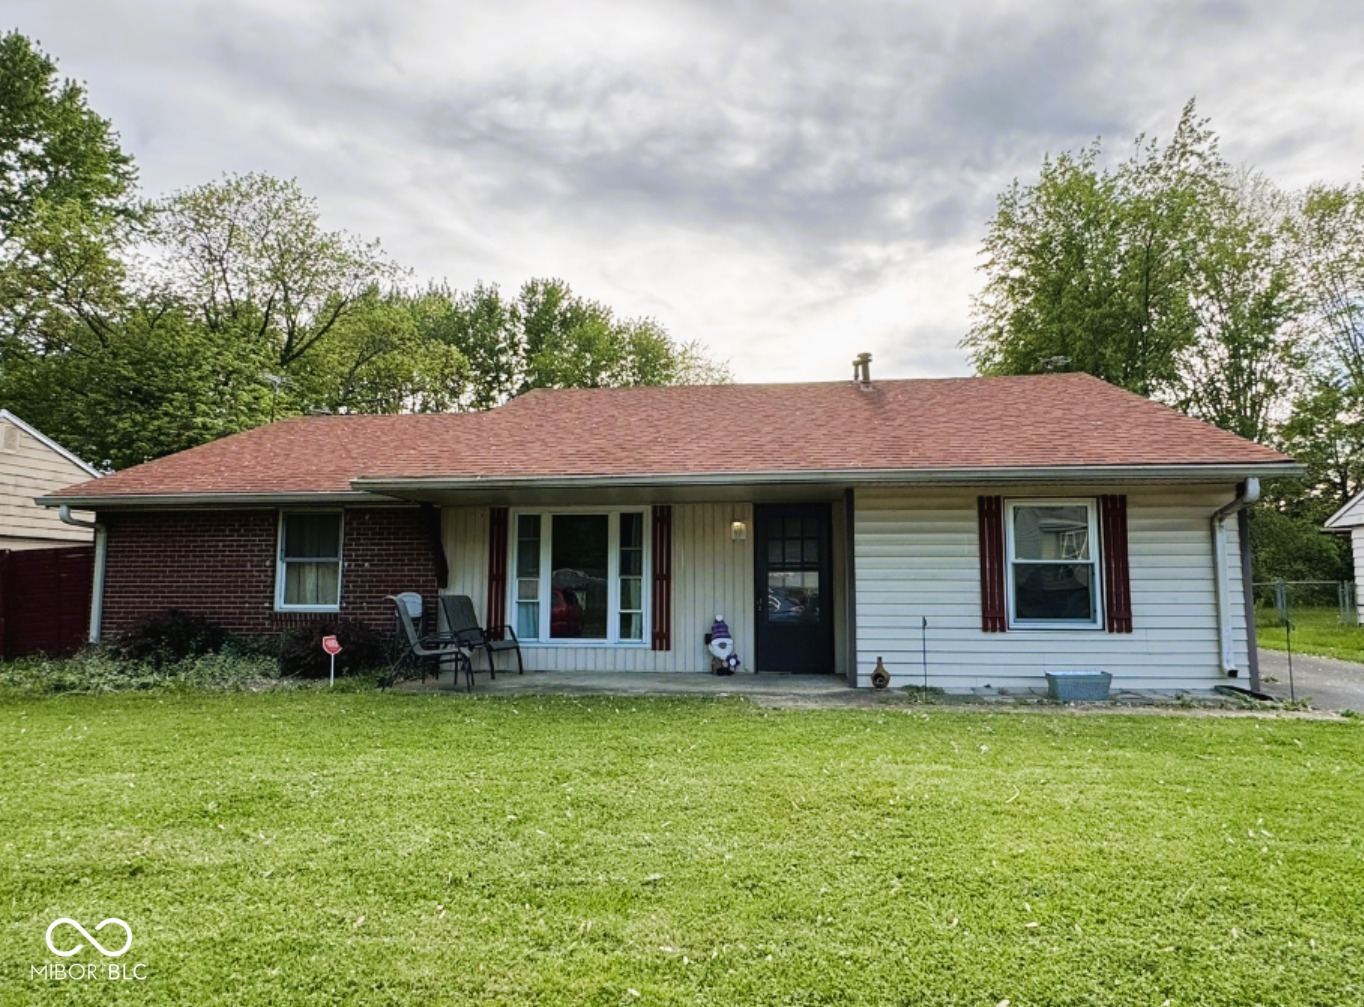
35 S Catherwood Ave, Indianapolis, IN 46219
$287
Cash flow
9.4%
Cash-on-Cash Return
8.3%
Cap rate
1.0%
Rent to Value Ratio

Active
$150,000
3
bds
|
1
ba
|
855
sqft
|
built
1920
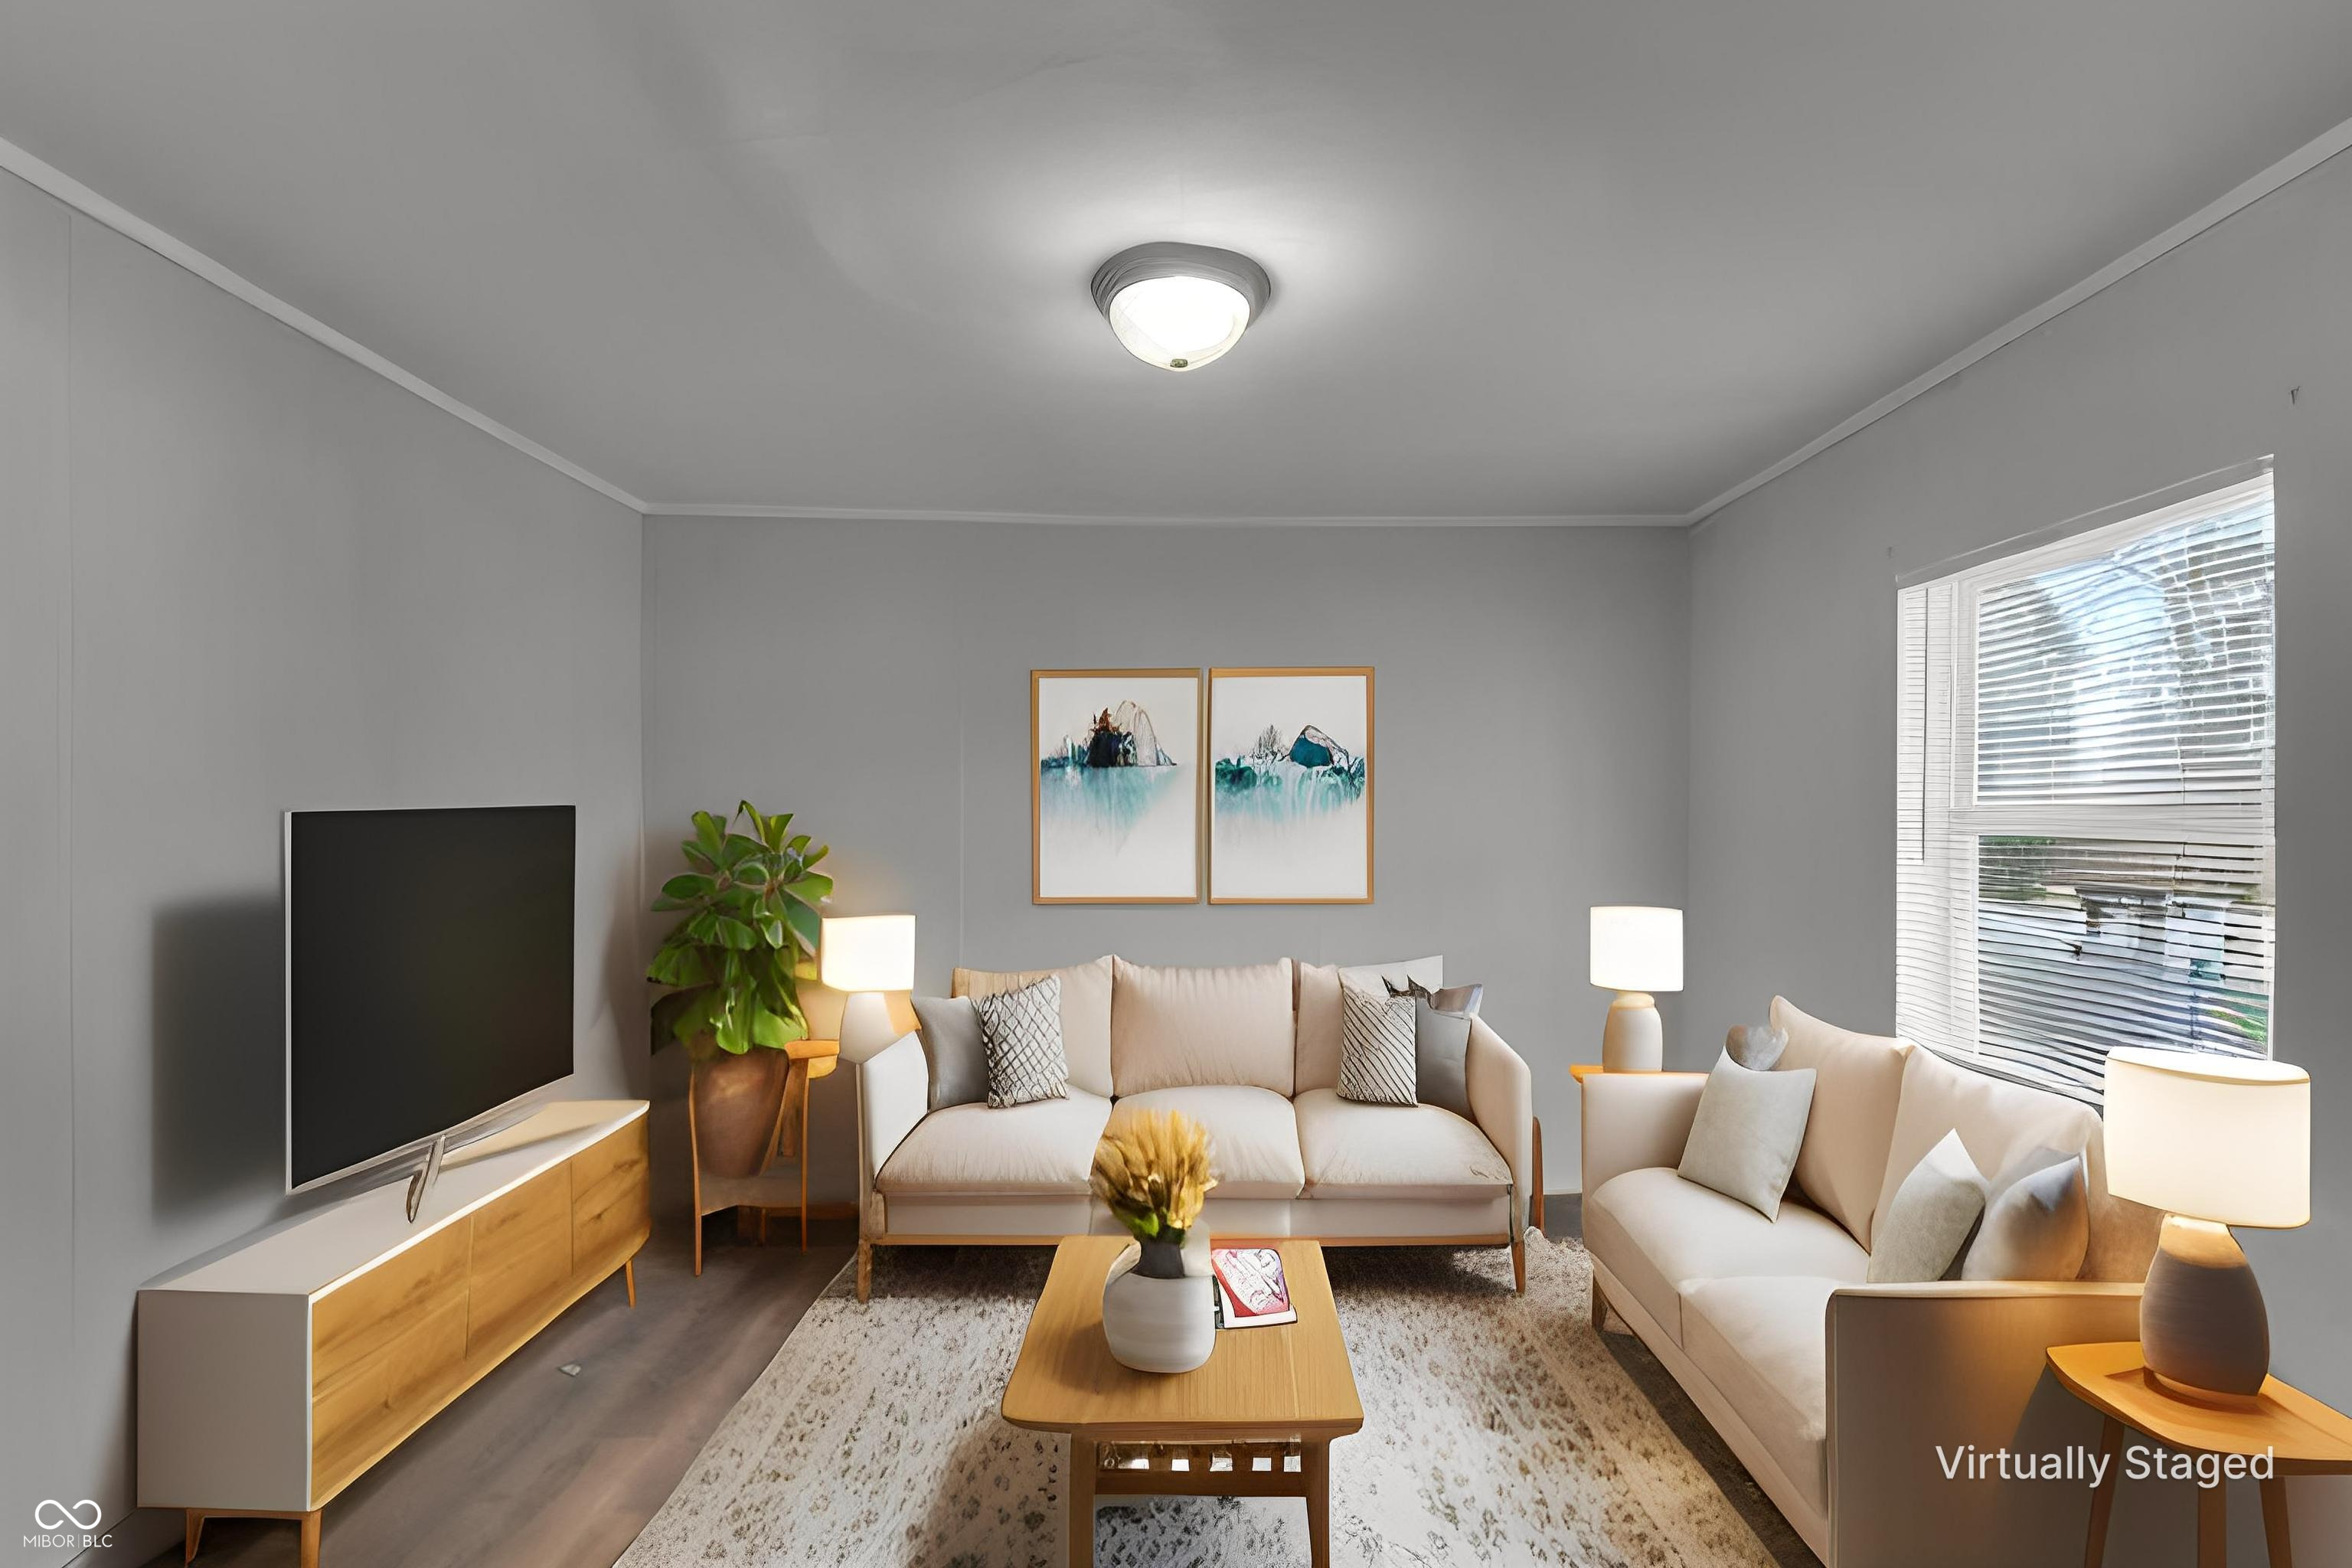
1845 W Wilkins St, Indianapolis, IN 46221
$198
Cash flow
6.9%
Cash-on-Cash Return
7.7%
Cap rate
0.9%
Rent to Value Ratio
Pending
$169,500
3
bds
|
2
ba
|
1,386
sqft
|
built
1921
937 N Bosart Ave, Indianapolis, IN 46201
$98
Cash flow
3.0%
Cash-on-Cash Return
6.8%
Cap rate
0.8%
Rent to Value Ratio
Active
$85,000
3
bds
|
1
ba
|
1,056
sqft
|
built
1926
2134 Dr Andrew J Brown Ave, Indianapolis, IN 46202
$324
Cash flow
19.9%
Cash-on-Cash Return
10.7%
Cap rate
1.3%
Rent to Value Ratio
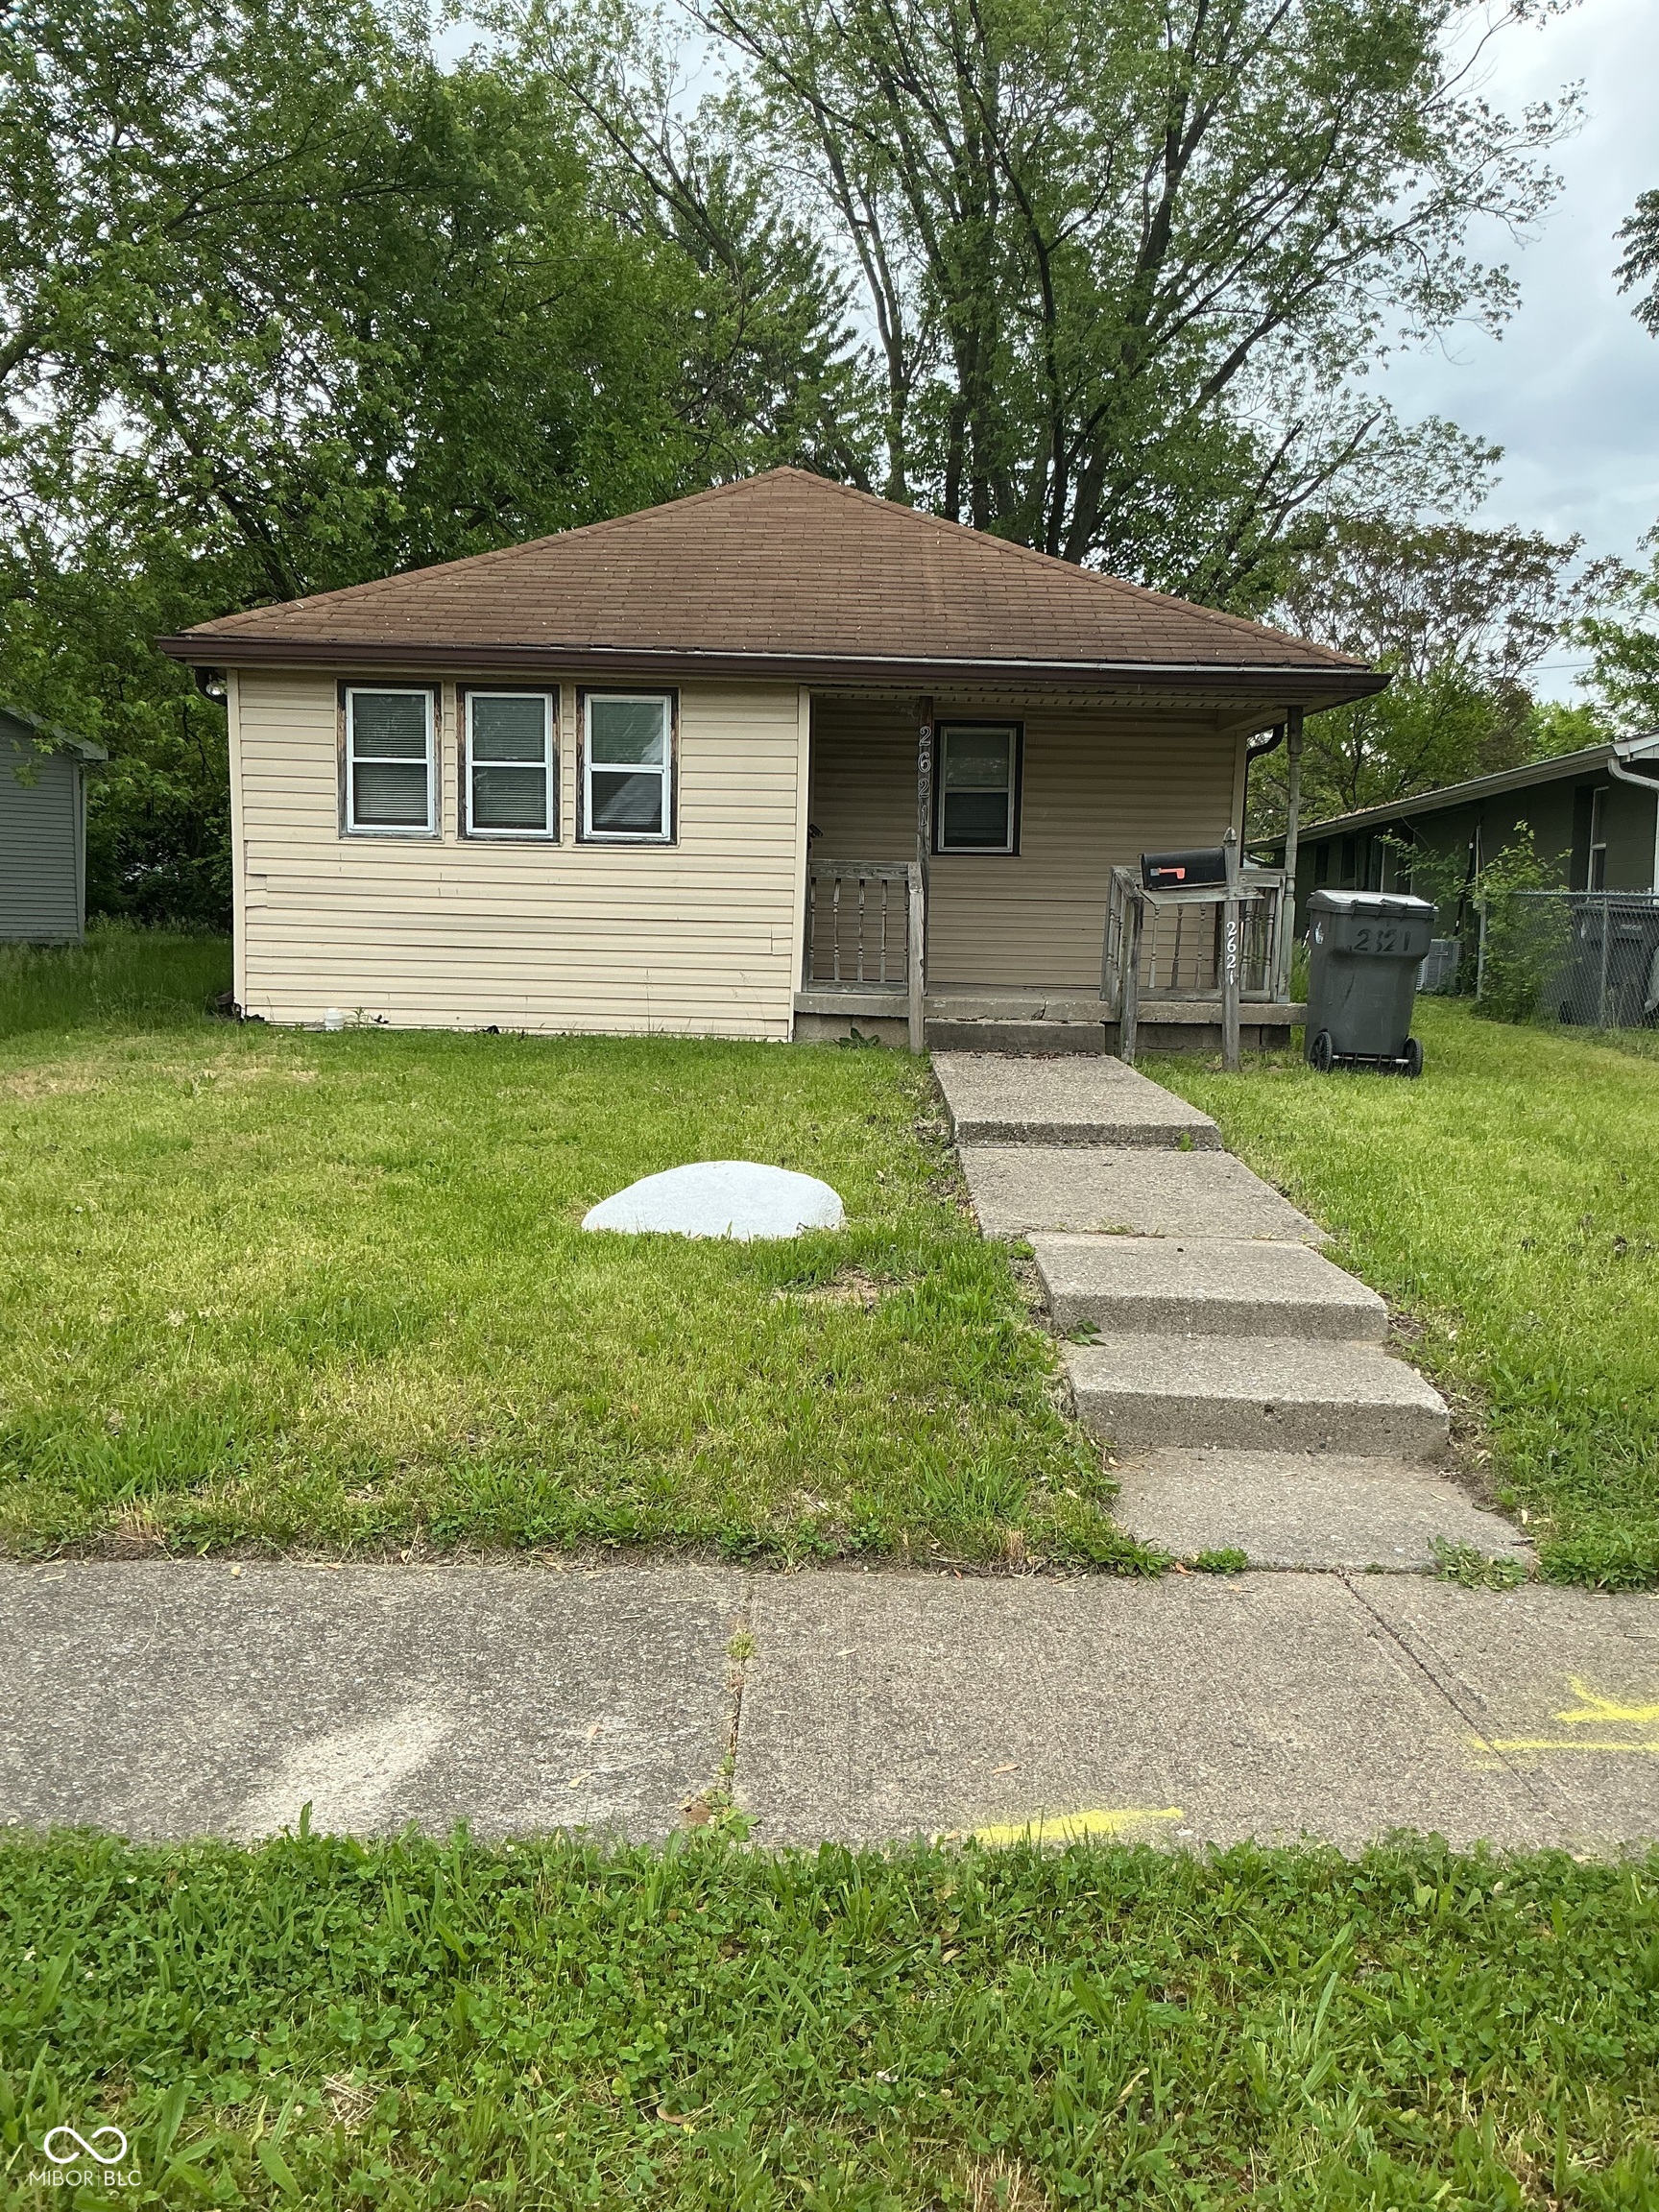
Active
$115,000
2
bds
|
1
ba
|
780
sqft
|
built
1930
2621 N Tacoma Ave, Indianapolis, IN 46218
$101
Cash flow
4.6%
Cash-on-Cash Return
7.2%
Cap rate
0.9%
Rent to Value Ratio
Active
$225,000
4
bds
|
2
ba
|
1,888
sqft
|
built
1920
518 Central Ct S, Indianapolis, IN 46205
$227
Cash flow
5.3%
Cash-on-Cash Return
7.4%
Cap rate
0.9%
Rent to Value Ratio
Active
$149,900
3
bds
|
2
ba
|
910
sqft
|
built
1910
1210 S State Ave, Indianapolis, IN 46203
$750
Cash flow
26.1%
Cash-on-Cash Return
12.2%
Cap rate
1.5%
Rent to Value Ratio
Active
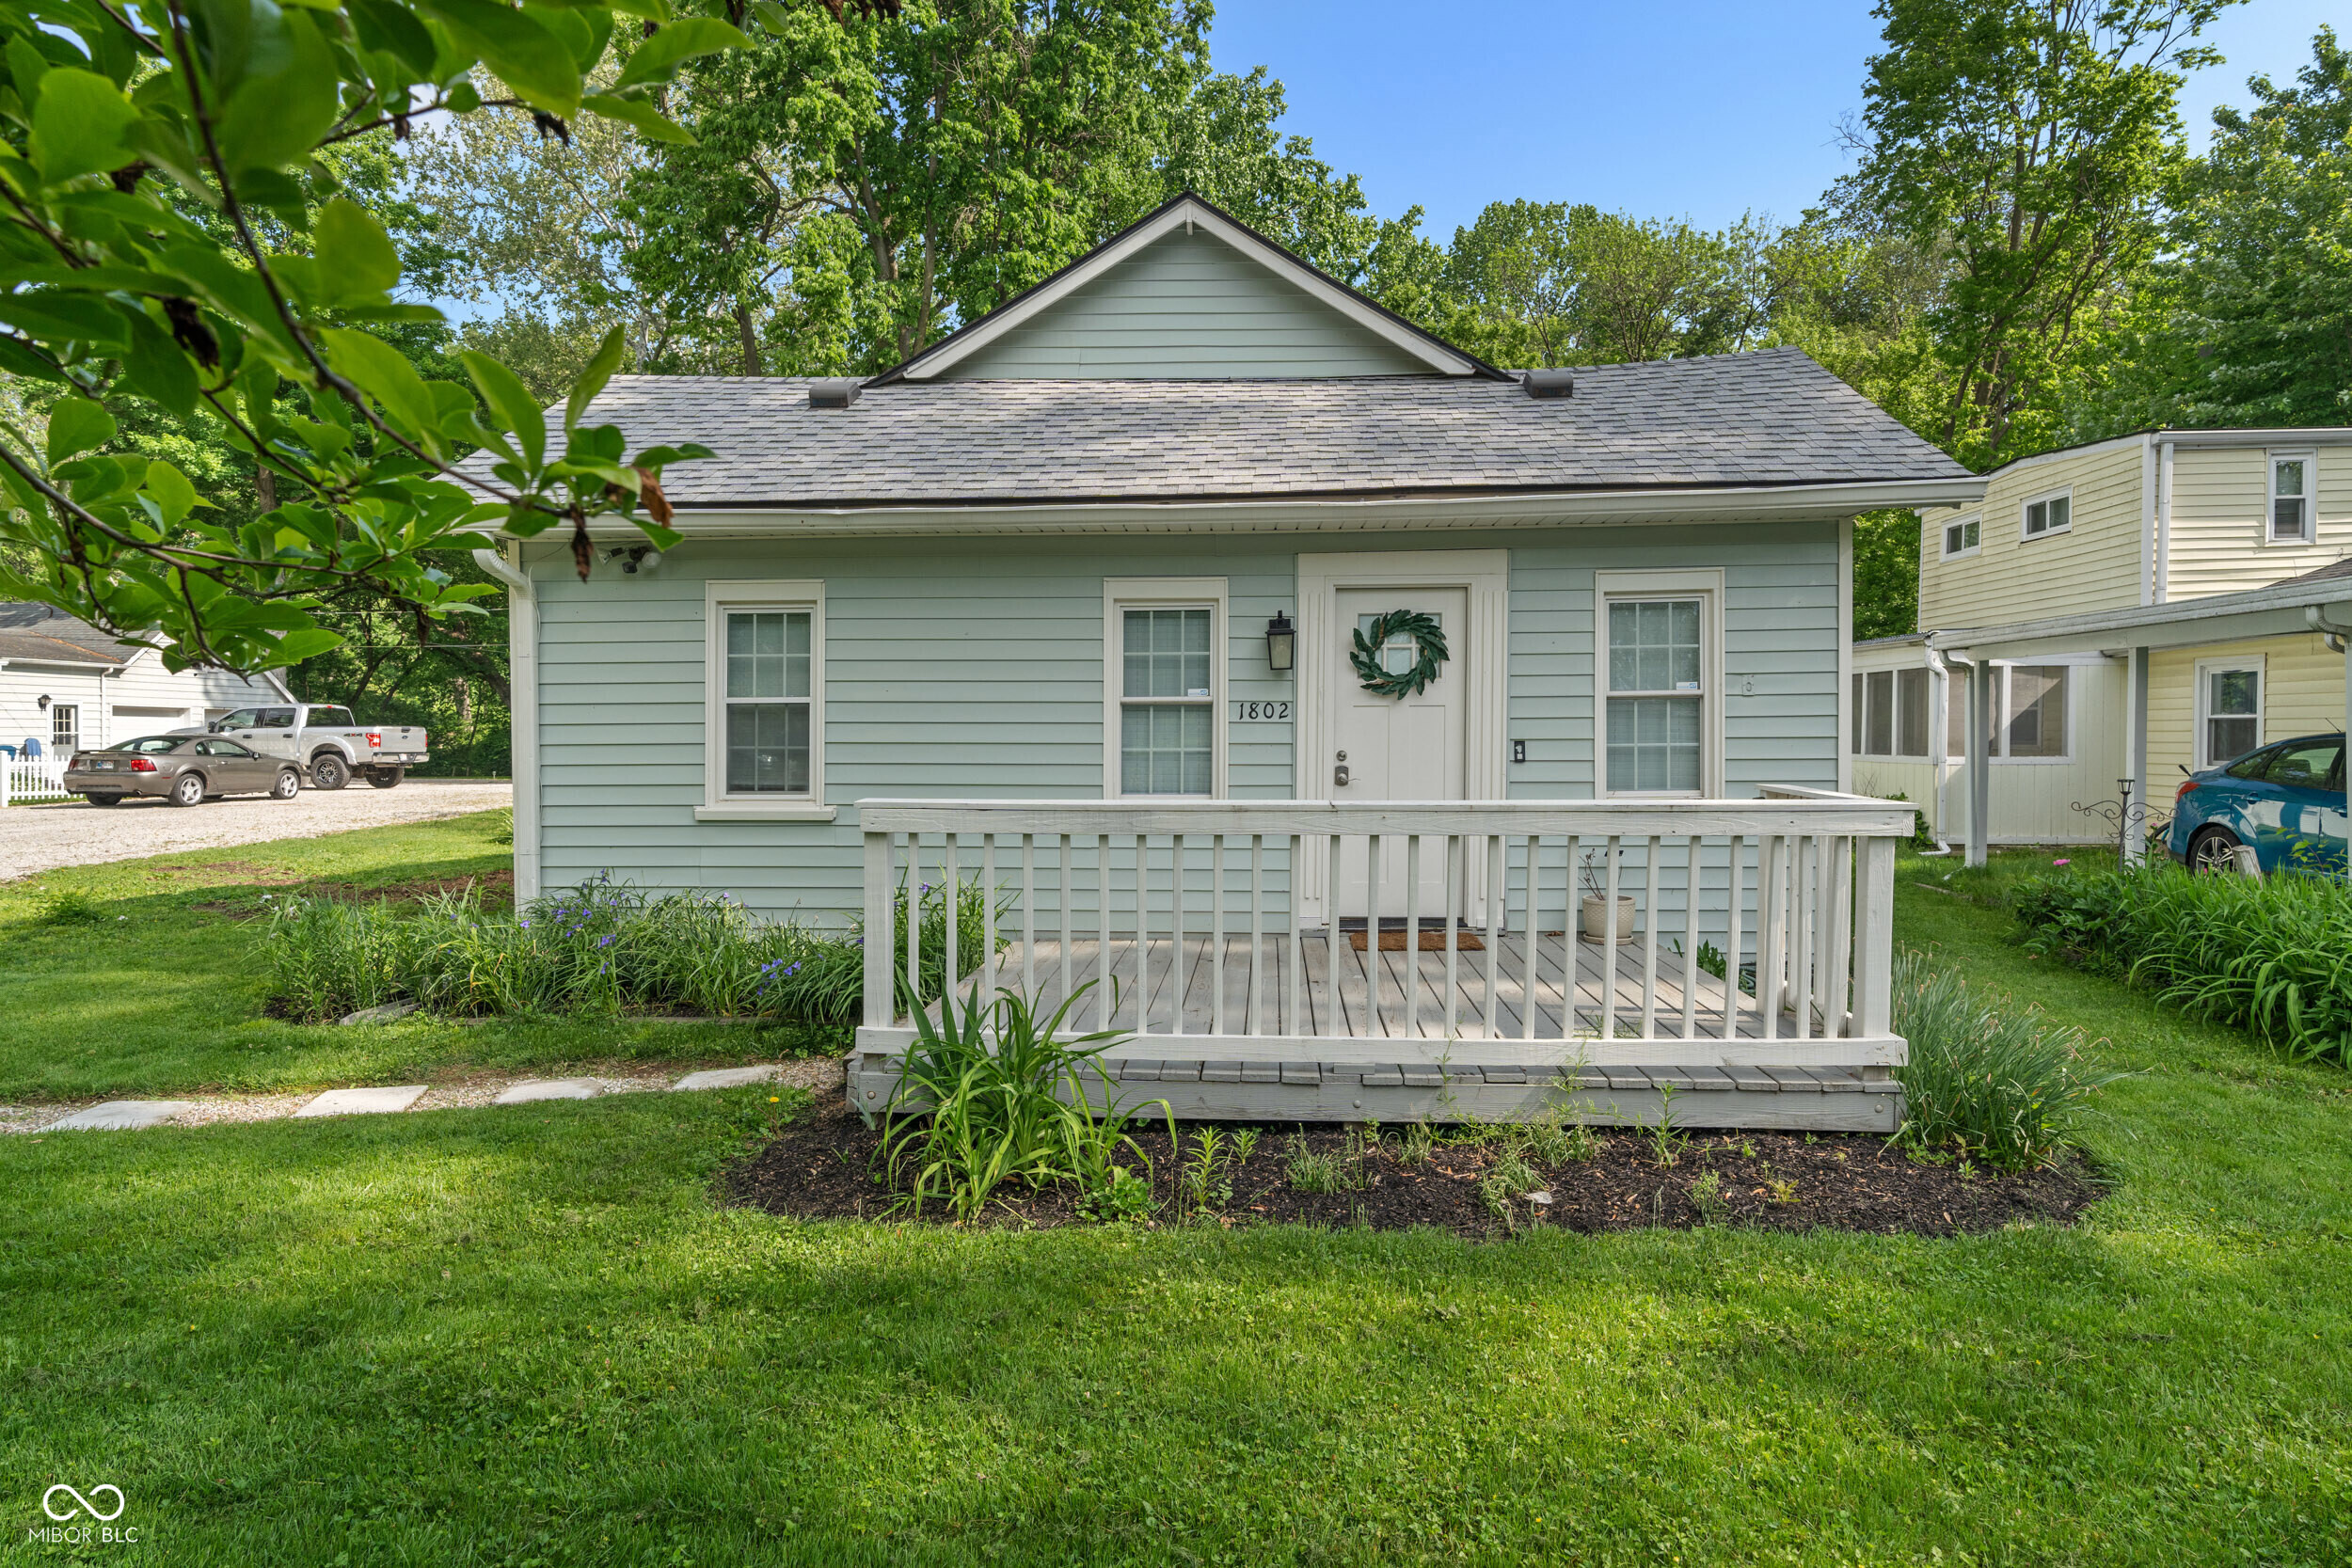
$240,000
2
bds
|
1
ba
|
1,074
sqft
|
built
1936
1802 E 66th St, Indianapolis, IN 46220
$289
Cash flow
6.3%
Cash-on-Cash Return
7.6%
Cap rate
0.9%
Rent to Value Ratio
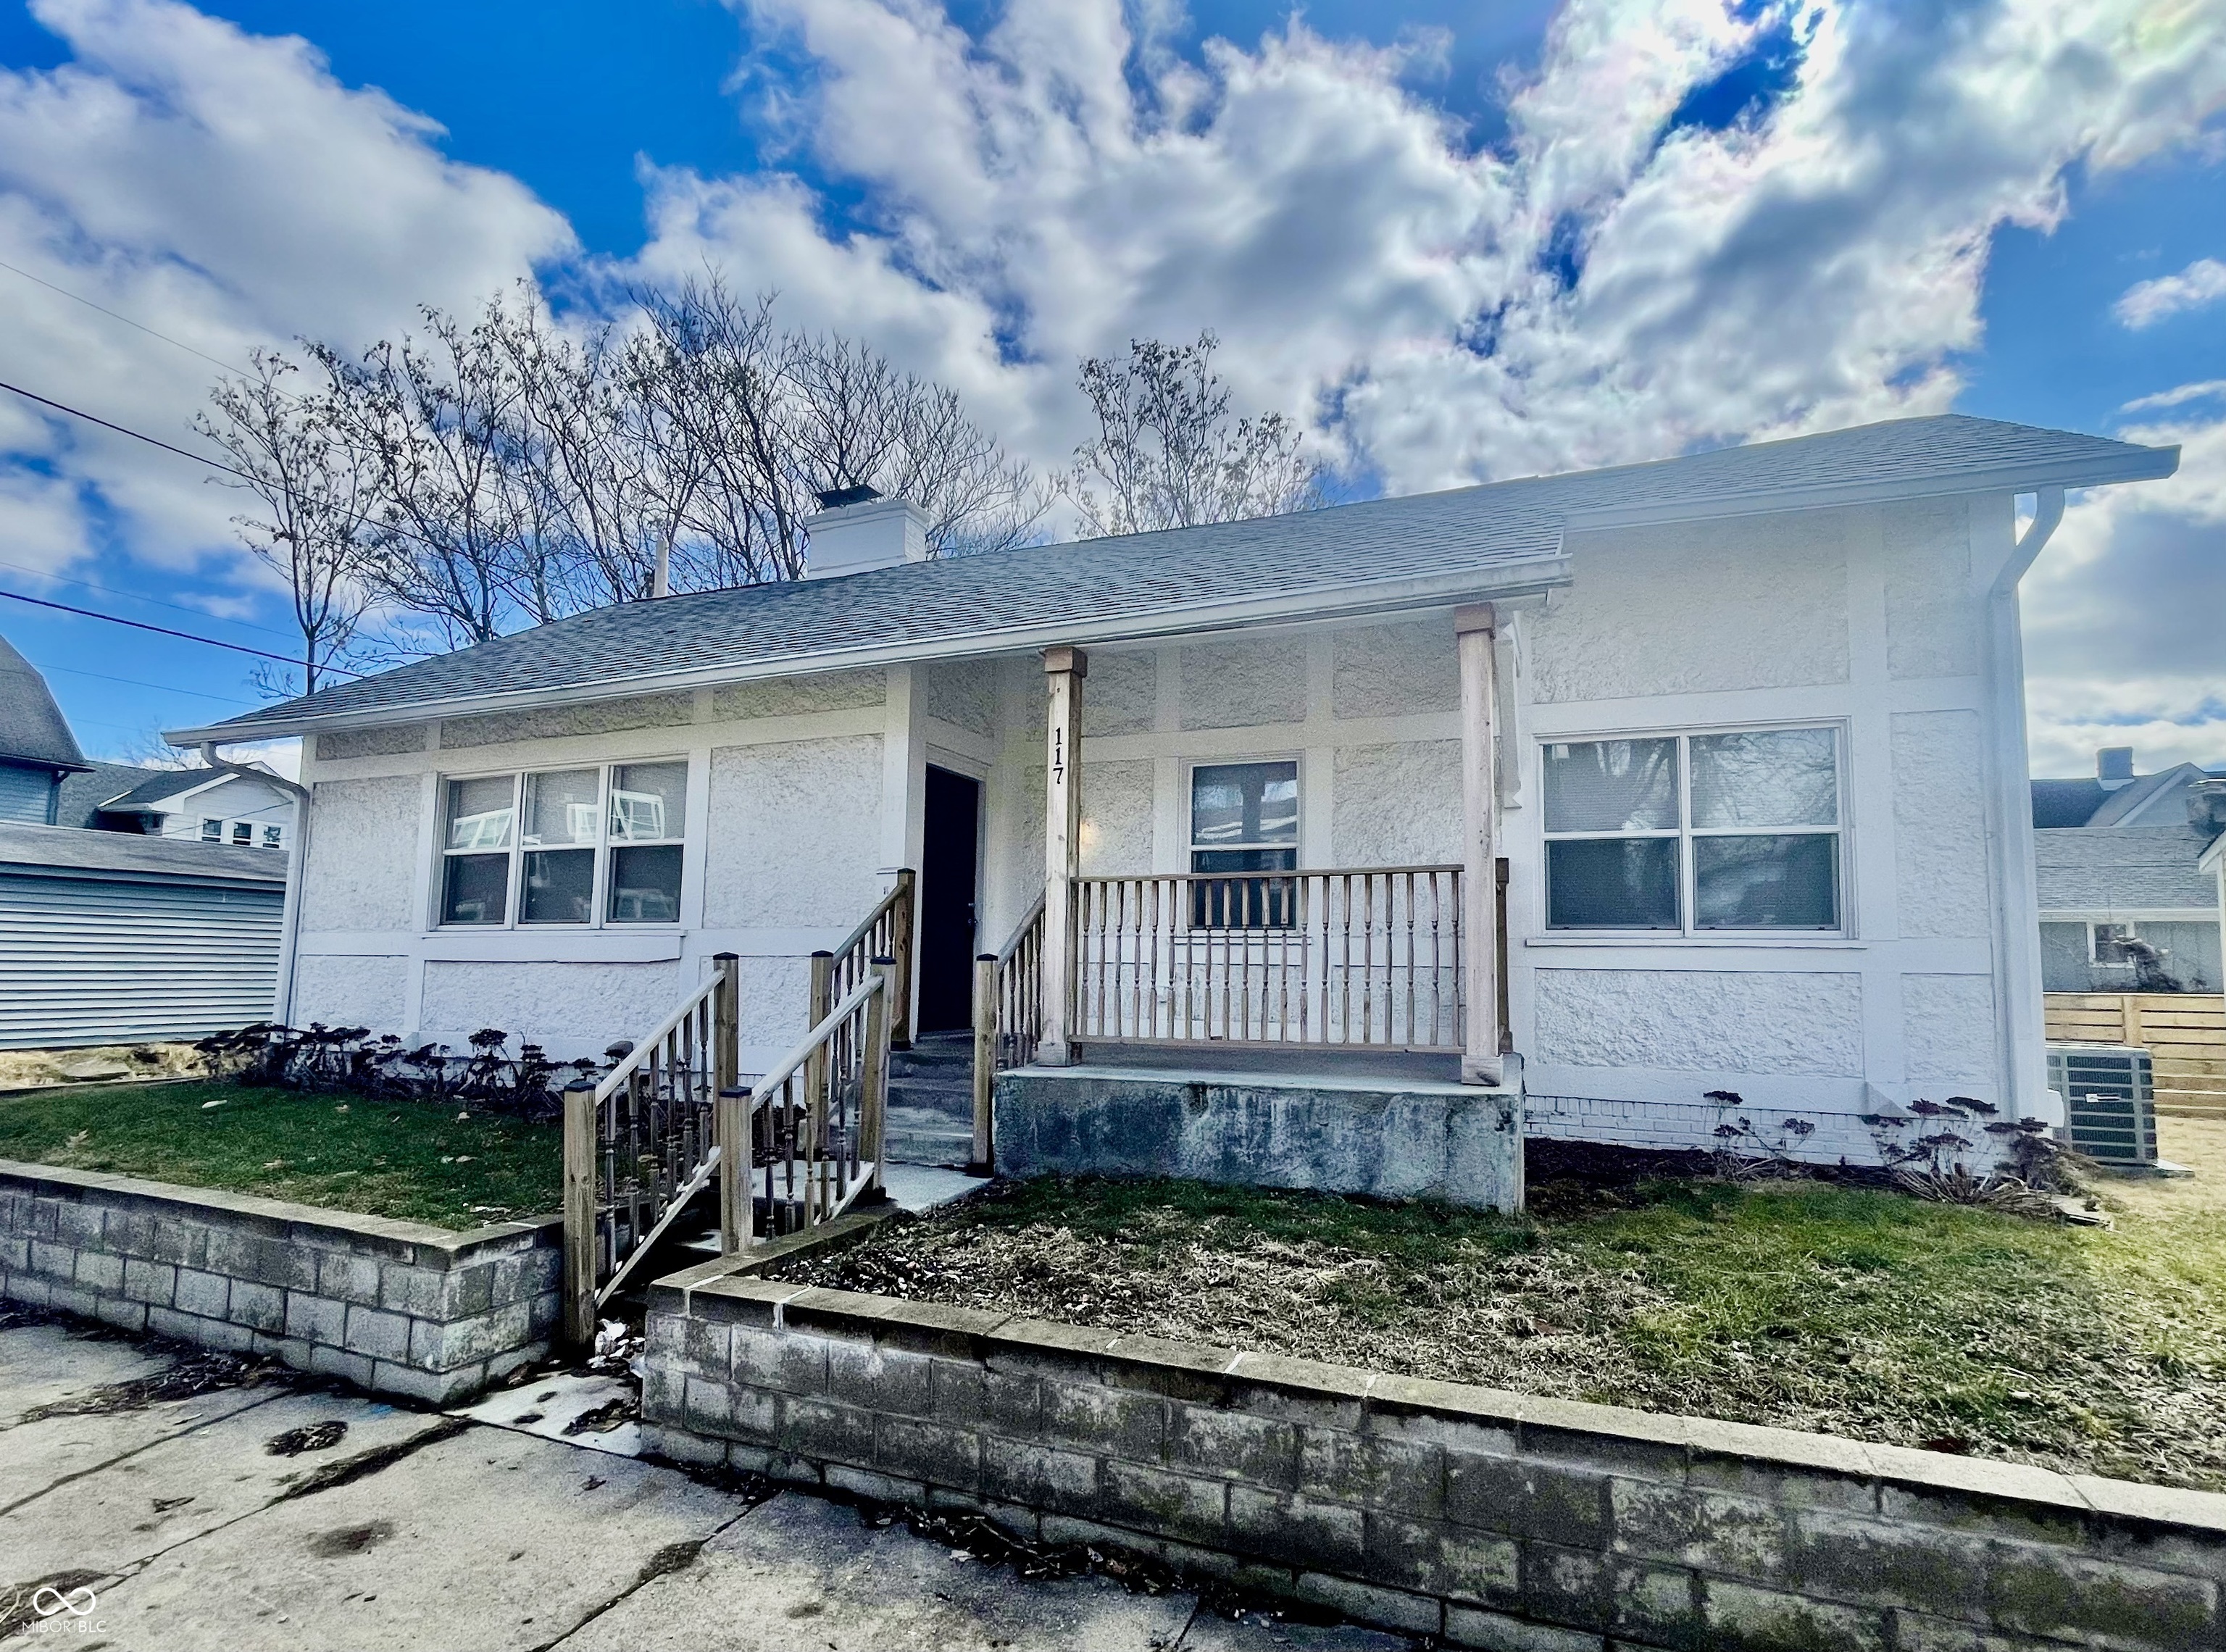
Active
$158,900
2
bds
|
1
ba
|
1,005
sqft
|
built
1930
117 W 36th St, Indianapolis, IN 46208
$152
Cash flow
5.0%
Cash-on-Cash Return
7.3%
Cap rate
0.9%
Rent to Value Ratio
Active
$299,900
6
bds
|
2
ba
|
2,580
sqft
|
built
1959
8553 Broadway St, Indianapolis, IN 46240
$258
Cash flow
4.5%
Cash-on-Cash Return
7.2%
Cap rate
0.9%
Rent to Value Ratio
Active
$99,900
3
bds
|
2
ba
|
972
sqft
|
built
1945
3731 N Tacoma Ave, Indianapolis, IN 46218
$178
Cash flow
9.3%
Cash-on-Cash Return
8.3%
Cap rate
1.0%
Rent to Value Ratio
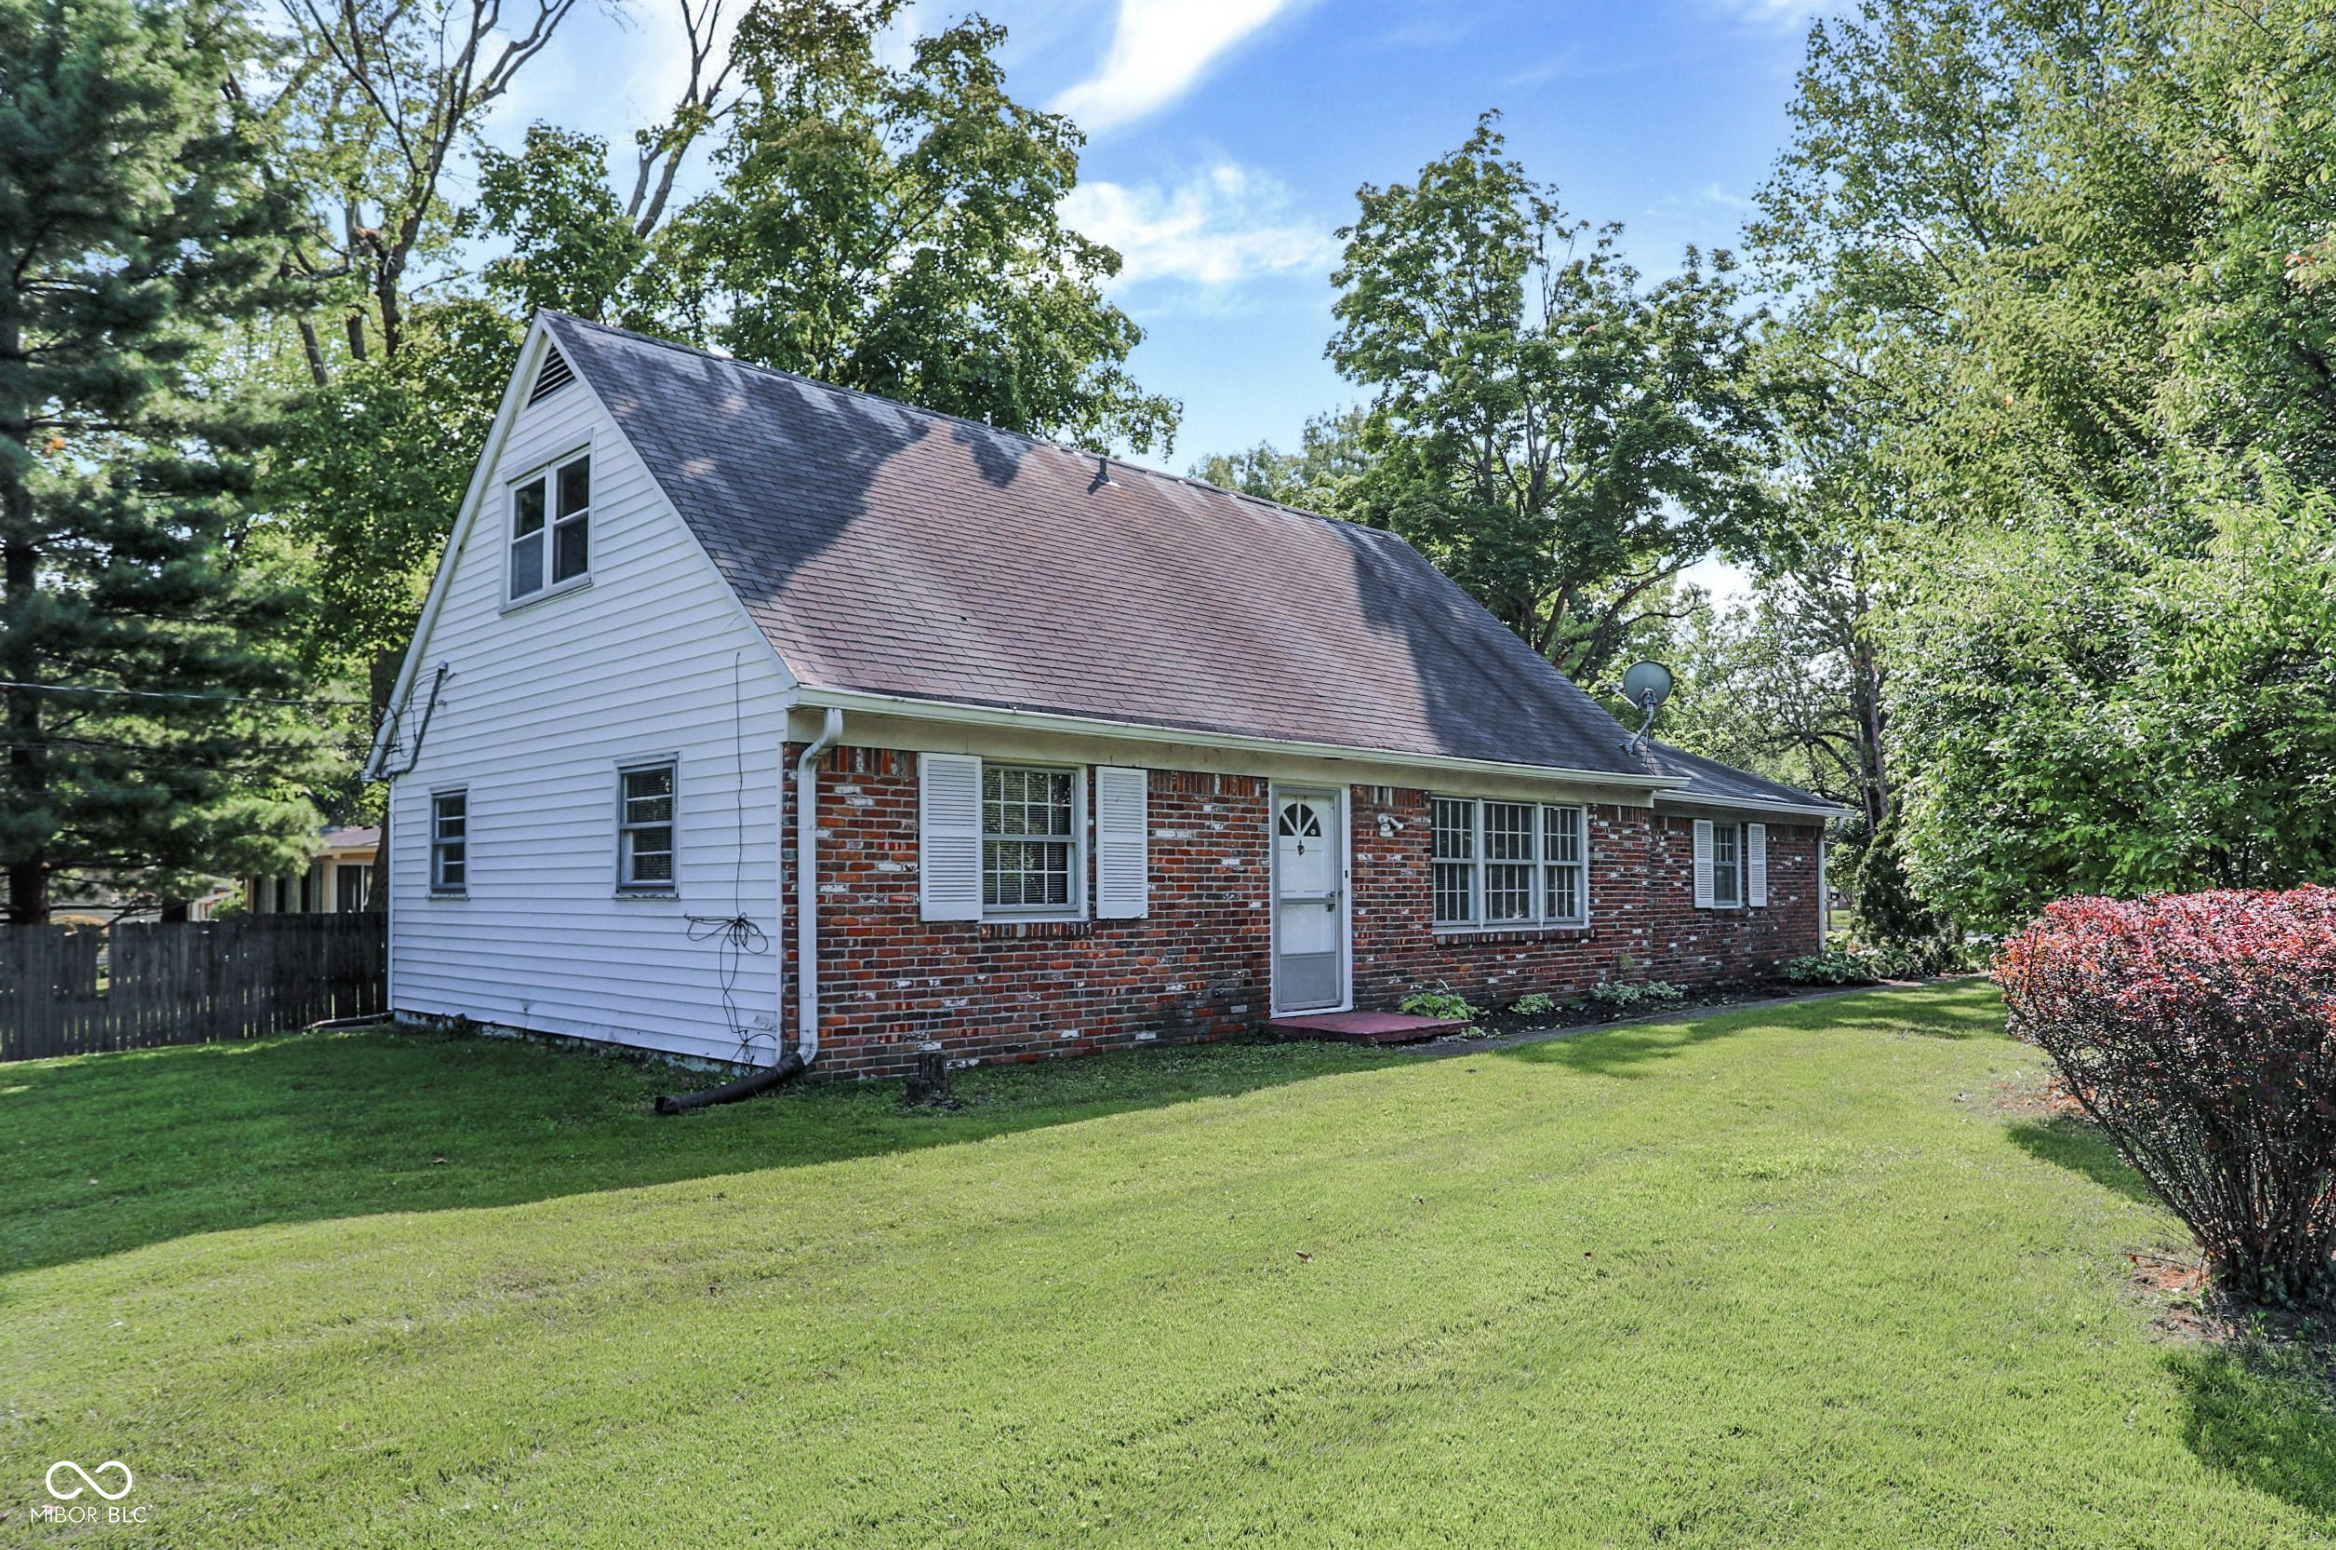
Active
$215,000
3
bds
|
1
ba
|
1,336
sqft
|
built
1972
128 Coronado Rd, Indianapolis, IN 46234
$141
Cash flow
3.4%
Cash-on-Cash Return
6.9%
Cap rate
0.8%
Rent to Value Ratio
Active
$170,000
3
bds
|
1
ba
|
1,934
sqft
|
built
1955
1121 Eugene St, Indianapolis, IN 46208
$95
Cash flow
2.9%
Cash-on-Cash Return
6.8%
Cap rate
0.8%
Rent to Value Ratio
Active
$115,000
3
bds
|
1
ba
|
953
sqft
|
built
1940
4618 W Beecher St, Indianapolis, IN 46241
$239
Cash flow
10.8%
Cash-on-Cash Return
8.6%
Cap rate
1.0%
Rent to Value Ratio
Active
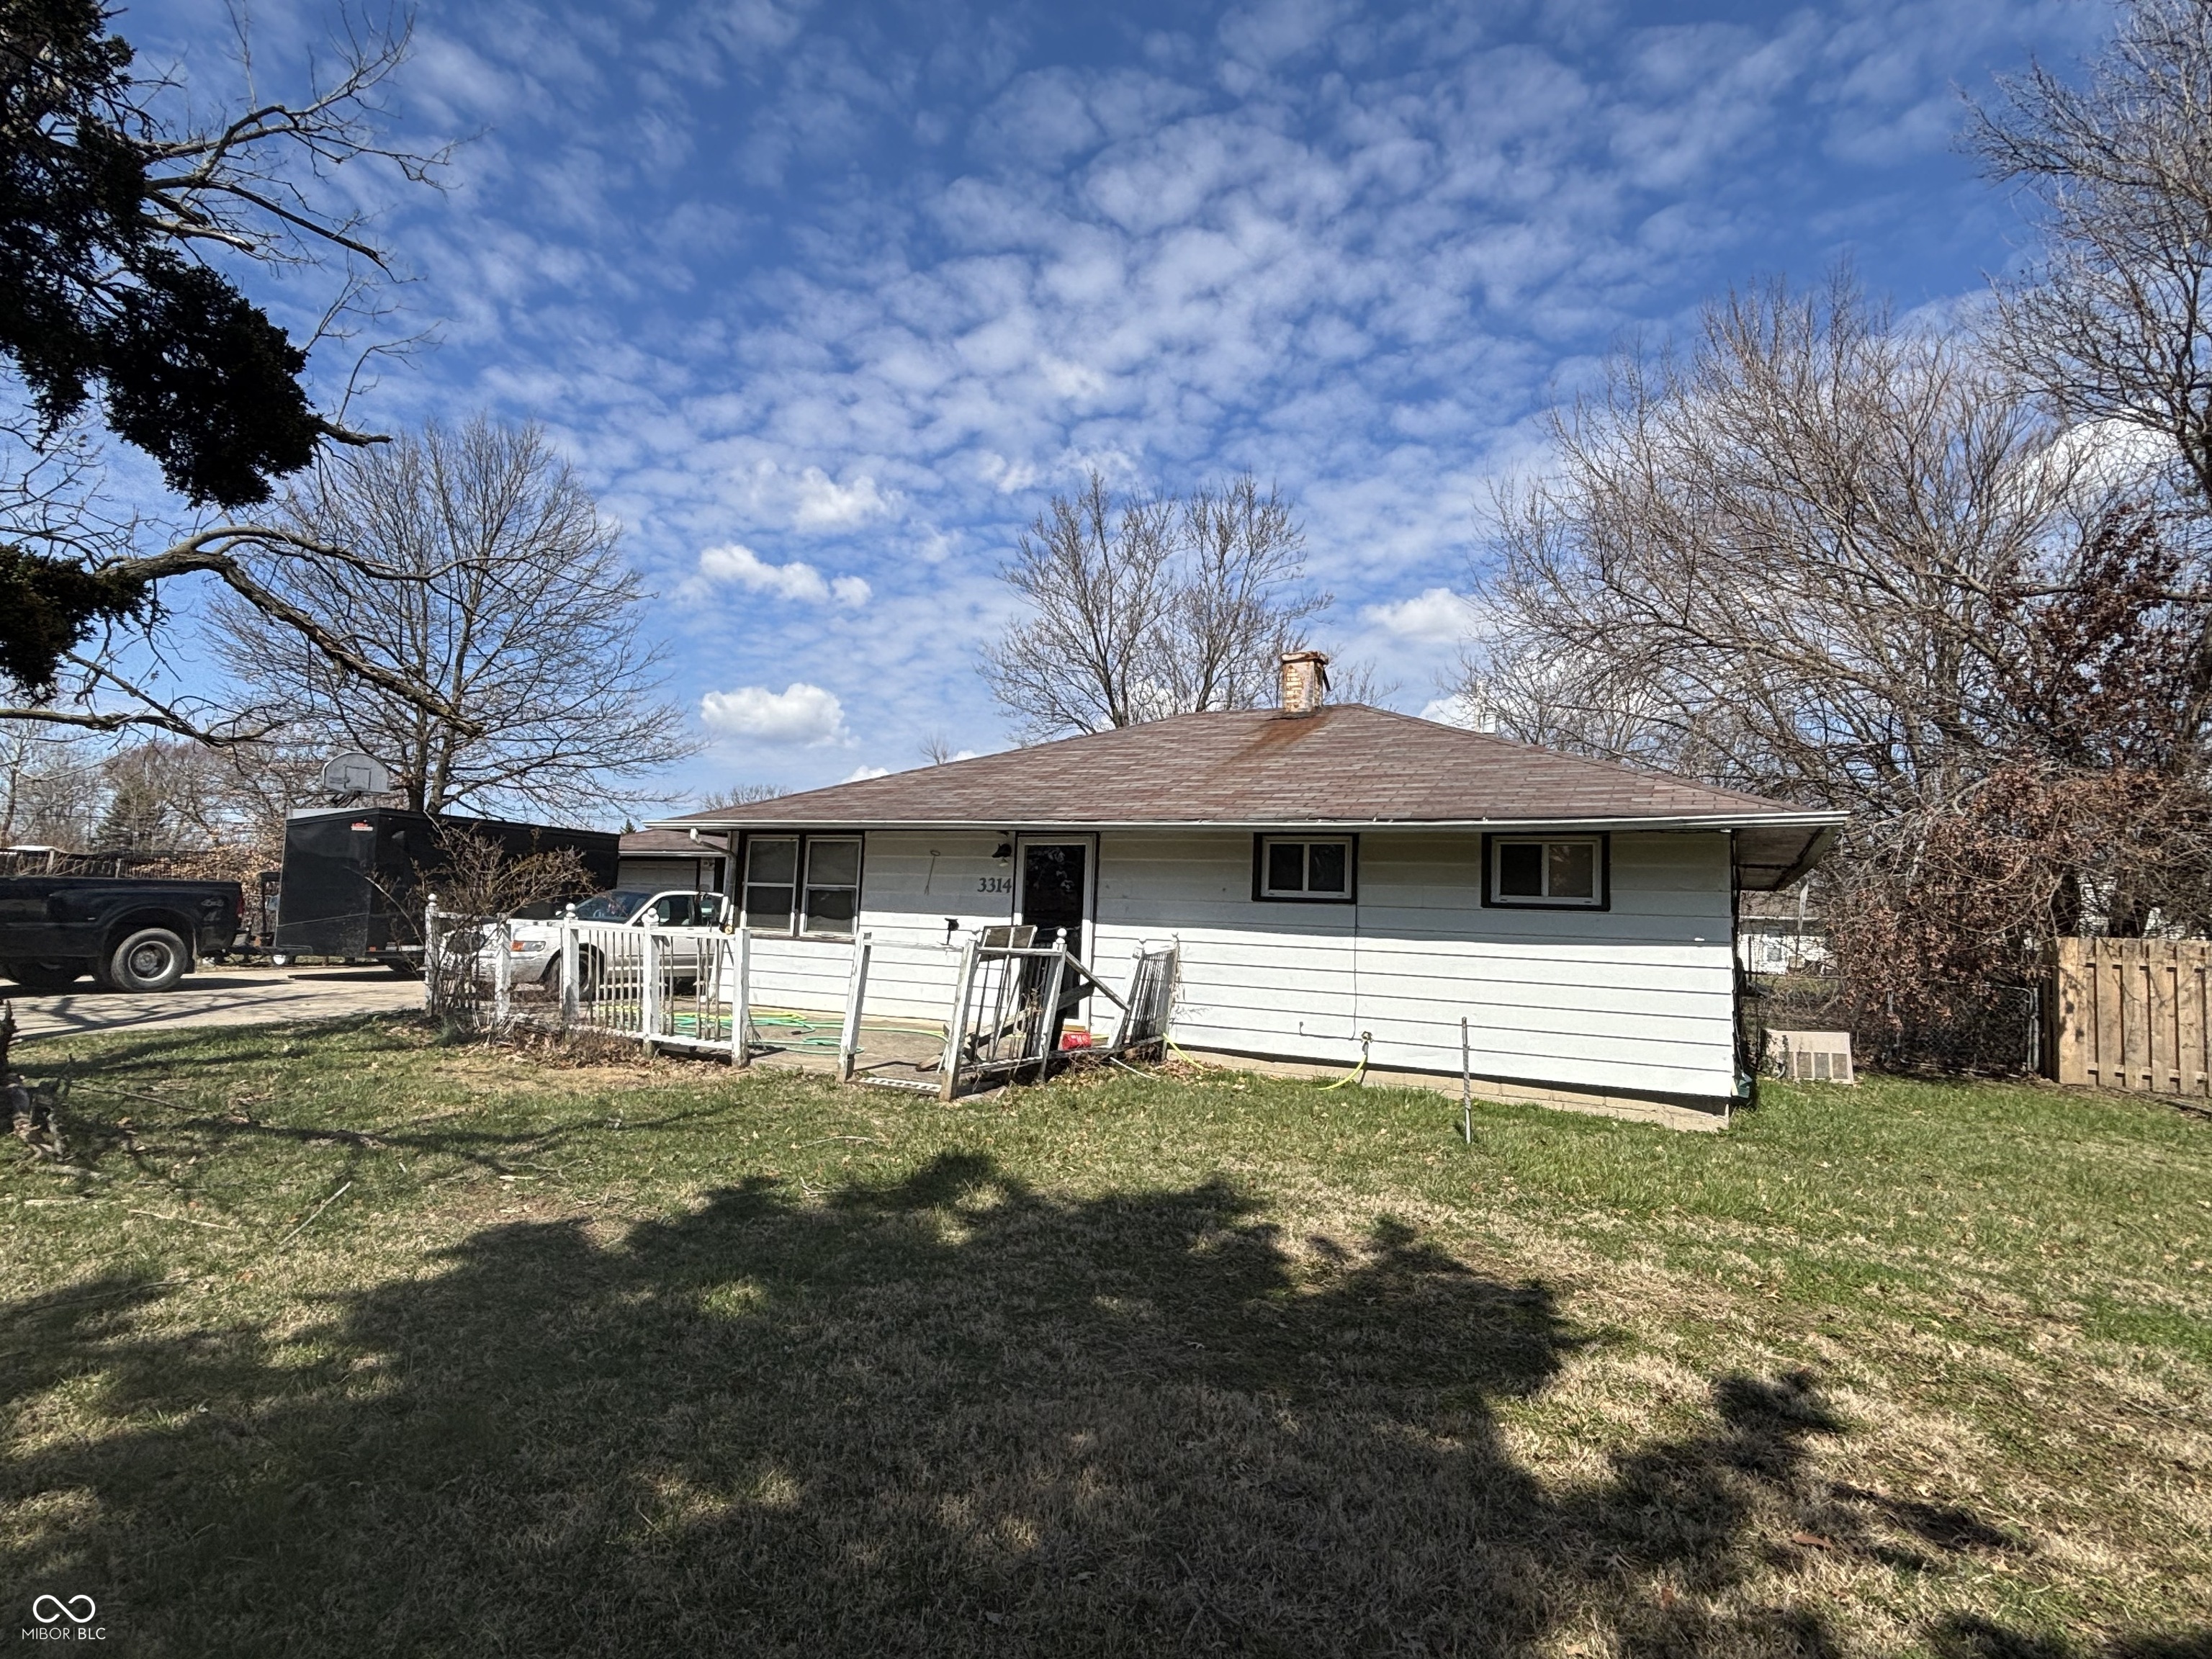
$150,000
3
bds
|
1
ba
|
1,008
sqft
|
built
1953
3314 Argyle Ct, Indianapolis, IN 46226
$198
Cash flow
6.9%
Cash-on-Cash Return
7.7%
Cap rate
0.9%
Rent to Value Ratio
Active
$340,000
3
bds
|
3
ba
|
2,948
sqft
|
built
1952
3805 Byram Ave, Indianapolis, IN 46208
$190
Cash flow
2.9%
Cash-on-Cash Return
6.8%
Cap rate
0.8%
Rent to Value Ratio
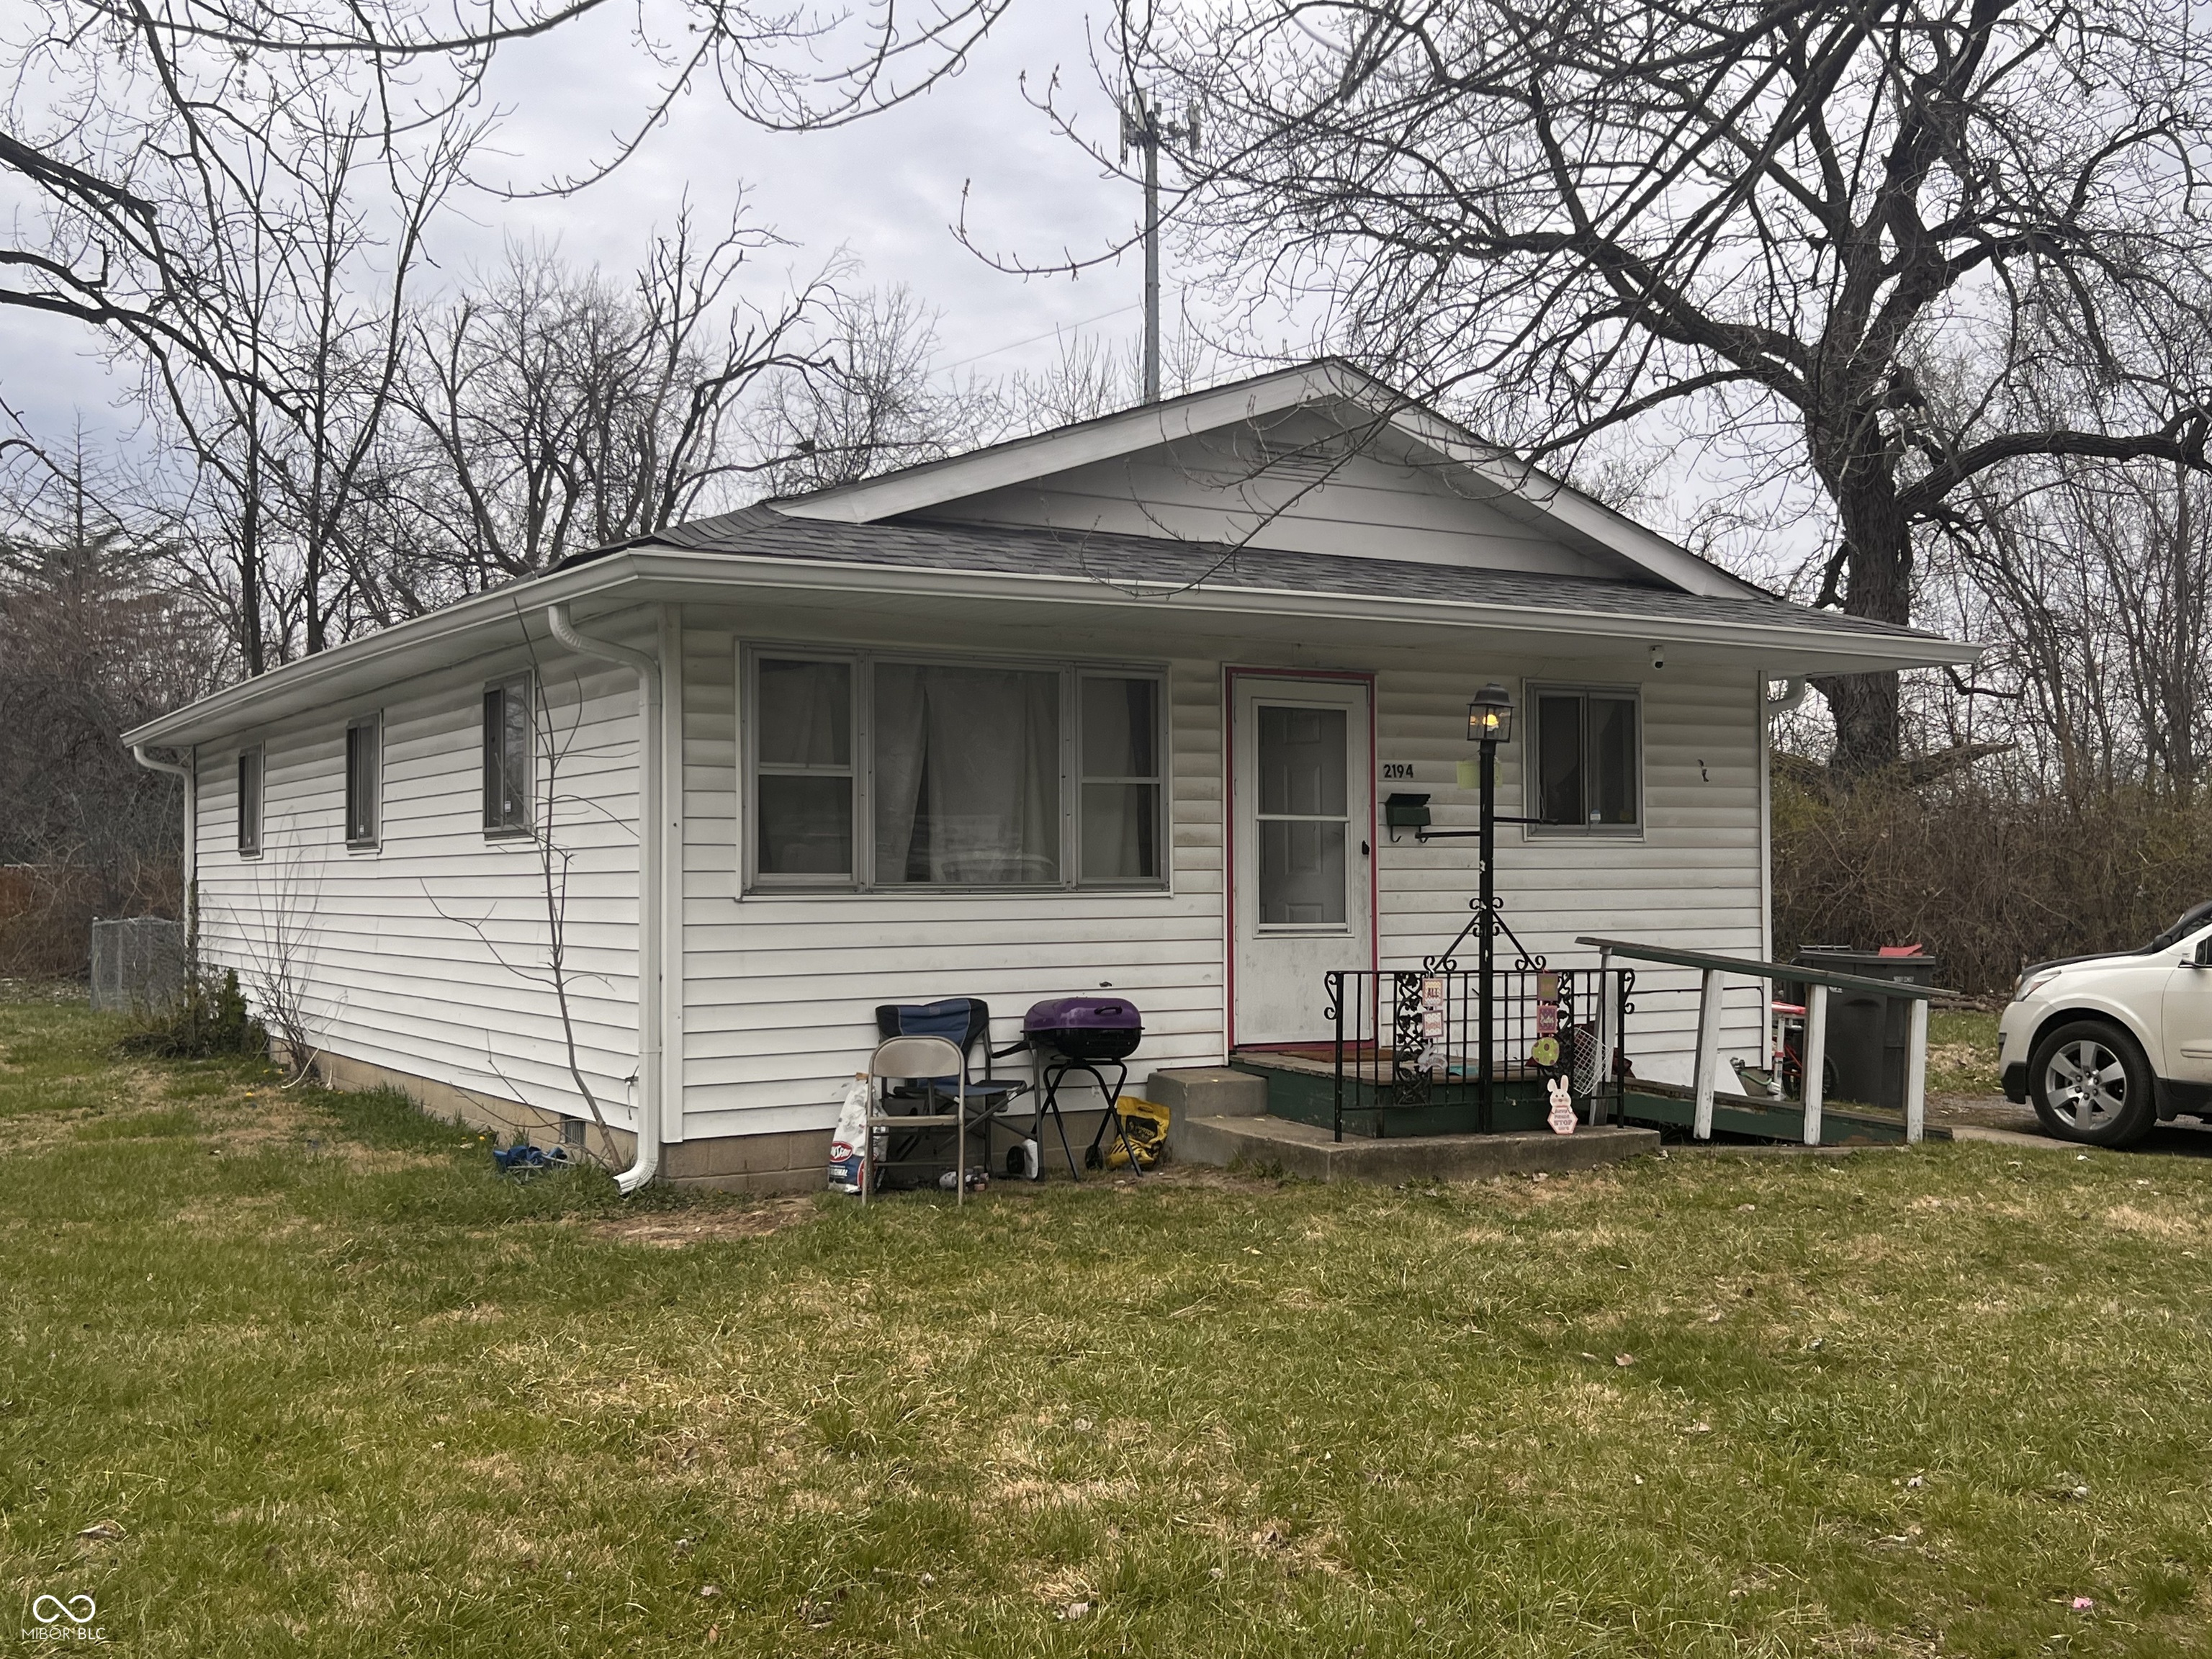
Active
$125,000
3
bds
|
1
ba
|
1,008
sqft
|
built
1967
2194 N Riley Ave, Indianapolis, IN 46218
$257
Cash flow
10.7%
Cash-on-Cash Return
8.6%
Cap rate
1.0%
Rent to Value Ratio
Active
$210,000
3
bds
|
3
ba
|
1,360
sqft
|
built
1966
1136 W 35th St, Indianapolis, IN 46208
$166
Cash flow
4.1%
Cash-on-Cash Return
7.1%
Cap rate
0.9%
Rent to Value Ratio
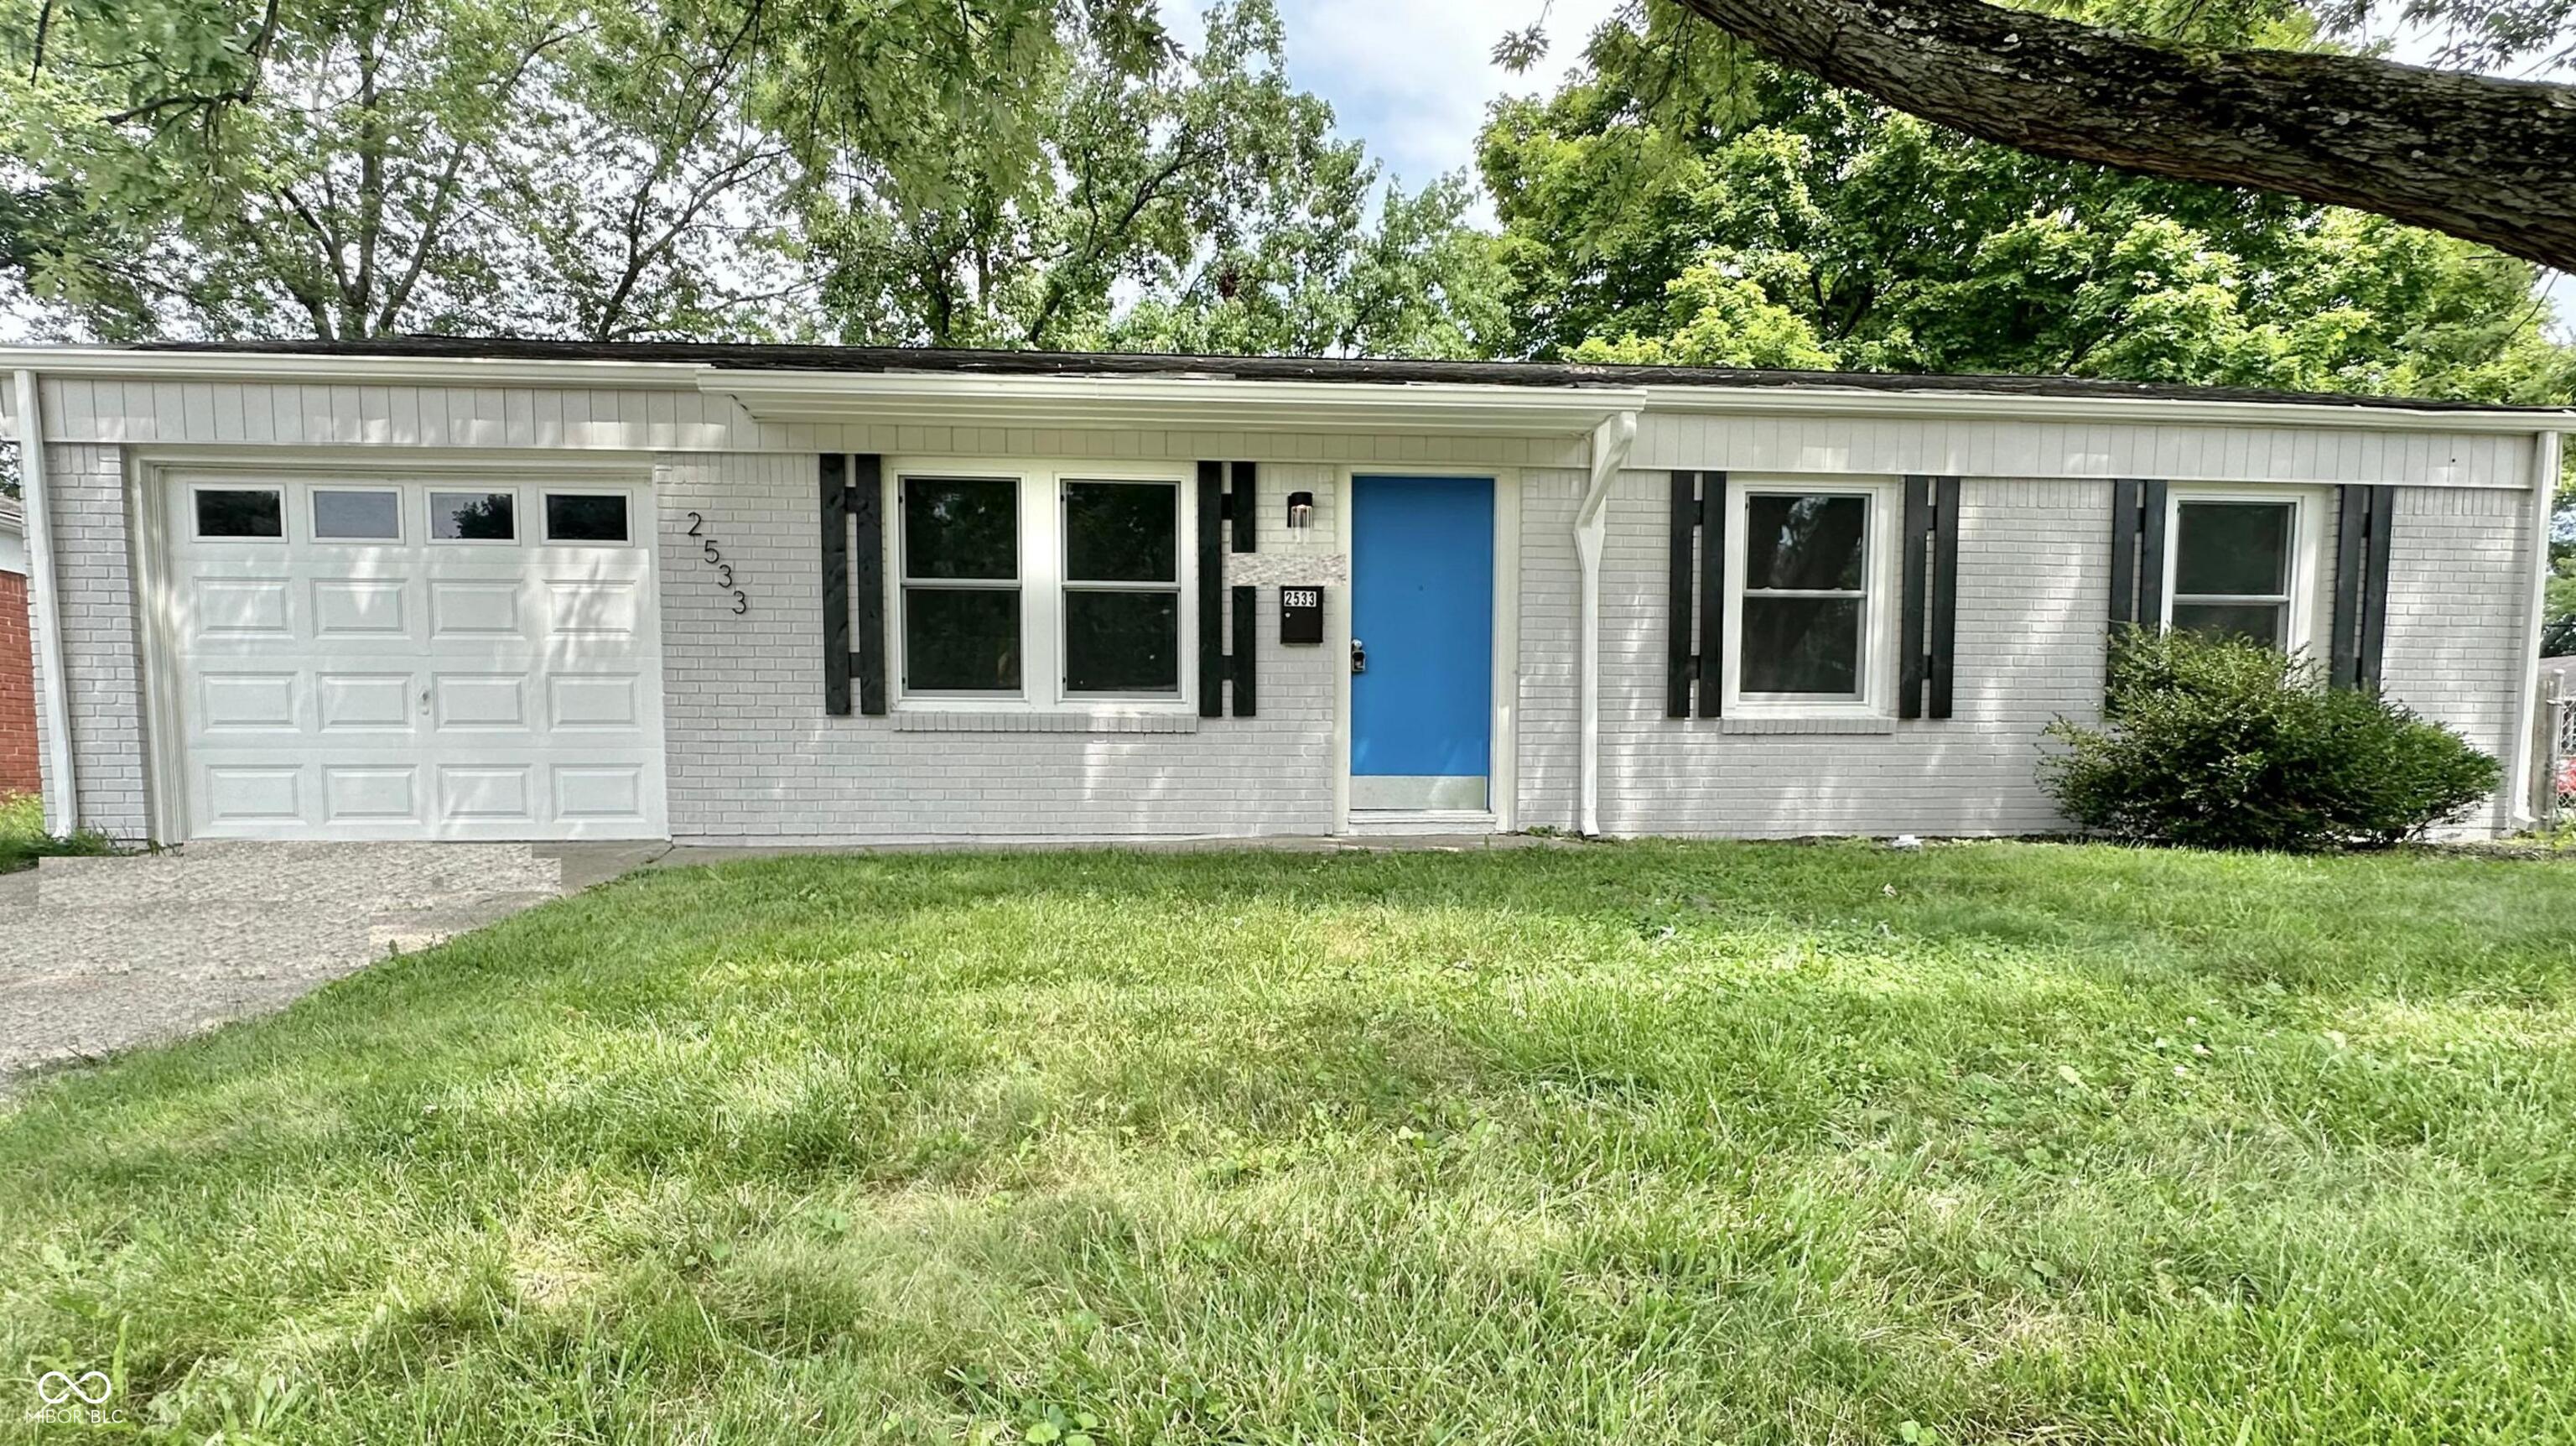
Active
$192,000
3
bds
|
1
ba
|
1,250
sqft
|
built
1959
2533 Aurie Dr, Indianapolis, IN 46219
$120
Cash flow
3.3%
Cash-on-Cash Return
6.9%
Cap rate
0.8%
Rent to Value Ratio
Active
$75,121
2
bds
|
1
ba
|
498
sqft
|
built
1910
226 Miley Ave, Indianapolis, IN 46222
$236
Cash flow
16.4%
Cash-on-Cash Return
9.9%
Cap rate
1.2%
Rent to Value Ratio
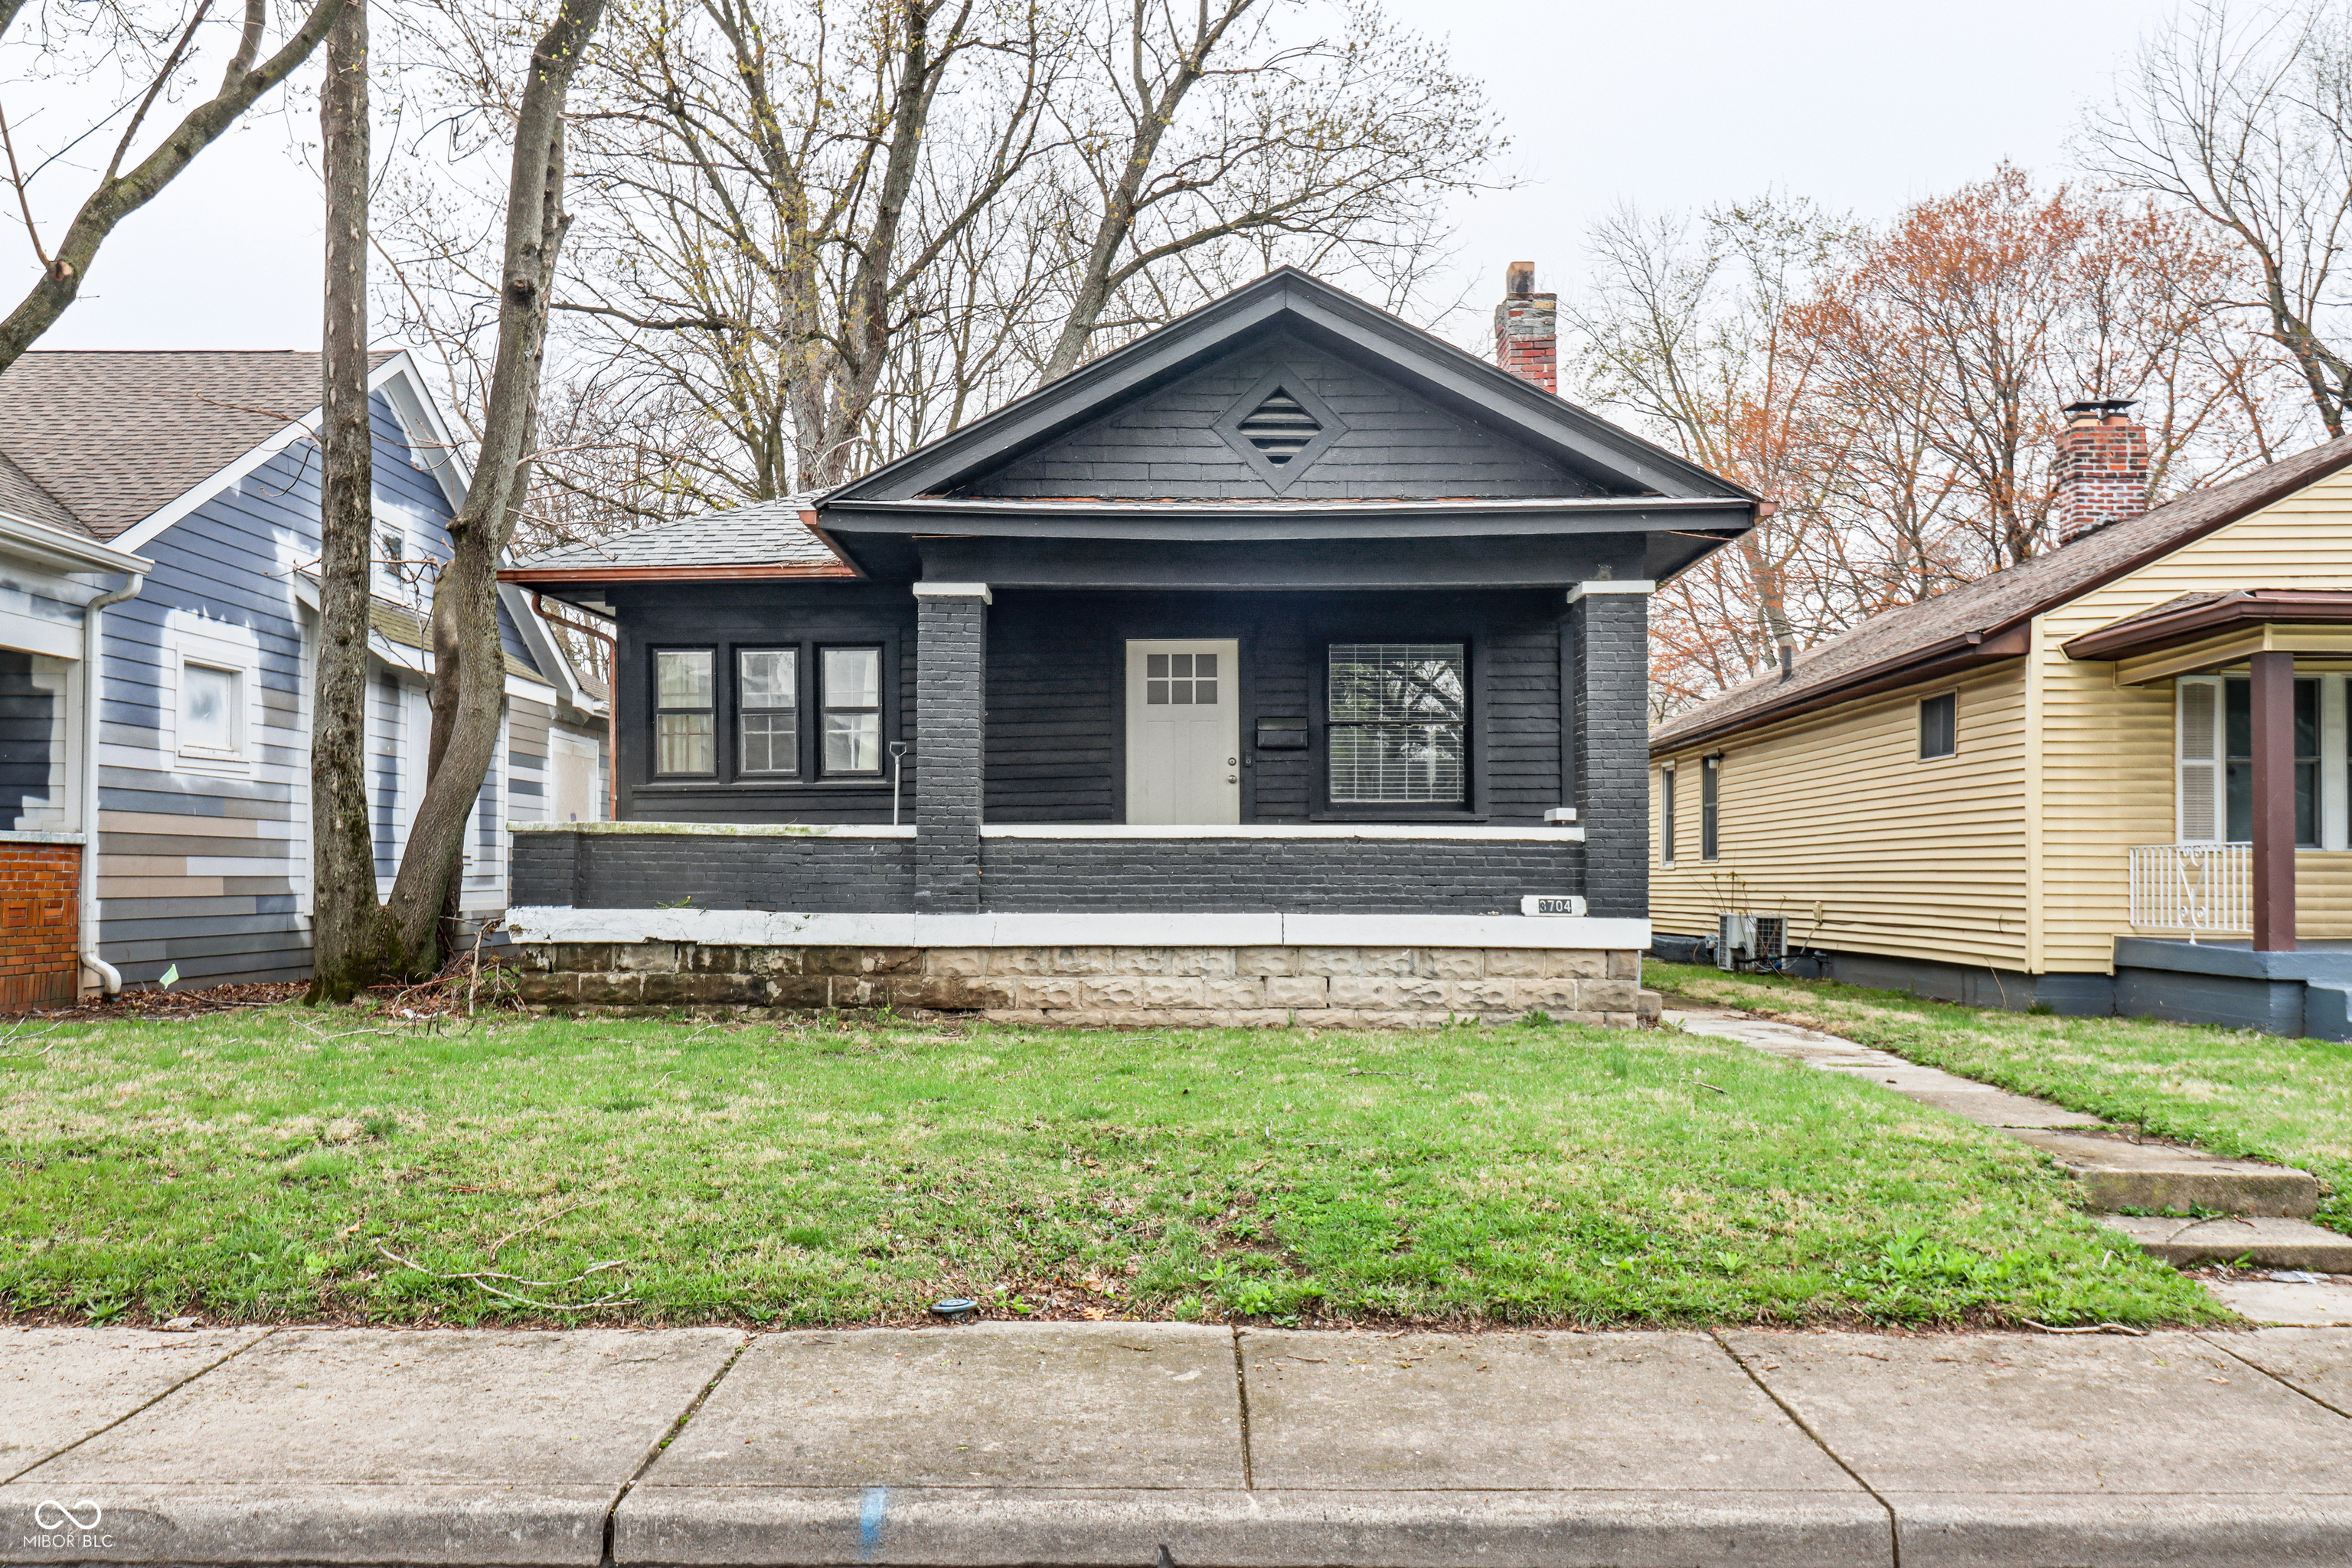
Active
$120,000
3
bds
|
1
ba
|
1,006
sqft
|
built
1920
3704 Graceland Ave, Indianapolis, IN 46208
$351
Cash flow
15.3%
Cash-on-Cash Return
9.7%
Cap rate
1.2%
Rent to Value Ratio
Active
$159,900
2
bds
|
1
ba
|
916
sqft
|
built
1905
2025 Barth Ave, Indianapolis, IN 46203
$147
Cash flow
4.8%
Cash-on-Cash Return
7.2%
Cap rate
0.9%
Rent to Value Ratio
Pending
$159,400
3
bds
|
1
ba
|
1,008
sqft
|
built
1960
120 Hugo St, Indianapolis, IN 46229
$80
Cash flow
2.6%
Cash-on-Cash Return
6.8%
Cap rate
0.8%
Rent to Value Ratio
Active
$155,000
2
bds
|
2
ba
|
2,800
sqft
|
built
1955
120 Wisconsin St, Indianapolis, IN 46225
$103
Cash flow
3.5%
Cash-on-Cash Return
6.9%
Cap rate
0.8%
Rent to Value Ratio
Active
$345,000
4
bds
|
2
ba
|
2,330
sqft
|
built
1915
3140 Washington Blvd, Indianapolis, IN 46205
$165
Cash flow
2.5%
Cash-on-Cash Return
6.7%
Cap rate
0.8%
Rent to Value Ratio
Active
$144,900
3
bds
|
2
ba
|
1,928
sqft
|
built
1910
1207 W 35th St, Indianapolis, IN 46208
$86
Cash flow
3.1%
Cash-on-Cash Return
6.9%
Cap rate
0.8%
Rent to Value Ratio
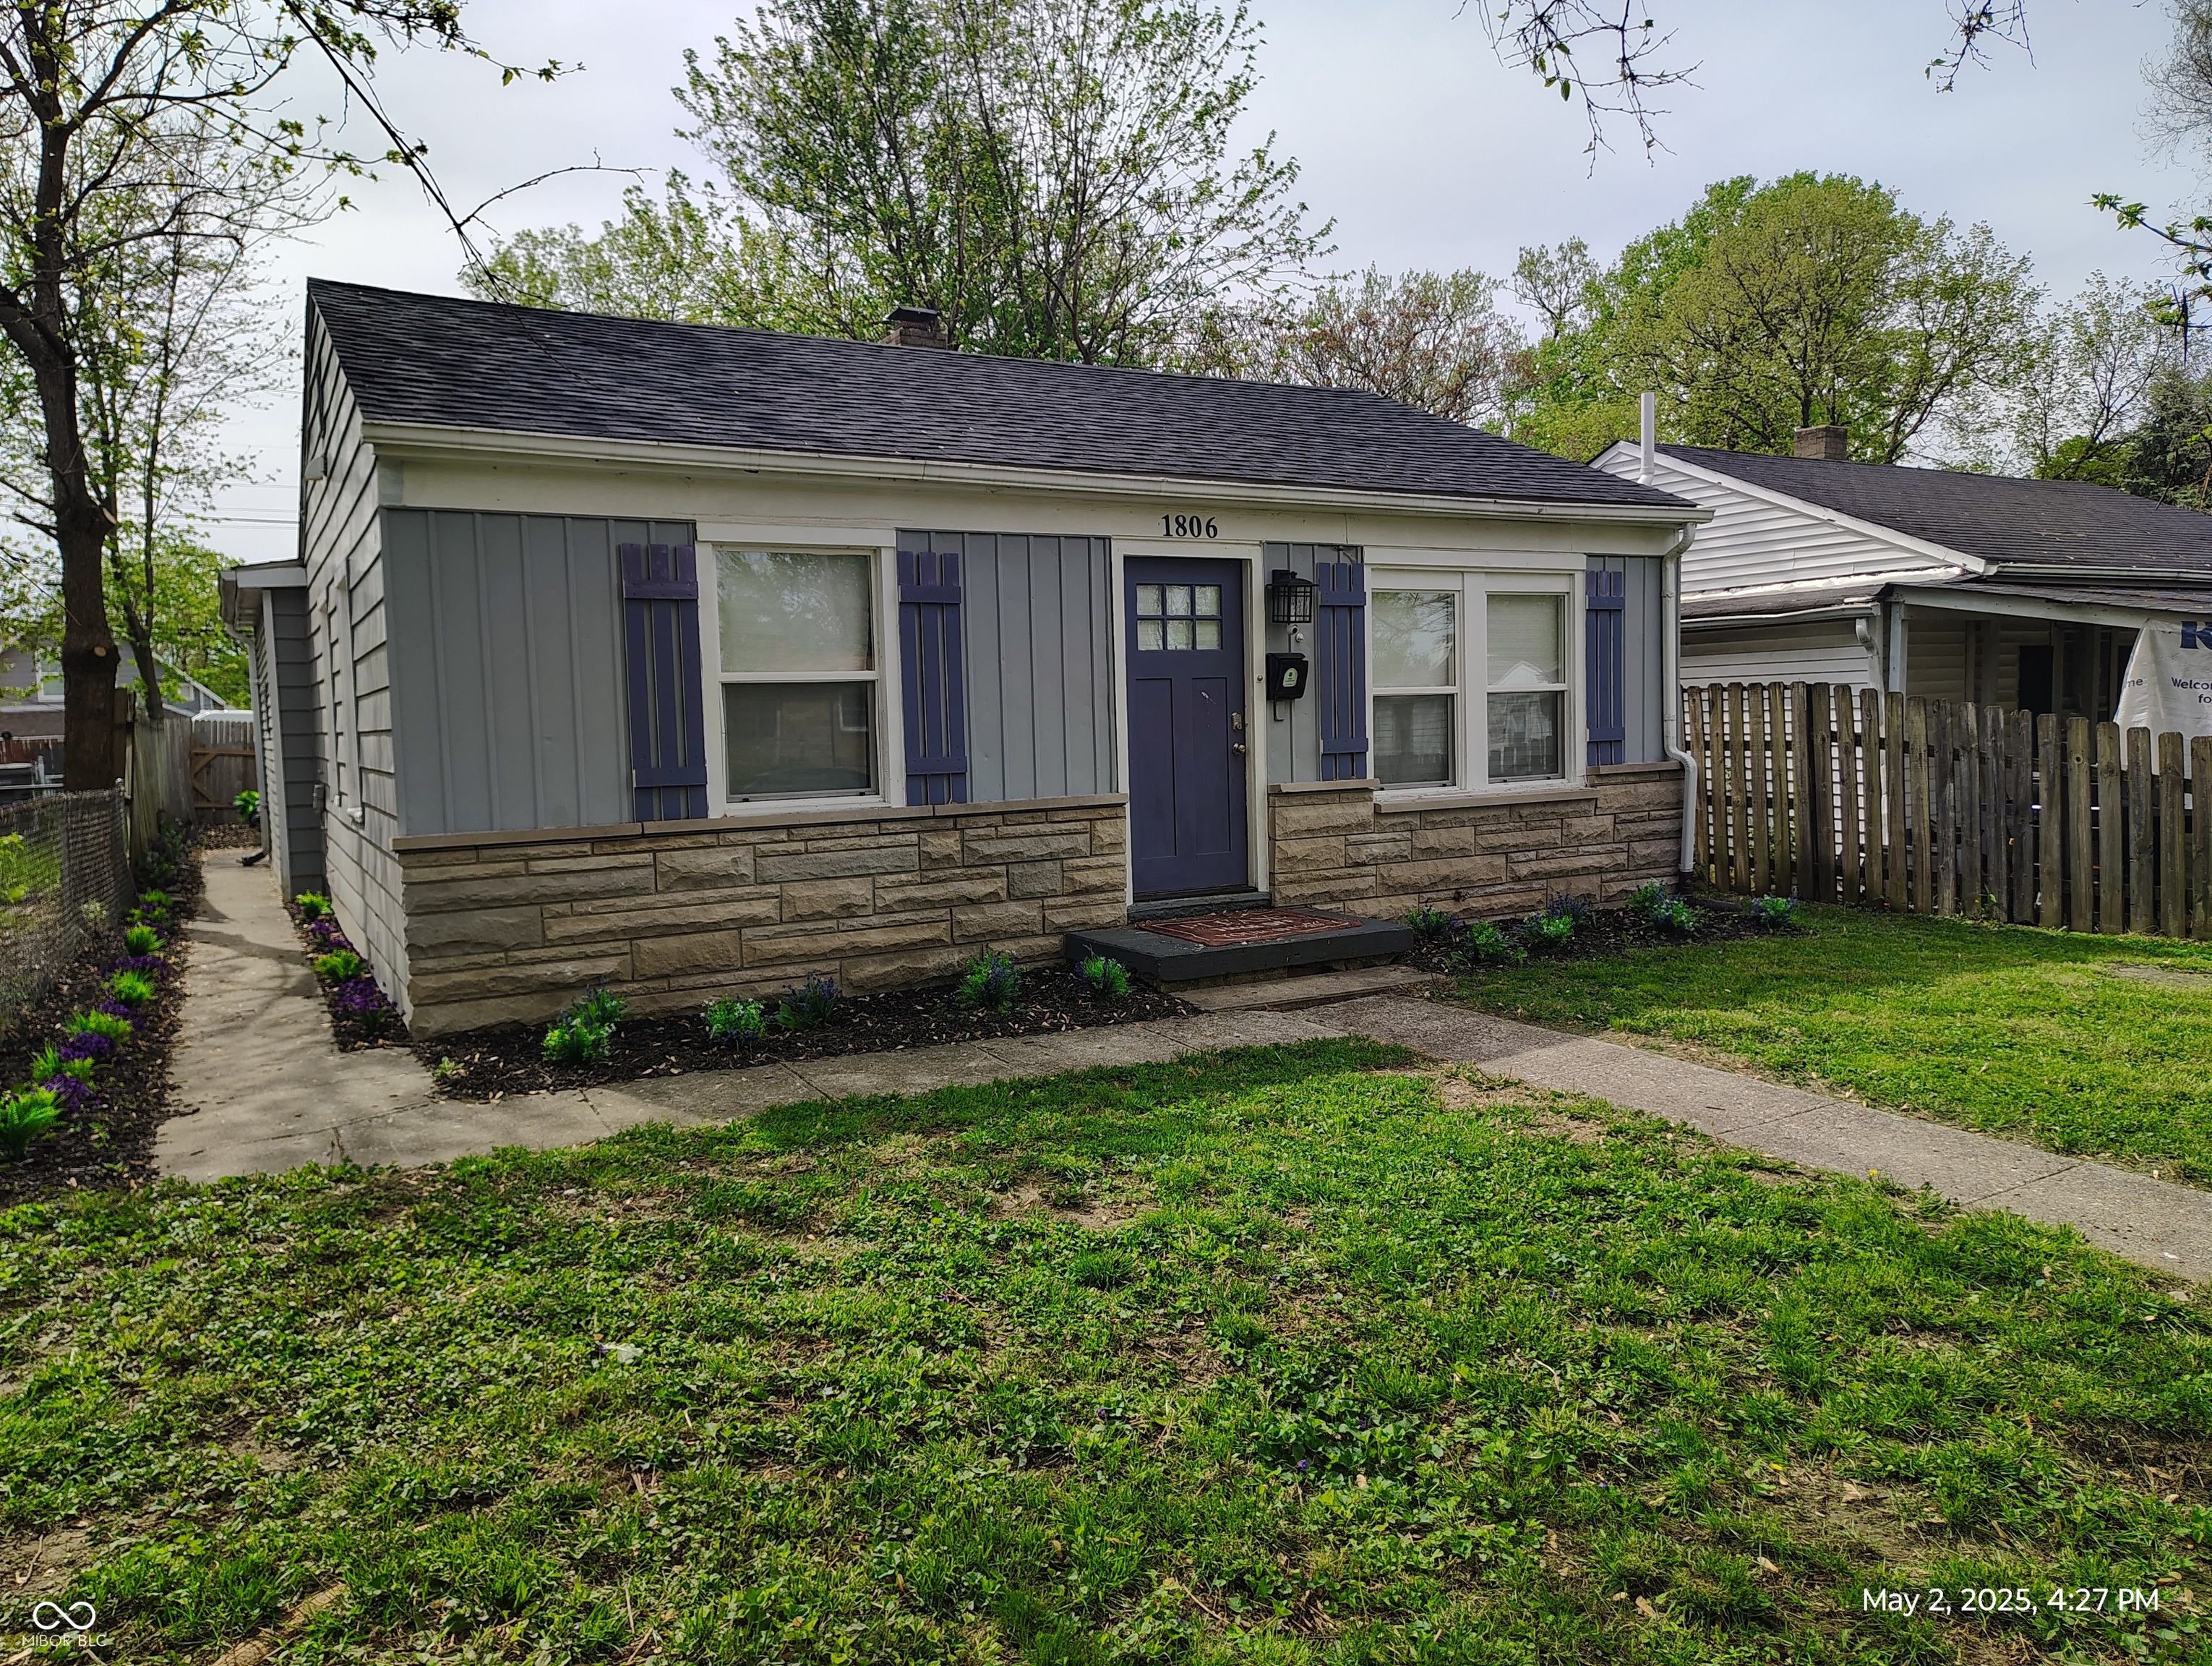
Active
$205,000
3
bds
|
2
ba
|
1,152
sqft
|
built
1950
1806 Asbury St, Indianapolis, IN 46203
$192
Cash flow
4.9%
Cash-on-Cash Return
7.3%
Cap rate
0.9%
Rent to Value Ratio
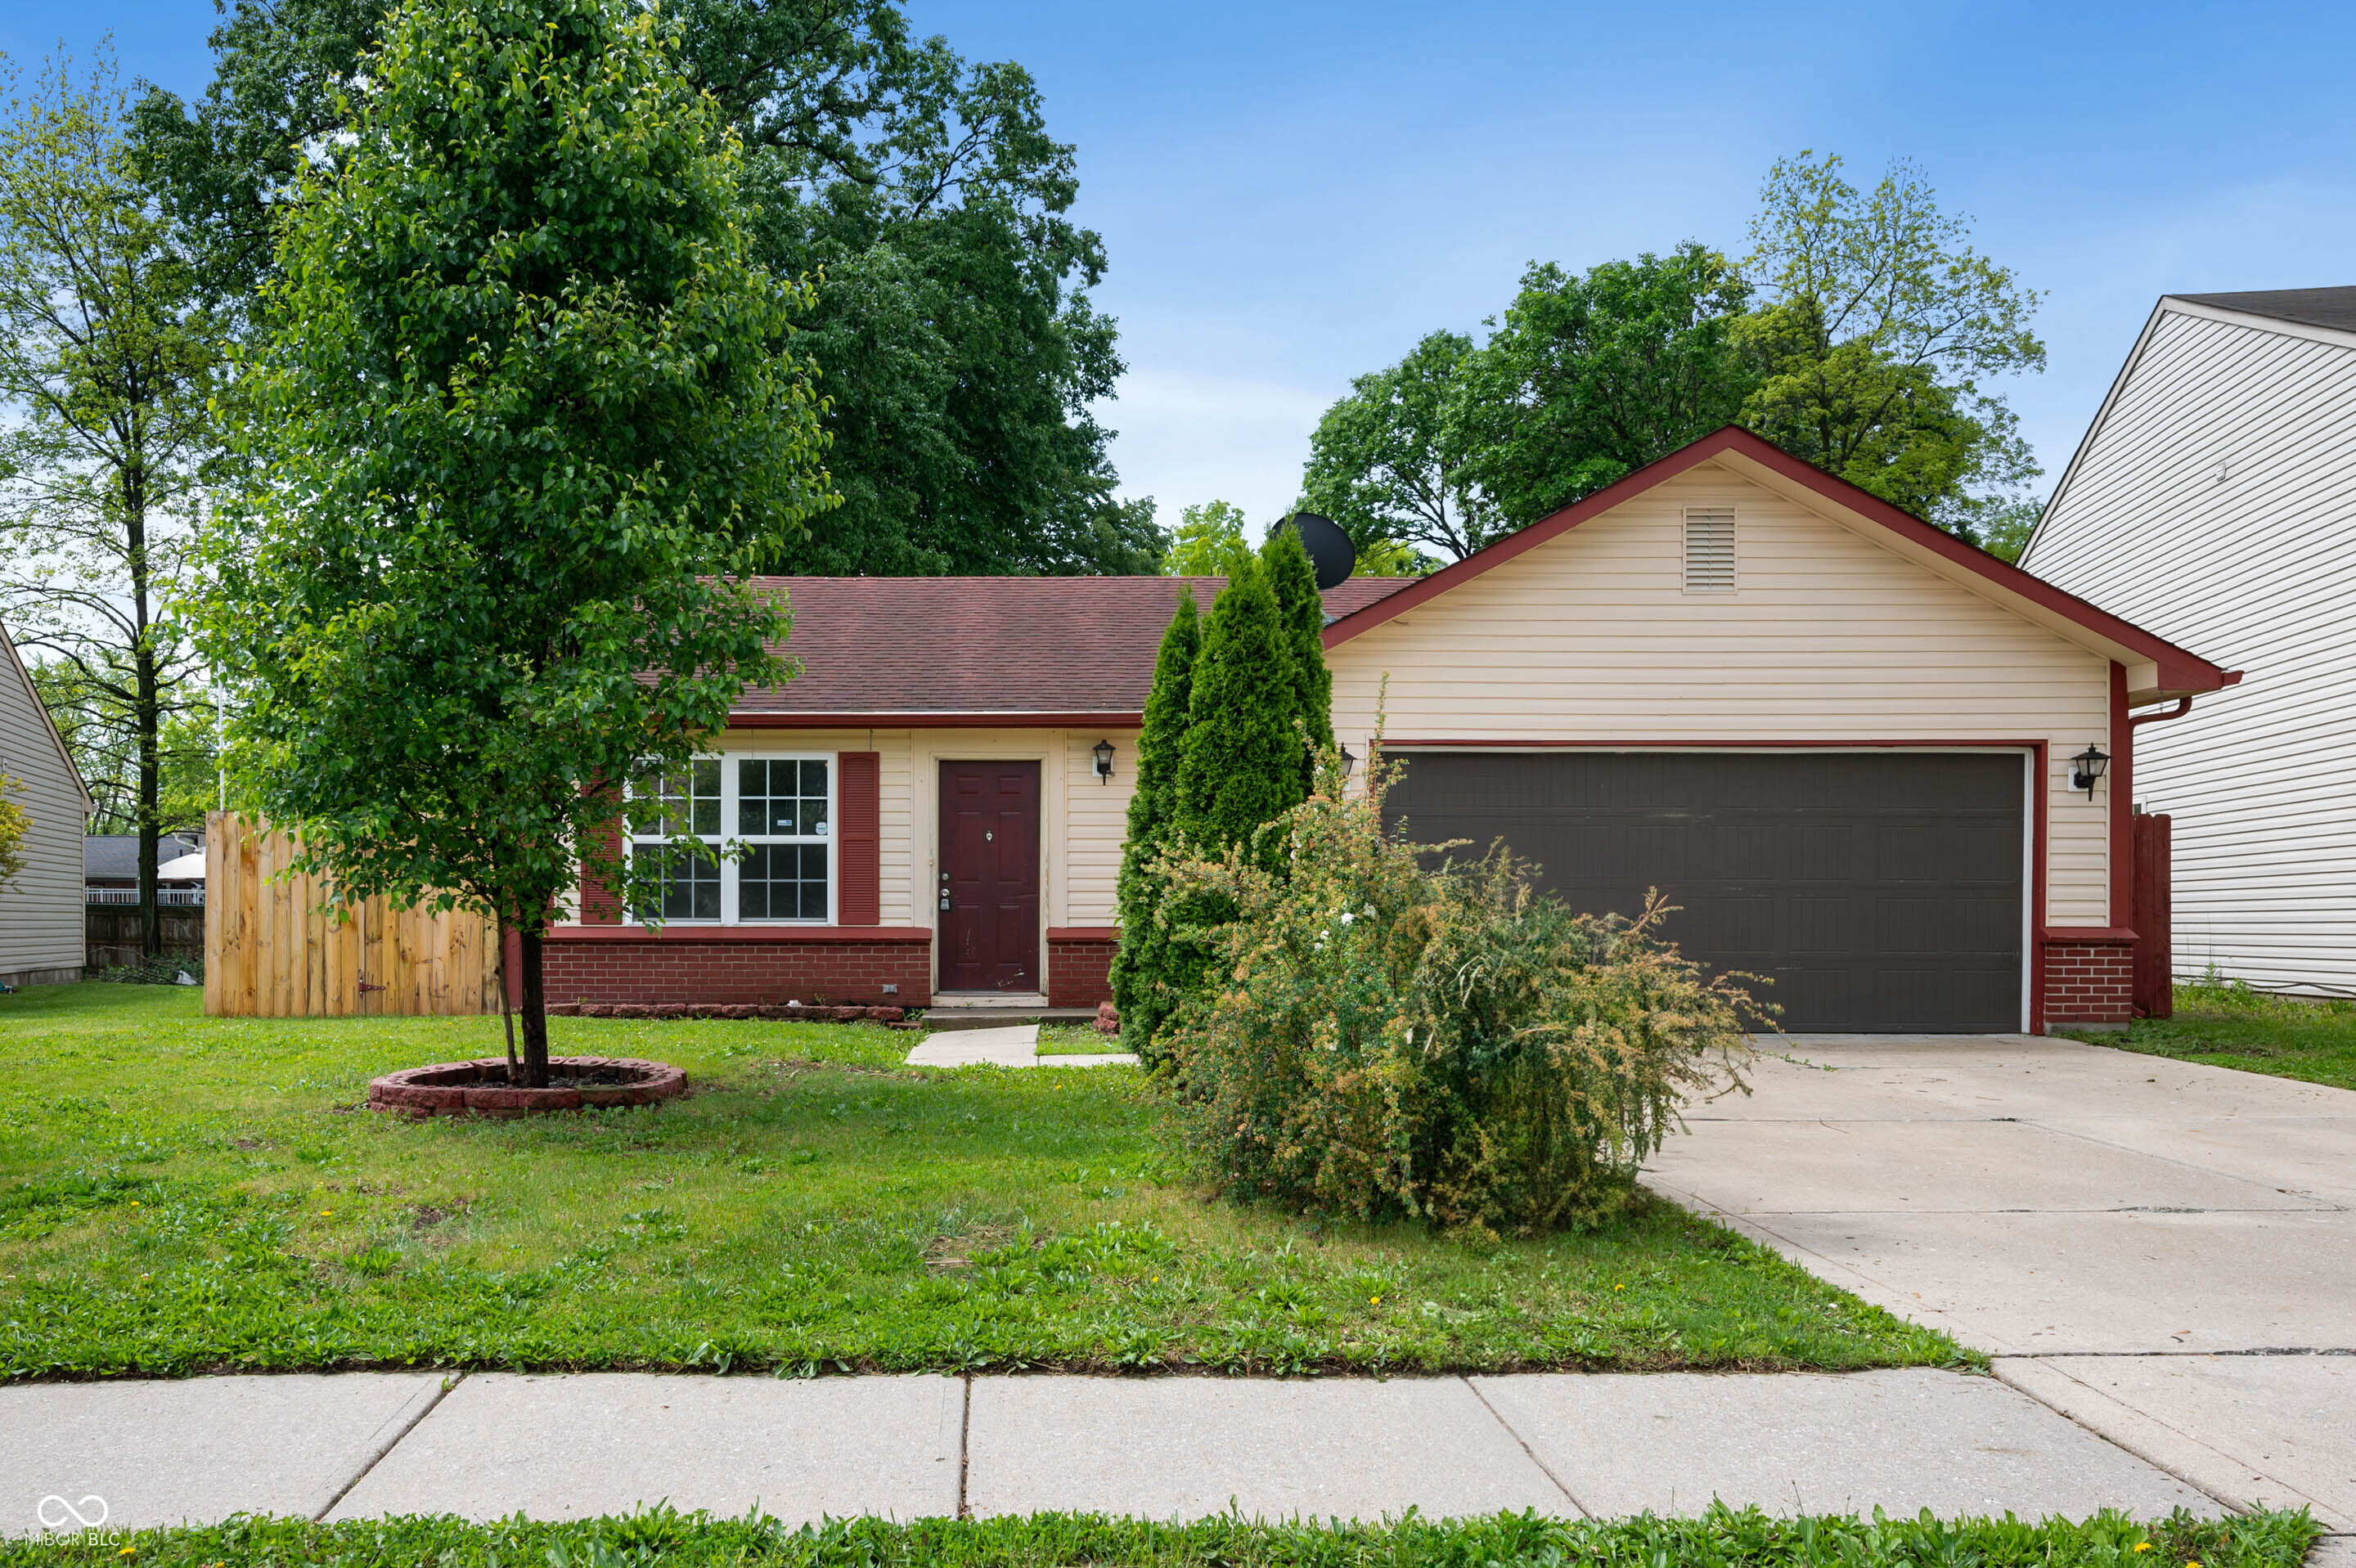
Pending
$200,000
3
bds
|
1
ba
|
960
sqft
|
built
2001
6715 Wandering Way, Indianapolis, IN 46241
$61
Cash flow
1.6%
Cash-on-Cash Return
6.5%
Cap rate
0.8%
Rent to Value Ratio
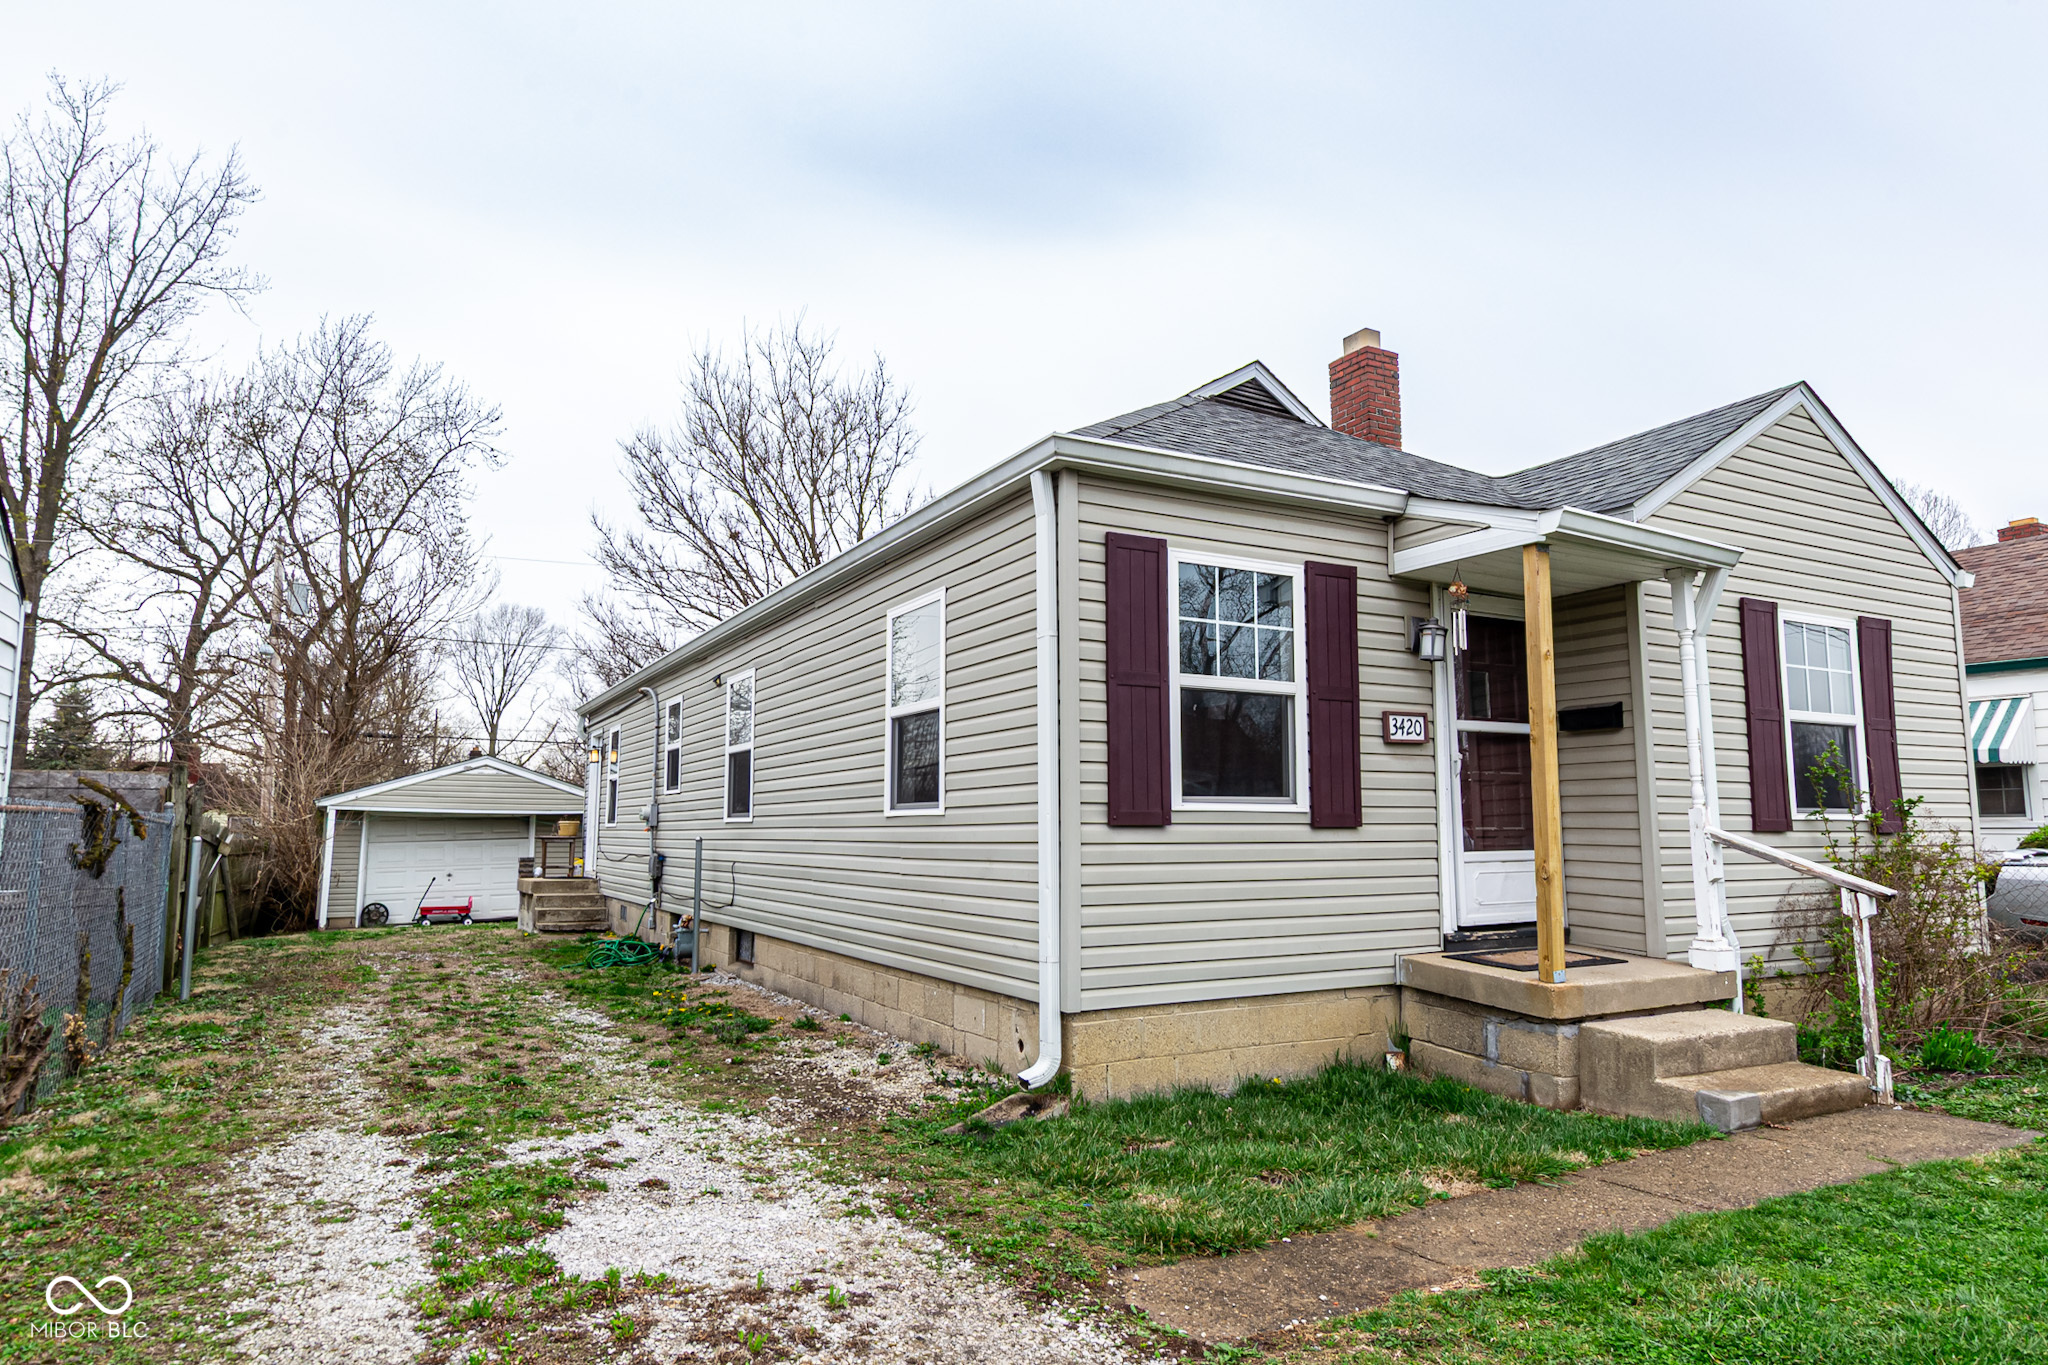
Active
$149,999
3
bds
|
1
ba
|
1,176
sqft
|
built
1950
3420 N Chester Ave, Indianapolis, IN 46218
$198
Cash flow
6.9%
Cash-on-Cash Return
7.7%
Cap rate
0.9%
Rent to Value Ratio
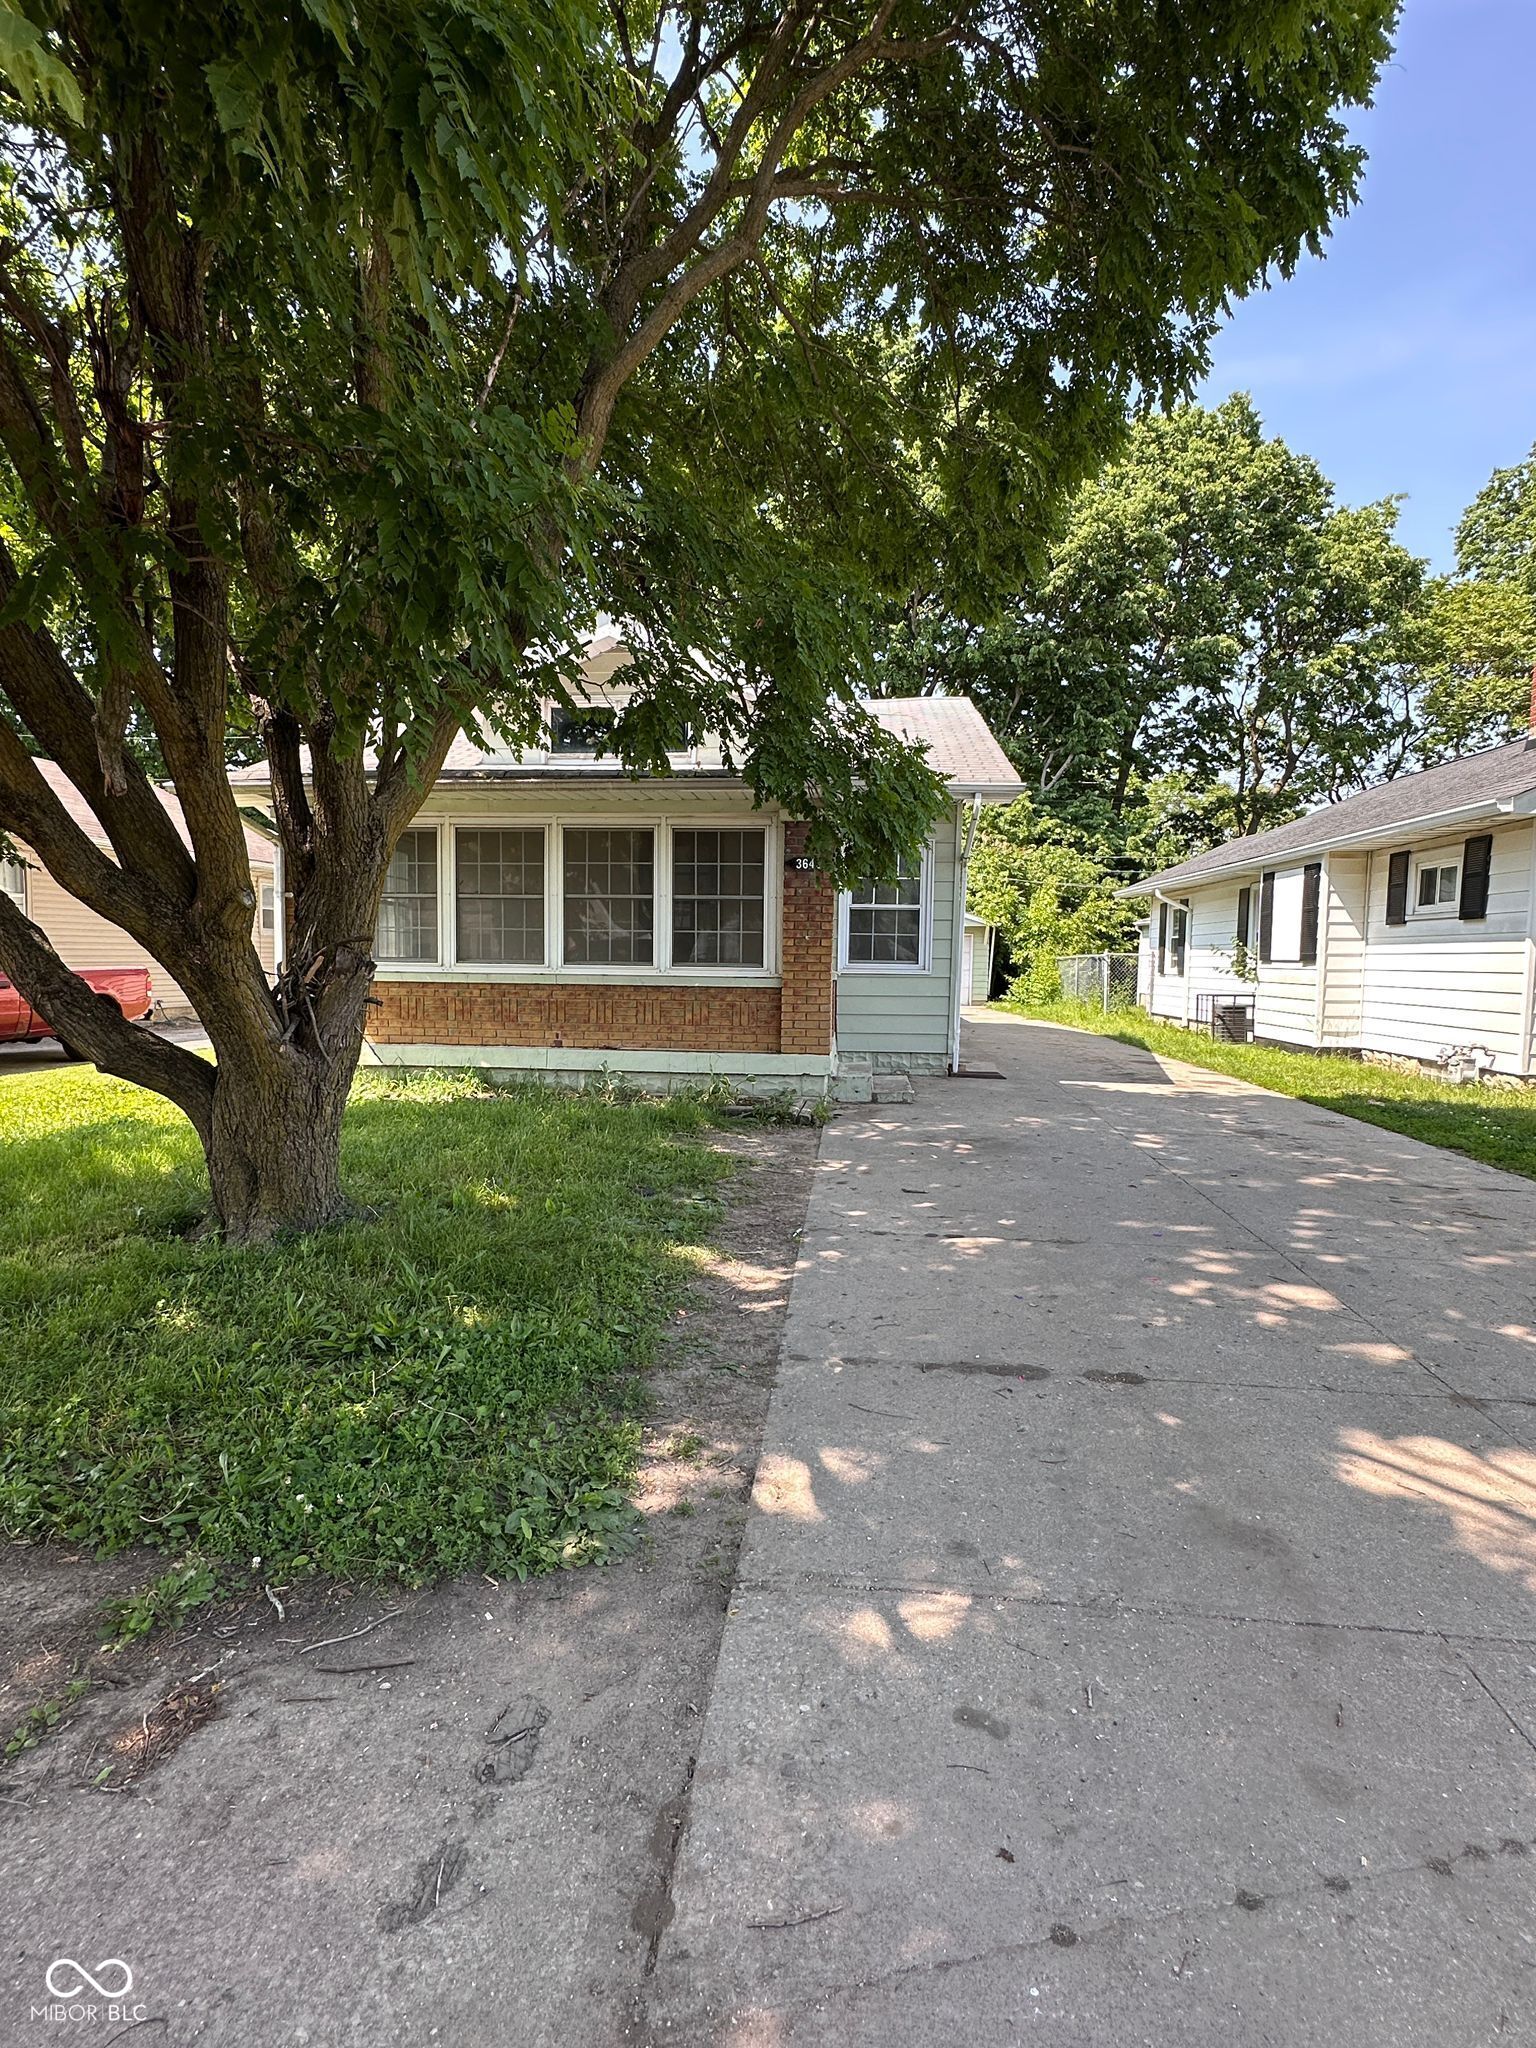
Active
$159,900
3
bds
|
1
ba
|
1,120
sqft
|
built
1928
3646 Creston Dr, Indianapolis, IN 46222
$147
Cash flow
4.8%
Cash-on-Cash Return
7.2%
Cap rate
0.9%
Rent to Value Ratio
Active
$115,000
2
bds
|
2
ba
|
610
sqft
|
built
1935
1623 N Centennial St, Indianapolis, IN 46222
$377
Cash flow
17.1%
Cash-on-Cash Return
10.1%
Cap rate
1.2%
Rent to Value Ratio
Active
$185,000
2
bds
|
2
ba
|
1,706
sqft
|
built
1926
2819 W 16th St, Indianapolis, IN 46222
$156
Cash flow
4.4%
Cash-on-Cash Return
7.2%
Cap rate
0.9%
Rent to Value Ratio
Active
$145,000
2
bds
|
1
ba
|
720
sqft
|
built
1935
1311 N Denny St, Indianapolis, IN 46201
$223
Cash flow
8.0%
Cash-on-Cash Return
8.0%
Cap rate
1.0%
Rent to Value Ratio
Active
$349,400
2
bds
|
2
ba
|
1,240
sqft
|
built
1910
430 N Park Ave, Indianapolis, IN 46202
$-721
Cash flow
-10.8%
Cash-on-Cash Return
3.7%
Cap rate
0.7%
Rent to Value Ratio
Active
$634,000
3
bds
|
3
ba
|
1,589
sqft
|
built
1945
6185 Evanston Ave, Indianapolis, IN 46220
$-764
Cash flow
-6.3%
Cash-on-Cash Return
4.7%
Cap rate
0.6%
Rent to Value Ratio
Active
$1,945,000
4
bds
|
7
ba
|
7,682
sqft
|
built
2001
10919 Brigantine Dr, Indianapolis, IN 46256
$-5,108
Cash flow
-13.7%
Cash-on-Cash Return
3.0%
Cap rate
0.4%
Rent to Value Ratio
Active
$104,900
2
bds
|
1
ba
|
868
sqft
|
built
1920
1524 W 21st St, Indianapolis, IN 46202
$498
Cash flow
24.8%
Cash-on-Cash Return
11.8%
Cap rate
1.4%
Rent to Value Ratio
Active
$374,000
3
bds
|
2
ba
|
2,717
sqft
|
built
1987
9362 Helmsdale Dr, Indianapolis, IN 46256
$-536
Cash flow
-7.5%
Cash-on-Cash Return
4.4%
Cap rate
0.5%
Rent to Value Ratio