Indianapolis, IN Investment Properties for Sale
Browse homes for sale and investment properties in Indianapolis, IN. Refine your search by price, property type, or more.
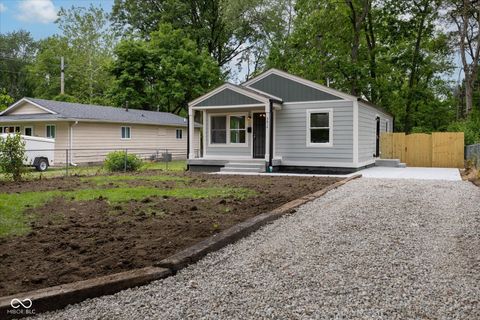
Best cash flowing properties in Indianapolis, IN

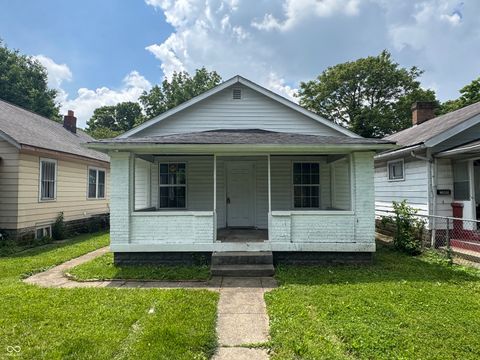
Pending
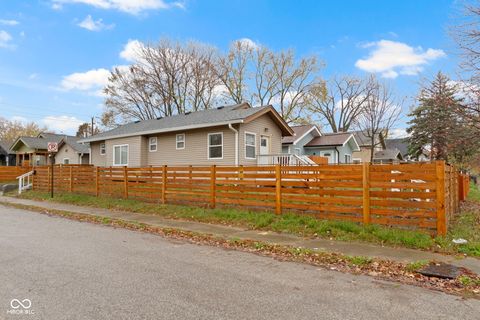
$80,000
3
bds
|
2
ba
|
1,342
sqft
|
built
1959
3845 N Irvington Ave, Indianapolis, IN 46226
$694
Cash flow
45.3%
Cash-on-Cash Return
16.6%
Cap rate
2.0%
Rent to Value Ratio

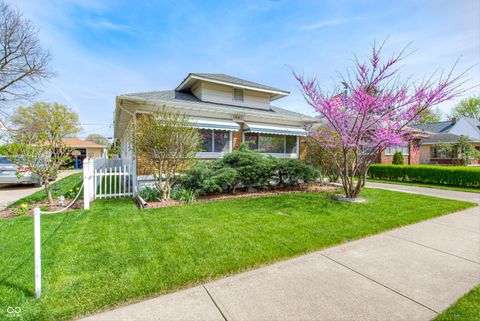
Active
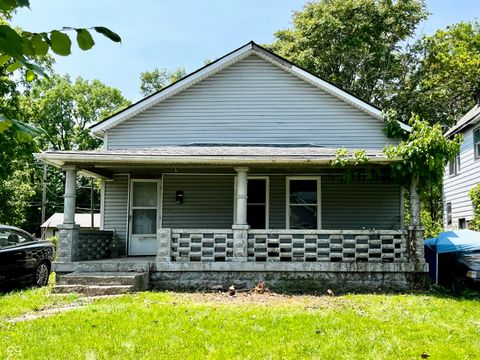
$209,900
3
bds
|
2
ba
|
1,078
sqft
|
built
1930
1411 N Grant Ave, Indianapolis, IN 46201
$374
Cash flow
9.3%
Cash-on-Cash Return
8.3%
Cap rate
1.0%
Rent to Value Ratio
1,959 out of 2,099 properties for sale in Indianapolis, IN
Limited Results Shown
Create a free account, or log in to reveal all property listings and enjoy the complete experience.
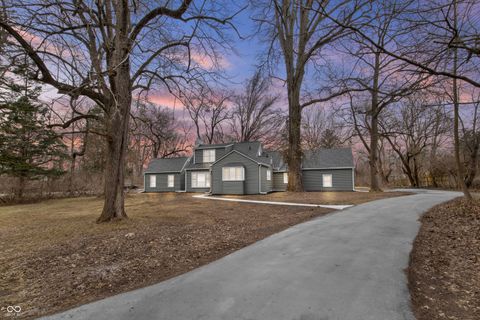
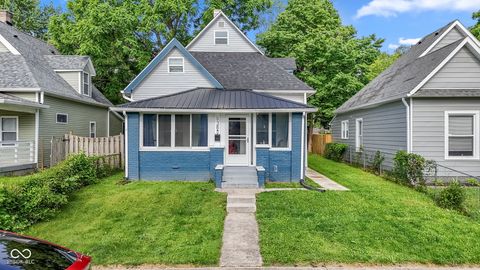
Pending
$549,000
5
bds
|
4
ba
|
3,466
sqft
|
built
2007
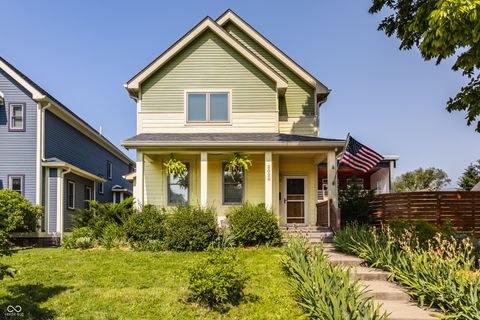
2020 N Park Ave, Indianapolis, IN 46202
$-328
Cash flow
-3.1%
Cash-on-Cash Return
5.4%
Cap rate
0.7%
Rent to Value Ratio
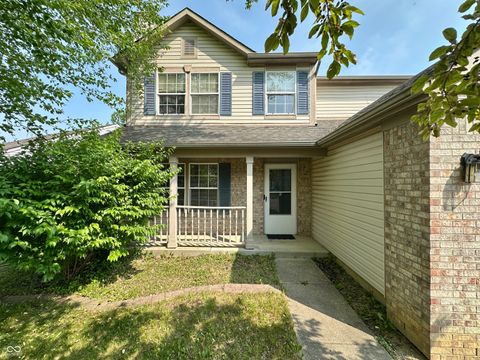
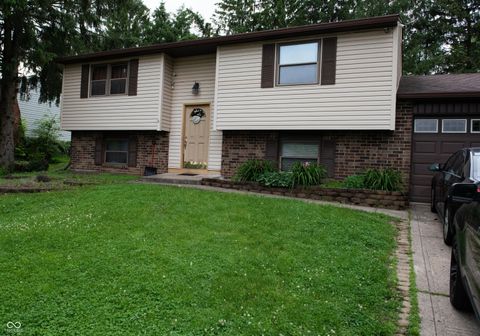
Pending
$179,900
3
bds
|
1
ba
|
912
sqft
|
built
1960
1850 Cruft St, Indianapolis, IN 46203
$44
Cash flow
1.3%
Cash-on-Cash Return
6.4%
Cap rate
0.8%
Rent to Value Ratio
Active
$475,000
5
bds
|
2
ba
|
2,892
sqft
|
built
1876
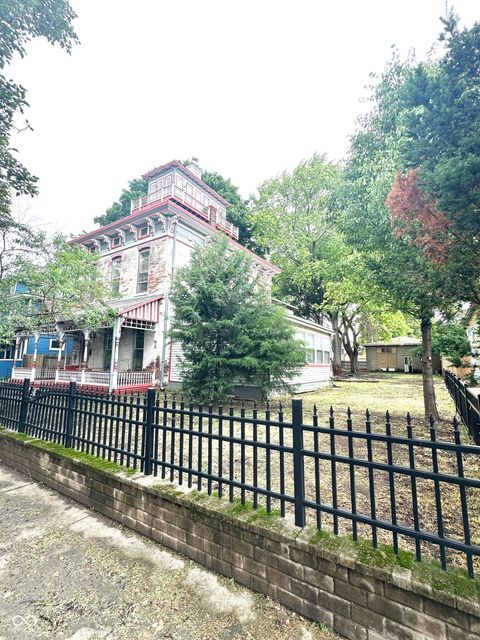
866 Fletcher Ave, Indianapolis, IN 46203
$-294
Cash flow
-3.2%
Cash-on-Cash Return
5.4%
Cap rate
0.7%
Rent to Value Ratio
Active
$290,000
3
bds
|
3
ba
|
1,324
sqft
|
built
1910
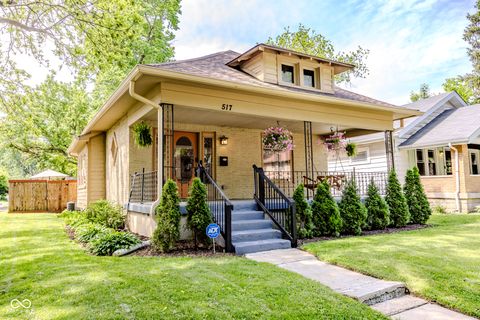
517 Bernard Ave, Indianapolis, IN 46208
$32
Cash flow
0.6%
Cash-on-Cash Return
6.3%
Cap rate
0.8%
Rent to Value Ratio
Active
$129,000
2
bds
|
1
ba
|
672
sqft
|
built
1930
1445 W 34th St, Indianapolis, IN 46208
$98
Cash flow
4.0%
Cash-on-Cash Return
7.1%
Cap rate
0.9%
Rent to Value Ratio

Active
$240,000
3
bds
|
2
ba
|
2,184
sqft
|
built
1968
1416 Wellington Ave, Indianapolis, IN 46219
$13
Cash flow
0.3%
Cash-on-Cash Return
6.2%
Cap rate
0.8%
Rent to Value Ratio
Active
$274,900
2
bds
|
2
ba
|
1,803
sqft
|
built
1935
1641 Winton Ave, Indianapolis, IN 46224
$-28
Cash flow
-0.5%
Cash-on-Cash Return
6.0%
Cap rate
0.7%
Rent to Value Ratio
Active
$649,000
5
bds
|
4
ba
|
3,401
sqft
|
built
1945
7999 Englewood Rd, Indianapolis, IN 46240
$-220
Cash flow
-1.8%
Cash-on-Cash Return
5.7%
Cap rate
0.7%
Rent to Value Ratio

Active
$175,000
2
bds
|
2
ba
|
1,180
sqft
|
built
1980
8980 Cinnebar Dr, Indianapolis, IN 46268
$-86
Cash flow
-2.6%
Cash-on-Cash Return
5.6%
Cap rate
0.9%
Rent to Value Ratio
Active
$215,000
3
bds
|
3
ba
|
1,468
sqft
|
built
1997
10832 Tealpoint Dr, Indianapolis, IN 46229
$48
Cash flow
1.2%
Cash-on-Cash Return
6.4%
Cap rate
0.8%
Rent to Value Ratio

Active
$325,000
3
bds
|
2
ba
|
1,921
sqft
|
built
1984
4428 Edinburgh Pt, Indianapolis, IN 46228
$-858
Cash flow
-13.8%
Cash-on-Cash Return
3.0%
Cap rate
0.7%
Rent to Value Ratio
Active
$499,000
4
bds
|
3
ba
|
2,188
sqft
|
built
1930
140 W Hampton Dr, Indianapolis, IN 46208
$-555
Cash flow
-5.8%
Cash-on-Cash Return
4.8%
Cap rate
0.6%
Rent to Value Ratio
Active
$180,000
3
bds
|
2
ba
|
1,908
sqft
|
built
1920
352 W 28th St, Indianapolis, IN 46208
$320
Cash flow
9.3%
Cash-on-Cash Return
8.3%
Cap rate
1.0%
Rent to Value Ratio
Active
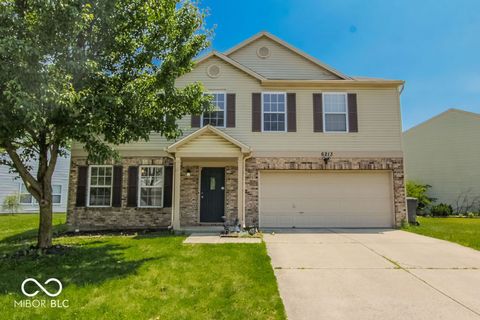
$285,000
4
bds
|
3
ba
|
2,360
sqft
|
built
2000
6213 Selago Dr, Indianapolis, IN 46203
$-249
Cash flow
-4.6%
Cash-on-Cash Return
5.1%
Cap rate
0.6%
Rent to Value Ratio

Pending
$179,900
3
bds
|
1
ba
|
1,205
sqft
|
built
1959
2465 N Eaton Ave, Indianapolis, IN 46219
$44
Cash flow
1.3%
Cash-on-Cash Return
6.4%
Cap rate
0.8%
Rent to Value Ratio

Active
$275,000
5
bds
|
3
ba
|
1,840
sqft
|
built
1935
6640 E Washington St, Indianapolis, IN 46219
$-29
Cash flow
-0.6%
Cash-on-Cash Return
6.0%
Cap rate
0.7%
Rent to Value Ratio
Active
$575,000
4
bds
|
3
ba
|
2,906
sqft
|
built
2004
6054 Easy Ln, Indianapolis, IN 46259
$-766
Cash flow
-7.0%
Cash-on-Cash Return
4.5%
Cap rate
0.6%
Rent to Value Ratio
Active
$190,000
3
bds
|
2
ba
|
1,063
sqft
|
built
1926
802 N Tuxedo St, Indianapolis, IN 46201
$131
Cash flow
3.6%
Cash-on-Cash Return
7.0%
Cap rate
0.8%
Rent to Value Ratio
Active
$109,000
2
bds
|
1
ba
|
1,383
sqft
|
built
1955
2826 Station St, Indianapolis, IN 46218
$339
Cash flow
16.2%
Cash-on-Cash Return
9.9%
Cap rate
1.2%
Rent to Value Ratio
Active
$199,000
3
bds
|
2
ba
|
1,559
sqft
|
built
1910
938 N Tuxedo St, Indianapolis, IN 46201
$154
Cash flow
4.0%
Cash-on-Cash Return
7.1%
Cap rate
0.9%
Rent to Value Ratio

Active
$525,000
3
bds
|
3
ba
|
2,472
sqft
|
built
2002
6760 Spirit Lake Dr, Indianapolis, IN 46220
$-1,528
Cash flow
-15.2%
Cash-on-Cash Return
2.7%
Cap rate
0.6%
Rent to Value Ratio

Active
$260,000
3
bds
|
2
ba
|
1,232
sqft
|
built
1990
9134 Jene Ct, Indianapolis, IN 46234
$-99
Cash flow
-2.0%
Cash-on-Cash Return
5.7%
Cap rate
0.7%
Rent to Value Ratio

Active
$290,000
3
bds
|
3
ba
|
2,030
sqft
|
built
2005
2887 Ludwig Dr, Indianapolis, IN 46239
$-143
Cash flow
-2.6%
Cash-on-Cash Return
5.6%
Cap rate
0.7%
Rent to Value Ratio

Active
$330,000
4
bds
|
3
ba
|
1,944
sqft
|
built
1973
1102 Fox Hill Dr, Indianapolis, IN 46228
$-103
Cash flow
-1.6%
Cash-on-Cash Return
5.8%
Cap rate
0.7%
Rent to Value Ratio
Active
$249,500
4
bds
|
2
ba
|
1,788
sqft
|
built
1976
7402 Broadview Dr, Indianapolis, IN 46227
$-36
Cash flow
-0.8%
Cash-on-Cash Return
6.0%
Cap rate
0.7%
Rent to Value Ratio
Active
$209,900
3
bds
|
2
ba
|
1,078
sqft
|
built
1930
1411 N Grant Ave, Indianapolis, IN 46201
$374
Cash flow
9.3%
Cash-on-Cash Return
8.3%
Cap rate
1.0%
Rent to Value Ratio
Active
$181,999
3
bds
|
2
ba
|
912
sqft
|
built
1950
3614 N Whittier Pl, Indianapolis, IN 46218
$-104
Cash flow
-3.0%
Cash-on-Cash Return
5.5%
Cap rate
0.7%
Rent to Value Ratio

Pending
$372,000
3
bds
|
2
ba
|
2,439
sqft
|
built
2004
2769 S 800 W, Indianapolis, IN 46239
$-319
Cash flow
-4.5%
Cash-on-Cash Return
5.1%
Cap rate
0.6%
Rent to Value Ratio

Pending
$259,900
2
bds
|
2
ba
|
1,712
sqft
|
built
2004
10668 Whippoorwill Ln, Indianapolis, IN 46231
$-34
Cash flow
-0.7%
Cash-on-Cash Return
6.0%
Cap rate
0.8%
Rent to Value Ratio

Active
$399,900
5
bds
|
3
ba
|
2,081
sqft
|
built
1957
5609 Meadowood Dr, Indianapolis, IN 46224
$-875
Cash flow
-11.4%
Cash-on-Cash Return
3.5%
Cap rate
0.4%
Rent to Value Ratio

Pending
$1,099,900
4
bds
|
5
ba
|
9,322
sqft
|
built
1992
7624 William Penn Pl, Indianapolis, IN 46256
$-2,351
Cash flow
-11.2%
Cash-on-Cash Return
3.6%
Cap rate
0.5%
Rent to Value Ratio

Pending
$274,900
3
bds
|
2
ba
|
2,200
sqft
|
built
1976
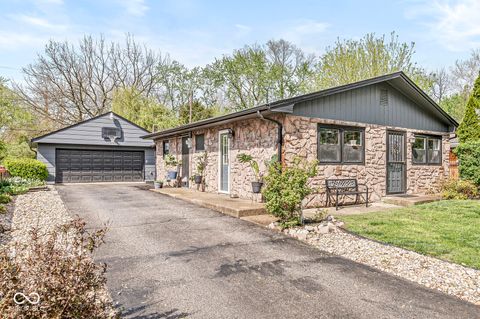
4718 Dancer Dr, Indianapolis, IN 46237
$-166
Cash flow
-3.2%
Cash-on-Cash Return
5.4%
Cap rate
0.7%
Rent to Value Ratio
Pending
$80,000
3
bds
|
2
ba
|
1,342
sqft
|
built
1959
3845 N Irvington Ave, Indianapolis, IN 46226
$694
Cash flow
45.3%
Cash-on-Cash Return
16.6%
Cap rate
2.0%
Rent to Value Ratio

Active
$615,000
3
bds
|
4
ba
|
2,374
sqft
|
built
2023
711 E 16th St, Indianapolis, IN 46202
$-841
Cash flow
-7.1%
Cash-on-Cash Return
4.5%
Cap rate
0.6%
Rent to Value Ratio

Pending
$270,000
3
bds
|
2
ba
|
1,579
sqft
|
built
1995
7215 Wet Rock Ct, Indianapolis, IN 46236
$-3
Cash flow
-0.1%
Cash-on-Cash Return
6.1%
Cap rate
0.7%
Rent to Value Ratio

Active
$259,900
3
bds
|
2
ba
|
1,377
sqft
|
built
1965
2951 S Elizabeth St, Indianapolis, IN 46203
$-227
Cash flow
-4.6%
Cash-on-Cash Return
5.1%
Cap rate
0.6%
Rent to Value Ratio

Active
$124,900
3
bds
|
1
ba
|
1,624
sqft
|
built
1920
1163 Groff Ave, Indianapolis, IN 46222
$326
Cash flow
13.6%
Cash-on-Cash Return
9.3%
Cap rate
1.1%
Rent to Value Ratio

Active
$564,999
4
bds
|
3
ba
|
3,982
sqft
|
built
1961
11603 Maze Rd, Indianapolis, IN 46259
$-962
Cash flow
-8.9%
Cash-on-Cash Return
4.1%
Cap rate
0.5%
Rent to Value Ratio

Active
$264,500
4
bds
|
2
ba
|
1,628
sqft
|
built
1968
1543 W 79th St, Indianapolis, IN 46260
$25
Cash flow
0.5%
Cash-on-Cash Return
6.3%
Cap rate
0.8%
Rent to Value Ratio

Pending
$273,500
3
bds
|
2
ba
|
1,440
sqft
|
built
1999
6529 Lakesedge Dr, Indianapolis, IN 46237
$-190
Cash flow
-3.6%
Cash-on-Cash Return
5.3%
Cap rate
0.7%
Rent to Value Ratio