Indianapolis, IN Investment Properties for Sale
Browse homes for sale and investment properties in Indianapolis, IN. Refine your search by price, property type, or more.
Best cash flowing properties in Indianapolis, IN
Active
$43,000
bds
|
0
ba
|
576
sqft
|
built
1995
1254 S Leland Ave, Indianapolis, IN 46203
$759
Cash flow
20.6%
Cash-on-Cash Return
21.2%
Cap rate
2.6%
Rent to Value Ratio
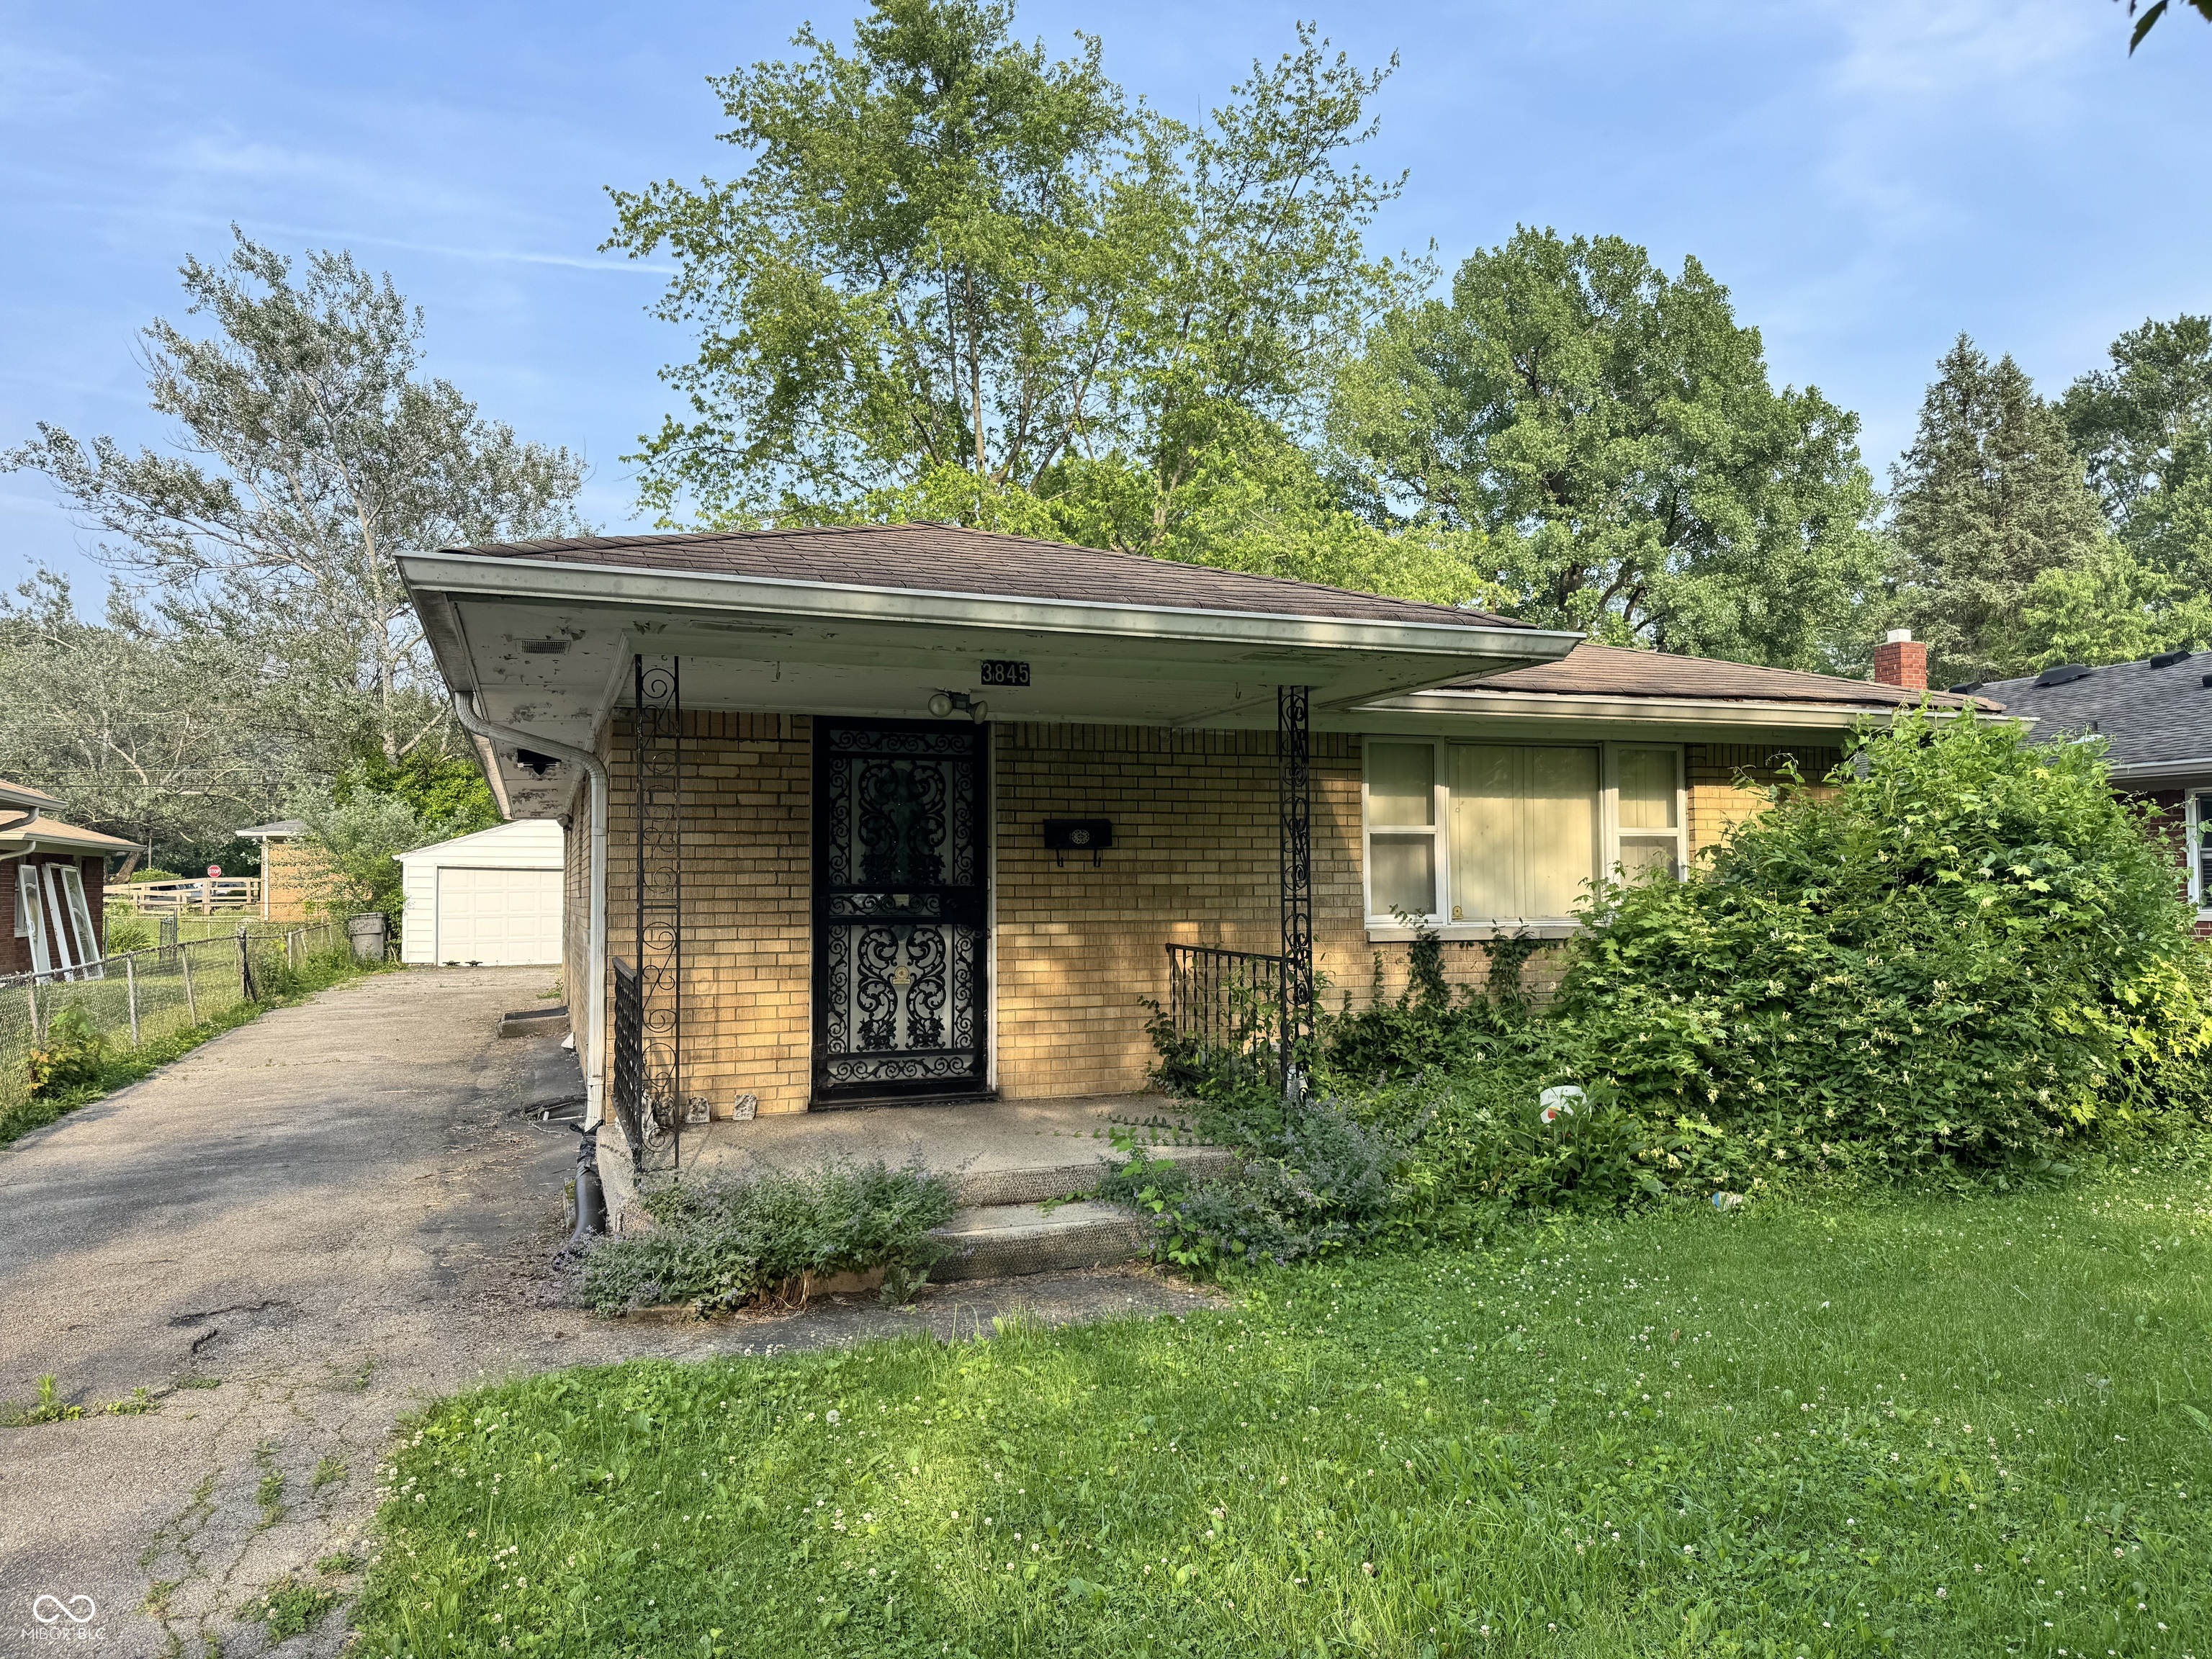
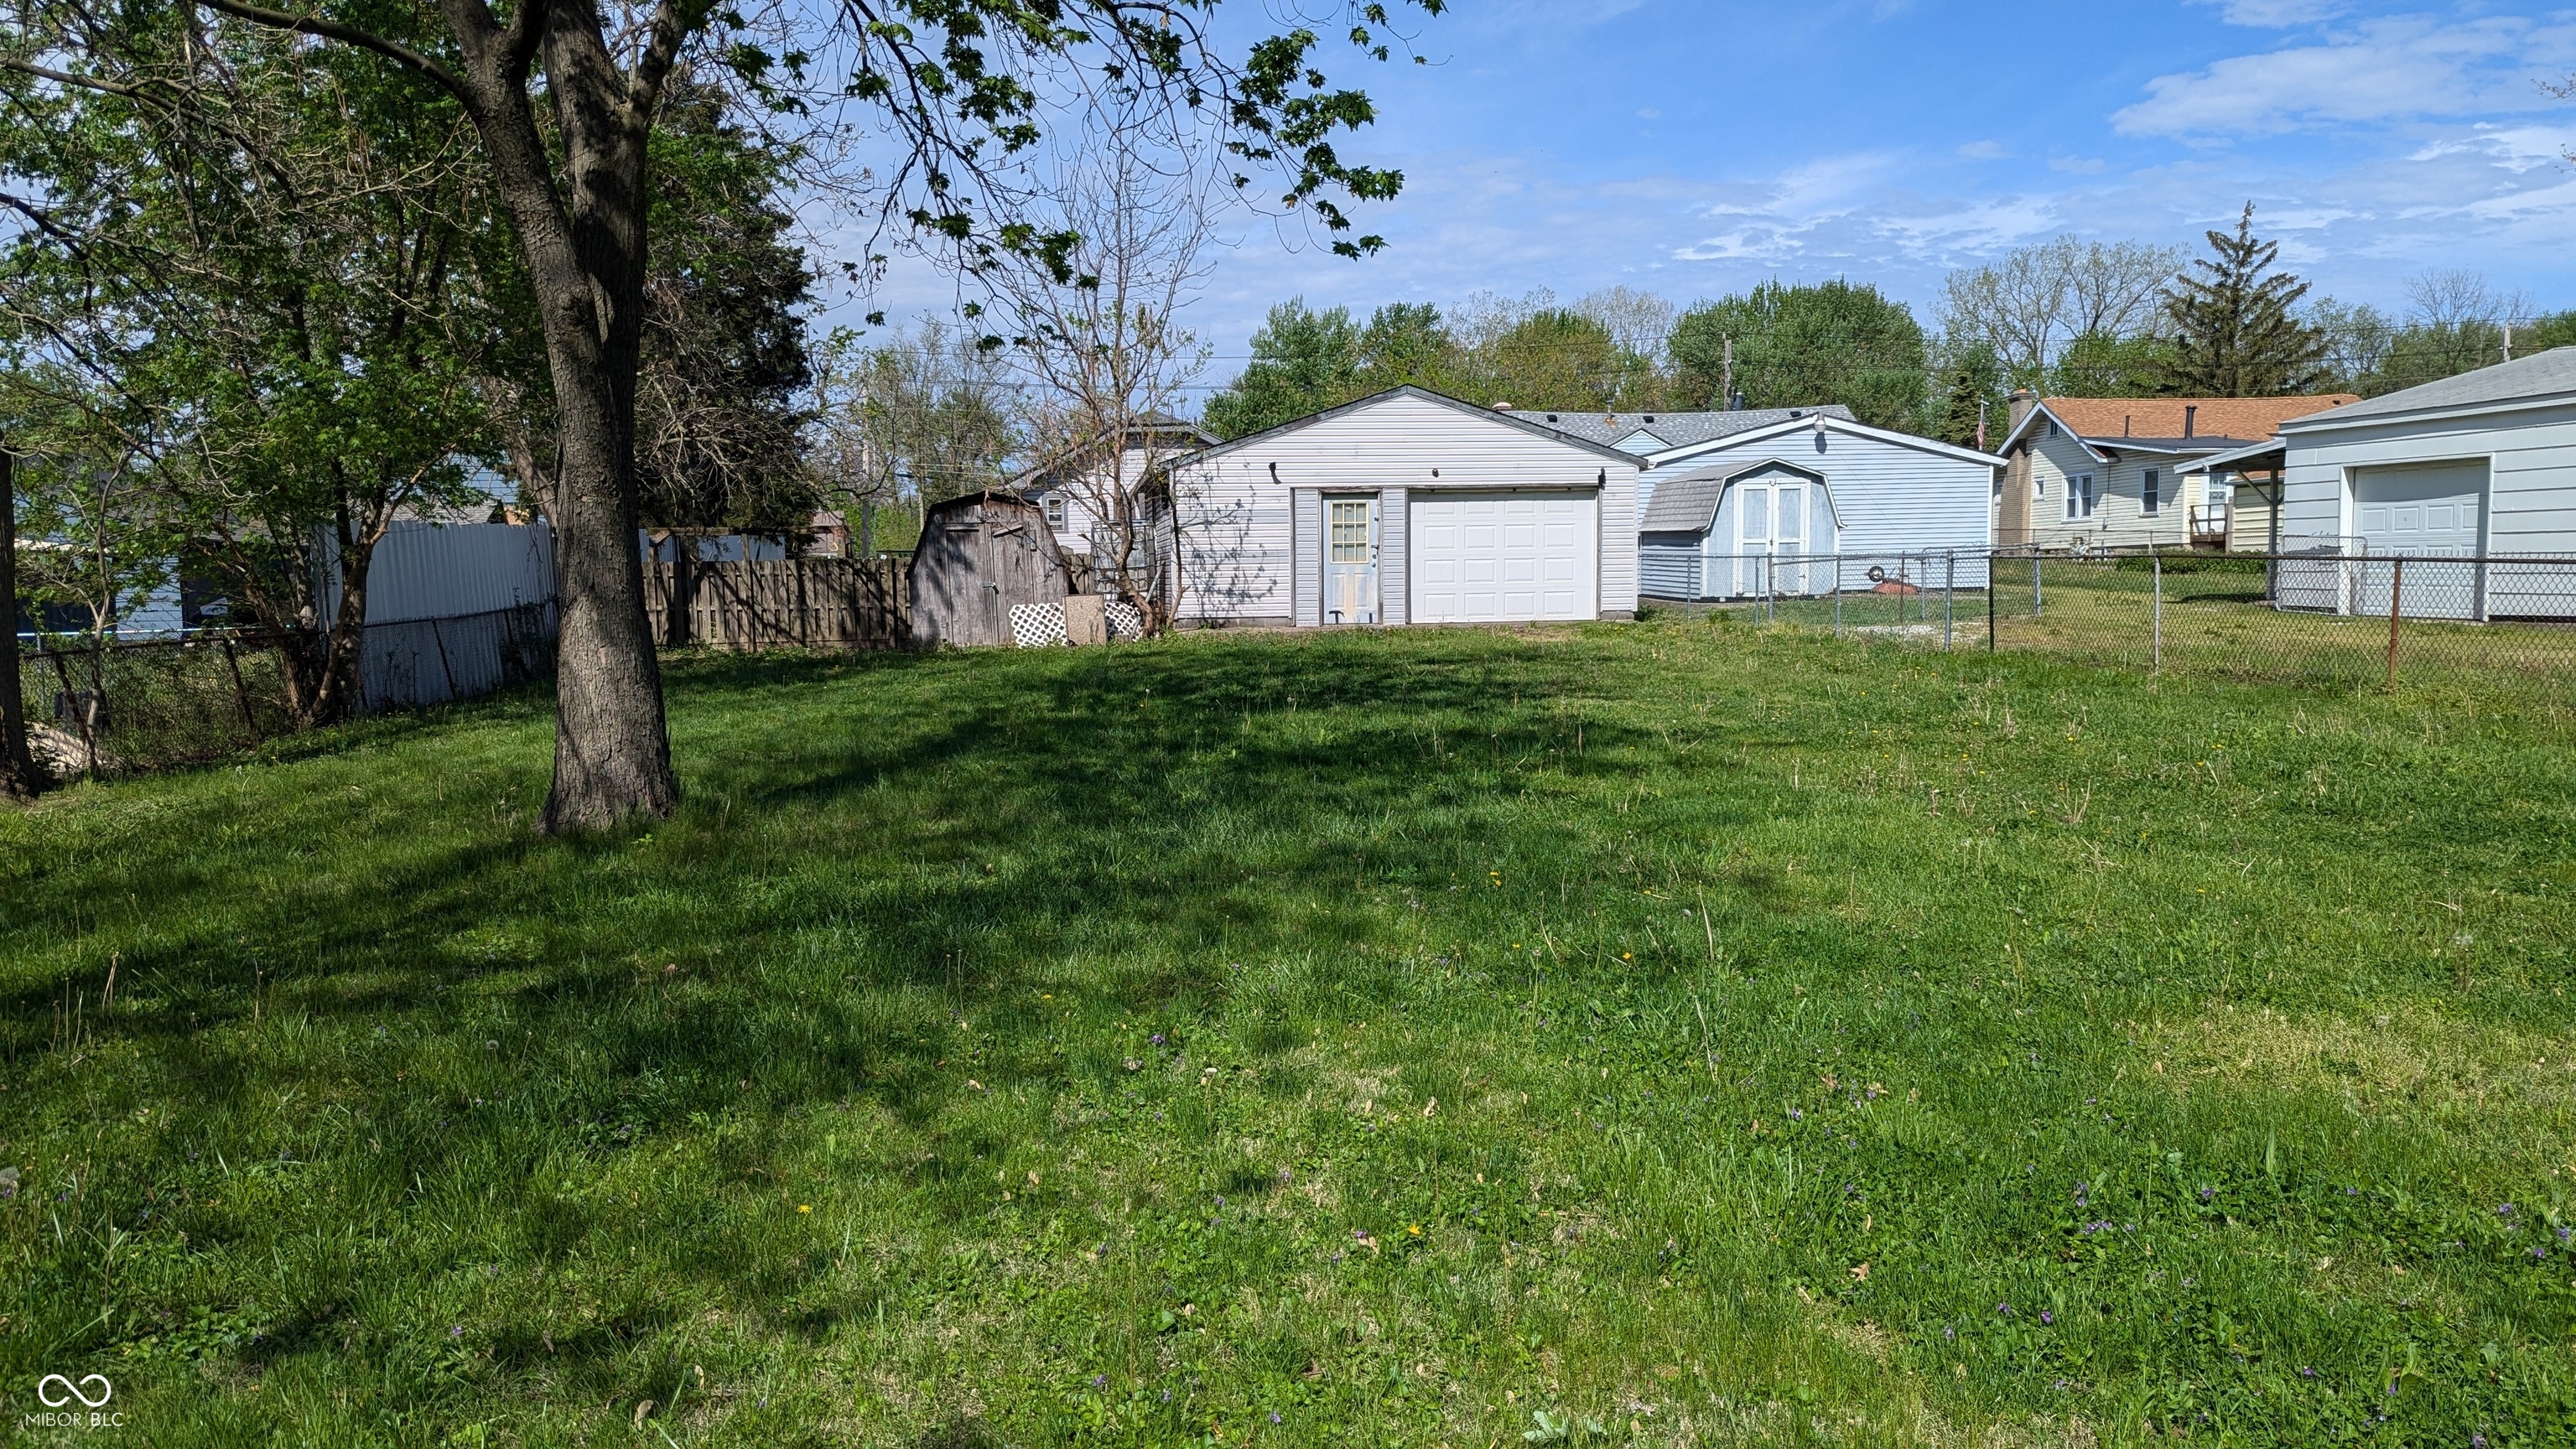
Pending
$80,000
3
bds
|
2
ba
|
1,342
sqft
|
built
1959
3845 N Irvington Ave, Indianapolis, IN 46226
$694
Cash flow
45.3%
Cash-on-Cash Return
16.6%
Cap rate
2.0%
Rent to Value Ratio
1,984 out of 2,125 properties for sale in Indianapolis, IN
Limited Results Shown
Create a free account, or log in to reveal all property listings and enjoy the complete experience.
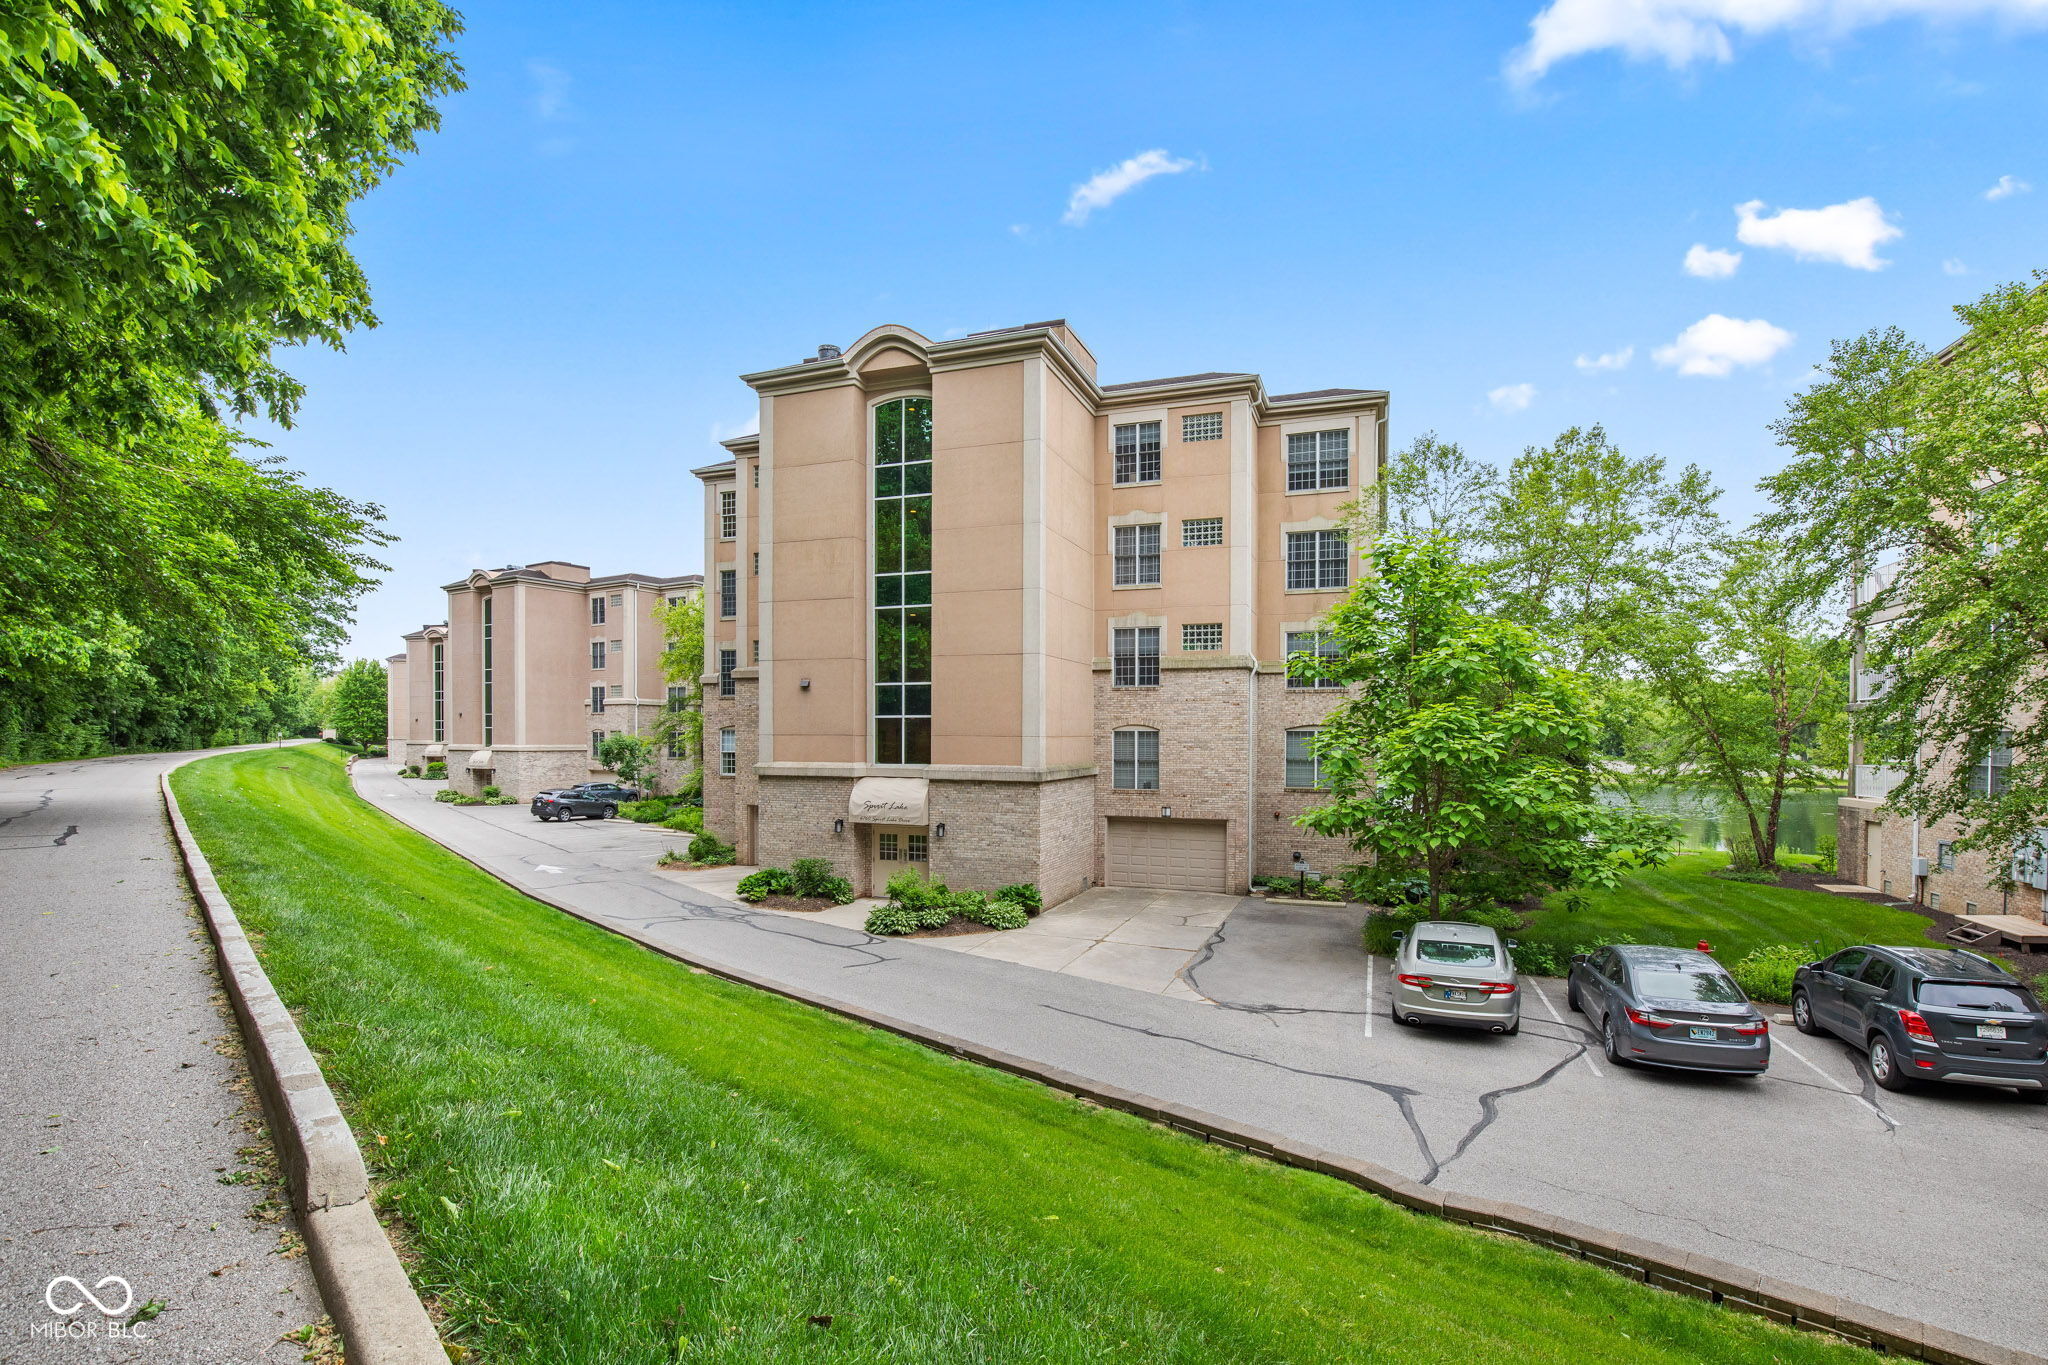
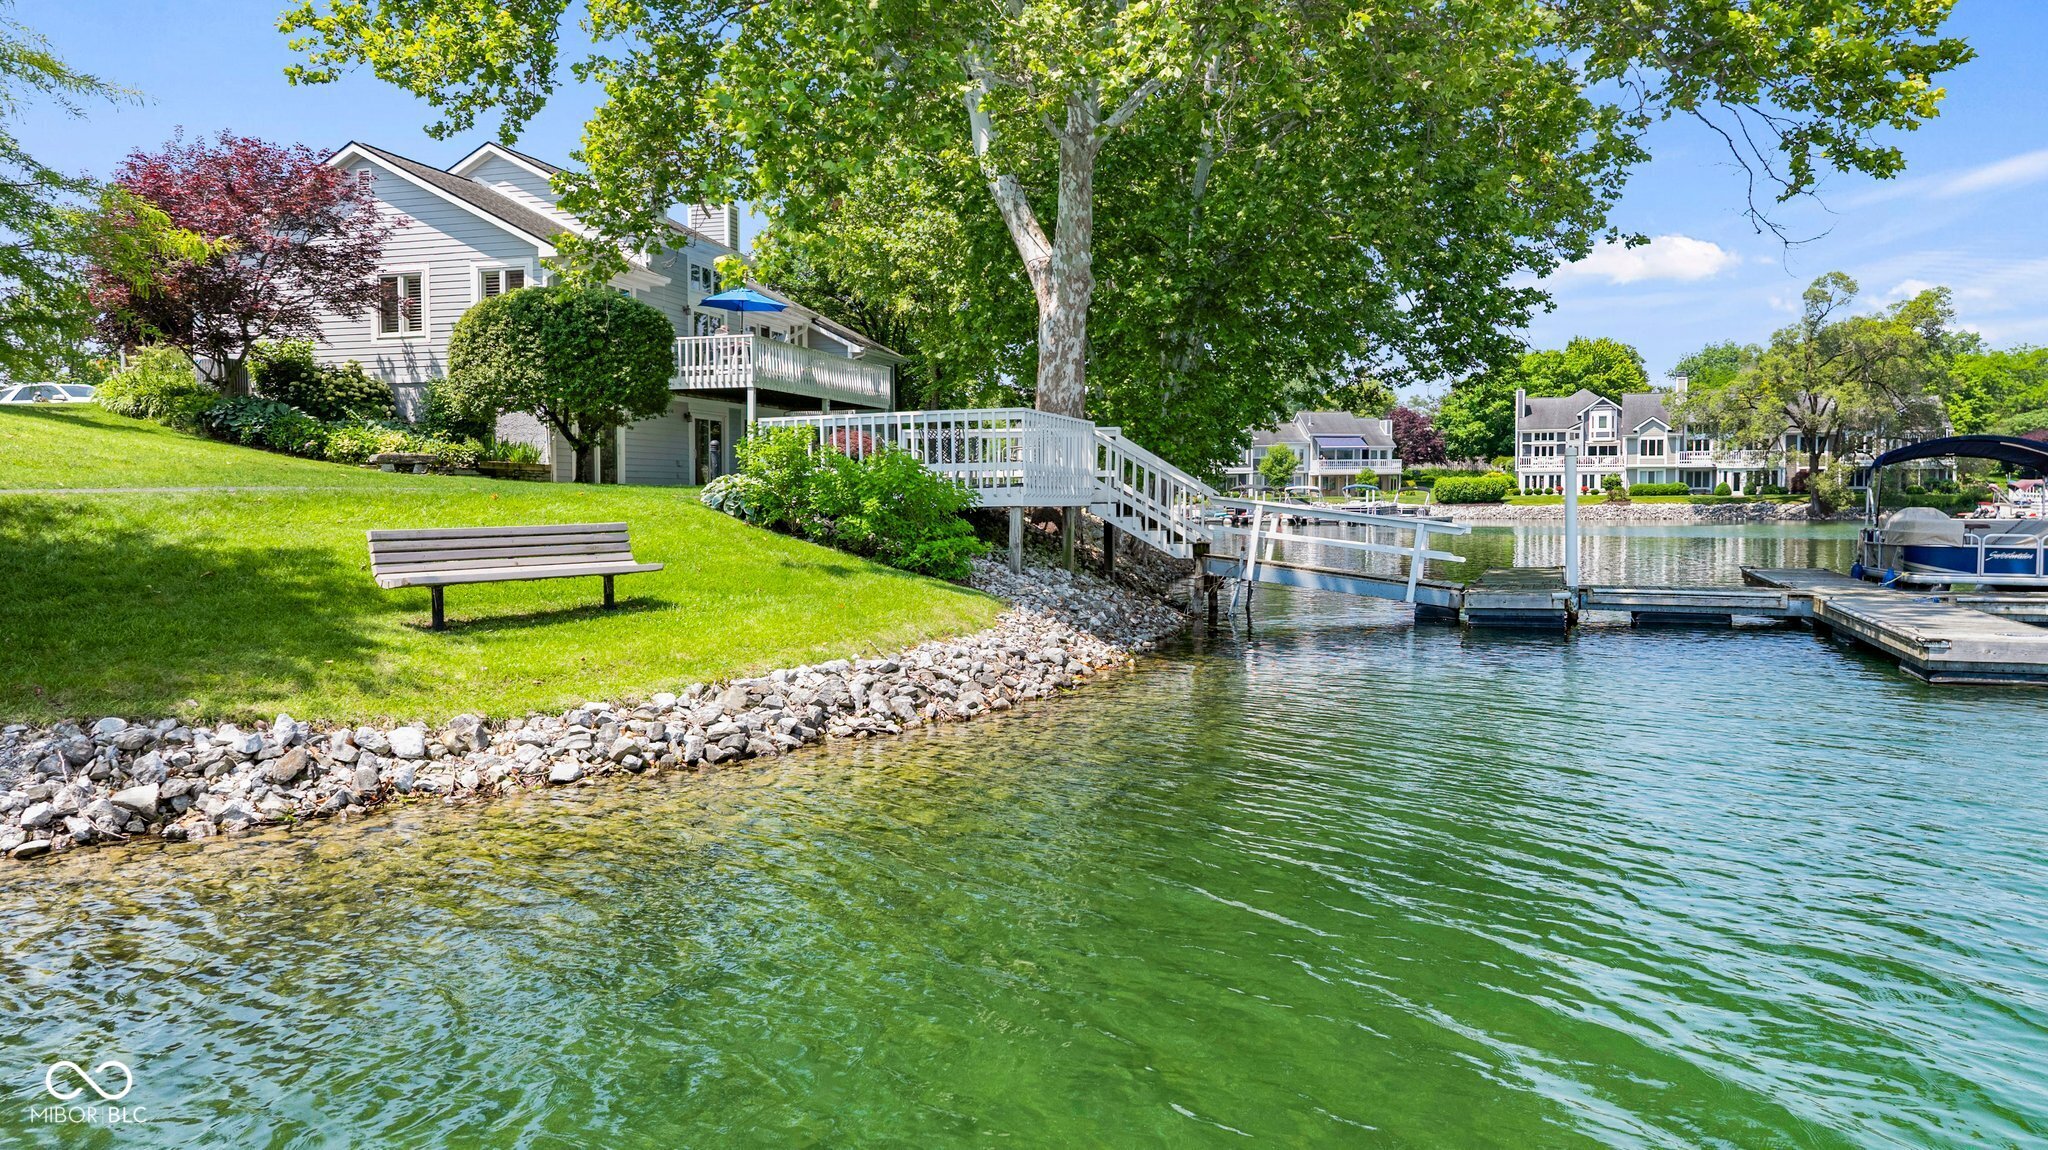
Active
$525,000
3
bds
|
3
ba
|
2,472
sqft
|
built
2002
6760 Spirit Lake Dr, Indianapolis, IN 46220
$-1,528
Cash flow
-15.2%
Cash-on-Cash Return
2.7%
Cap rate
0.6%
Rent to Value Ratio
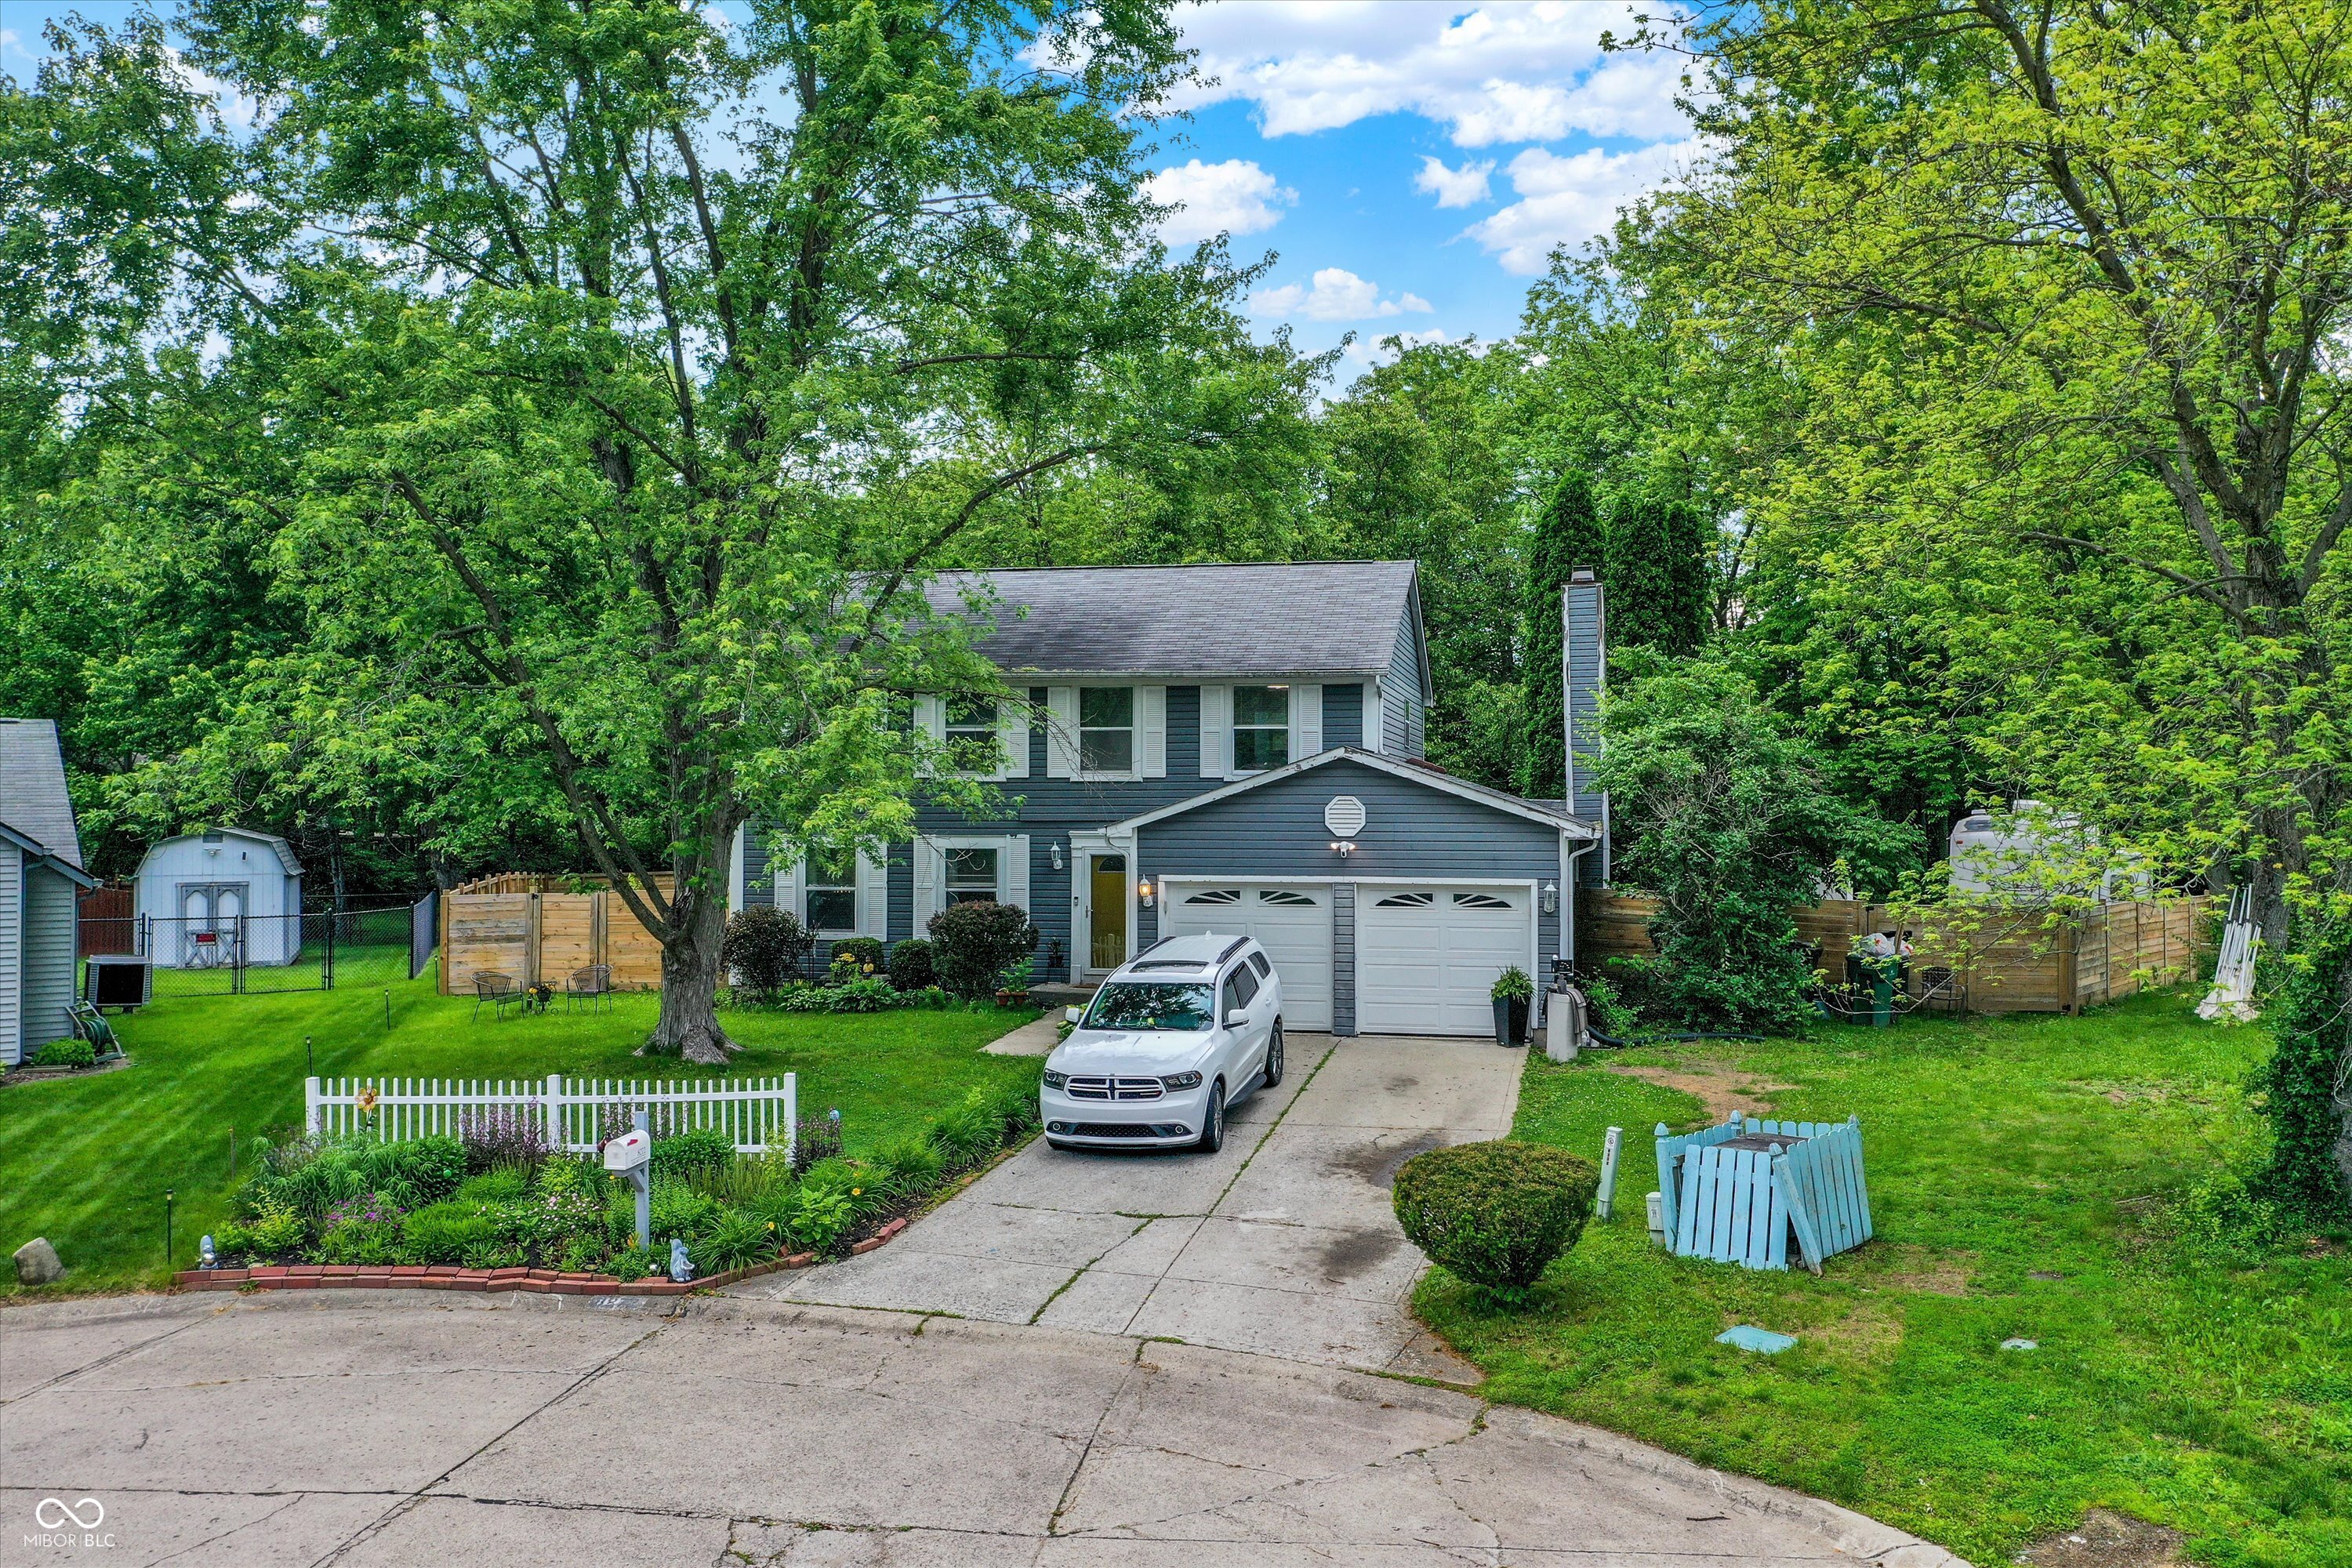
Pending
$310,000
4
bds
|
3
ba
|
1,996
sqft
|
built
1986
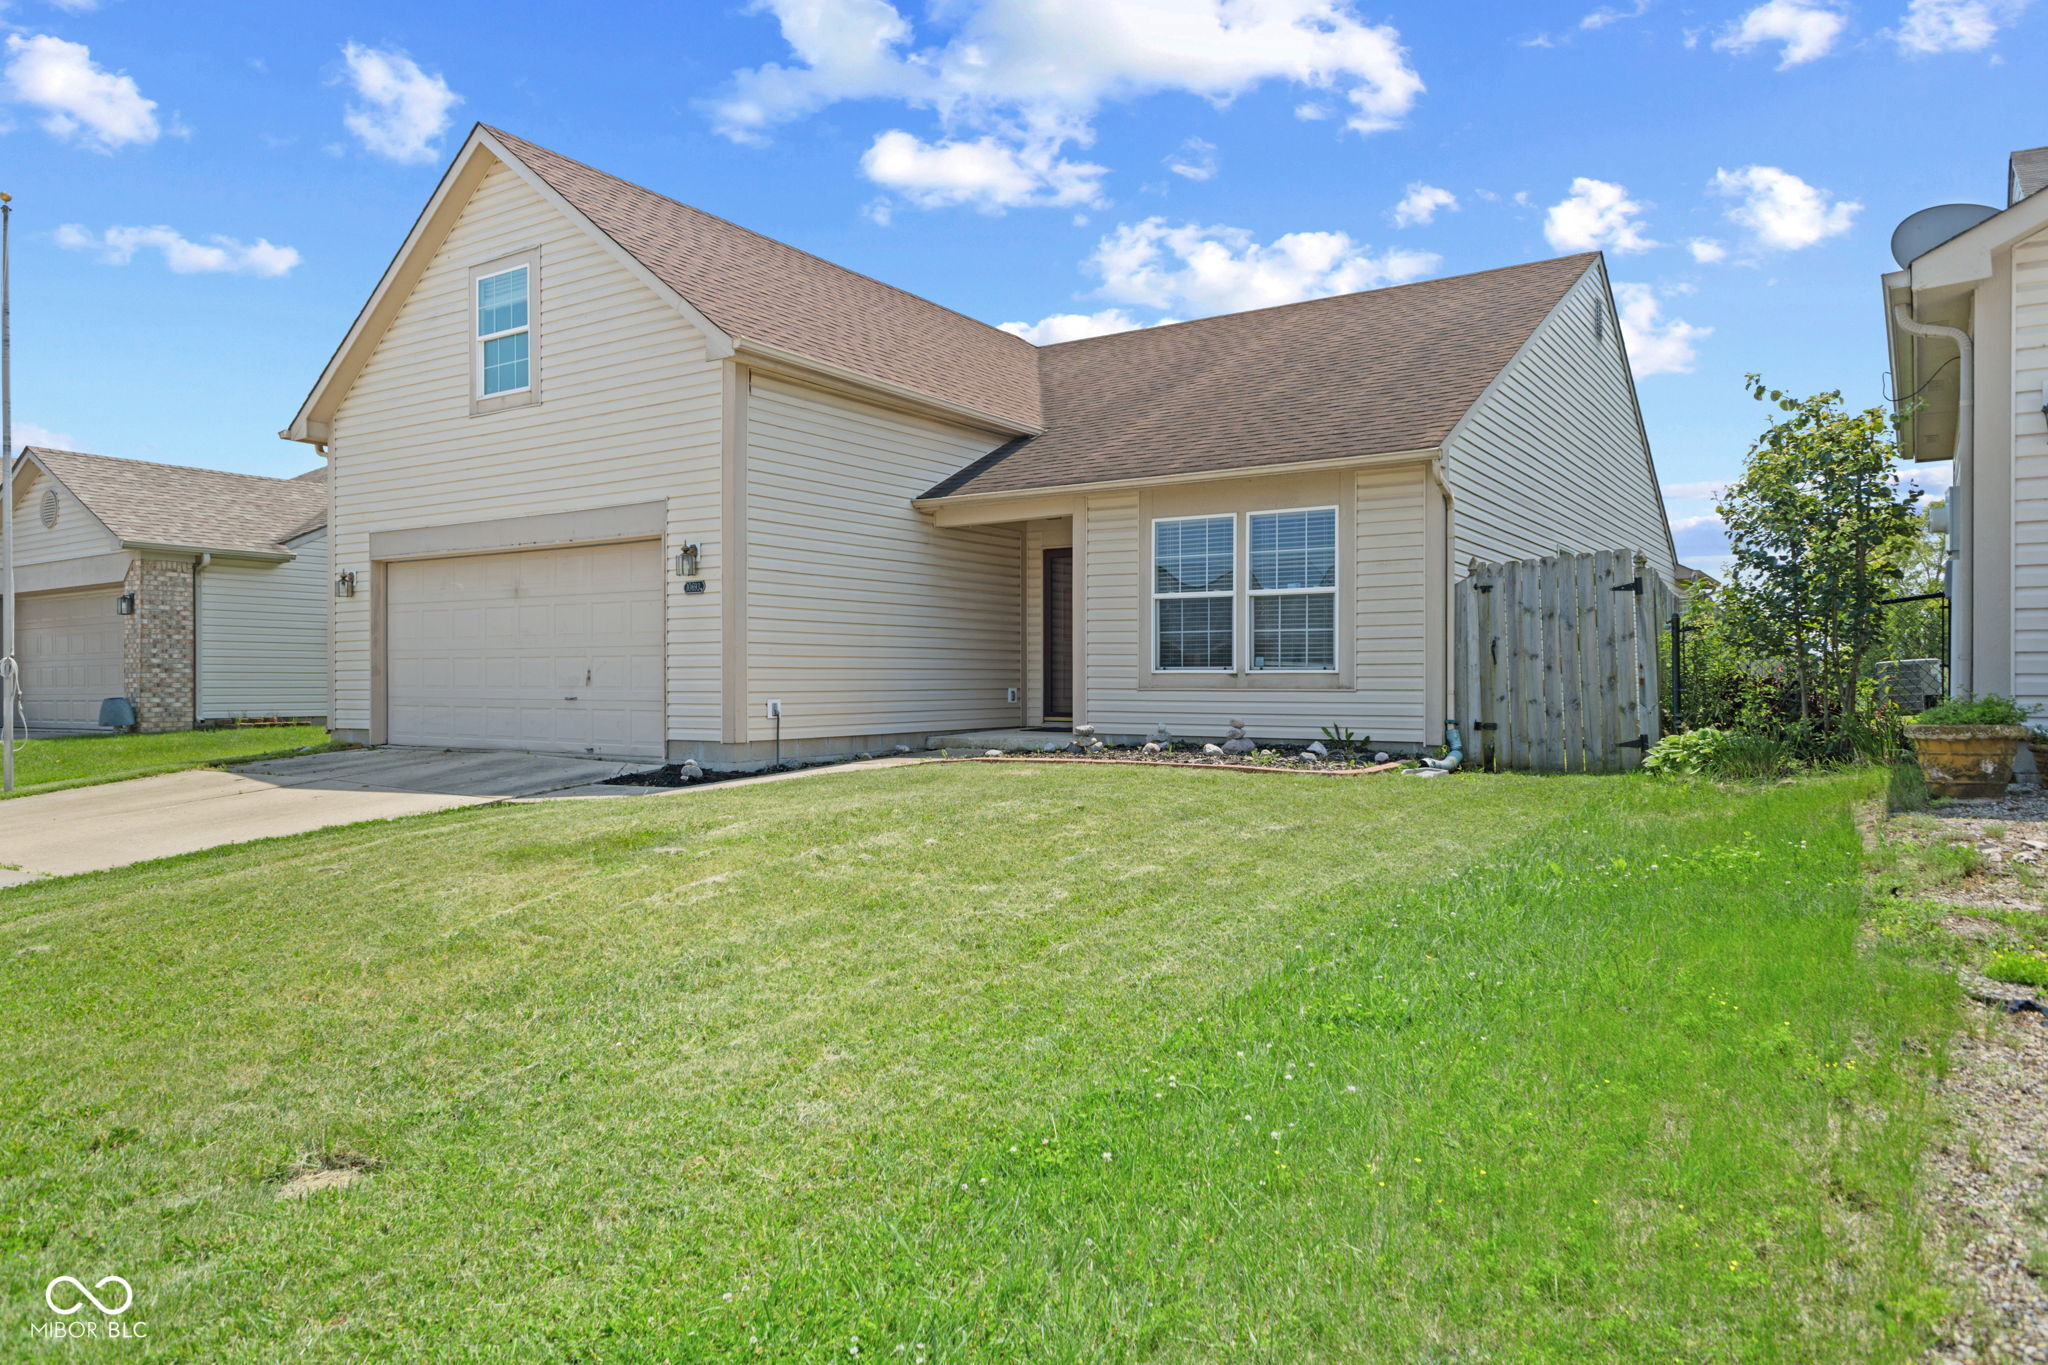
8272 Calgary Ct, Indianapolis, IN 46268
$-70
Cash flow
-1.2%
Cash-on-Cash Return
5.9%
Cap rate
0.7%
Rent to Value Ratio
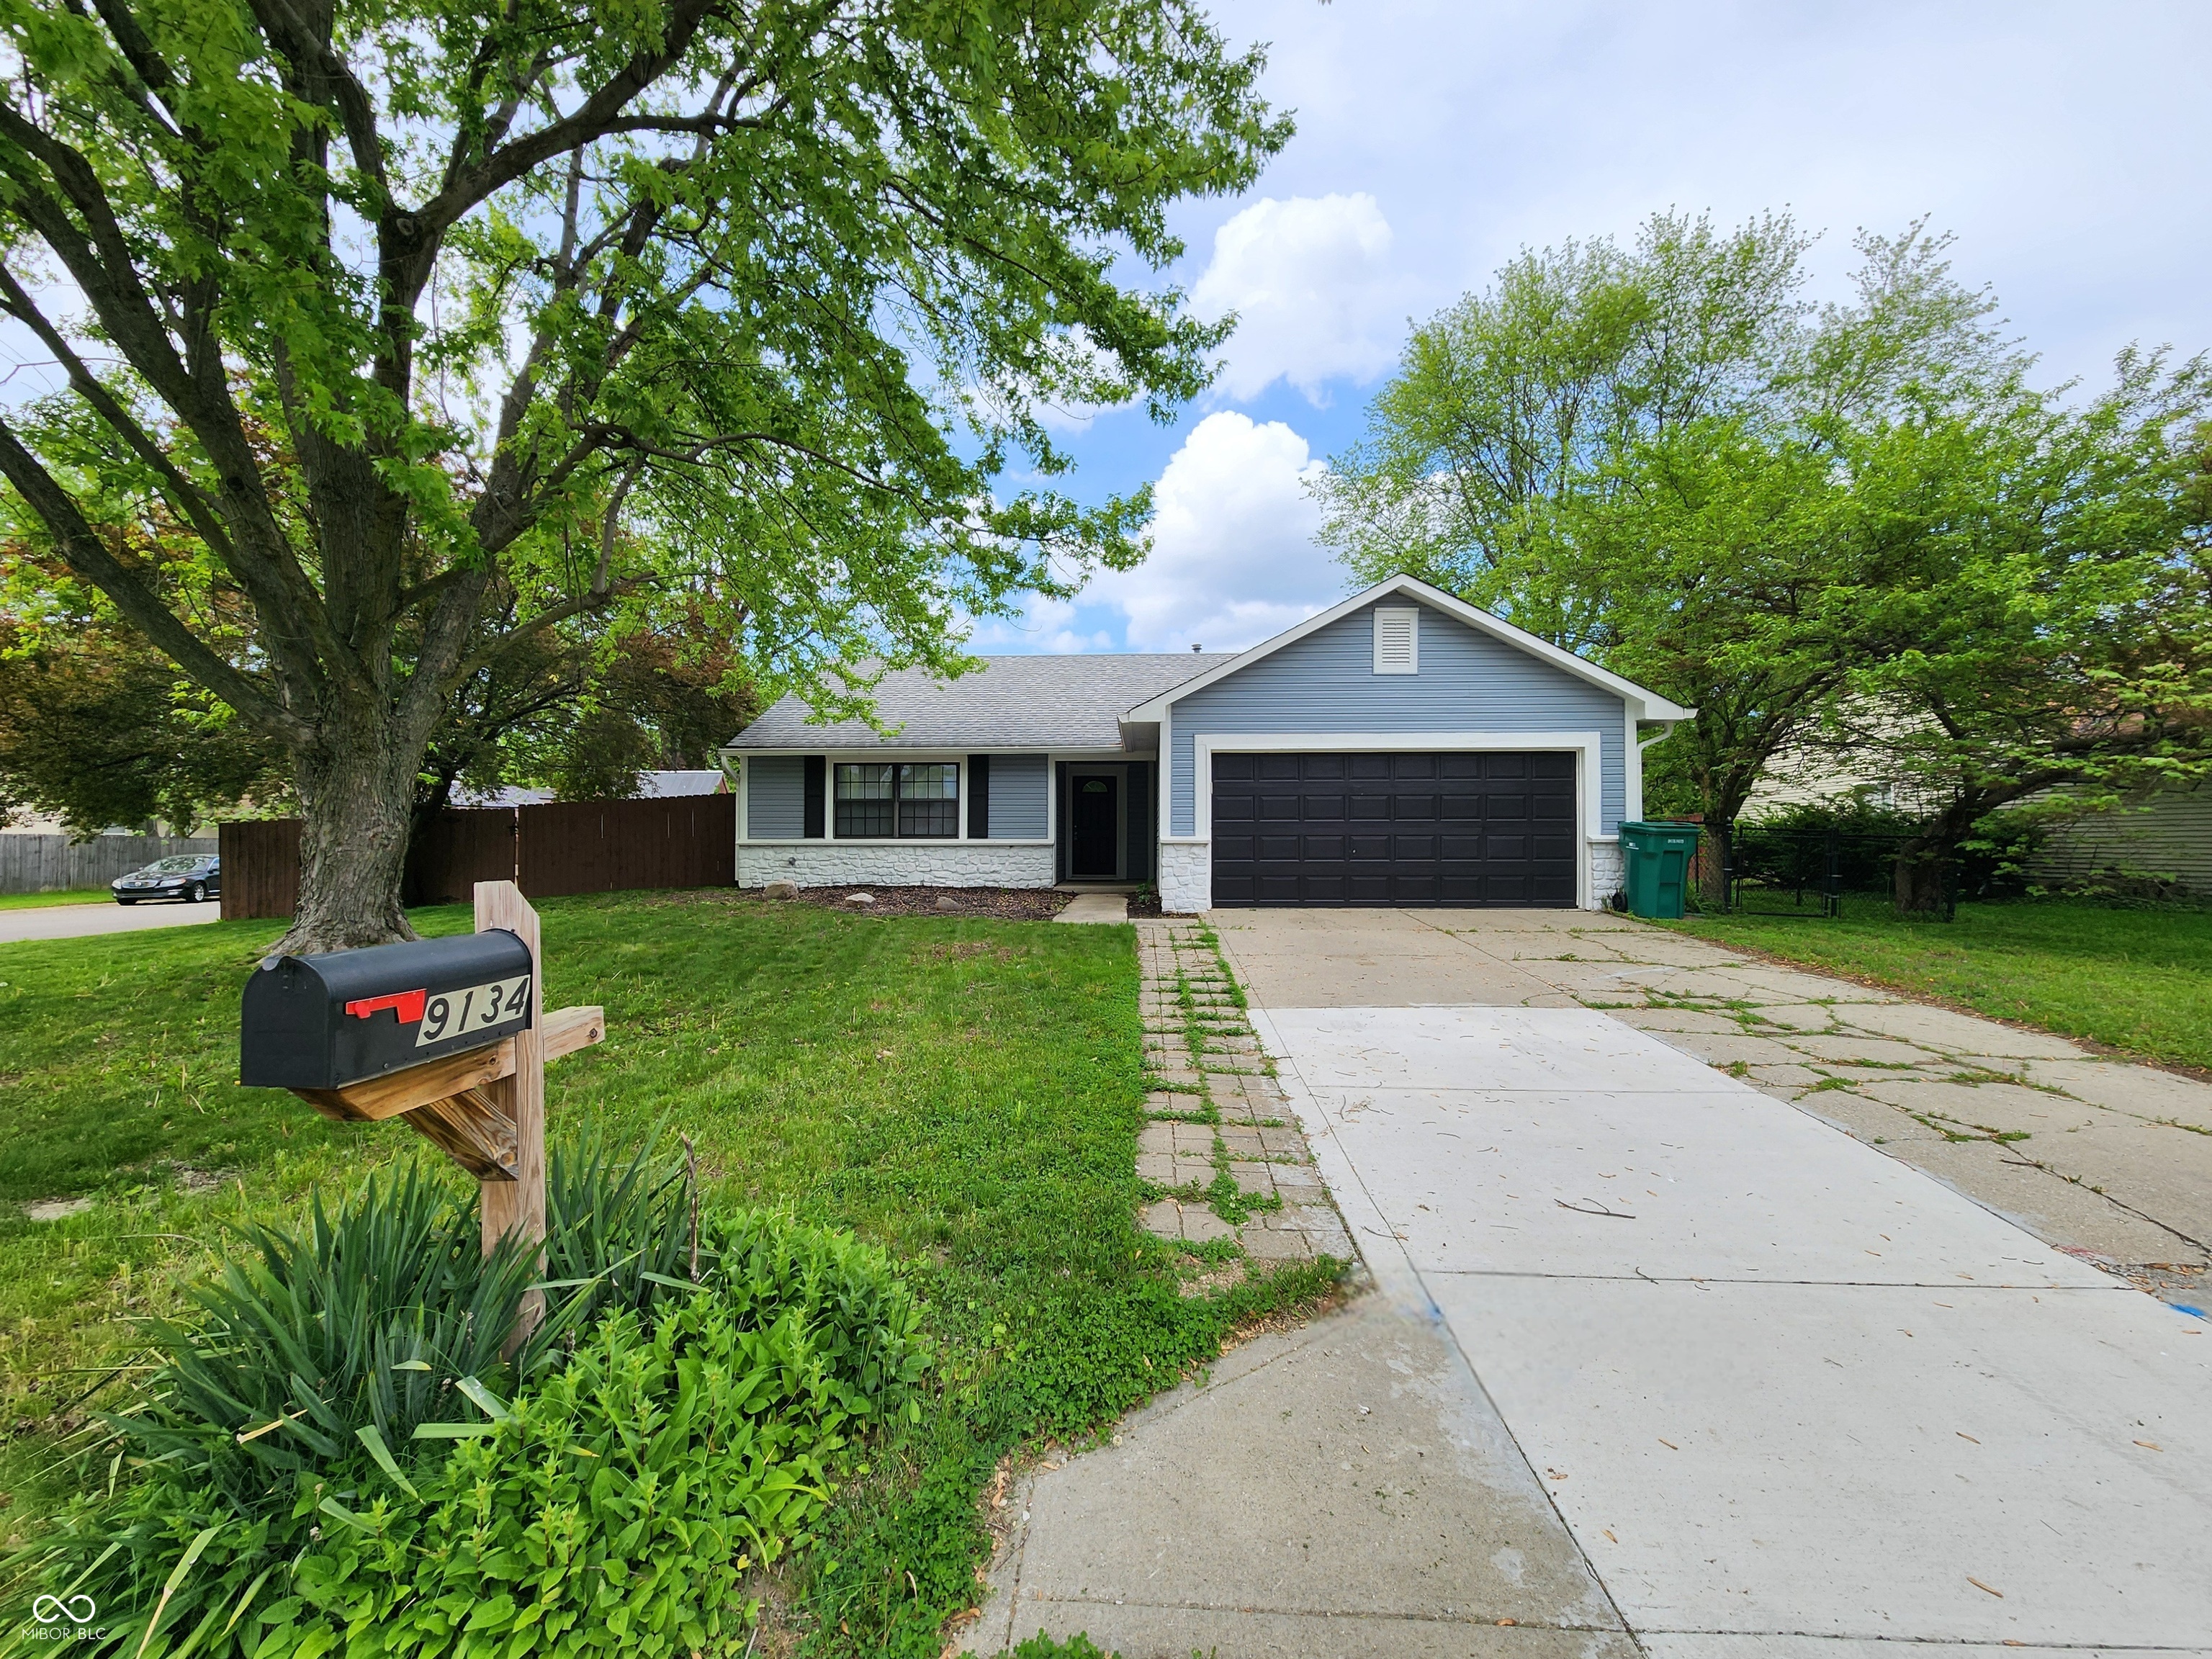
Active
$260,000
3
bds
|
2
ba
|
1,232
sqft
|
built
1990
9134 Jene Ct, Indianapolis, IN 46234
$-99
Cash flow
-2.0%
Cash-on-Cash Return
5.7%
Cap rate
0.7%
Rent to Value Ratio
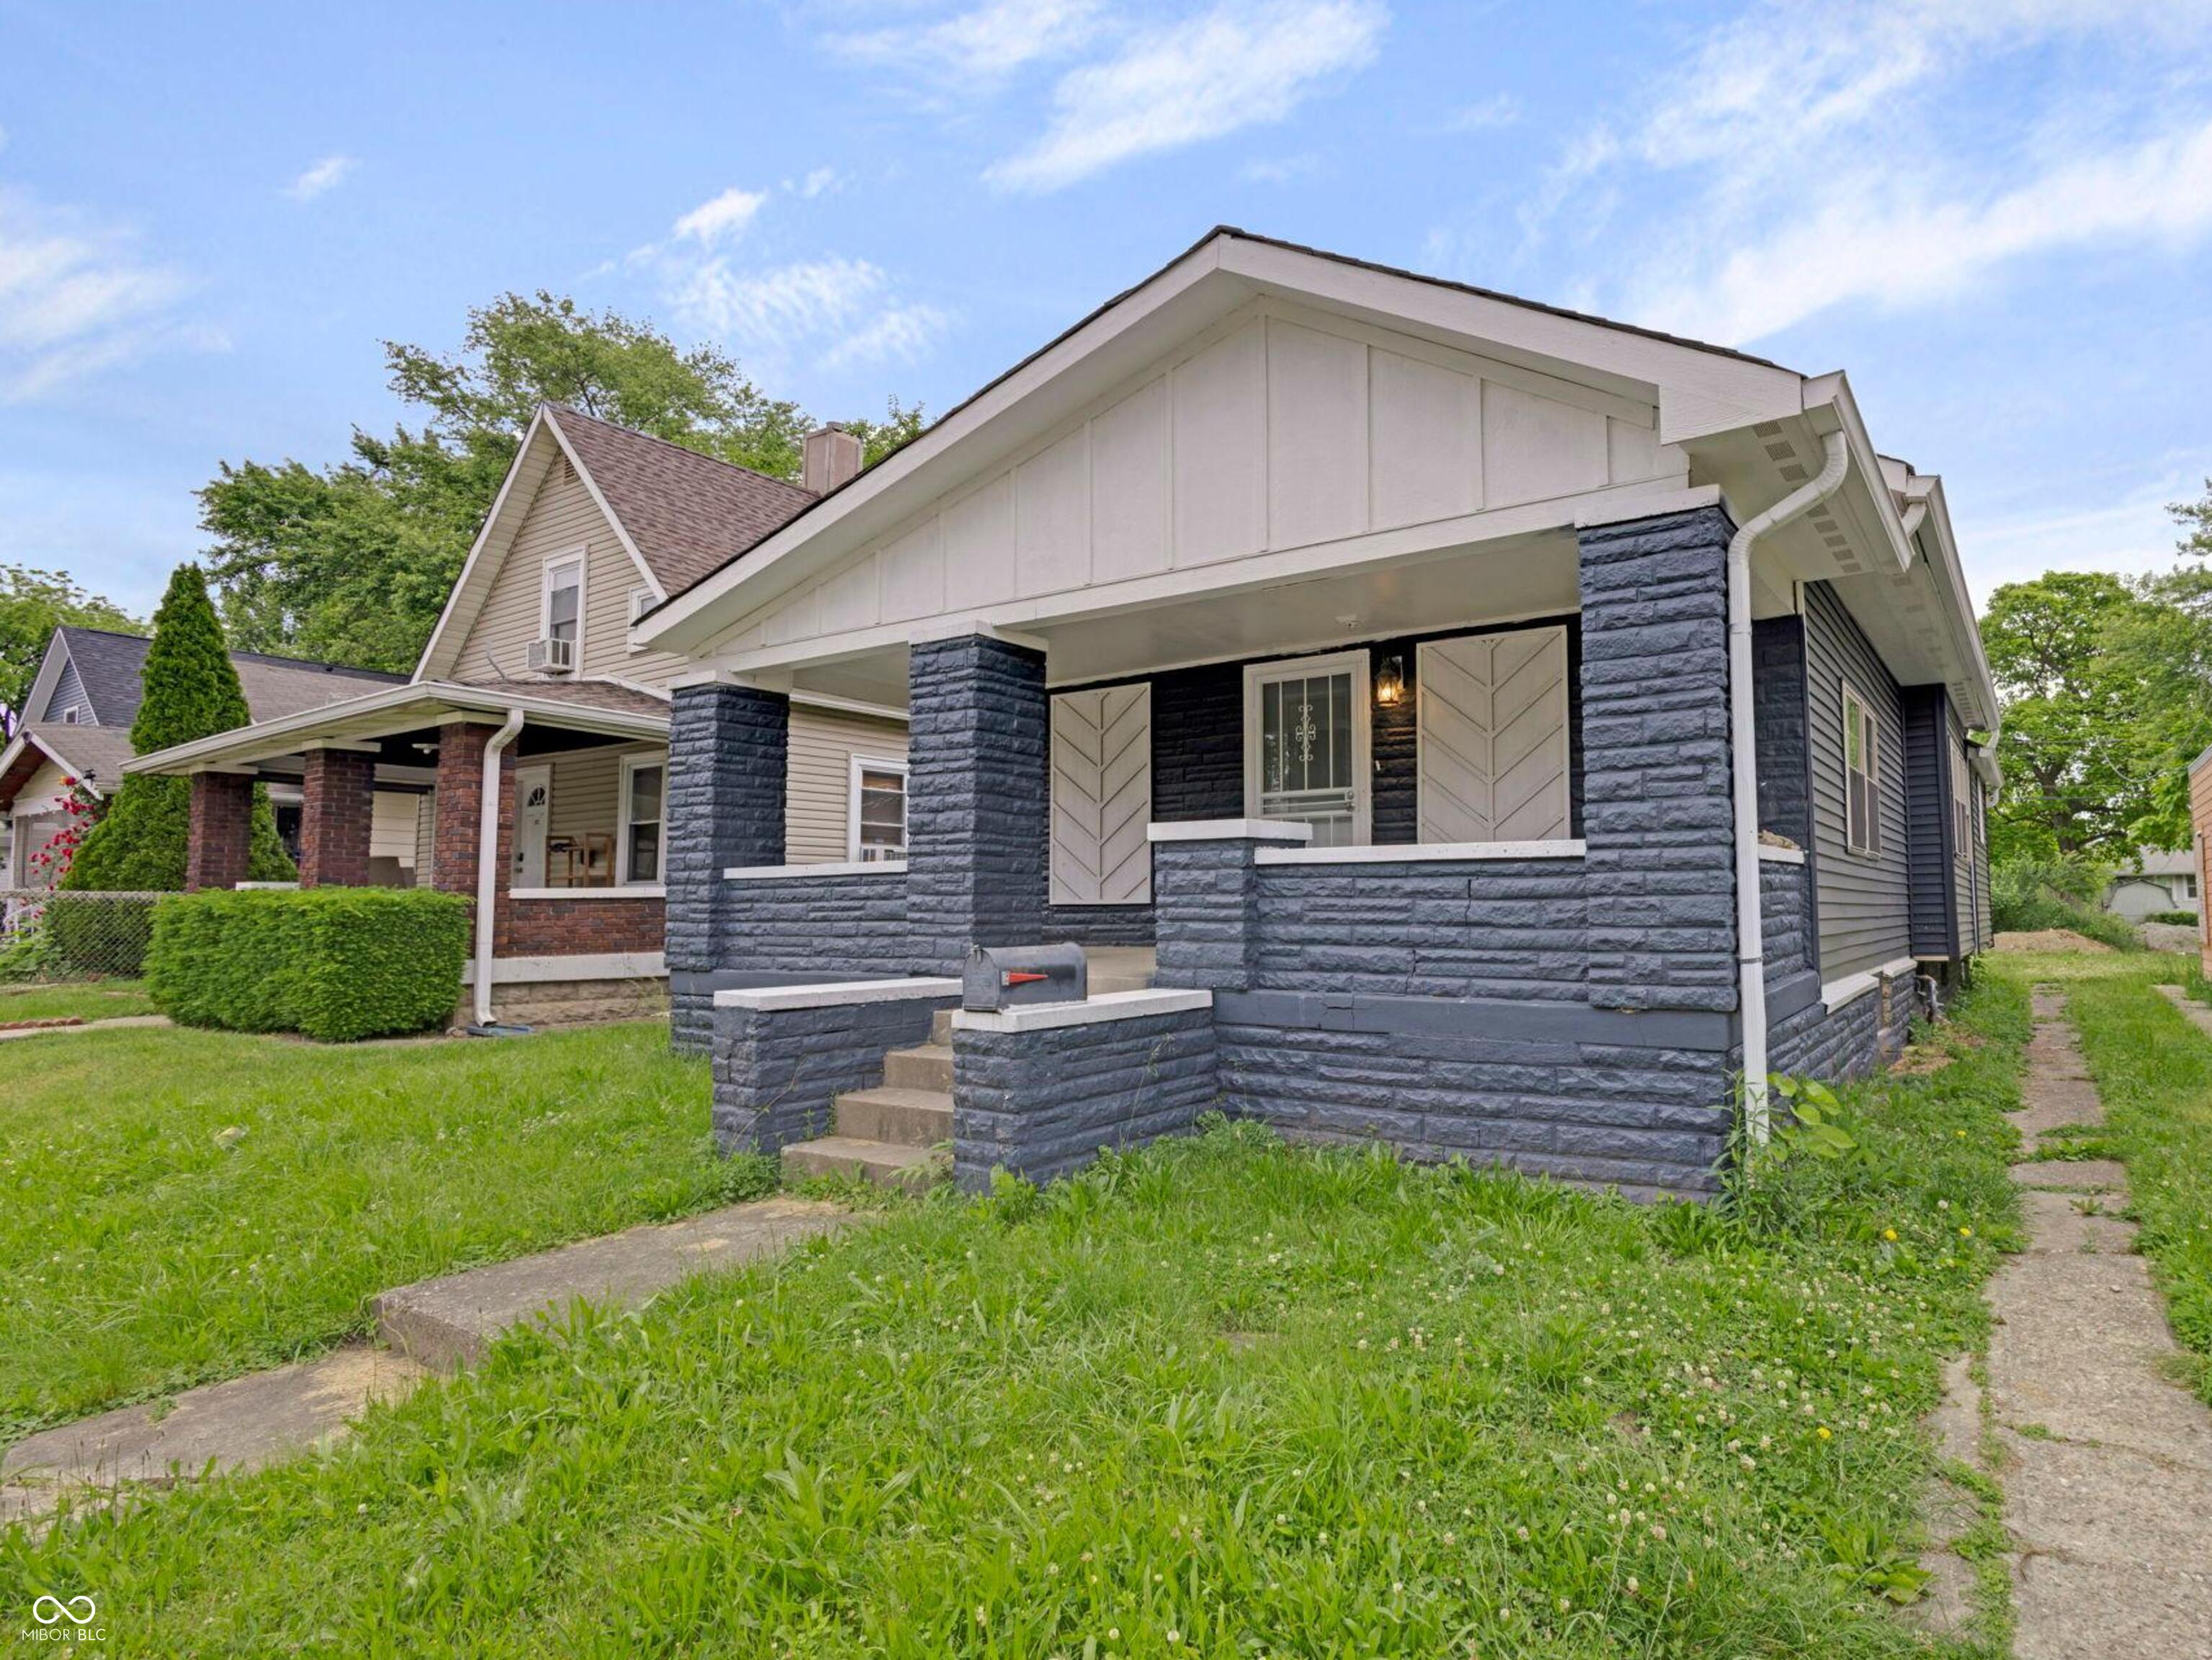
Active
$209,900
3
bds
|
2
ba
|
1,078
sqft
|
built
1930
1411 N Grant Ave, Indianapolis, IN 46201
$374
Cash flow
9.3%
Cash-on-Cash Return
8.3%
Cap rate
1.0%
Rent to Value Ratio
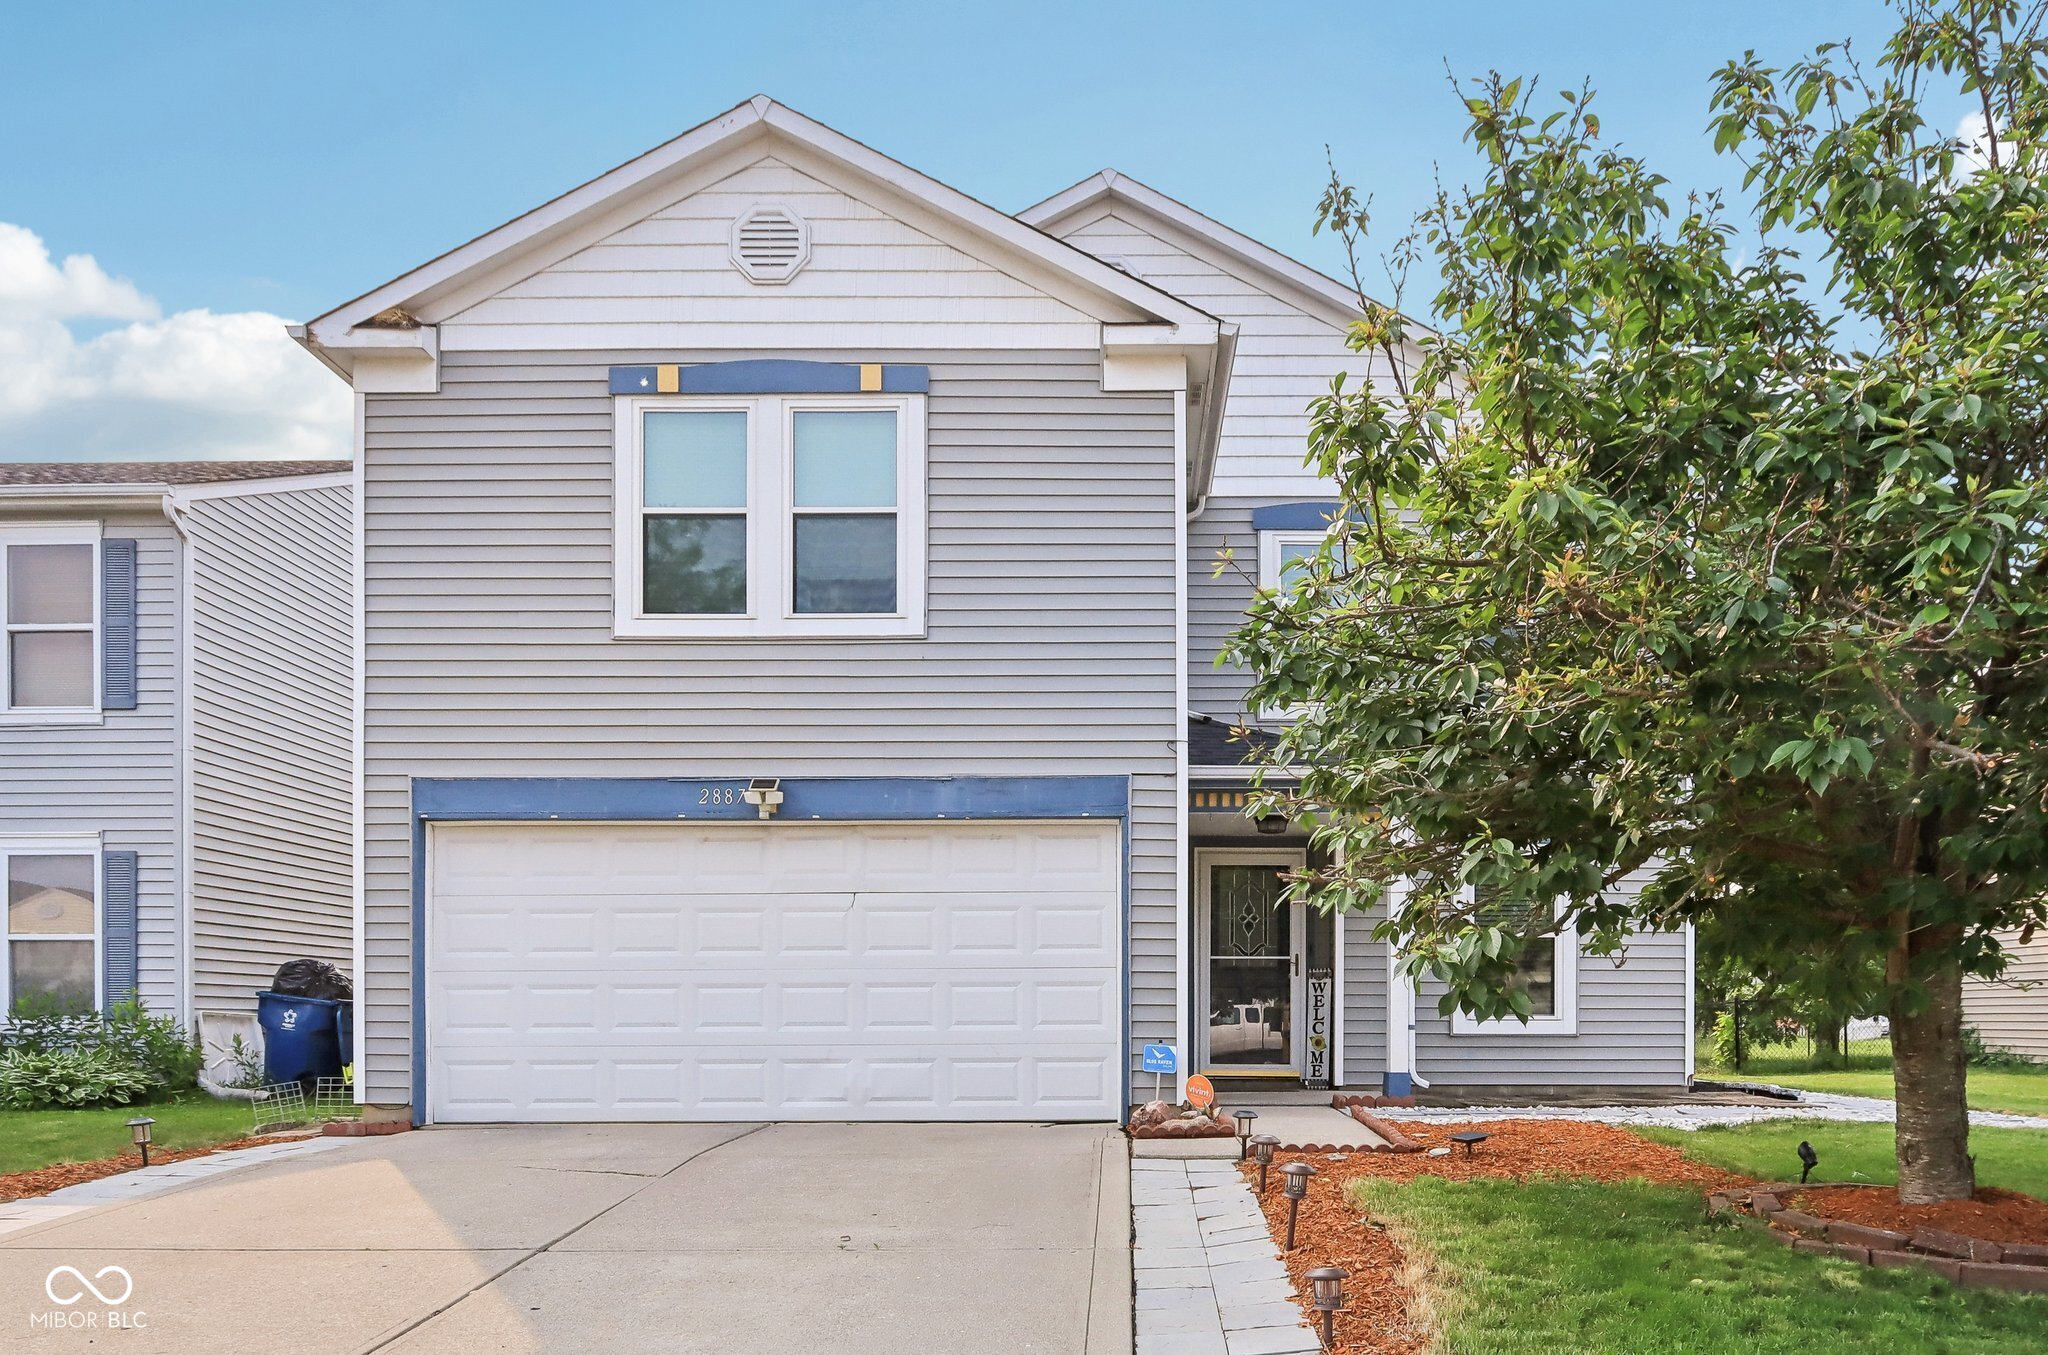
Active
$290,000
3
bds
|
3
ba
|
2,030
sqft
|
built
2005
2887 Ludwig Dr, Indianapolis, IN 46239
$-143
Cash flow
-2.6%
Cash-on-Cash Return
5.6%
Cap rate
0.7%
Rent to Value Ratio
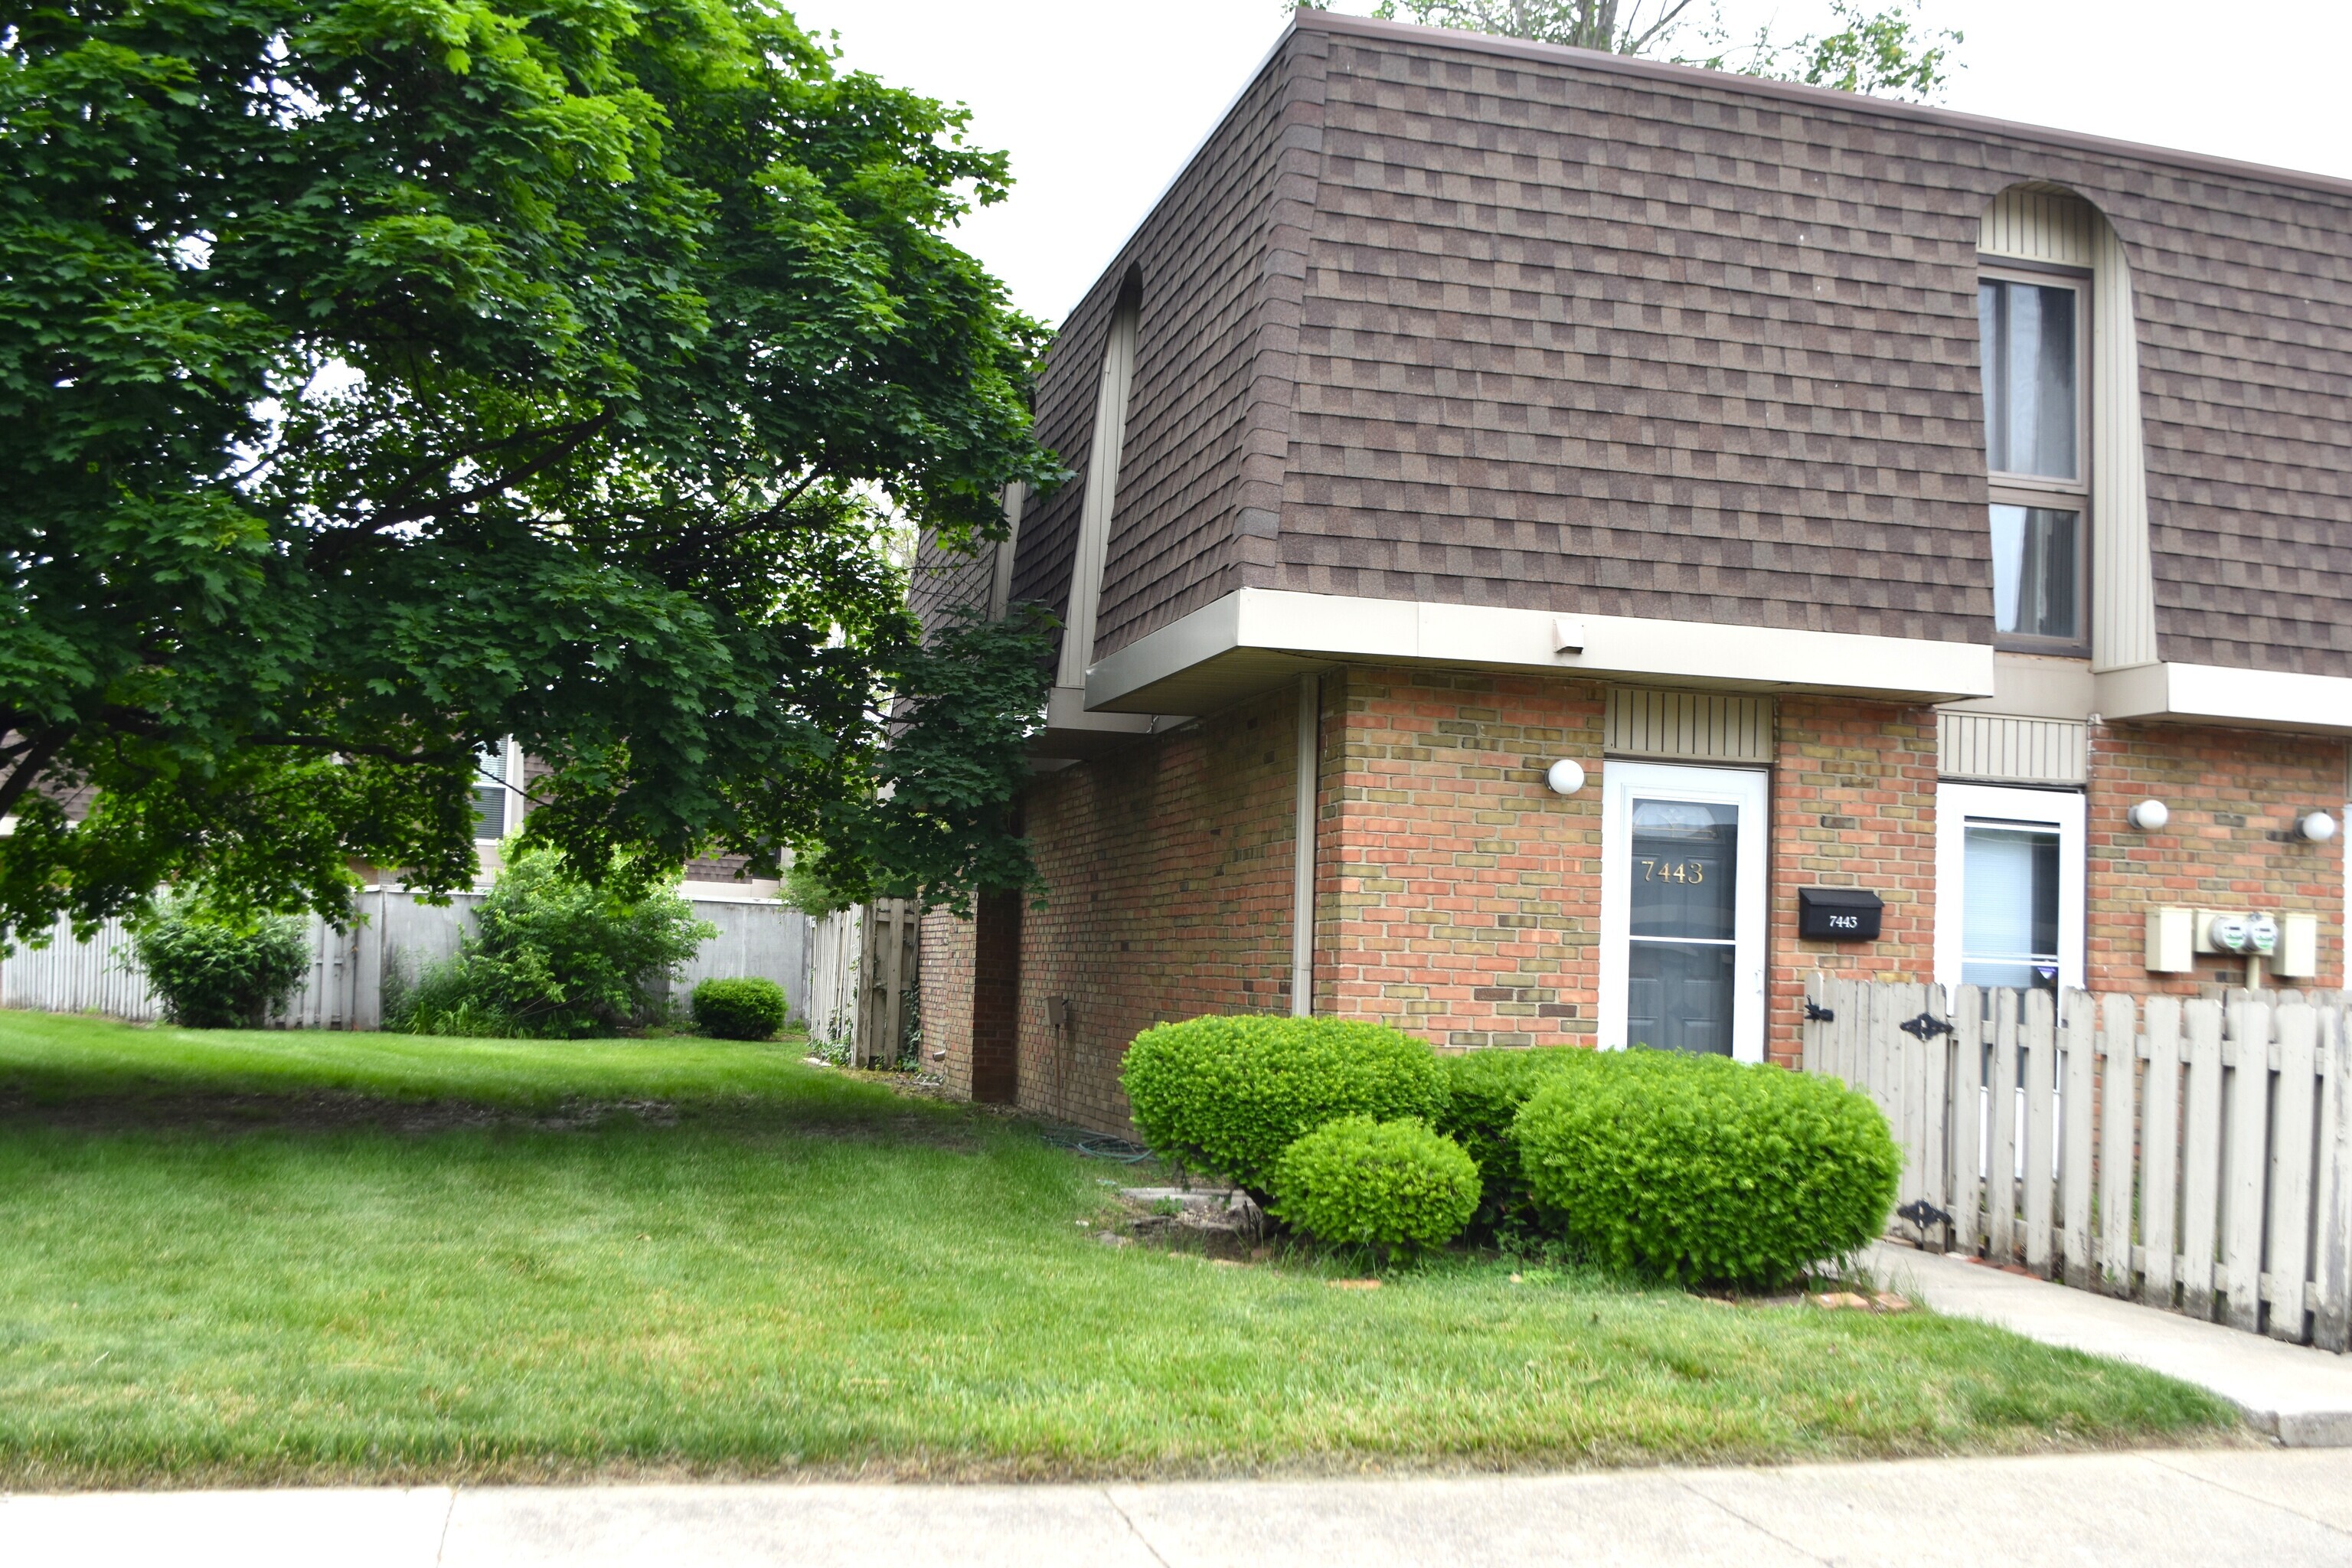
Active
$119,900
2
bds
|
2
ba
|
1,216
sqft
|
built
1966
7443 Country Brook Dr, Indianapolis, IN 46260
$122
Cash flow
5.3%
Cash-on-Cash Return
7.4%
Cap rate
1.3%
Rent to Value Ratio
Pending
$372,000
3
bds
|
2
ba
|
2,439
sqft
|
built
2004
2769 S 800 W, Indianapolis, IN 46239
$-319
Cash flow
-4.5%
Cash-on-Cash Return
5.1%
Cap rate
0.6%
Rent to Value Ratio
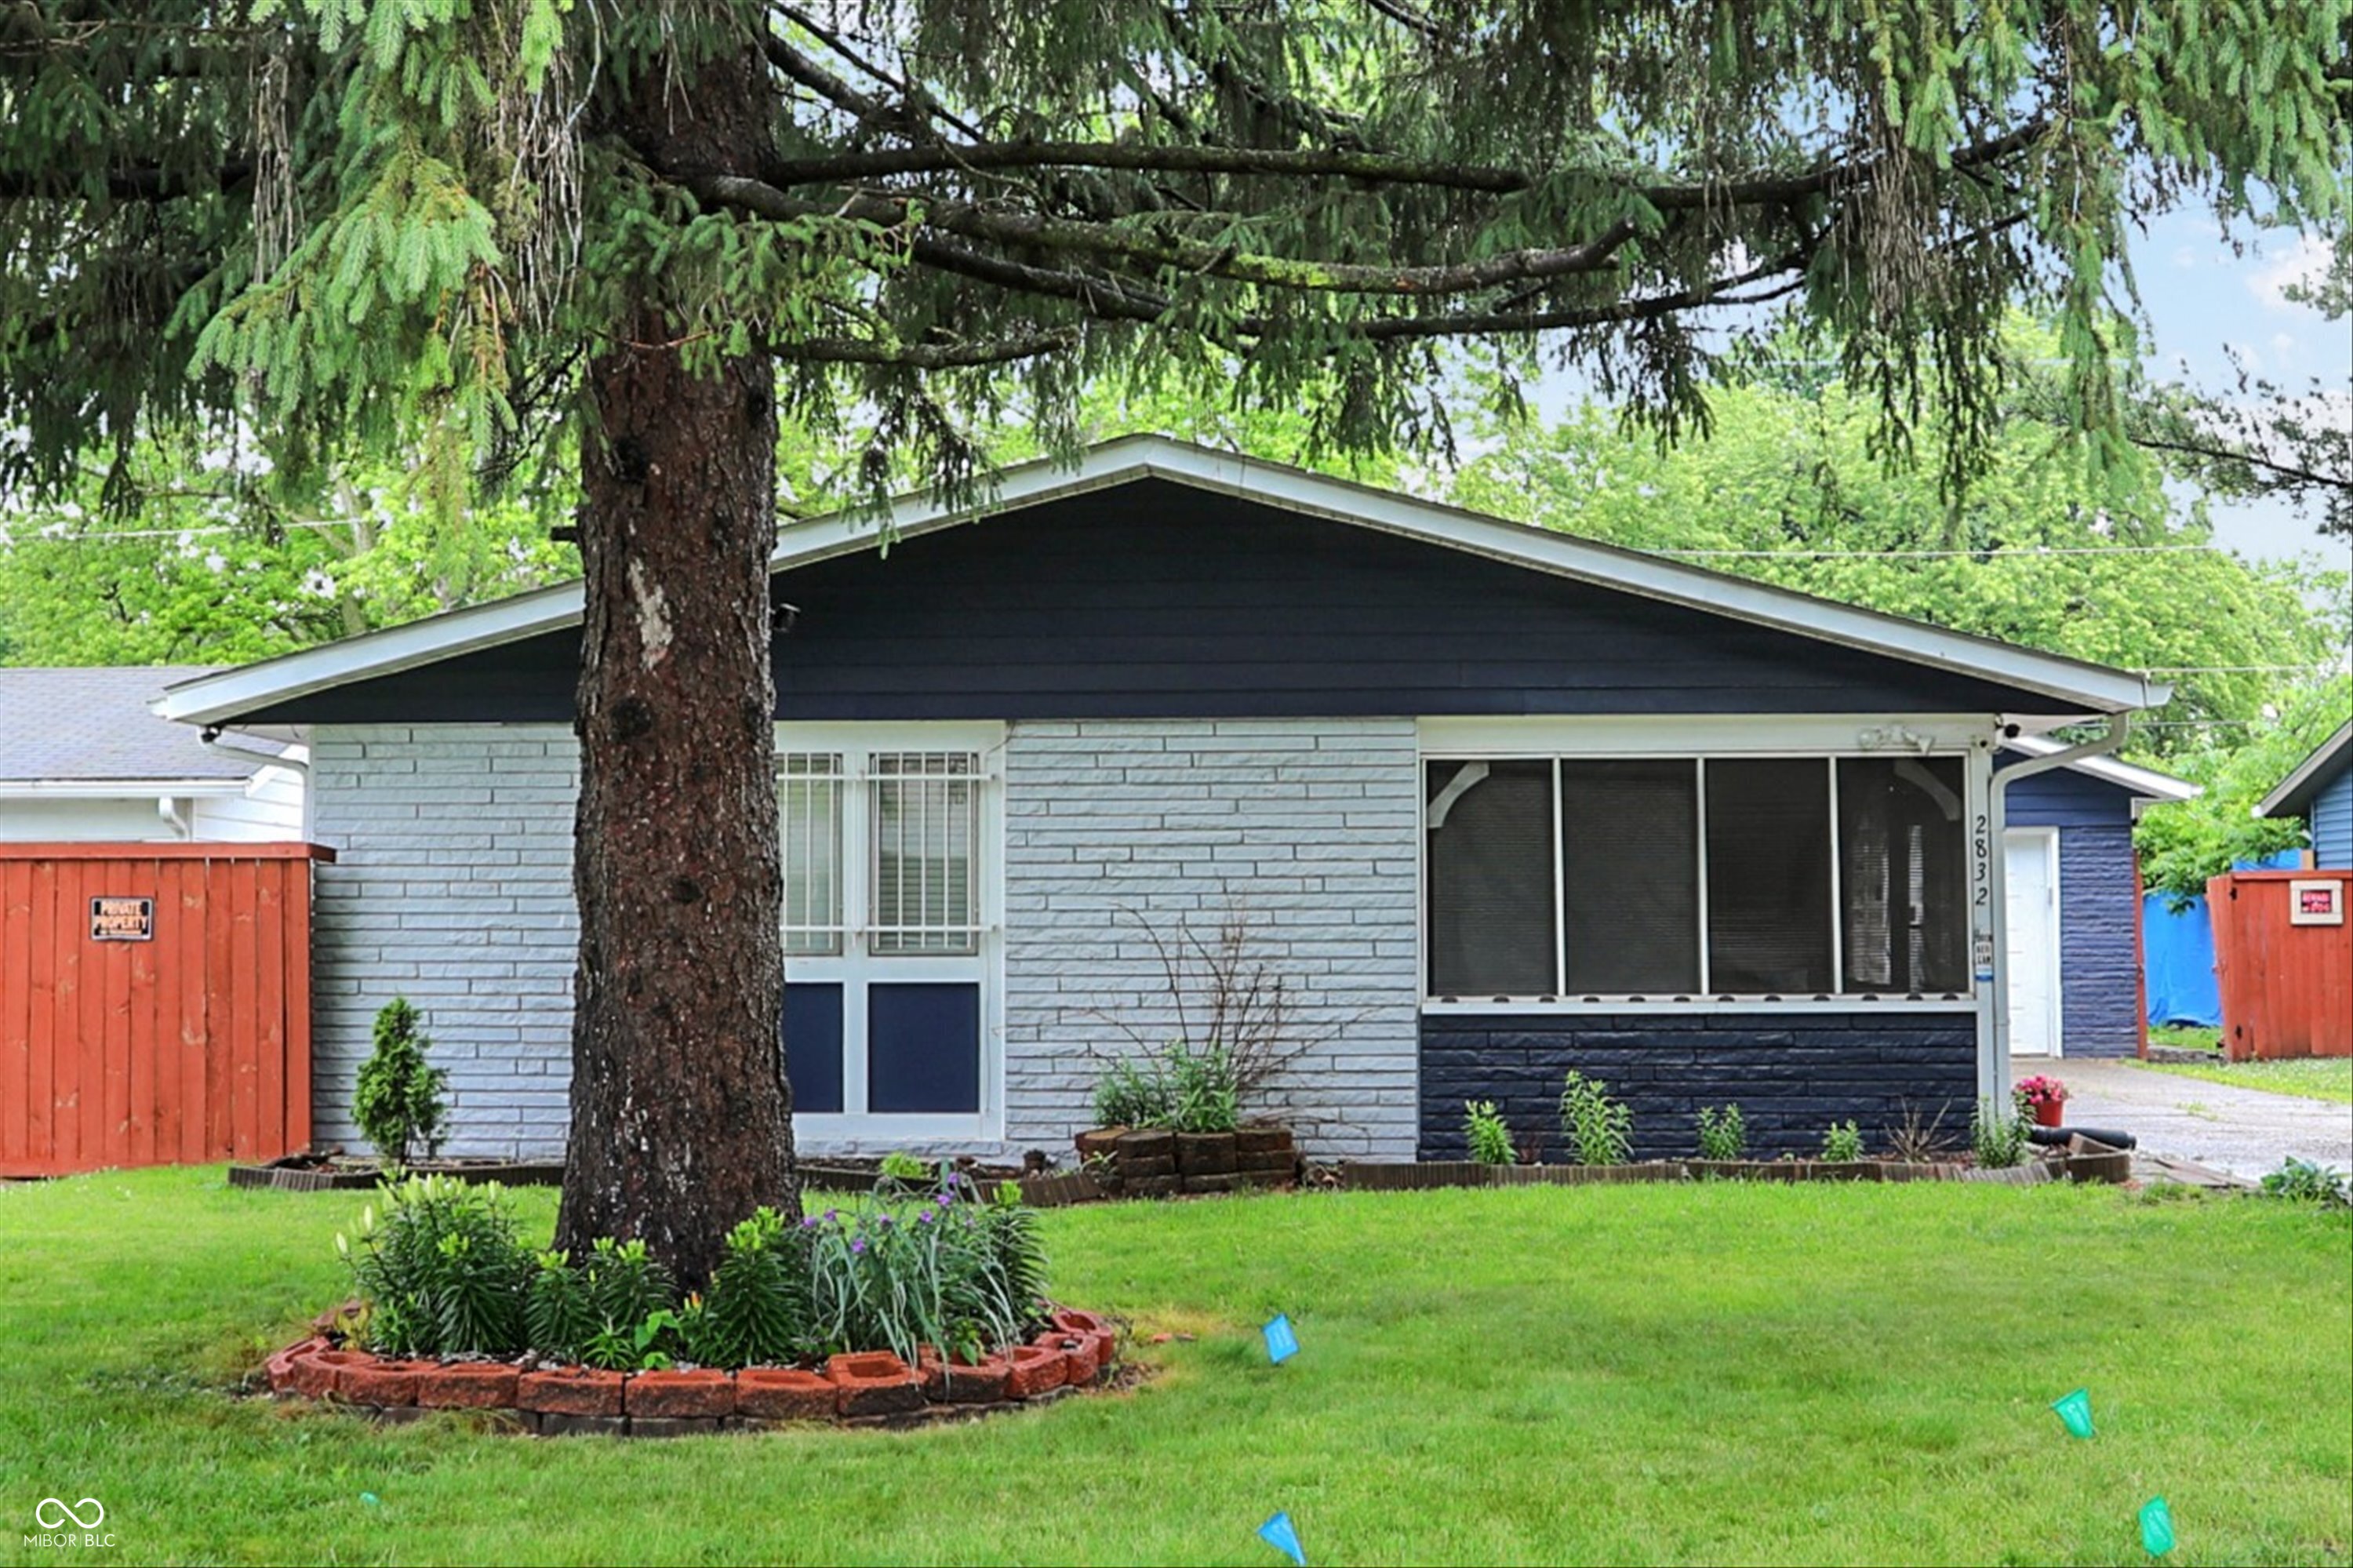
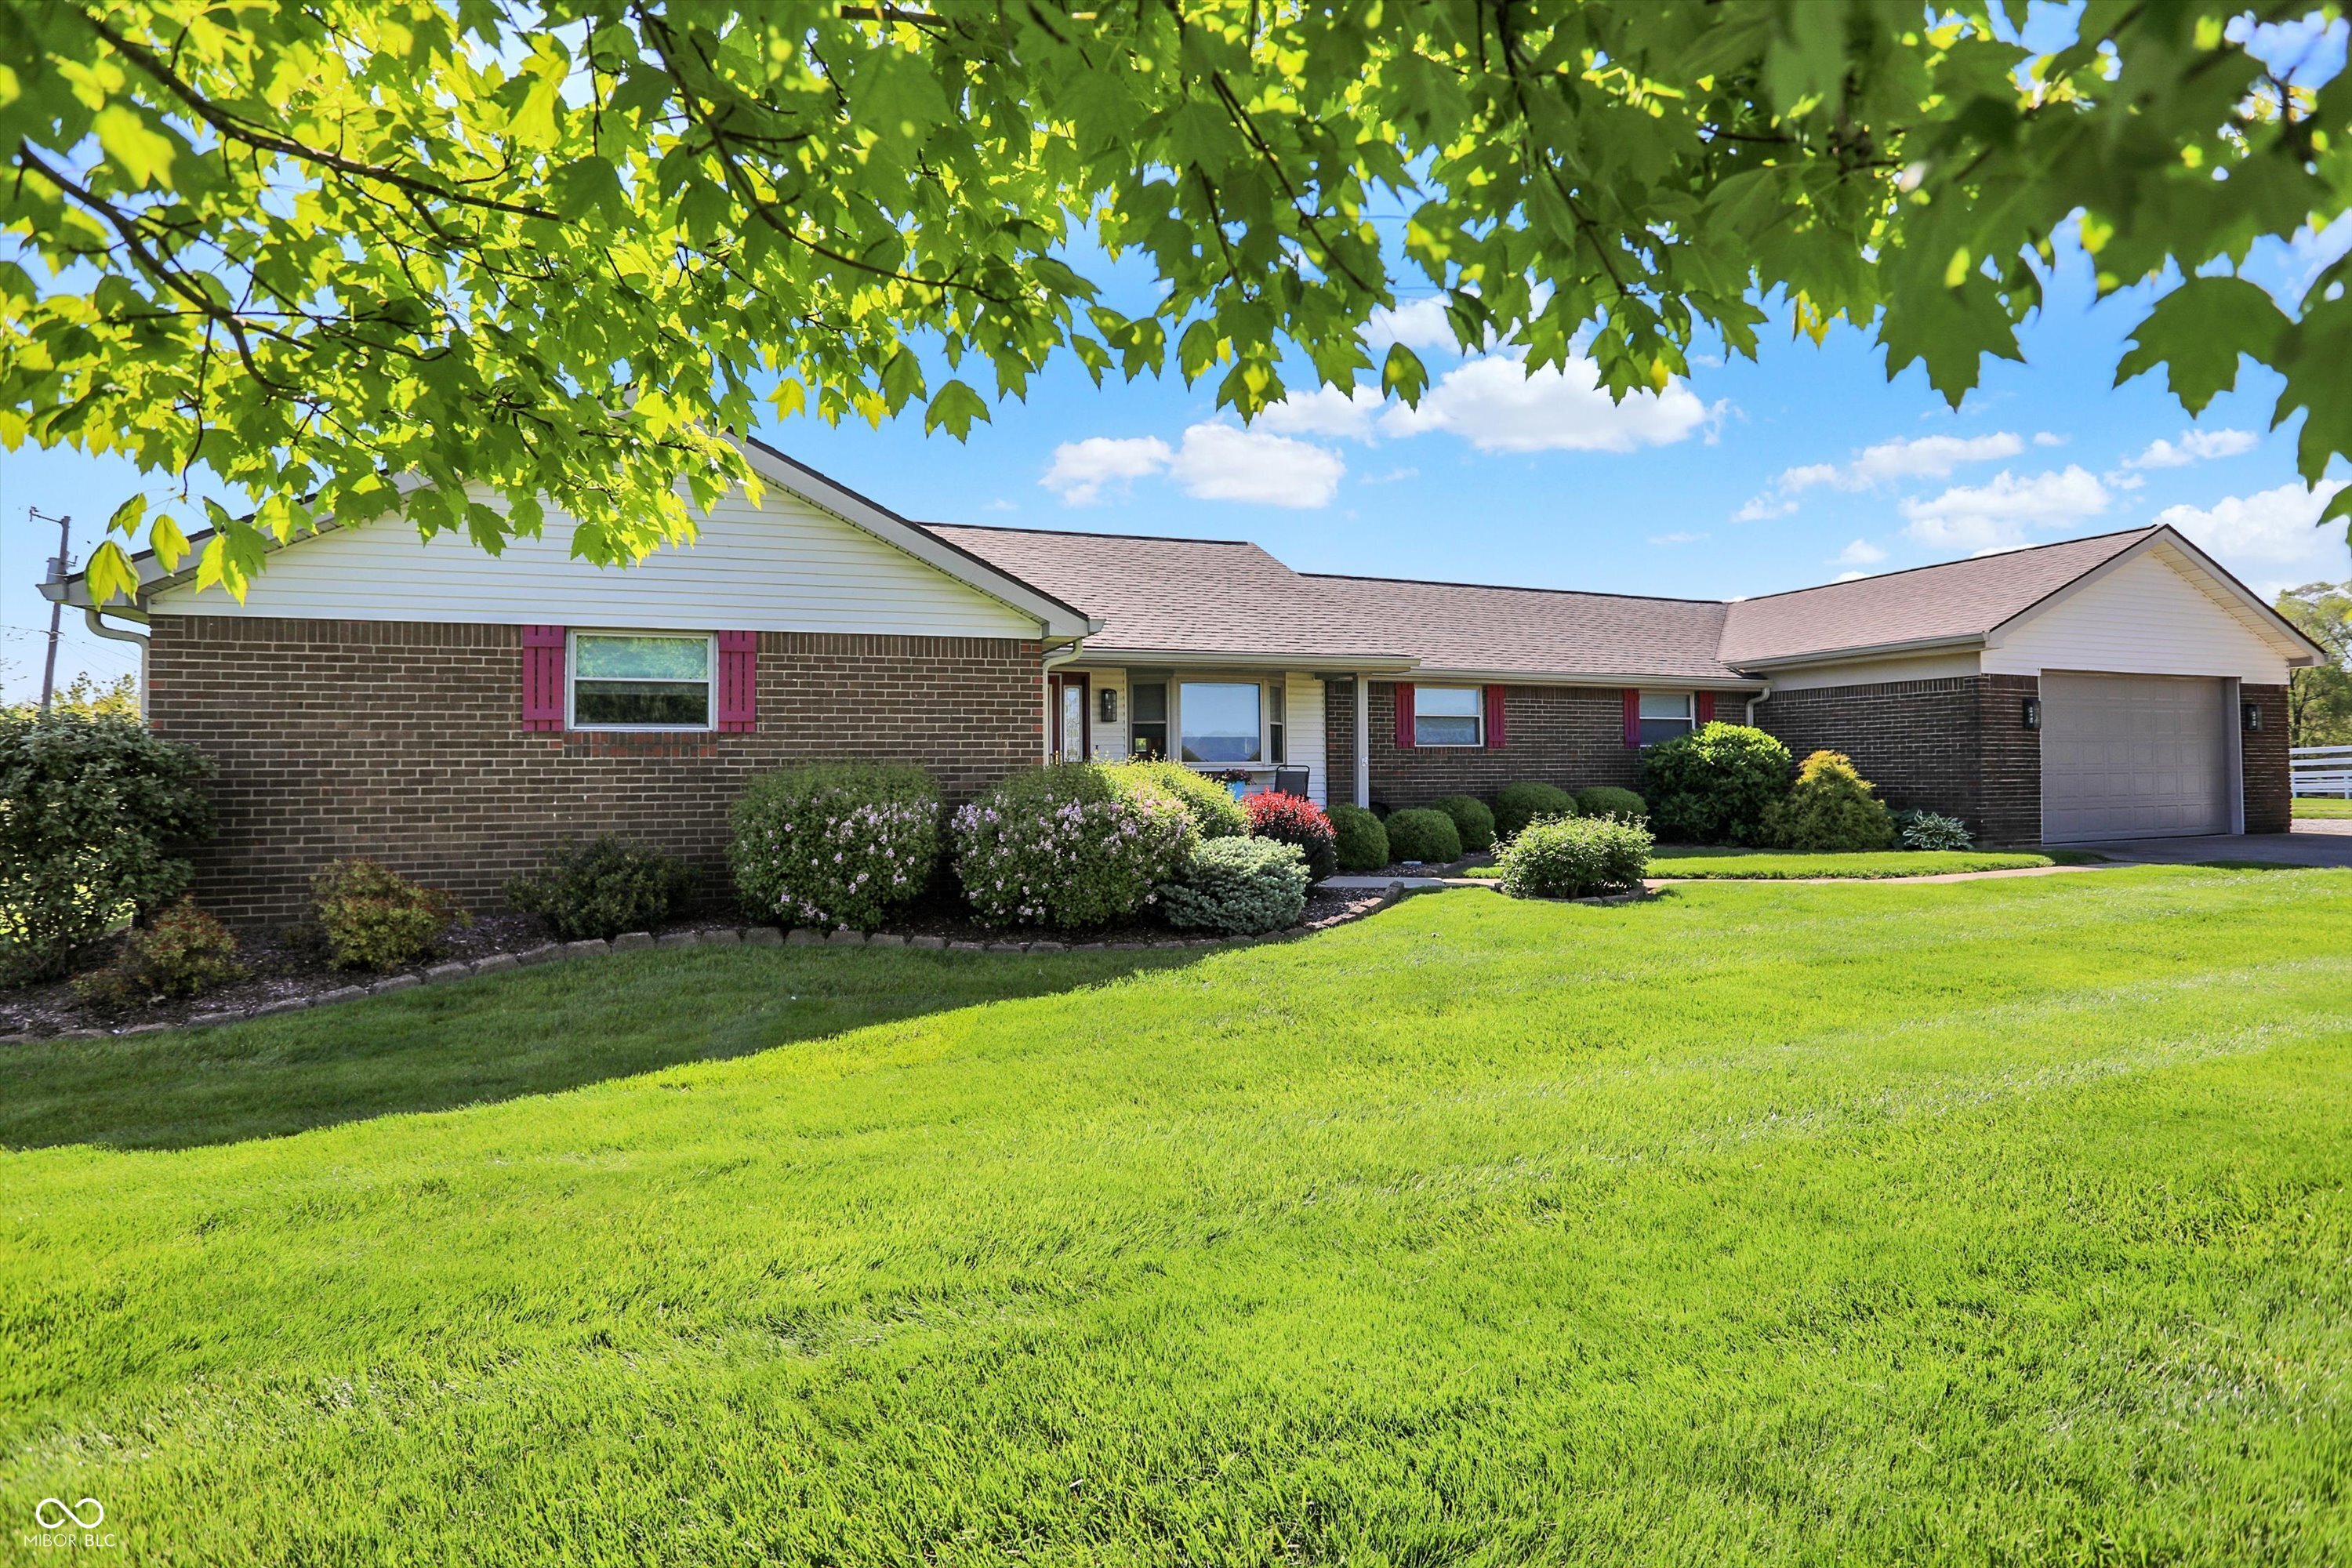
Active
$215,000
2
bds
|
1
ba
|
1,294
sqft
|
built
1963
2832 Hillside Ave, Indianapolis, IN 46218
$-135
Cash flow
-3.3%
Cash-on-Cash Return
5.4%
Cap rate
0.7%
Rent to Value Ratio
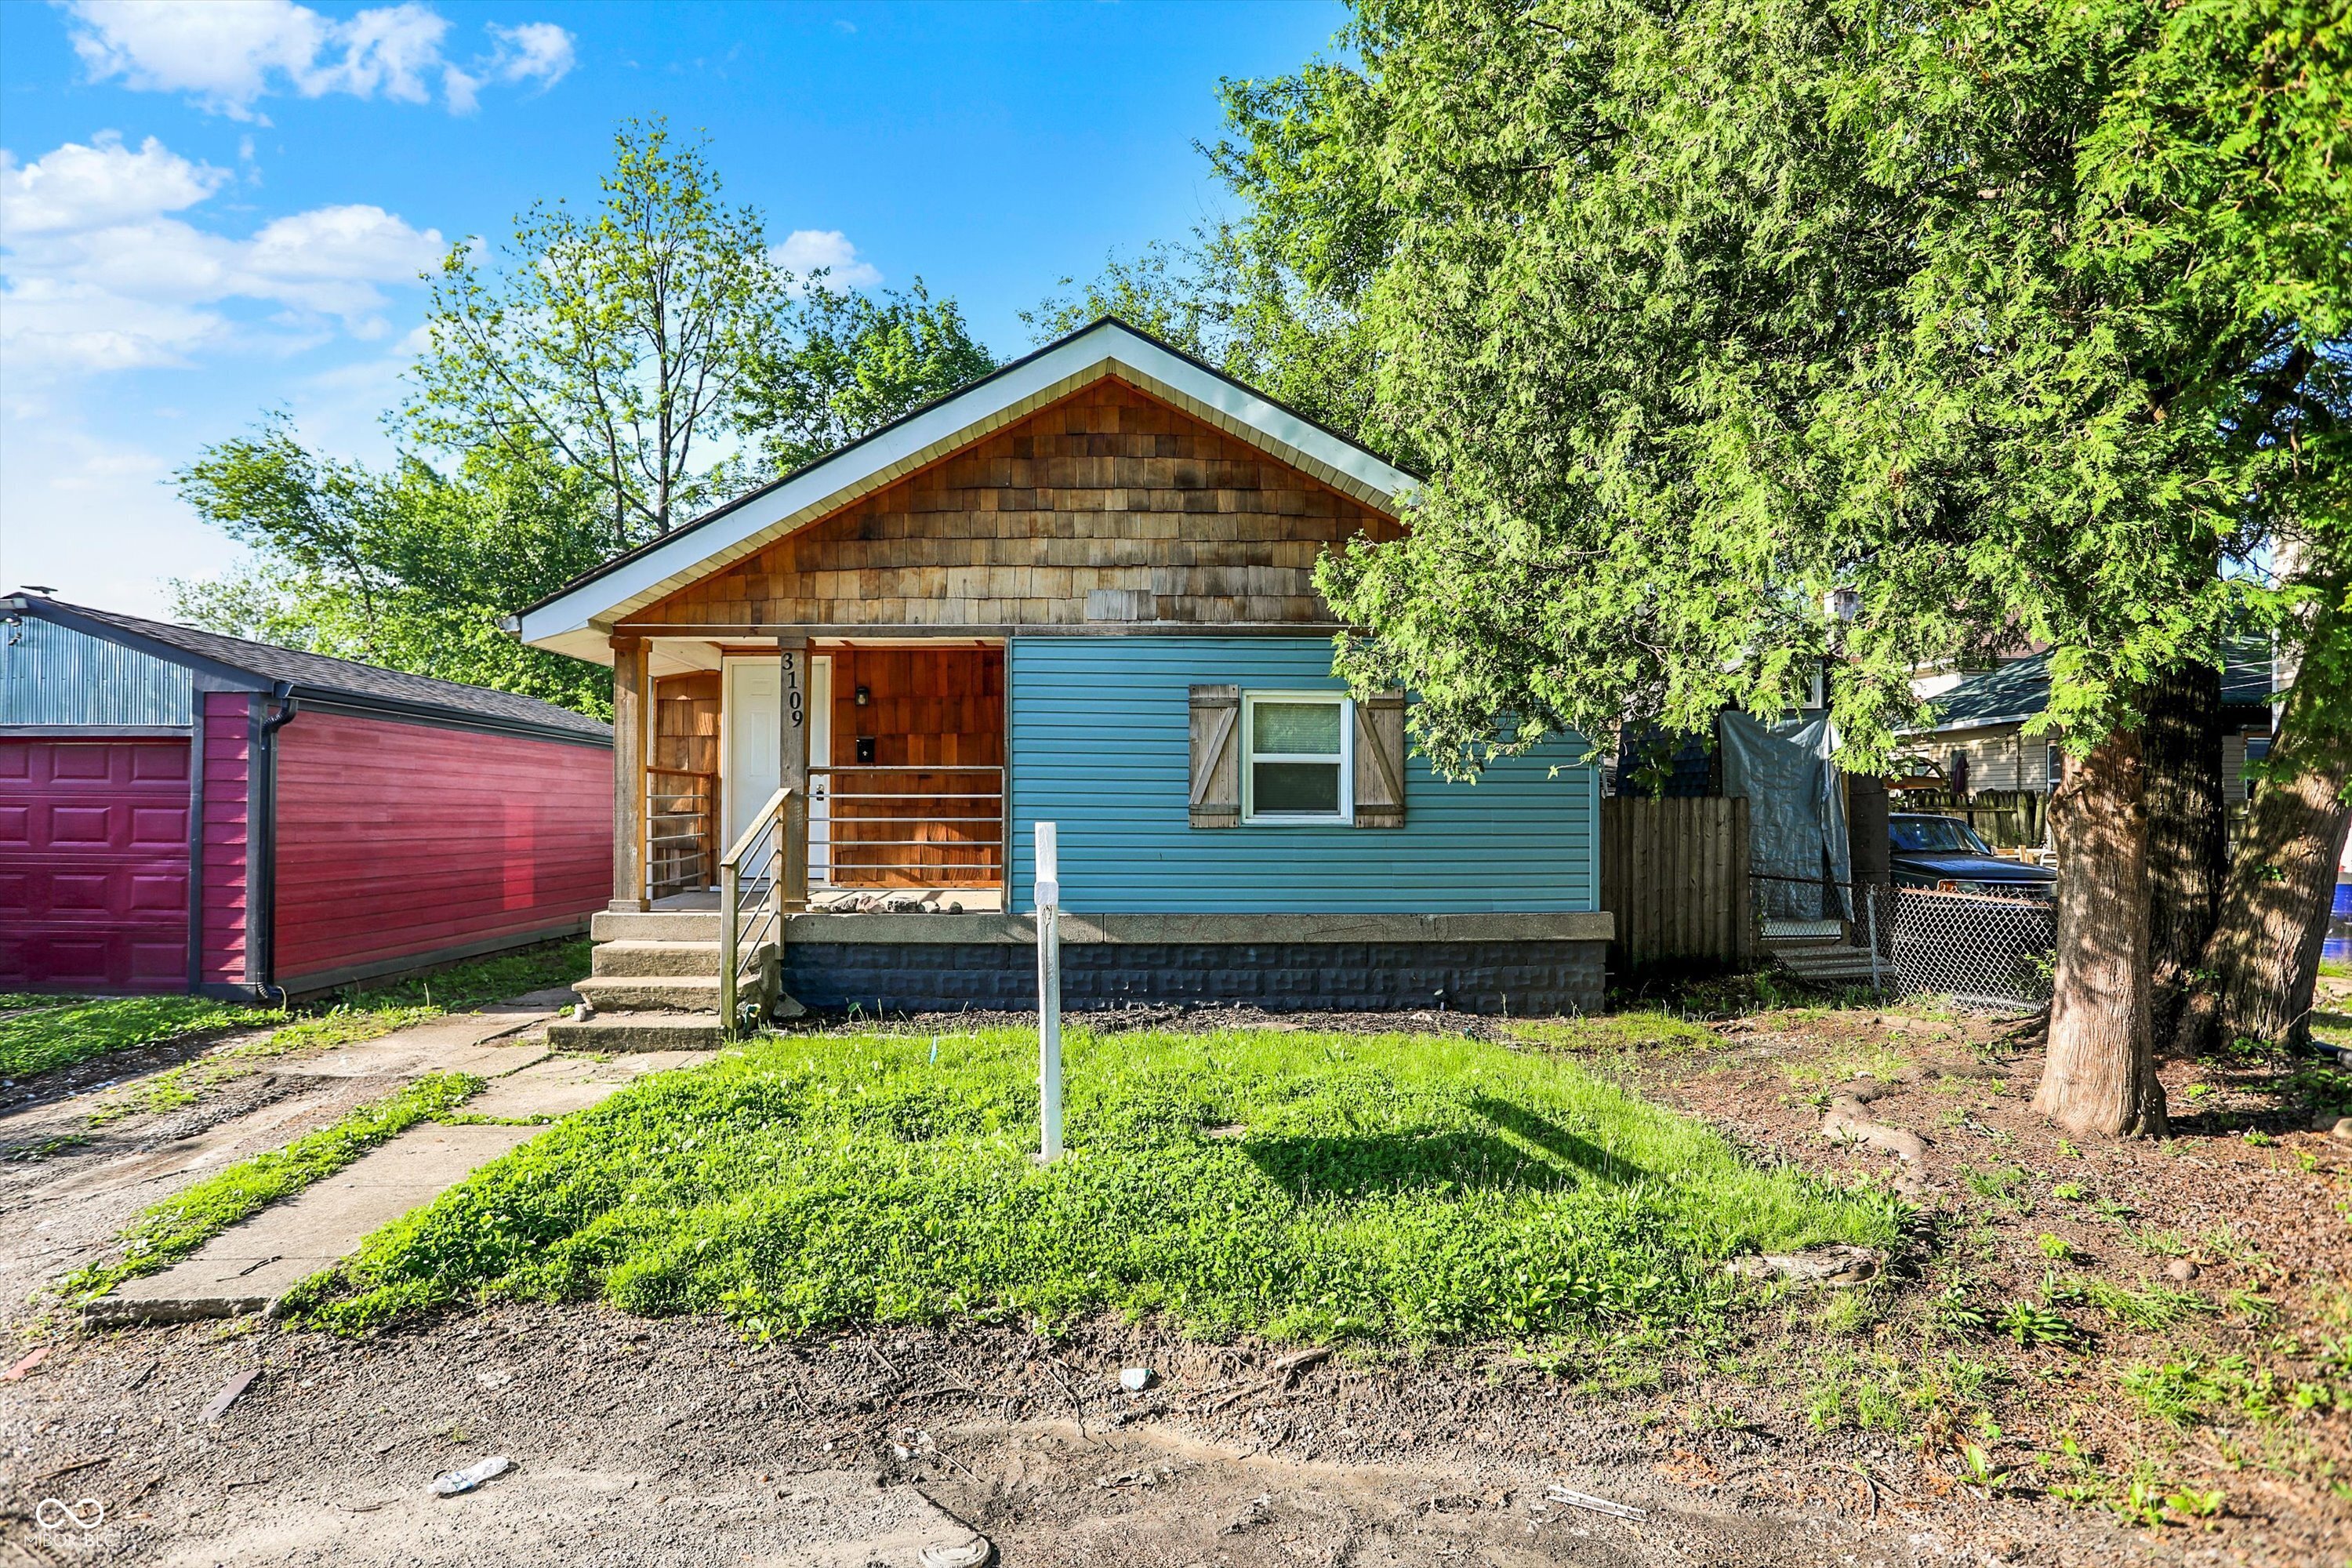
Pending
$115,000
3
bds
|
2
ba
|
1,078
sqft
|
built
1925
3109 E Saint Joseph St, Indianapolis, IN 46201
$170
Cash flow
7.7%
Cash-on-Cash Return
7.9%
Cap rate
1.0%
Rent to Value Ratio
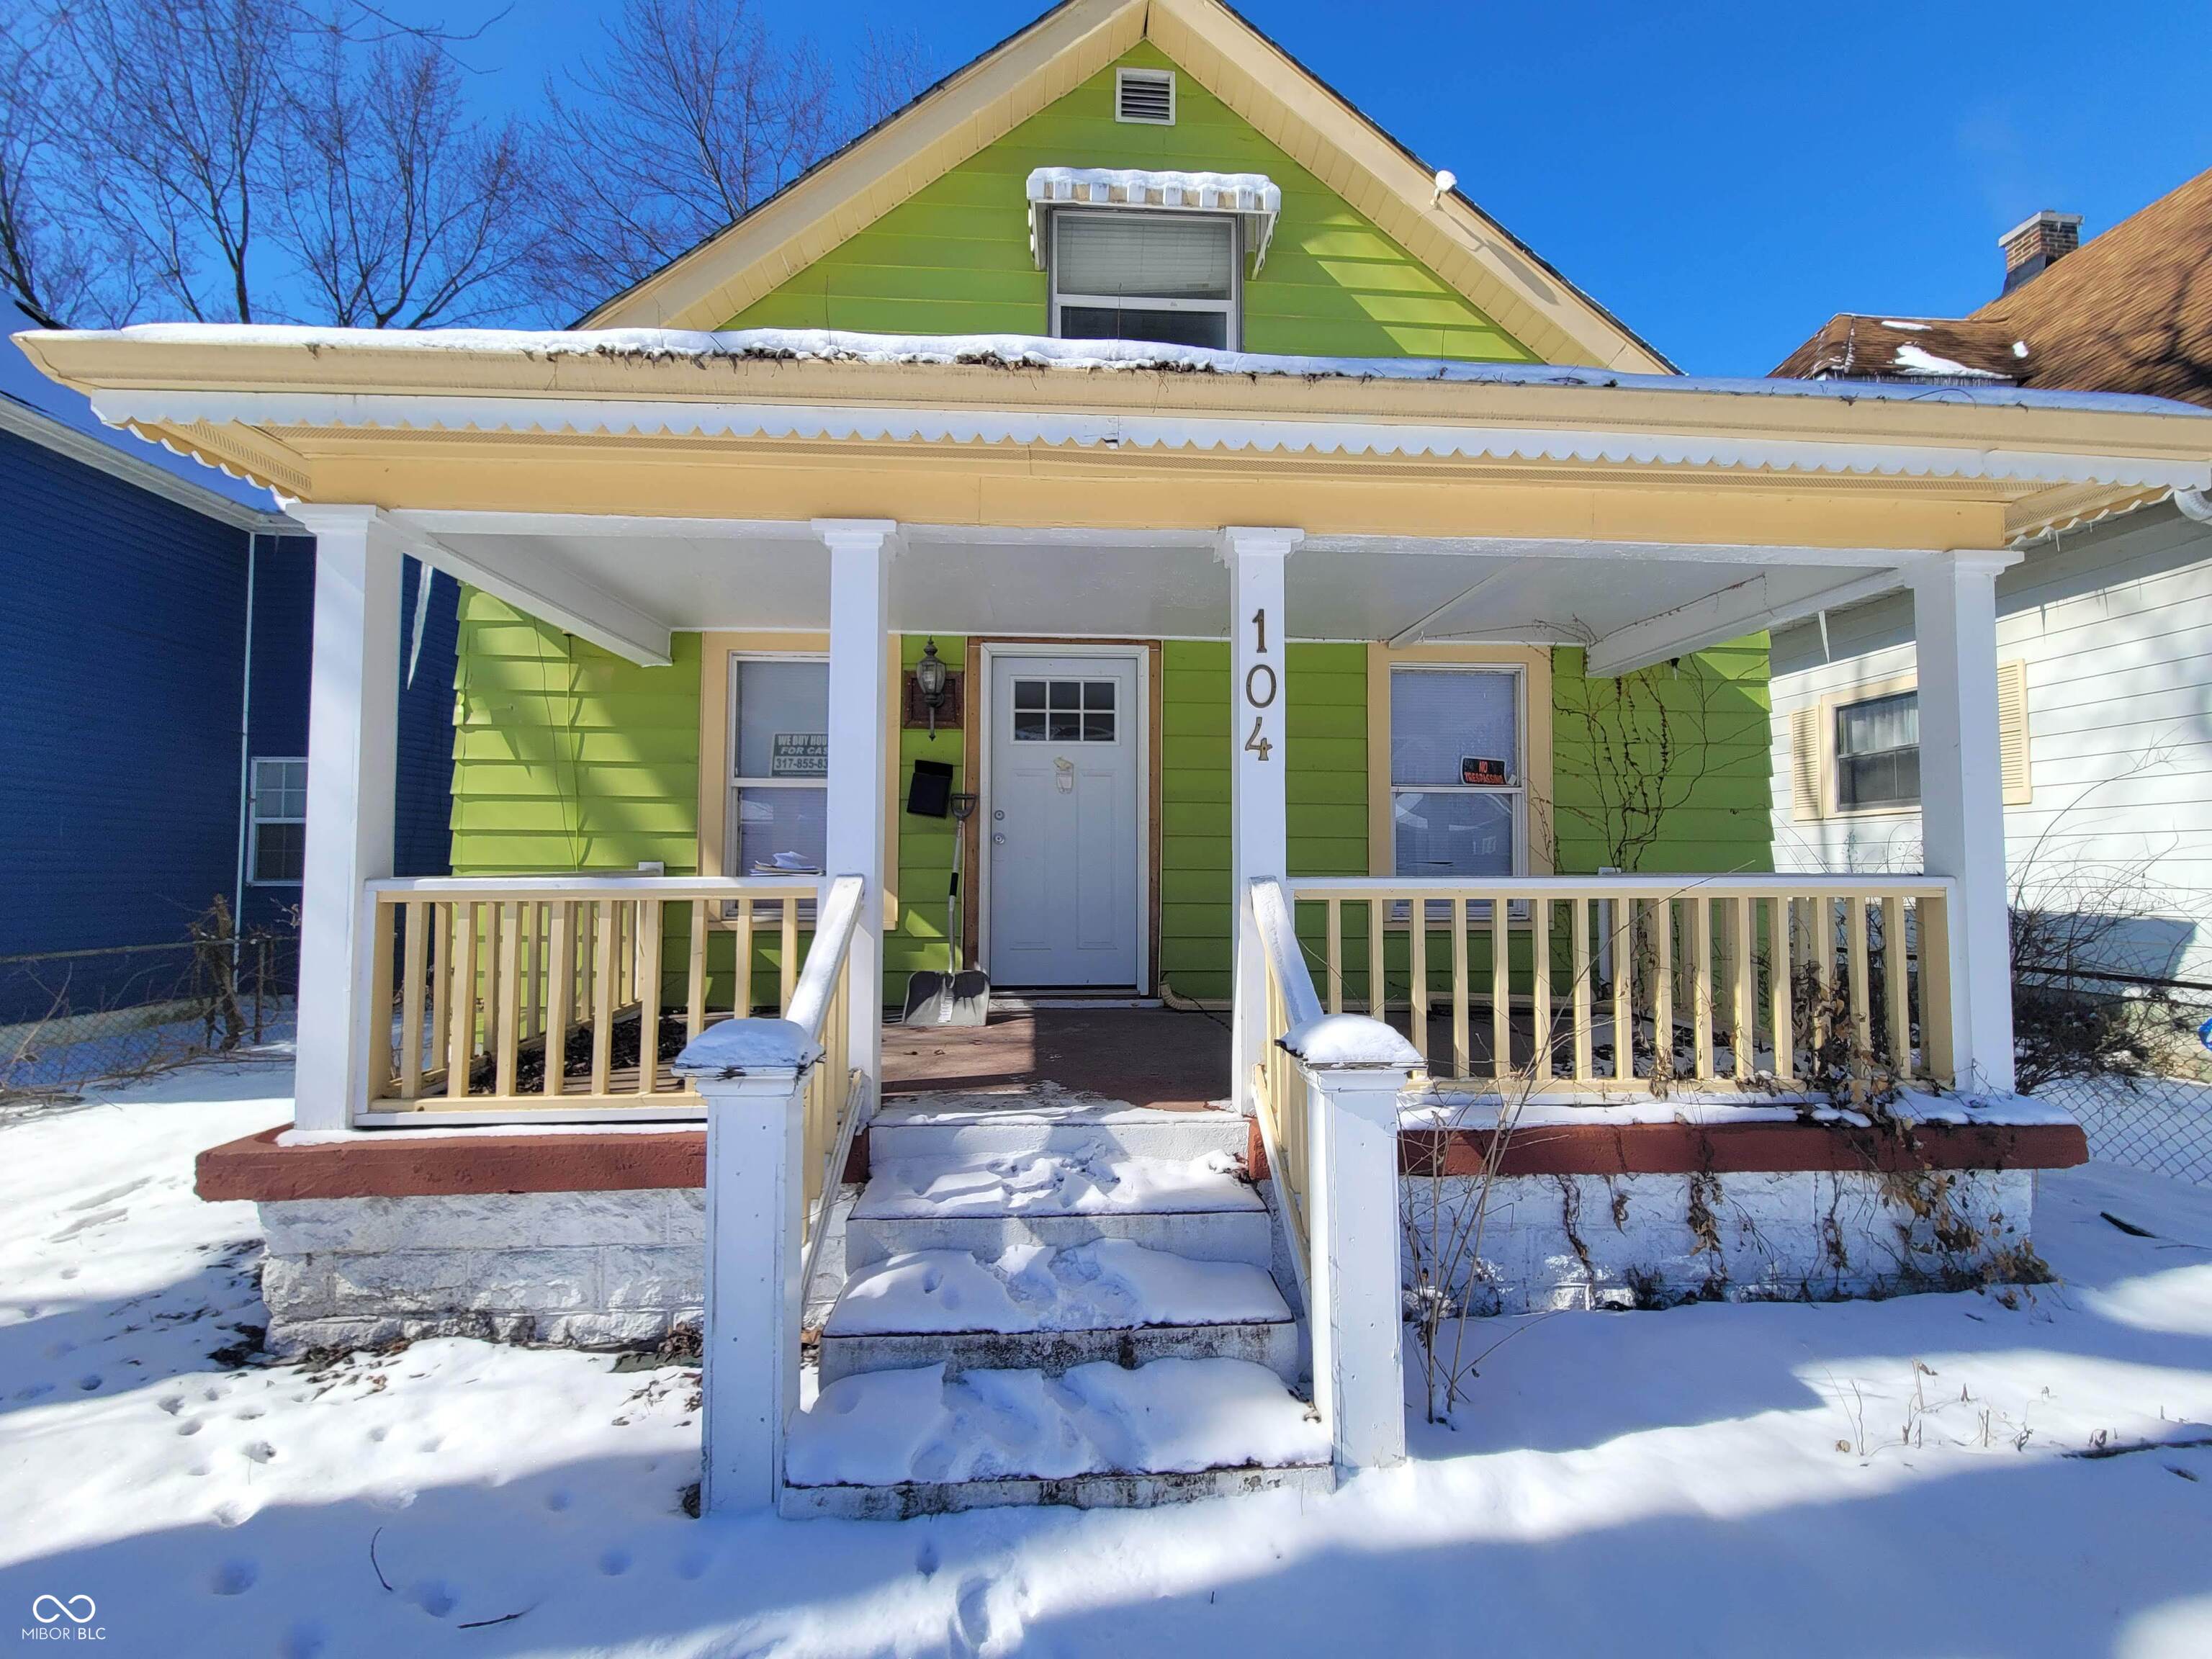
Active
$155,000
3
bds
|
2
ba
|
1,027
sqft
|
built
1910
104 N Chester Ave, Indianapolis, IN 46201
$172
Cash flow
5.8%
Cash-on-Cash Return
7.5%
Cap rate
0.9%
Rent to Value Ratio
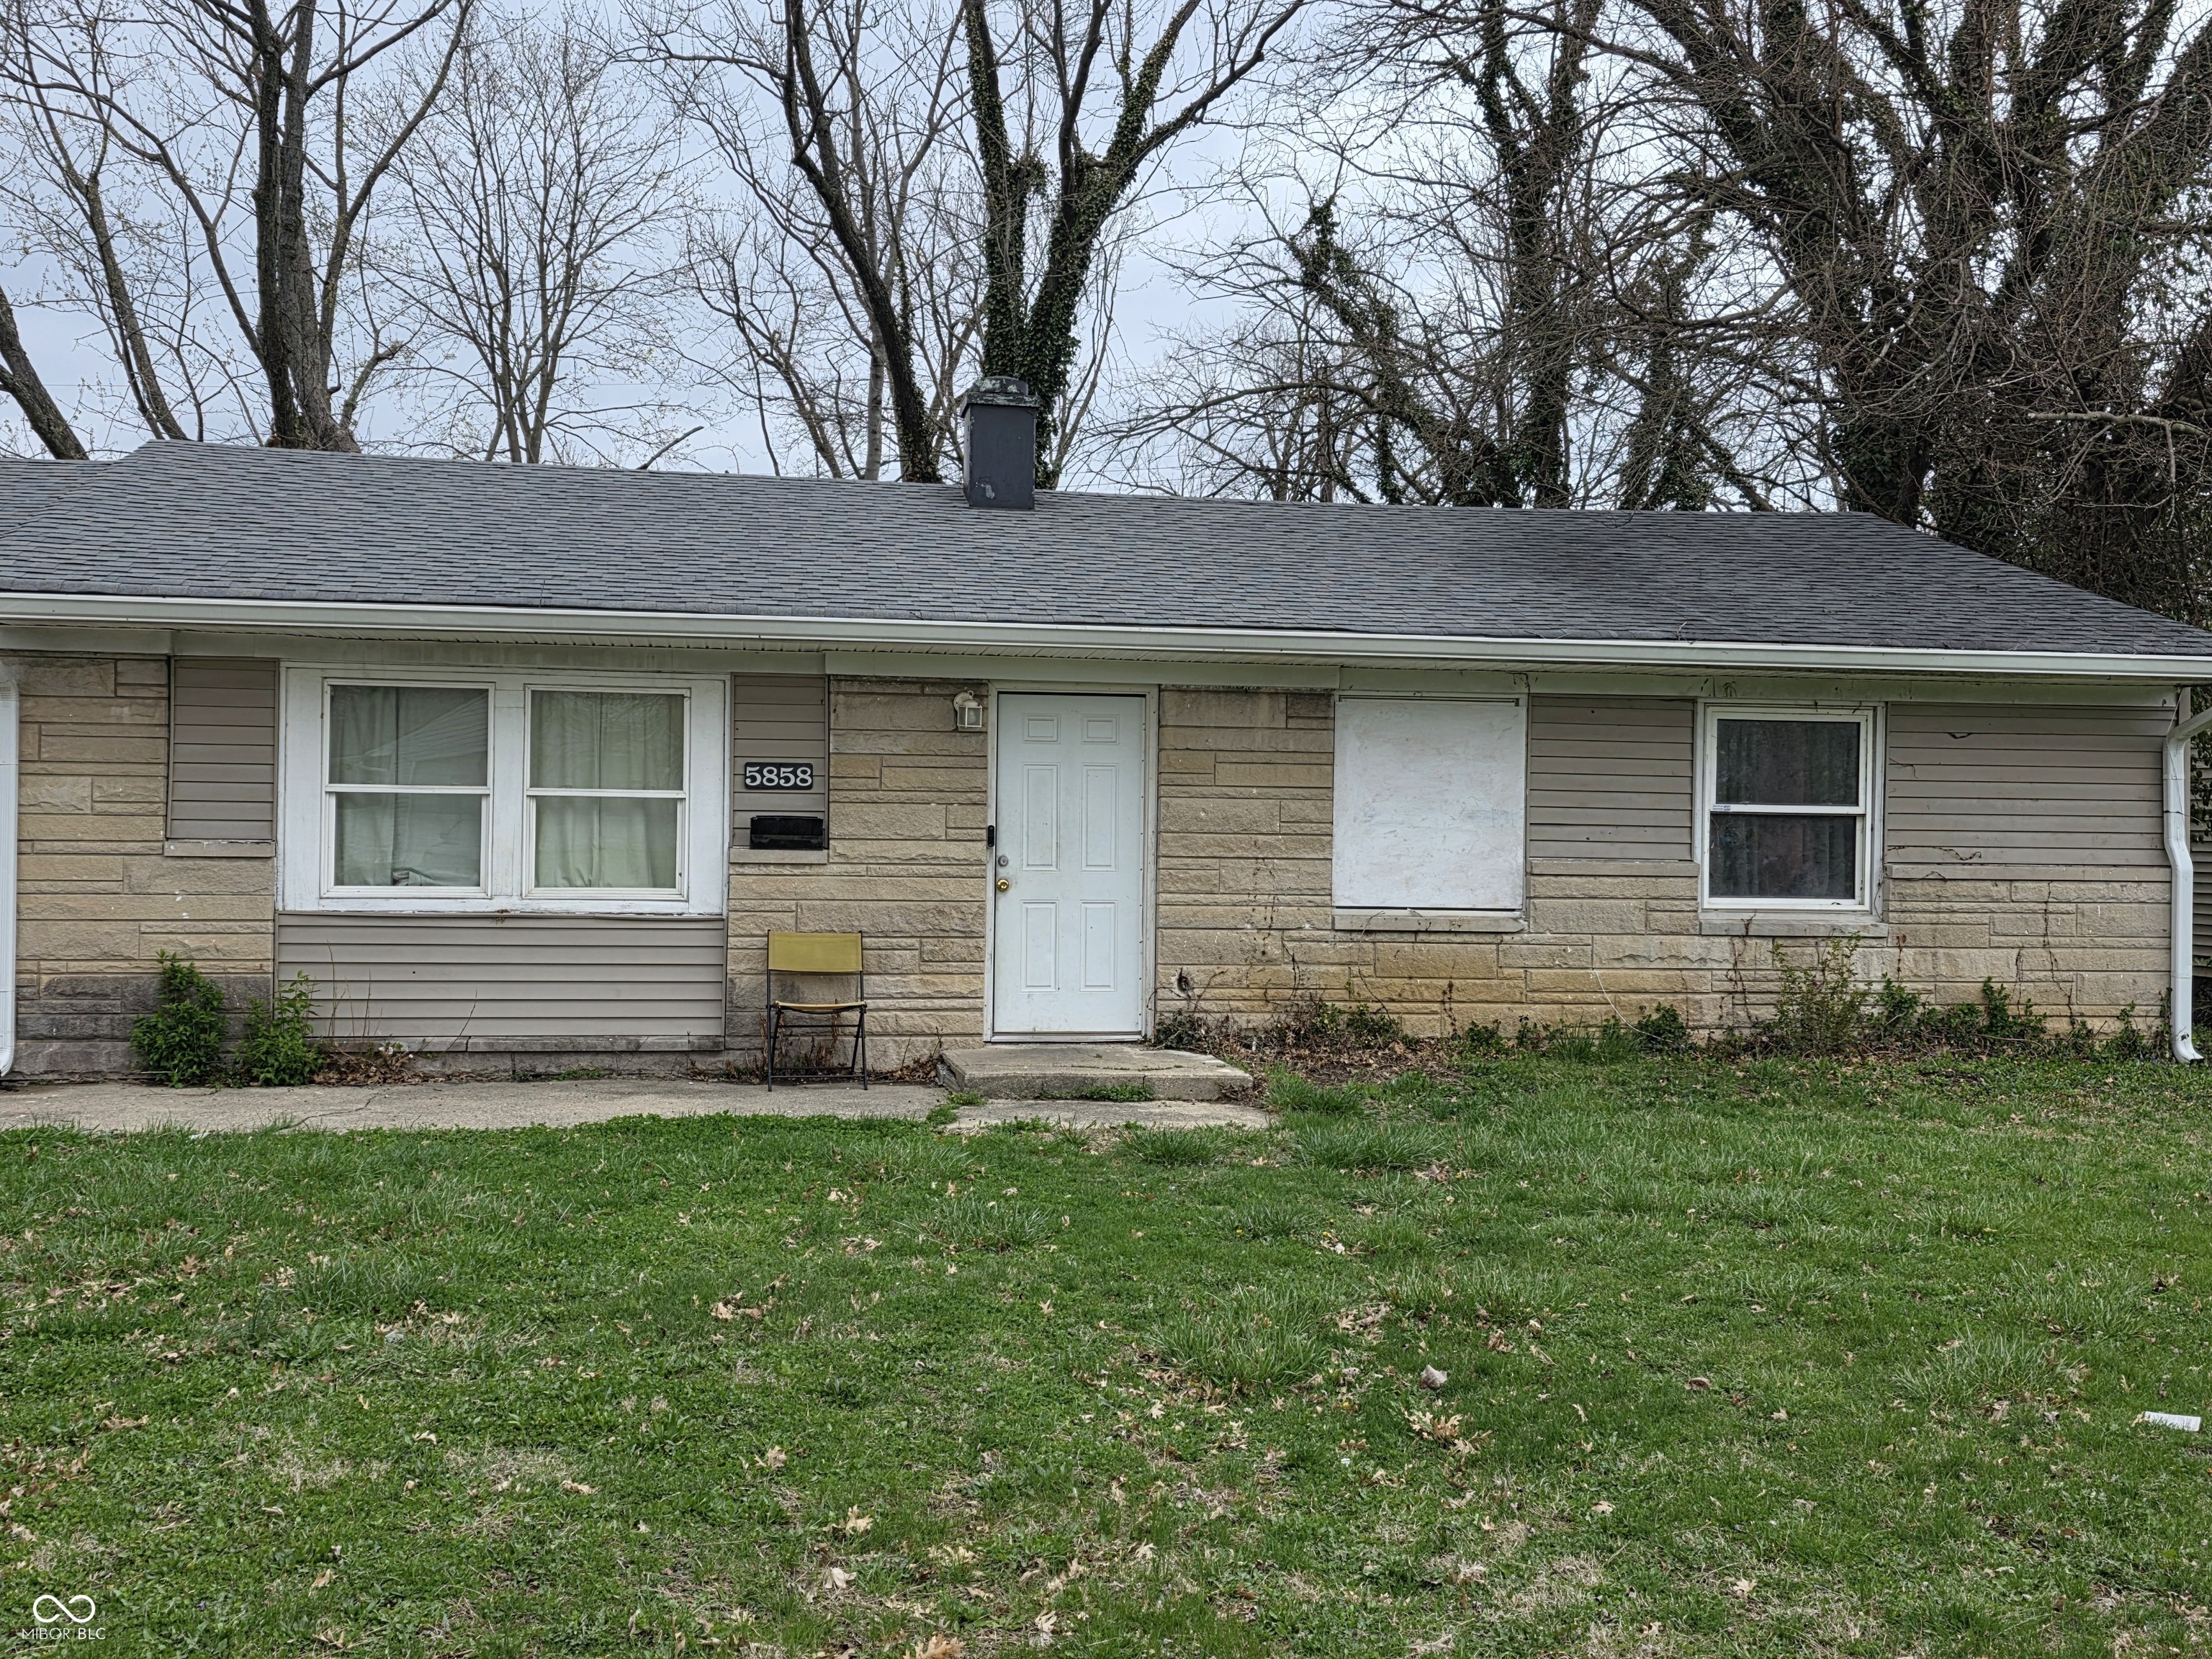
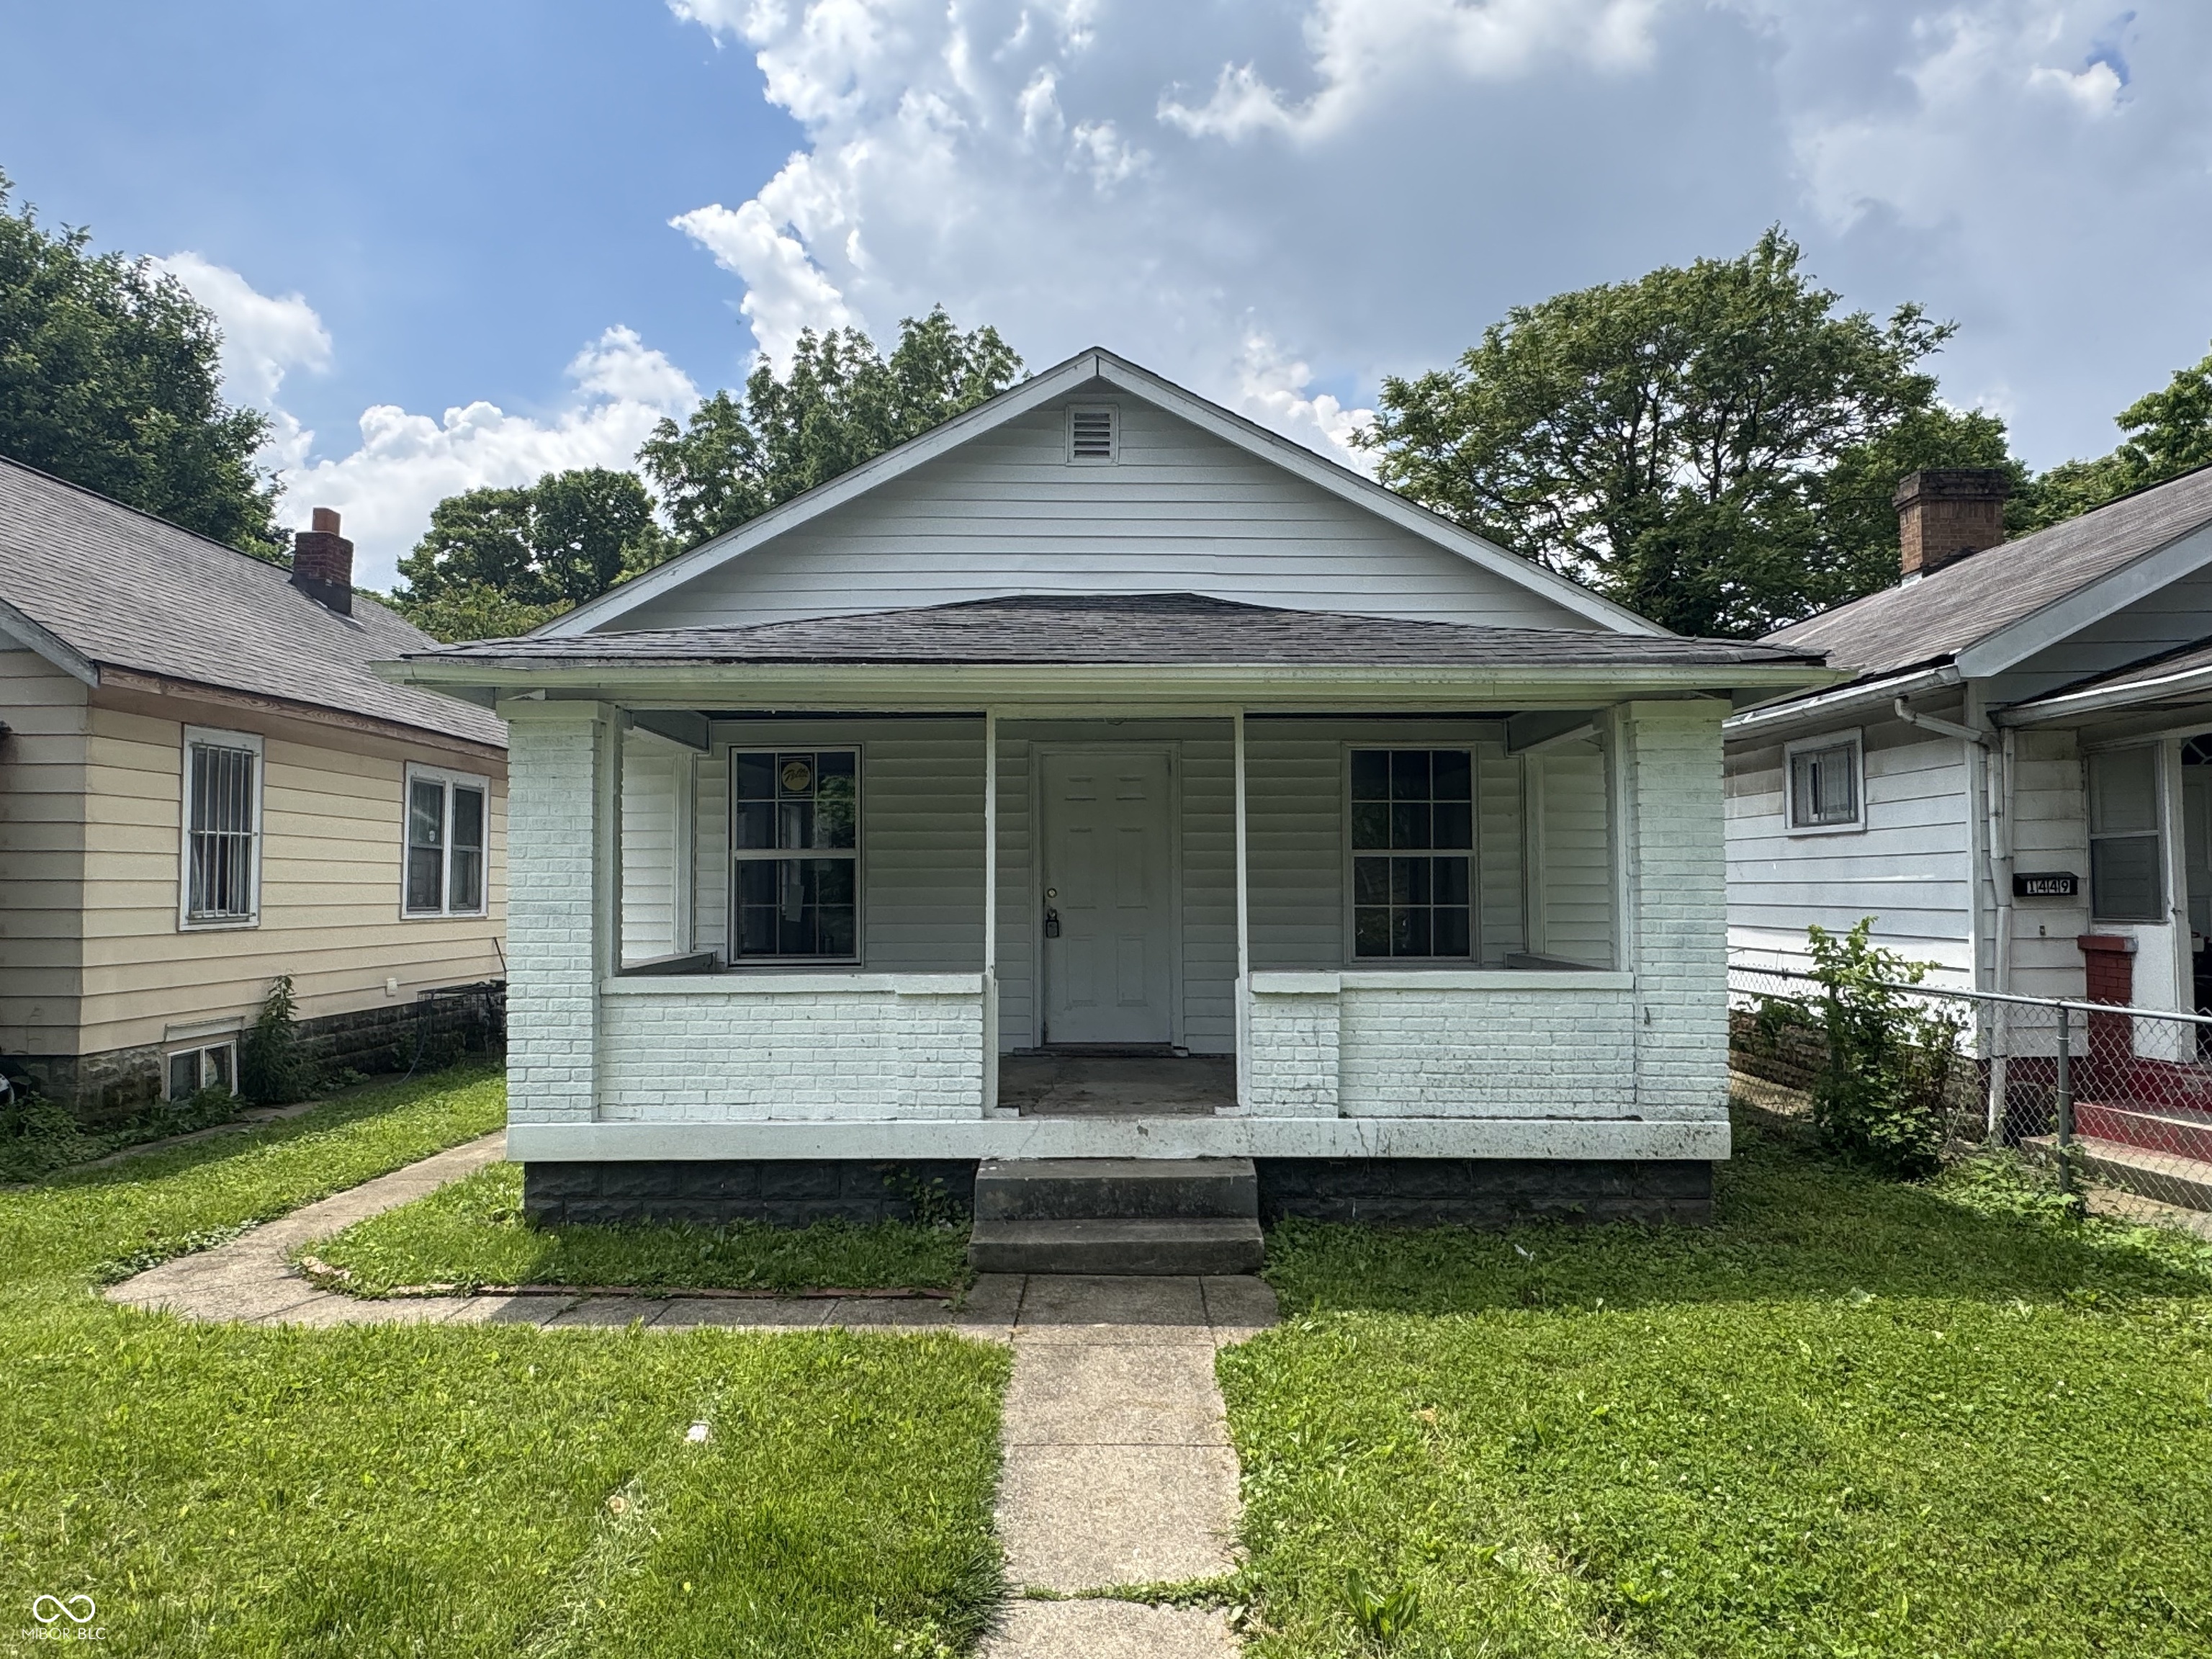
Active
$99,000
3
bds
|
1
ba
|
1,176
sqft
|
built
1955
5858 E 44th St, Indianapolis, IN 46226
$459
Cash flow
24.2%
Cash-on-Cash Return
11.7%
Cap rate
1.4%
Rent to Value Ratio
Active
$129,000
2
bds
|
1
ba
|
672
sqft
|
built
1930
1445 W 34th St, Indianapolis, IN 46208
$98
Cash flow
4.0%
Cash-on-Cash Return
7.1%
Cap rate
0.9%
Rent to Value Ratio
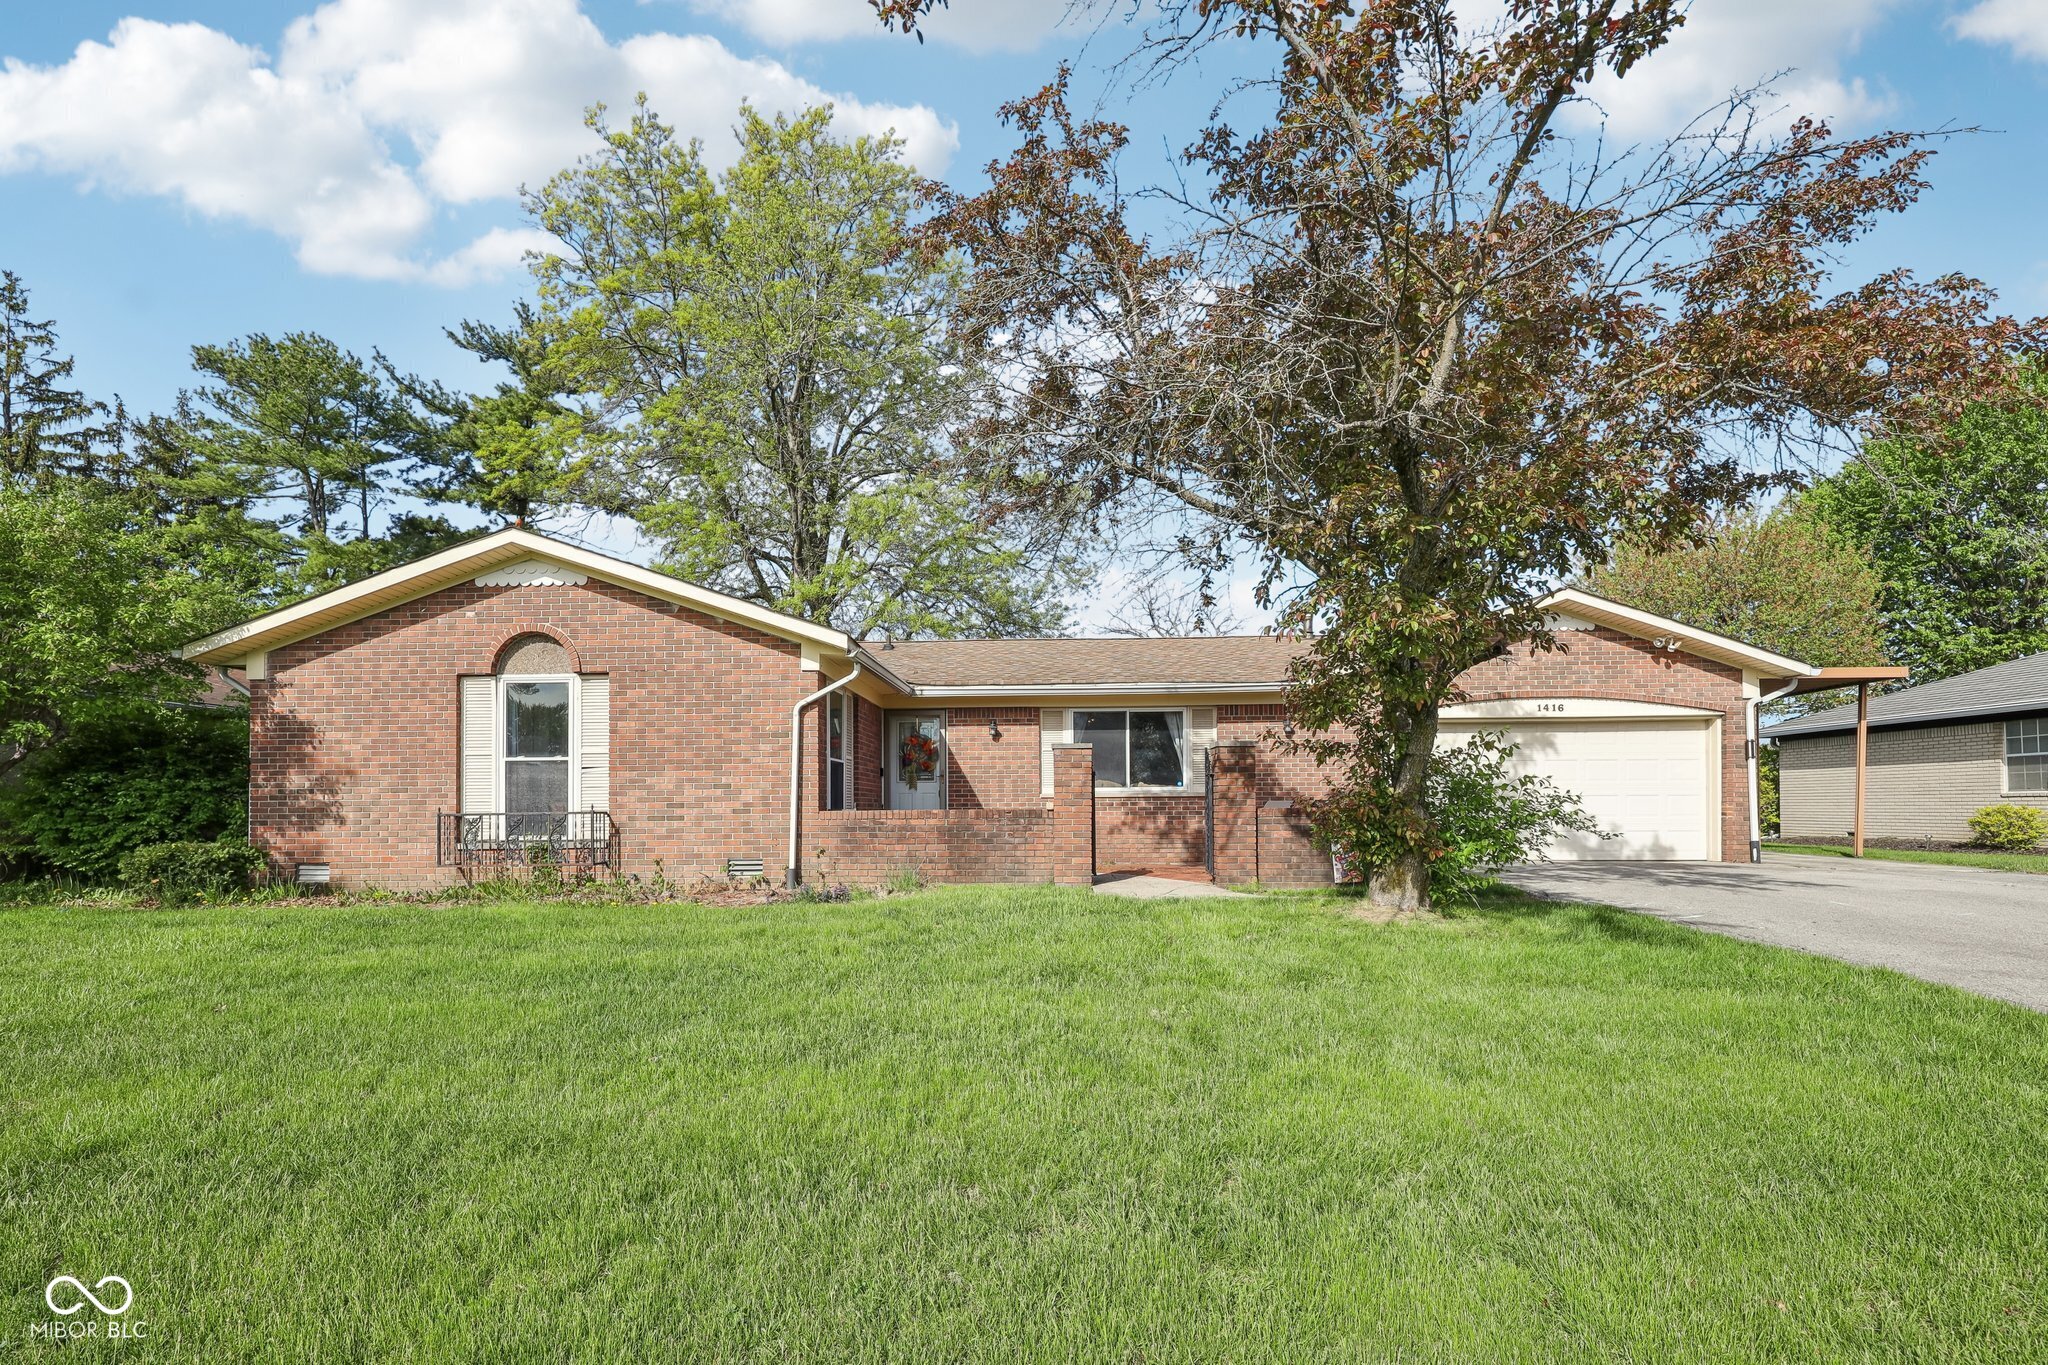
Active
$240,000
3
bds
|
2
ba
|
2,184
sqft
|
built
1968
1416 Wellington Ave, Indianapolis, IN 46219
$13
Cash flow
0.3%
Cash-on-Cash Return
6.2%
Cap rate
0.8%
Rent to Value Ratio
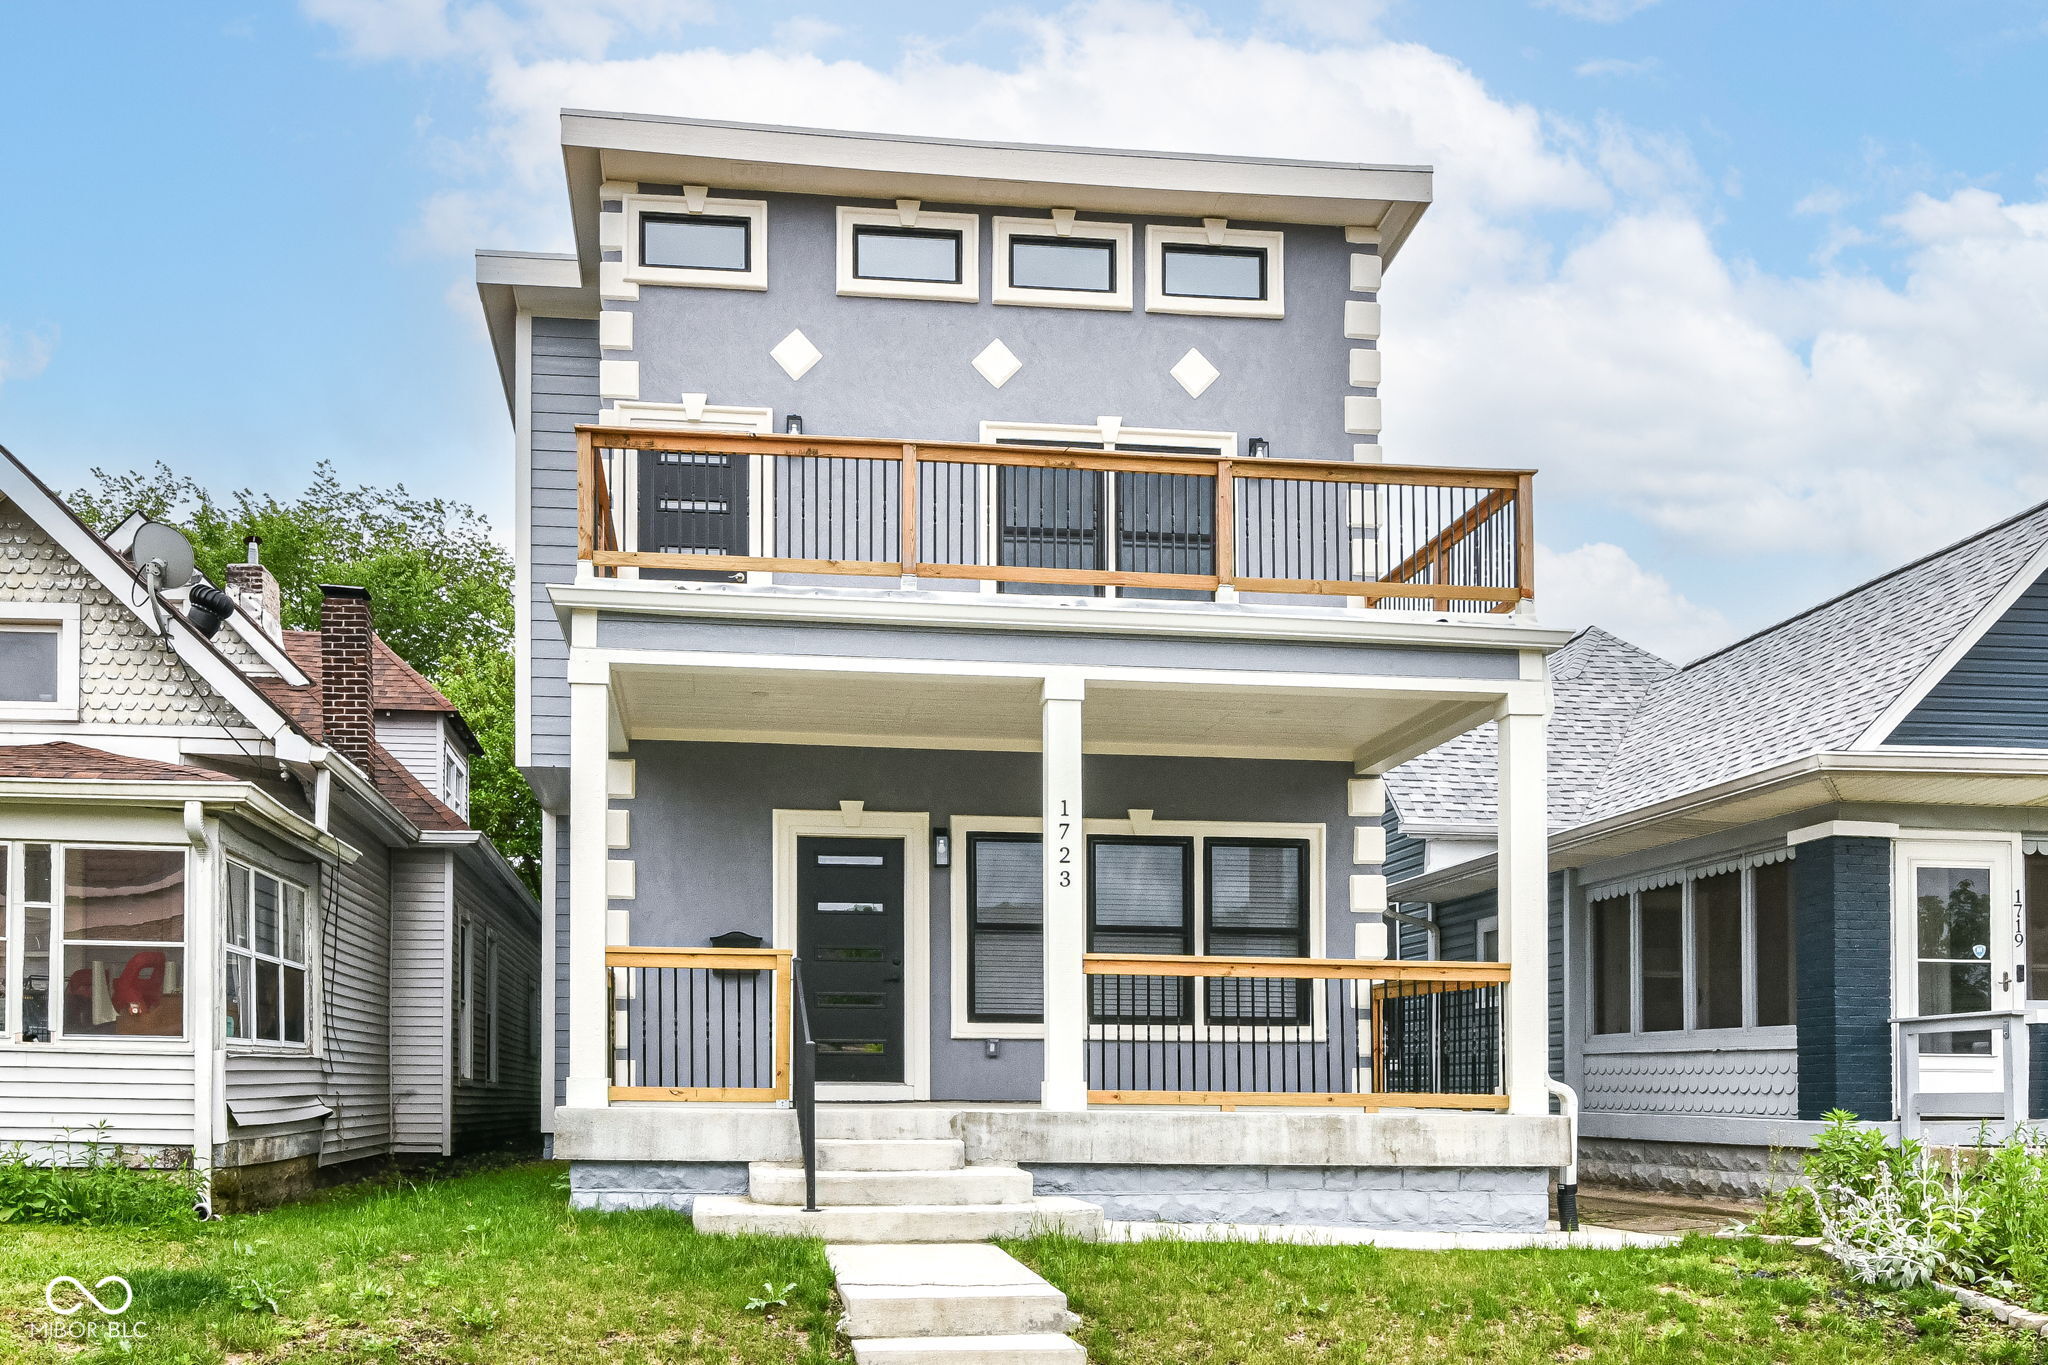
Active
$719,000
5
bds
|
5
ba
|
3,240
sqft
|
built
1910
1723 Fletcher Ave, Indianapolis, IN 46203
$-1,268
Cash flow
-9.2%
Cash-on-Cash Return
4.0%
Cap rate
0.5%
Rent to Value Ratio
Active
$369,900
4
bds
|
3
ba
|
3,294
sqft
|
built
2005
10903 Greenleaf Dr, Indianapolis, IN 46229
$-195
Cash flow
-2.8%
Cash-on-Cash Return
5.5%
Cap rate
0.7%
Rent to Value Ratio
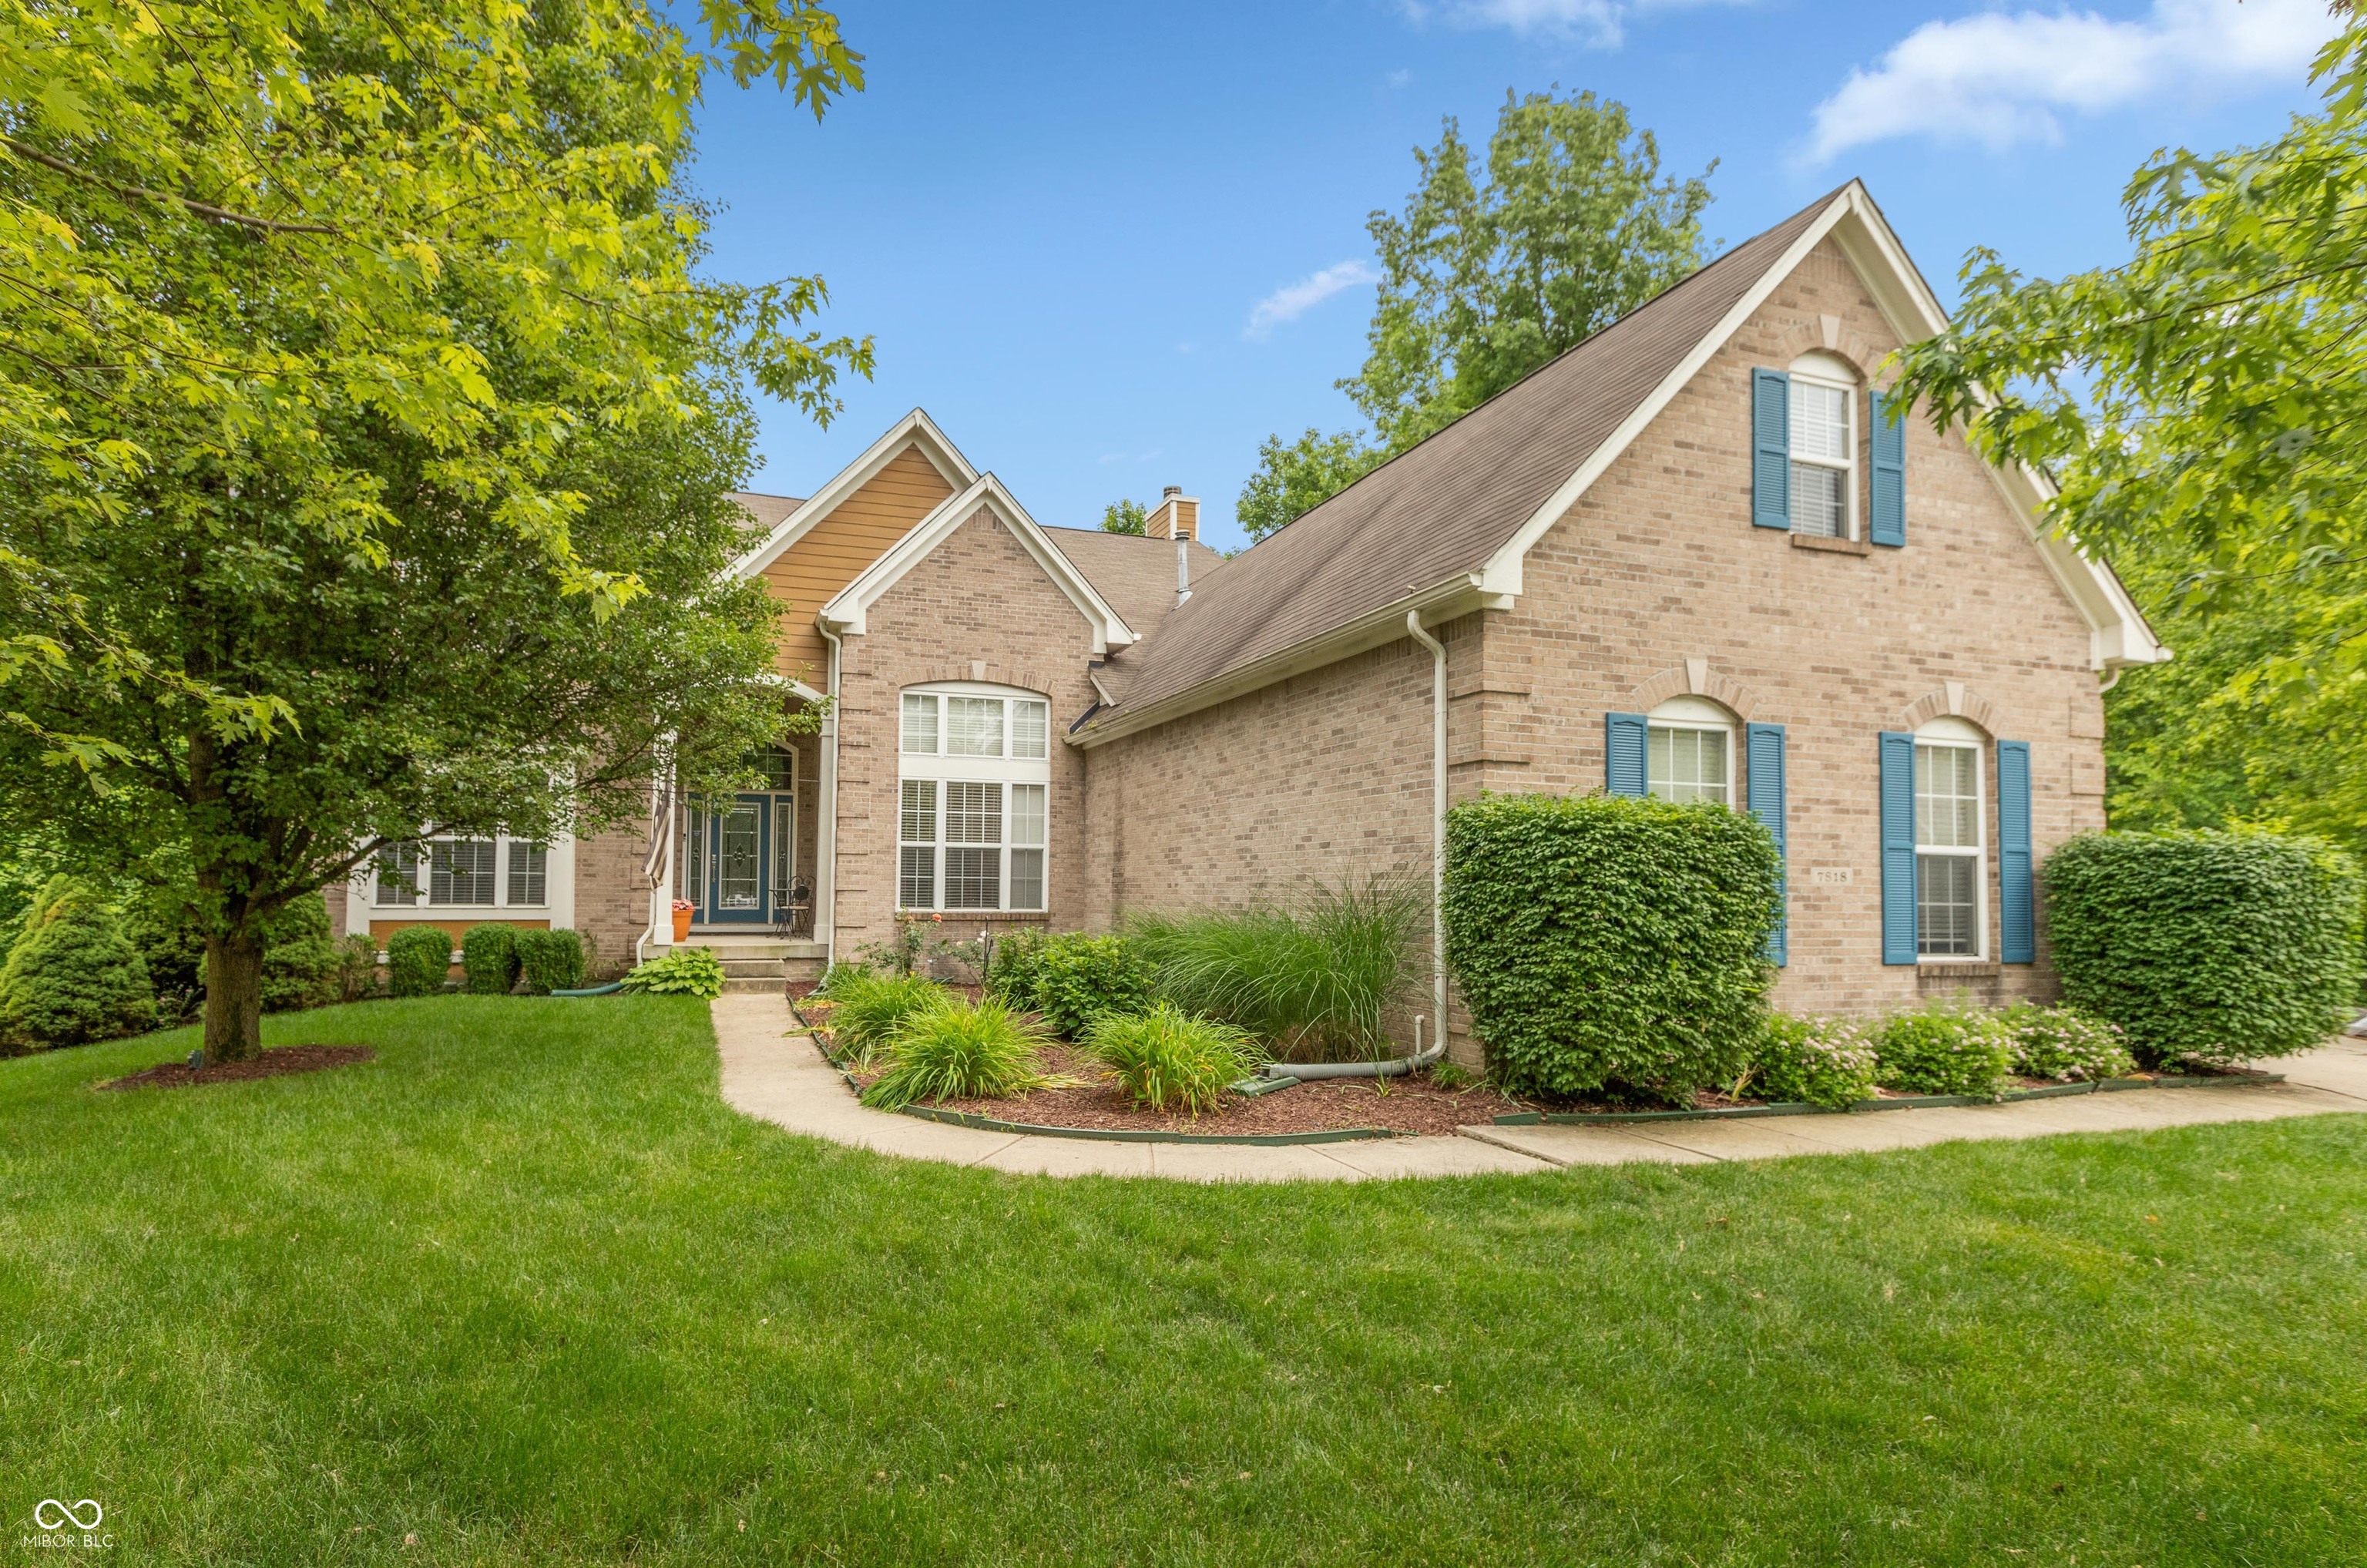
Active
$620,000
4
bds
|
4
ba
|
4,825
sqft
|
built
2004
7818 Fawnwood Dr, Indianapolis, IN 46278
$-874
Cash flow
-7.4%
Cash-on-Cash Return
4.5%
Cap rate
0.6%
Rent to Value Ratio
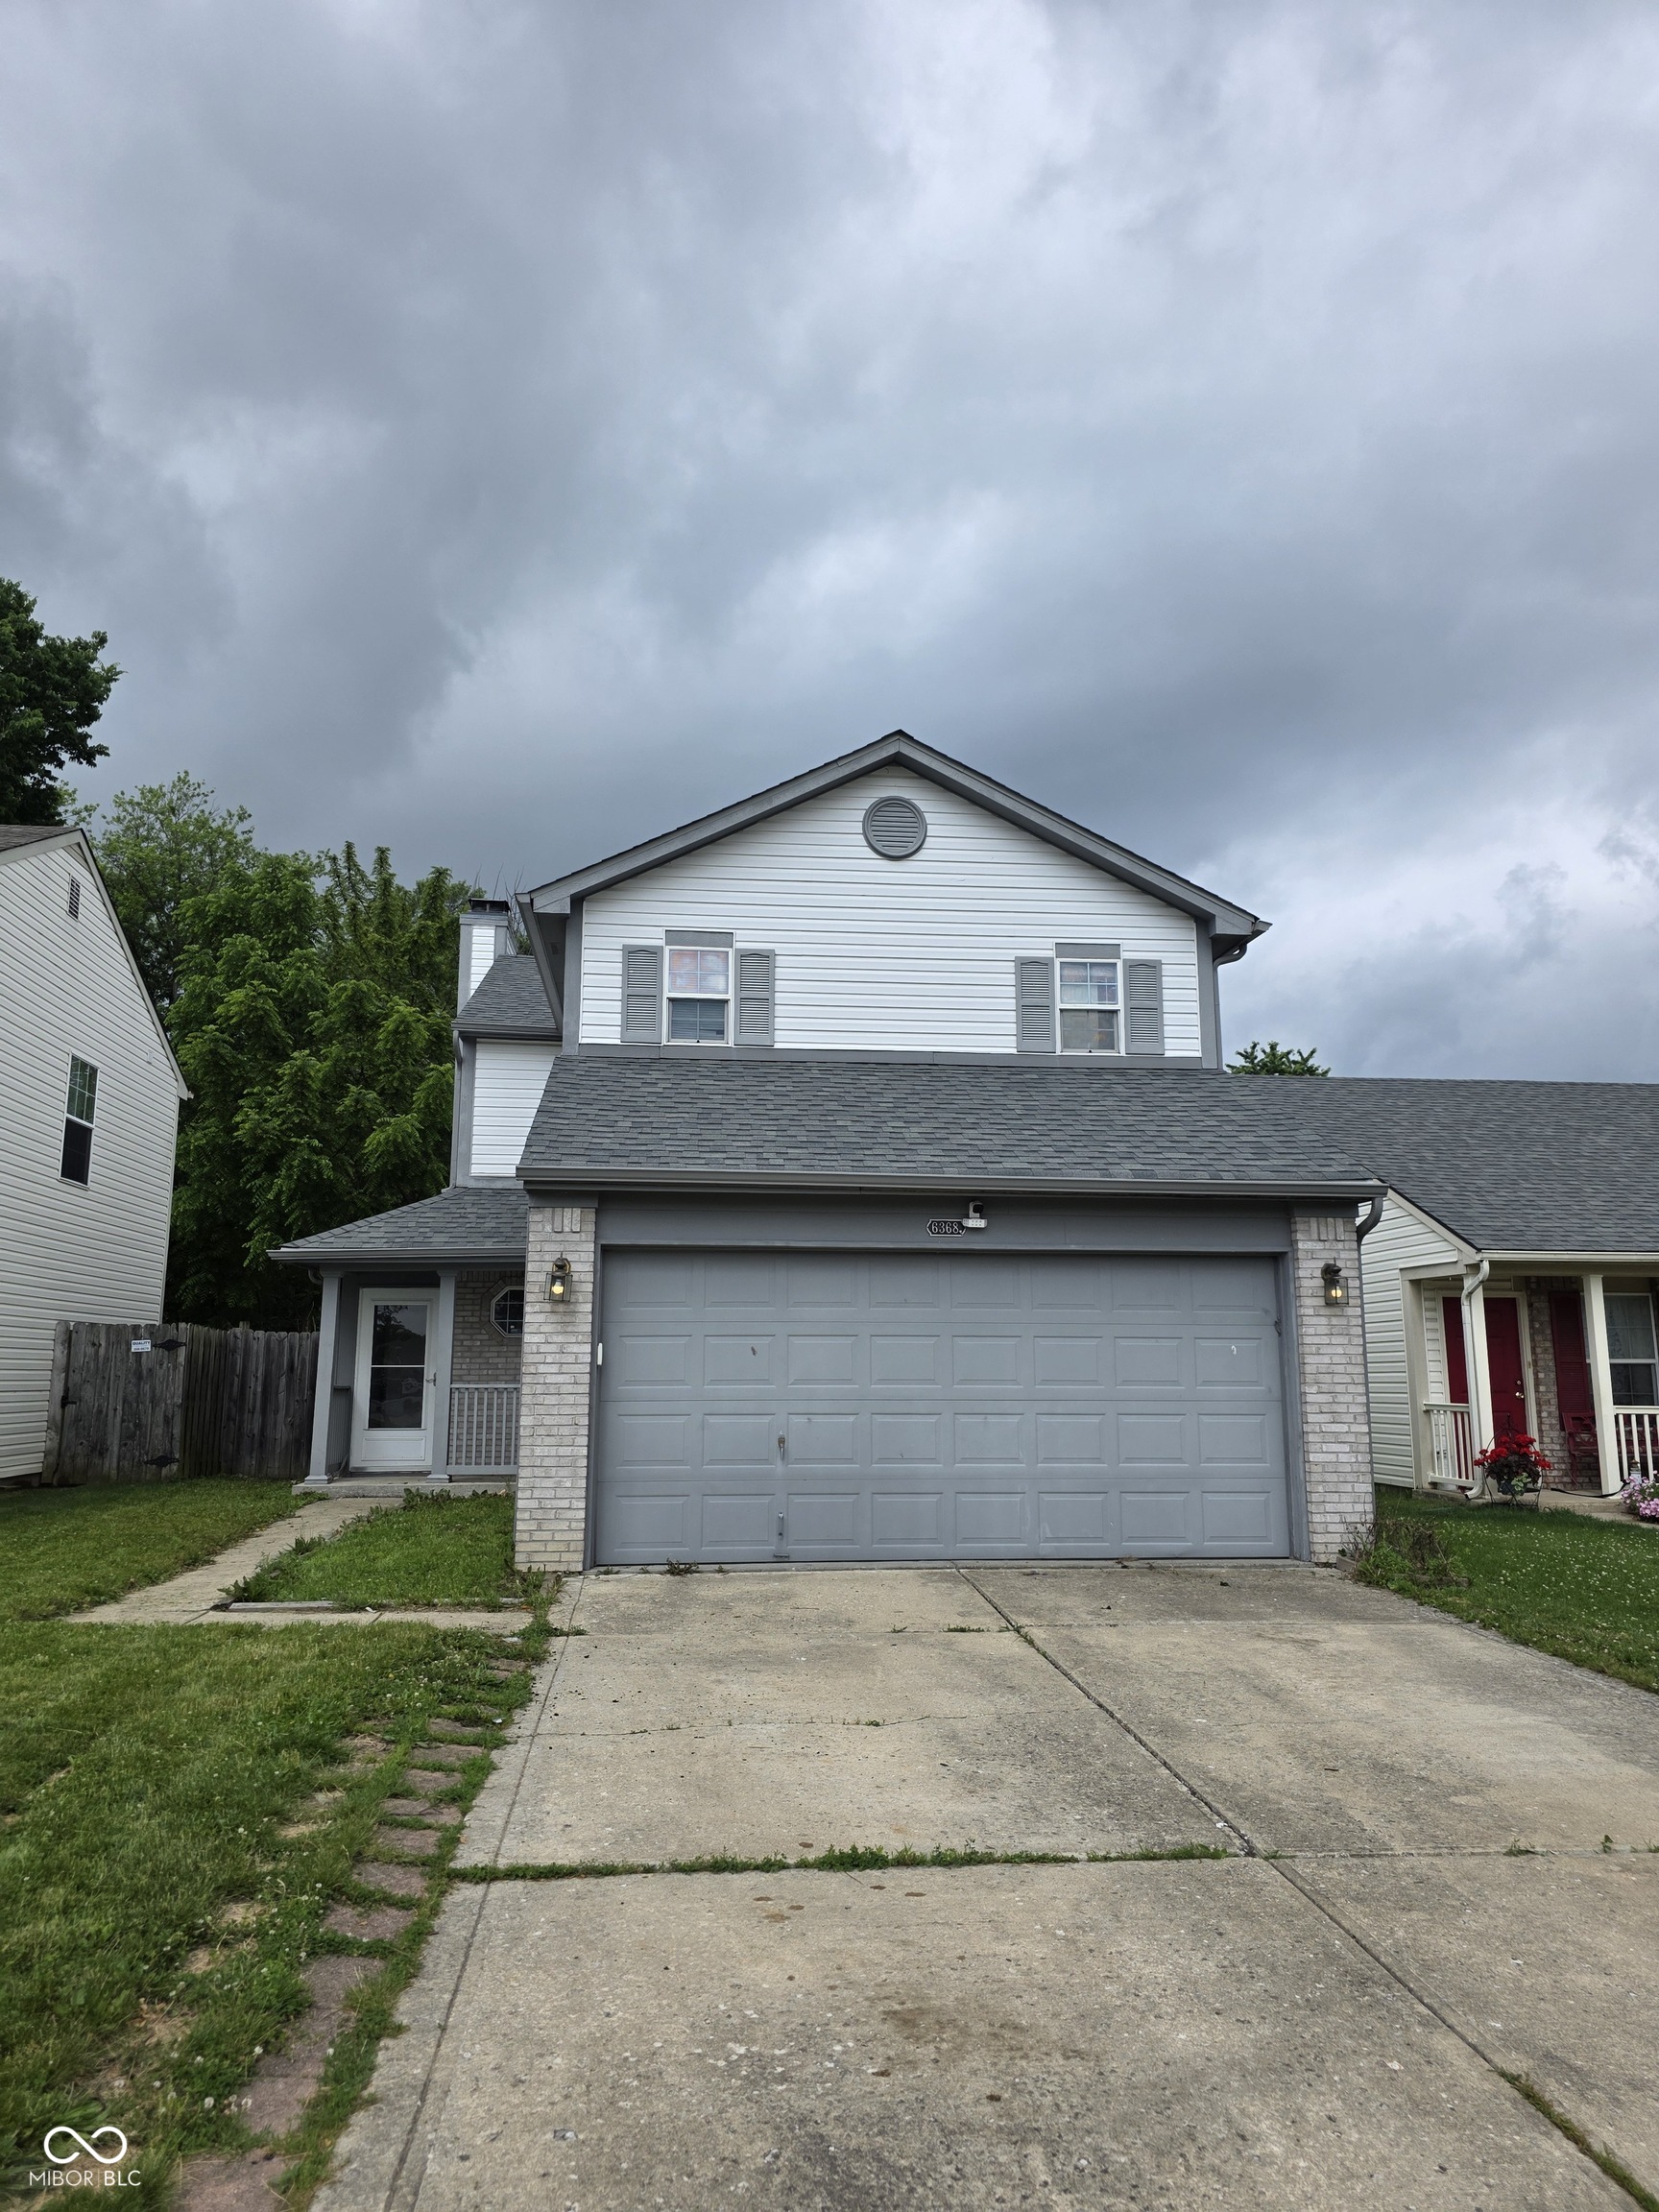
Active
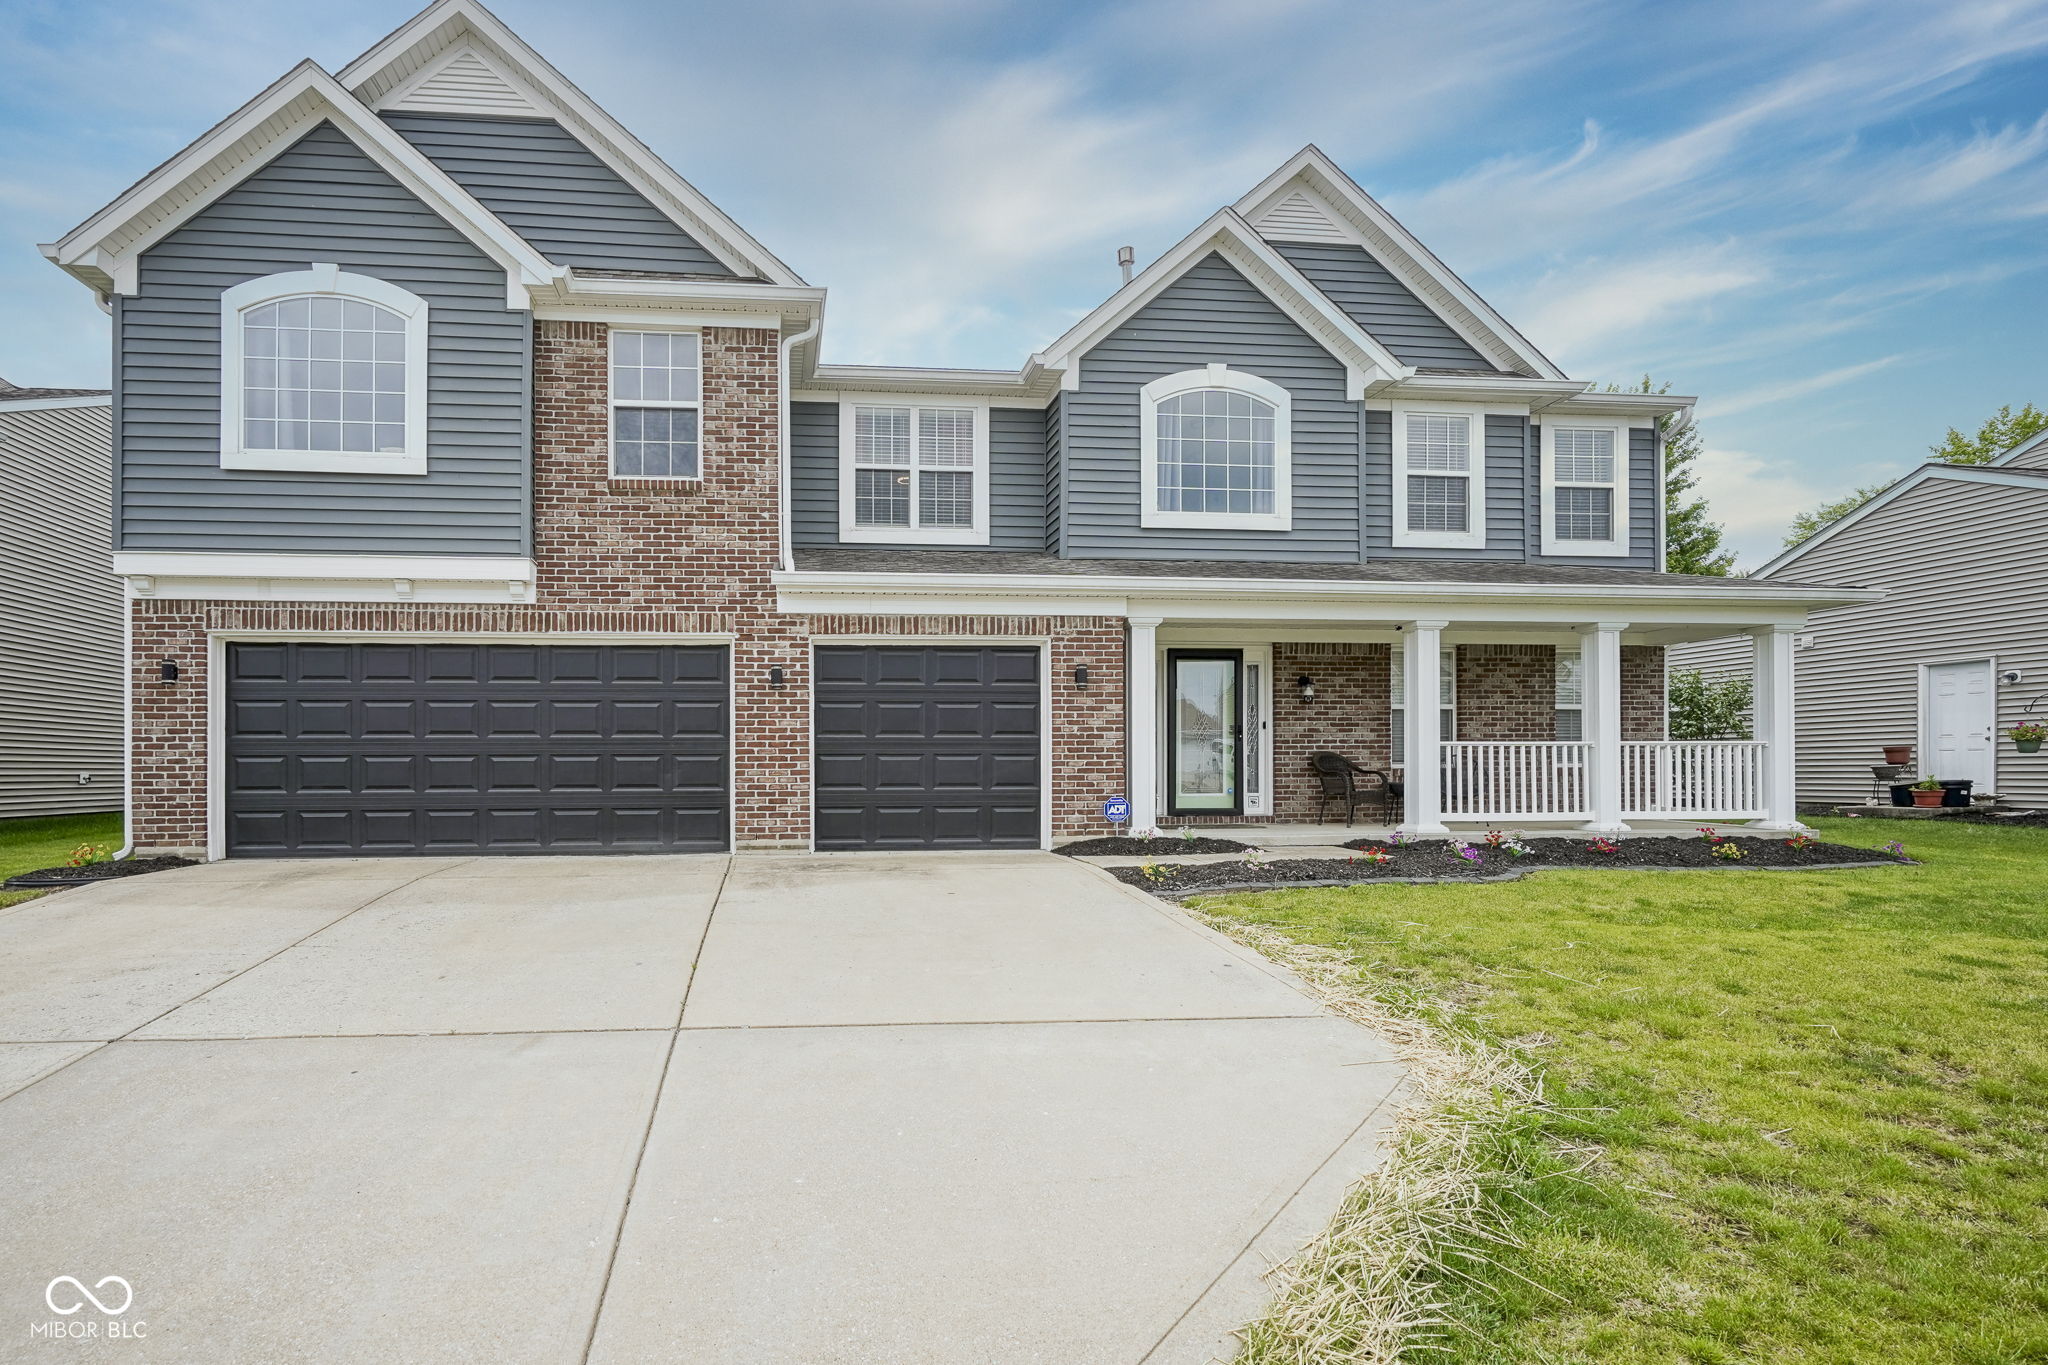
$300,000
4
bds
|
3
ba
|
1,517
sqft
|
built
1999
6368 Titania Dr, Indianapolis, IN 46236
$-295
Cash flow
-5.1%
Cash-on-Cash Return
5.0%
Cap rate
0.6%
Rent to Value Ratio
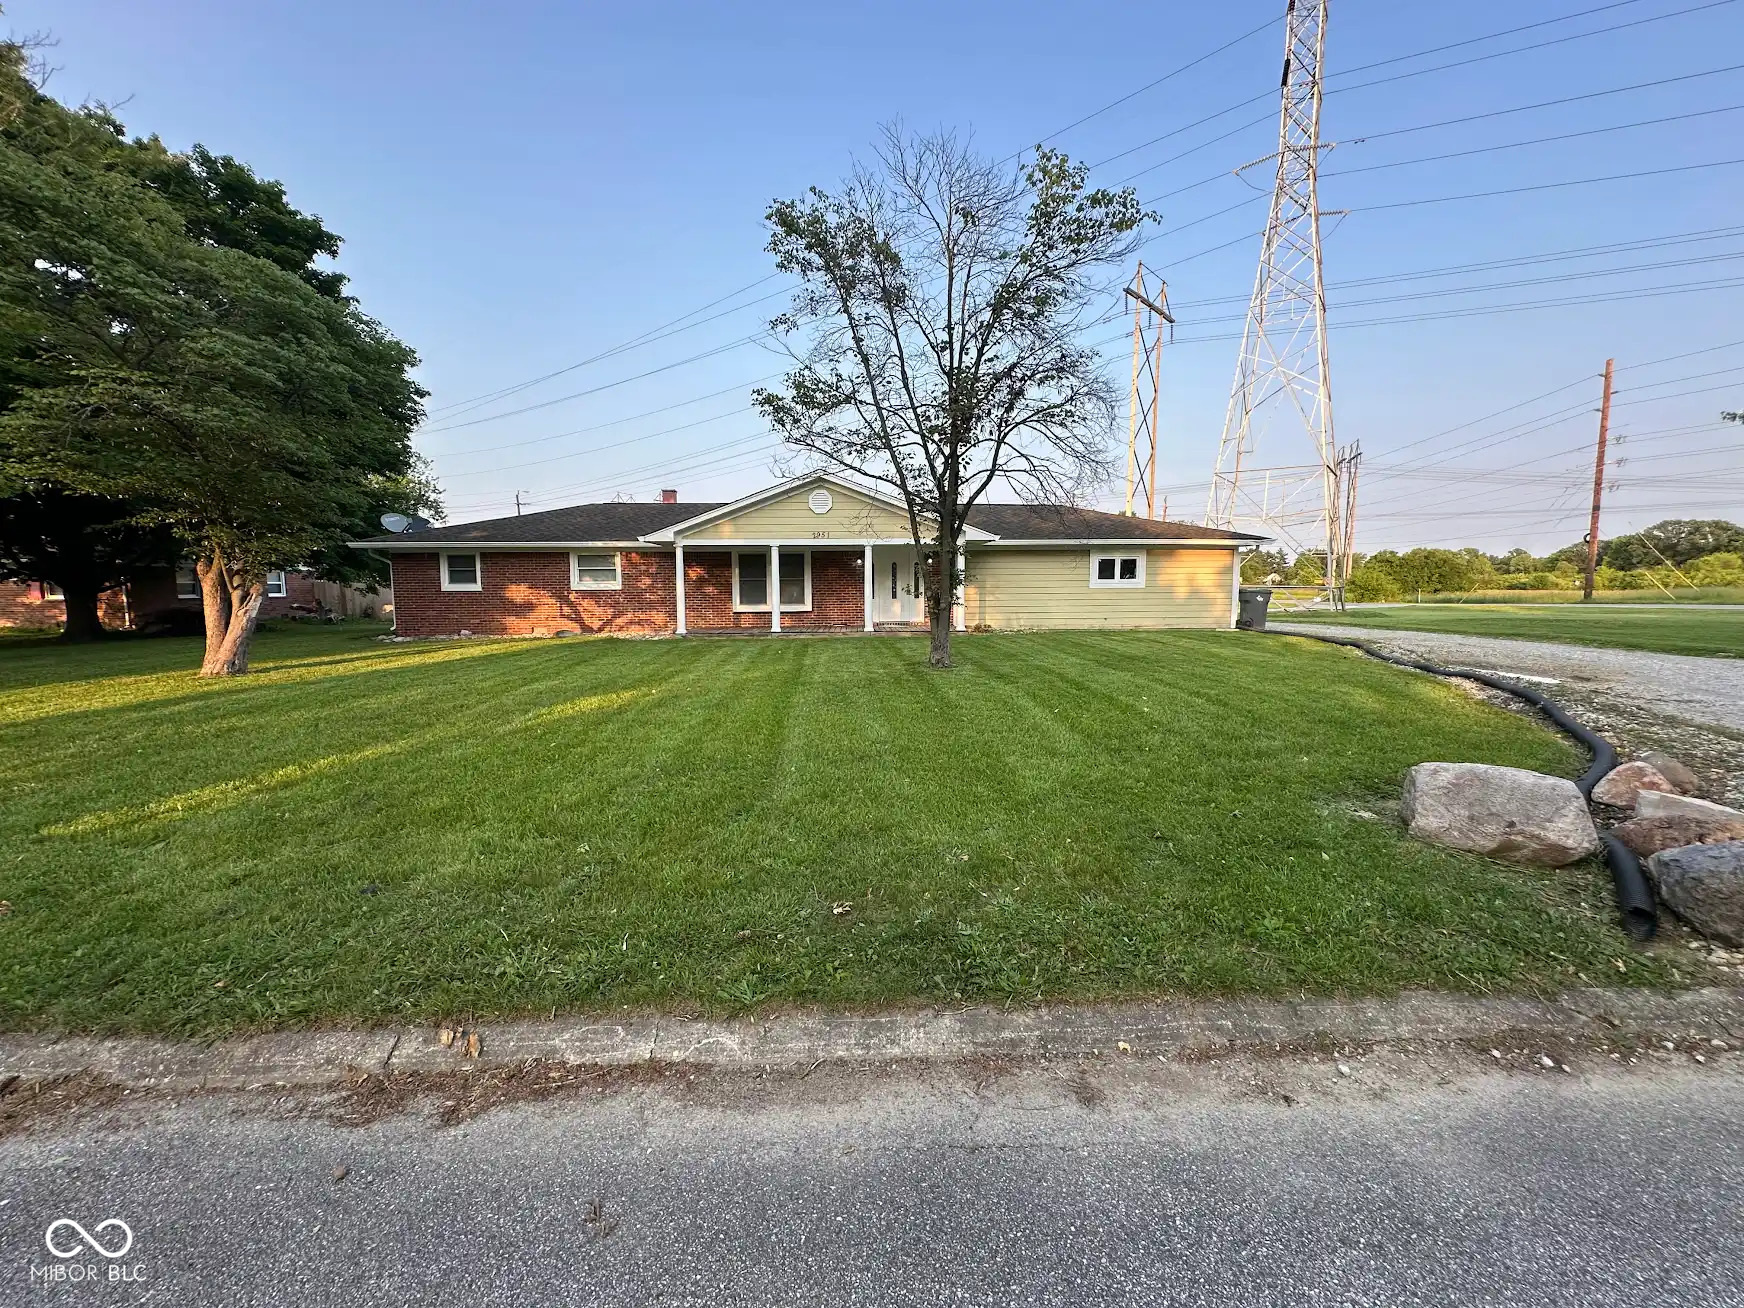
Active
$259,900
3
bds
|
2
ba
|
1,377
sqft
|
built
1965
2951 S Elizabeth St, Indianapolis, IN 46203
$-227
Cash flow
-4.6%
Cash-on-Cash Return
5.1%
Cap rate
0.6%
Rent to Value Ratio
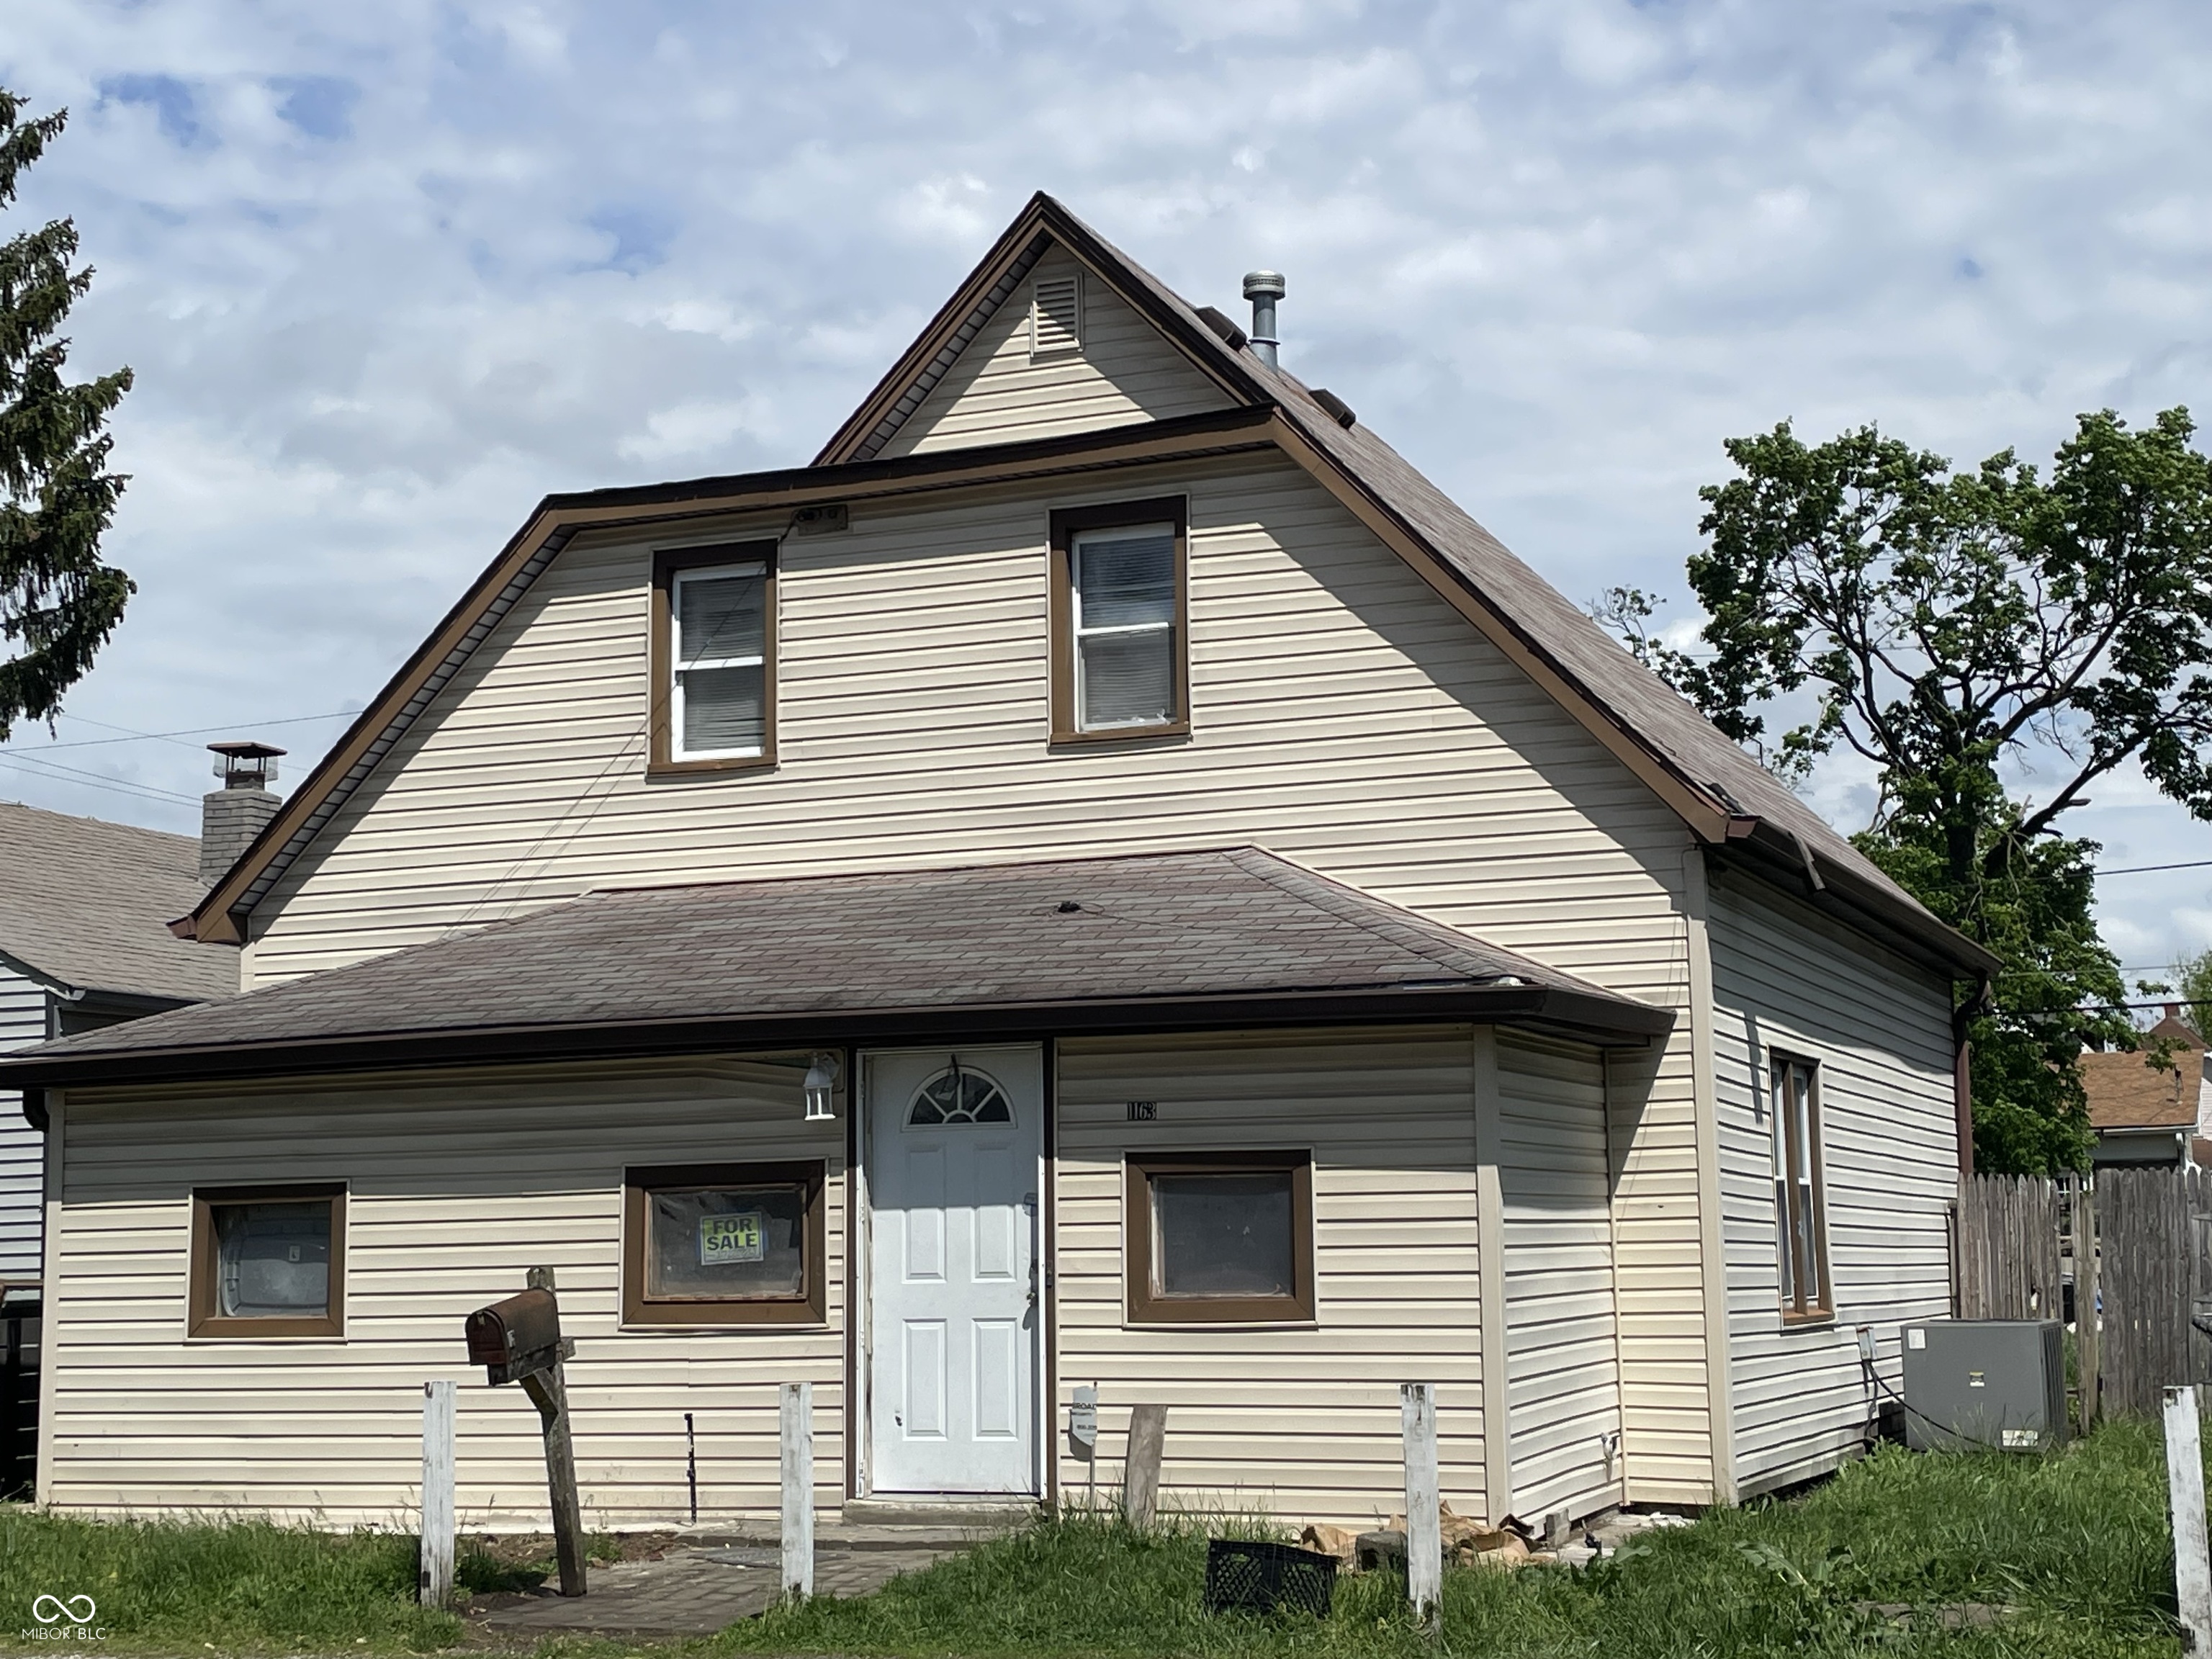
Active
$124,900
3
bds
|
1
ba
|
1,624
sqft
|
built
1920
1163 Groff Ave, Indianapolis, IN 46222
$326
Cash flow
13.6%
Cash-on-Cash Return
9.3%
Cap rate
1.1%
Rent to Value Ratio
Active
$564,999
4
bds
|
3
ba
|
3,982
sqft
|
built
1961
11603 Maze Rd, Indianapolis, IN 46259
$-962
Cash flow
-8.9%
Cash-on-Cash Return
4.1%
Cap rate
0.5%
Rent to Value Ratio
Active
$264,500
4
bds
|
2
ba
|
1,628
sqft
|
built
1968
1543 W 79th St, Indianapolis, IN 46260
$25
Cash flow
0.5%
Cash-on-Cash Return
6.3%
Cap rate
0.8%
Rent to Value Ratio
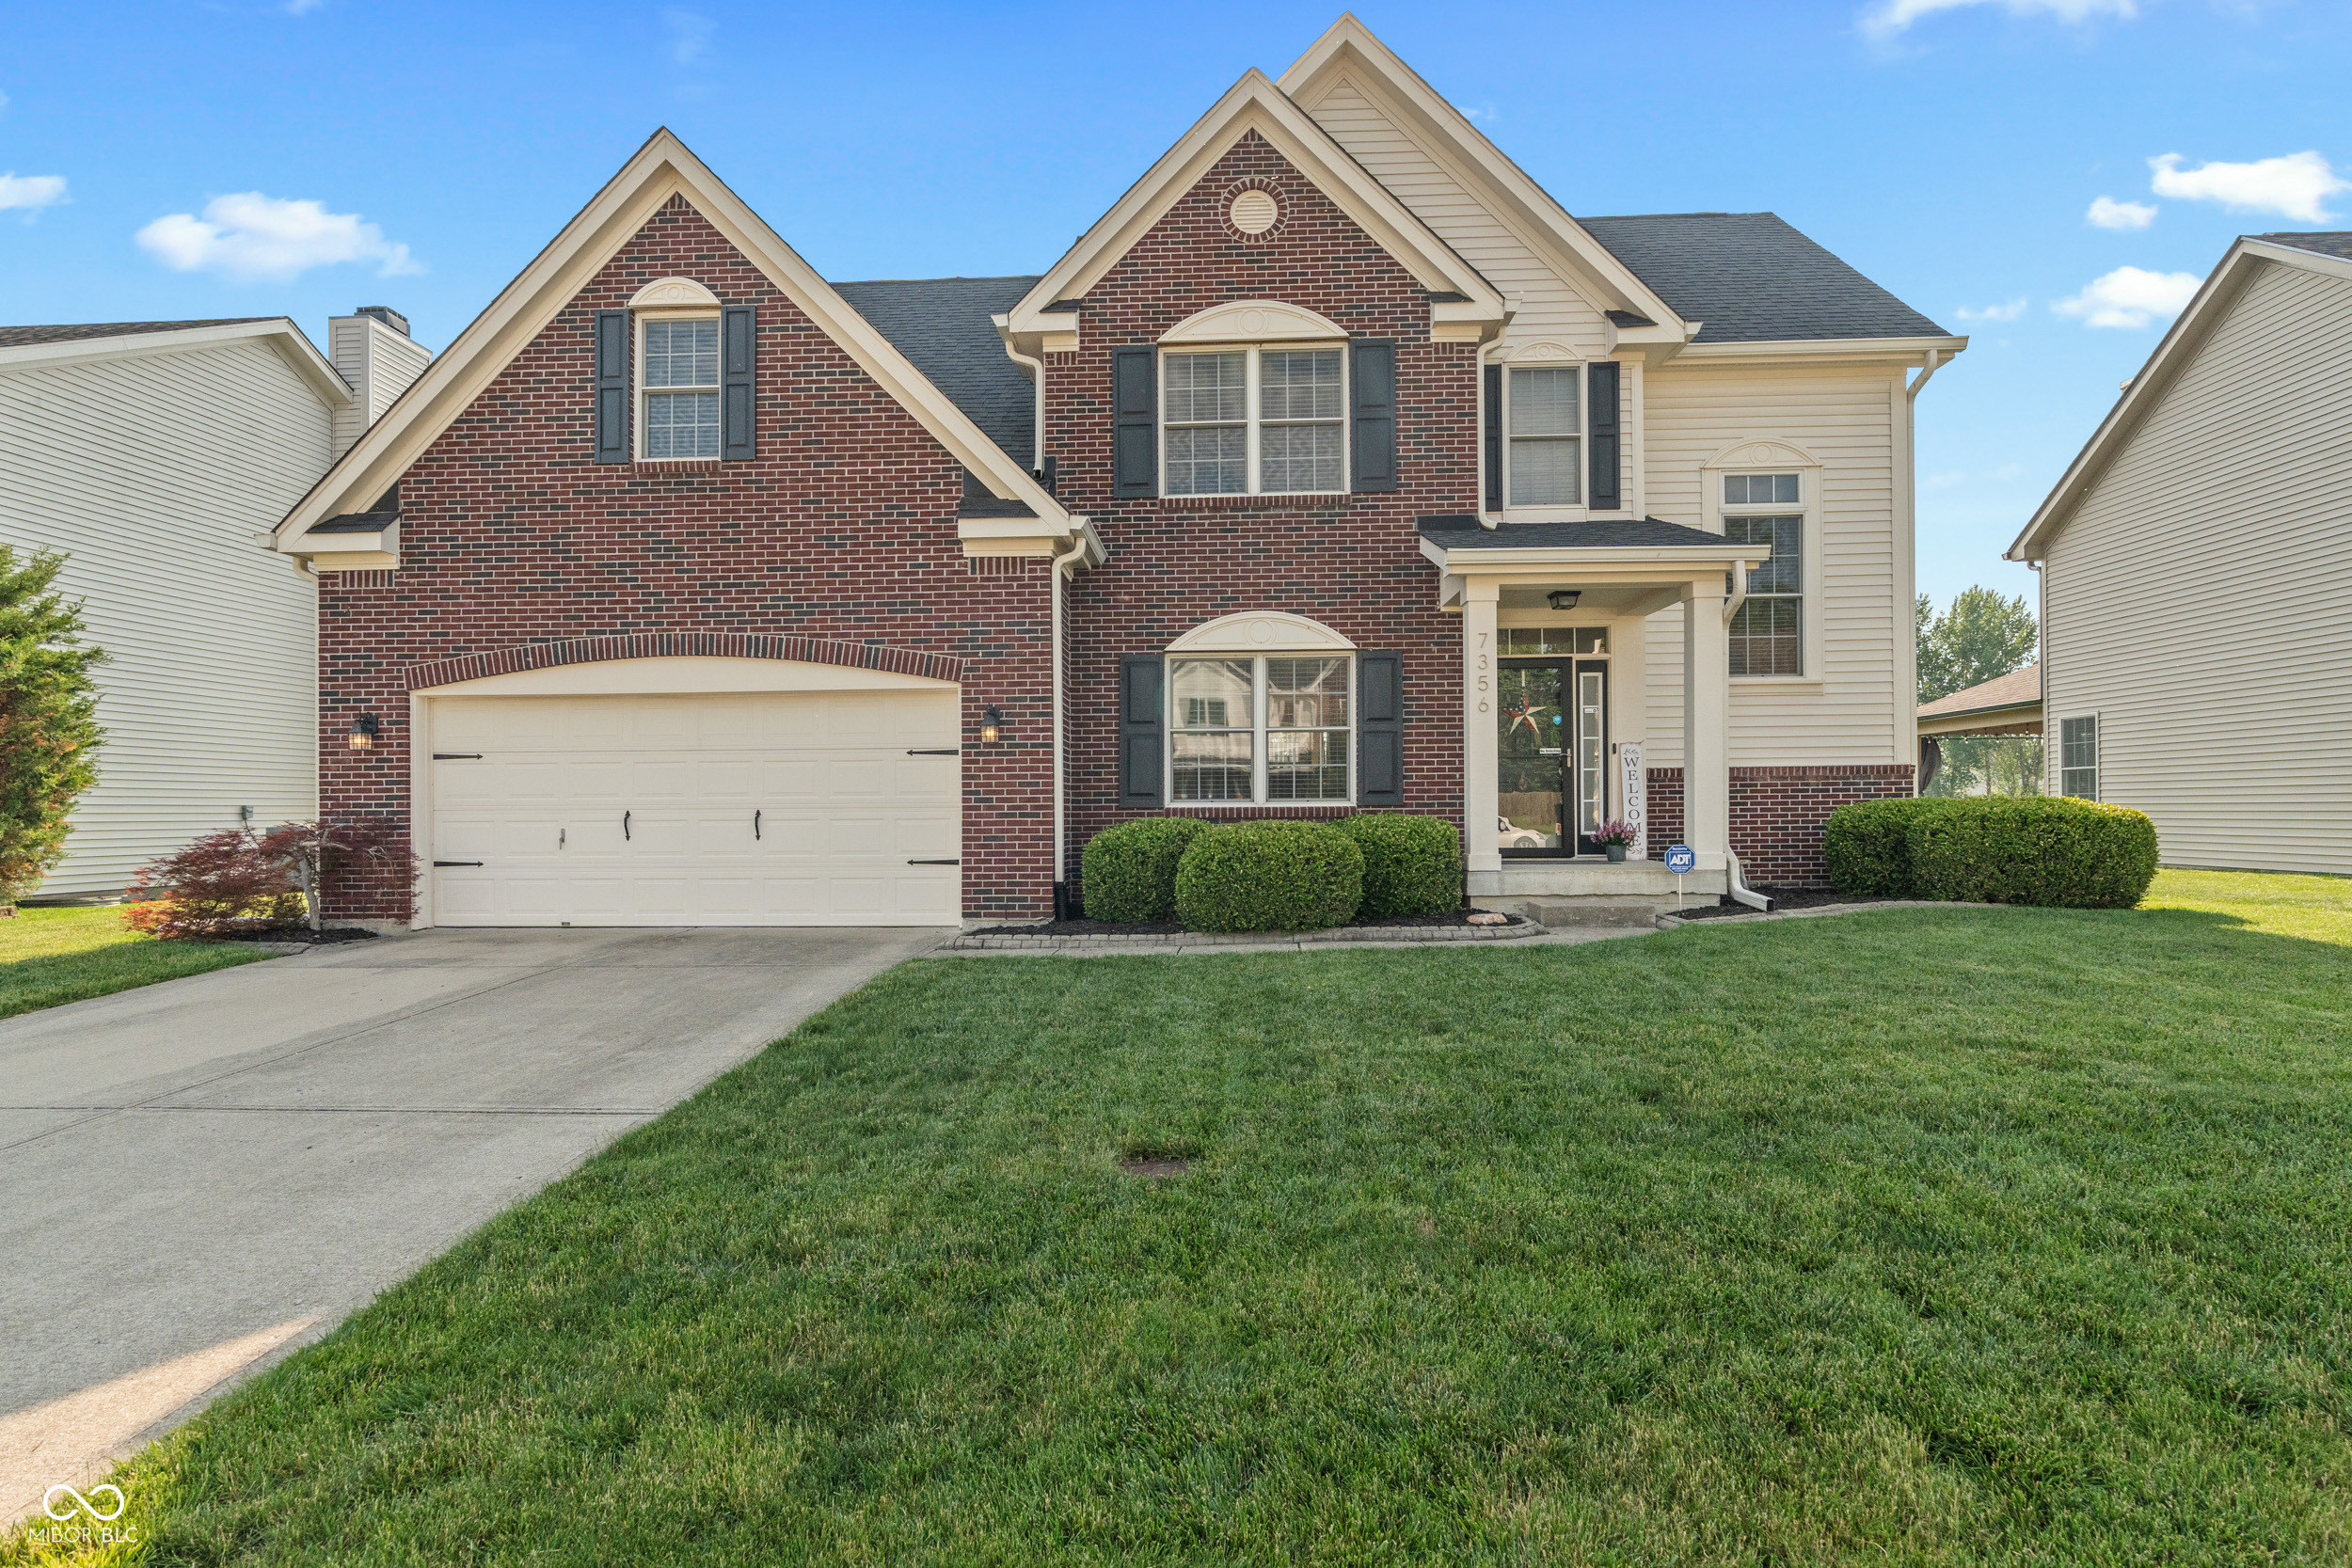
Pending
$350,000
3
bds
|
3
ba
|
1,991
sqft
|
built
2003
7356 Woodington Pl, Indianapolis, IN 46259
$-114
Cash flow
-1.7%
Cash-on-Cash Return
5.8%
Cap rate
0.7%
Rent to Value Ratio
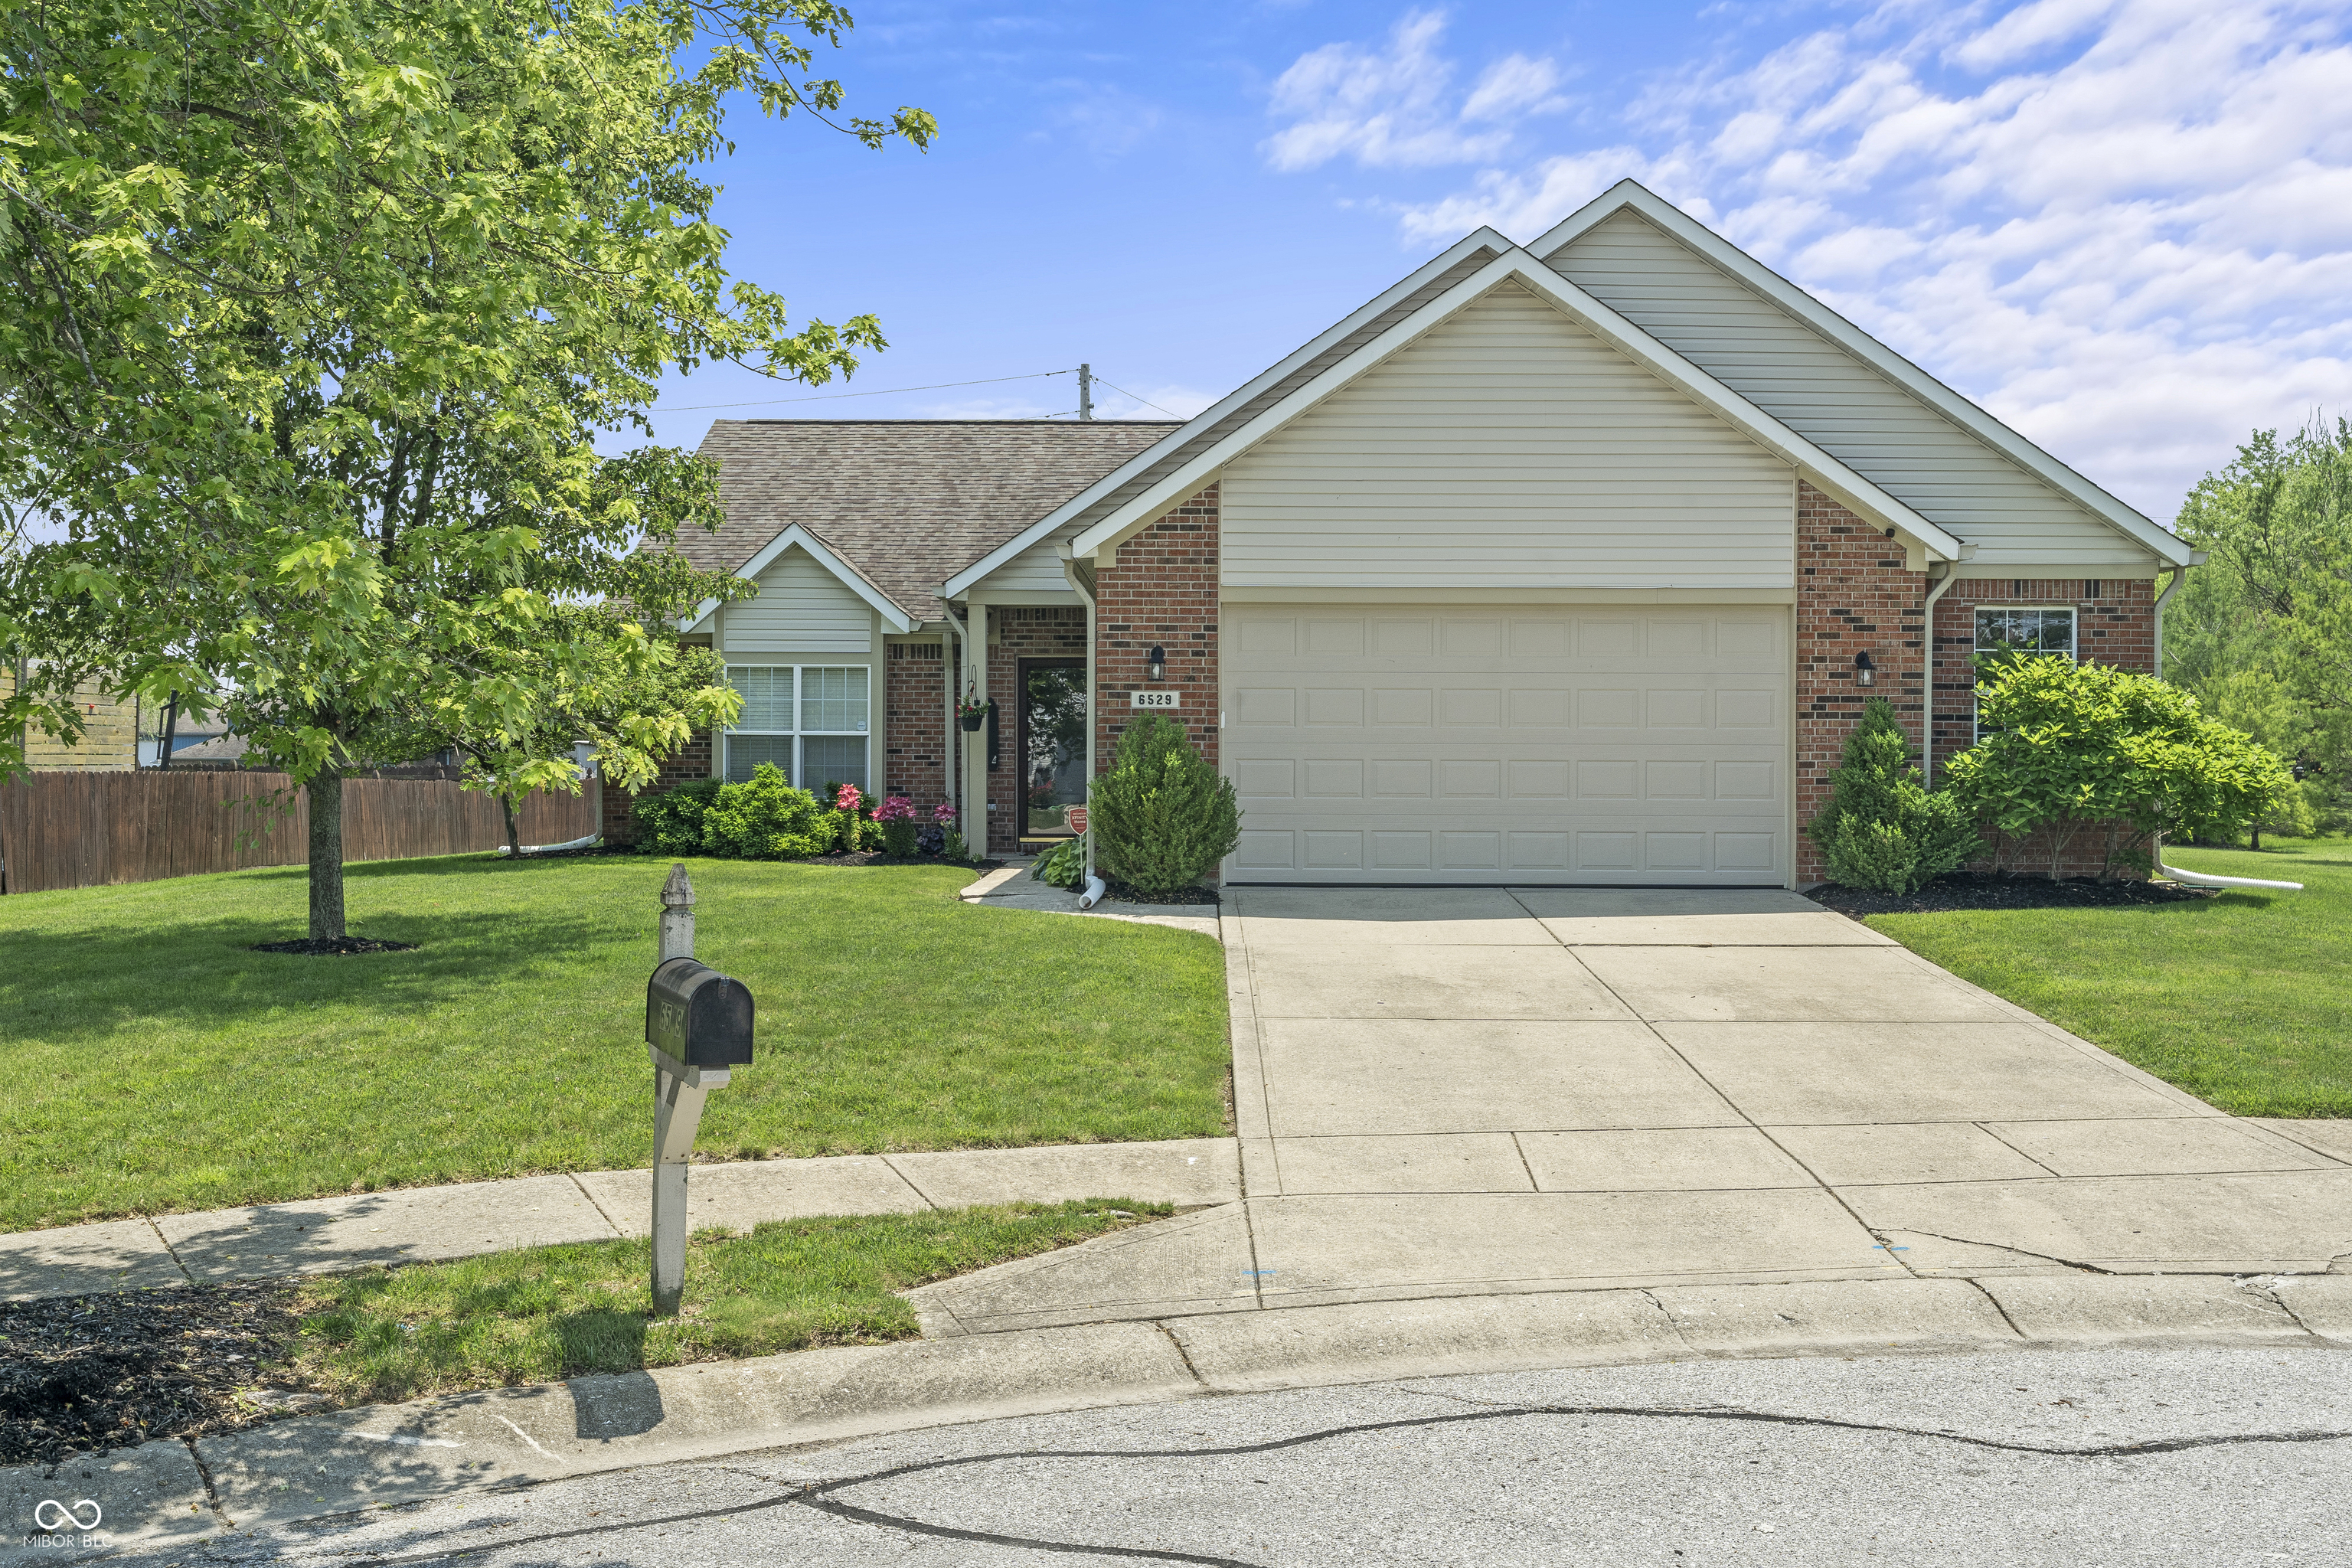
Pending
$273,500
3
bds
|
2
ba
|
1,440
sqft
|
built
1999
6529 Lakesedge Dr, Indianapolis, IN 46237
$-190
Cash flow
-3.6%
Cash-on-Cash Return
5.3%
Cap rate
0.7%
Rent to Value Ratio
Pending
$650,000
3
bds
|
3
ba
|
2,382
sqft
|
built
1987
3532 Clearwater Cir, Indianapolis, IN 46240
$-1,617
Cash flow
-13.0%
Cash-on-Cash Return
3.2%
Cap rate
0.5%
Rent to Value Ratio
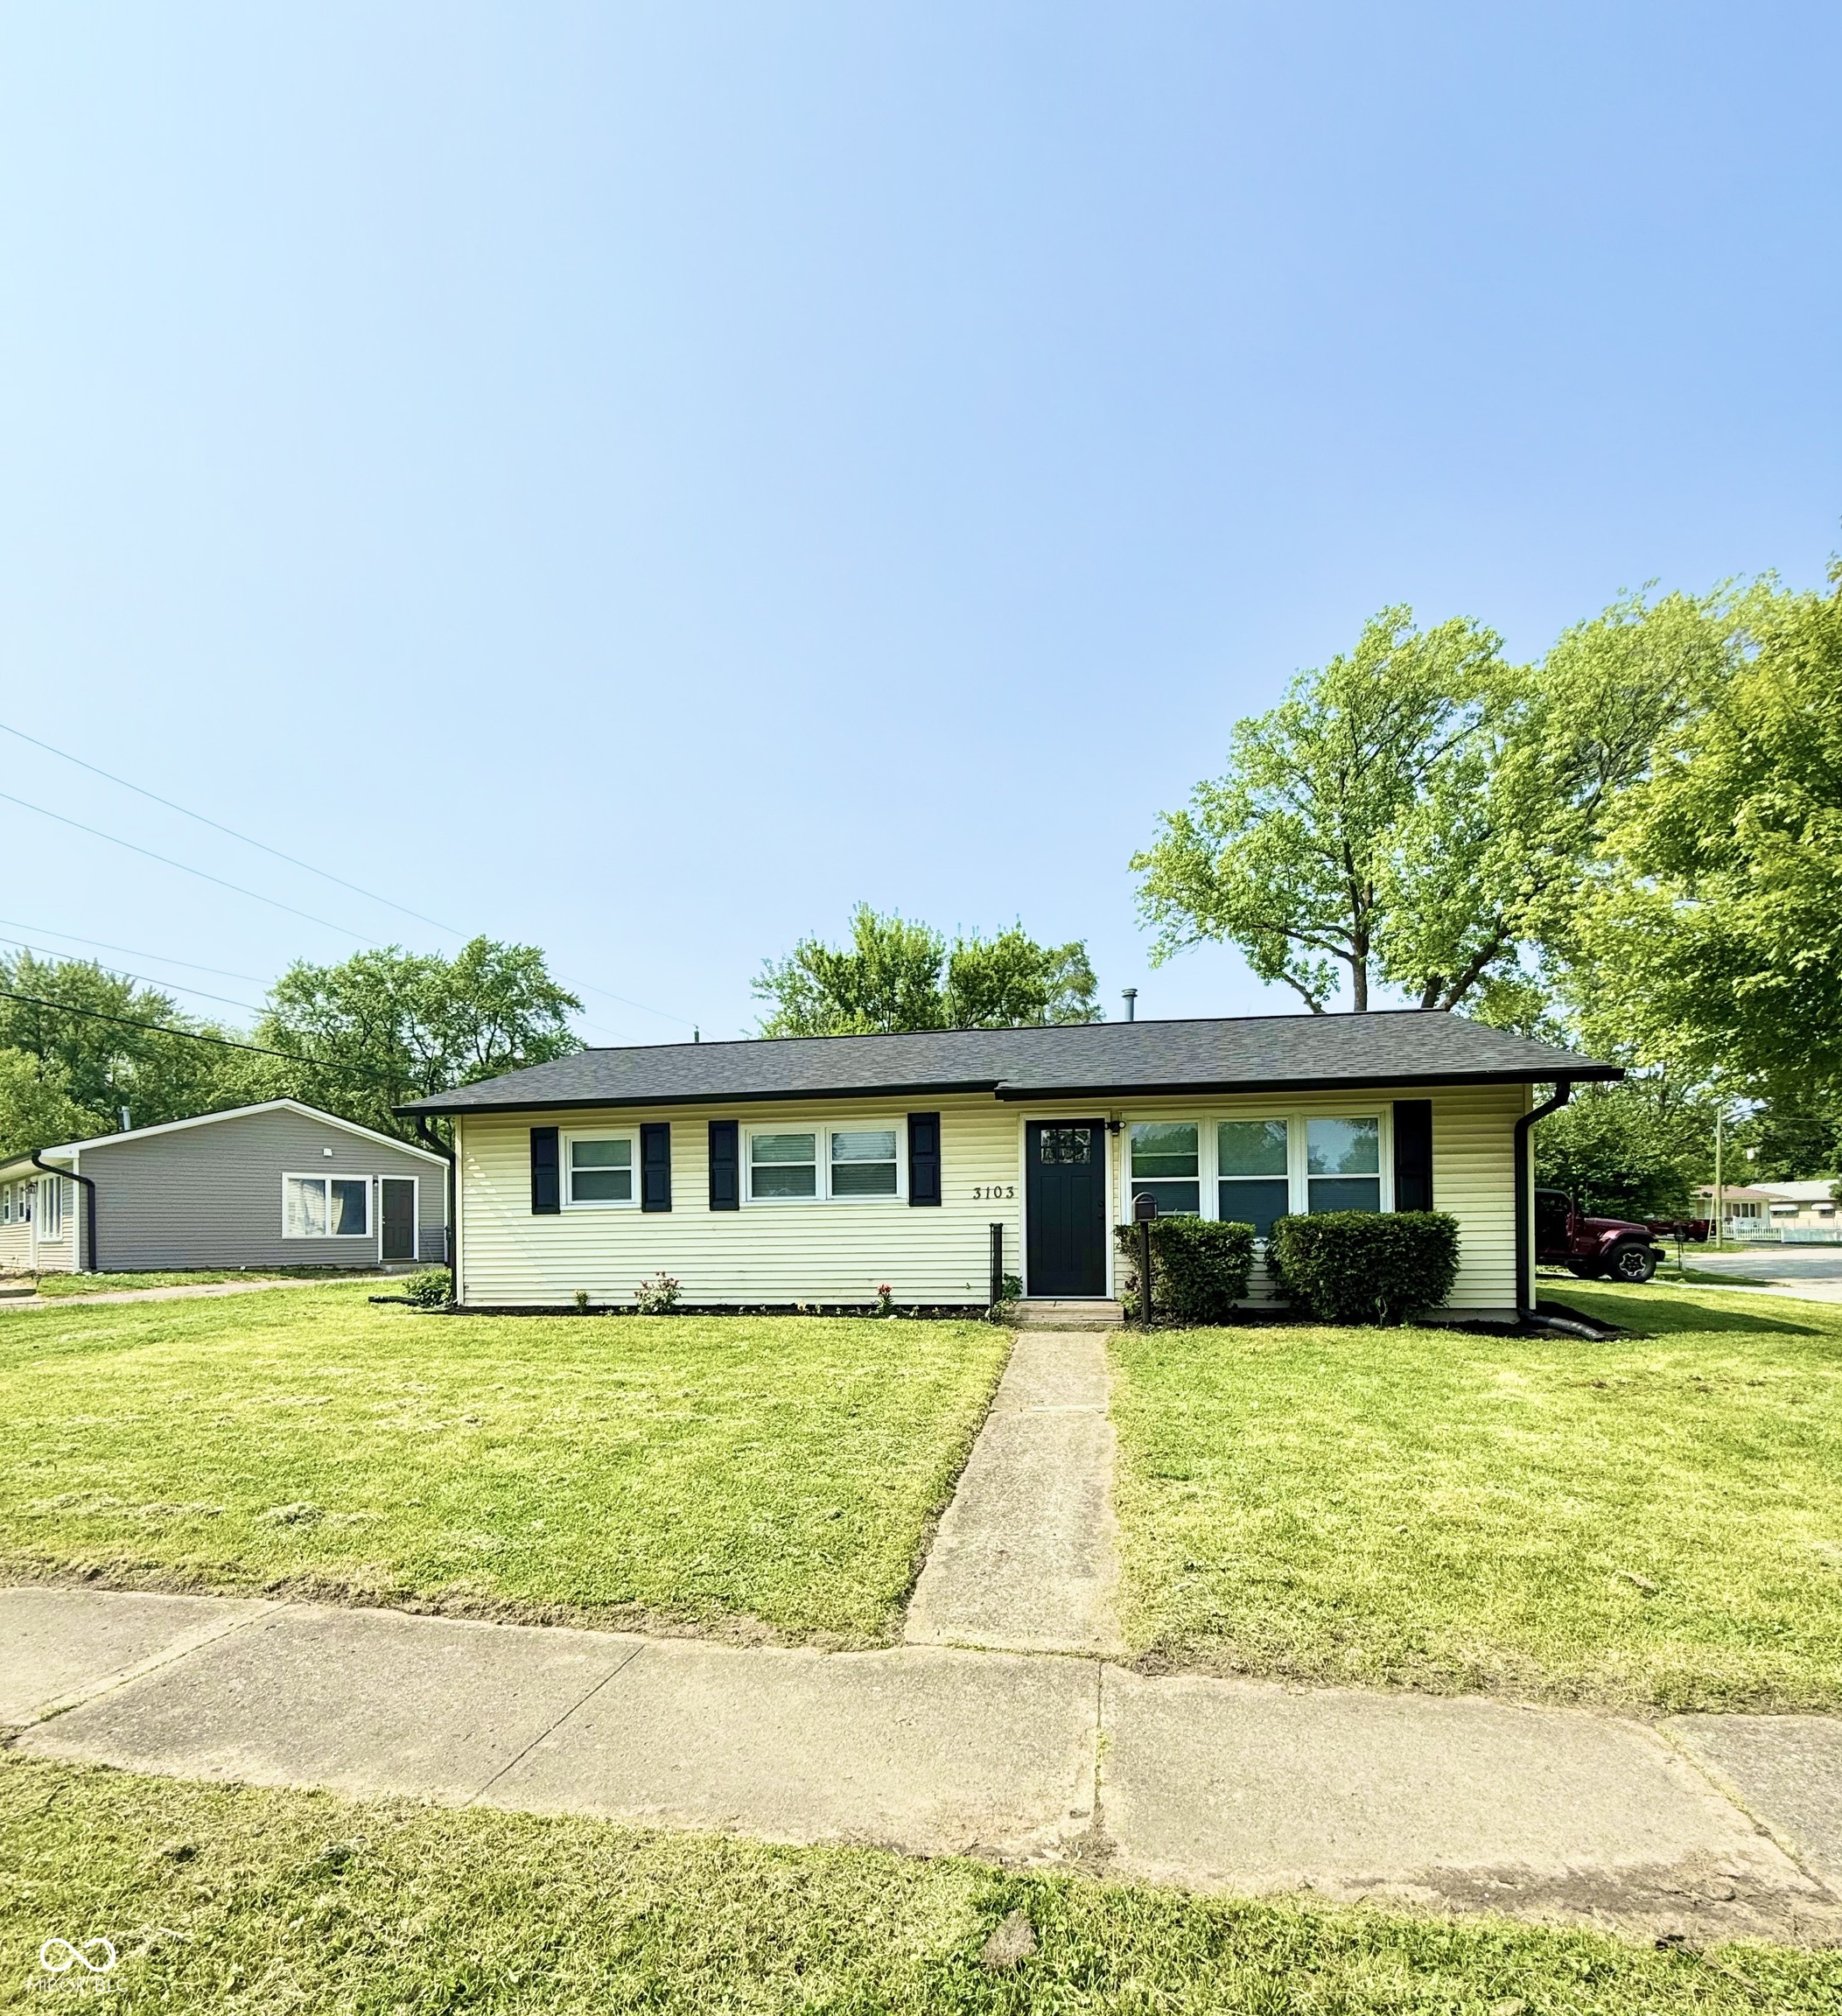
Pending
$189,900
4
bds
|
1
ba
|
1,000
sqft
|
built
1955
3103 Keswick Rd, Indianapolis, IN 46222
$-214
Cash flow
-5.9%
Cash-on-Cash Return
4.8%
Cap rate
0.6%
Rent to Value Ratio
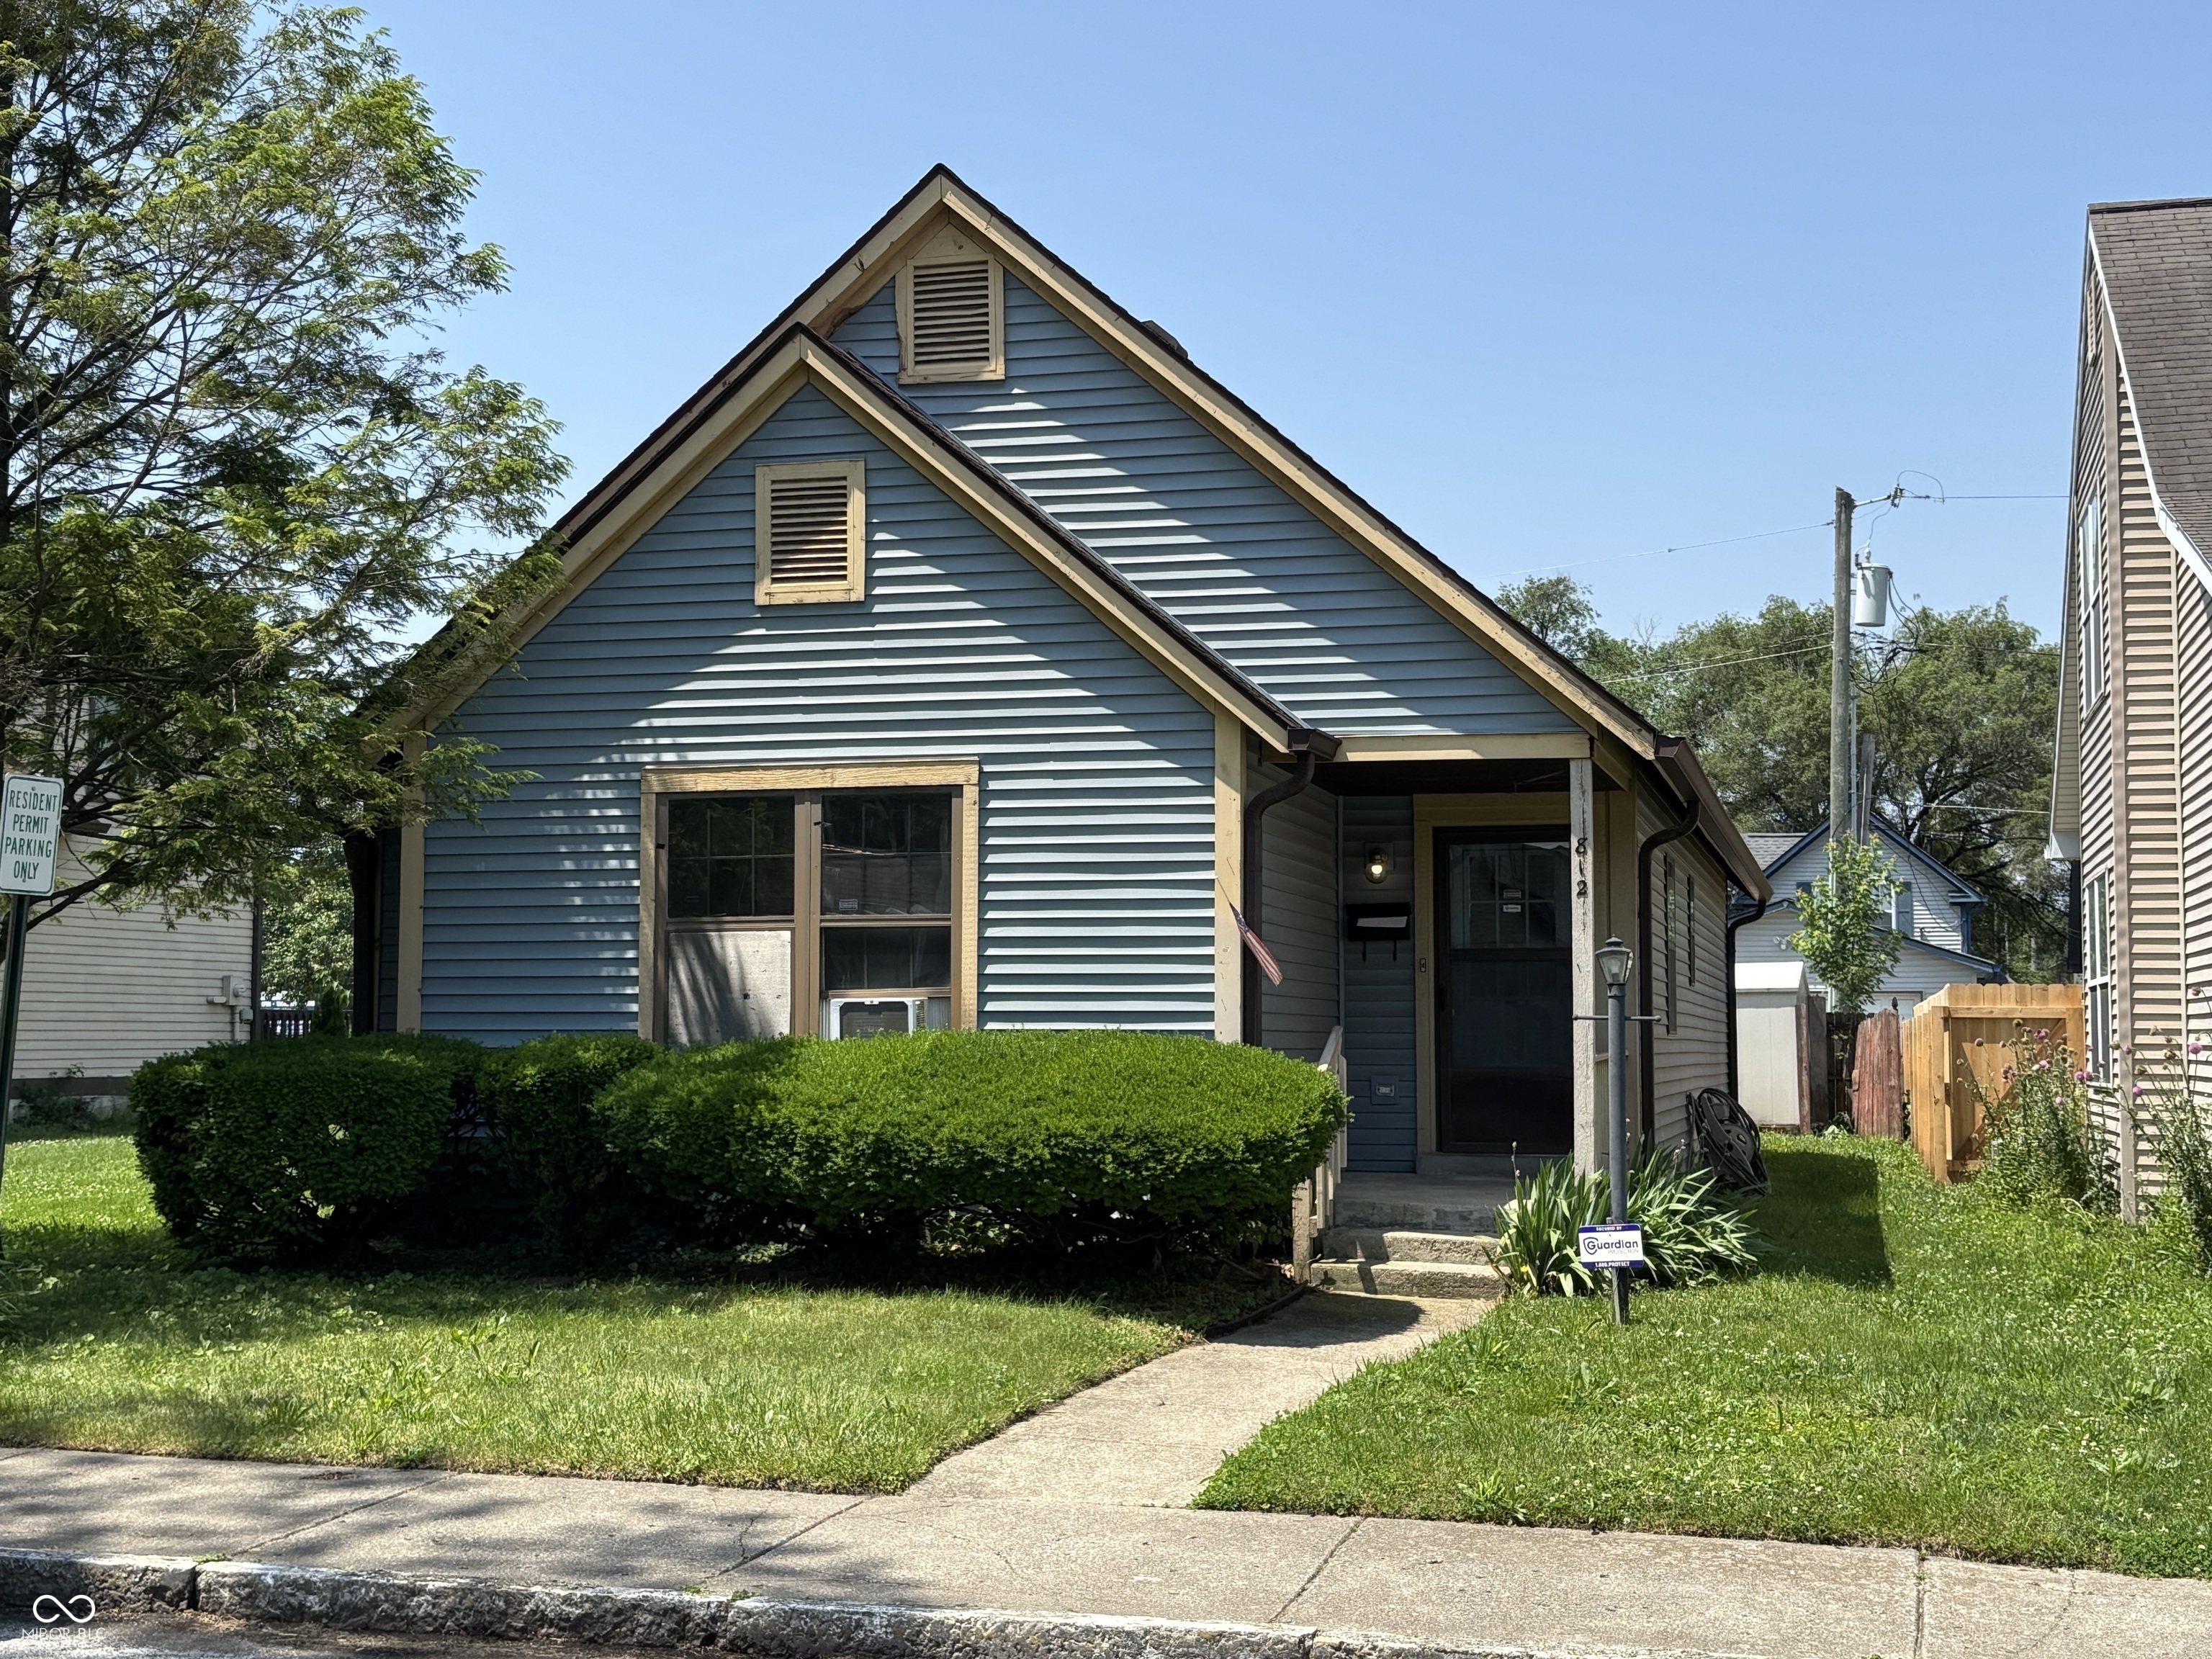
Pending
$198,000
3
bds
|
1
ba
|
1,120
sqft
|
built
1990
812 N California St, Indianapolis, IN 46202
$228
Cash flow
6.0%
Cash-on-Cash Return
7.5%
Cap rate
0.9%
Rent to Value Ratio
Pending
$275,000
4
bds
|
2
ba
|
2,105
sqft
|
built
2001
10693 Newgate Ln, Indianapolis, IN 46231
$-49
Cash flow
-0.9%
Cash-on-Cash Return
5.9%
Cap rate
0.7%
Rent to Value Ratio
Active
$259,900
2
bds
|
2
ba
|
1,712
sqft
|
built
2004
10668 Whippoorwill Ln, Indianapolis, IN 46231
$-34
Cash flow
-0.7%
Cash-on-Cash Return
6.0%
Cap rate
0.8%
Rent to Value Ratio
Pending
$1,099,900
4
bds
|
5
ba
|
9,322
sqft
|
built
1992
7624 William Penn Pl, Indianapolis, IN 46256
$-2,351
Cash flow
-11.2%
Cash-on-Cash Return
3.6%
Cap rate
0.5%
Rent to Value Ratio
Pending
$80,000
3
bds
|
2
ba
|
1,342
sqft
|
built
1959
3845 N Irvington Ave, Indianapolis, IN 46226
$694
Cash flow
45.3%
Cash-on-Cash Return
16.6%
Cap rate
2.0%
Rent to Value Ratio
Active
$615,000
3
bds
|
4
ba
|
2,374
sqft
|
built
2023
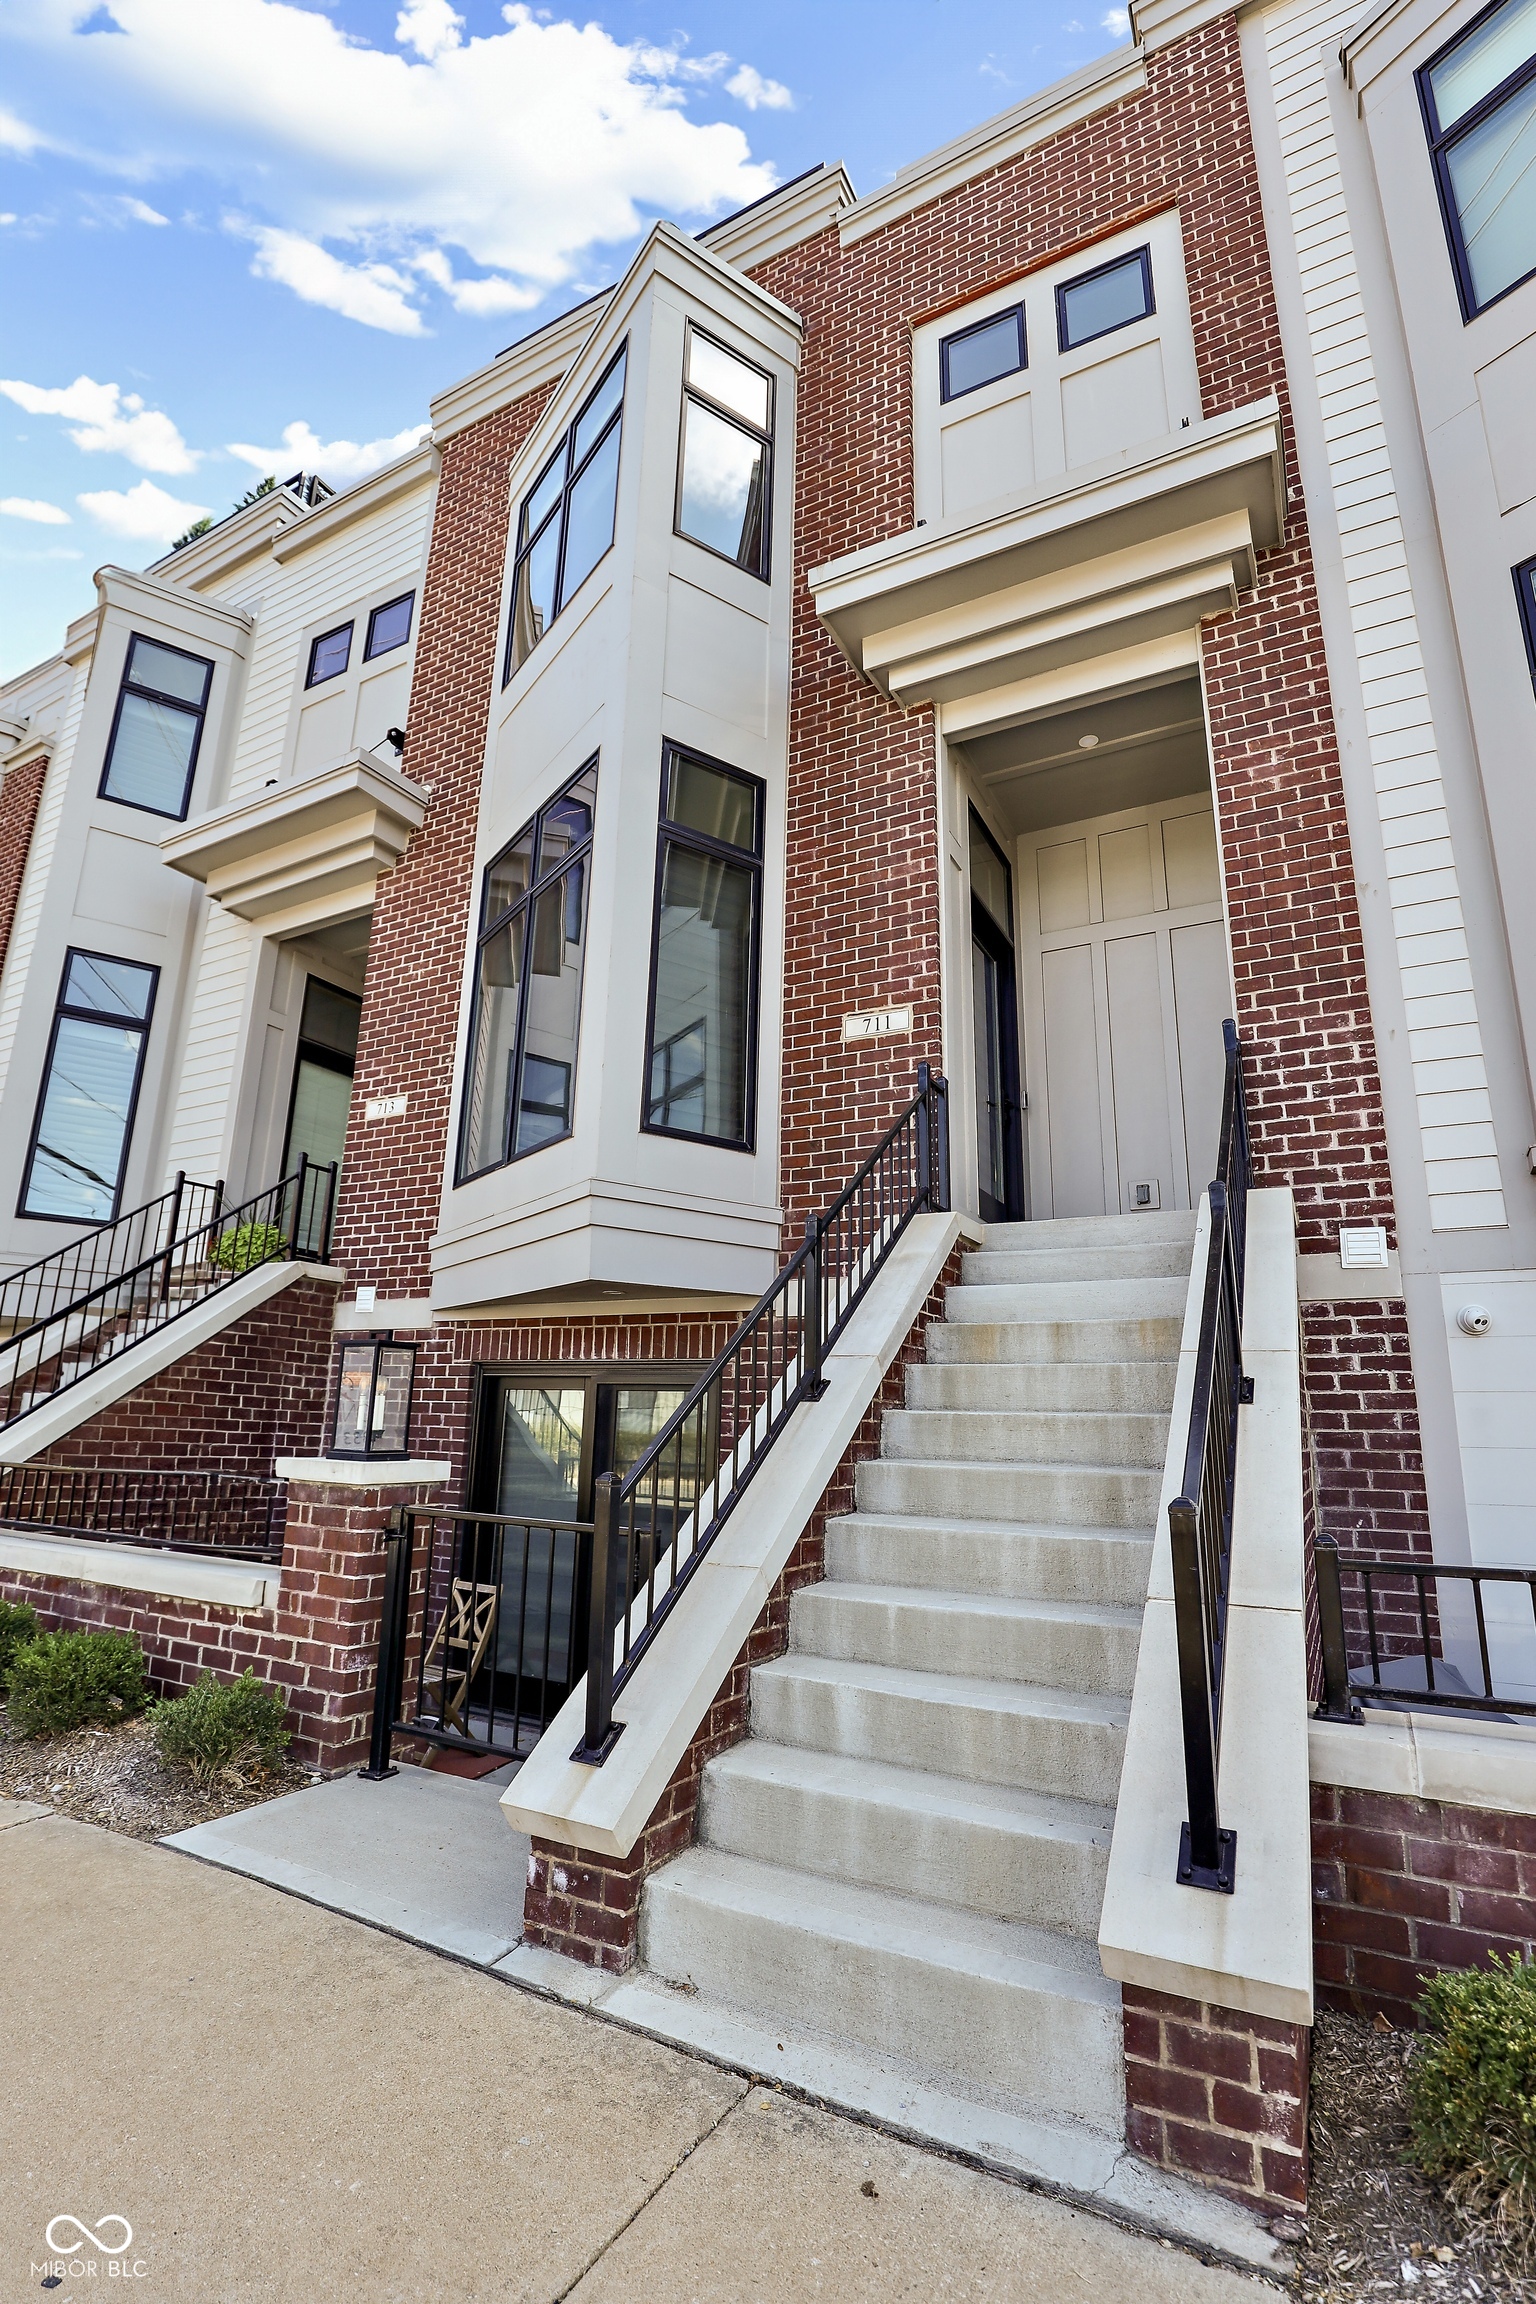
711 E 16th St, Indianapolis, IN 46202
$-841
Cash flow
-7.1%
Cash-on-Cash Return
4.5%
Cap rate
0.6%
Rent to Value Ratio
Pending
$270,000
3
bds
|
2
ba
|
1,579
sqft
|
built
1995
7215 Wet Rock Ct, Indianapolis, IN 46236
$-3
Cash flow
-0.1%
Cash-on-Cash Return
6.1%
Cap rate
0.7%
Rent to Value Ratio
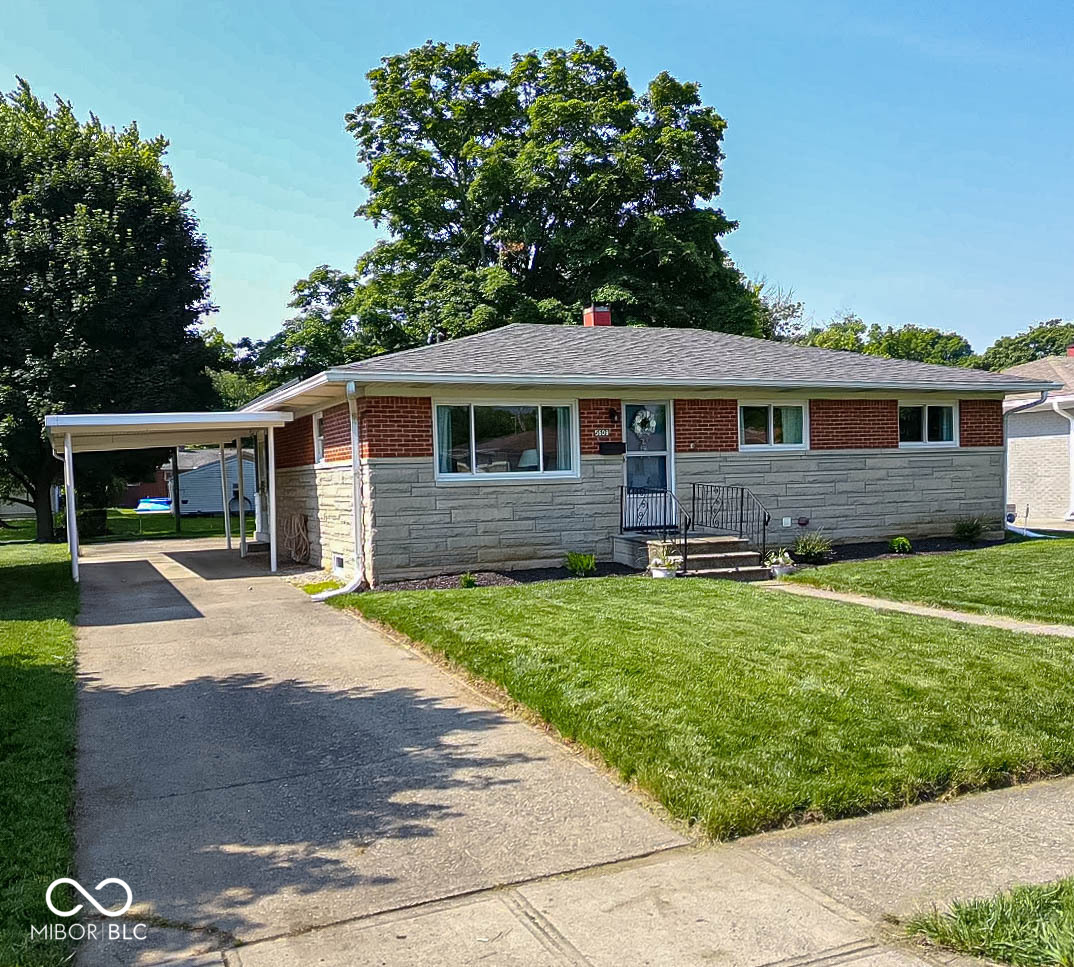
Active
$399,900
5
bds
|
3
ba
|
2,081
sqft
|
built
1957
5609 Meadowood Dr, Indianapolis, IN 46224
$-875
Cash flow
-11.4%
Cash-on-Cash Return
3.5%
Cap rate
0.4%
Rent to Value Ratio
Pending
$274,900
3
bds
|
2
ba
|
2,200
sqft
|
built
1976
4718 Dancer Dr, Indianapolis, IN 46237
$-166
Cash flow
-3.2%
Cash-on-Cash Return
5.4%
Cap rate
0.7%
Rent to Value Ratio
Pending
$369,000
4
bds
|
3
ba
|
2,686
sqft
|
built
1979
9256 Colgate St, Indianapolis, IN 46268
$-215
Cash flow
-3.0%
Cash-on-Cash Return
5.4%
Cap rate
0.7%
Rent to Value Ratio
Pending
$317,000
3
bds
|
2
ba
|
1,804
sqft
|
built
2022
4726 Amber Wood Ln, Indianapolis, IN 46235
$-106
Cash flow
-1.7%
Cash-on-Cash Return
5.7%
Cap rate
0.7%
Rent to Value Ratio
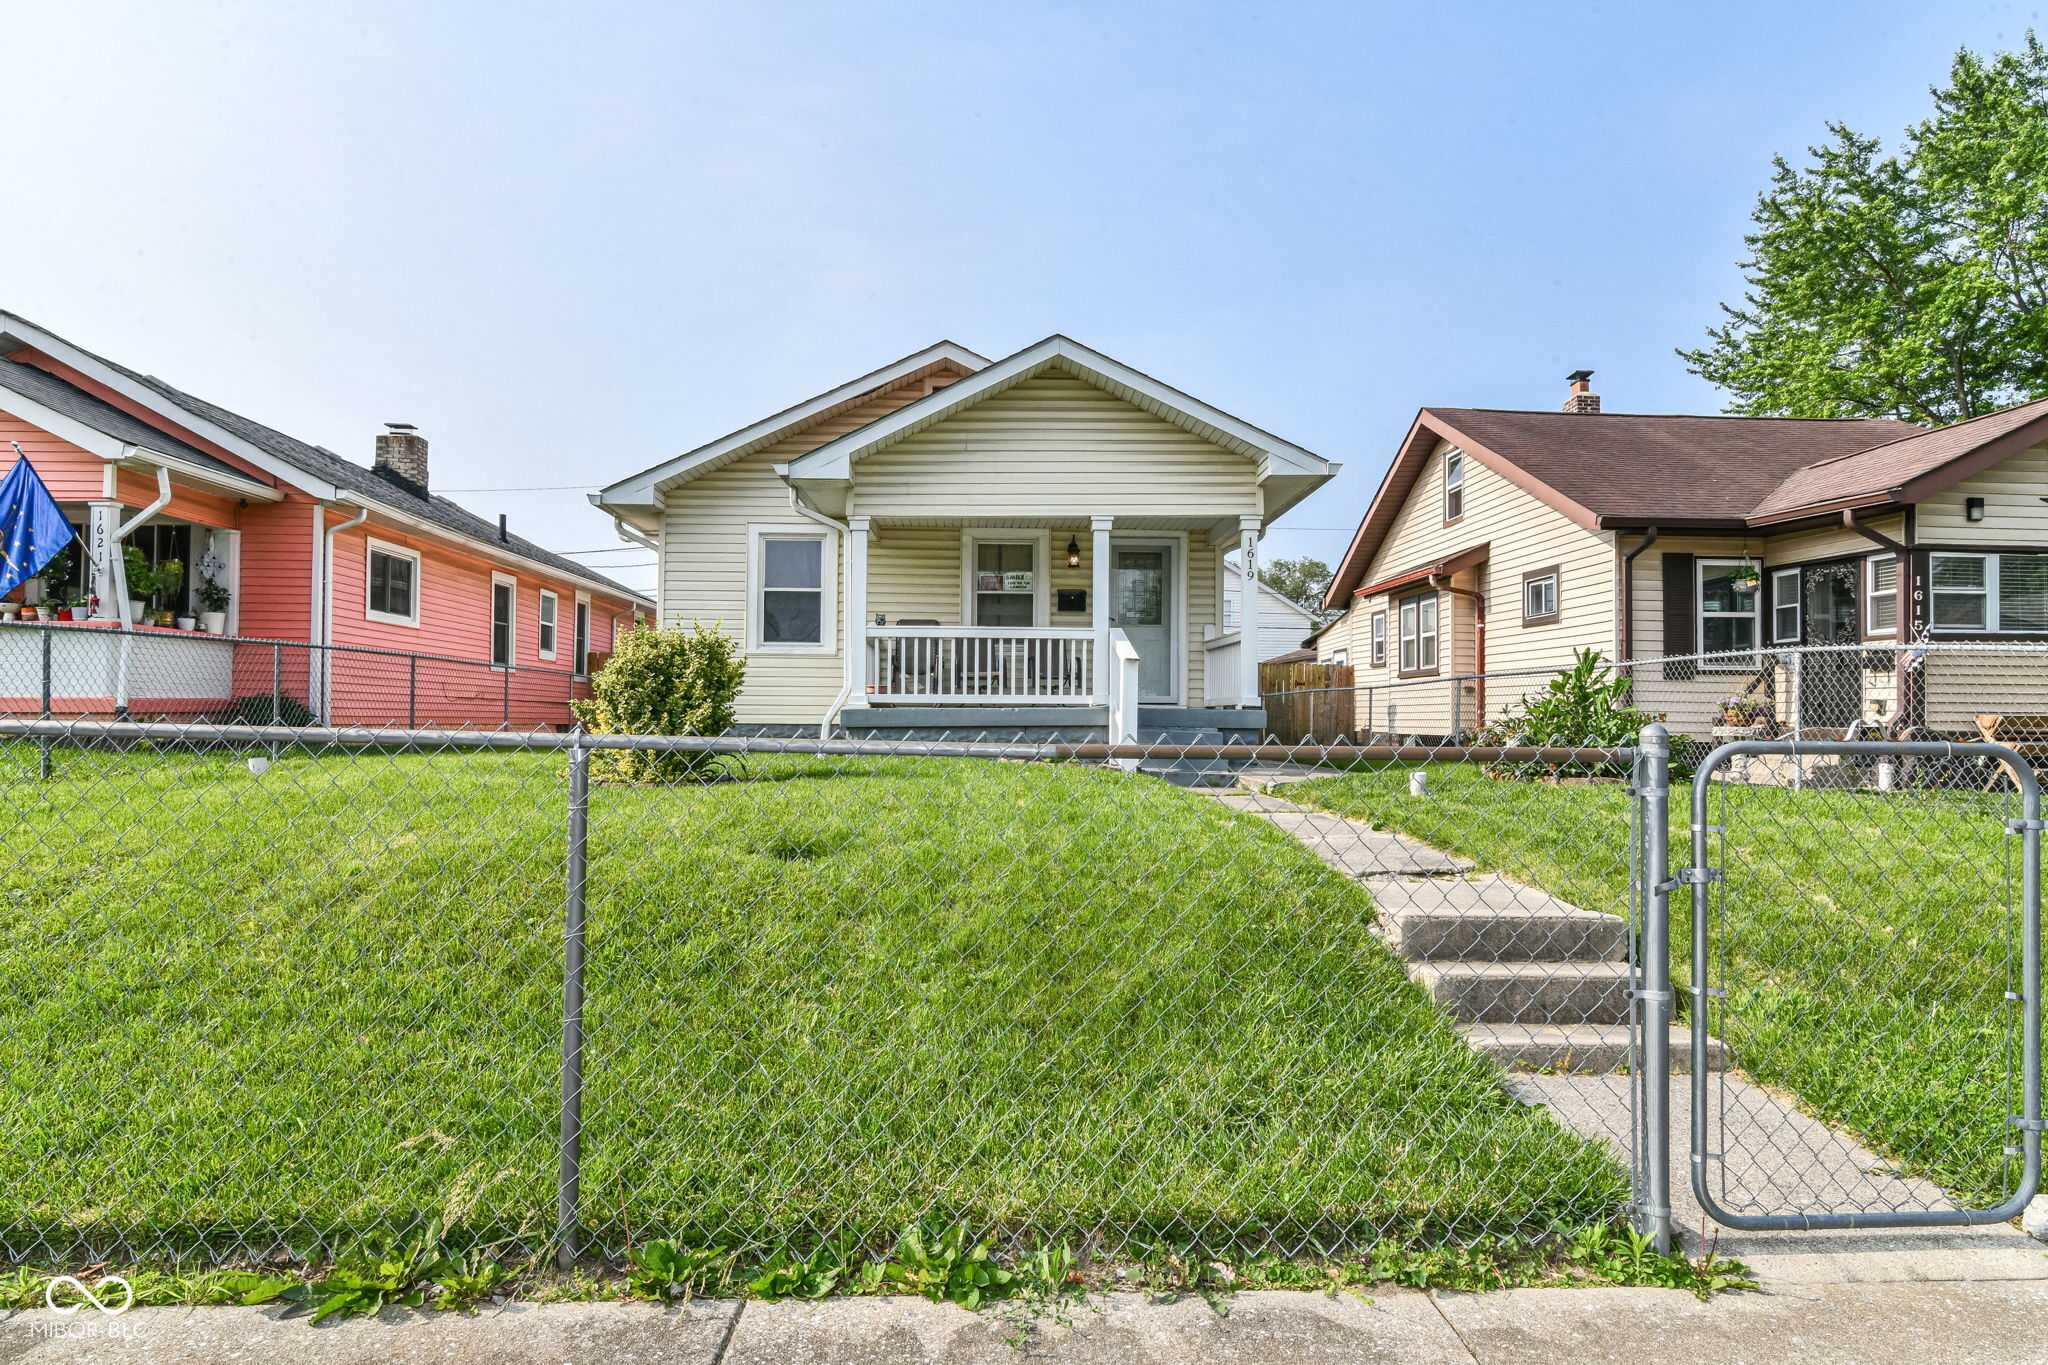
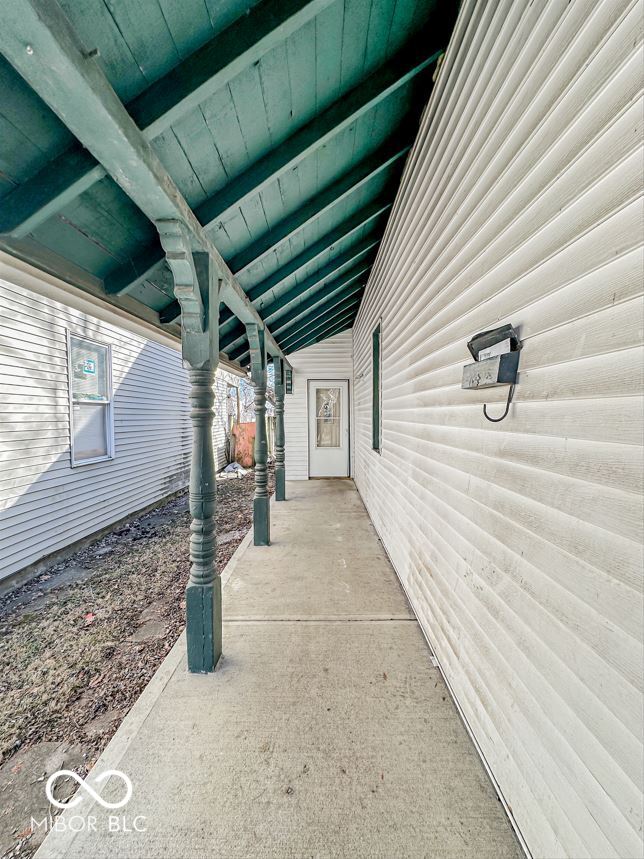
Active
$169,900
2
bds
|
1
ba
|
885
sqft
|
built
1923
1619 E Bradbury Ave, Indianapolis, IN 46203
$27
Cash flow
0.8%
Cash-on-Cash Return
6.3%
Cap rate
0.8%
Rent to Value Ratio
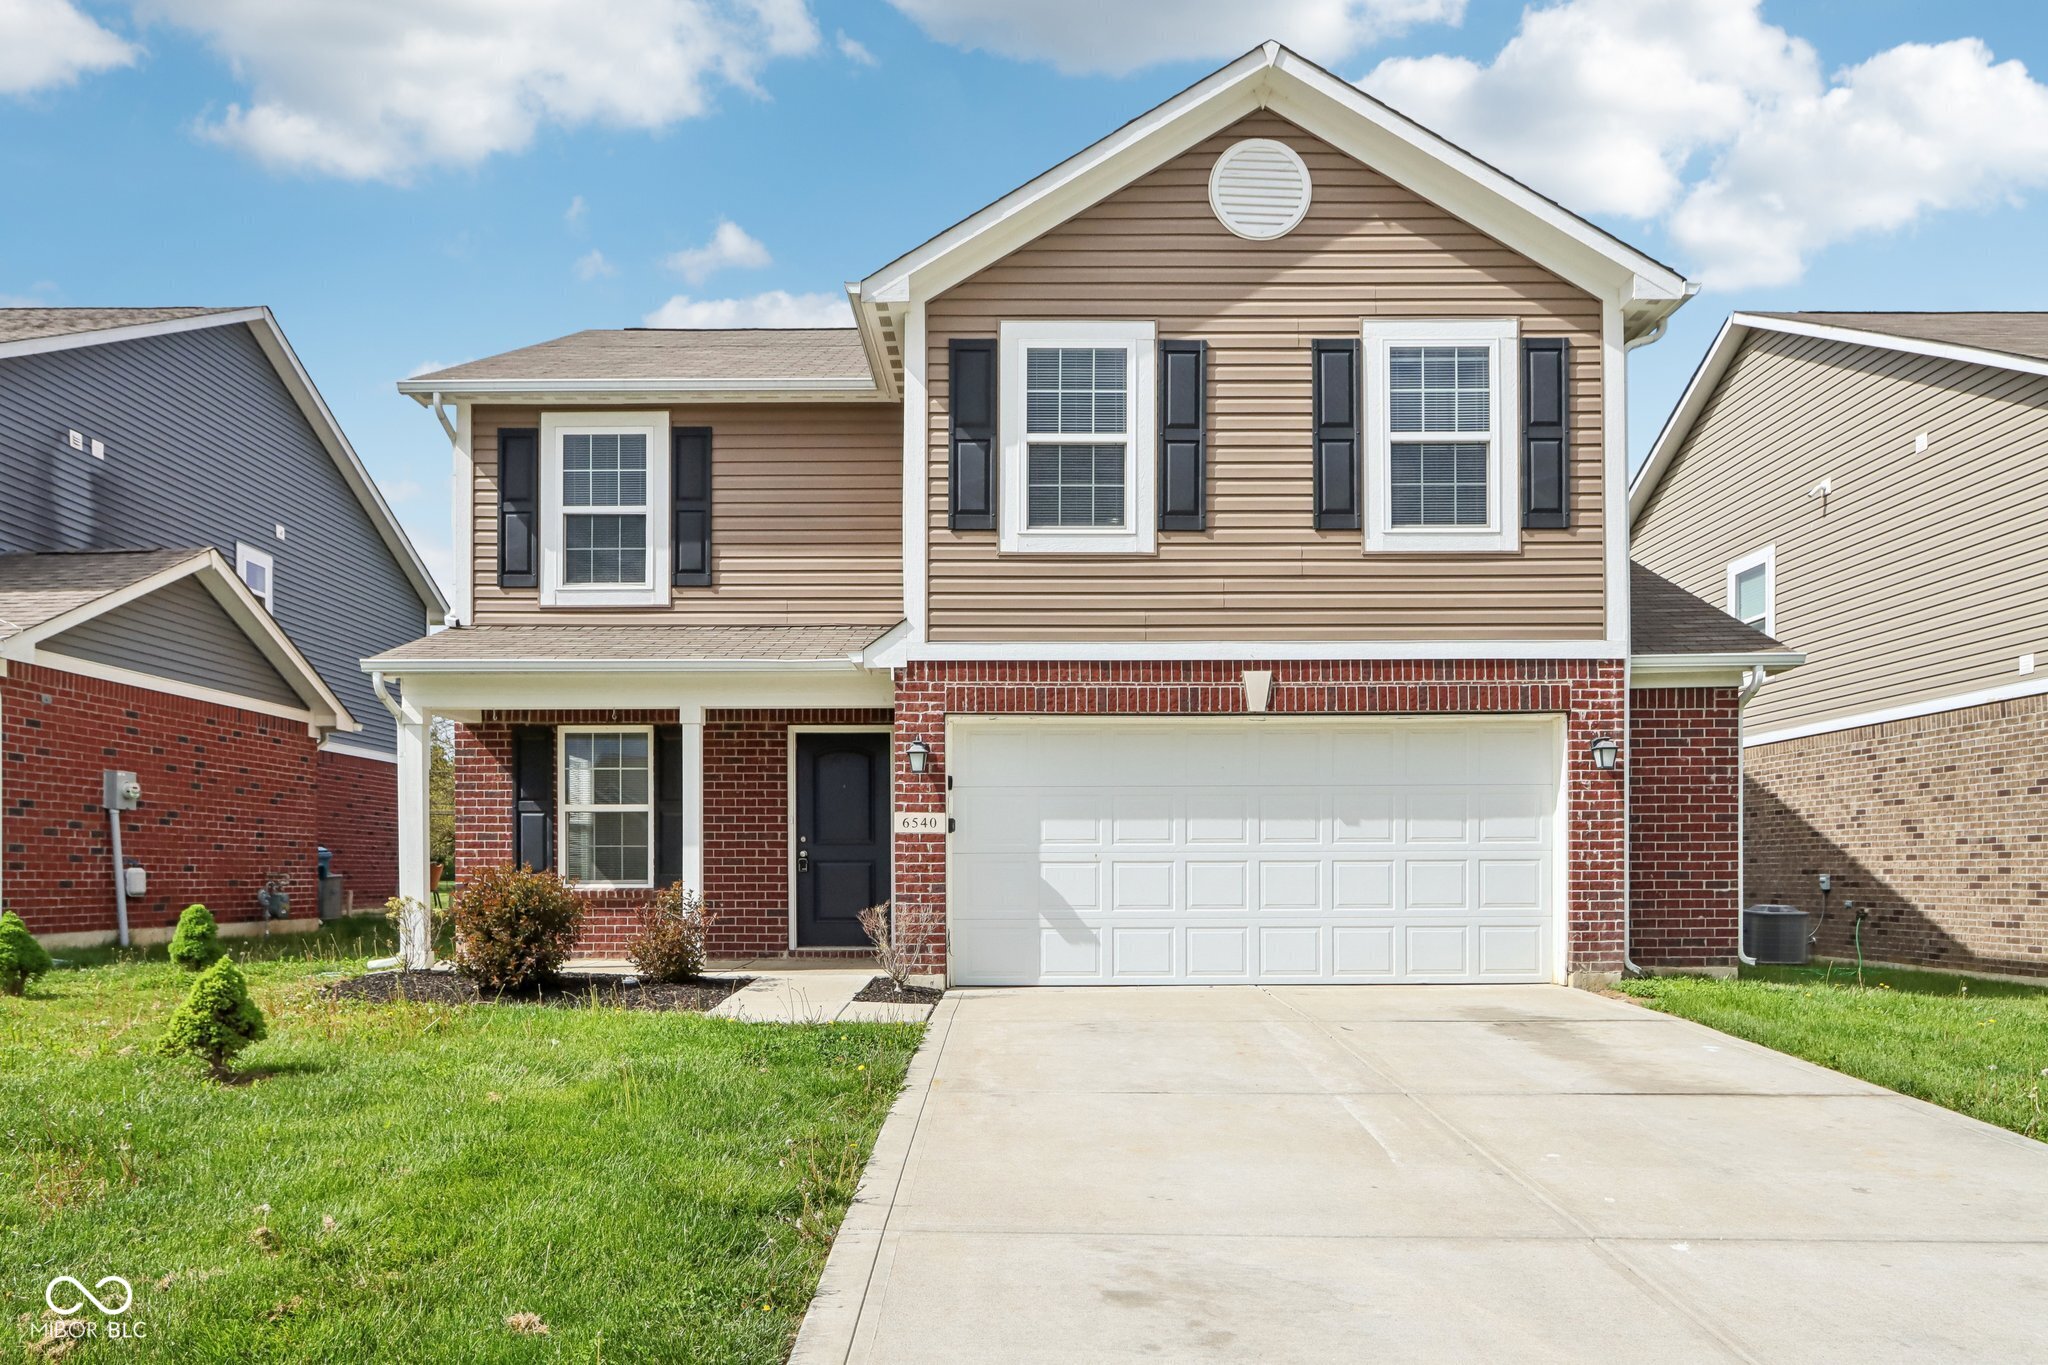
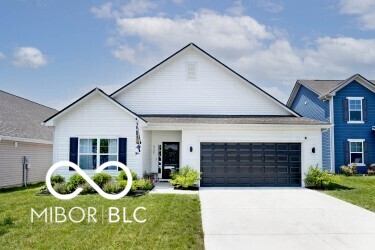
Active
$299,900
4
bds
|
3
ba
|
1,924
sqft
|
built
2019
6540 Mc Creery Ct, Indianapolis, IN 46221
$-264
Cash flow
-4.6%
Cash-on-Cash Return
5.1%
Cap rate
0.6%
Rent to Value Ratio
Active
$78,000
2
bds
|
1
ba
|
778
sqft
|
built
1955
1929 Wilcox St, Indianapolis, IN 46222
$566
Cash flow
37.9%
Cash-on-Cash Return
14.9%
Cap rate
1.8%
Rent to Value Ratio
Active
$43,000
bds
|
0
ba
|
576
sqft
|
built
1995
1254 S Leland Ave, Indianapolis, IN 46203
$759
Cash flow
20.6%
Cash-on-Cash Return
21.2%
Cap rate
2.6%
Rent to Value Ratio