Indianapolis, IN Investment Properties for Sale
Browse homes for sale and investment properties in Indianapolis, IN. Refine your search by price, property type, or more.
Best cash flowing properties in Indianapolis, IN
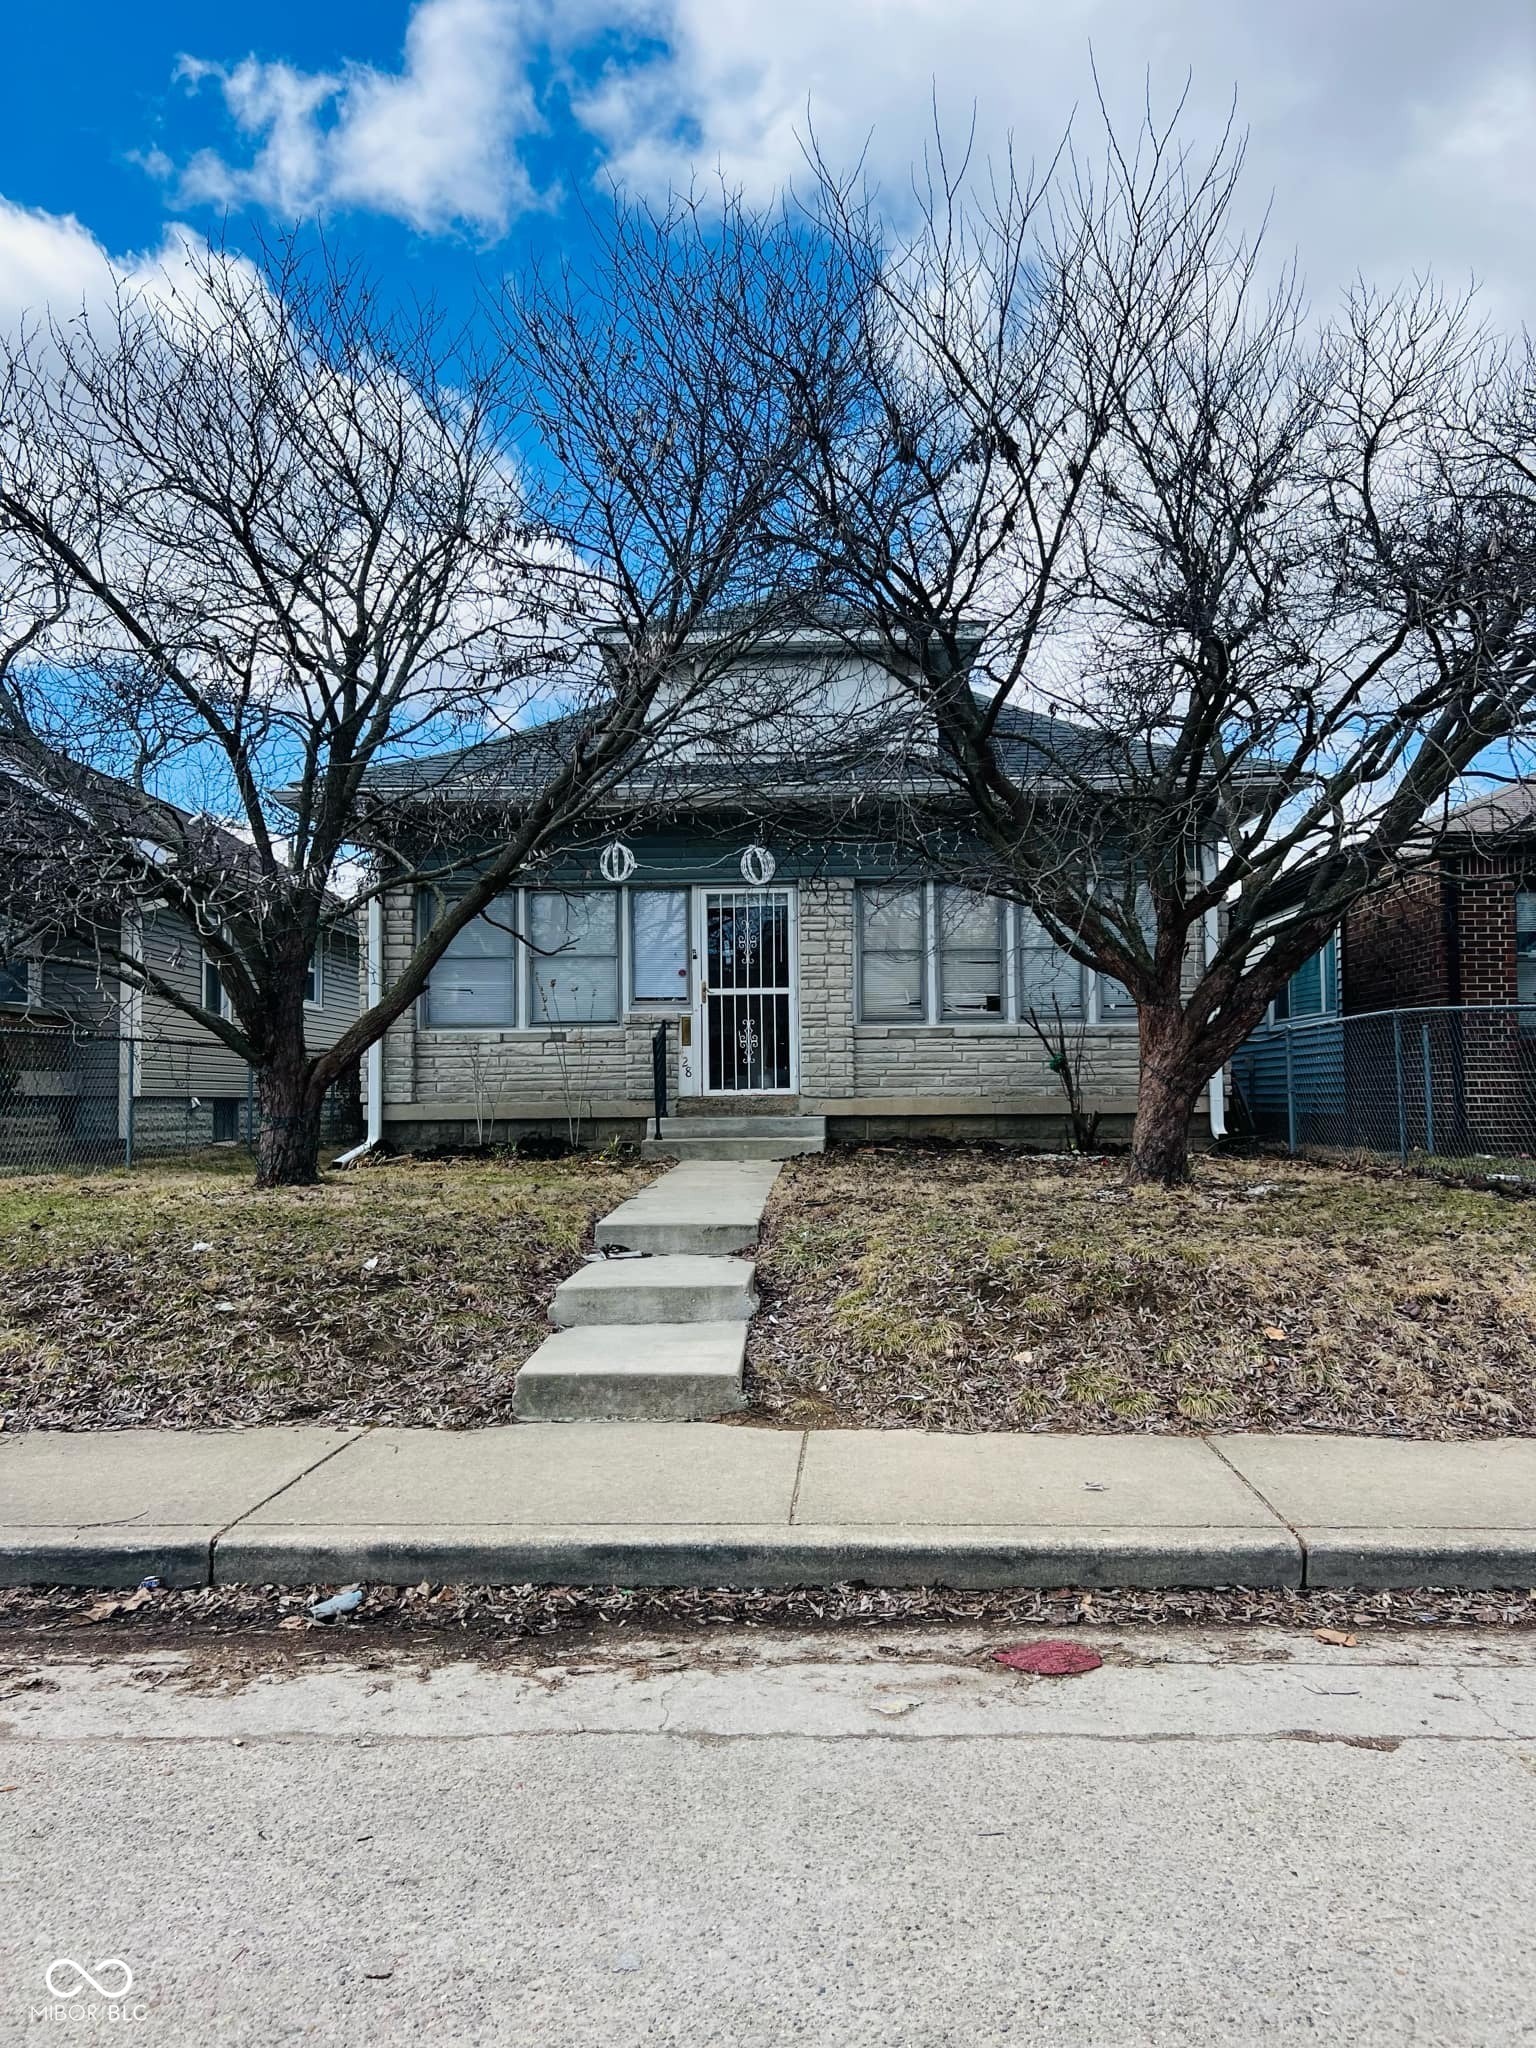
Active
$254,900
4
bds
|
2
ba
|
1,944
sqft
|
built
1890
248 N Walcott St, Indianapolis, IN 46201
$419
Cash flow
8.6%
Cash-on-Cash Return
8.1%
Cap rate
1.0%
Rent to Value Ratio
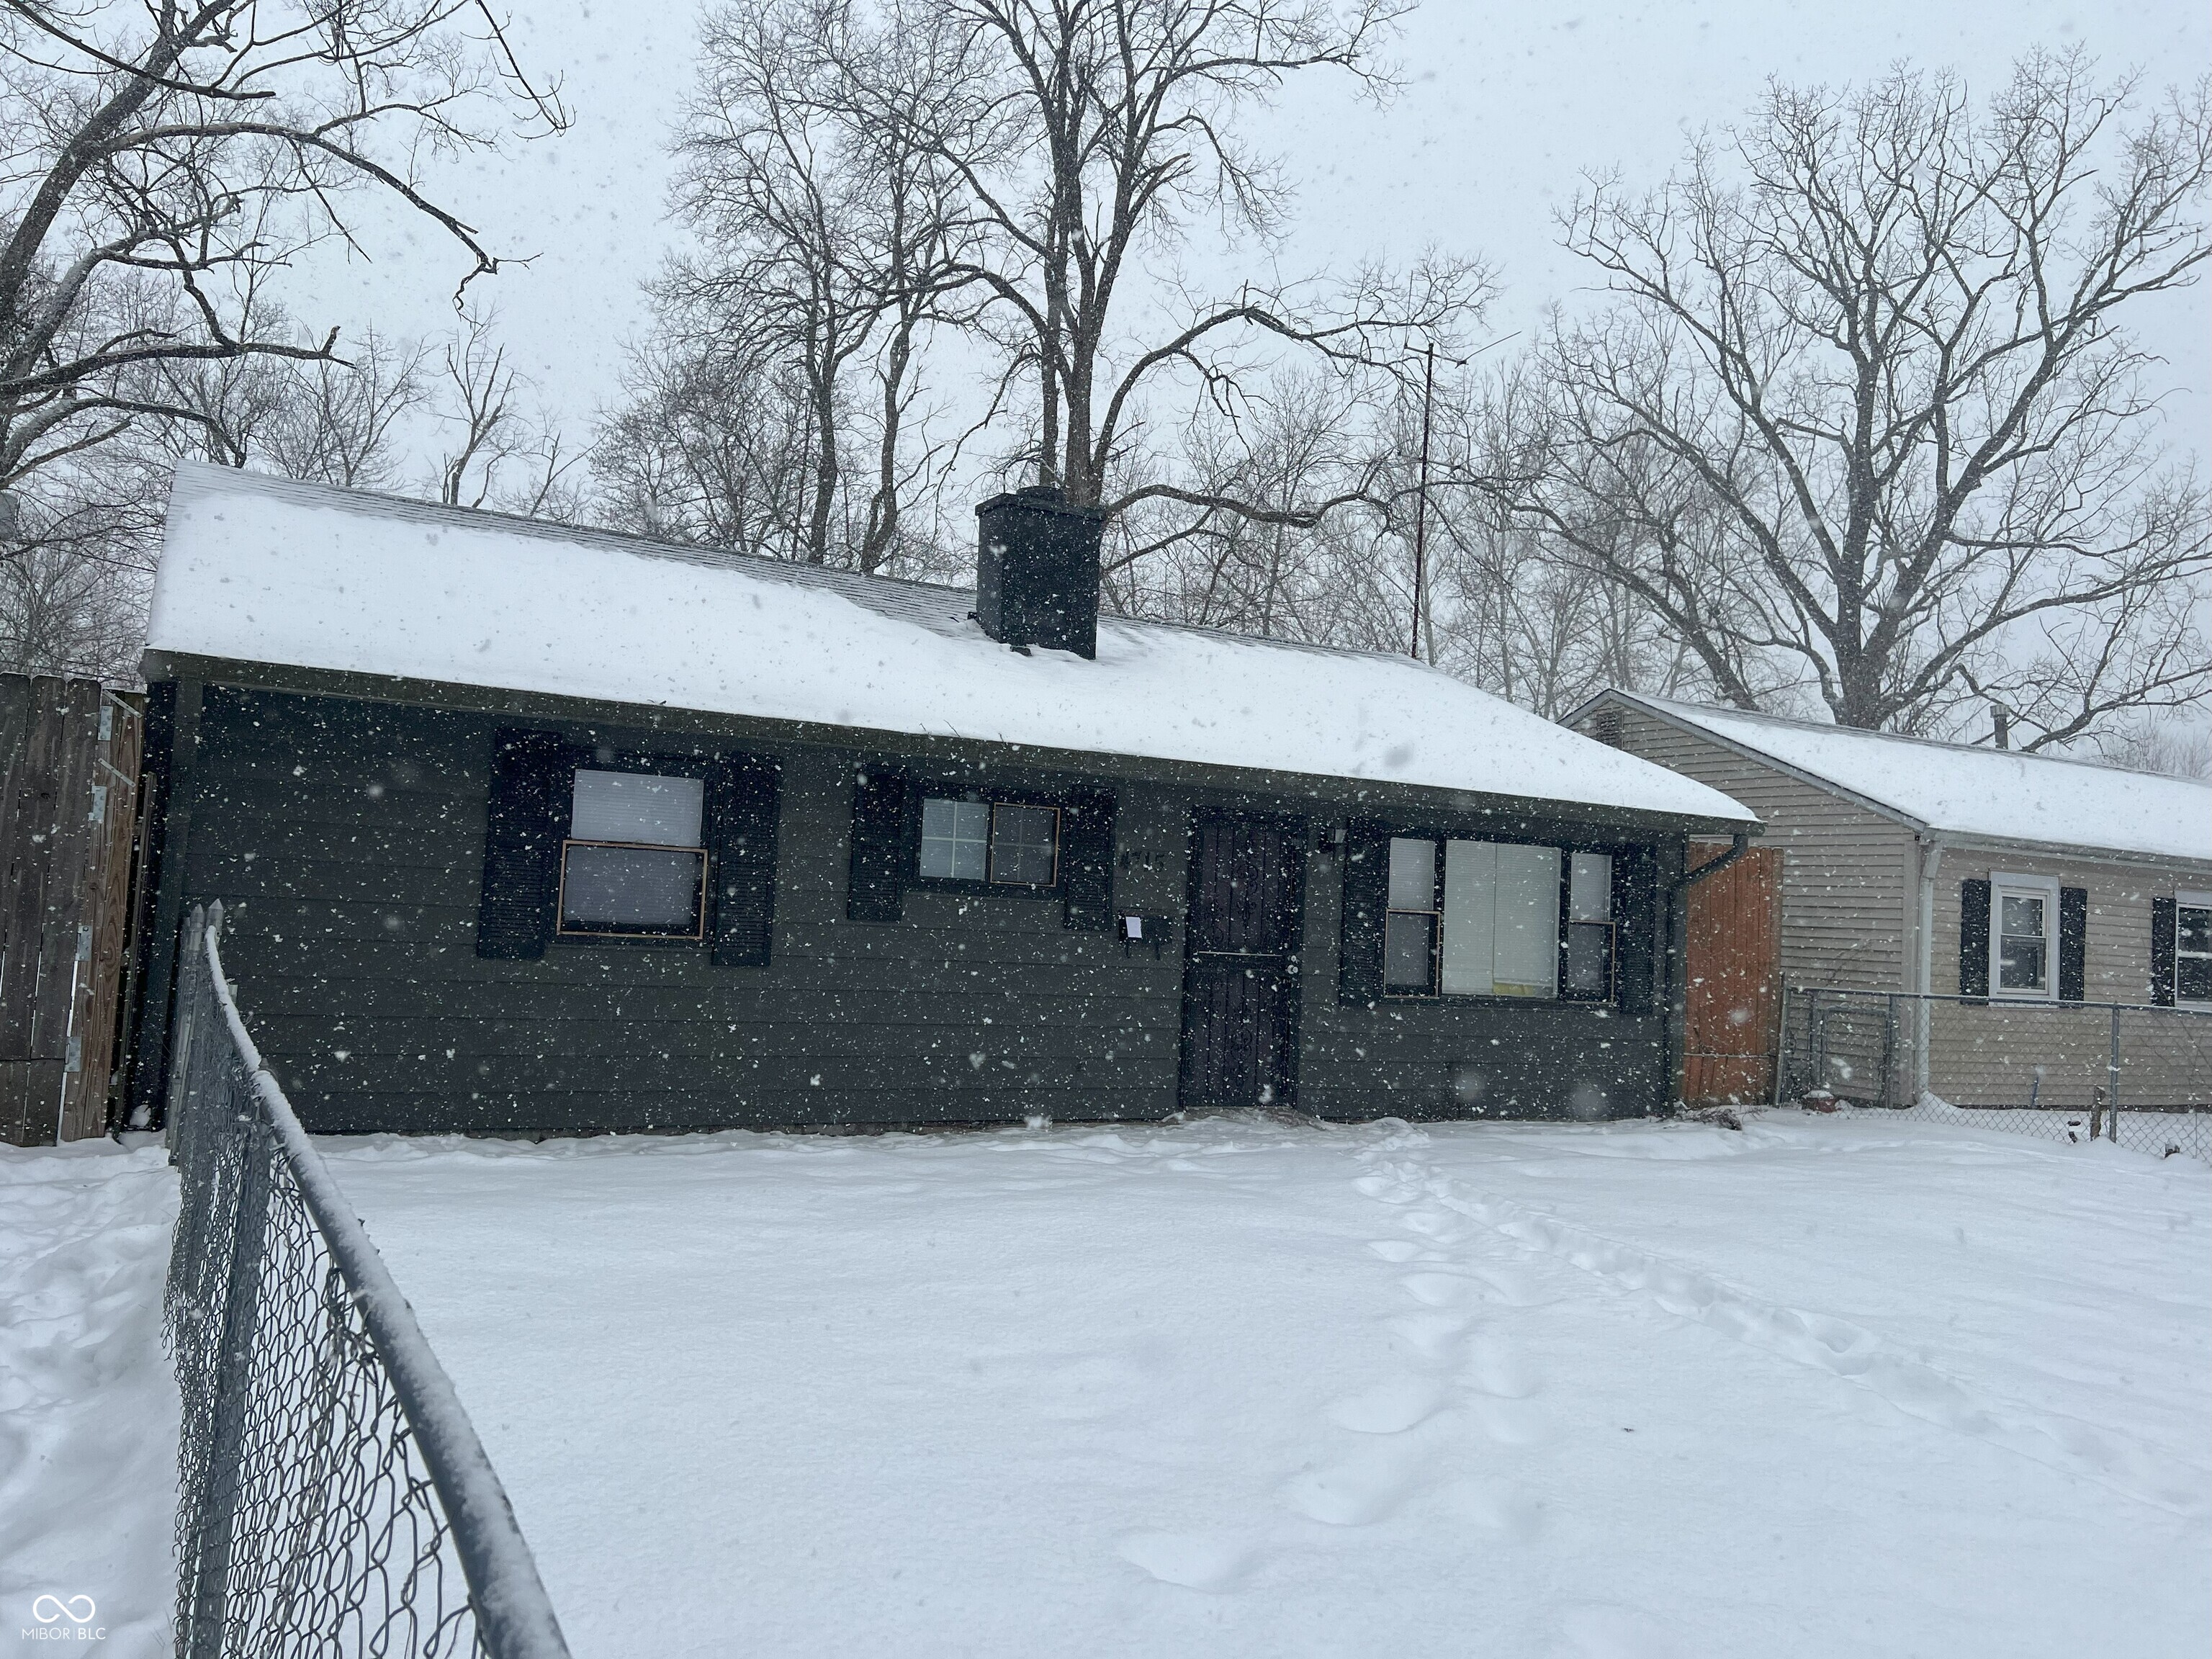
Active
$115,000
3
bds
|
1
ba
|
925
sqft
|
built
1955
4715 E 33rd St, Indianapolis, IN 46218
$377
Cash flow
17.1%
Cash-on-Cash Return
10.1%
Cap rate
1.2%
Rent to Value Ratio
1,974 out of 2,115 properties for sale in Indianapolis, IN
Limited Results Shown
Create a free account, or log in to reveal all property listings and enjoy the complete experience.
Active
$170,000
2
bds
|
1
ba
|
1,440
sqft
|
built
1940
3701 N Temple Ave, Indianapolis, IN 46218
$-43
Cash flow
-1.3%
Cash-on-Cash Return
5.8%
Cap rate
0.7%
Rent to Value Ratio
Active
$292,000
4
bds
|
3
ba
|
1,760
sqft
|
built
1981
5155 Overland Ct, Indianapolis, IN 46268
$-151
Cash flow
-2.7%
Cash-on-Cash Return
5.5%
Cap rate
0.7%
Rent to Value Ratio
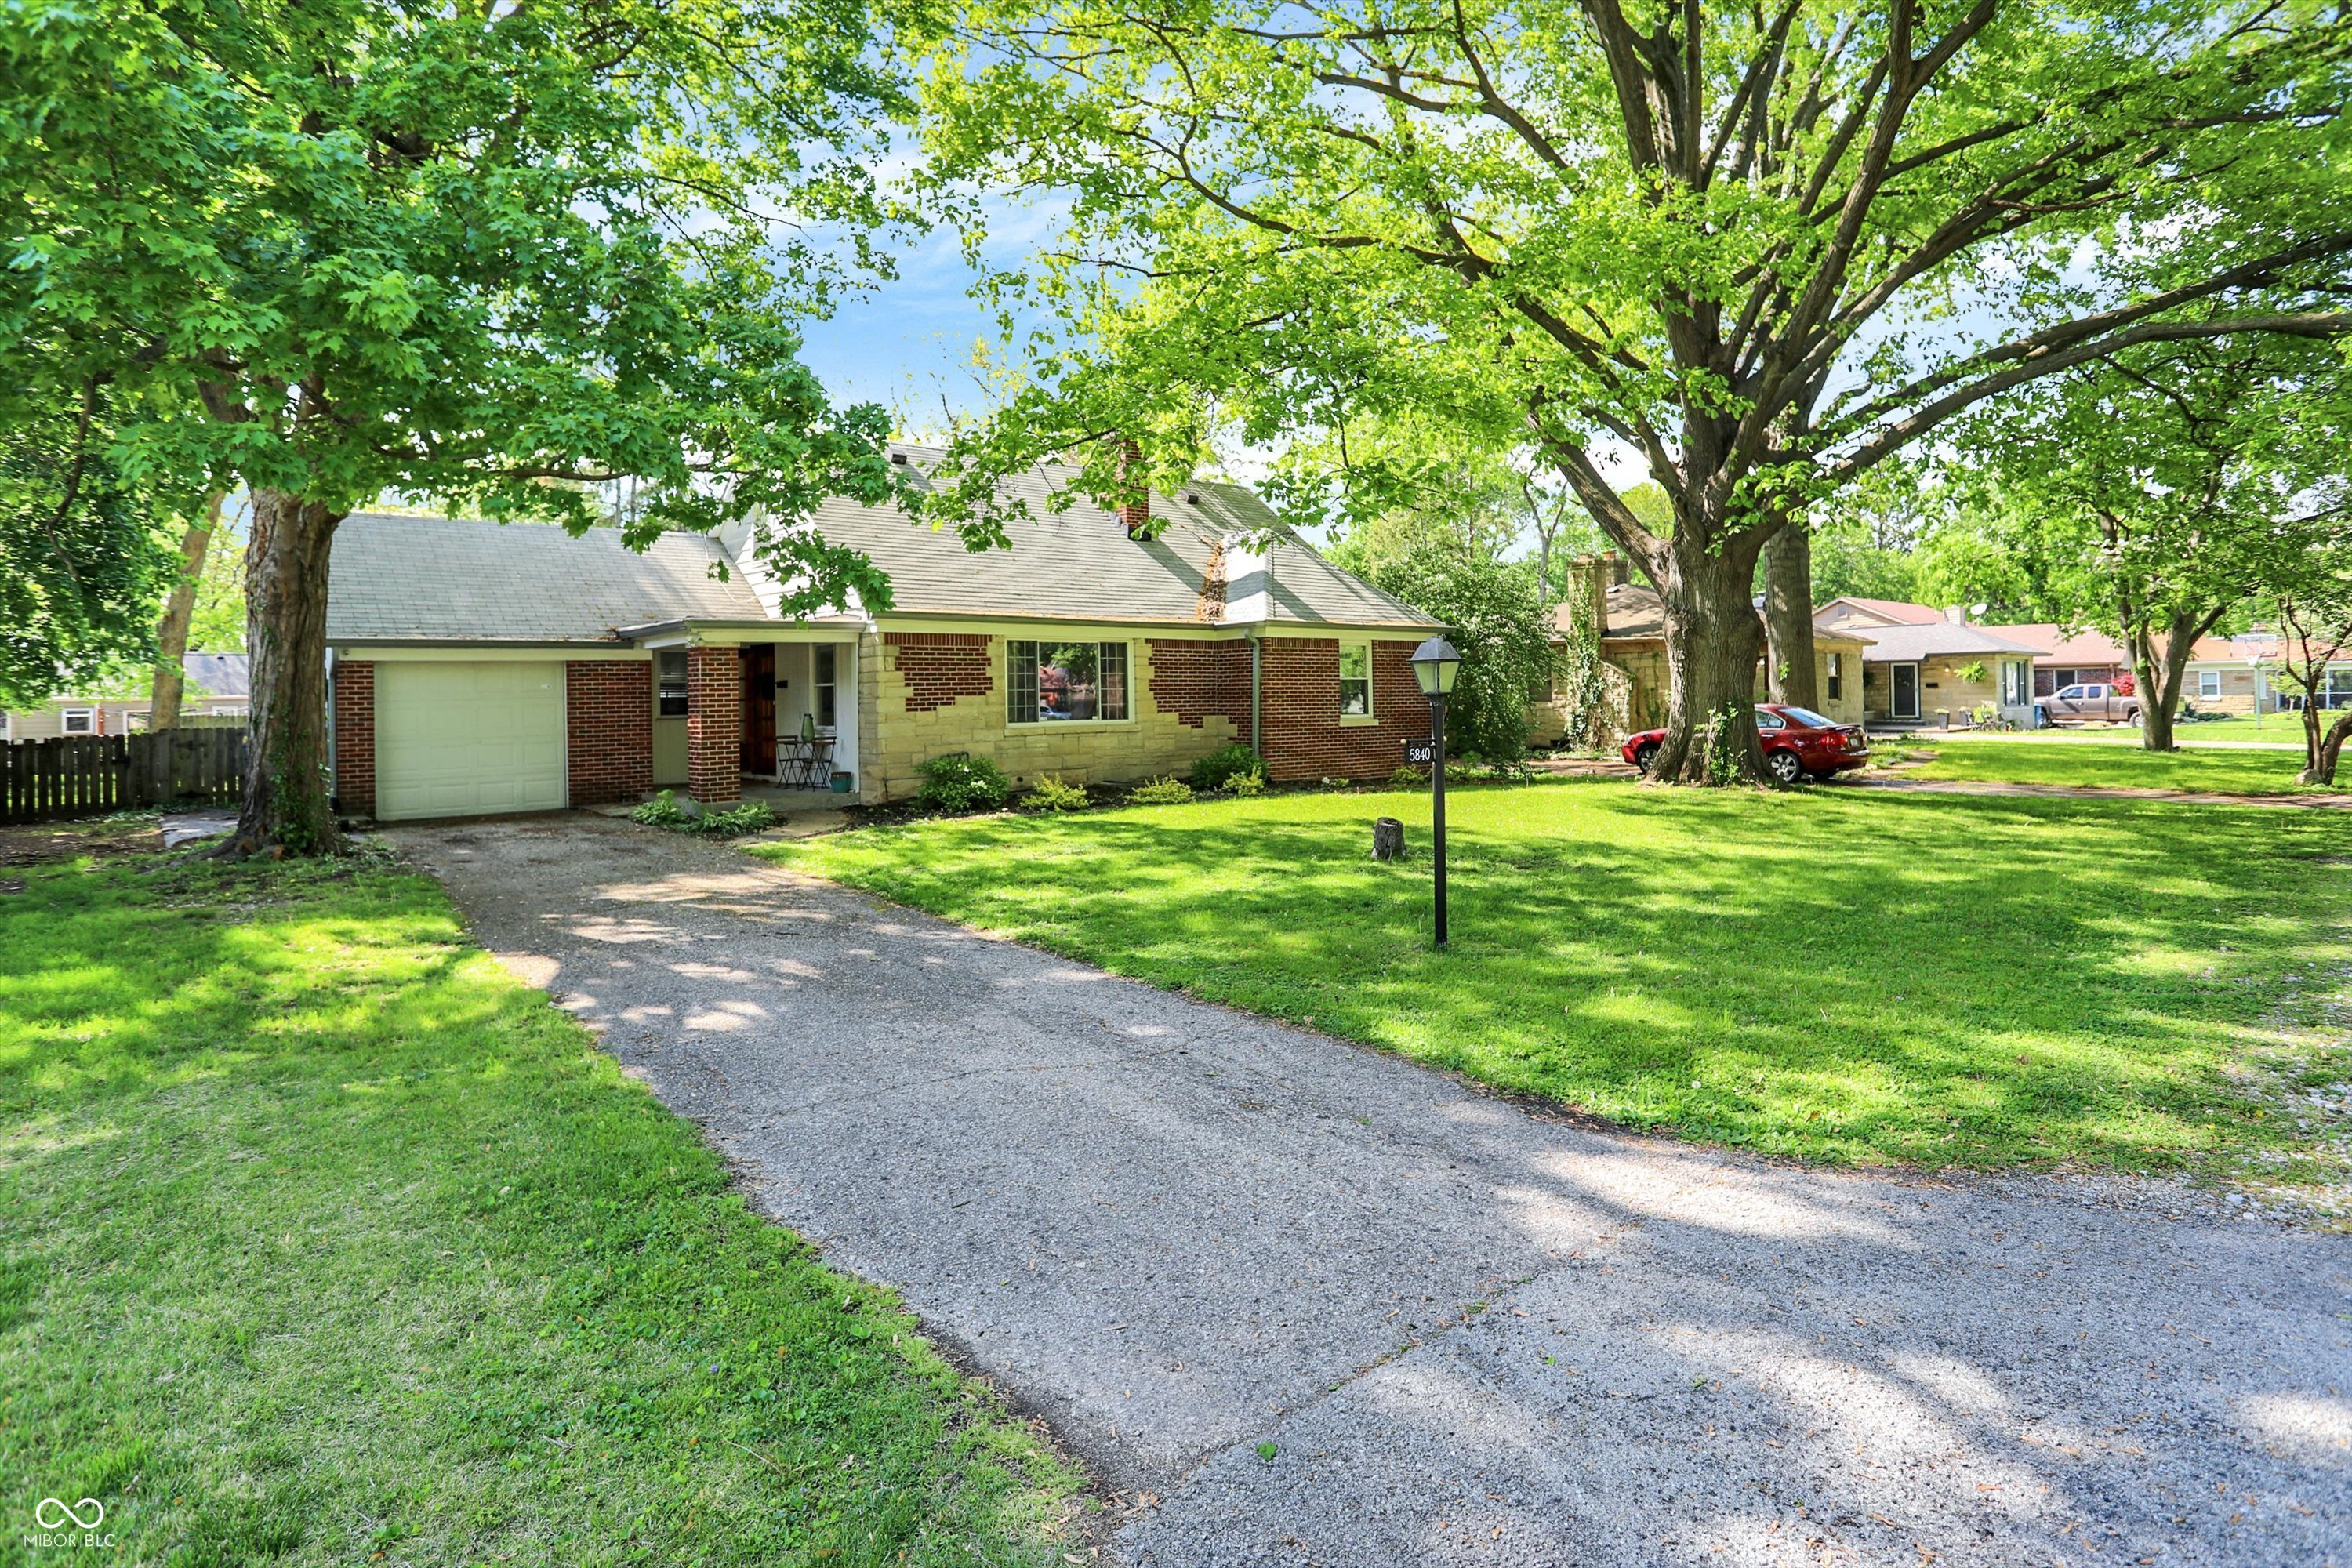
Active
$335,000
4
bds
|
2
ba
|
2,040
sqft
|
built
1949
5840 Brouse Ave, Indianapolis, IN 46220
$9
Cash flow
0.1%
Cash-on-Cash Return
6.2%
Cap rate
0.7%
Rent to Value Ratio
Active
$260,000
3
bds
|
2
ba
|
1,092
sqft
|
built
1981
5510 Chelsea Rd, Indianapolis, IN 46241
$-228
Cash flow
-4.6%
Cash-on-Cash Return
5.1%
Cap rate
0.6%
Rent to Value Ratio
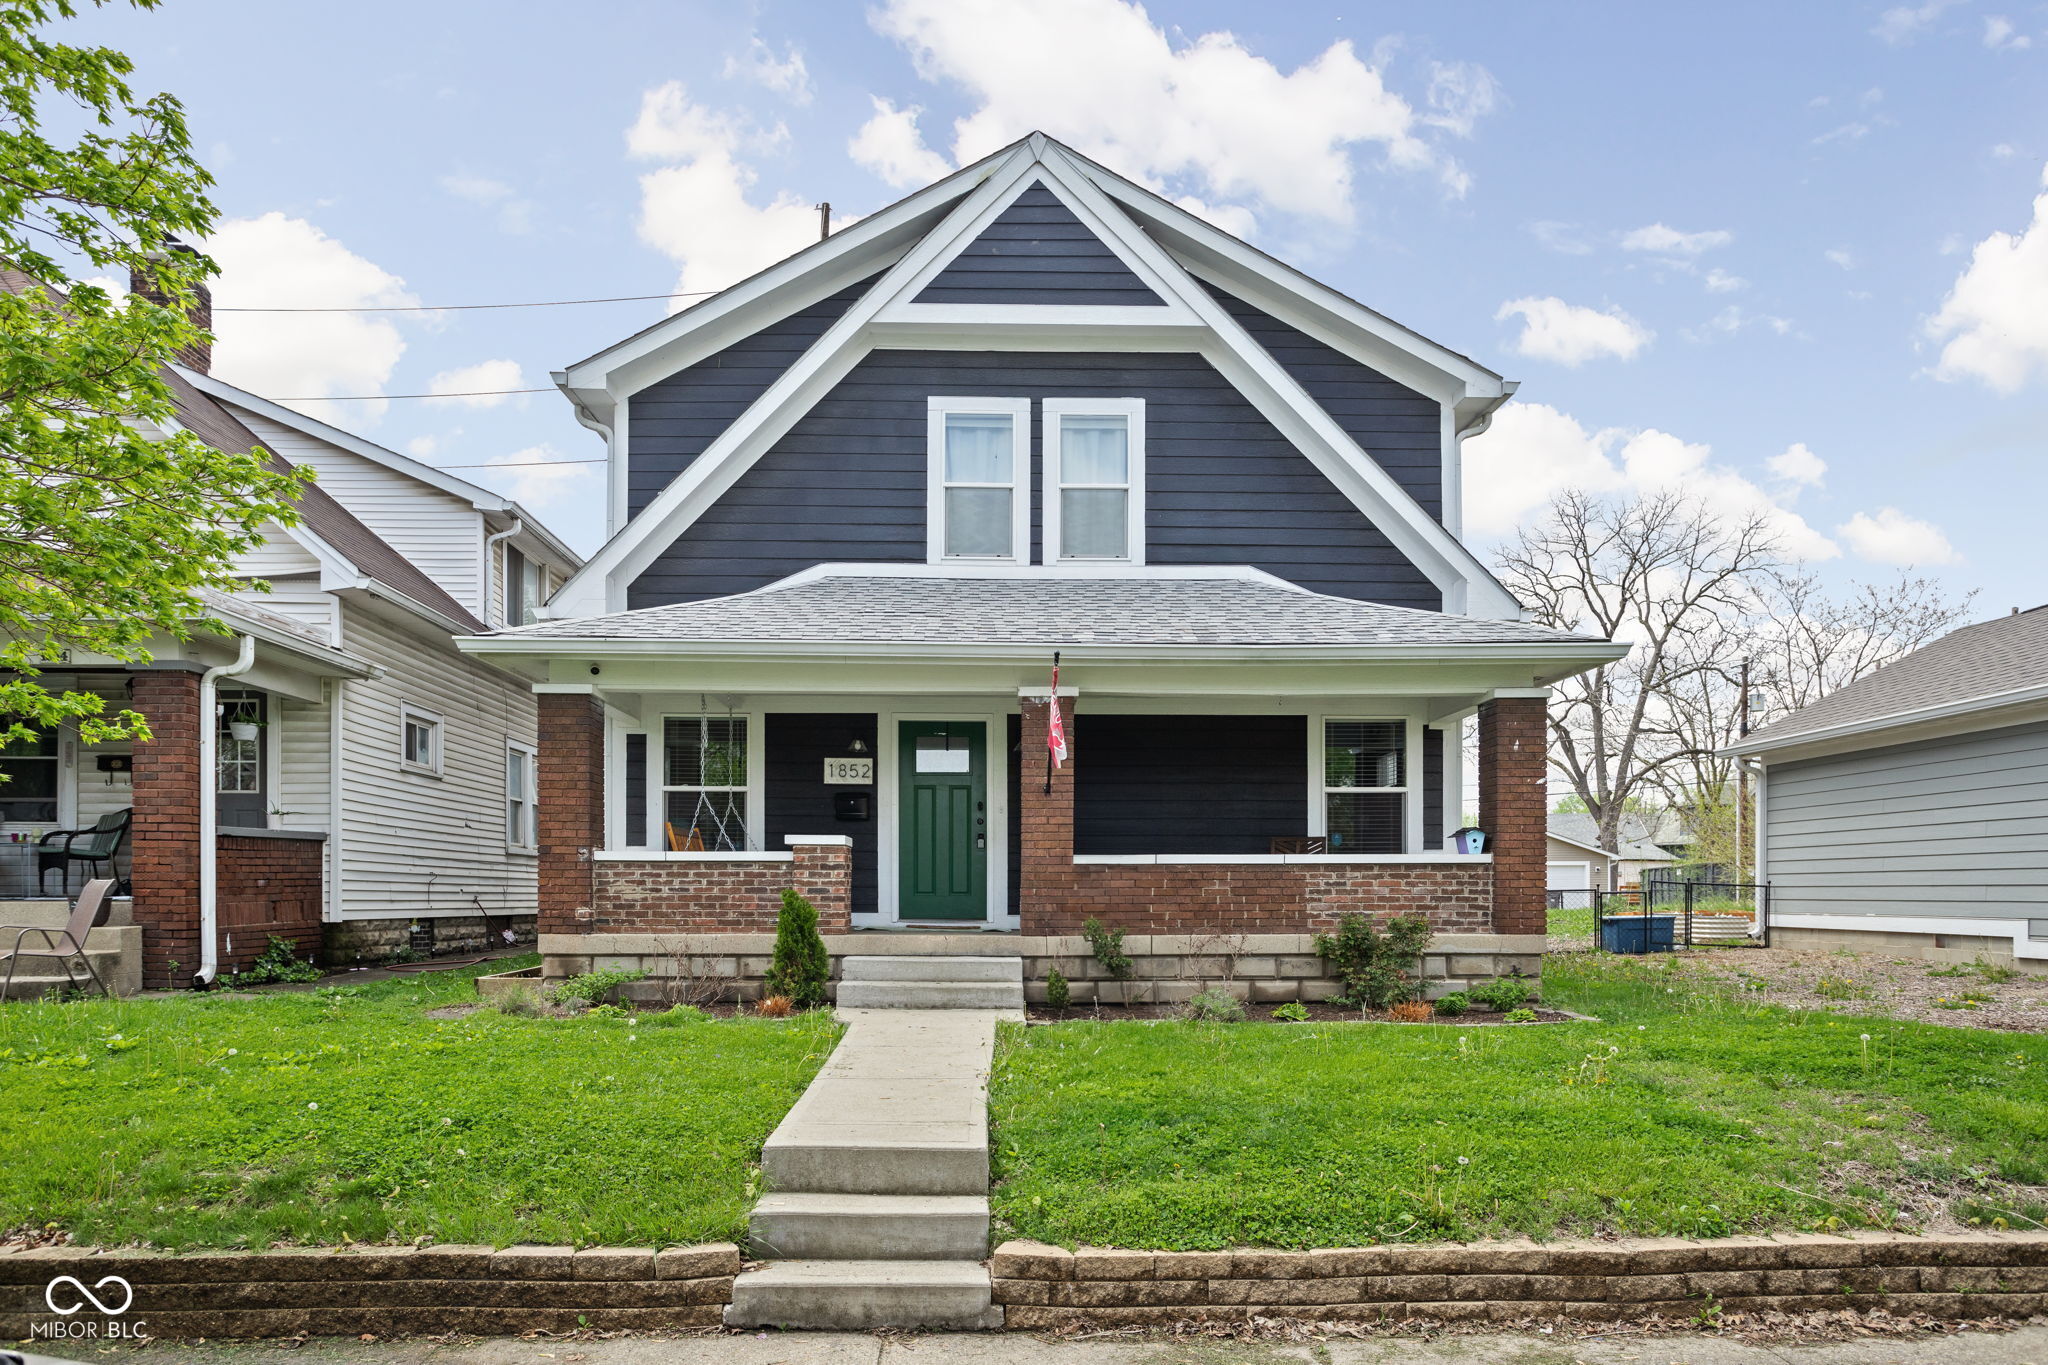
Active
$425,000
4
bds
|
3
ba
|
2,492
sqft
|
built
1925
1852 Singleton St, Indianapolis, IN 46203
$-38
Cash flow
-0.5%
Cash-on-Cash Return
6.0%
Cap rate
0.7%
Rent to Value Ratio

Active
$359,000
4
bds
|
2
ba
|
1,600
sqft
|
built
1920
2230 E 75th St, Indianapolis, IN 46240
$93
Cash flow
1.4%
Cash-on-Cash Return
6.5%
Cap rate
0.8%
Rent to Value Ratio
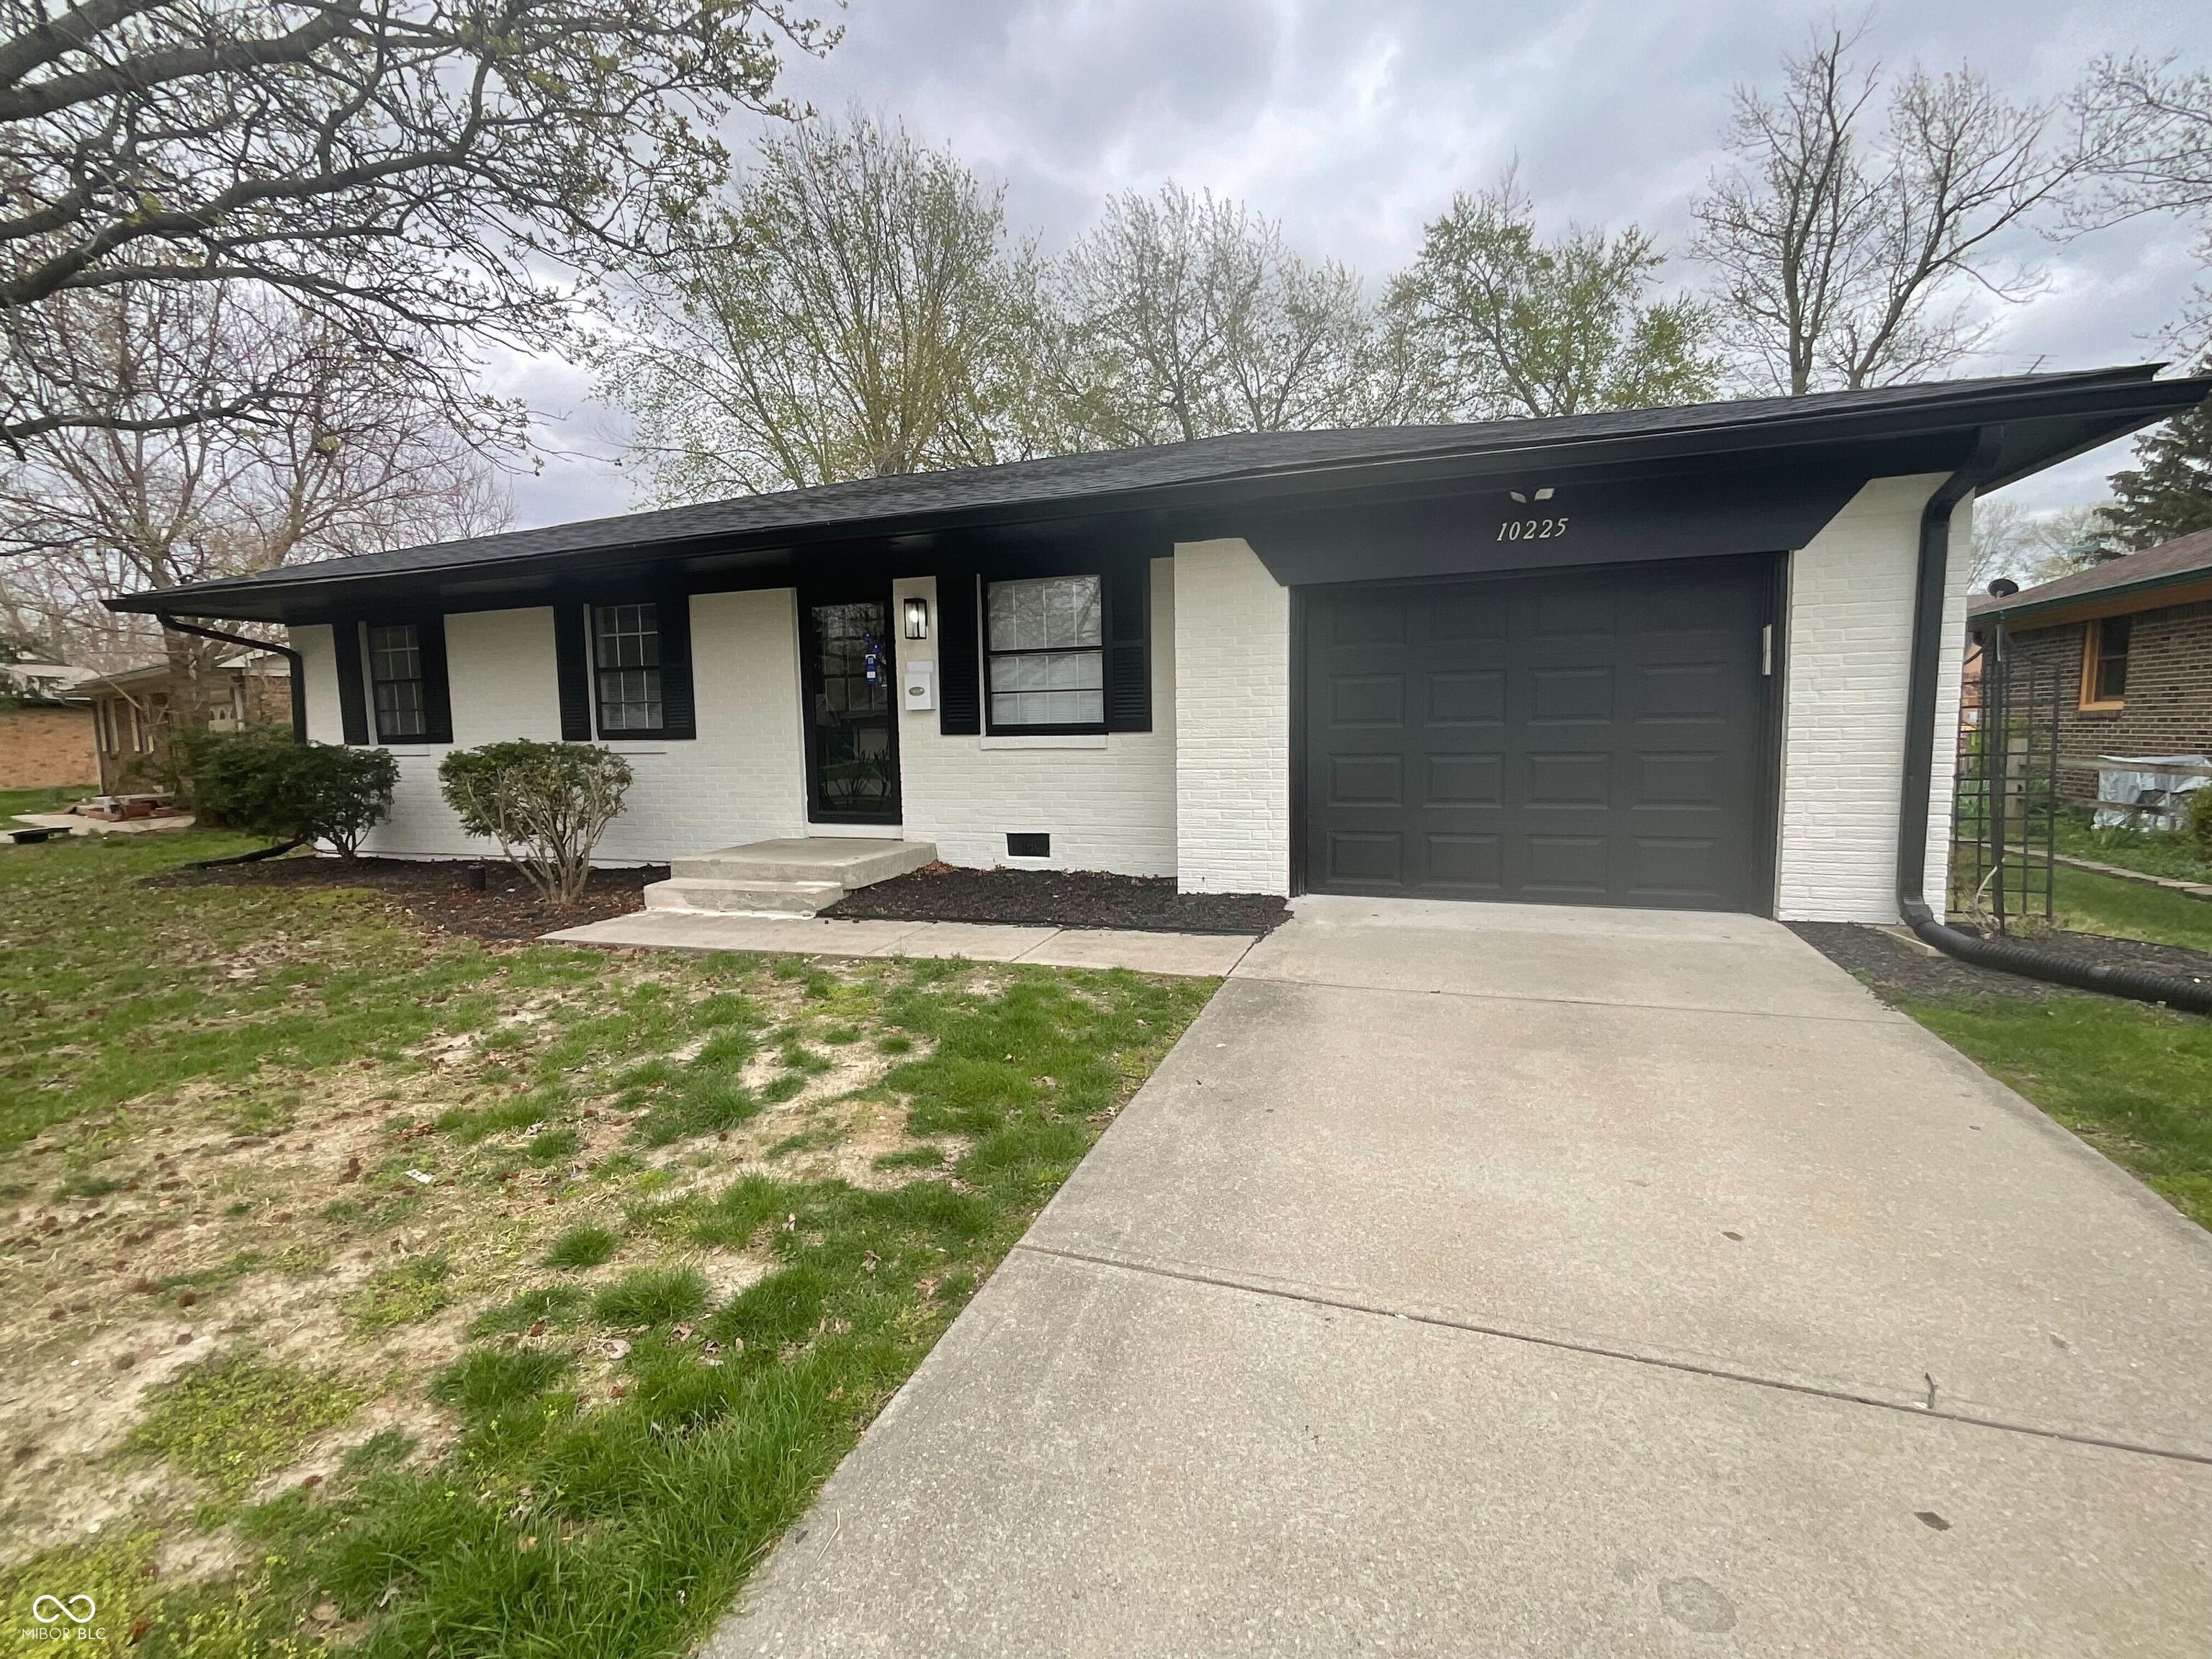
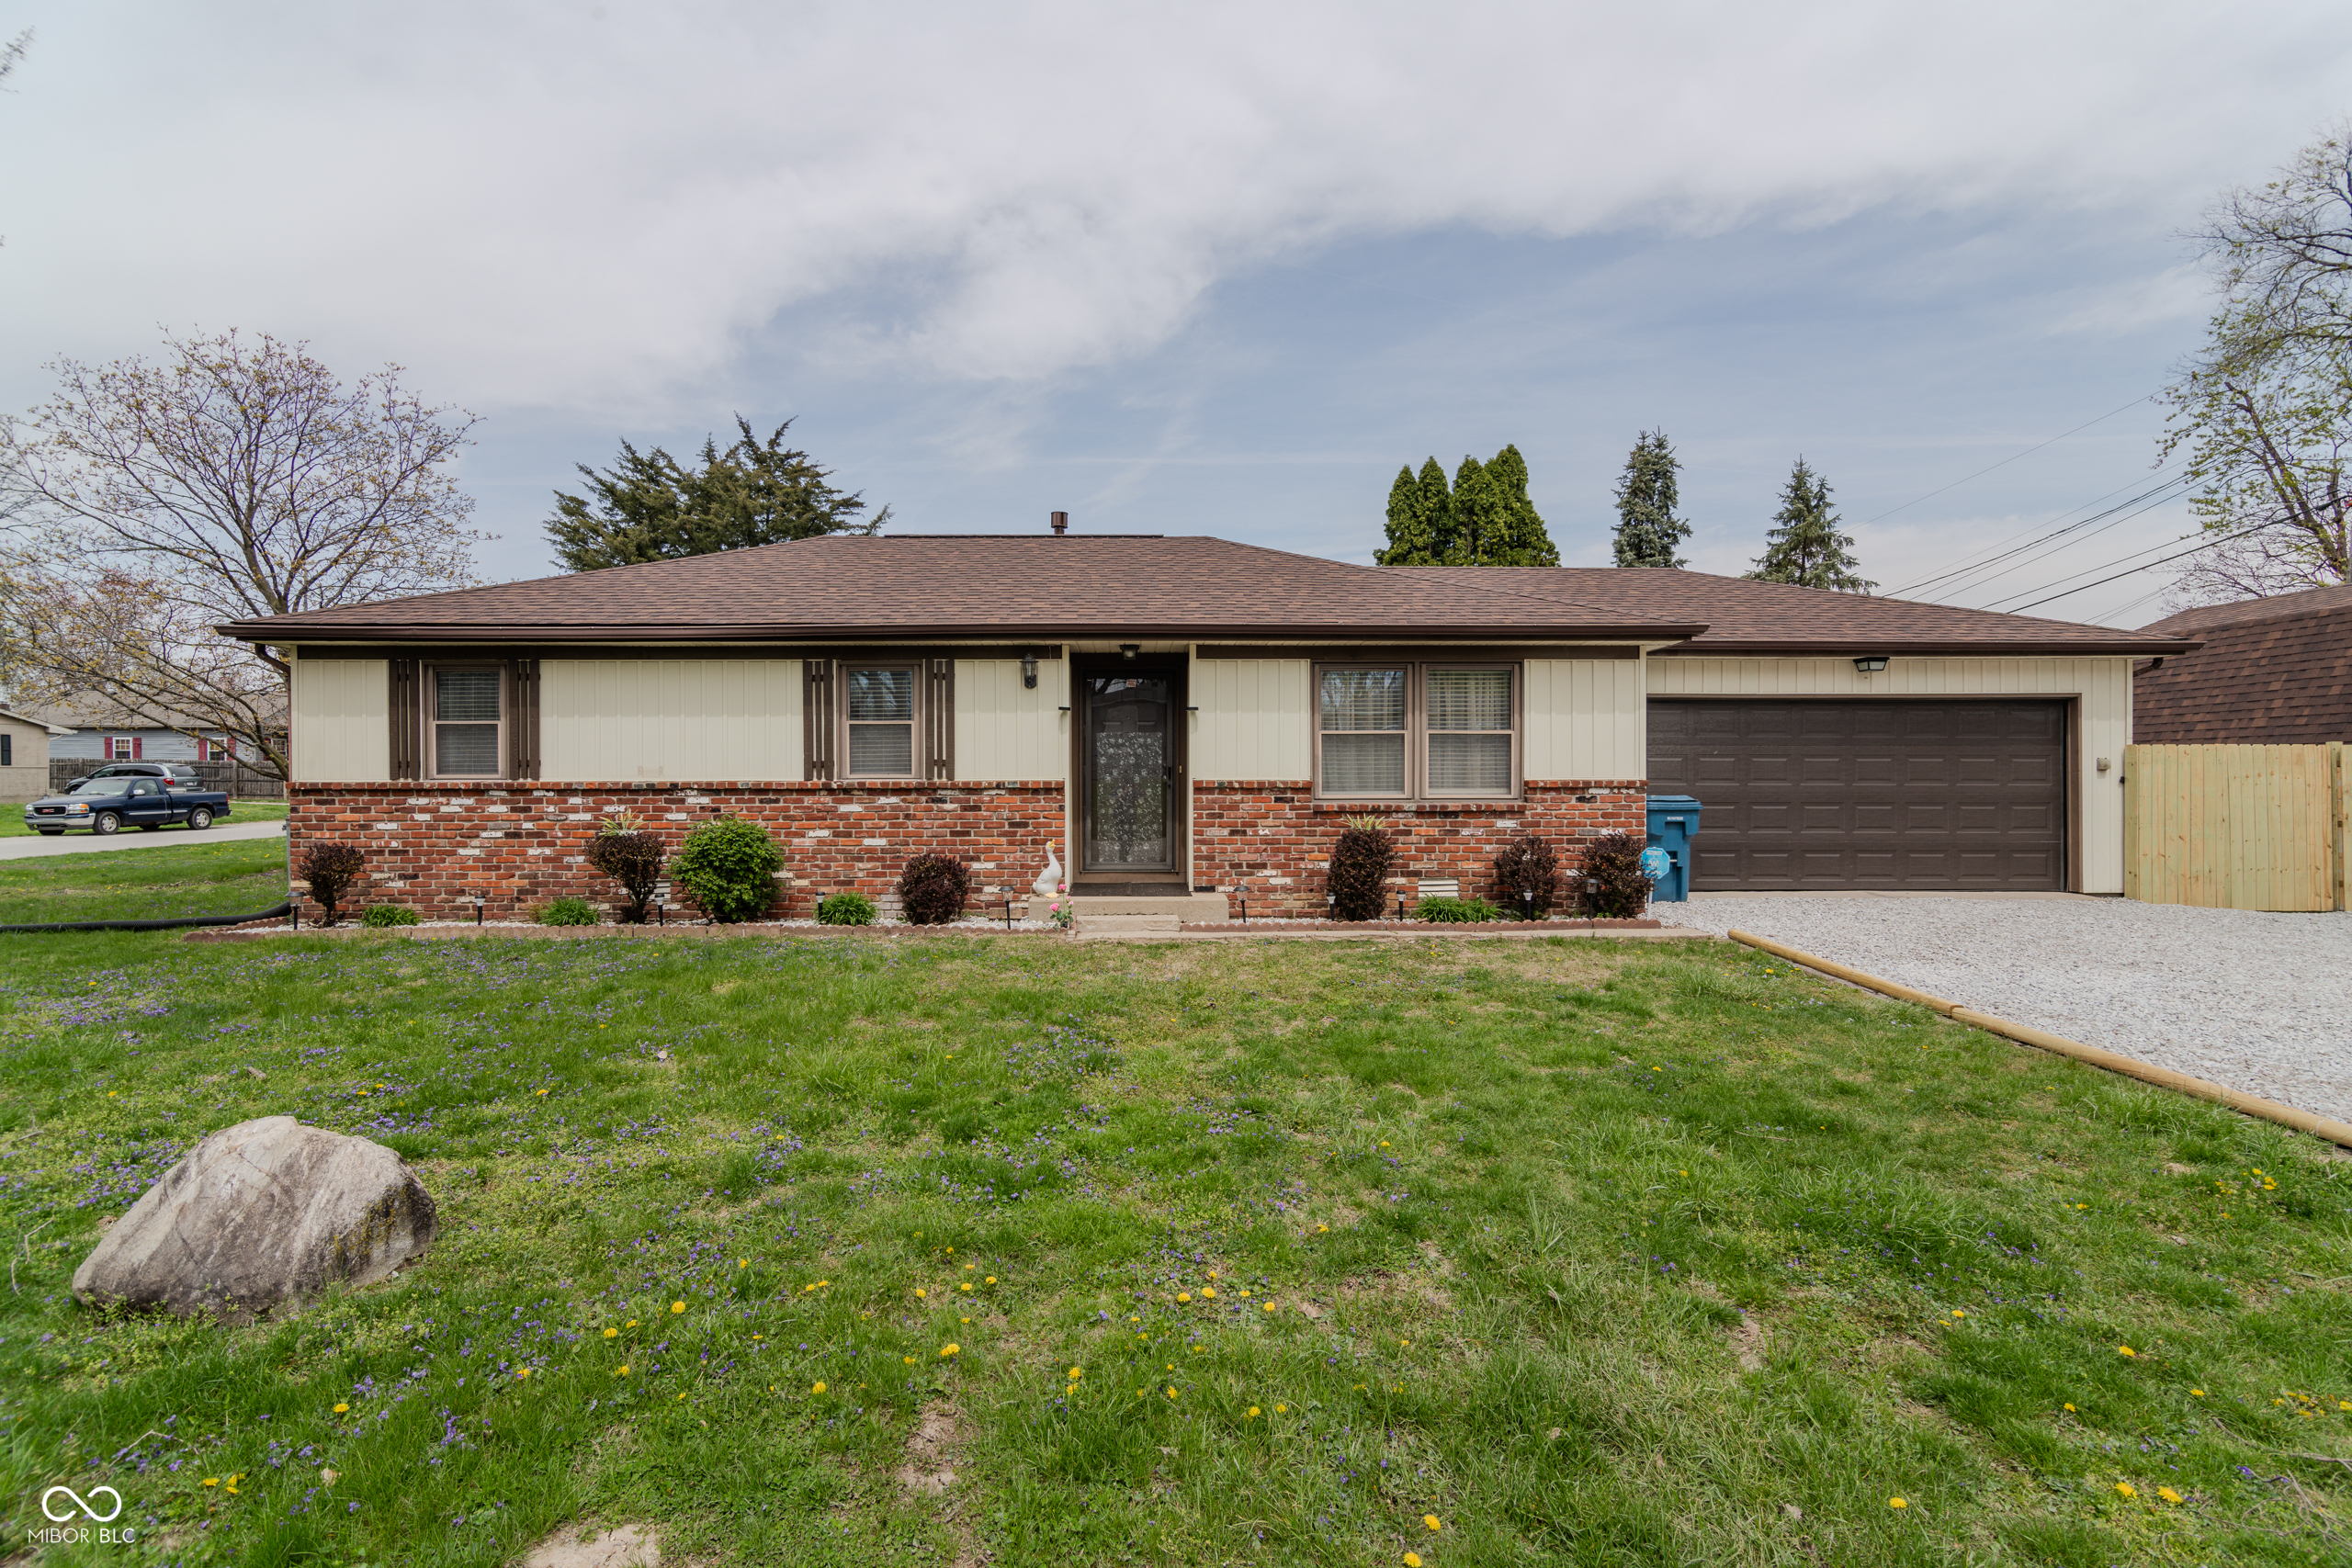
Pending
$210,000
3
bds
|
2
ba
|
1,147
sqft
|
built
1971
10225 Bayton Ct, Indianapolis, IN 46229
$-41
Cash flow
-1.0%
Cash-on-Cash Return
5.9%
Cap rate
0.7%
Rent to Value Ratio

Active
$489,900
2
bds
|
2
ba
|
1,661
sqft
|
built
1934
1 Virginia Ave, Indianapolis, IN 46204
$-351
Cash flow
-3.7%
Cash-on-Cash Return
5.3%
Cap rate
0.8%
Rent to Value Ratio
Active
$419,900
3
bds
|
0
ba
|
0
sqft
|
built
1909
4055 N College Ave, Indianapolis, IN 46205
$-1,185
Cash flow
-14.7%
Cash-on-Cash Return
2.8%
Cap rate
0.3%
Rent to Value Ratio
Active
$499,900
4
bds
|
4
ba
|
4,055
sqft
|
built
1993
7341 Campfire Run, Indianapolis, IN 46236
$-428
Cash flow
-4.5%
Cash-on-Cash Return
5.1%
Cap rate
0.6%
Rent to Value Ratio
Active
$284,950
2
bds
|
3
ba
|
1,585
sqft
|
built
1924
350 N Meridian St, Indianapolis, IN 46204
$-455
Cash flow
-8.3%
Cash-on-Cash Return
4.2%
Cap rate
0.9%
Rent to Value Ratio
Active
$254,900
4
bds
|
2
ba
|
1,944
sqft
|
built
1890
248 N Walcott St, Indianapolis, IN 46201
$419
Cash flow
8.6%
Cash-on-Cash Return
8.1%
Cap rate
1.0%
Rent to Value Ratio
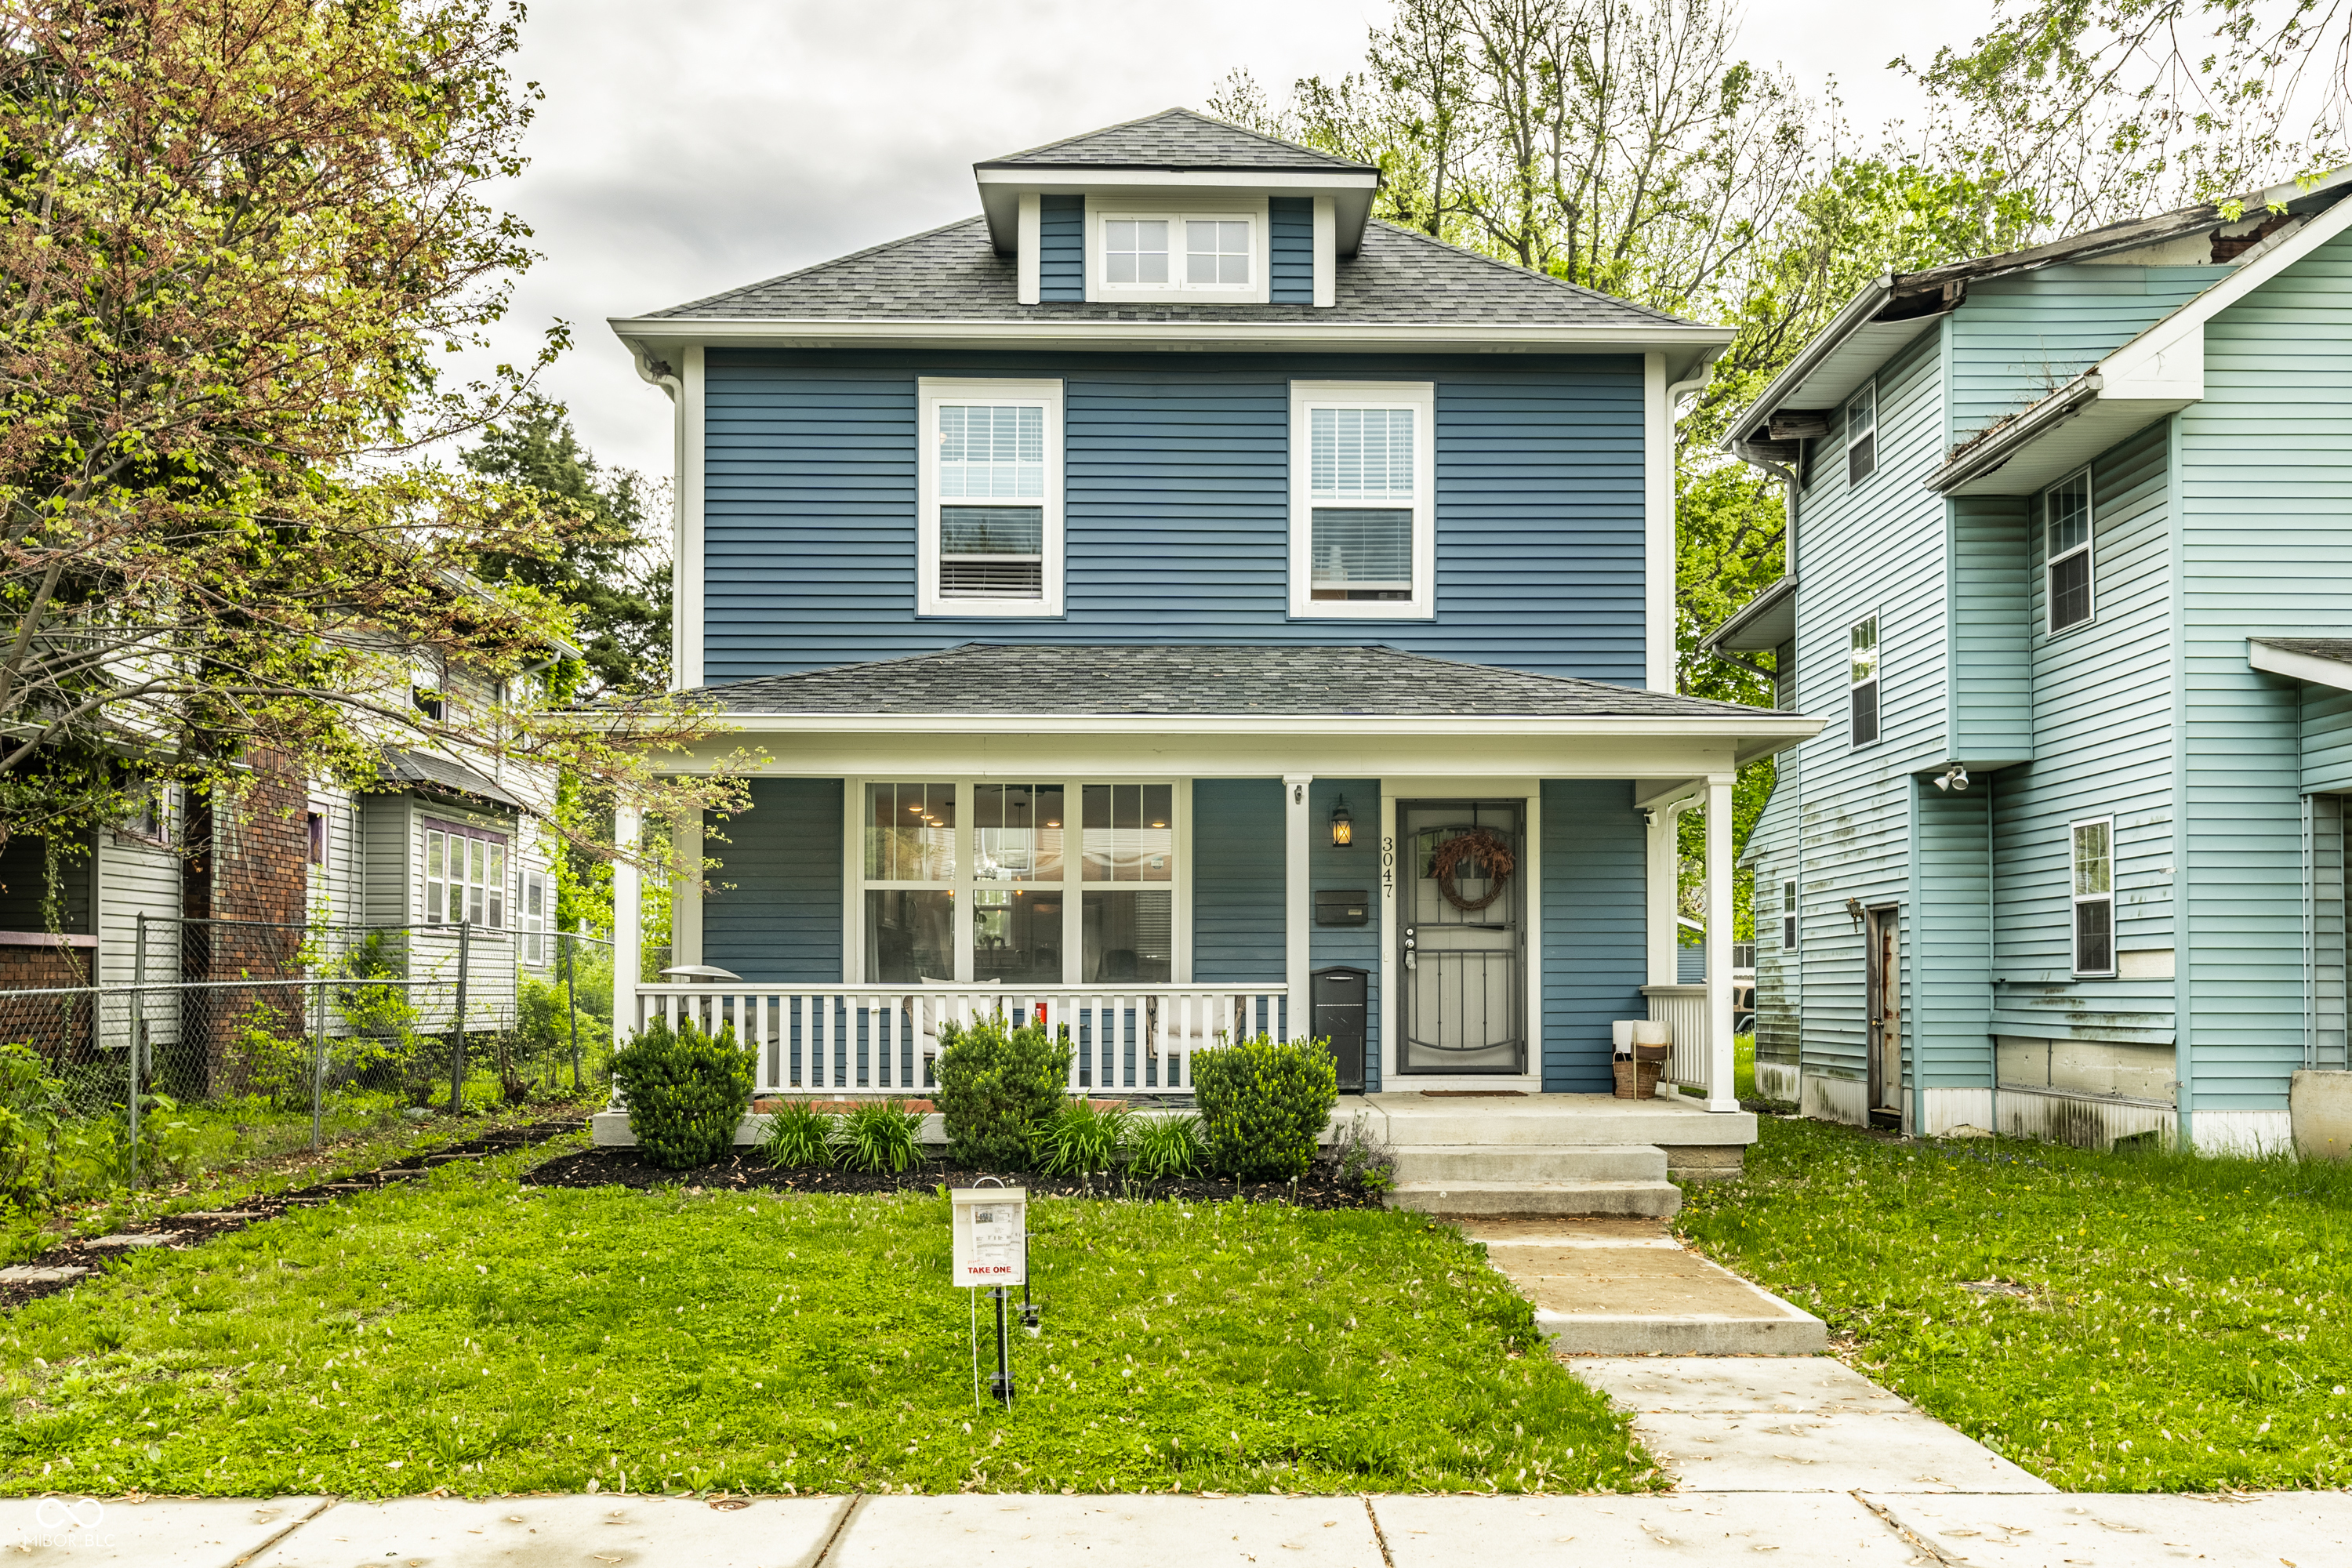
Active
$325,000
4
bds
|
3
ba
|
1,600
sqft
|
built
2018
3047 N New Jersey St, Indianapolis, IN 46205
$-147
Cash flow
-2.4%
Cash-on-Cash Return
5.6%
Cap rate
0.7%
Rent to Value Ratio
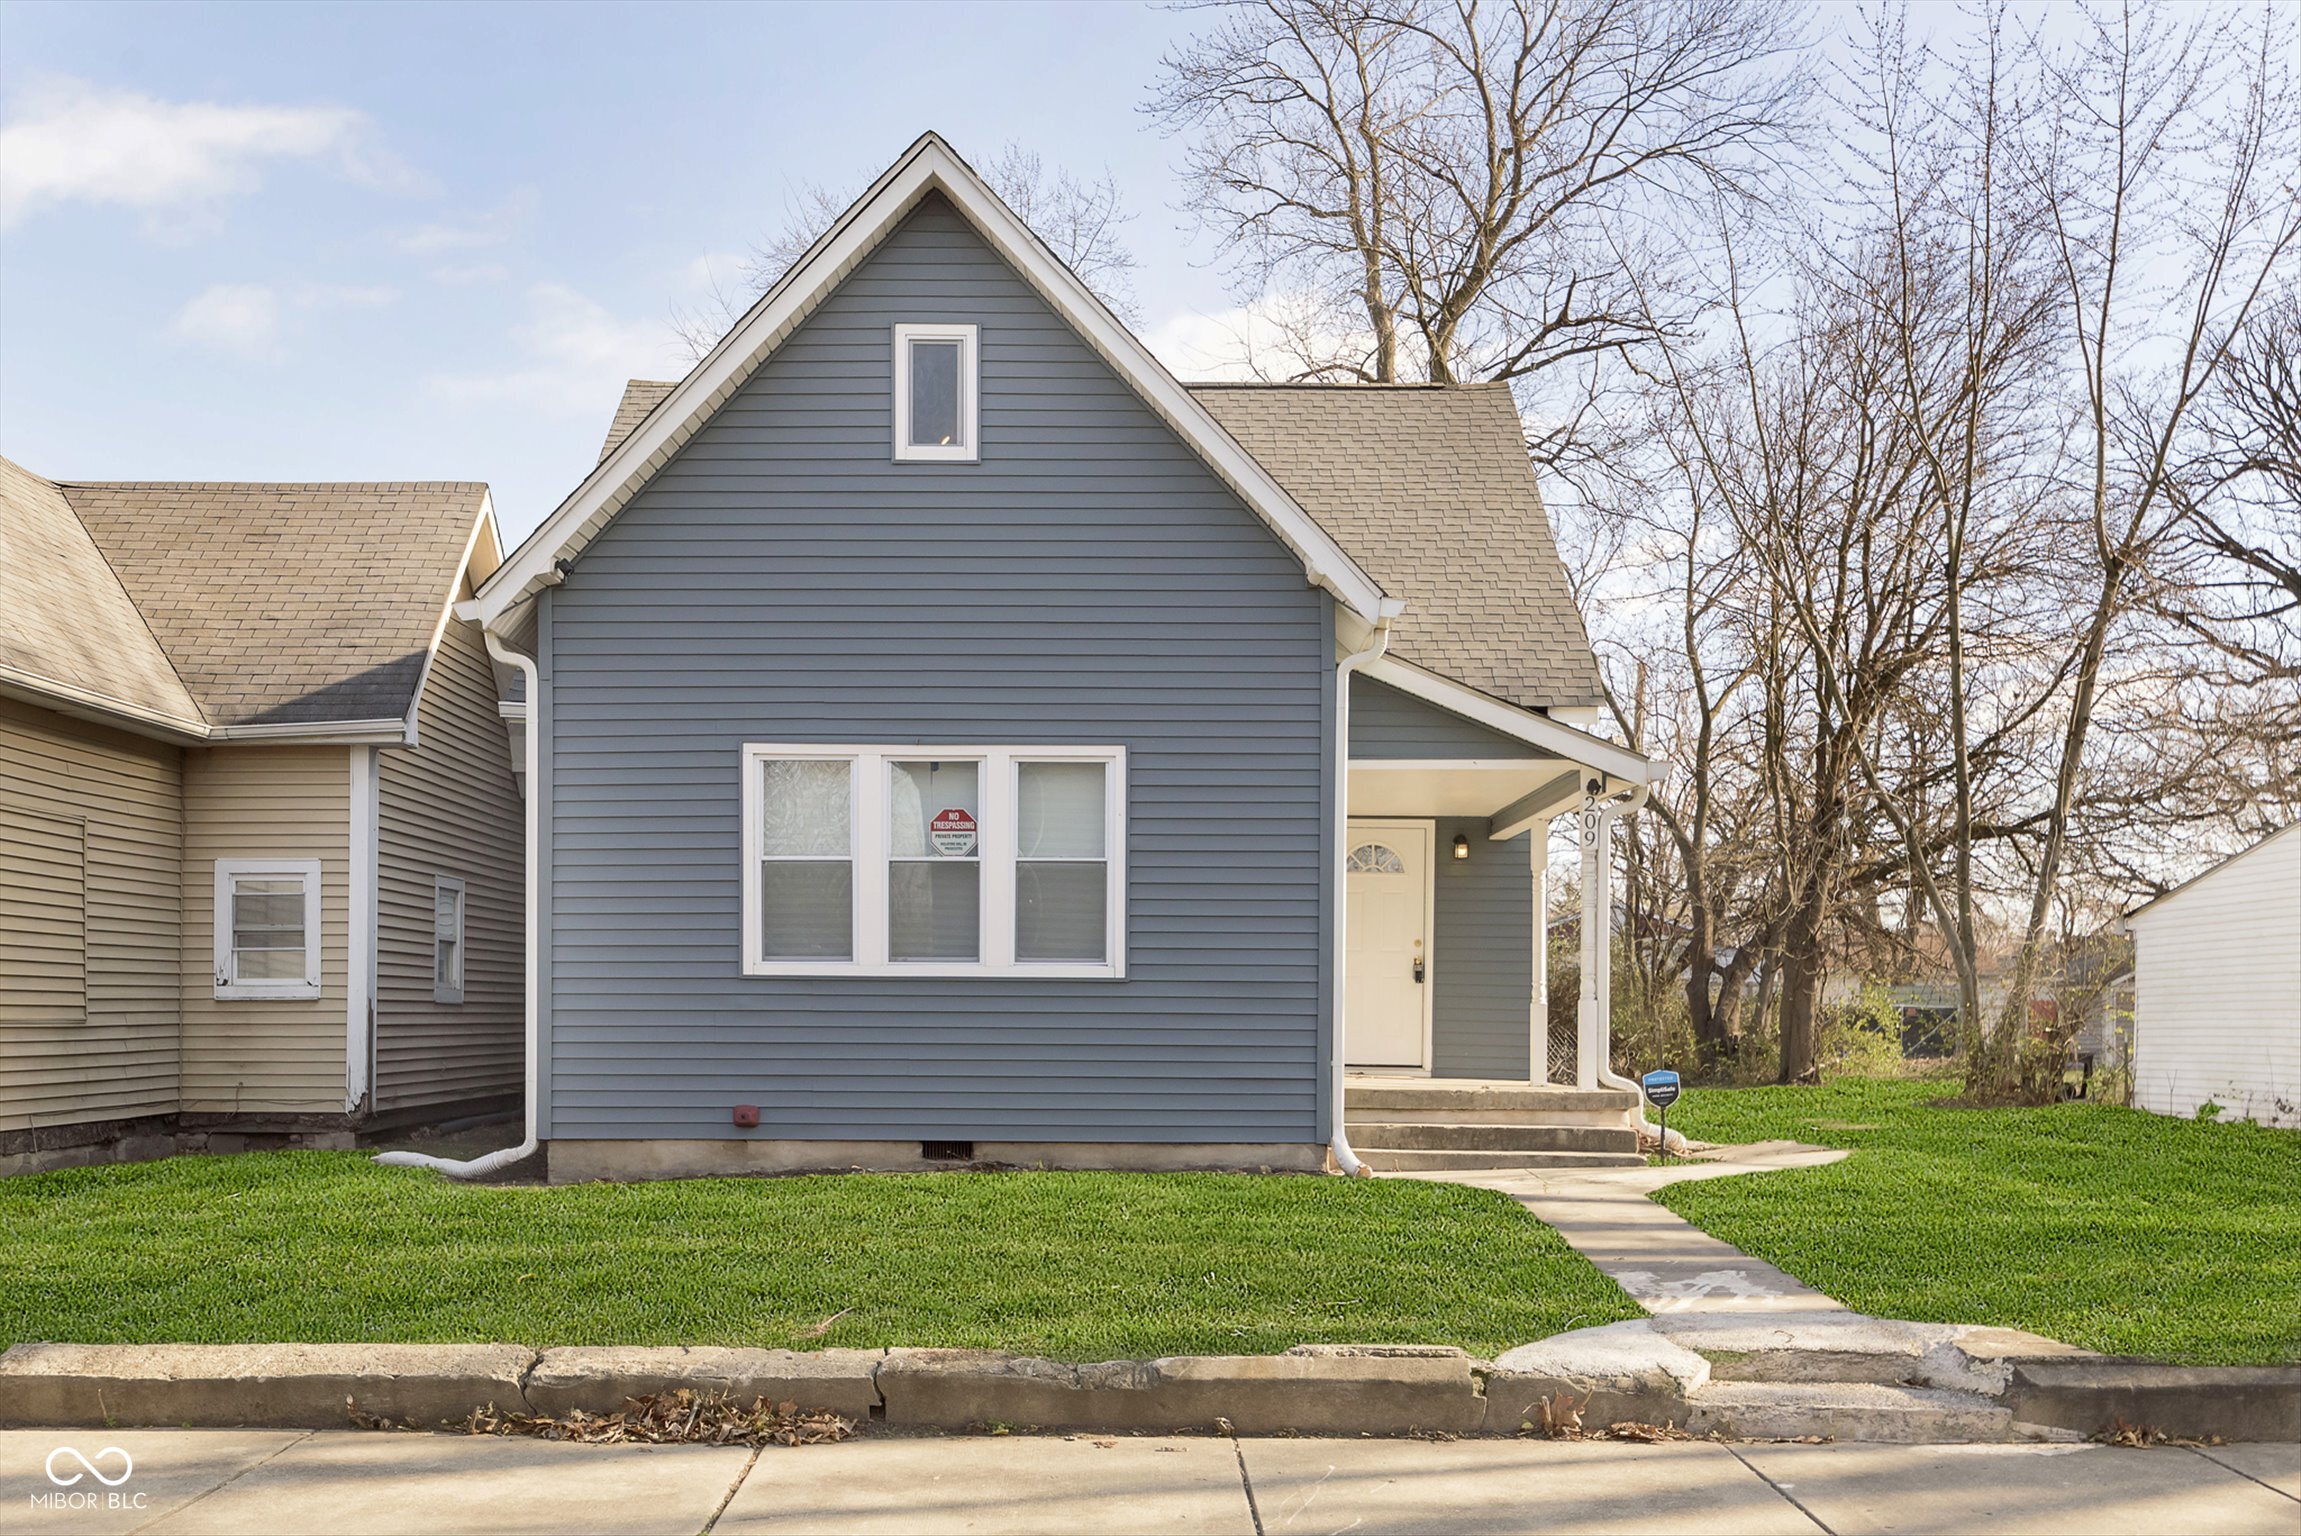
Active
$239,900
3
bds
|
3
ba
|
1,982
sqft
|
built
1905
209 Trowbridge St, Indianapolis, IN 46201
$151
Cash flow
3.3%
Cash-on-Cash Return
6.9%
Cap rate
0.8%
Rent to Value Ratio
Pending
$325,000
3
bds
|
2
ba
|
2,000
sqft
|
built
1964
7734 Hoover Rd, Indianapolis, IN 46260
$-78
Cash flow
-1.3%
Cash-on-Cash Return
5.9%
Cap rate
0.7%
Rent to Value Ratio
Active
$230,000
2
bds
|
2
ba
|
1,113
sqft
|
built
1999
7259 Registry Dr, Indianapolis, IN 46217
$-192
Cash flow
-4.4%
Cash-on-Cash Return
5.1%
Cap rate
0.7%
Rent to Value Ratio
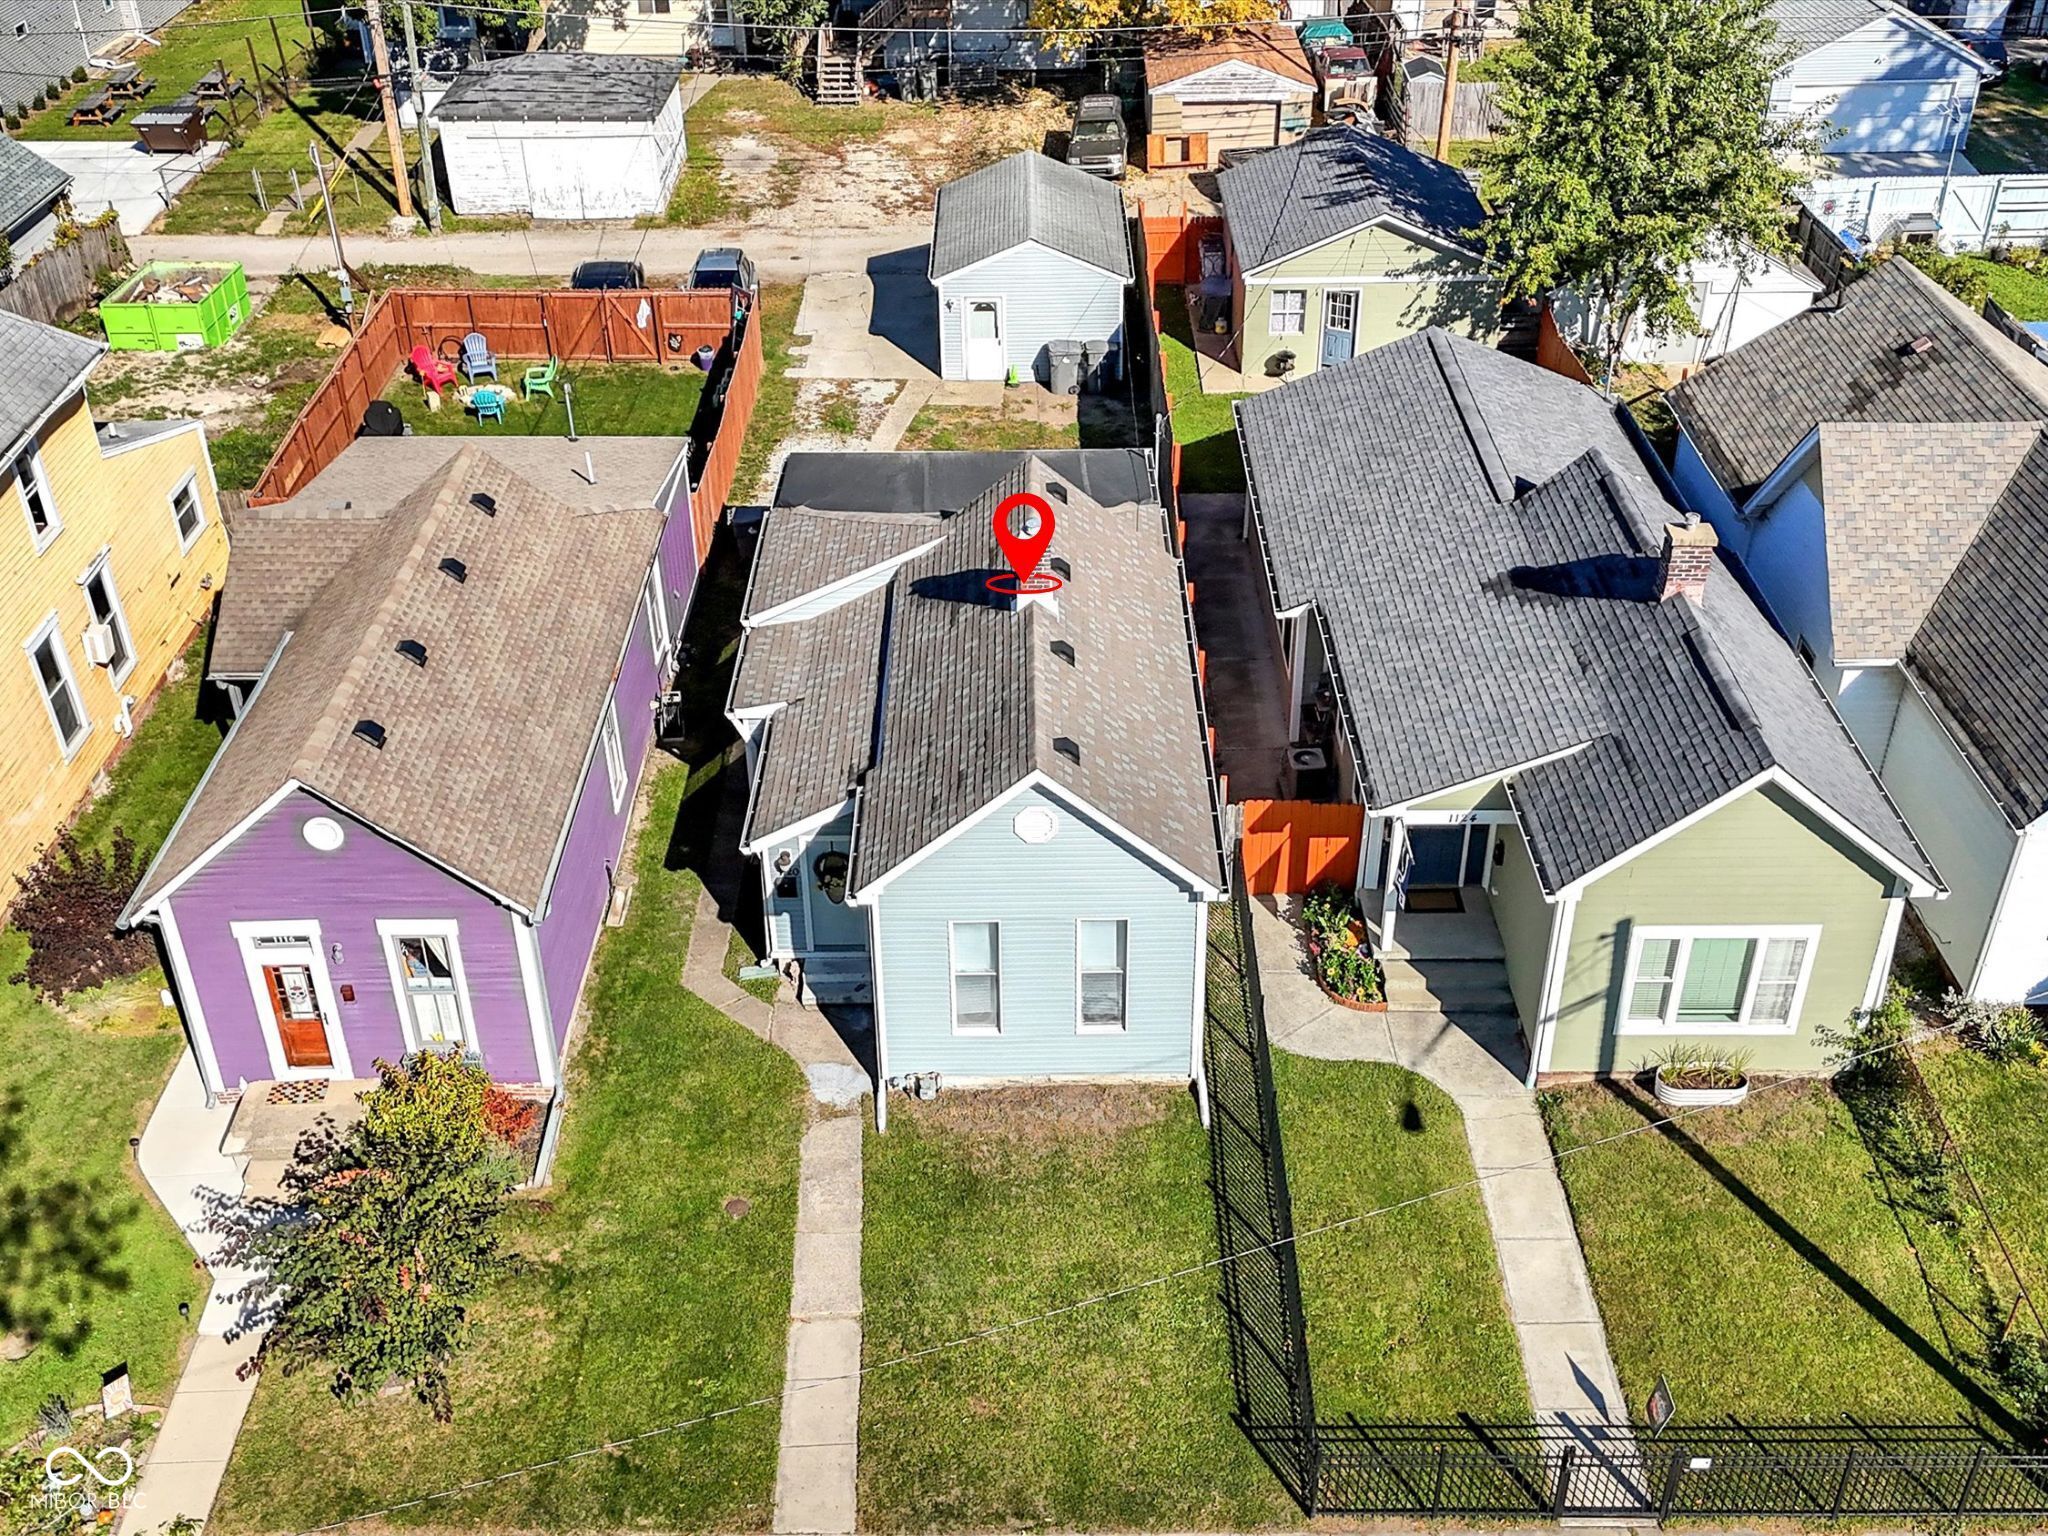
Active
$180,000
2
bds
|
1
ba
|
896
sqft
|
built
1870
1120 Lexington Ave, Indianapolis, IN 46203
$44
Cash flow
1.3%
Cash-on-Cash Return
6.4%
Cap rate
0.8%
Rent to Value Ratio
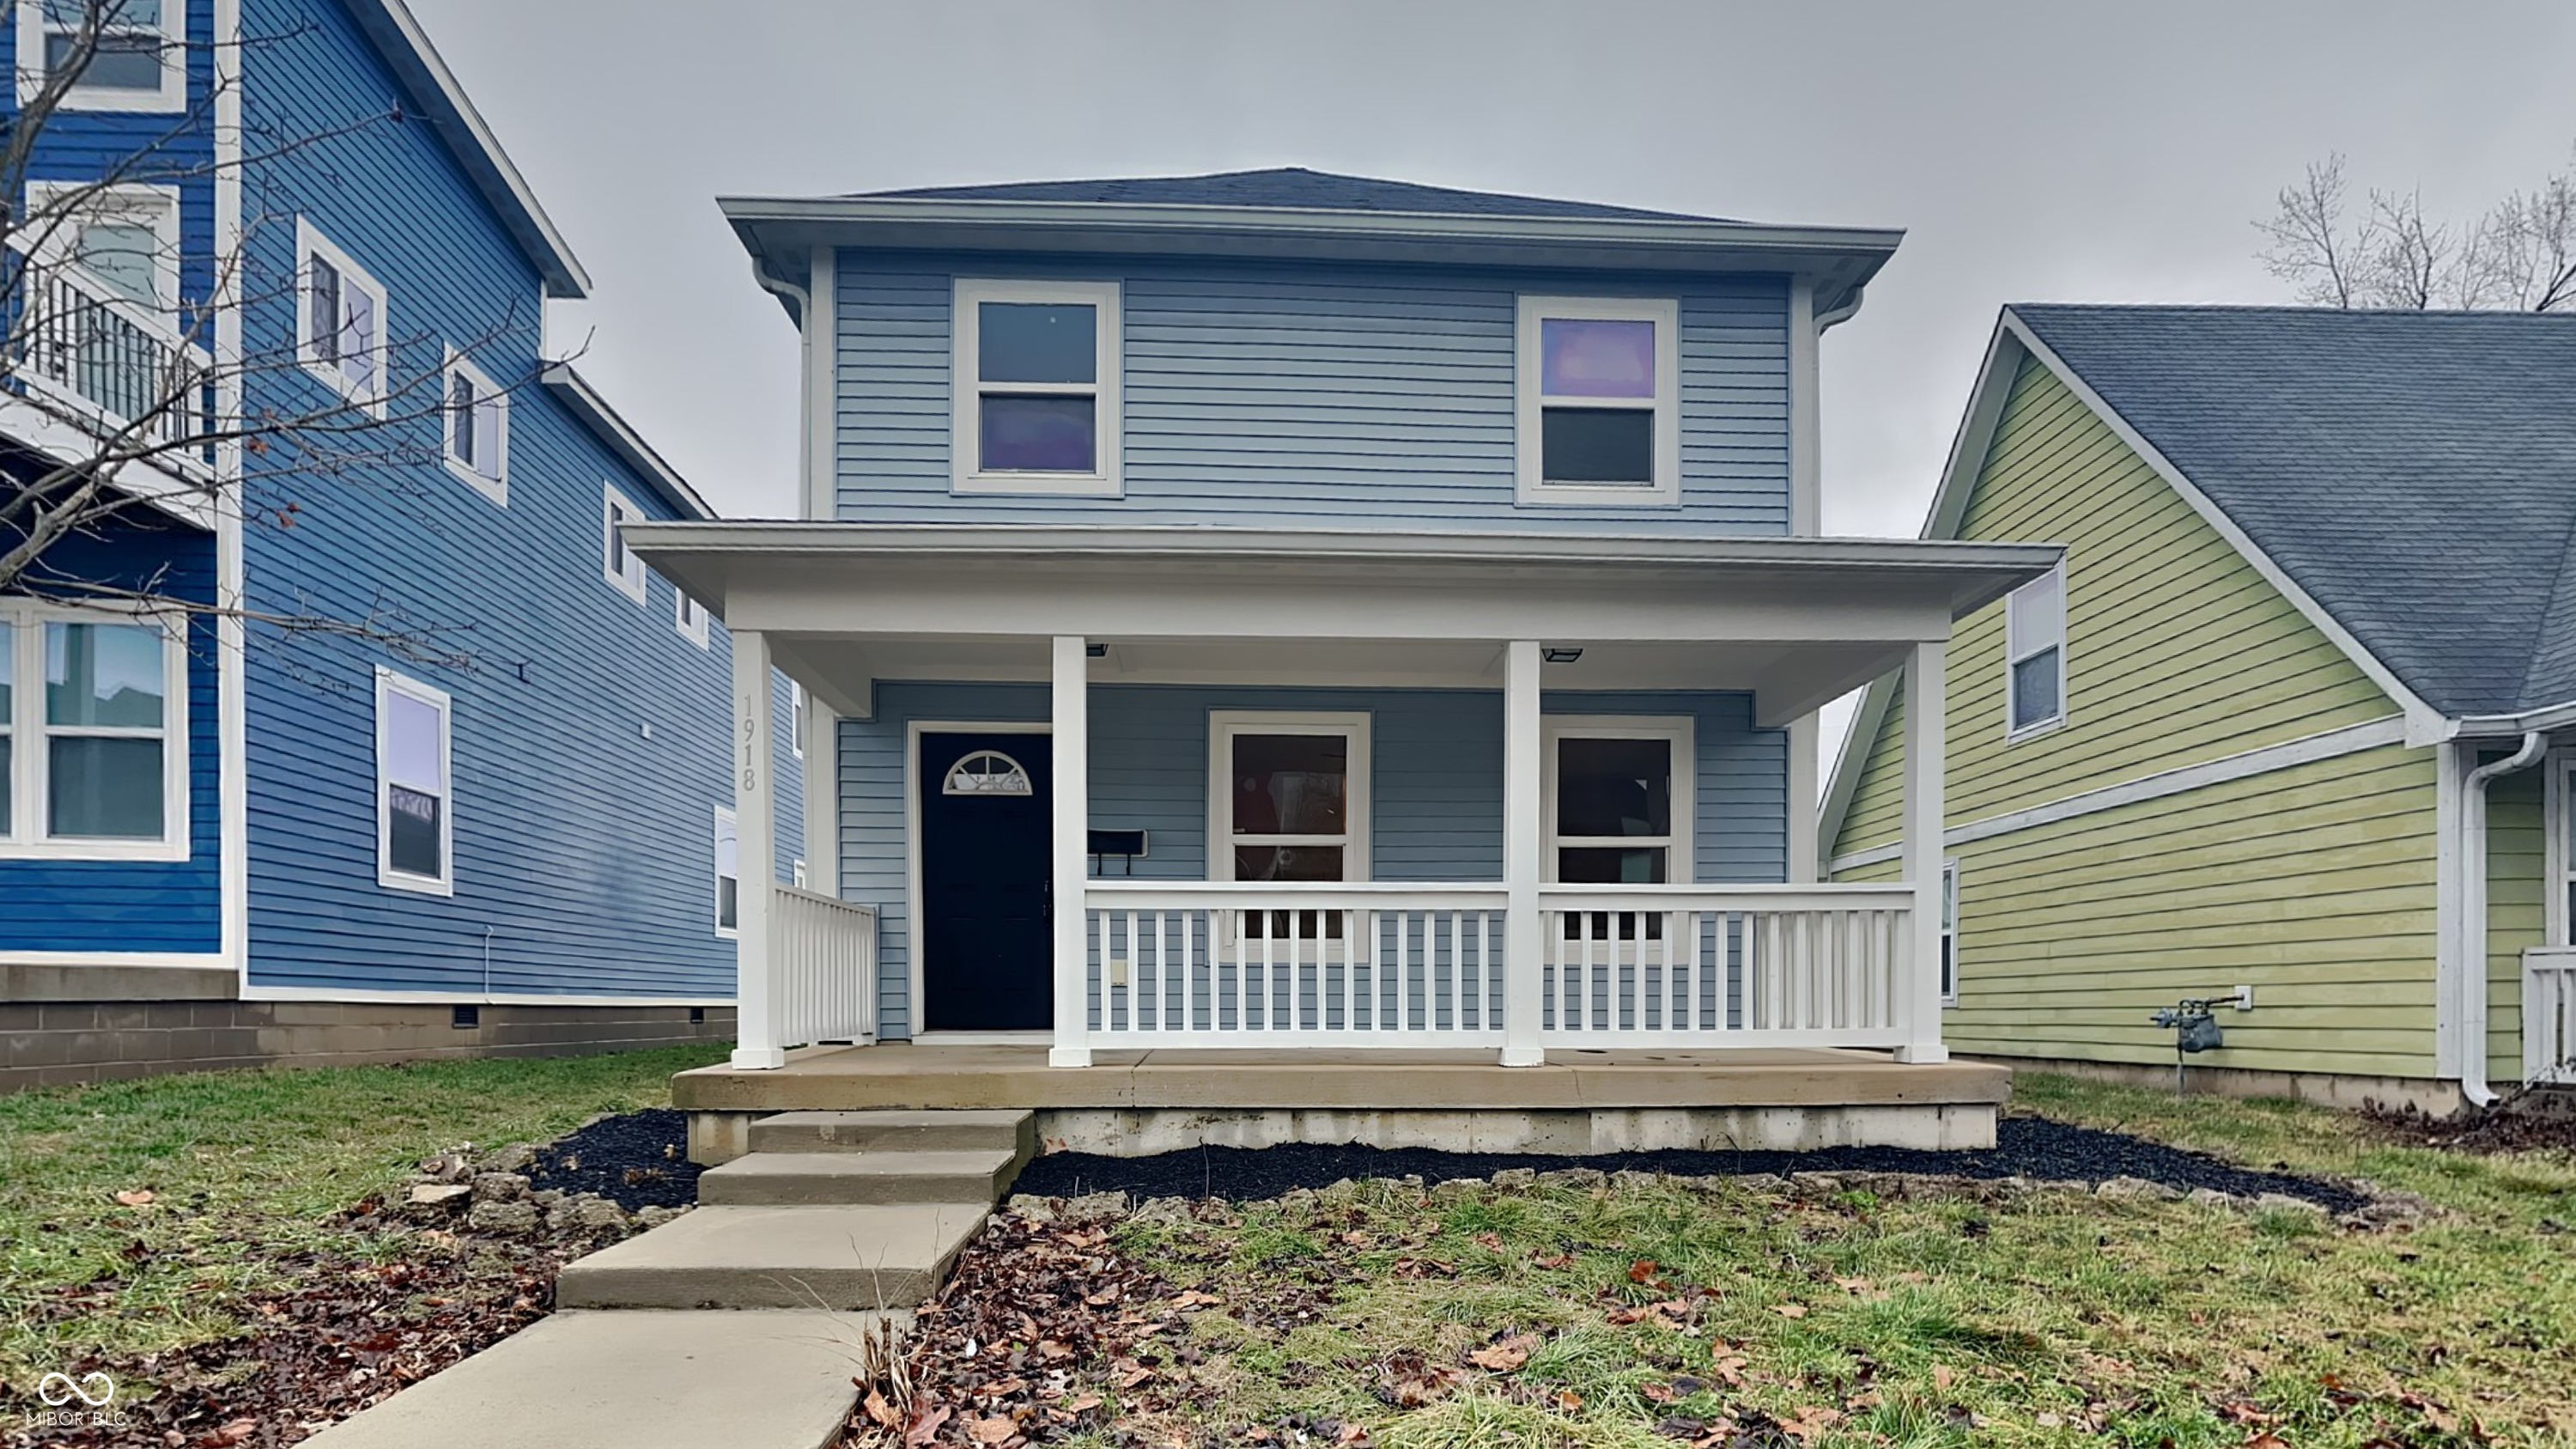
Active
$329,900
4
bds
|
2
ba
|
1,580
sqft
|
built
2010
1918 Cornell Ave, Indianapolis, IN 46202
$-34
Cash flow
-0.5%
Cash-on-Cash Return
6.0%
Cap rate
0.7%
Rent to Value Ratio
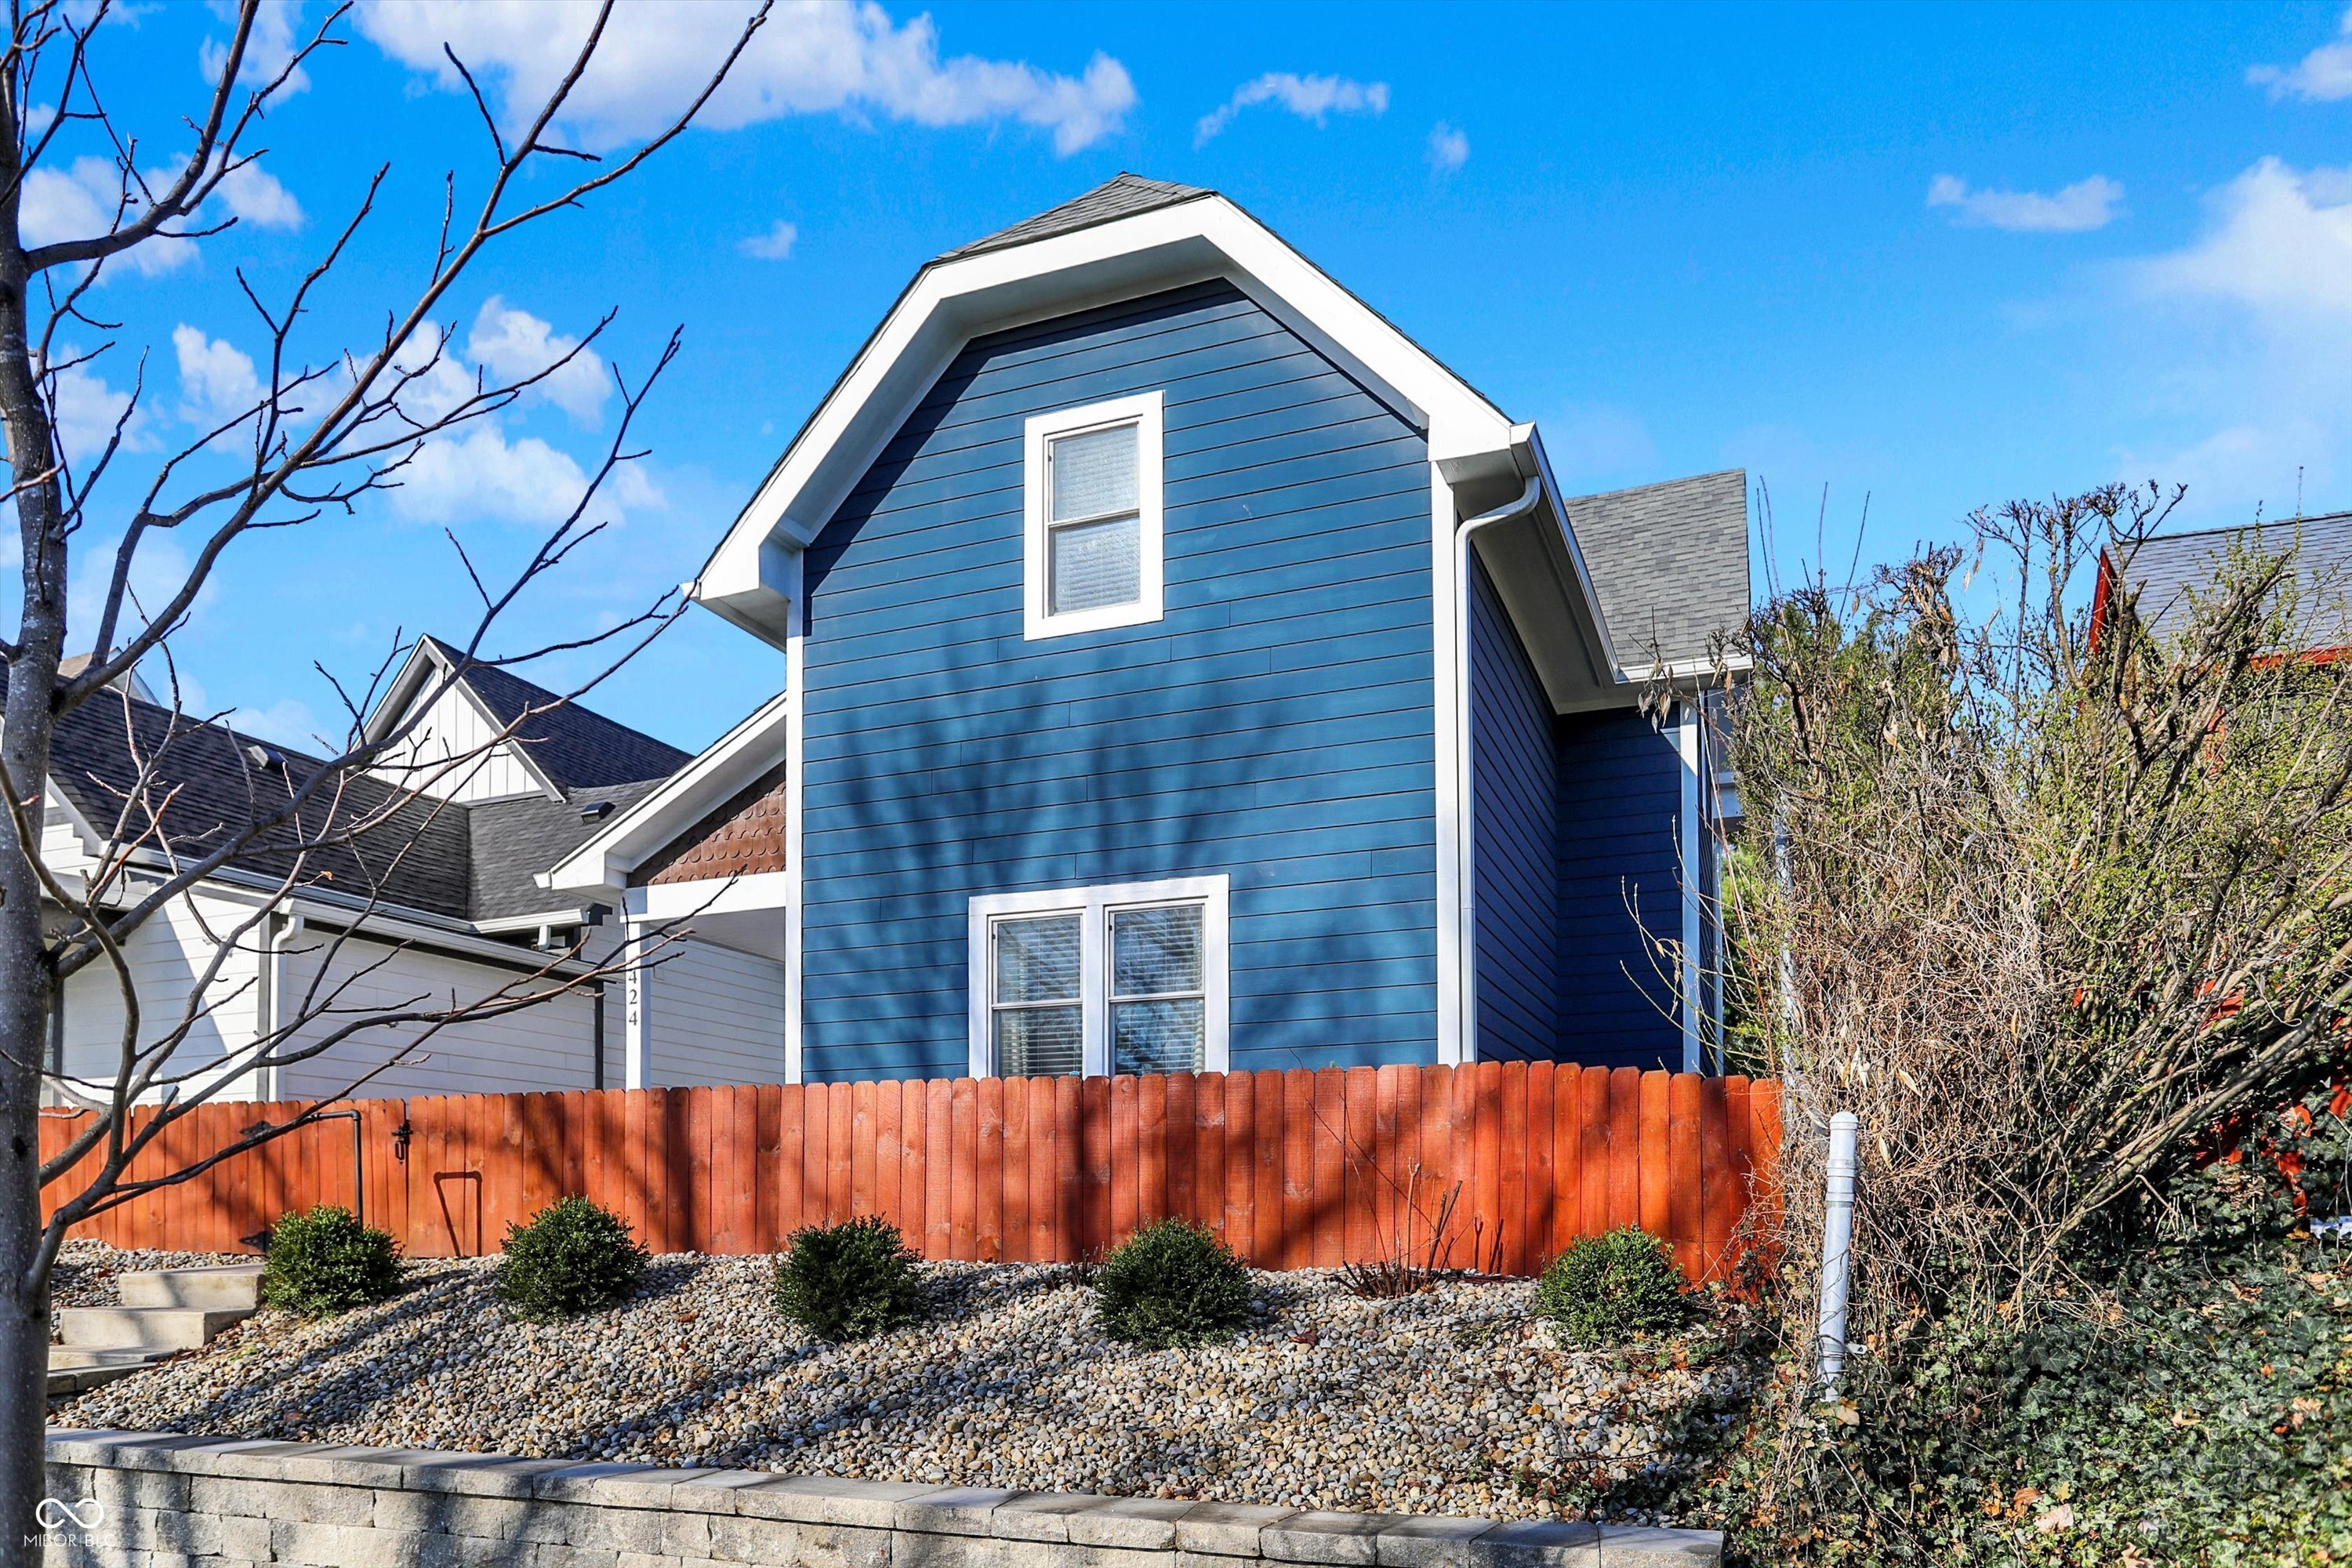
Active
$359,000
3
bds
|
3
ba
|
1,672
sqft
|
built
1890
424 N Randolph St, Indianapolis, IN 46201
$-252
Cash flow
-3.7%
Cash-on-Cash Return
5.3%
Cap rate
0.6%
Rent to Value Ratio

Pending
$350,000
4
bds
|
3
ba
|
2,650
sqft
|
built
1930
40 N Ritter Ave, Indianapolis, IN 46219
$-68
Cash flow
-1.0%
Cash-on-Cash Return
5.9%
Cap rate
0.7%
Rent to Value Ratio
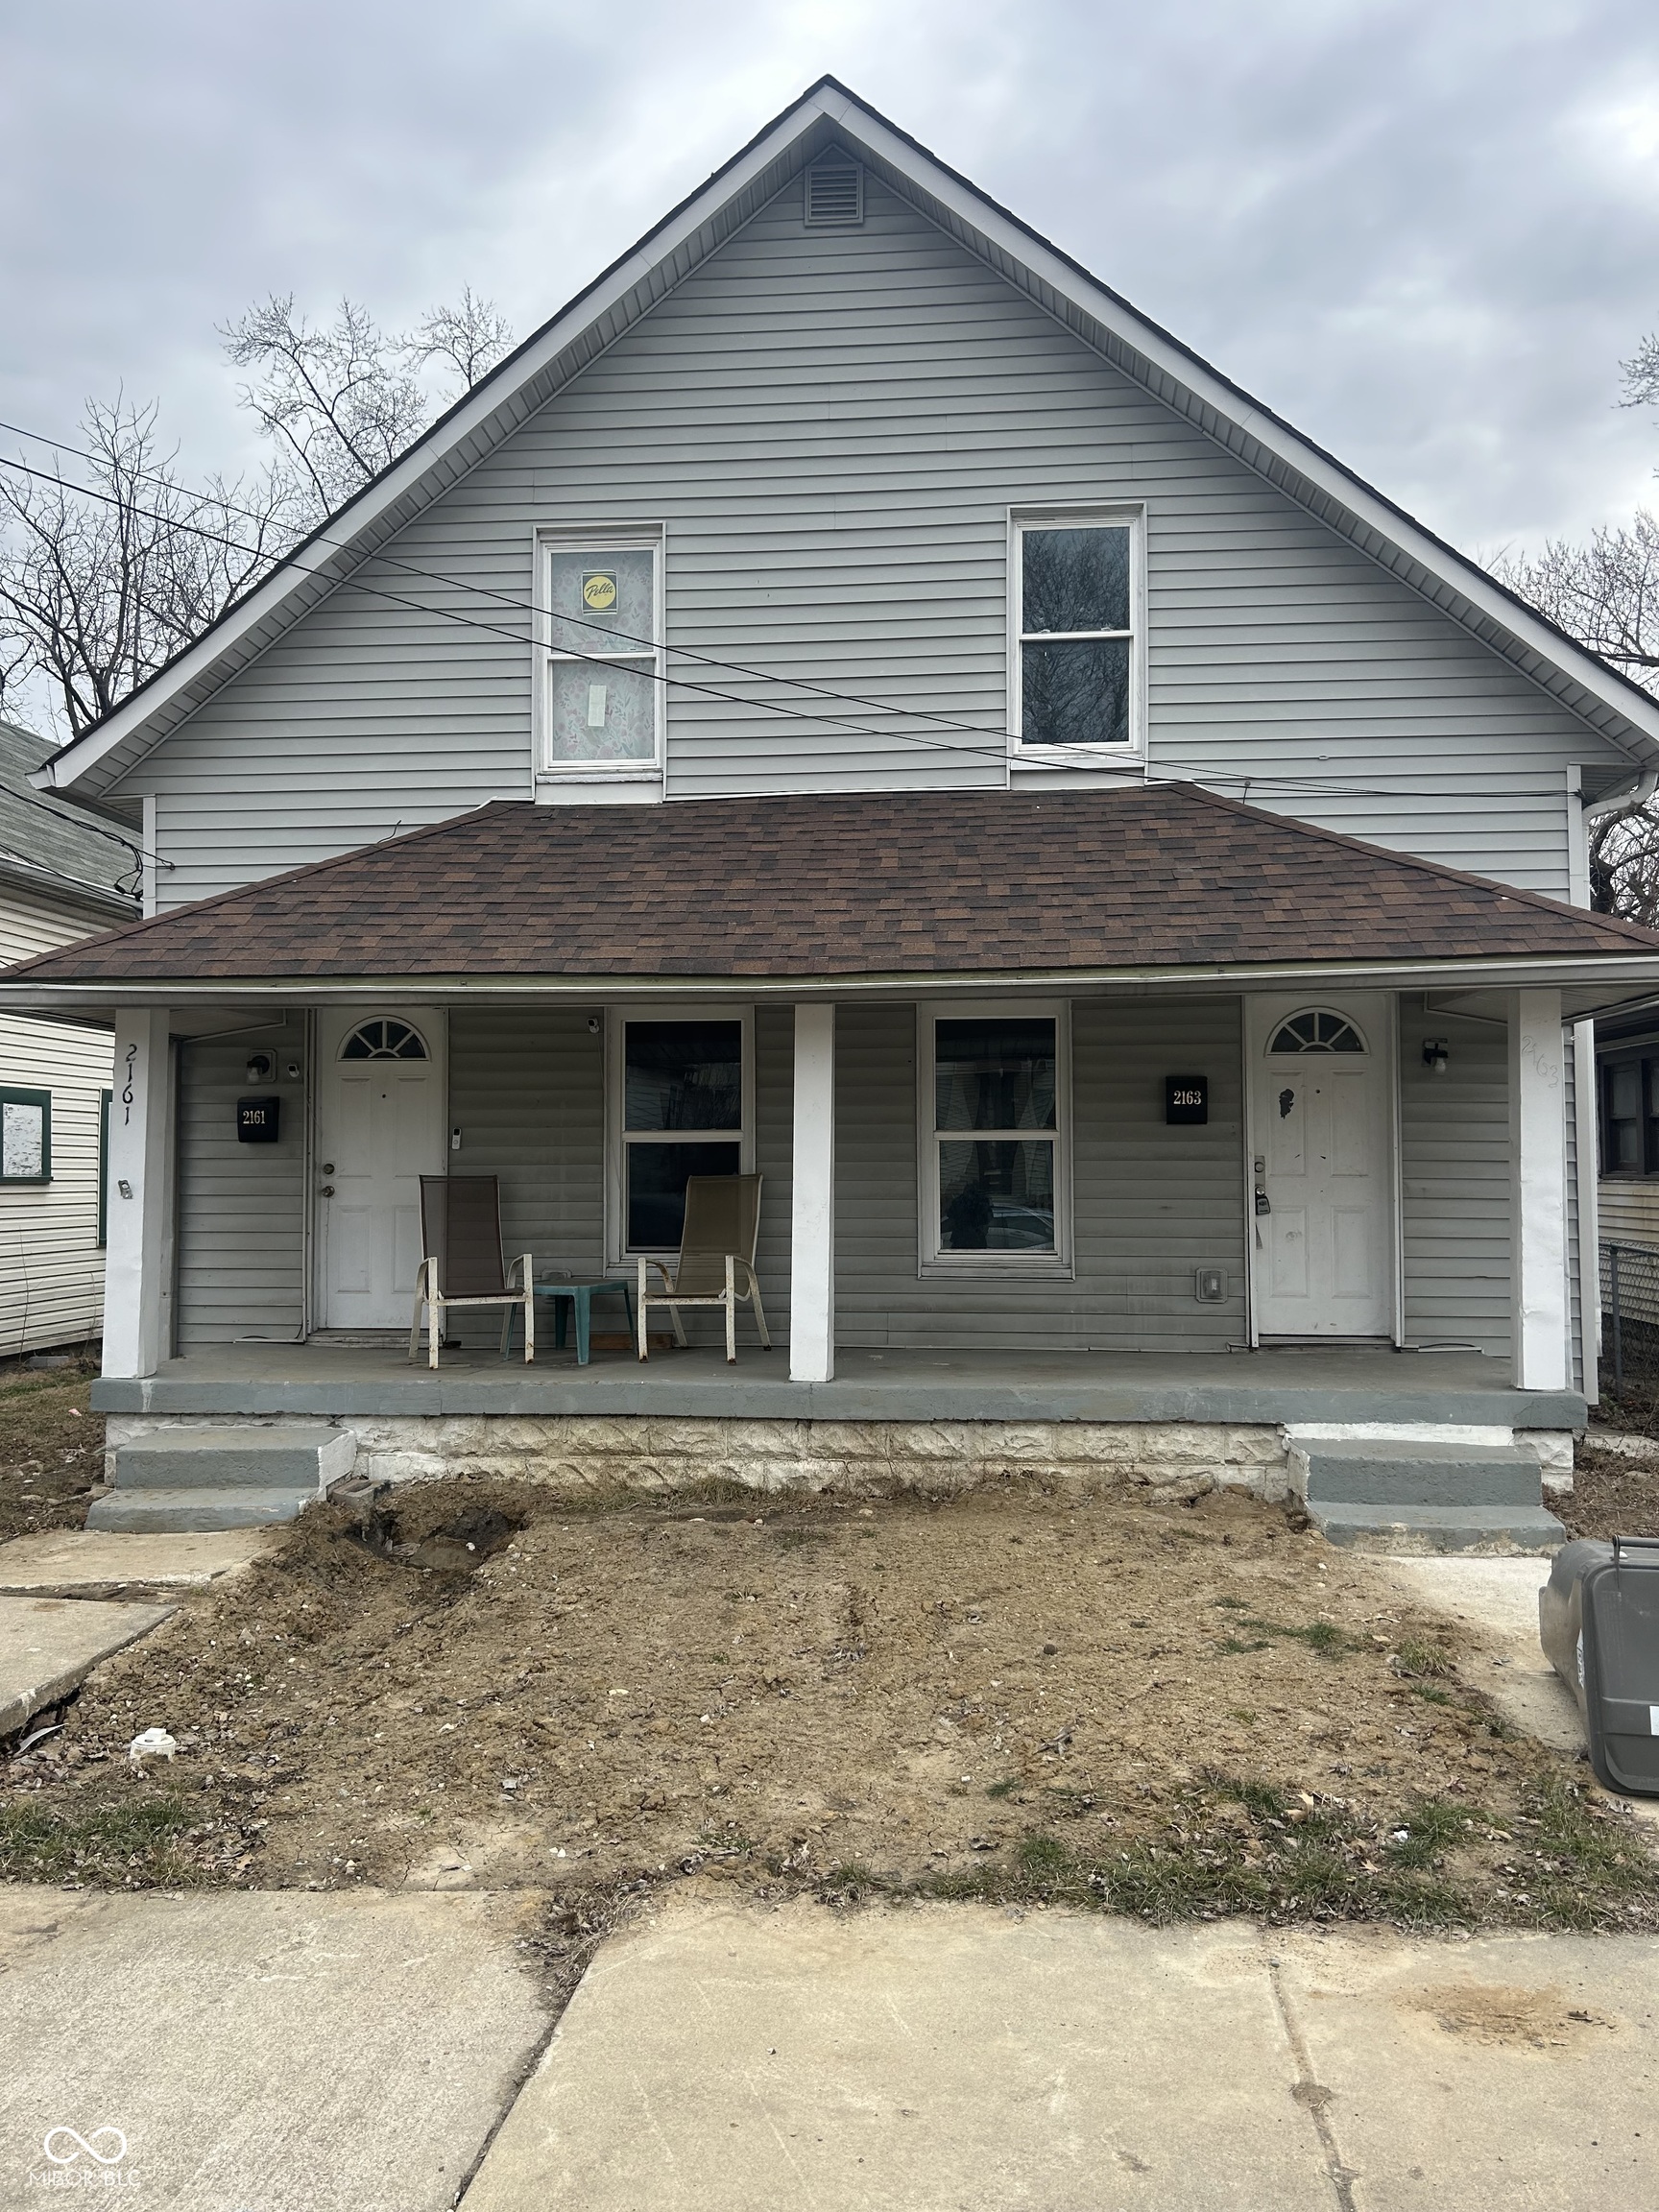
Active
$184,900
0
bds
|
0
ba
|
0
sqft
|
built
1920
2161 Ransdell St, Indianapolis, IN 46225
$-257
Cash flow
-7.3%
Cash-on-Cash Return
4.5%
Cap rate
0.5%
Rent to Value Ratio
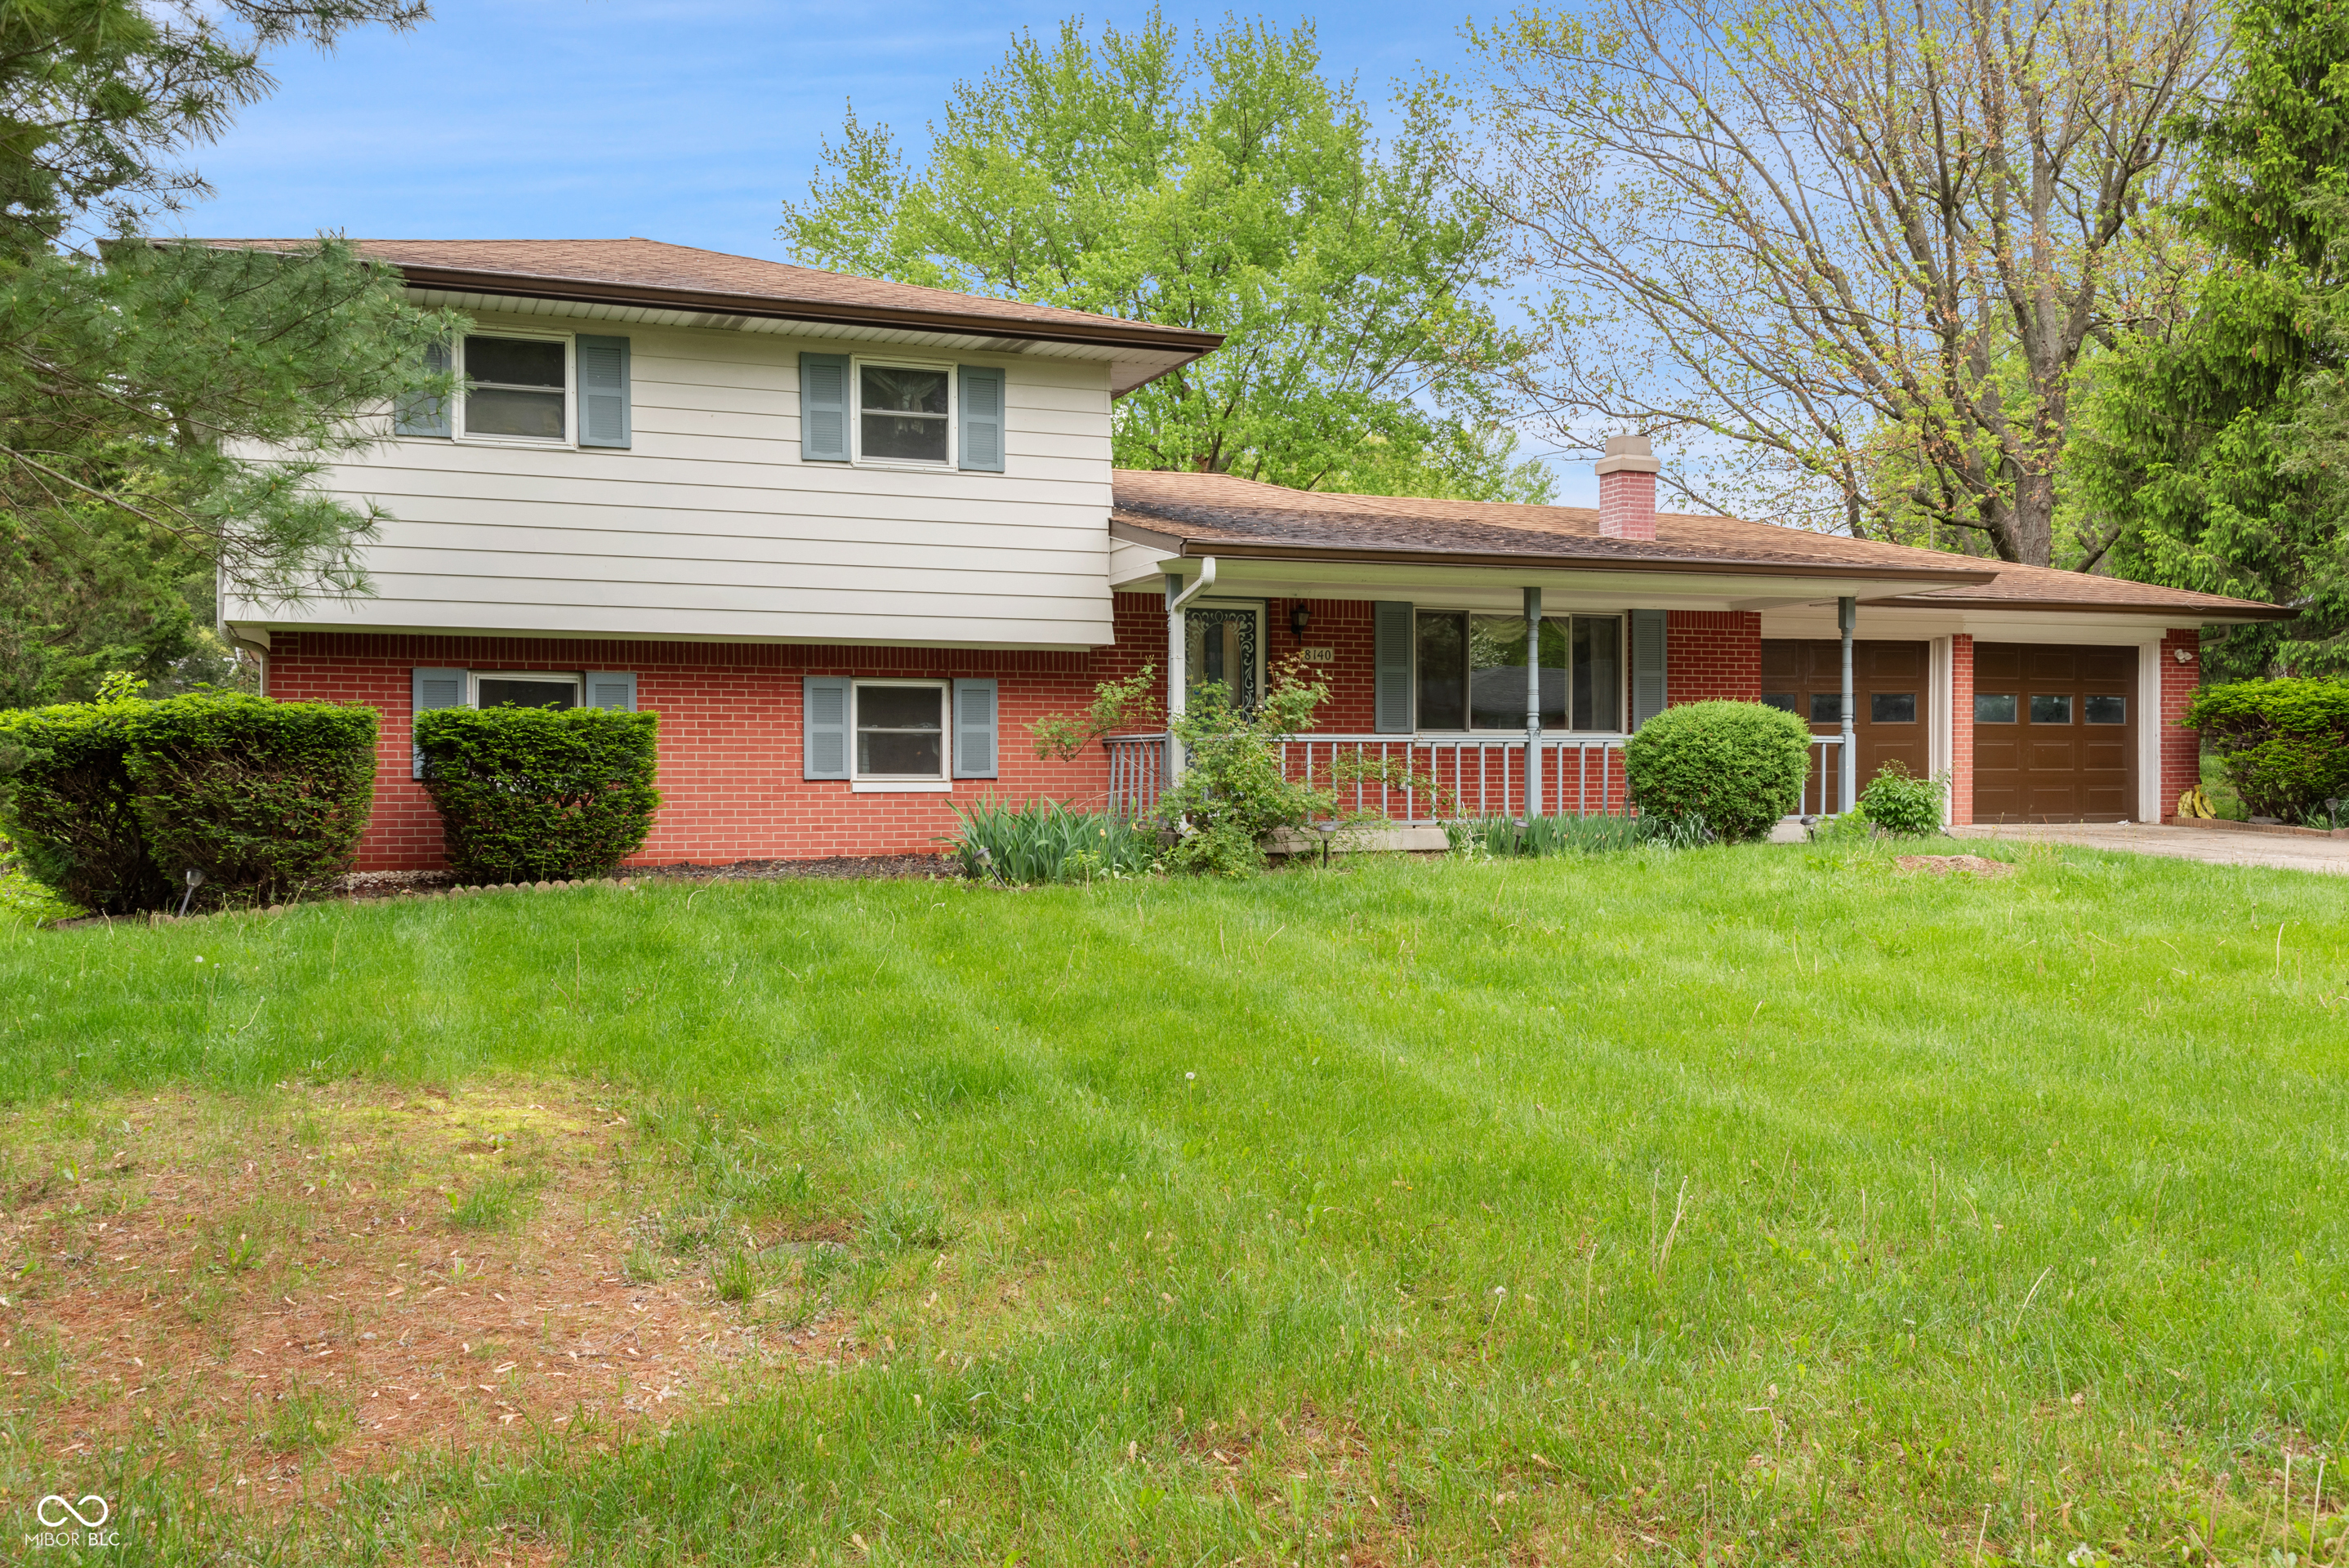
Active
$299,990
4
bds
|
3
ba
|
2,084
sqft
|
built
1967
8140 Valley Estates Dr, Indianapolis, IN 46227
$-157
Cash flow
-2.7%
Cash-on-Cash Return
5.5%
Cap rate
0.7%
Rent to Value Ratio
Active
$252,500
2
bds
|
1
ba
|
1,474
sqft
|
built
2016
1739 Elderberry Dr, Indianapolis, IN 46234
$-101
Cash flow
-2.1%
Cash-on-Cash Return
5.7%
Cap rate
0.7%
Rent to Value Ratio
Active
$539,500
3
bds
|
3
ba
|
3,294
sqft
|
built
2006
2037 Ruckle St, Indianapolis, IN 46202
$-349
Cash flow
-3.4%
Cash-on-Cash Return
5.4%
Cap rate
0.6%
Rent to Value Ratio
Active
$140,000
2
bds
|
1
ba
|
902
sqft
|
built
1908
1035 S Tremont St, Indianapolis, IN 46221
$111
Cash flow
4.1%
Cash-on-Cash Return
7.1%
Cap rate
0.9%
Rent to Value Ratio
Active
$115,000
2
bds
|
0
ba
|
0
sqft
|
built
1955
1916 E Maryland St, Indianapolis, IN 46201
$308
Cash flow
14.0%
Cash-on-Cash Return
9.4%
Cap rate
1.1%
Rent to Value Ratio
Active
$174,900
3
bds
|
1
ba
|
1,073
sqft
|
built
1959
1716 Arlene Dr, Indianapolis, IN 46219
$70
Cash flow
2.1%
Cash-on-Cash Return
6.6%
Cap rate
0.8%
Rent to Value Ratio
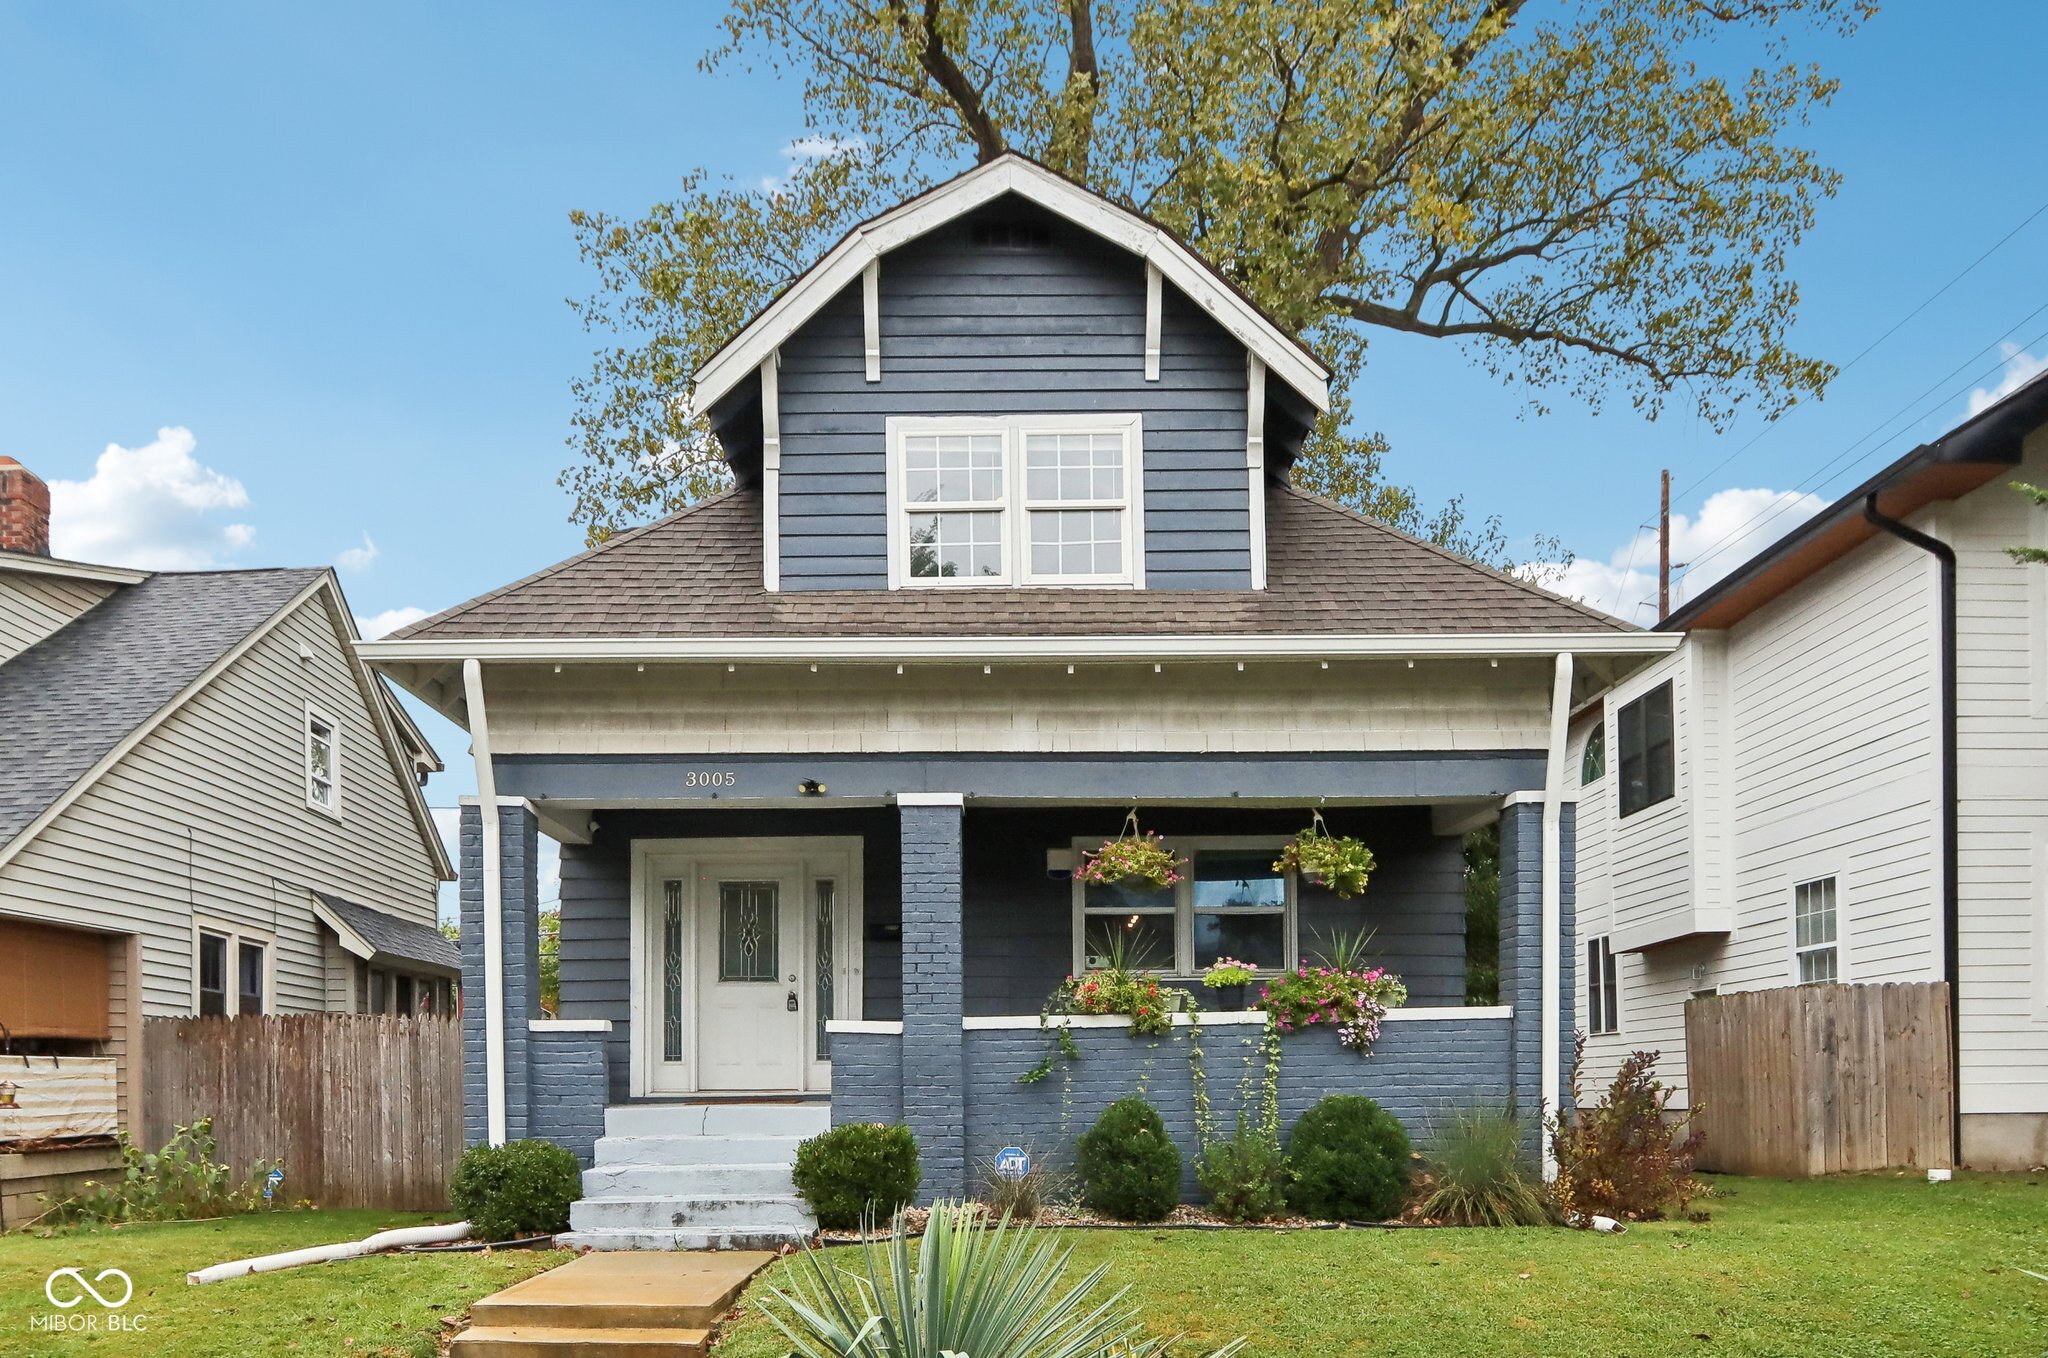
Active
$245,000
3
bds
|
2
ba
|
1,831
sqft
|
built
1925
3005 Broadway St, Indianapolis, IN 46205
$263
Cash flow
5.6%
Cash-on-Cash Return
7.4%
Cap rate
0.9%
Rent to Value Ratio
Active
$234,000
3
bds
|
3
ba
|
1,740
sqft
|
built
1977
3202 Acacia Dr, Indianapolis, IN 46214
$181
Cash flow
4.0%
Cash-on-Cash Return
7.1%
Cap rate
0.9%
Rent to Value Ratio
Active
$139,000
3
bds
|
1
ba
|
960
sqft
|
built
1958
2632 Walker Ave, Indianapolis, IN 46203
$47
Cash flow
1.8%
Cash-on-Cash Return
6.6%
Cap rate
0.8%
Rent to Value Ratio
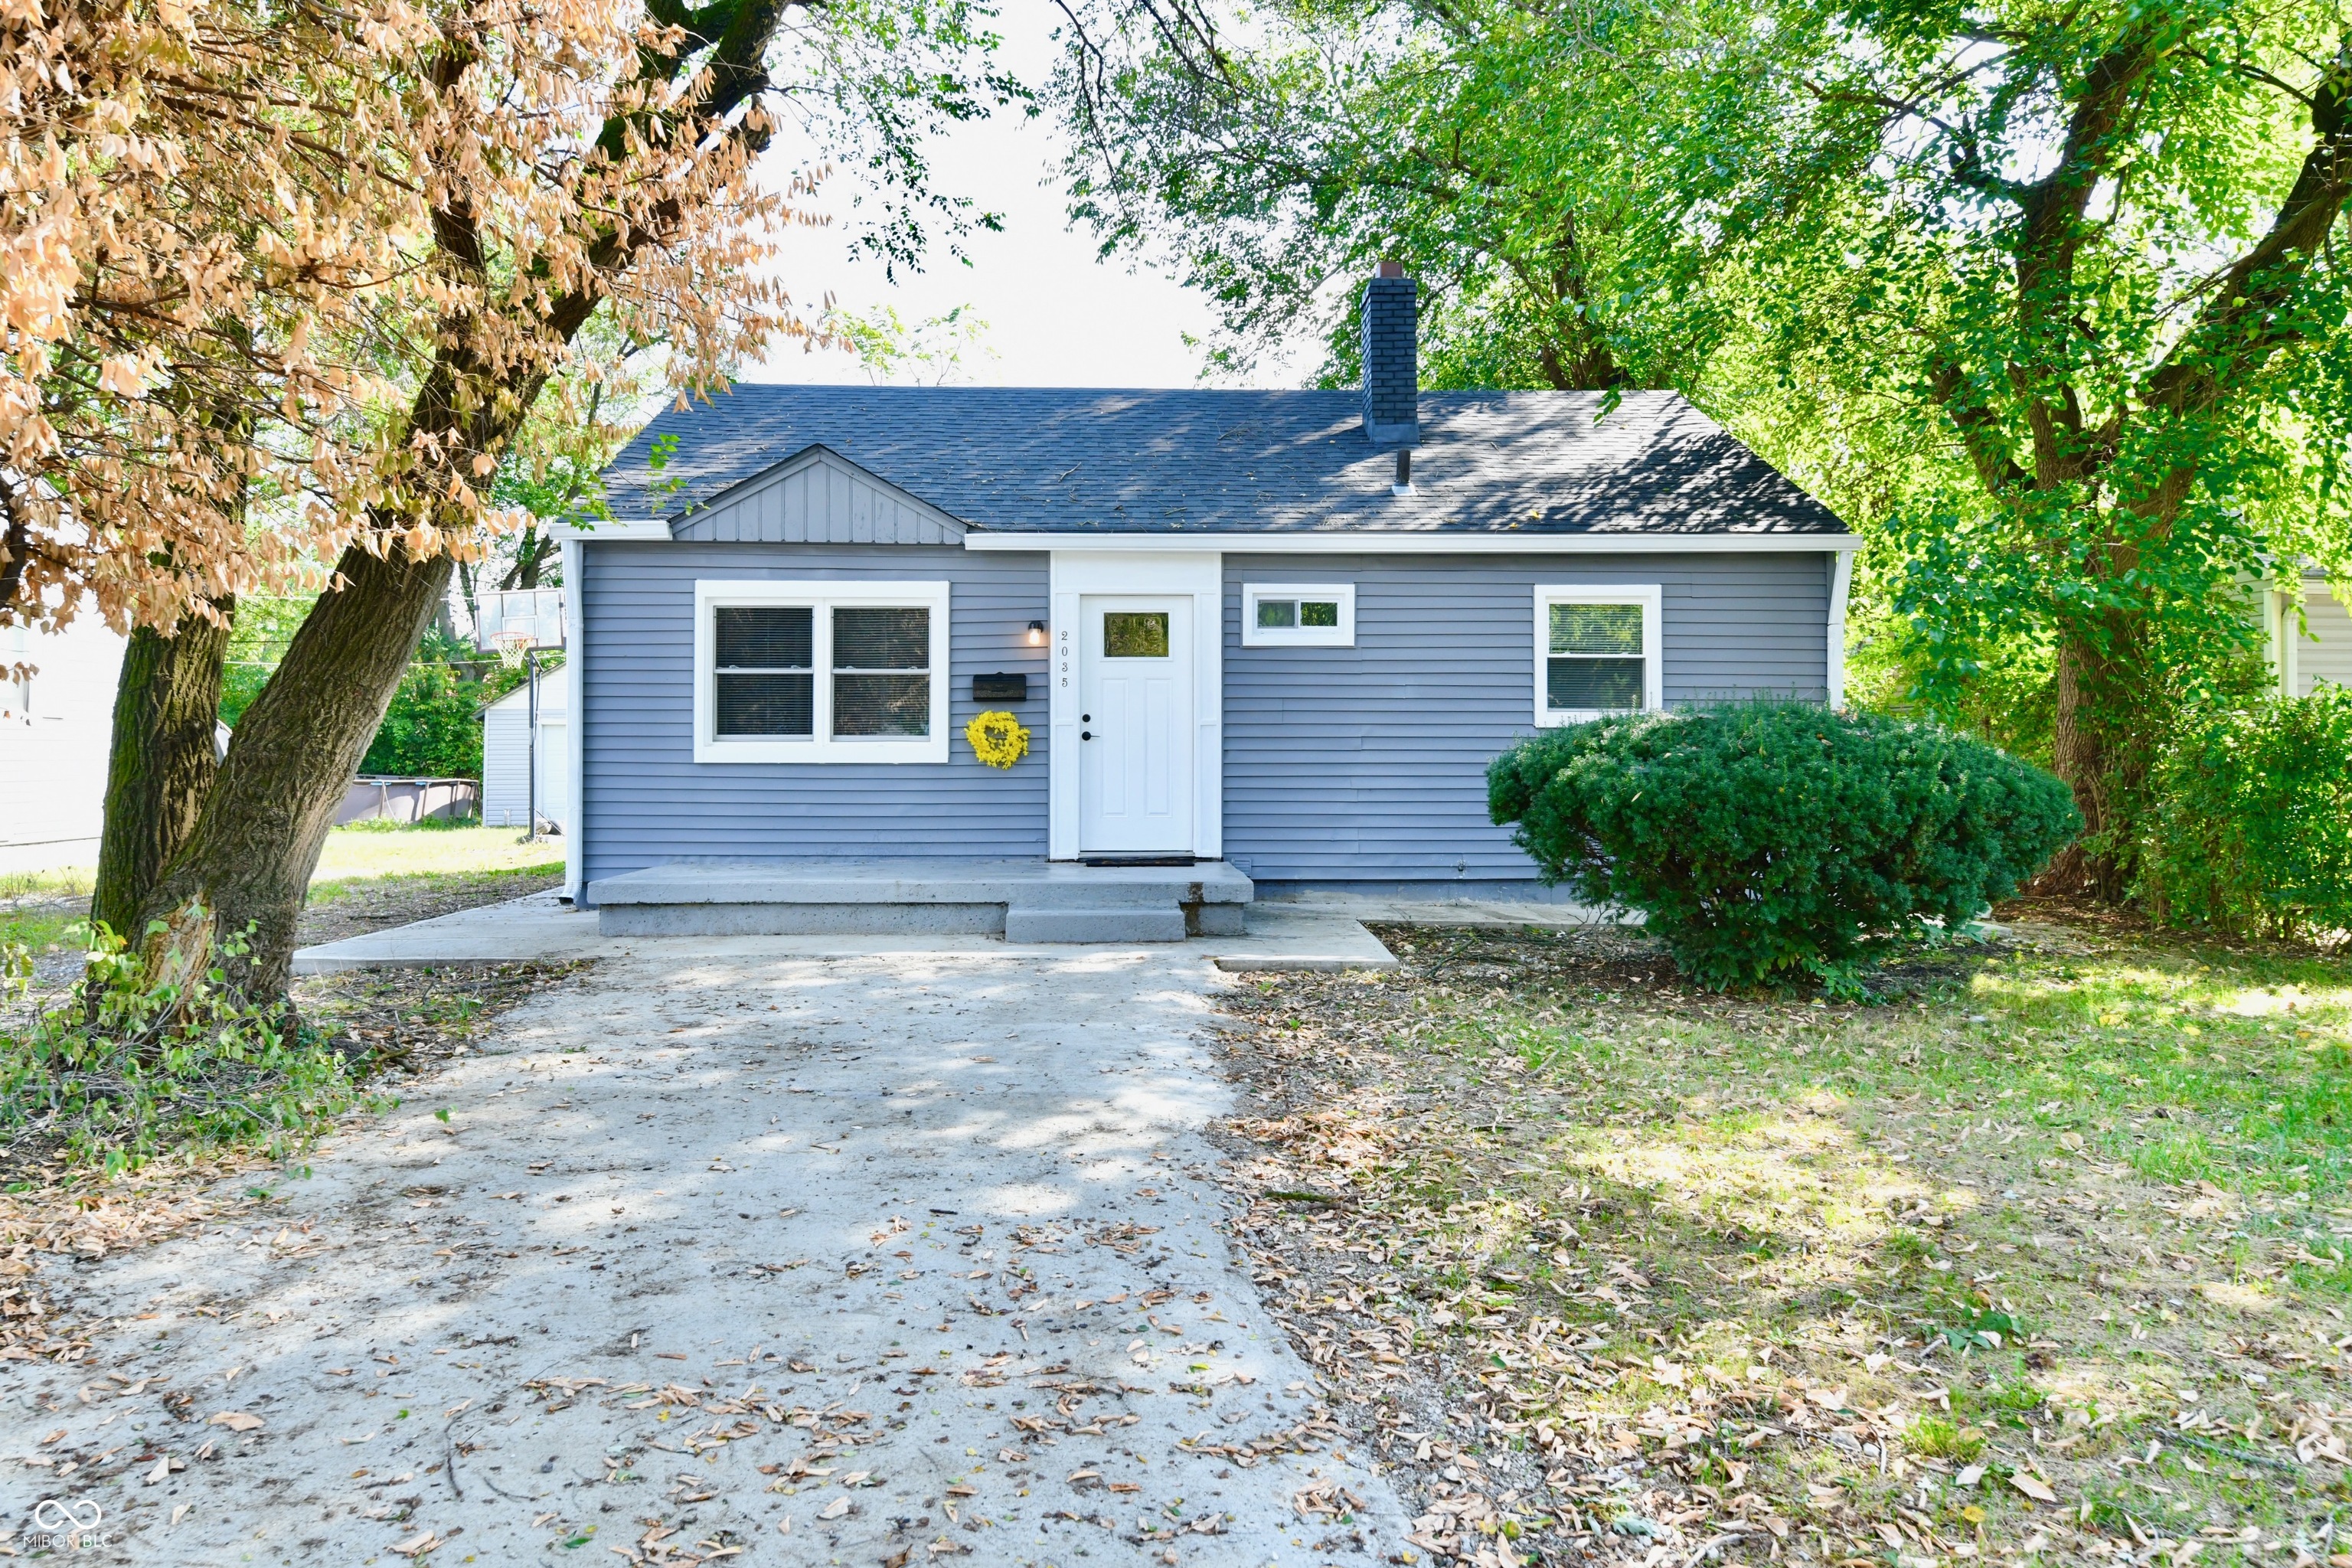
Pending
$193,900
3
bds
|
2
ba
|
1,035
sqft
|
built
1949
2035 N Tibbs Ave, Indianapolis, IN 46222
$249
Cash flow
6.7%
Cash-on-Cash Return
7.7%
Cap rate
0.9%
Rent to Value Ratio
Active
$185,000
4
bds
|
2
ba
|
1,440
sqft
|
built
1930
3308 Schofield Ave, Indianapolis, IN 46218
$156
Cash flow
4.4%
Cash-on-Cash Return
7.2%
Cap rate
0.9%
Rent to Value Ratio
Active
$159,900
3
bds
|
1
ba
|
928
sqft
|
built
1910
428 N Alton Ave, Indianapolis, IN 46222
$147
Cash flow
4.8%
Cash-on-Cash Return
7.2%
Cap rate
0.9%
Rent to Value Ratio
Active
$115,000
3
bds
|
1
ba
|
925
sqft
|
built
1955
4715 E 33rd St, Indianapolis, IN 46218
$377
Cash flow
17.1%
Cash-on-Cash Return
10.1%
Cap rate
1.2%
Rent to Value Ratio
Active
$189,900
2
bds
|
1
ba
|
832
sqft
|
built
1920
5206 E Saint Clair St, Indianapolis, IN 46219
$131
Cash flow
3.6%
Cash-on-Cash Return
7.0%
Cap rate
0.8%
Rent to Value Ratio
Active
$115,000
2
bds
|
1
ba
|
968
sqft
|
built
1973
2721 Del Prado Dr, Indianapolis, IN 46227
$21
Cash flow
1.0%
Cash-on-Cash Return
6.4%
Cap rate
1.1%
Rent to Value Ratio
Active
$150,000
2
bds
|
1
ba
|
1,152
sqft
|
built
1924
4014 E 10th St, Indianapolis, IN 46201
$129
Cash flow
4.5%
Cash-on-Cash Return
7.2%
Cap rate
0.9%
Rent to Value Ratio
Active
$389,999
3
bds
|
2
ba
|
2,150
sqft
|
built
1900
1818 Cornell Ave, Indianapolis, IN 46202
$210
Cash flow
2.8%
Cash-on-Cash Return
6.8%
Cap rate
0.8%
Rent to Value Ratio
Active
$89,900
2
bds
|
1
ba
|
1,120
sqft
|
built
1920
2821 E 13th St, Indianapolis, IN 46201
$298
Cash flow
17.3%
Cash-on-Cash Return
10.1%
Cap rate
1.2%
Rent to Value Ratio
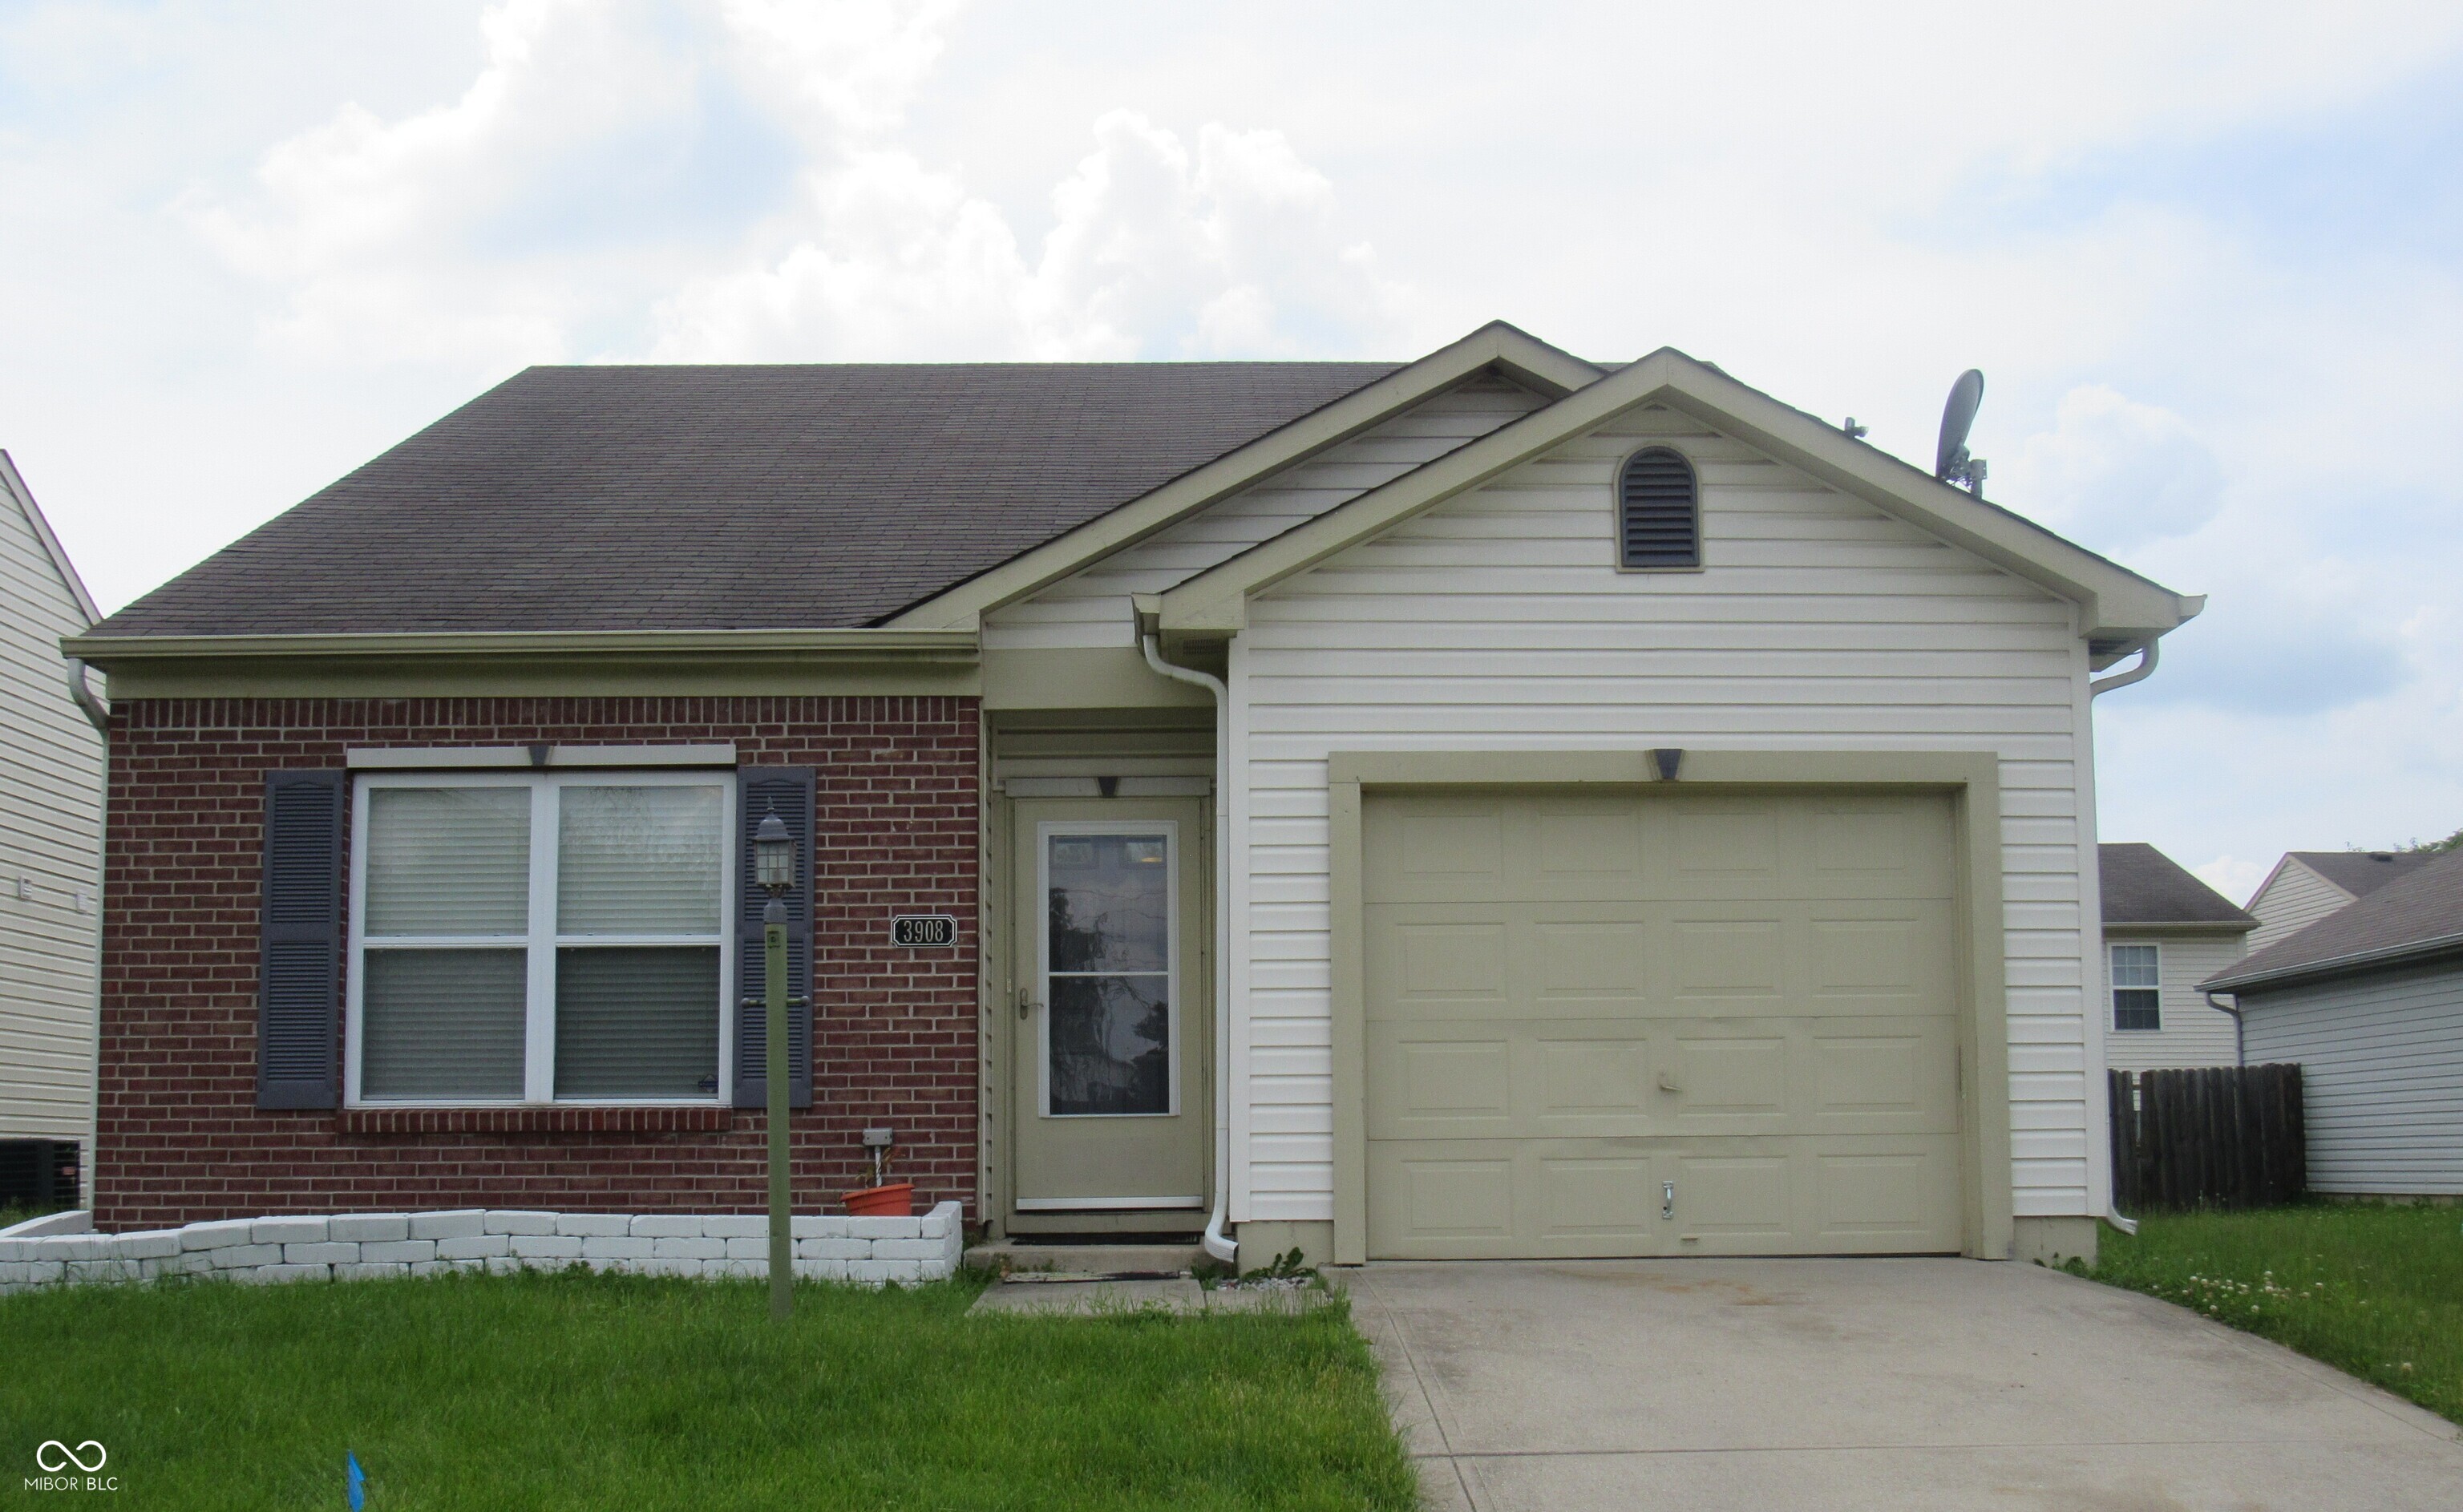
Active
$200,450
2
bds
|
2
ba
|
1,147
sqft
|
built
2002
3908 Roundwood Dr, Indianapolis, IN 46235
$77
Cash flow
2.0%
Cash-on-Cash Return
6.6%
Cap rate
0.8%
Rent to Value Ratio