Indianapolis, IN Investment Properties for Sale
Browse homes for sale and investment properties in Indianapolis, IN. Refine your search by price, property type, or more.
Best cash flowing properties in Indianapolis, IN
Active
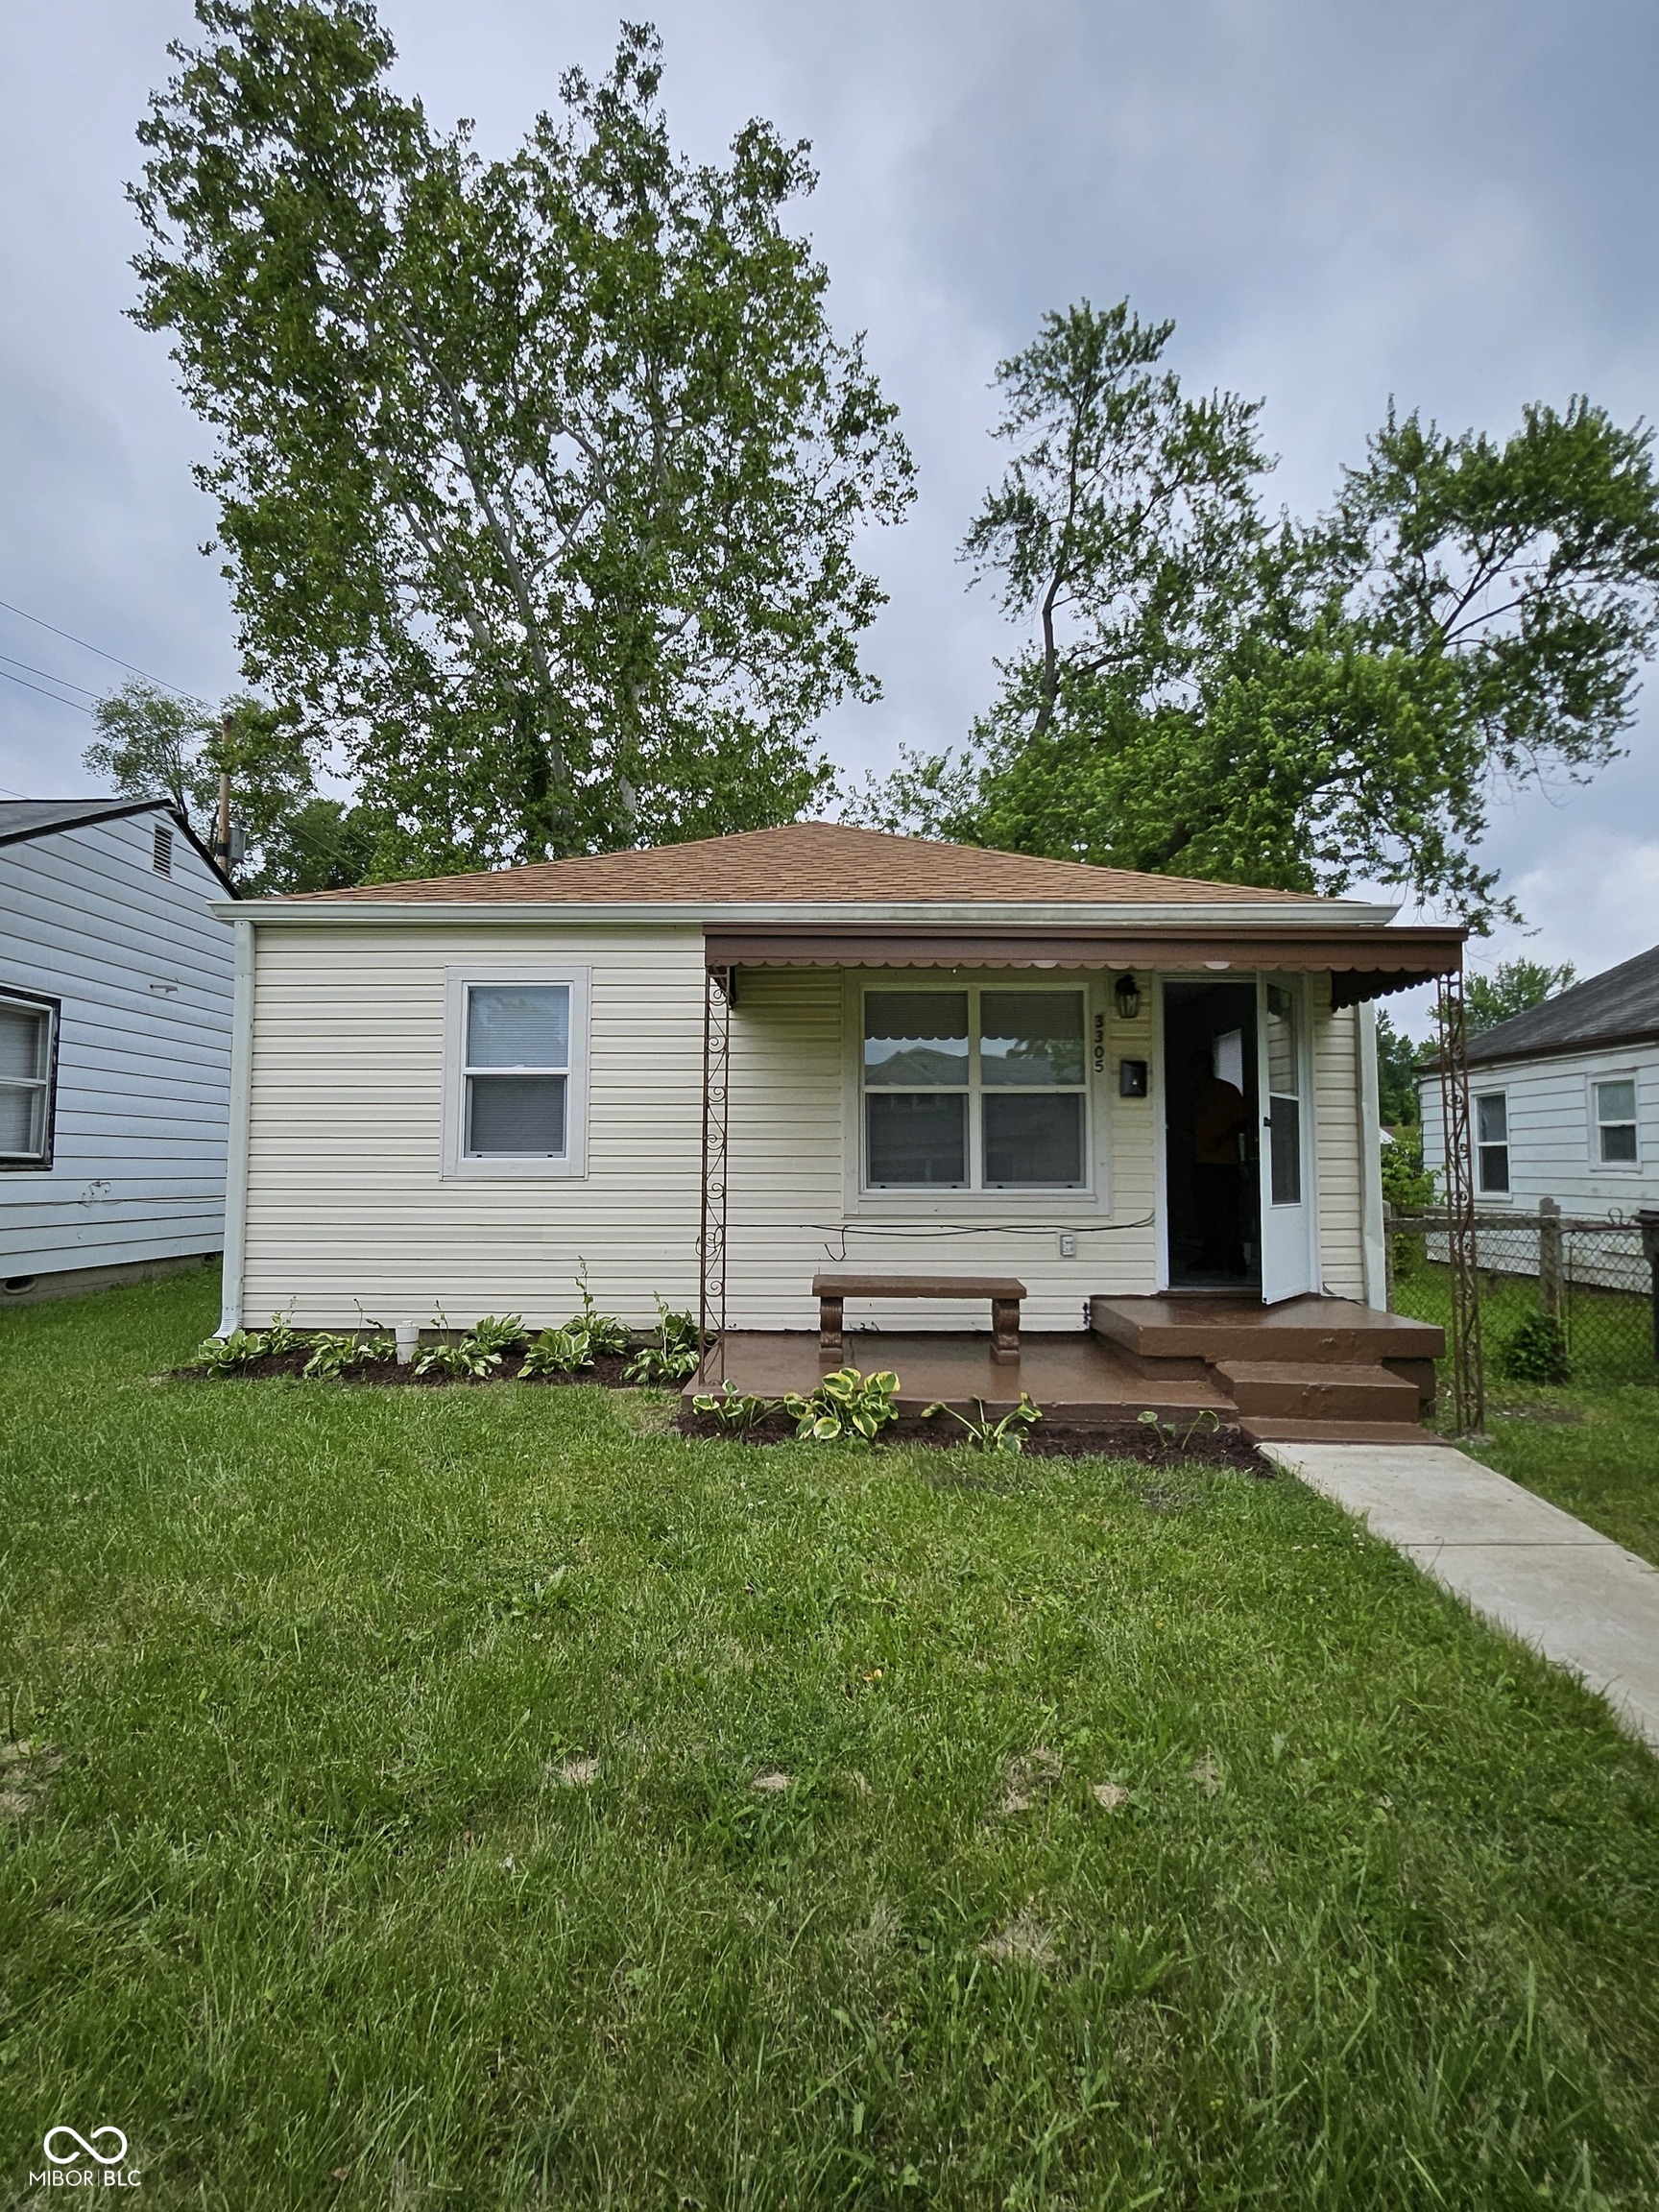
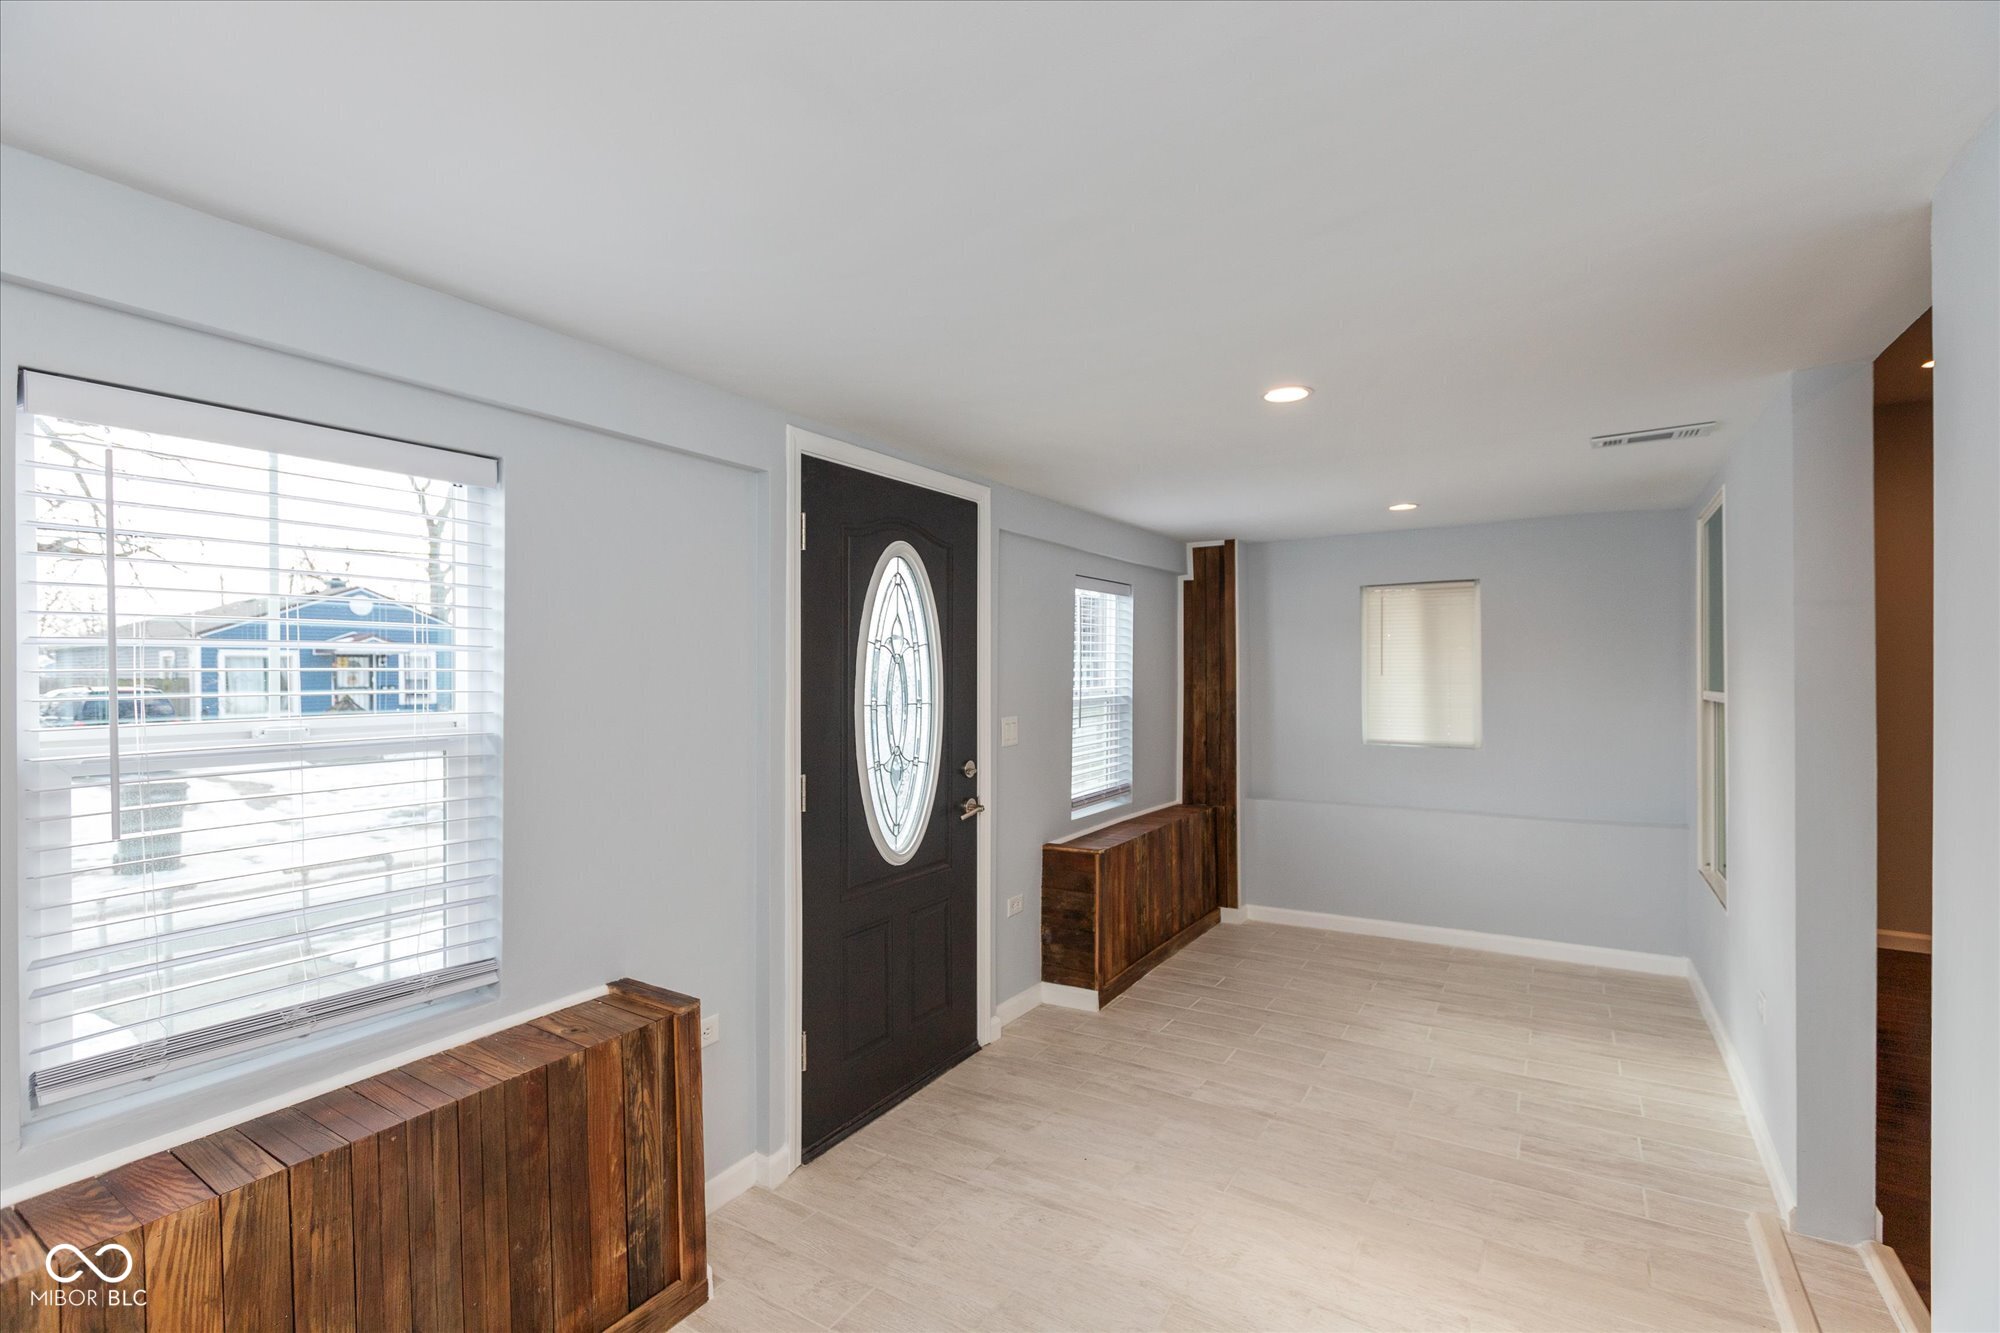
$112,900
2
bds
|
1
ba
|
720
sqft
|
built
1951
3305 E 30th St, Indianapolis, IN 46218
$444
Cash flow
20.5%
Cash-on-Cash Return
11.0%
Cap rate
1.3%
Rent to Value Ratio
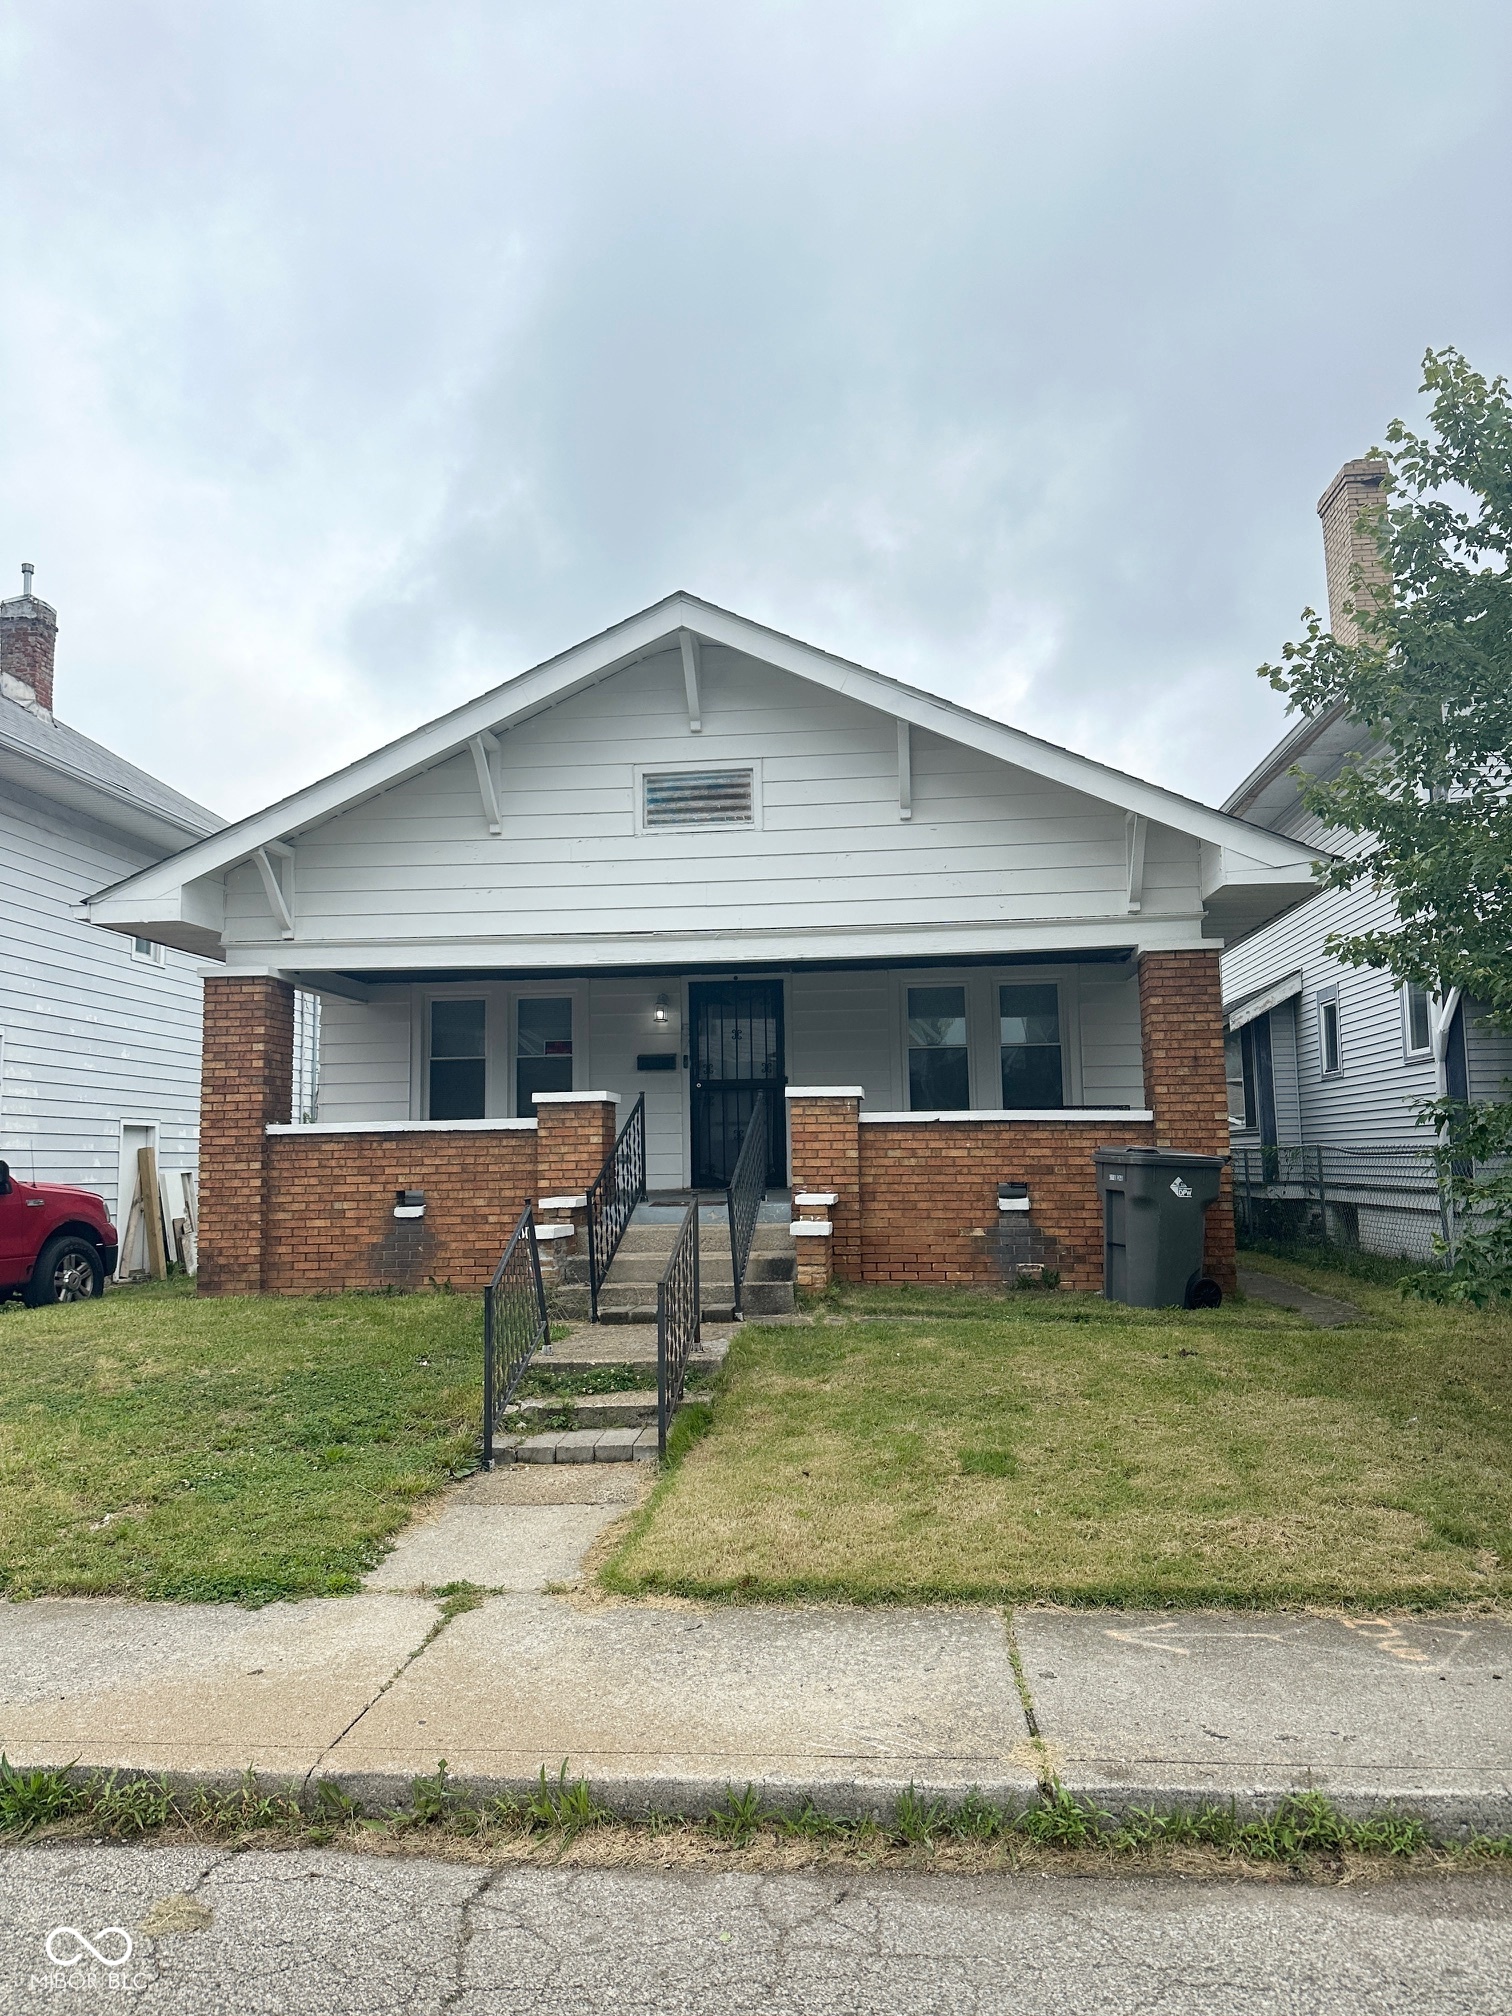
Pending
$180,000
3
bds
|
1
ba
|
1,875
sqft
|
built
1959
2442 N Franklin Rd, Indianapolis, IN 46219
$299
Cash flow
8.7%
Cash-on-Cash Return
8.3%
Cap rate
1.0%
Rent to Value Ratio
1,974 out of 2,115 properties for sale in Indianapolis, IN
Limited Results Shown
Create a free account, or log in to reveal all property listings and enjoy the complete experience.
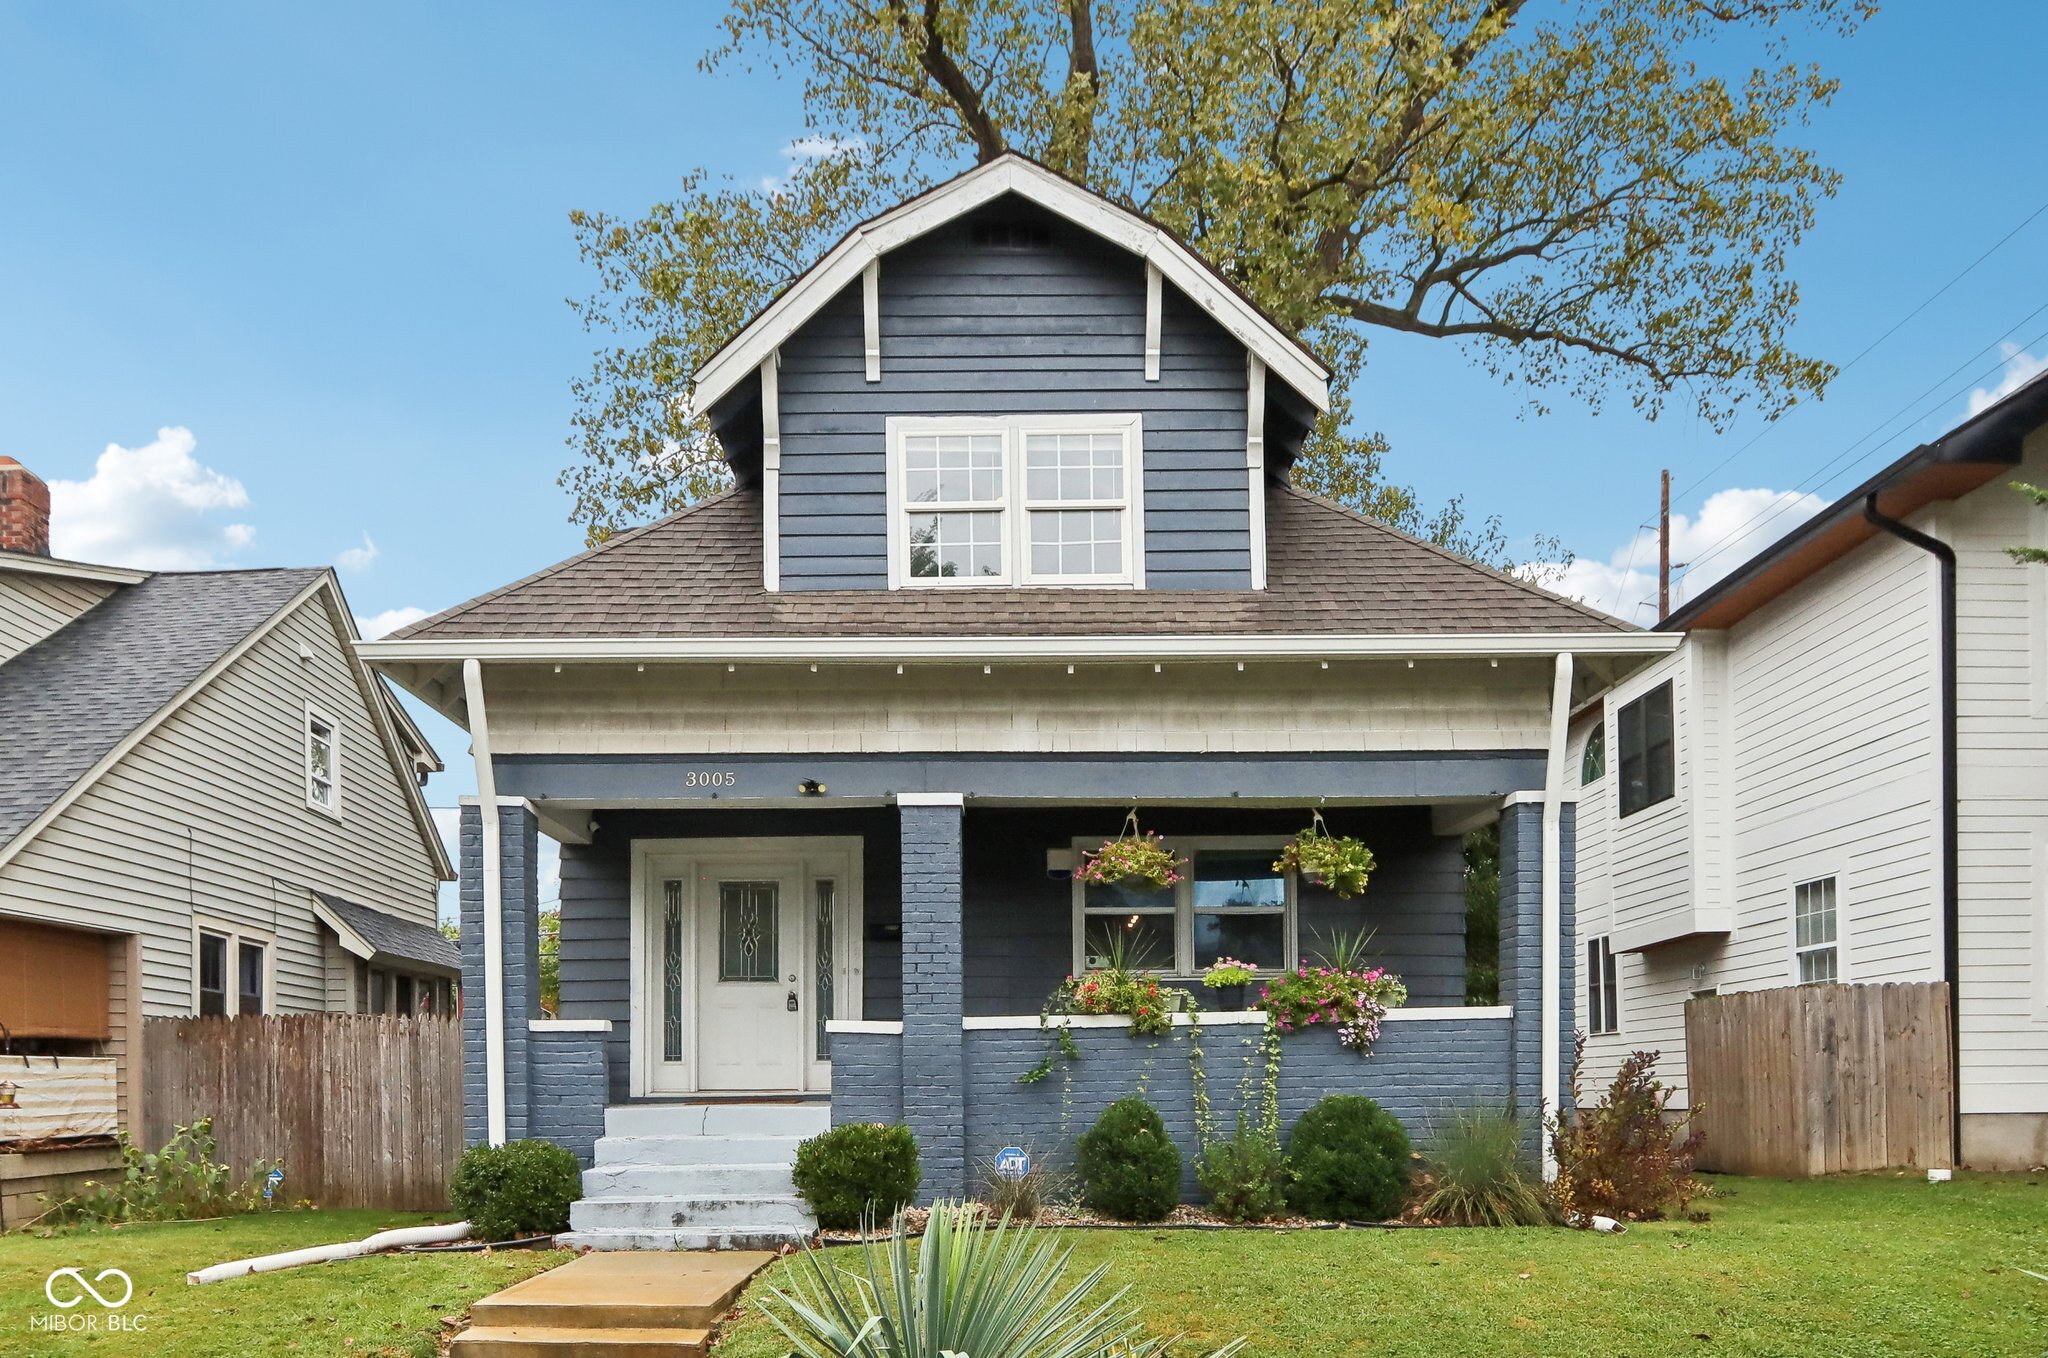
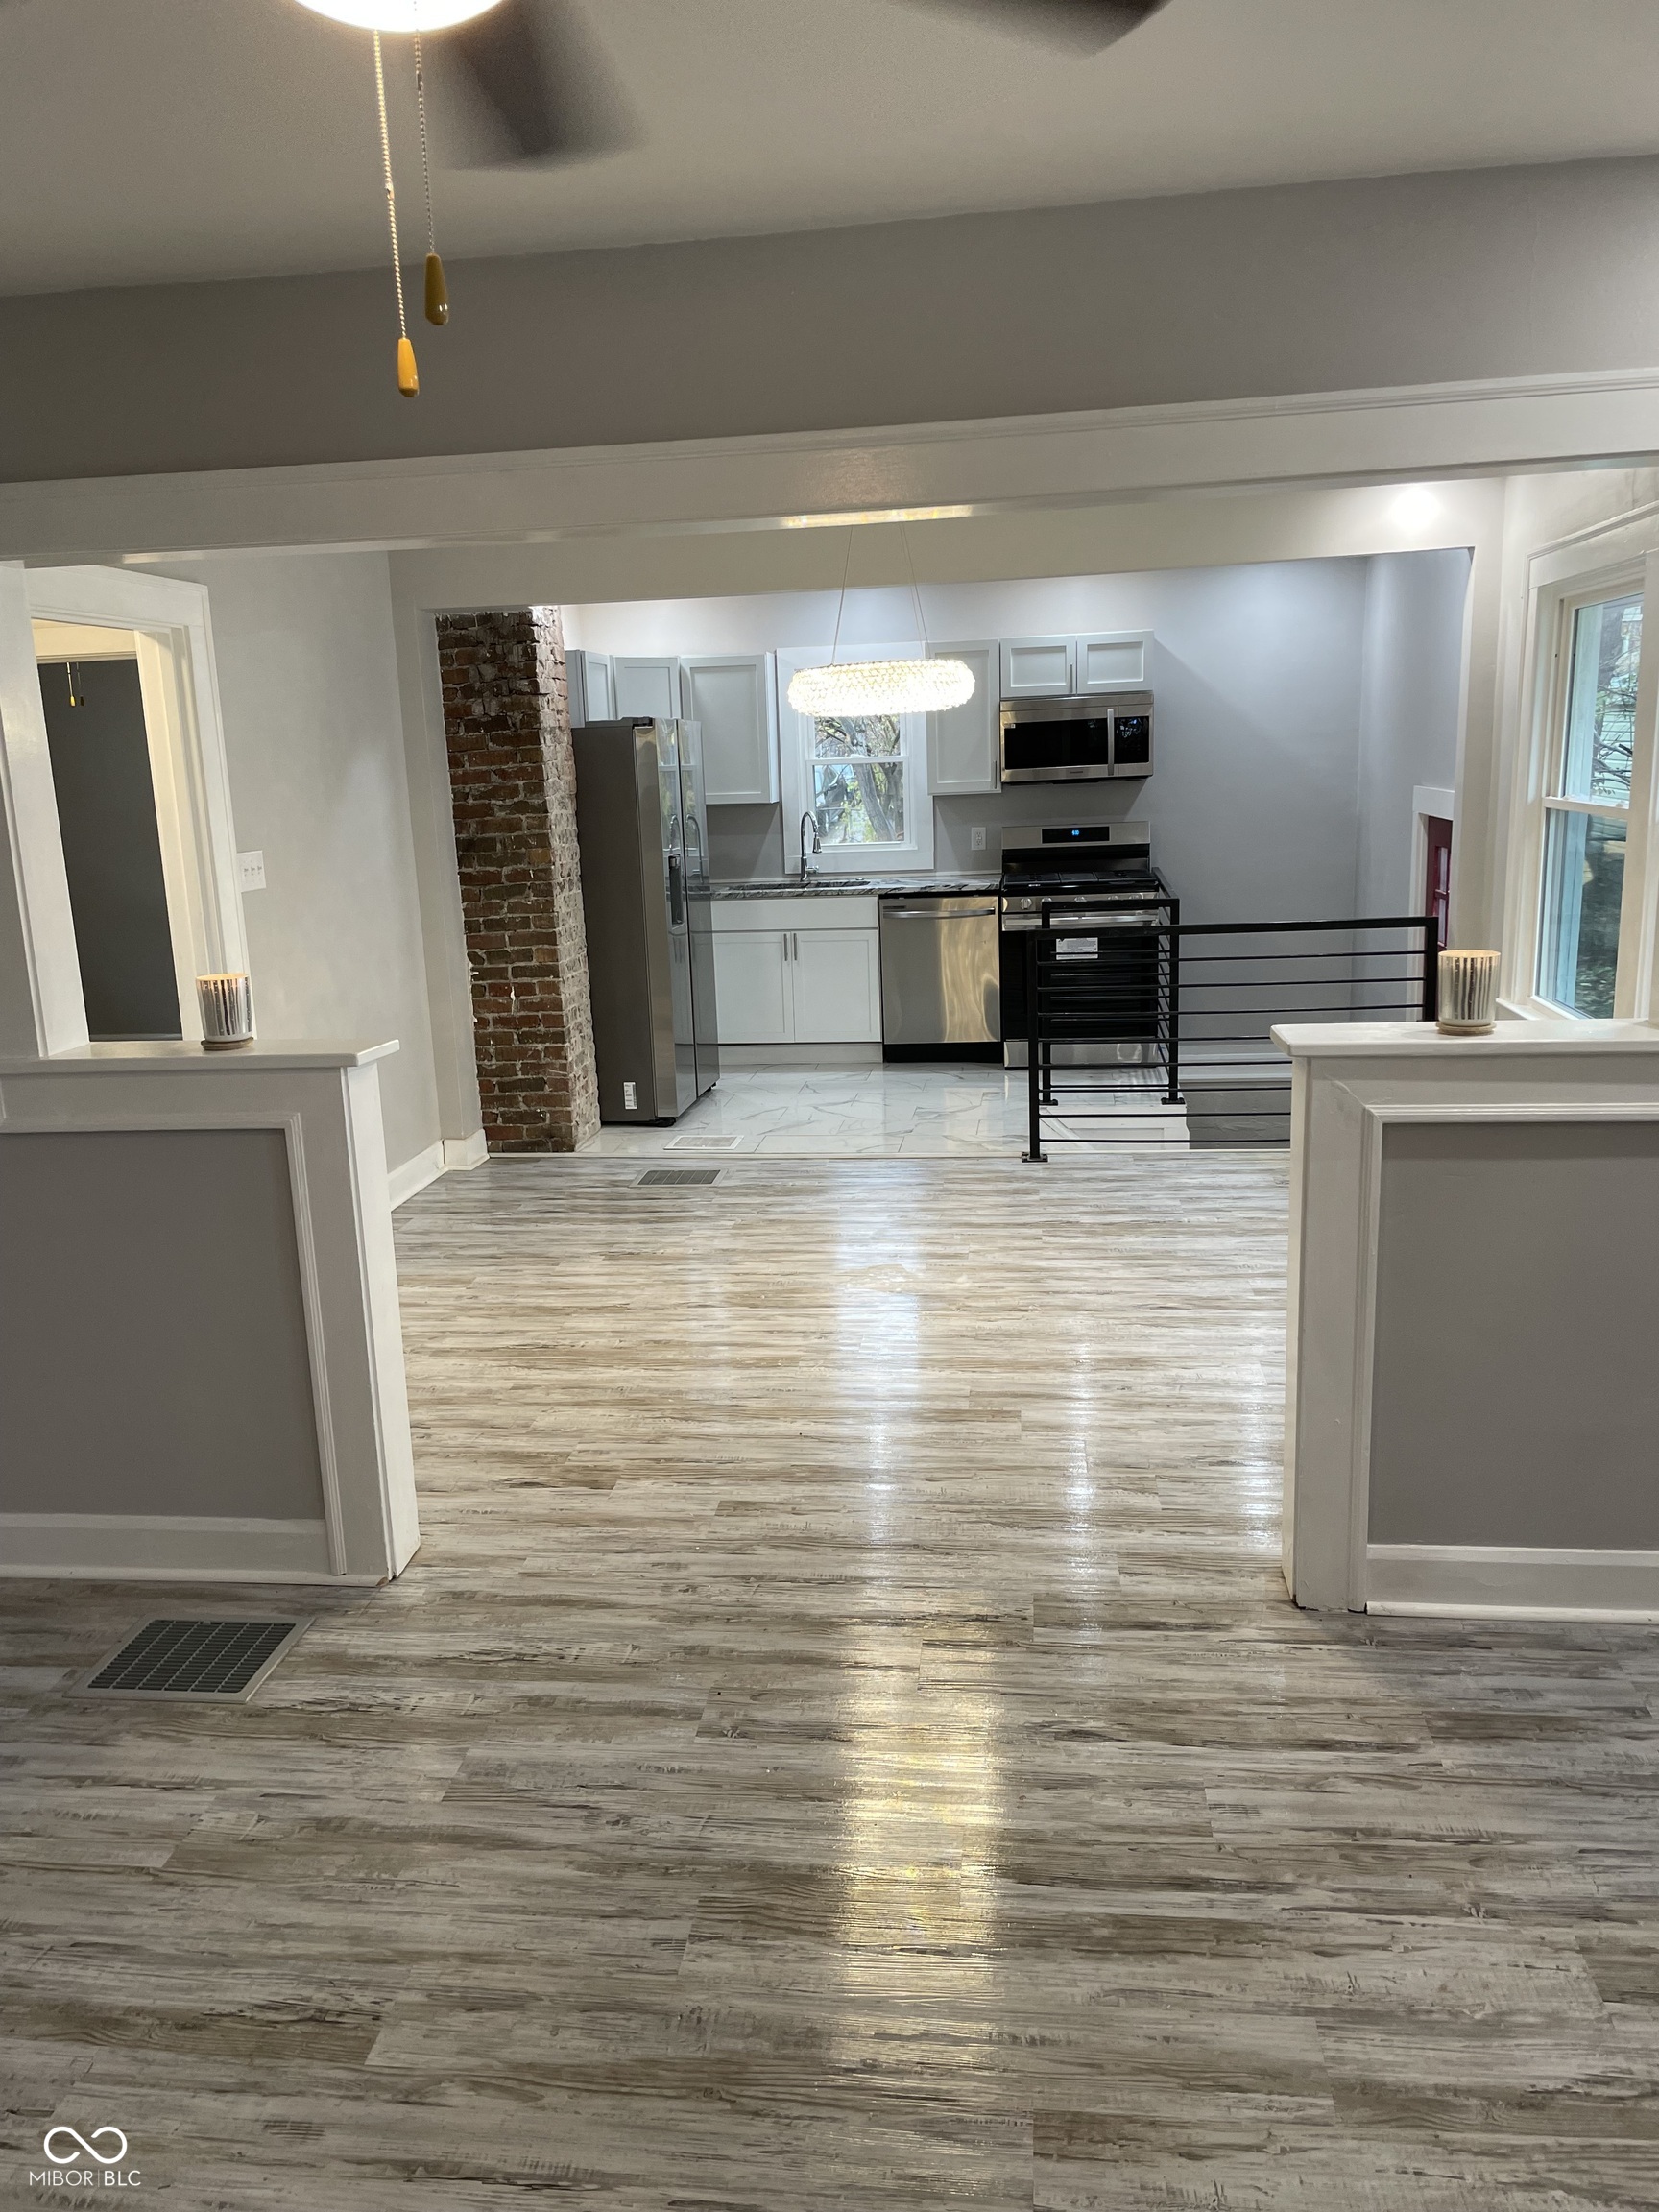
Active
$245,000
3
bds
|
2
ba
|
1,831
sqft
|
built
1925
3005 Broadway St, Indianapolis, IN 46205
$235
Cash flow
5.0%
Cash-on-Cash Return
7.4%
Cap rate
0.9%
Rent to Value Ratio
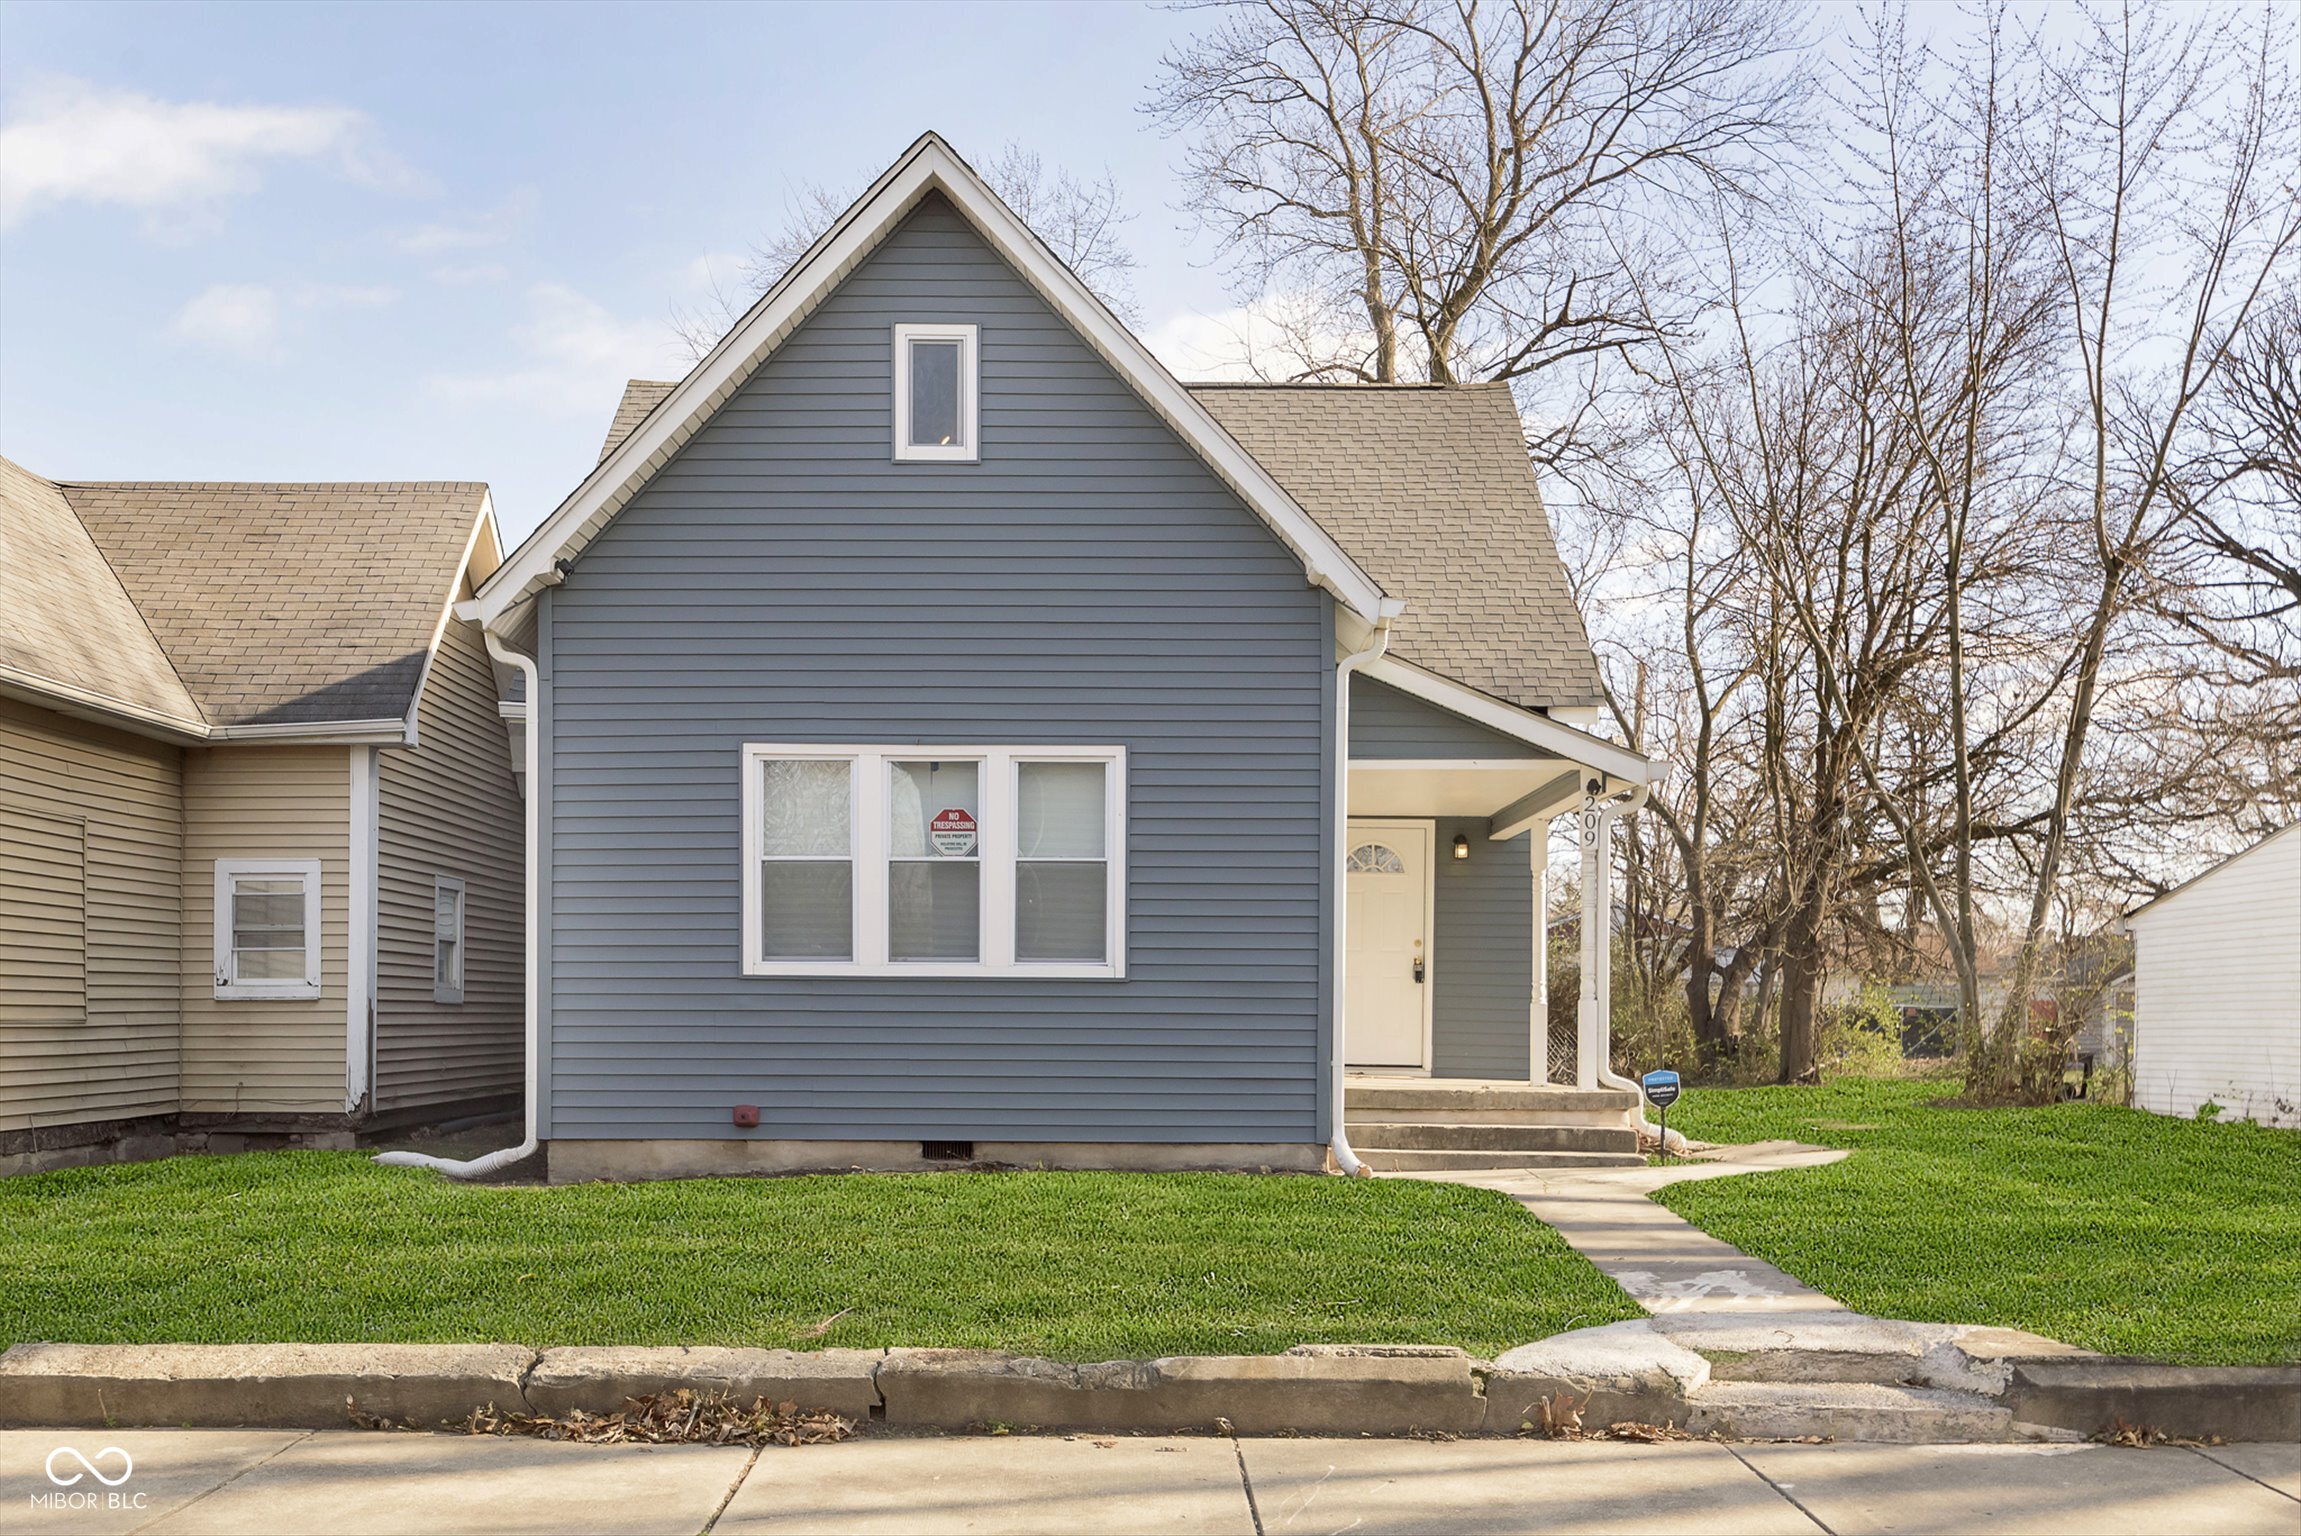
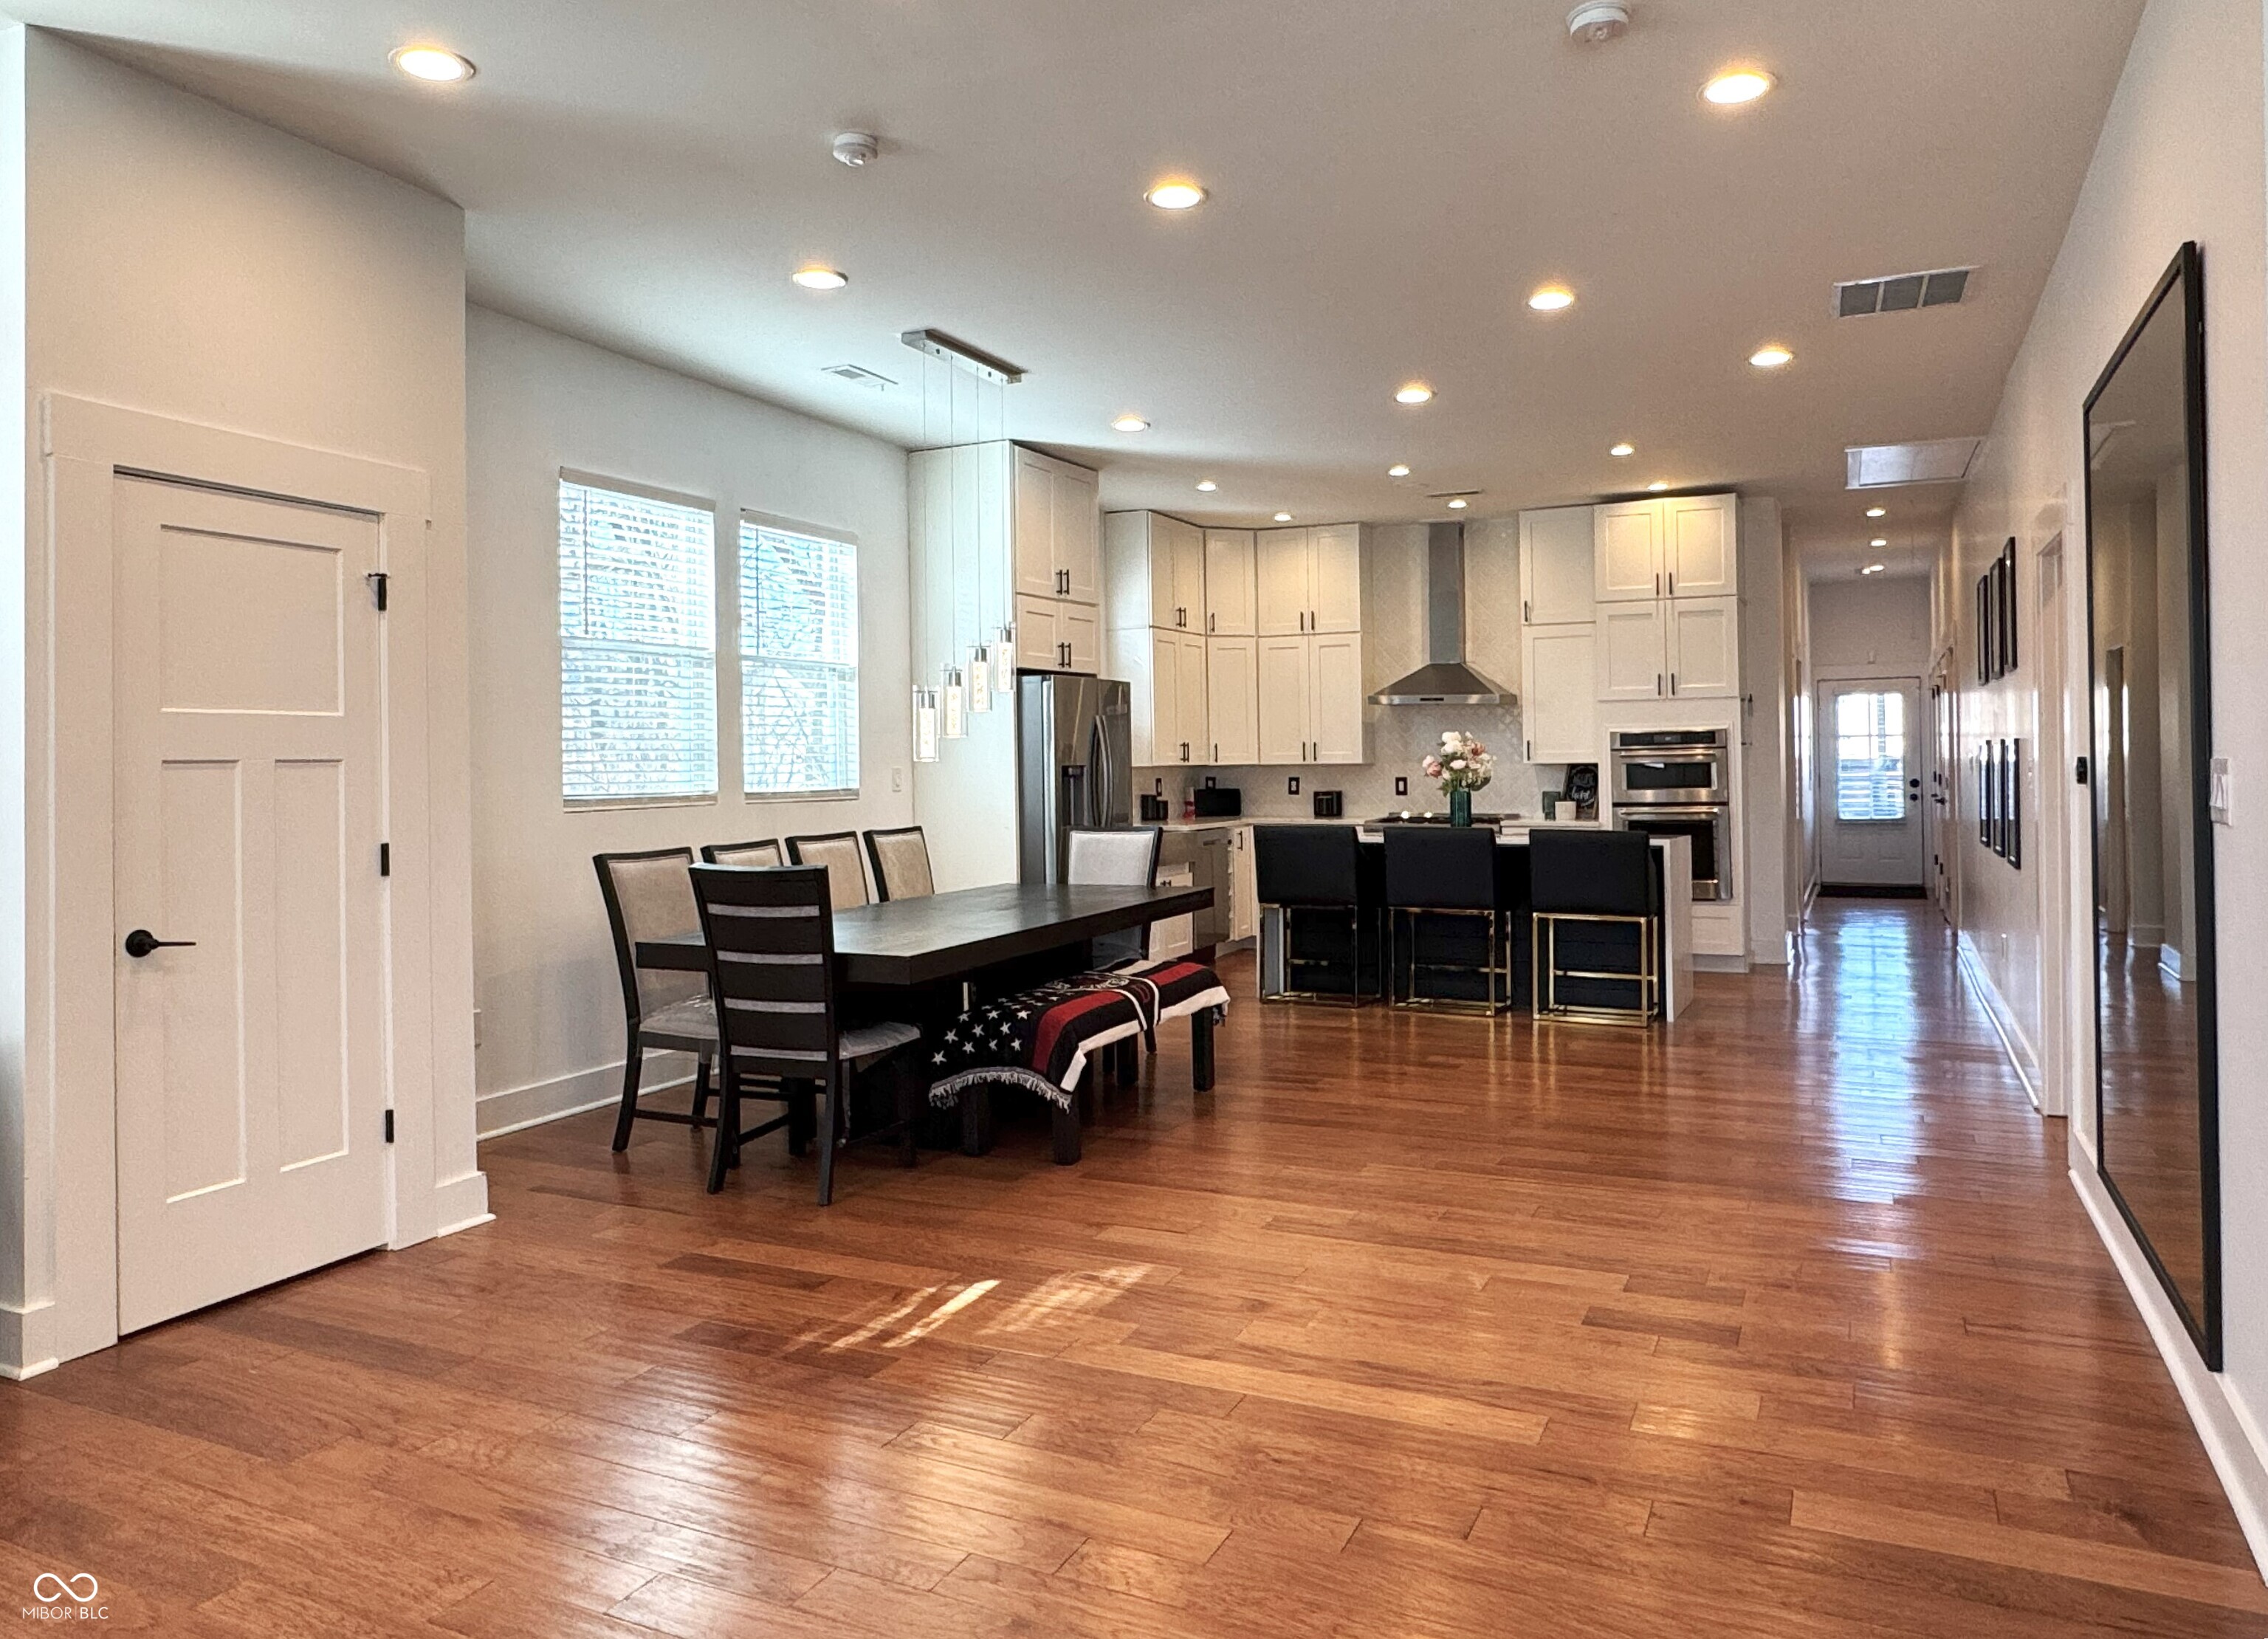
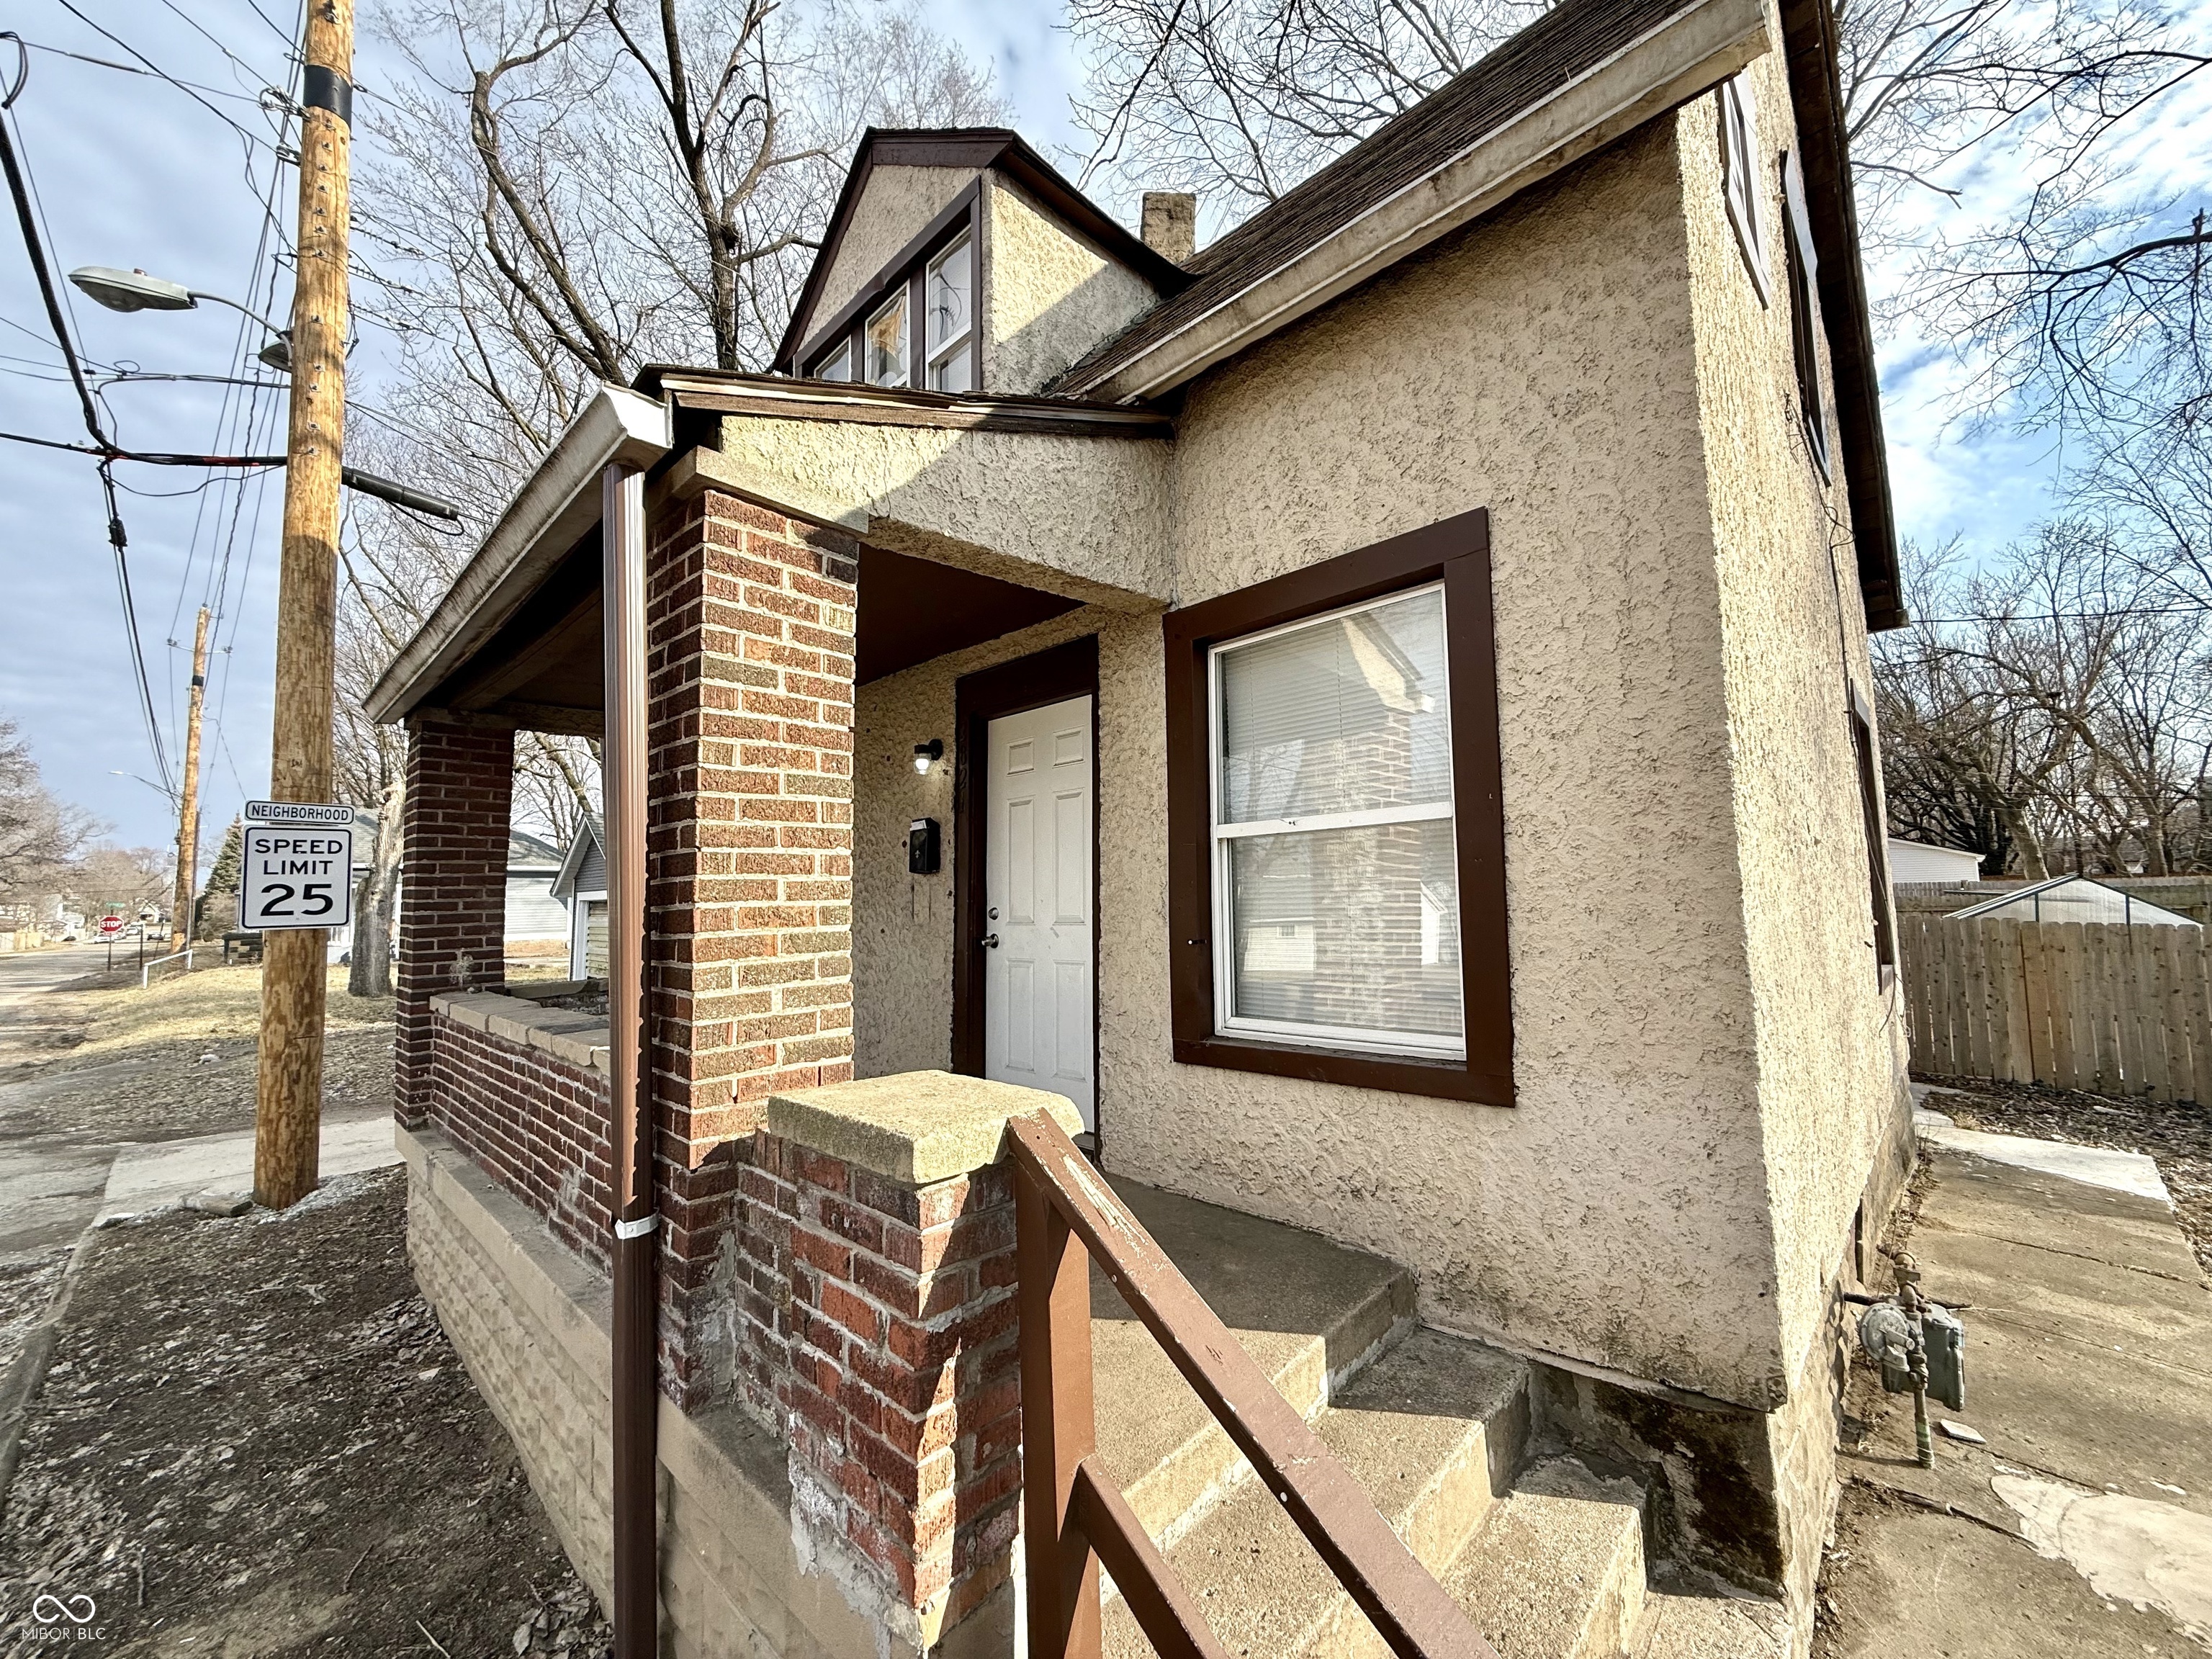
Active
$239,900
3
bds
|
3
ba
|
1,982
sqft
|
built
1905
209 Trowbridge St, Indianapolis, IN 46201
$124
Cash flow
2.7%
Cash-on-Cash Return
6.9%
Cap rate
0.8%
Rent to Value Ratio
Active
$234,000
3
bds
|
3
ba
|
1,740
sqft
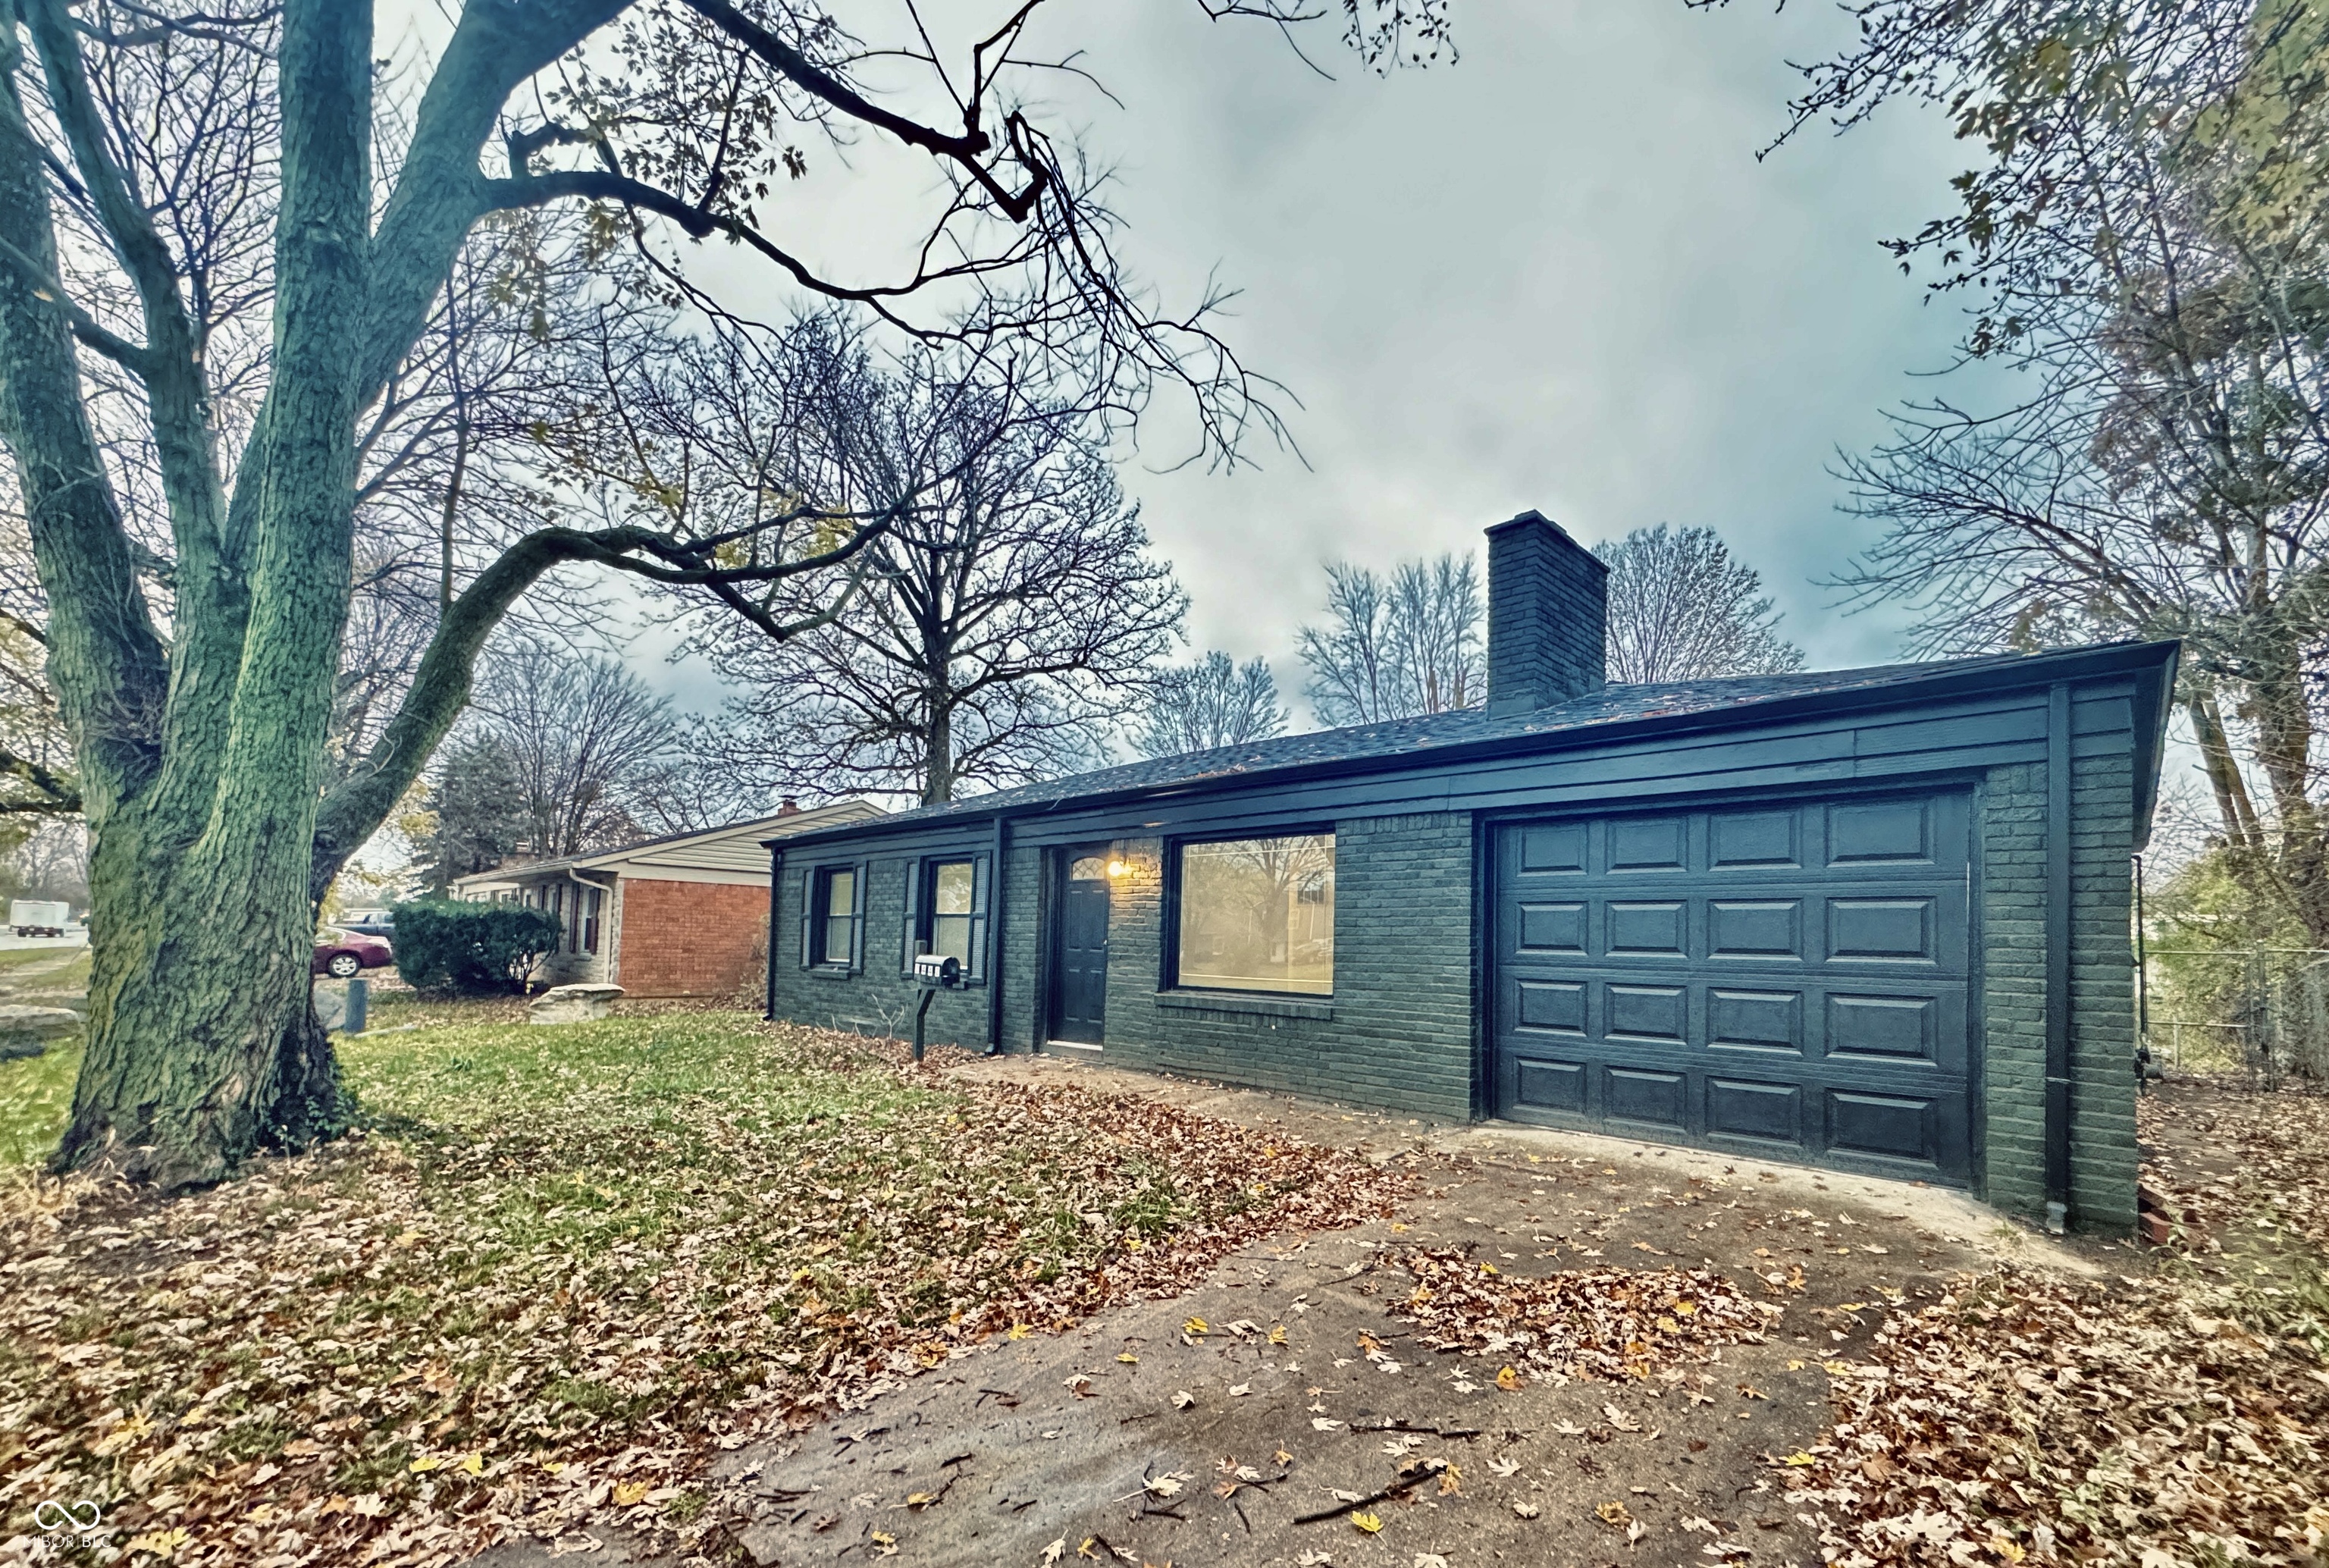
|
built
1977
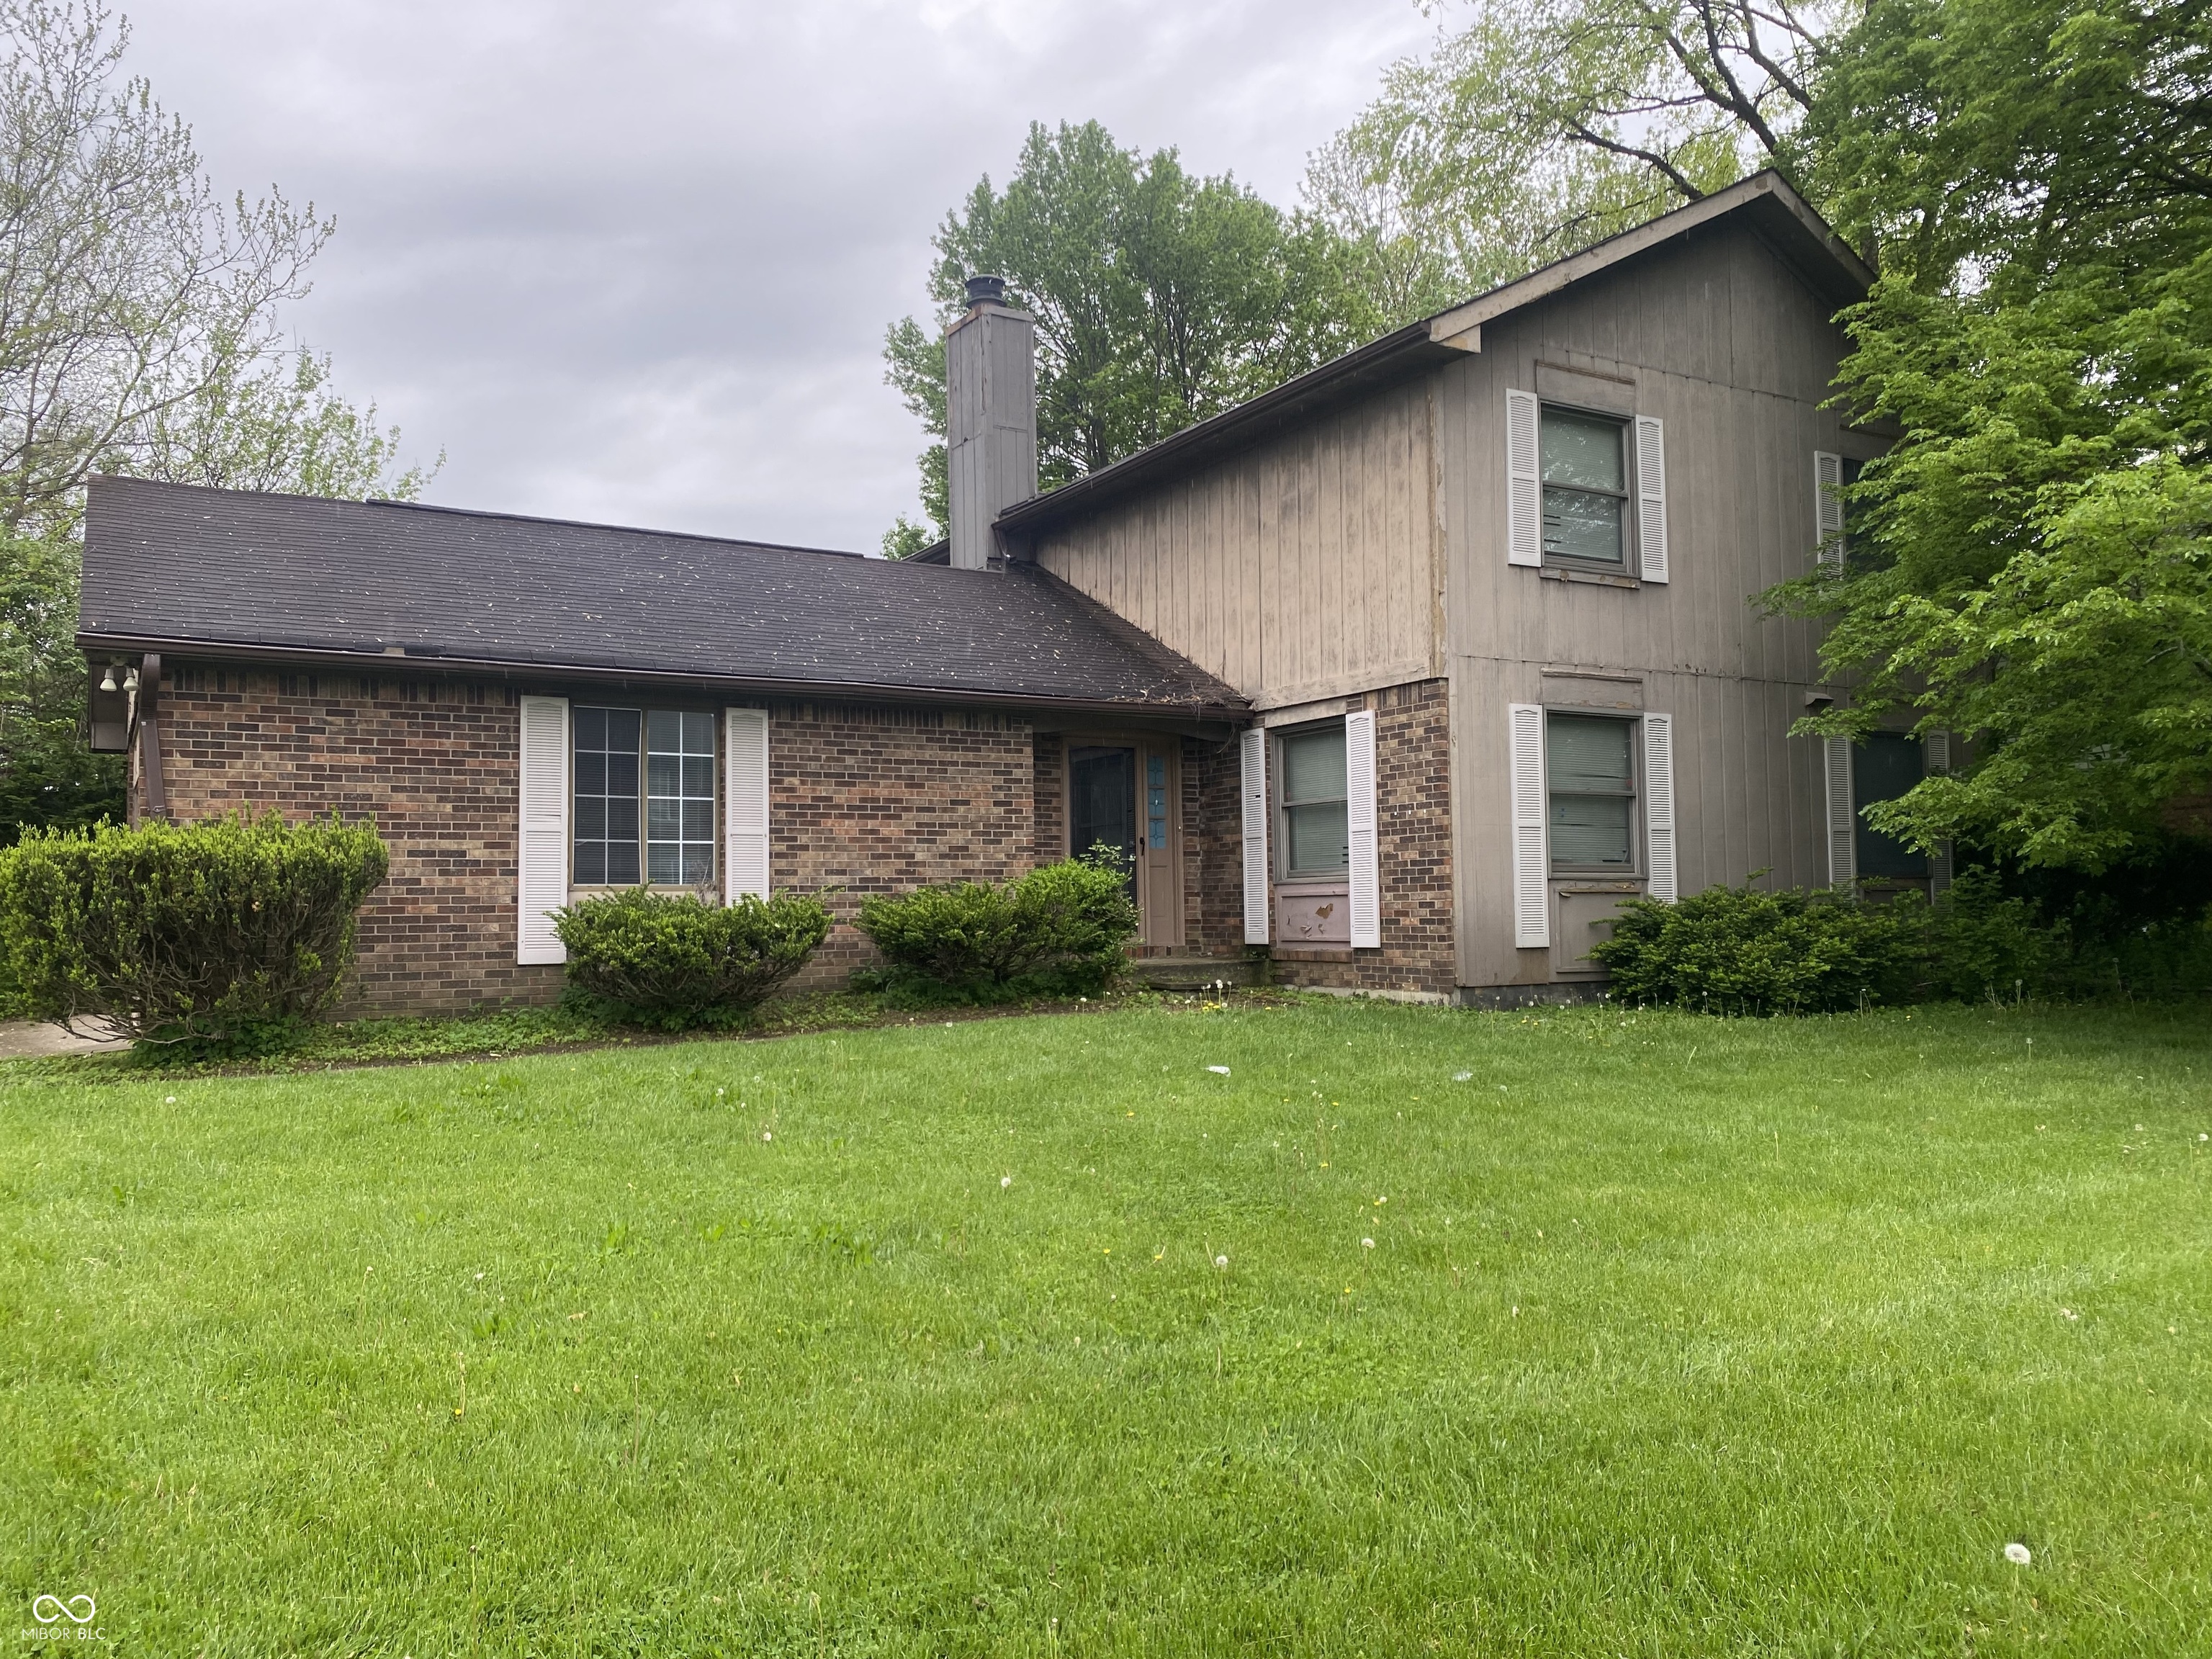
3202 Acacia Dr, Indianapolis, IN 46214
$155
Cash flow
3.5%
Cash-on-Cash Return
7.1%
Cap rate
0.9%
Rent to Value Ratio
Active
$174,900
3
bds
|
1
ba
|
1,073
sqft
|
built
1959
1716 Arlene Dr, Indianapolis, IN 46219
$50
Cash flow
1.5%
Cash-on-Cash Return
6.6%
Cap rate
0.8%
Rent to Value Ratio
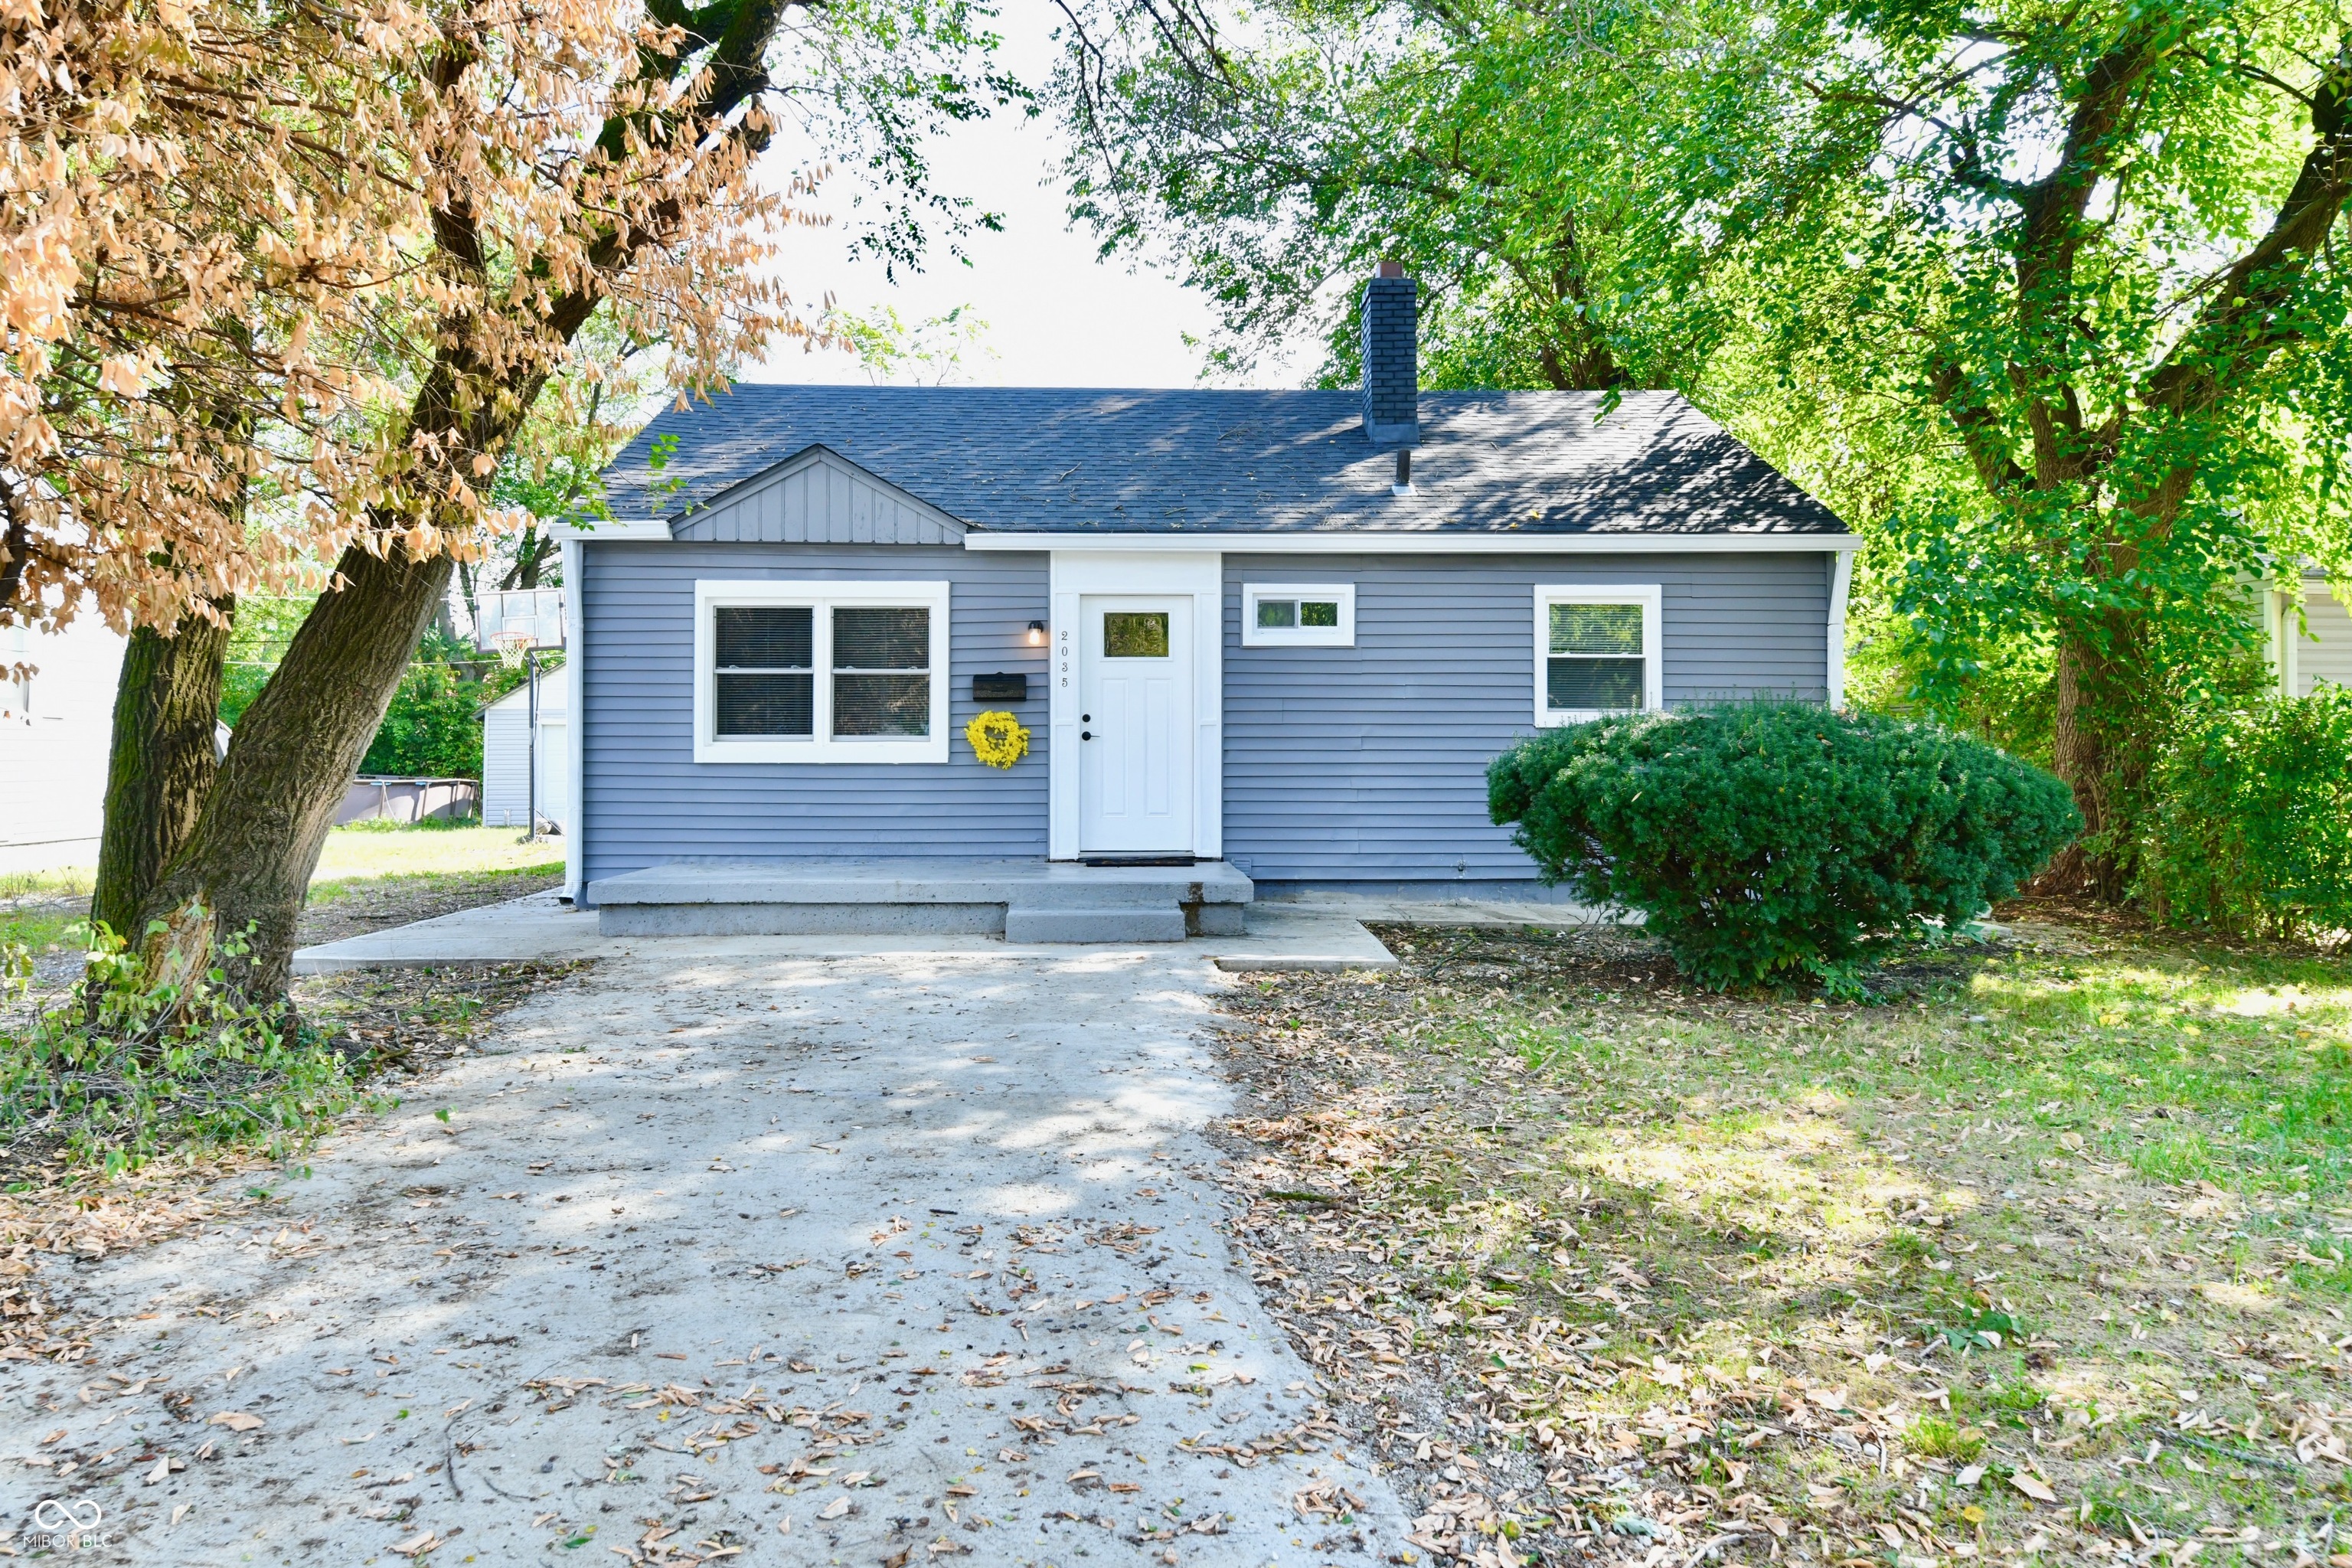
Pending
$193,900
3
bds
|
2
ba
|
1,035
sqft
|
built
1949
2035 N Tibbs Ave, Indianapolis, IN 46222
$227
Cash flow
6.1%
Cash-on-Cash Return
7.7%
Cap rate
0.9%
Rent to Value Ratio
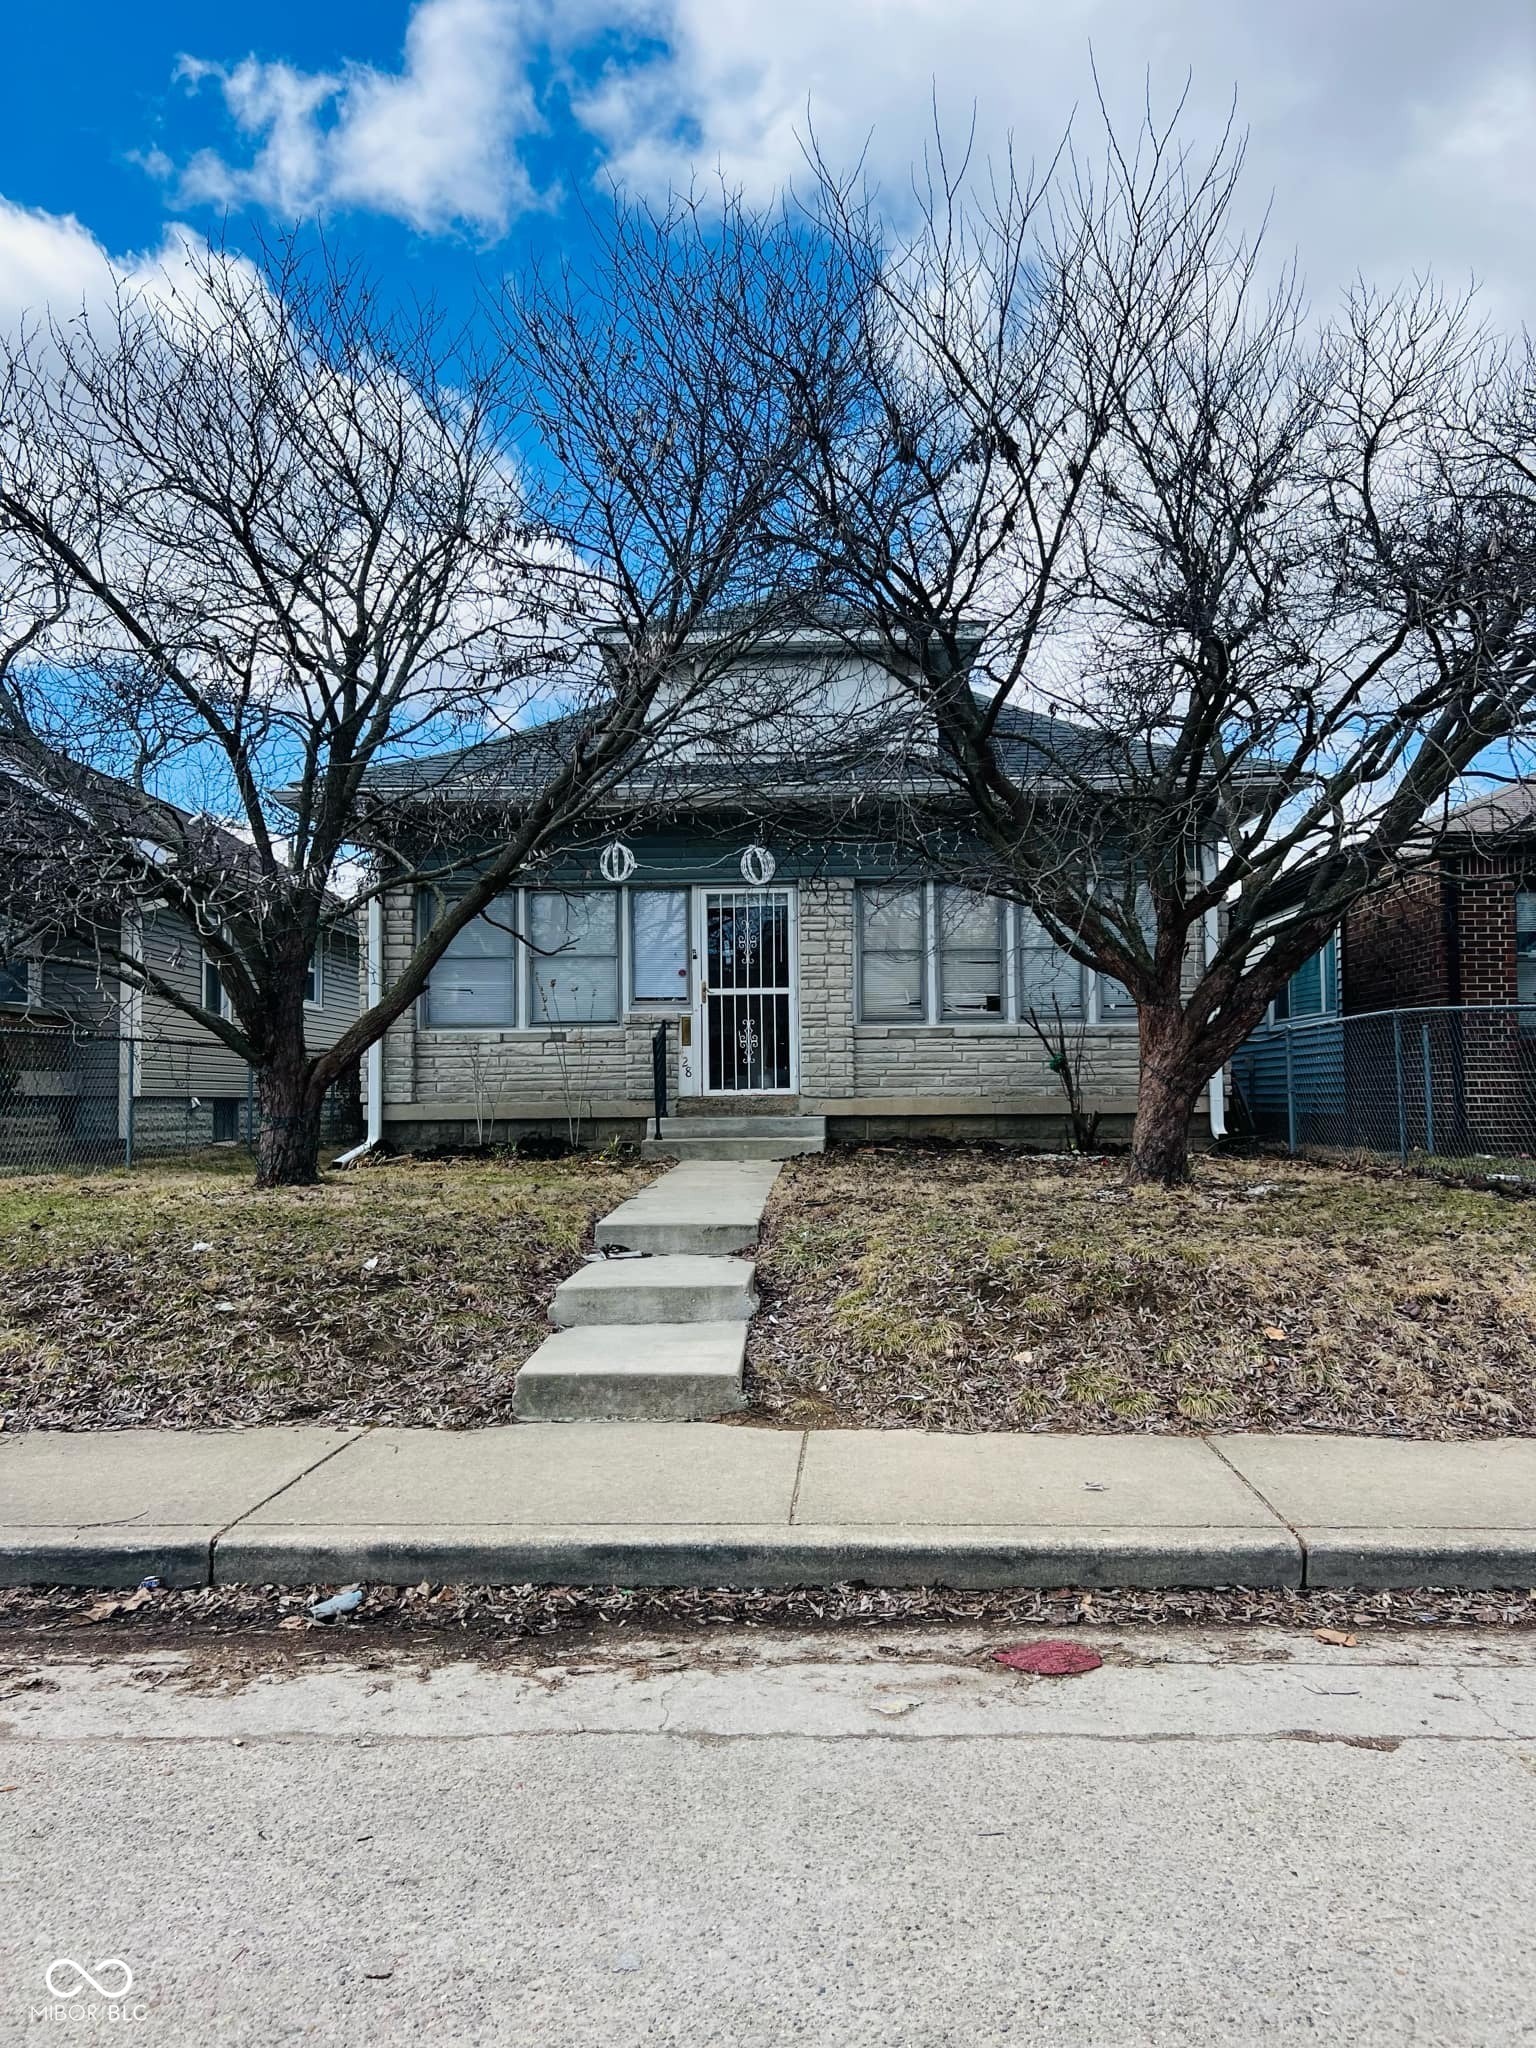
Active
$159,900
3
bds
|
1
ba
|
928
sqft
|
built
1910
428 N Alton Ave, Indianapolis, IN 46222
$129
Cash flow
4.2%
Cash-on-Cash Return
7.2%
Cap rate
0.9%
Rent to Value Ratio
Active
$185,000
4
bds
|
2
ba
|
1,440
sqft
|
built
1930
3308 Schofield Ave, Indianapolis, IN 46218
$135
Cash flow
3.8%
Cash-on-Cash Return
7.2%
Cap rate
0.9%
Rent to Value Ratio
Active
$150,000
2
bds
|
1
ba
|
1,152
sqft
|
built
1924
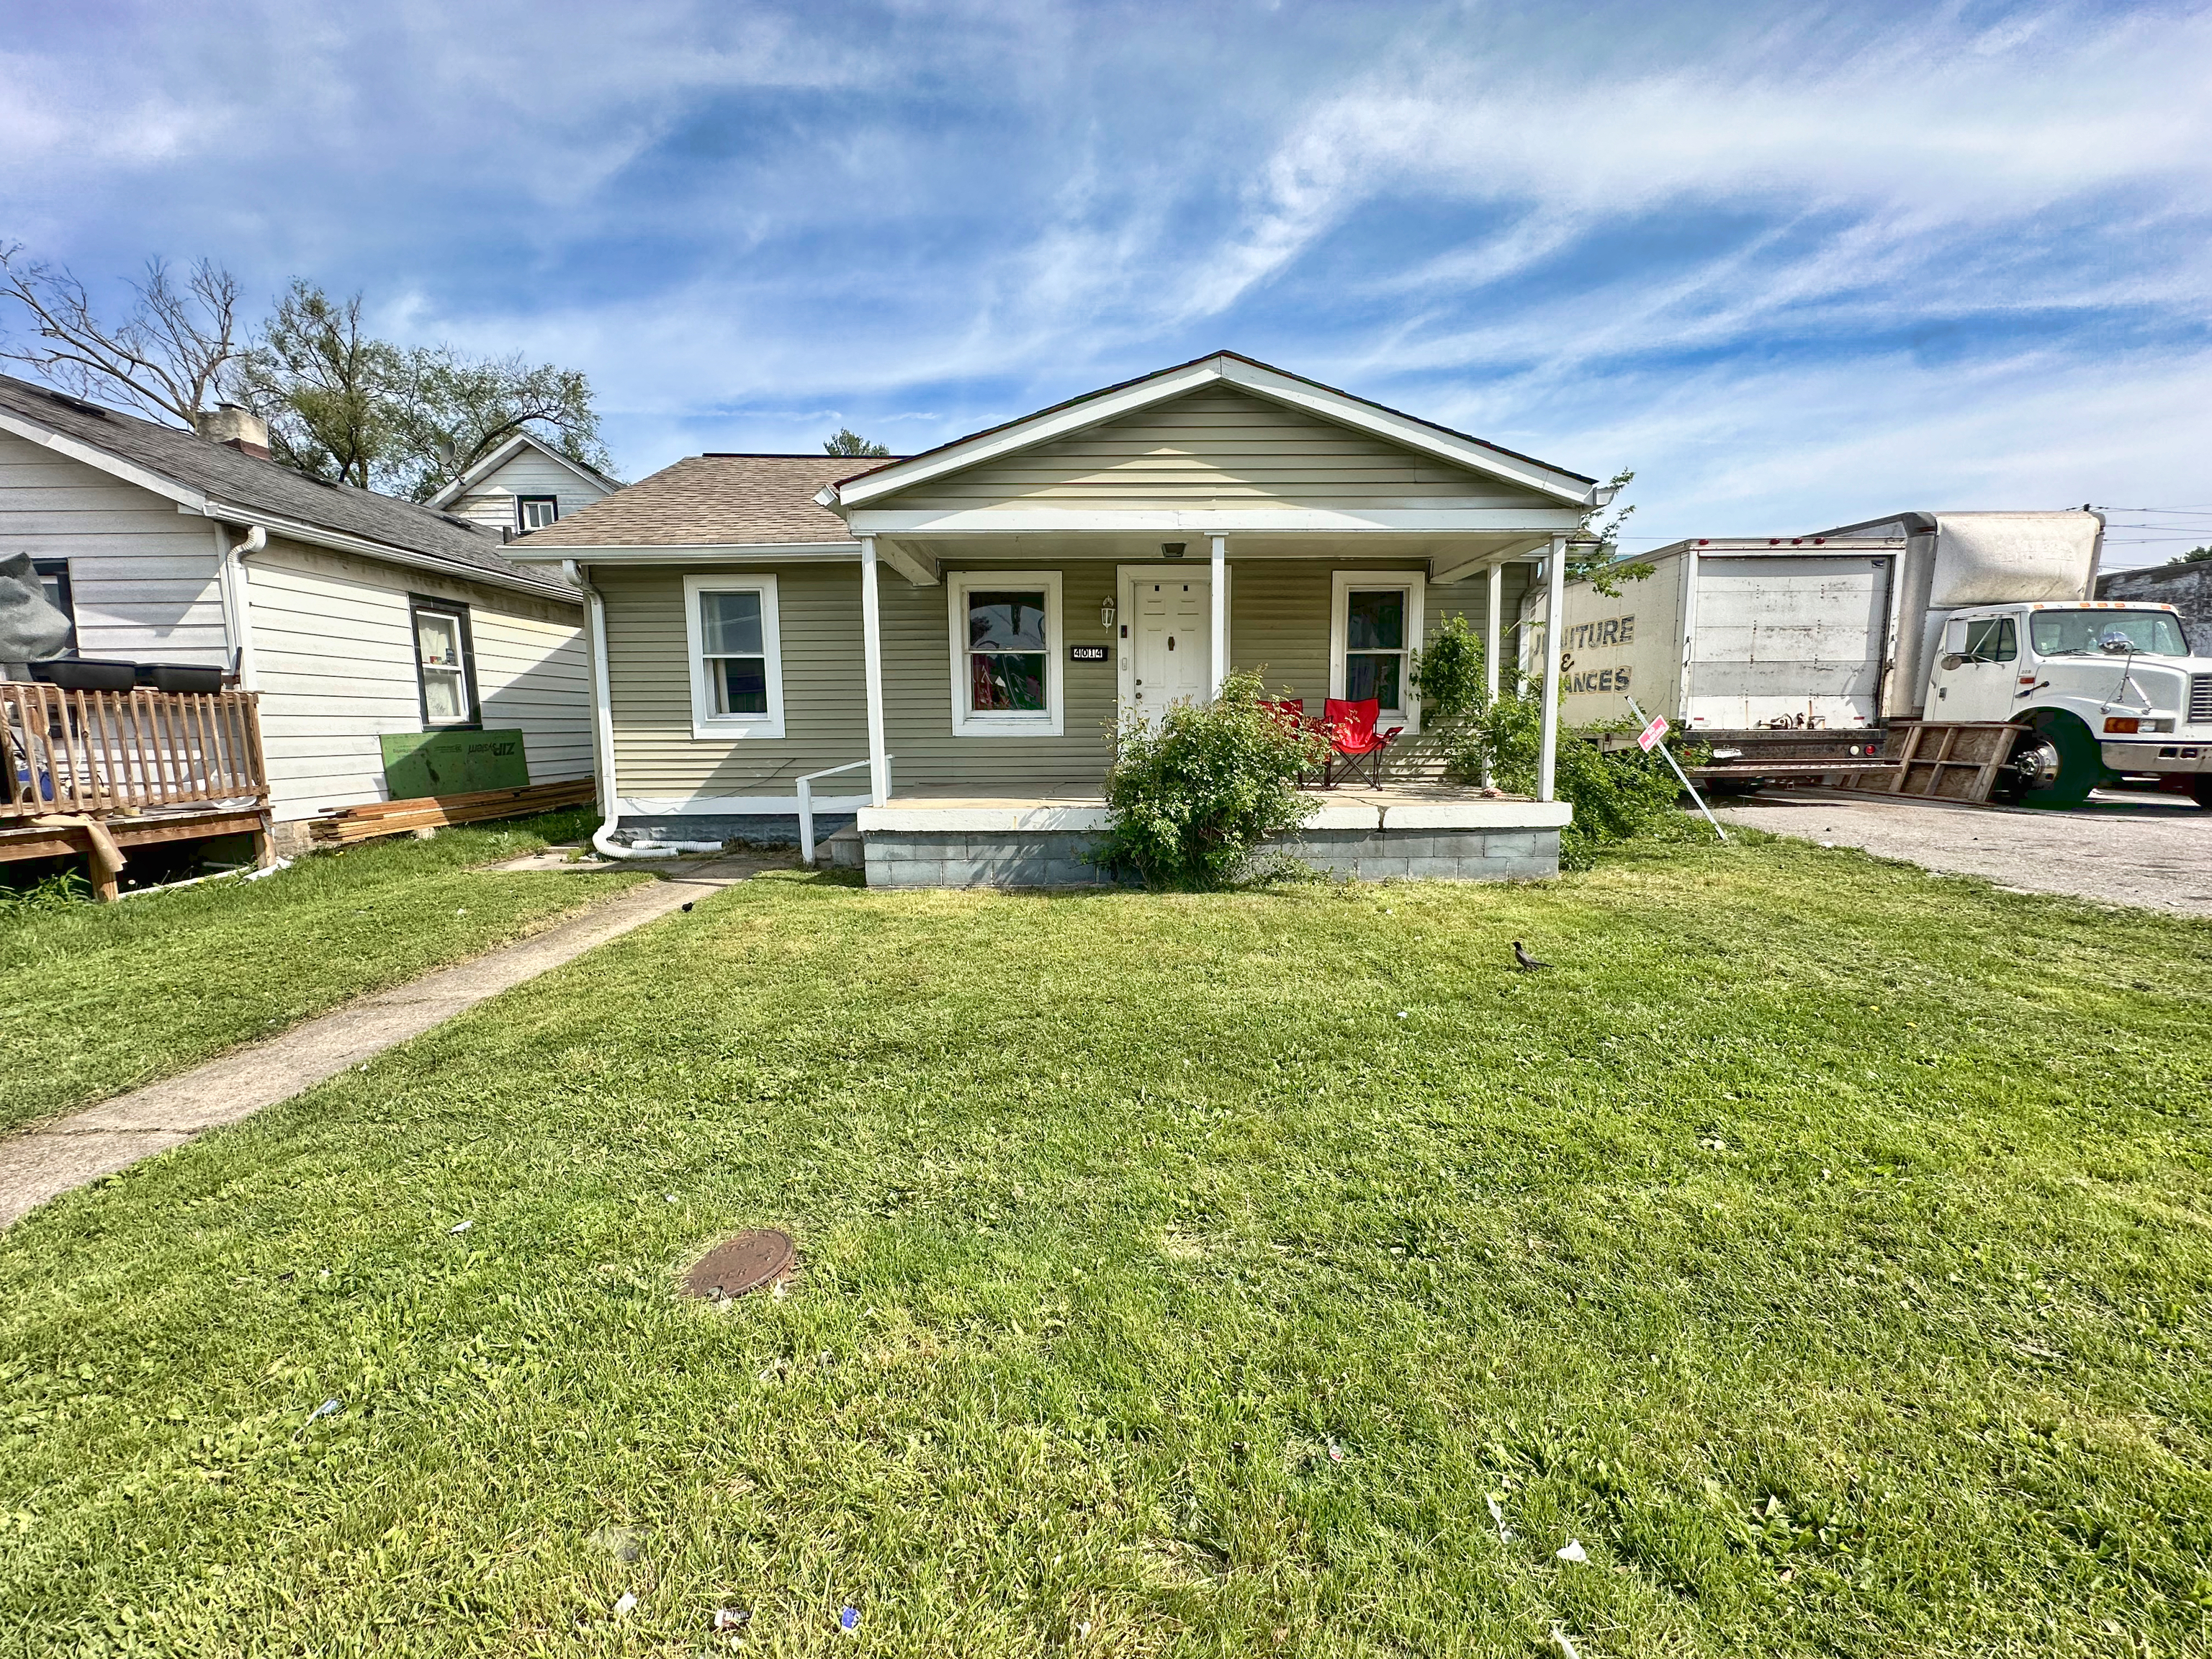
4014 E 10th St, Indianapolis, IN 46201
$111
Cash flow
3.9%
Cash-on-Cash Return
7.2%
Cap rate
0.9%
Rent to Value Ratio
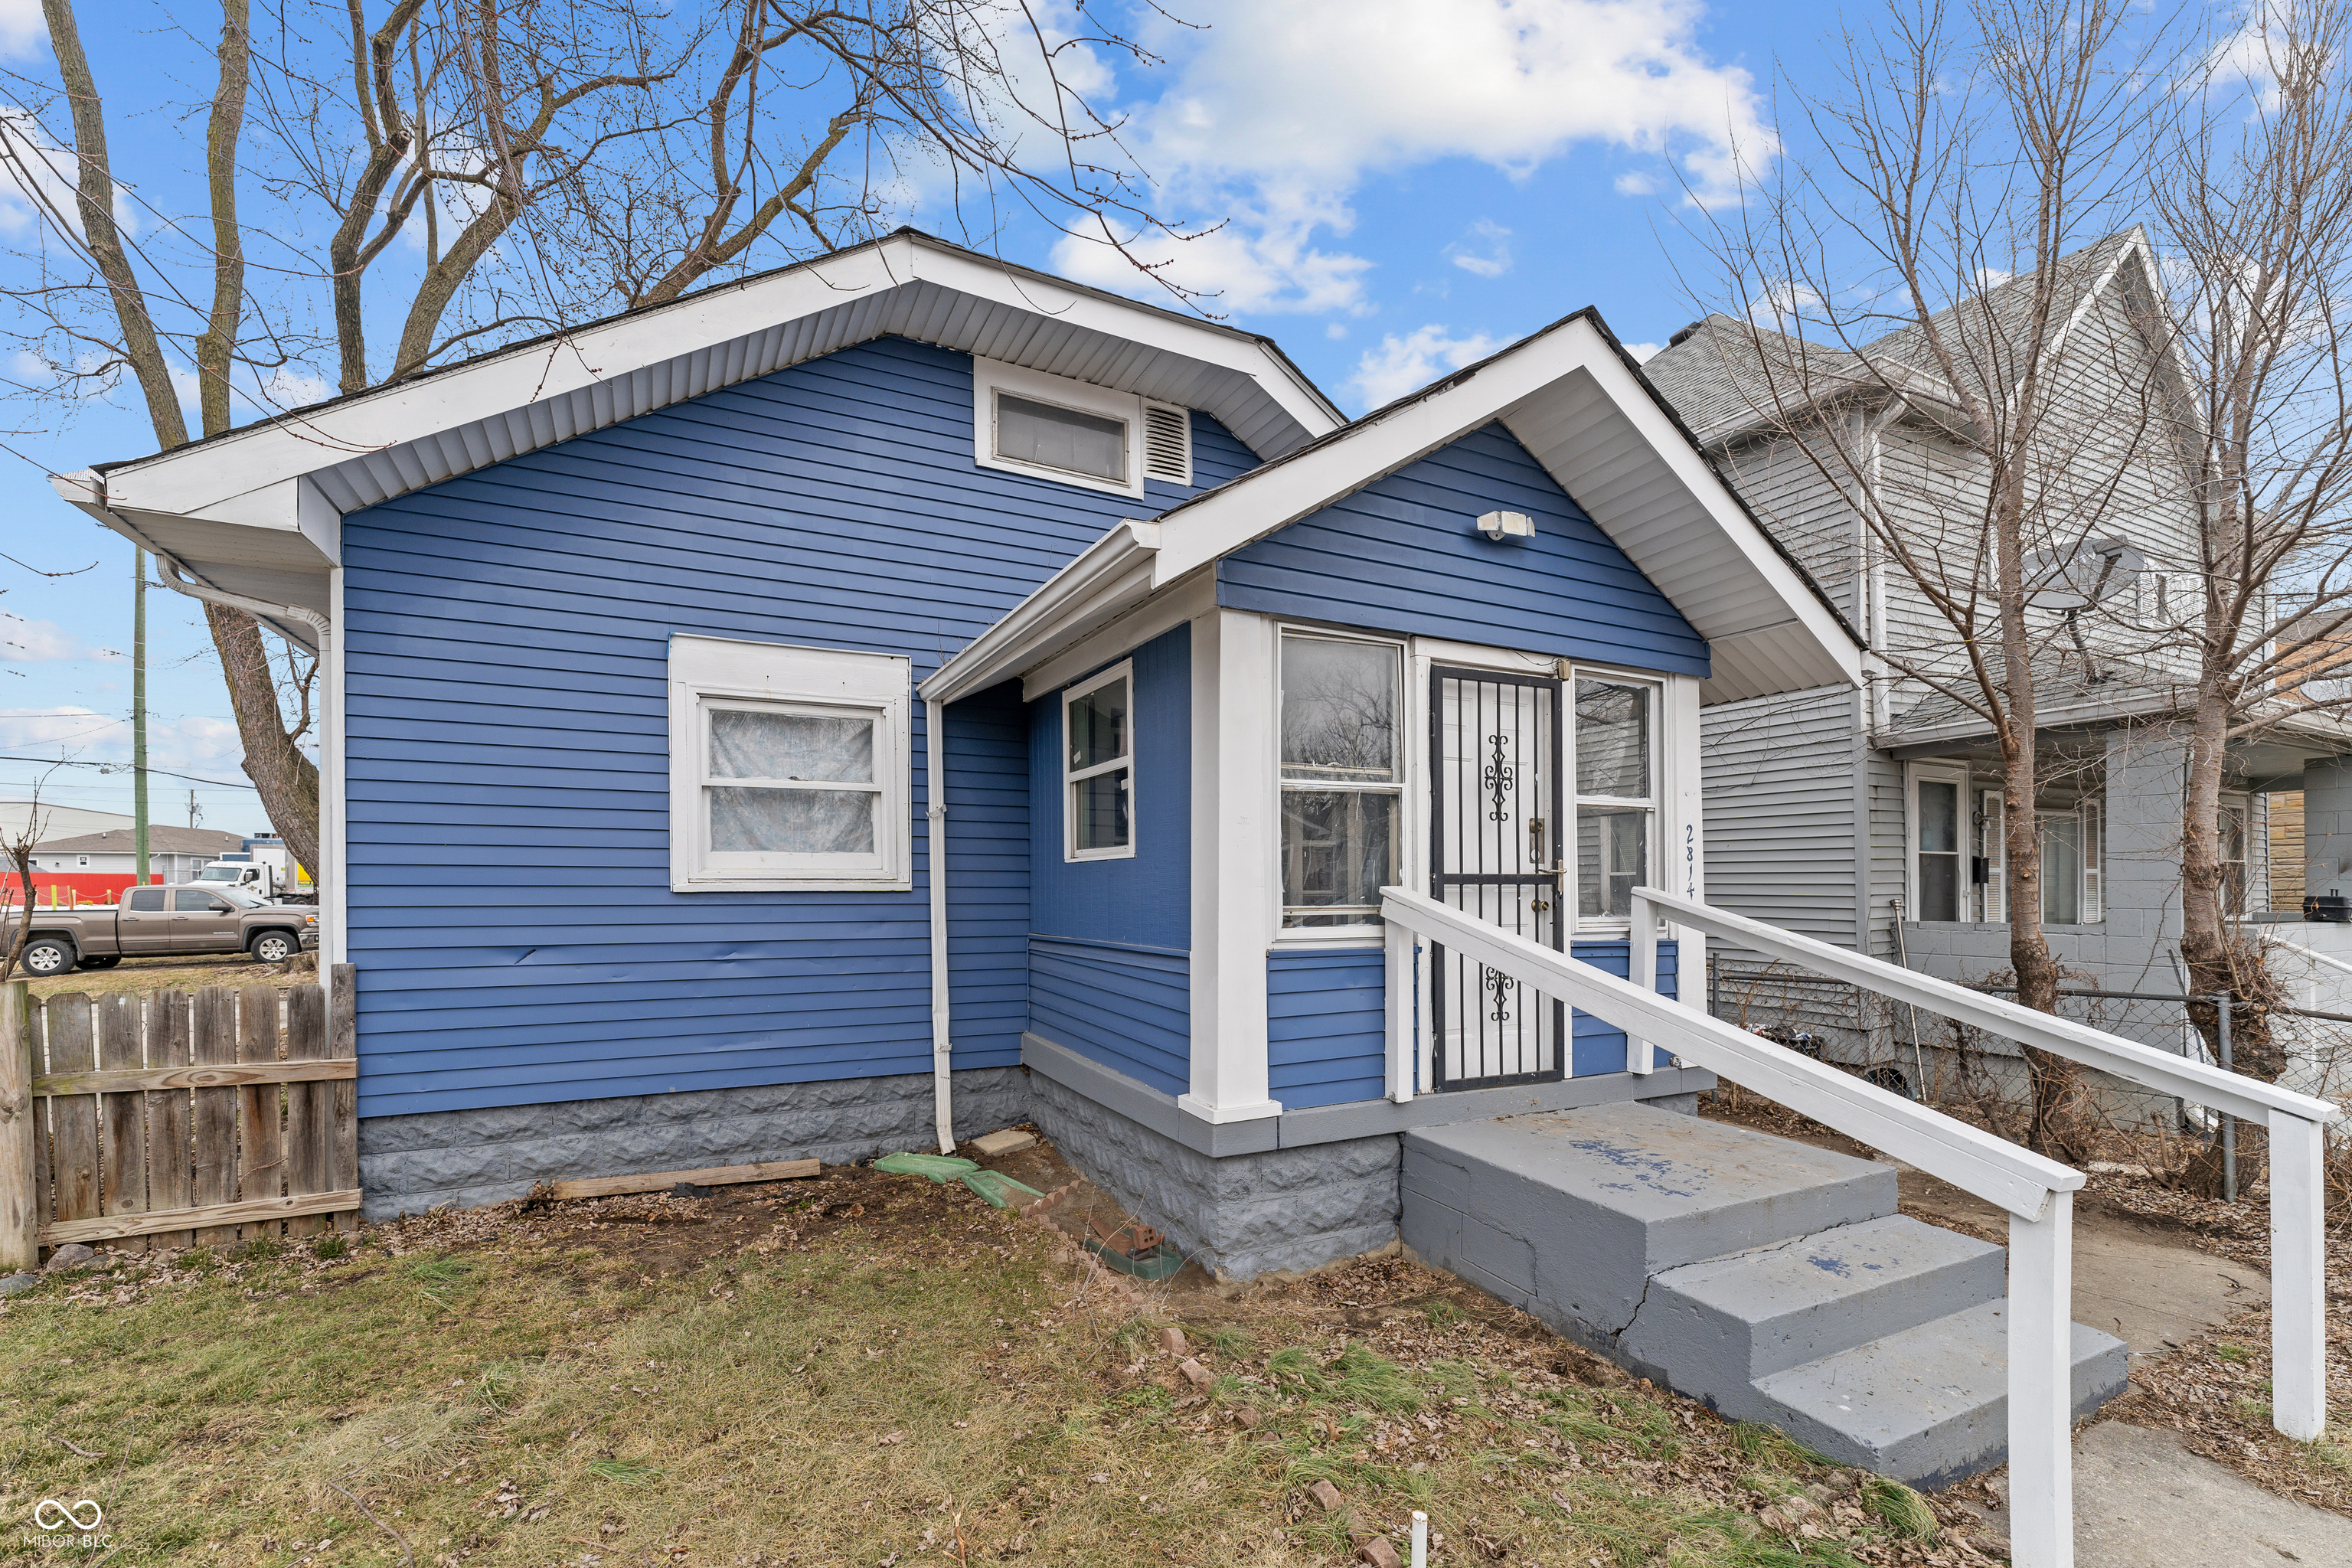
Active
$124,900
2
bds
|
2
ba
|
720
sqft
|
built
1925
2814 Brookside Ave, Indianapolis, IN 46218
$243
Cash flow
10.2%
Cash-on-Cash Return
8.6%
Cap rate
1.0%
Rent to Value Ratio
Pending
$180,000
3
bds
|
1
ba
|
1,875
sqft
|
built
1959
2442 N Franklin Rd, Indianapolis, IN 46219
$299
Cash flow
8.7%
Cash-on-Cash Return
8.3%
Cap rate
1.0%
Rent to Value Ratio
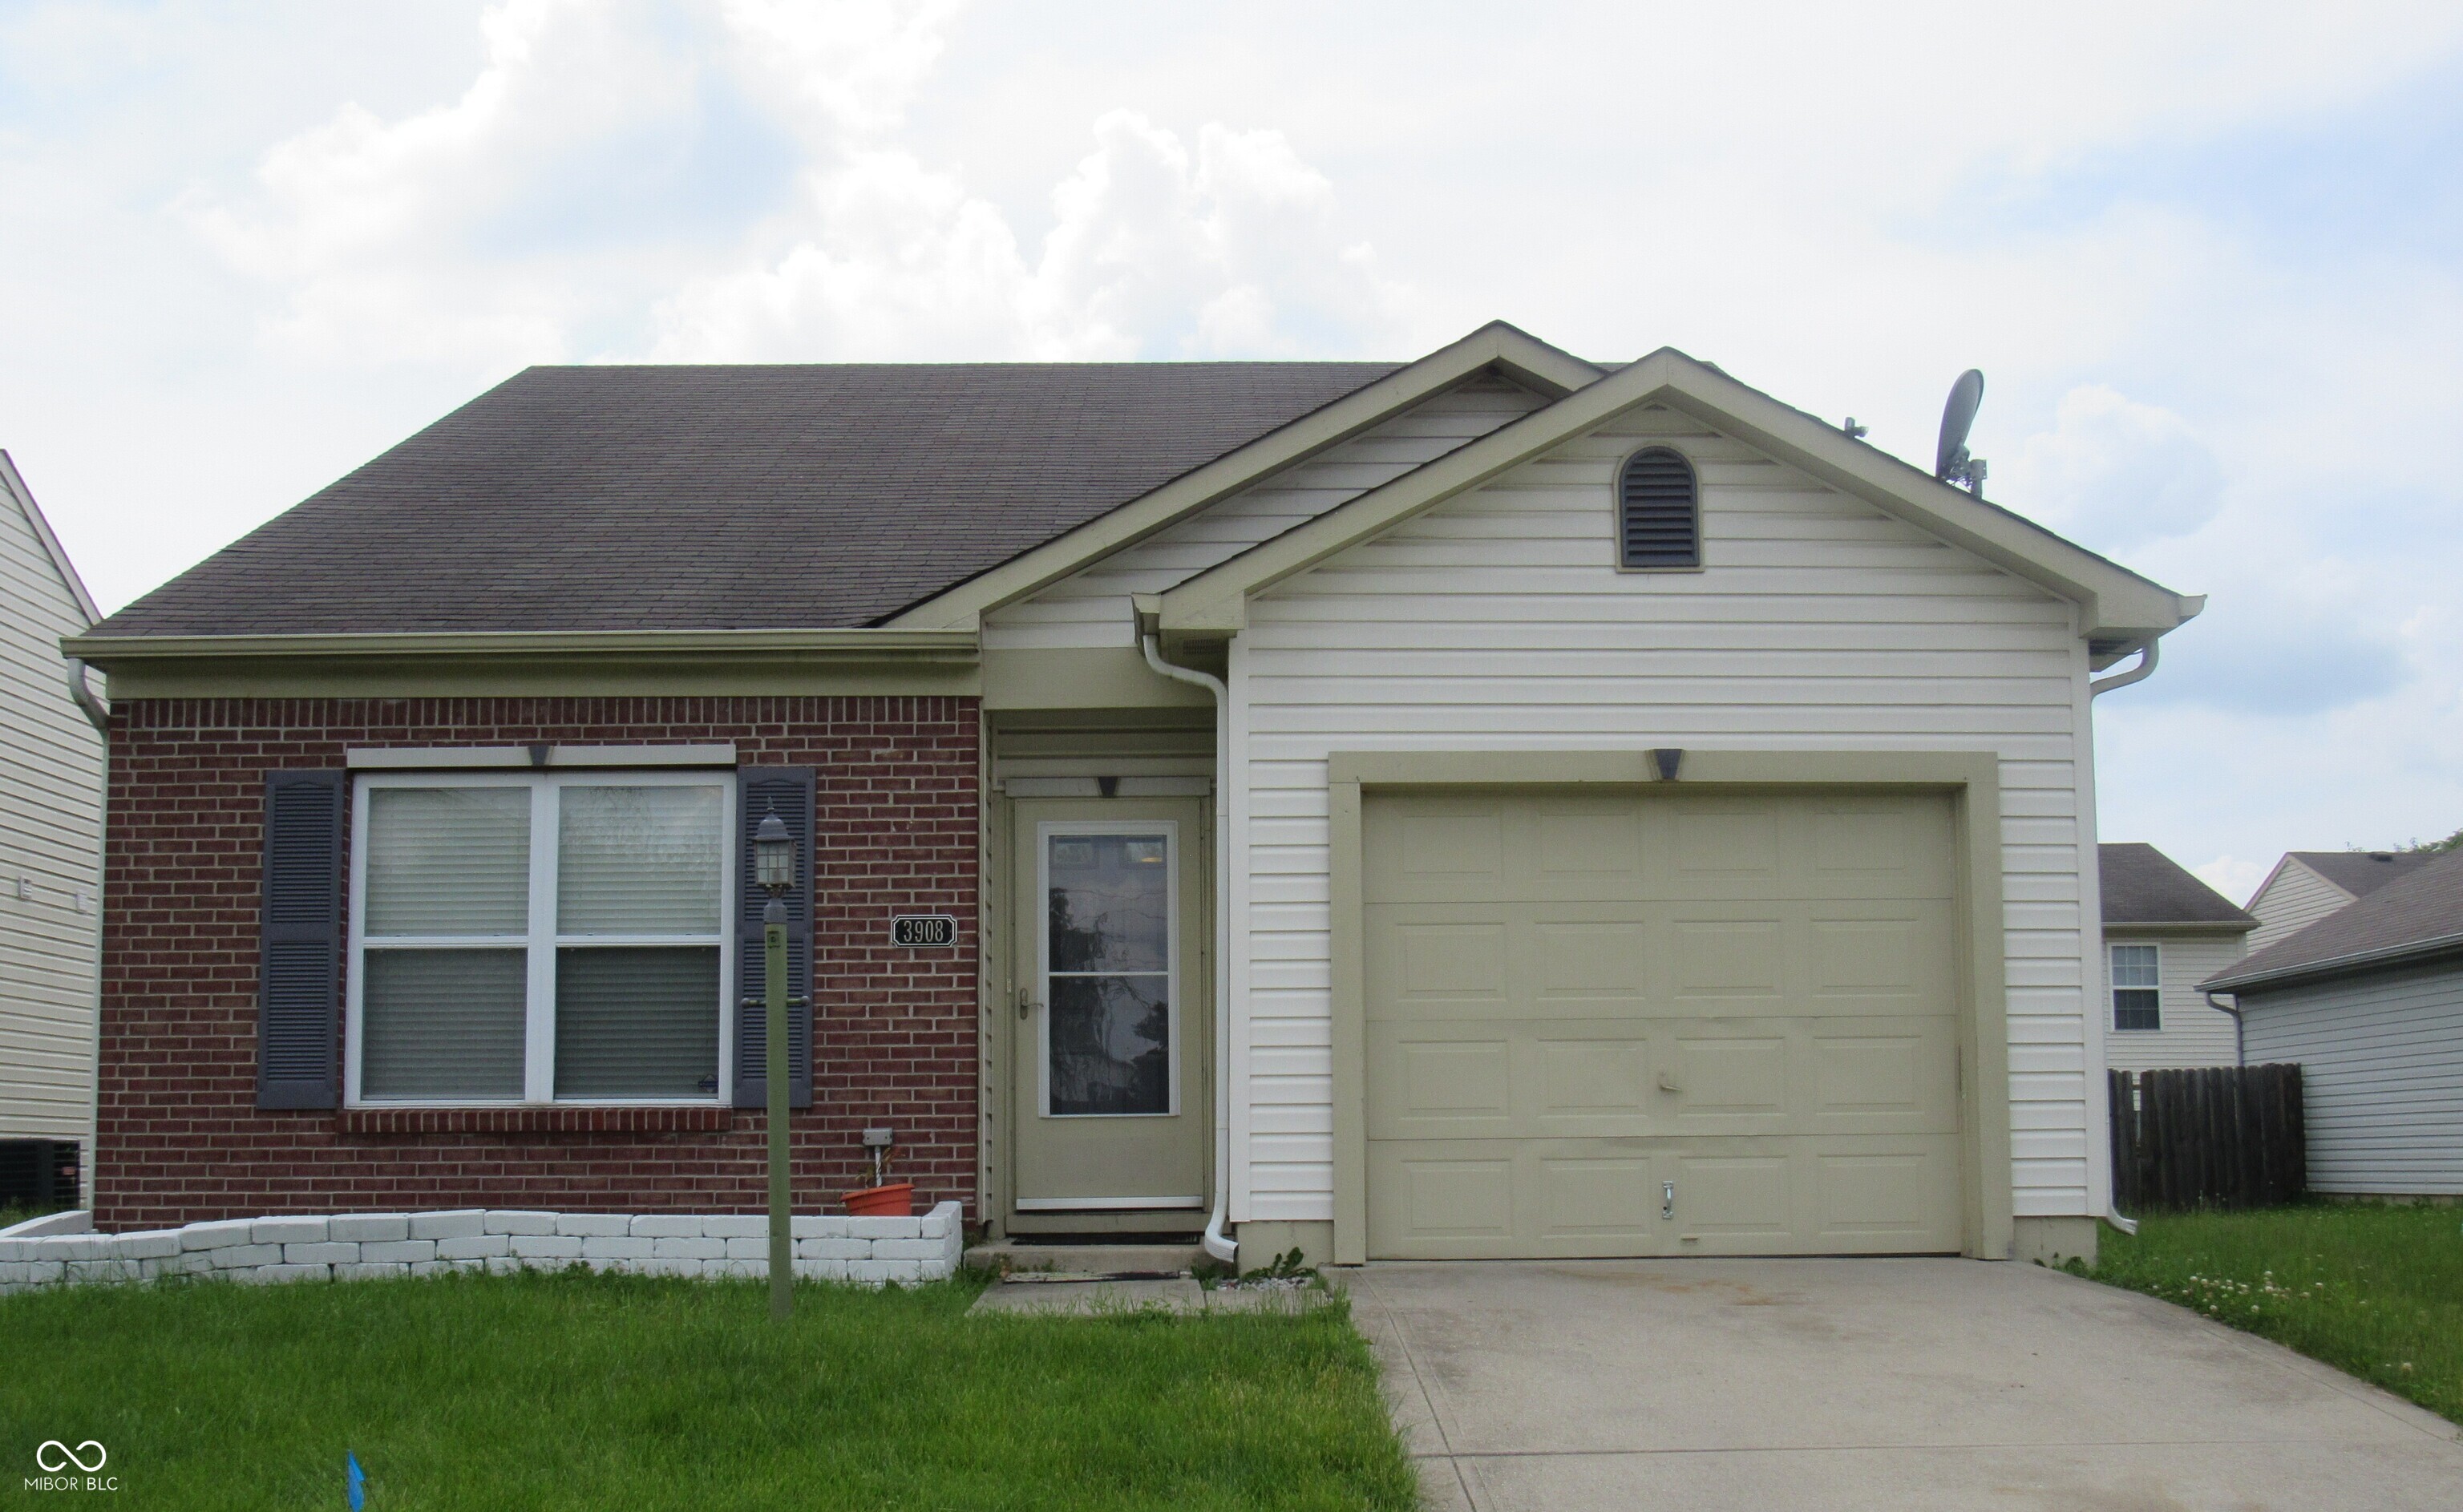
Active
$200,450
2
bds
|
2
ba
|
1,147
sqft
|
built
2002
3908 Roundwood Dr, Indianapolis, IN 46235
$54
Cash flow
1.4%
Cash-on-Cash Return
6.6%
Cap rate
0.8%
Rent to Value Ratio
Active
$237,000
2
bds
|
2
ba
|
1,219
sqft
|
built
1922
2320 Spann Ave, Indianapolis, IN 46203
$139
Cash flow
3.1%
Cash-on-Cash Return
7.0%
Cap rate
0.8%
Rent to Value Ratio
Active
$150,000
3
bds
|
1
ba
|
1,176
sqft
|
built
1910
57 N Tremont St, Indianapolis, IN 46222
$180
Cash flow
6.3%
Cash-on-Cash Return
7.7%
Cap rate
0.9%
Rent to Value Ratio
Active
$189,900
2
bds
|
1
ba
|
832
sqft
|
built
1920
5206 E Saint Clair St, Indianapolis, IN 46219
$110
Cash flow
3.0%
Cash-on-Cash Return
7.0%
Cap rate
0.8%
Rent to Value Ratio
Active
$389,999
3
bds
|
2
ba
|
2,150
sqft
|
built
1900
1818 Cornell Ave, Indianapolis, IN 46202
$166
Cash flow
2.2%
Cash-on-Cash Return
6.8%
Cap rate
0.8%
Rent to Value Ratio
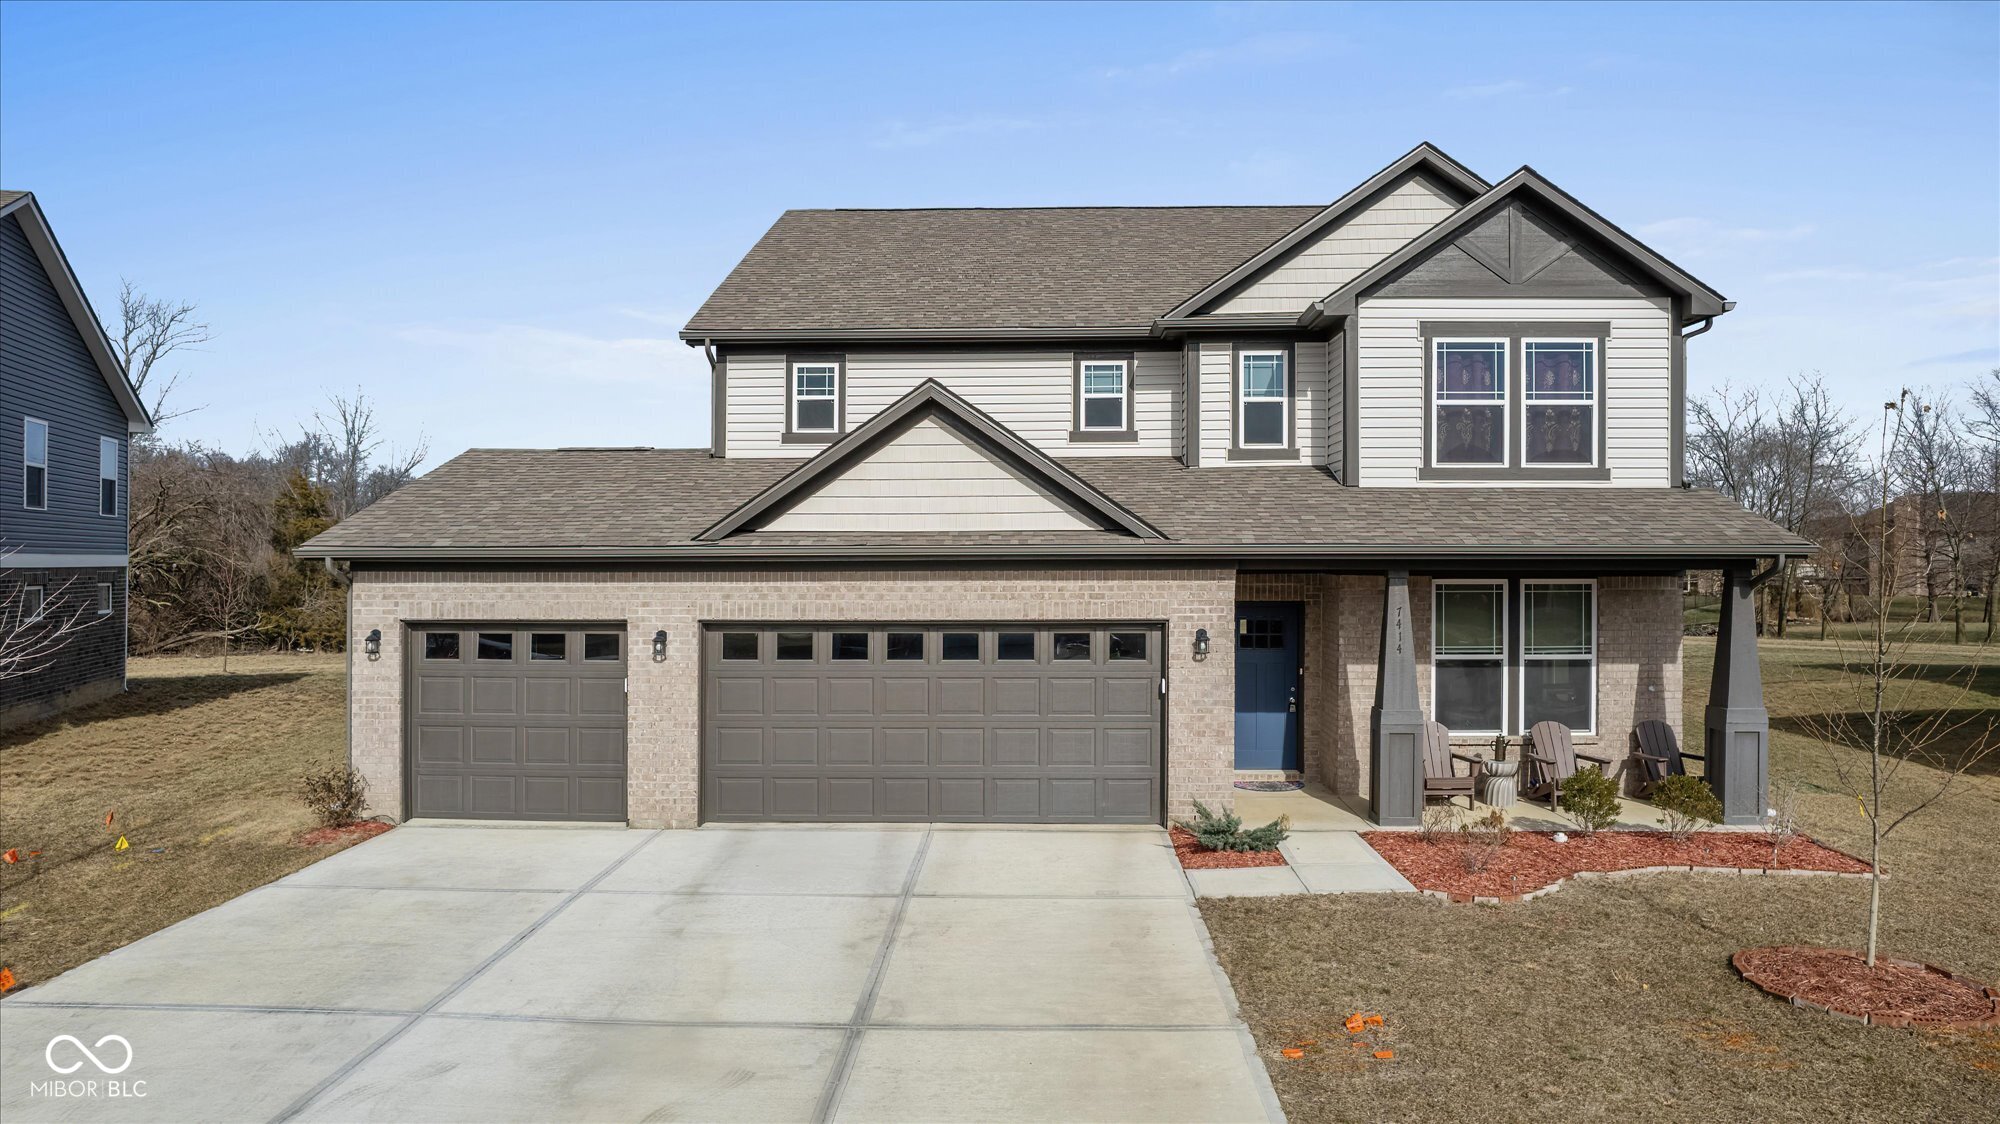
Active
$479,000
5
bds
|
3
ba
|
3,214
sqft
|
built
2022
7414 Glen Park Ln, Indianapolis, IN 46259
$123
Cash flow
1.3%
Cash-on-Cash Return
6.6%
Cap rate
0.8%
Rent to Value Ratio
Active
$89,900
2
bds
|
1
ba
|
1,120
sqft
|
built
1920
2821 E 13th St, Indianapolis, IN 46201
$288
Cash flow
16.7%
Cash-on-Cash Return
10.1%
Cap rate
1.2%
Rent to Value Ratio

Active
$95,000
1
bds
|
0
ba
|
1,344
sqft
|
built
1939
3321 S Rybolt Ave, Indianapolis, IN 46221
$262
Cash flow
14.4%
Cash-on-Cash Return
9.6%
Cap rate
1.2%
Rent to Value Ratio
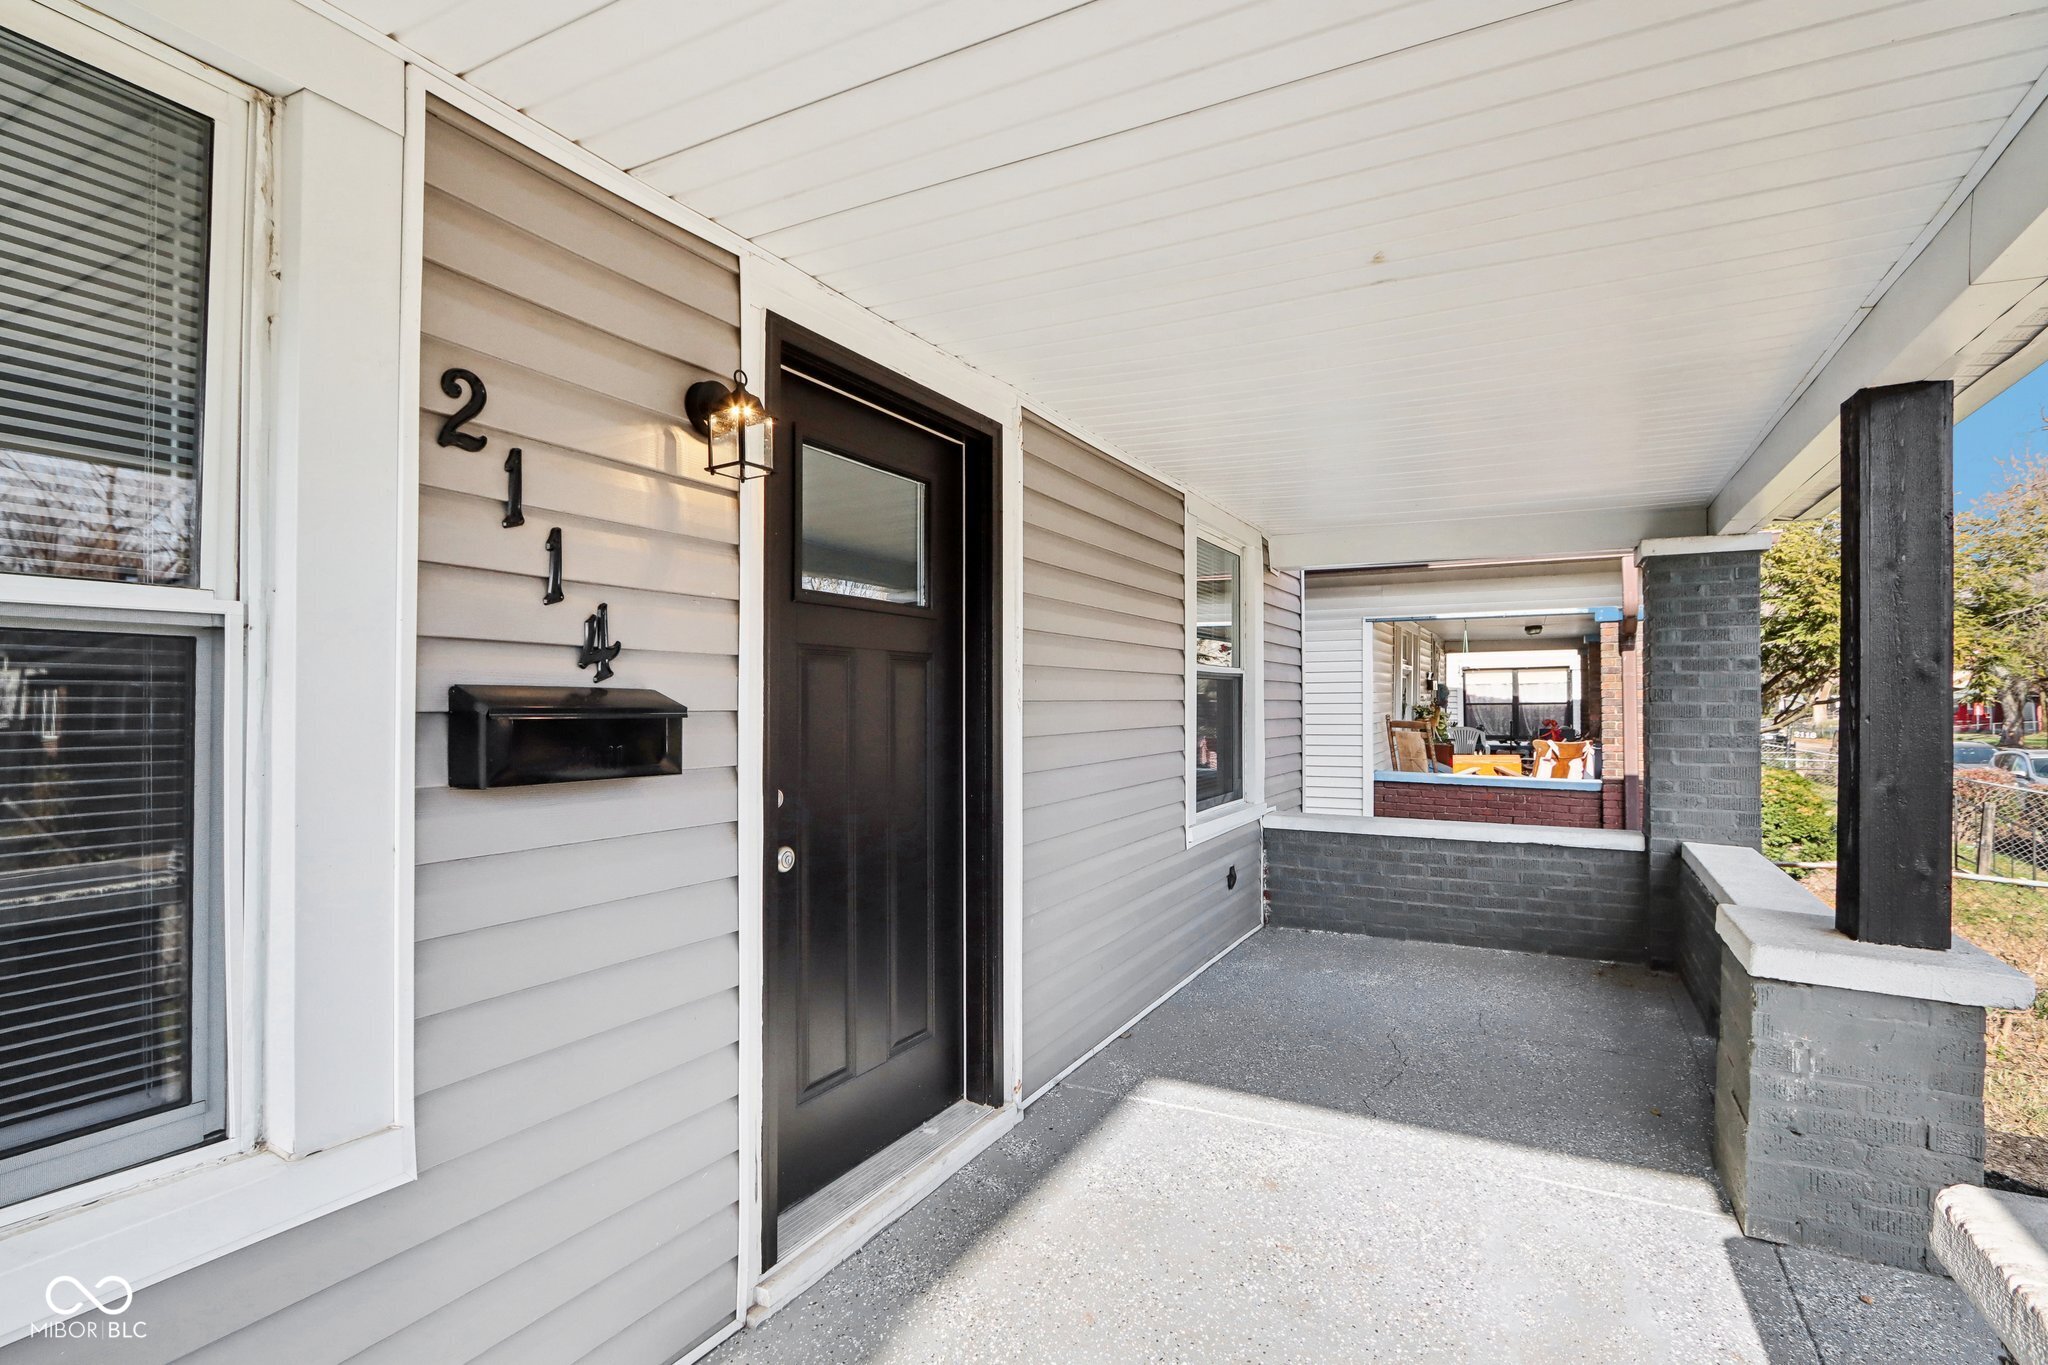
Active
$235,000
3
bds
|
1
ba
|
1,640
sqft
|
built
2009
2114 N Dexter St, Indianapolis, IN 46202
$149
Cash flow
3.3%
Cash-on-Cash Return
7.0%
Cap rate
0.9%
Rent to Value Ratio
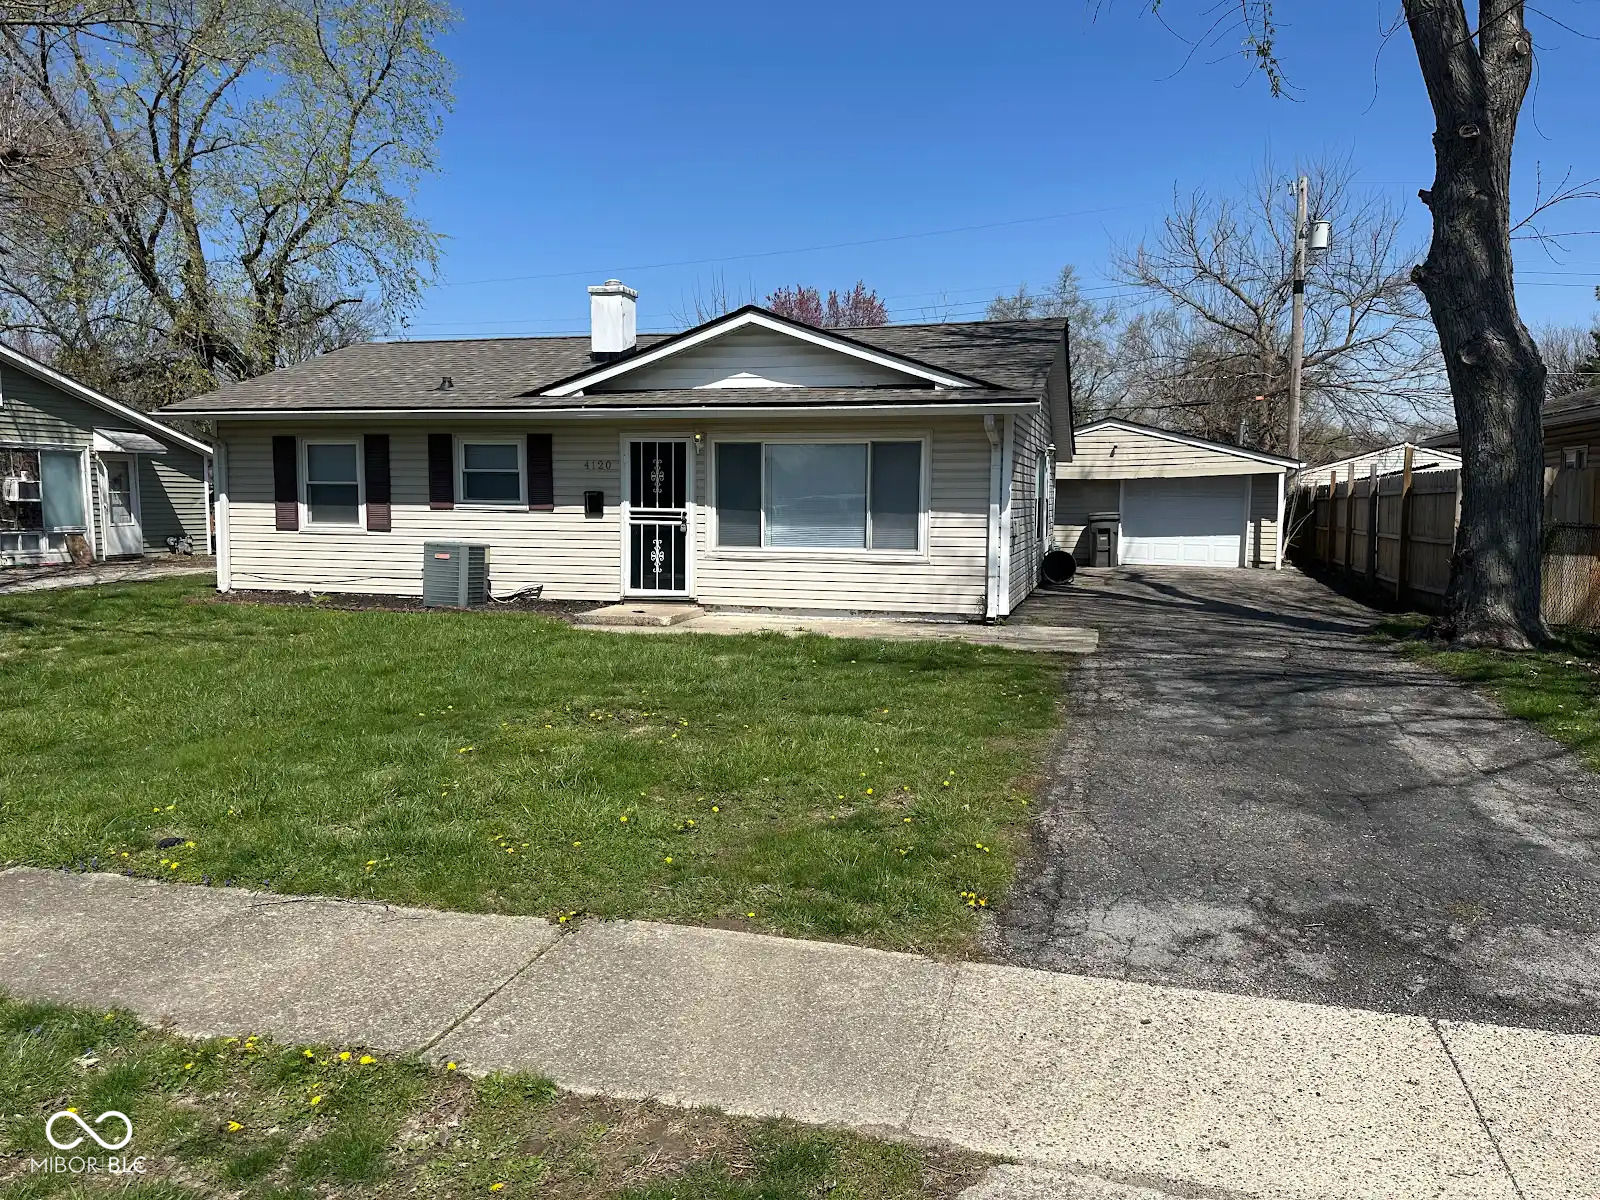
Pending
$174,900
3
bds
|
1
ba
|
888
sqft
|
built
1956
4120 Breton St, Indianapolis, IN 46222
$50
Cash flow
1.5%
Cash-on-Cash Return
6.6%
Cap rate
0.8%
Rent to Value Ratio
Active
$235,000
3
bds
|
1
ba
|
1,488
sqft
|
built
1900
902 Villa Ave, Indianapolis, IN 46203
$149
Cash flow
3.3%
Cash-on-Cash Return
7.0%
Cap rate
0.9%
Rent to Value Ratio
Active
$140,000
0
bds
|
0
ba
|
0
sqft
|
built
1941
4920 E 34th St, Indianapolis, IN 46218
$233
Cash flow
8.7%
Cash-on-Cash Return
8.3%
Cap rate
1.0%
Rent to Value Ratio
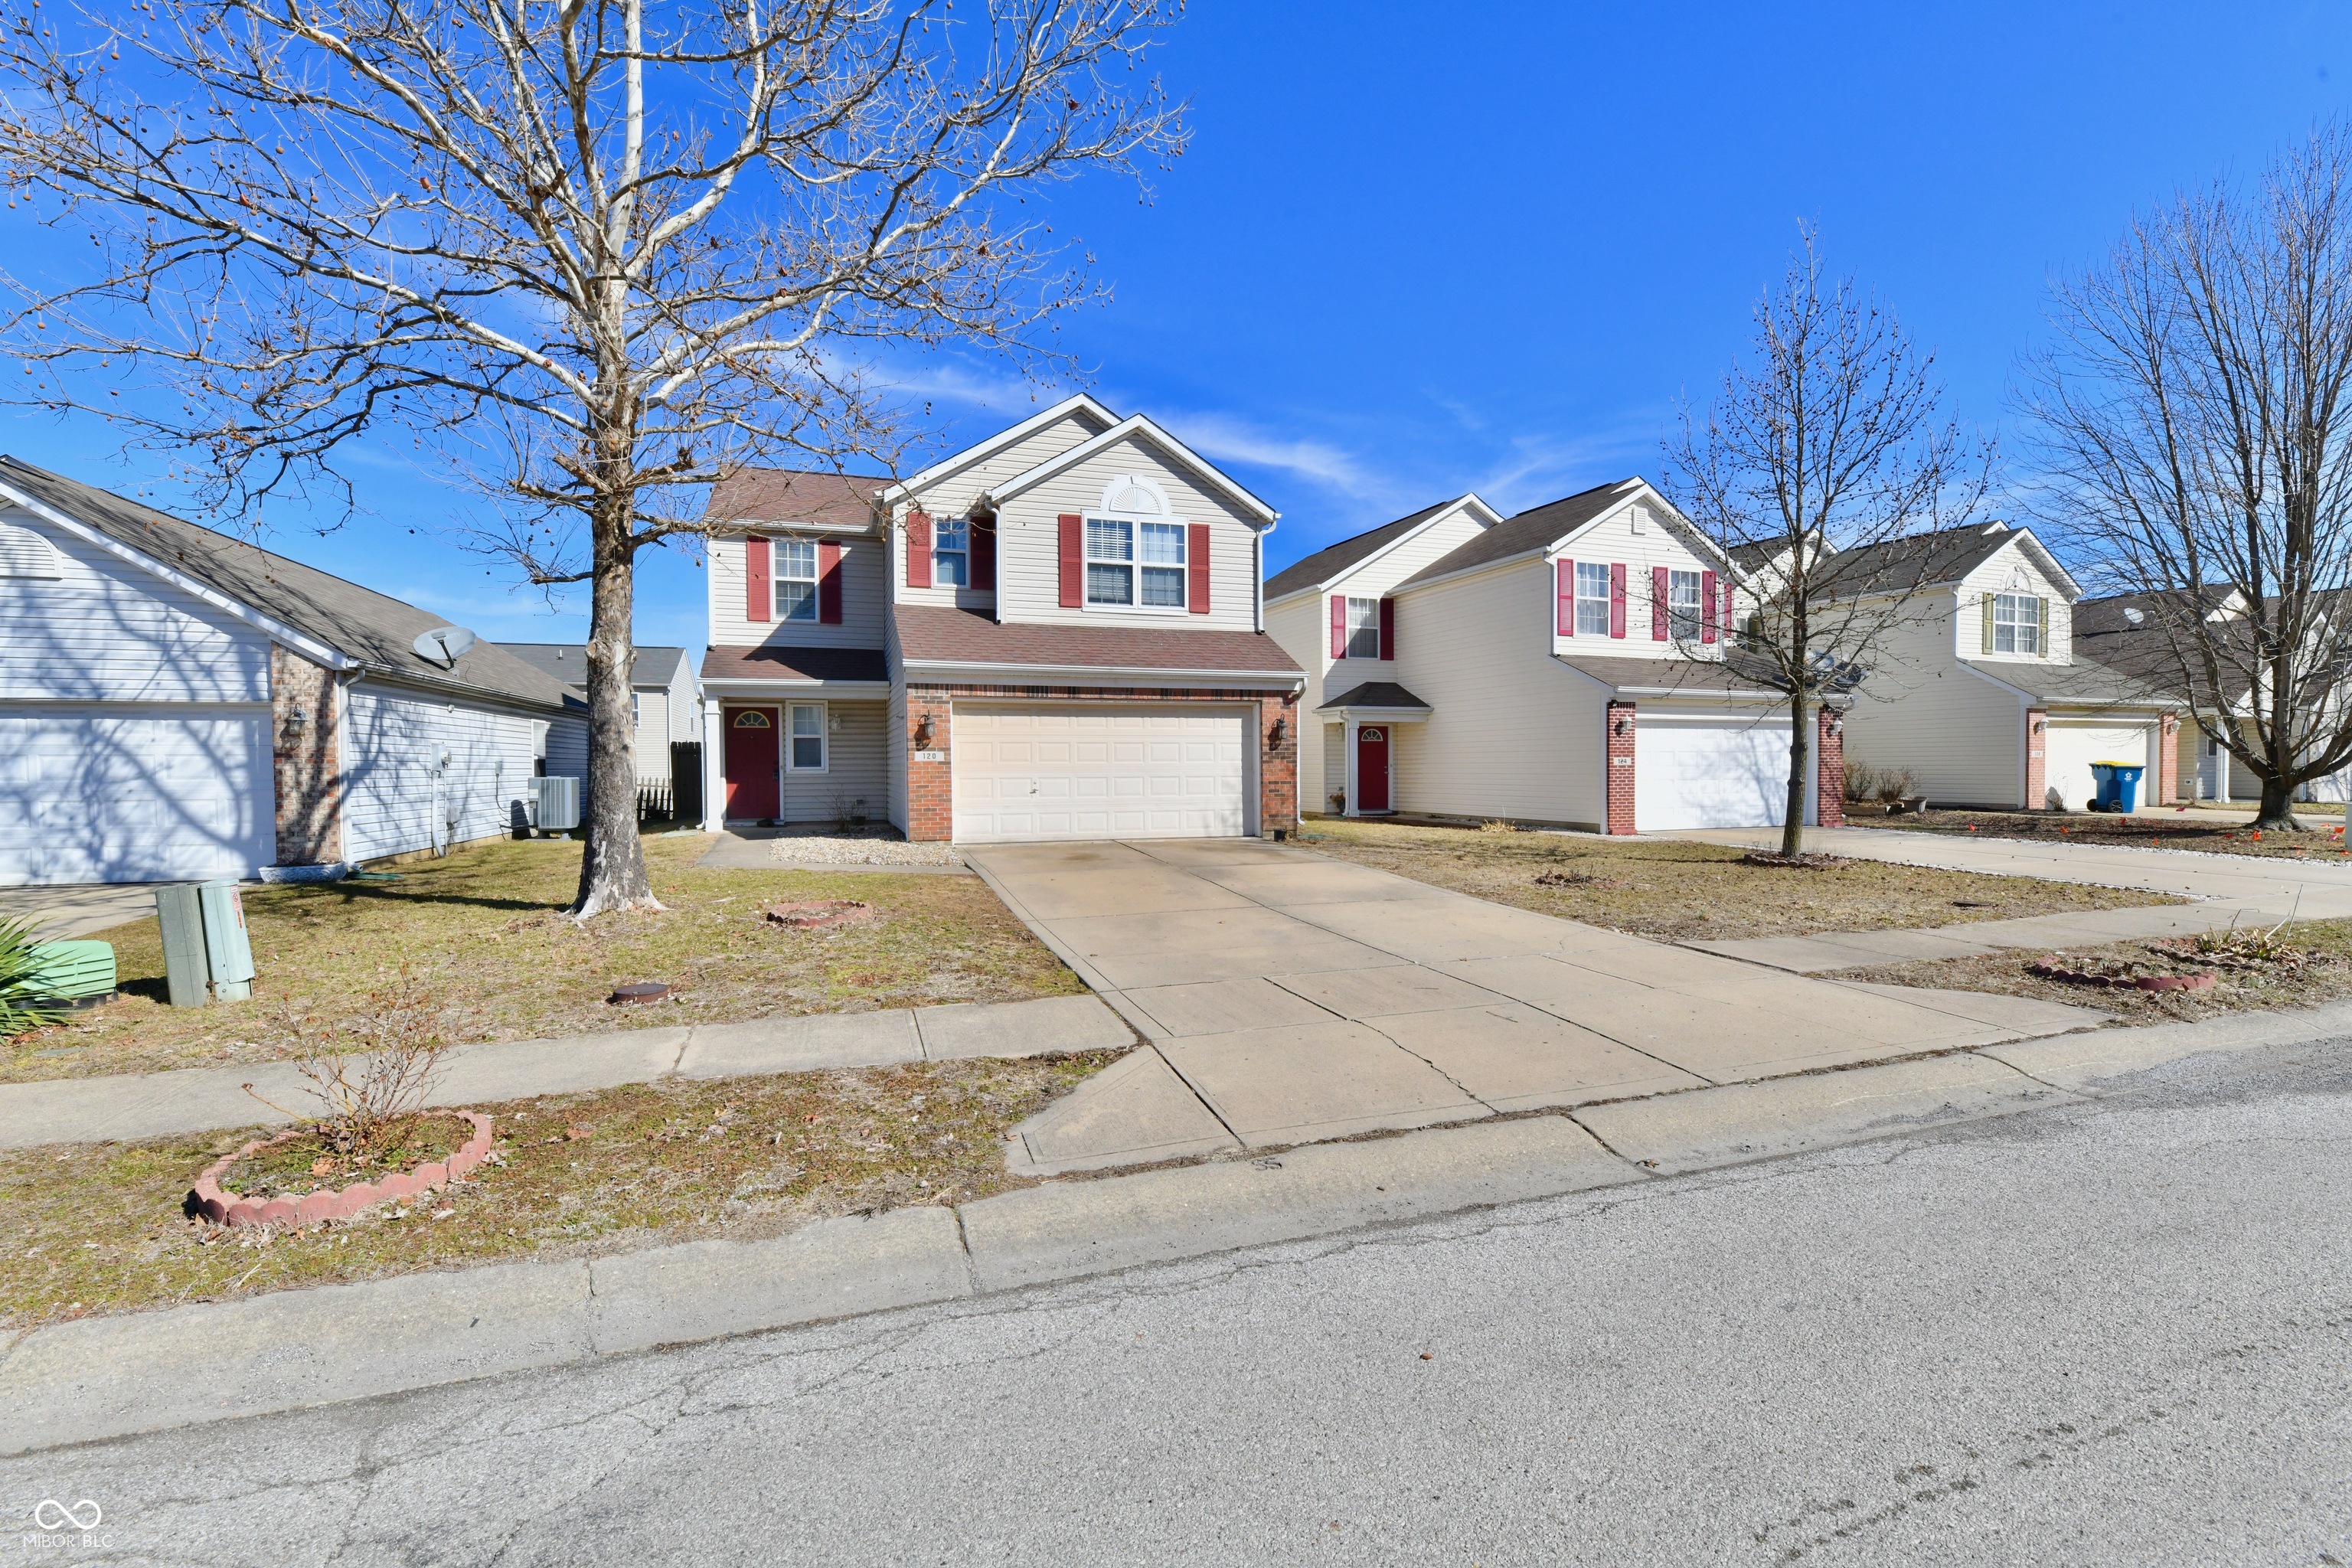
Active
$230,000
3
bds
|
3
ba
|
1,494
sqft
|
built
2002
120 White Lick Dr, Indianapolis, IN 46227
$17
Cash flow
0.4%
Cash-on-Cash Return
6.4%
Cap rate
0.8%
Rent to Value Ratio
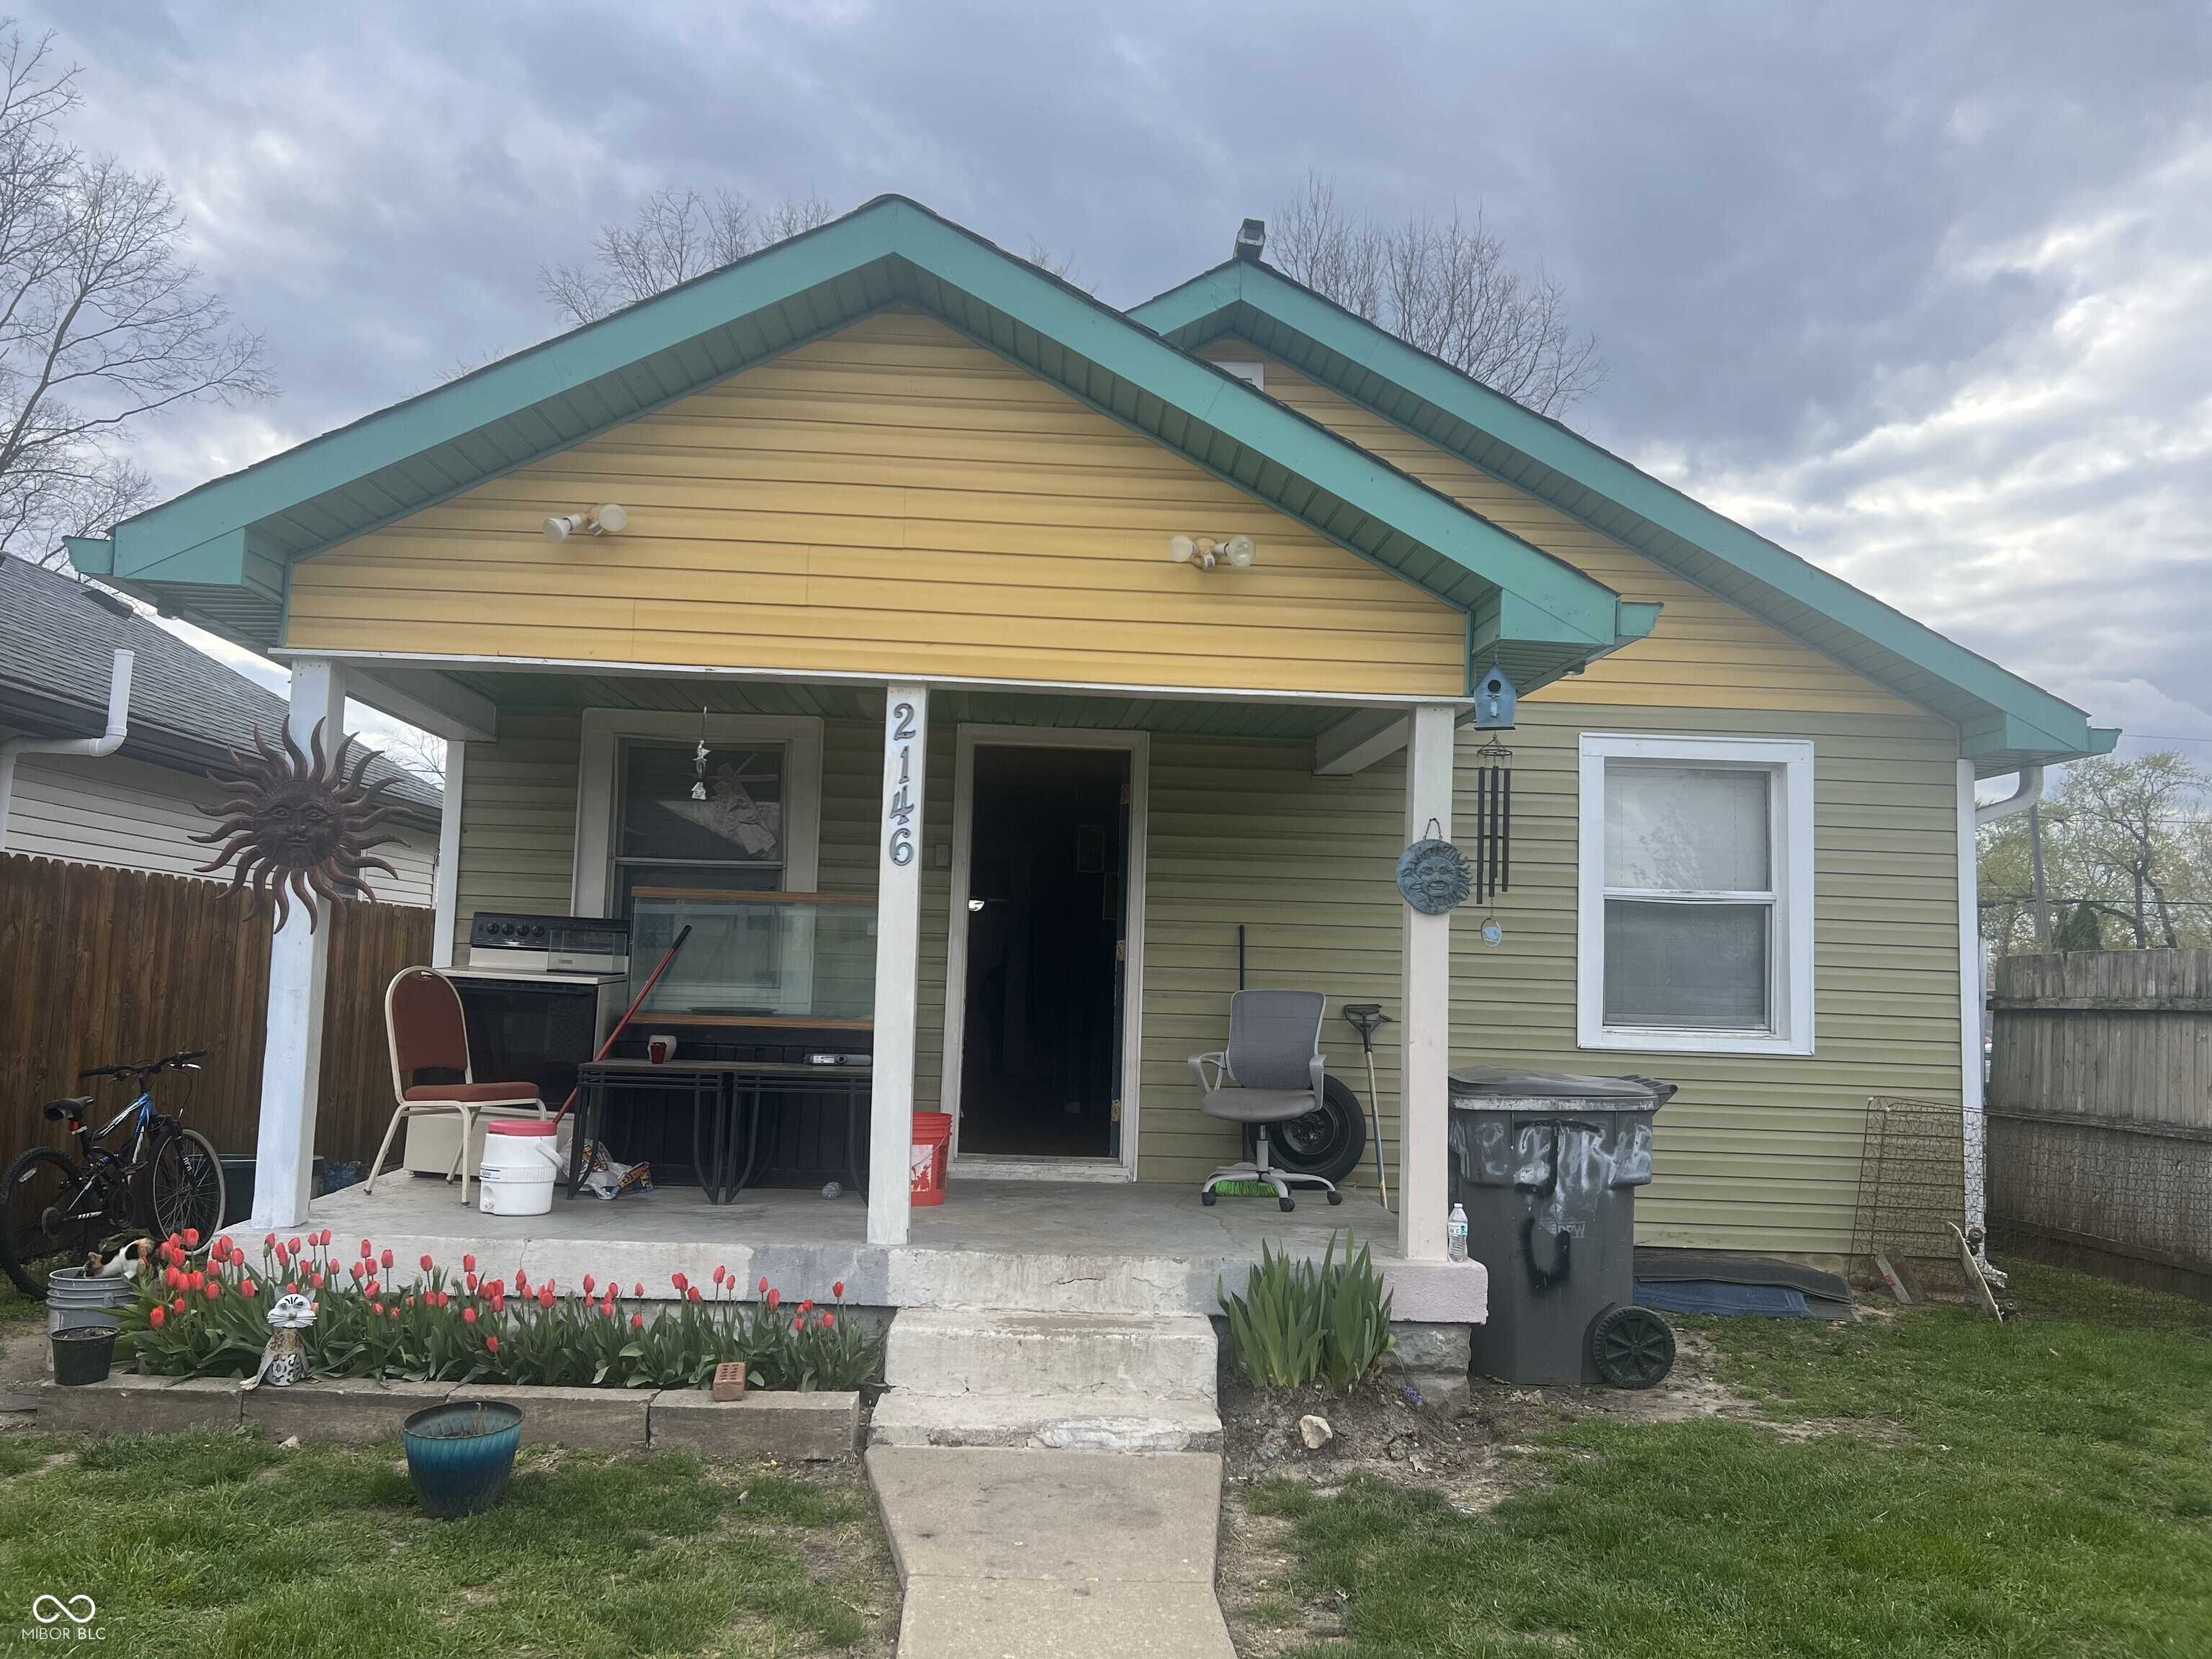
Active
$159,900
3
bds
|
2
ba
|
1,102
sqft
|
built
1931
2146 Gent Ave, Indianapolis, IN 46202
$129
Cash flow
4.2%
Cash-on-Cash Return
7.2%
Cap rate
0.9%
Rent to Value Ratio
Active
$115,000
2
bds
|
1
ba
|
968
sqft
|
built
1973
2721 Del Prado Dr, Indianapolis, IN 46227
$8
Cash flow
0.4%
Cash-on-Cash Return
6.4%
Cap rate
1.1%
Rent to Value Ratio
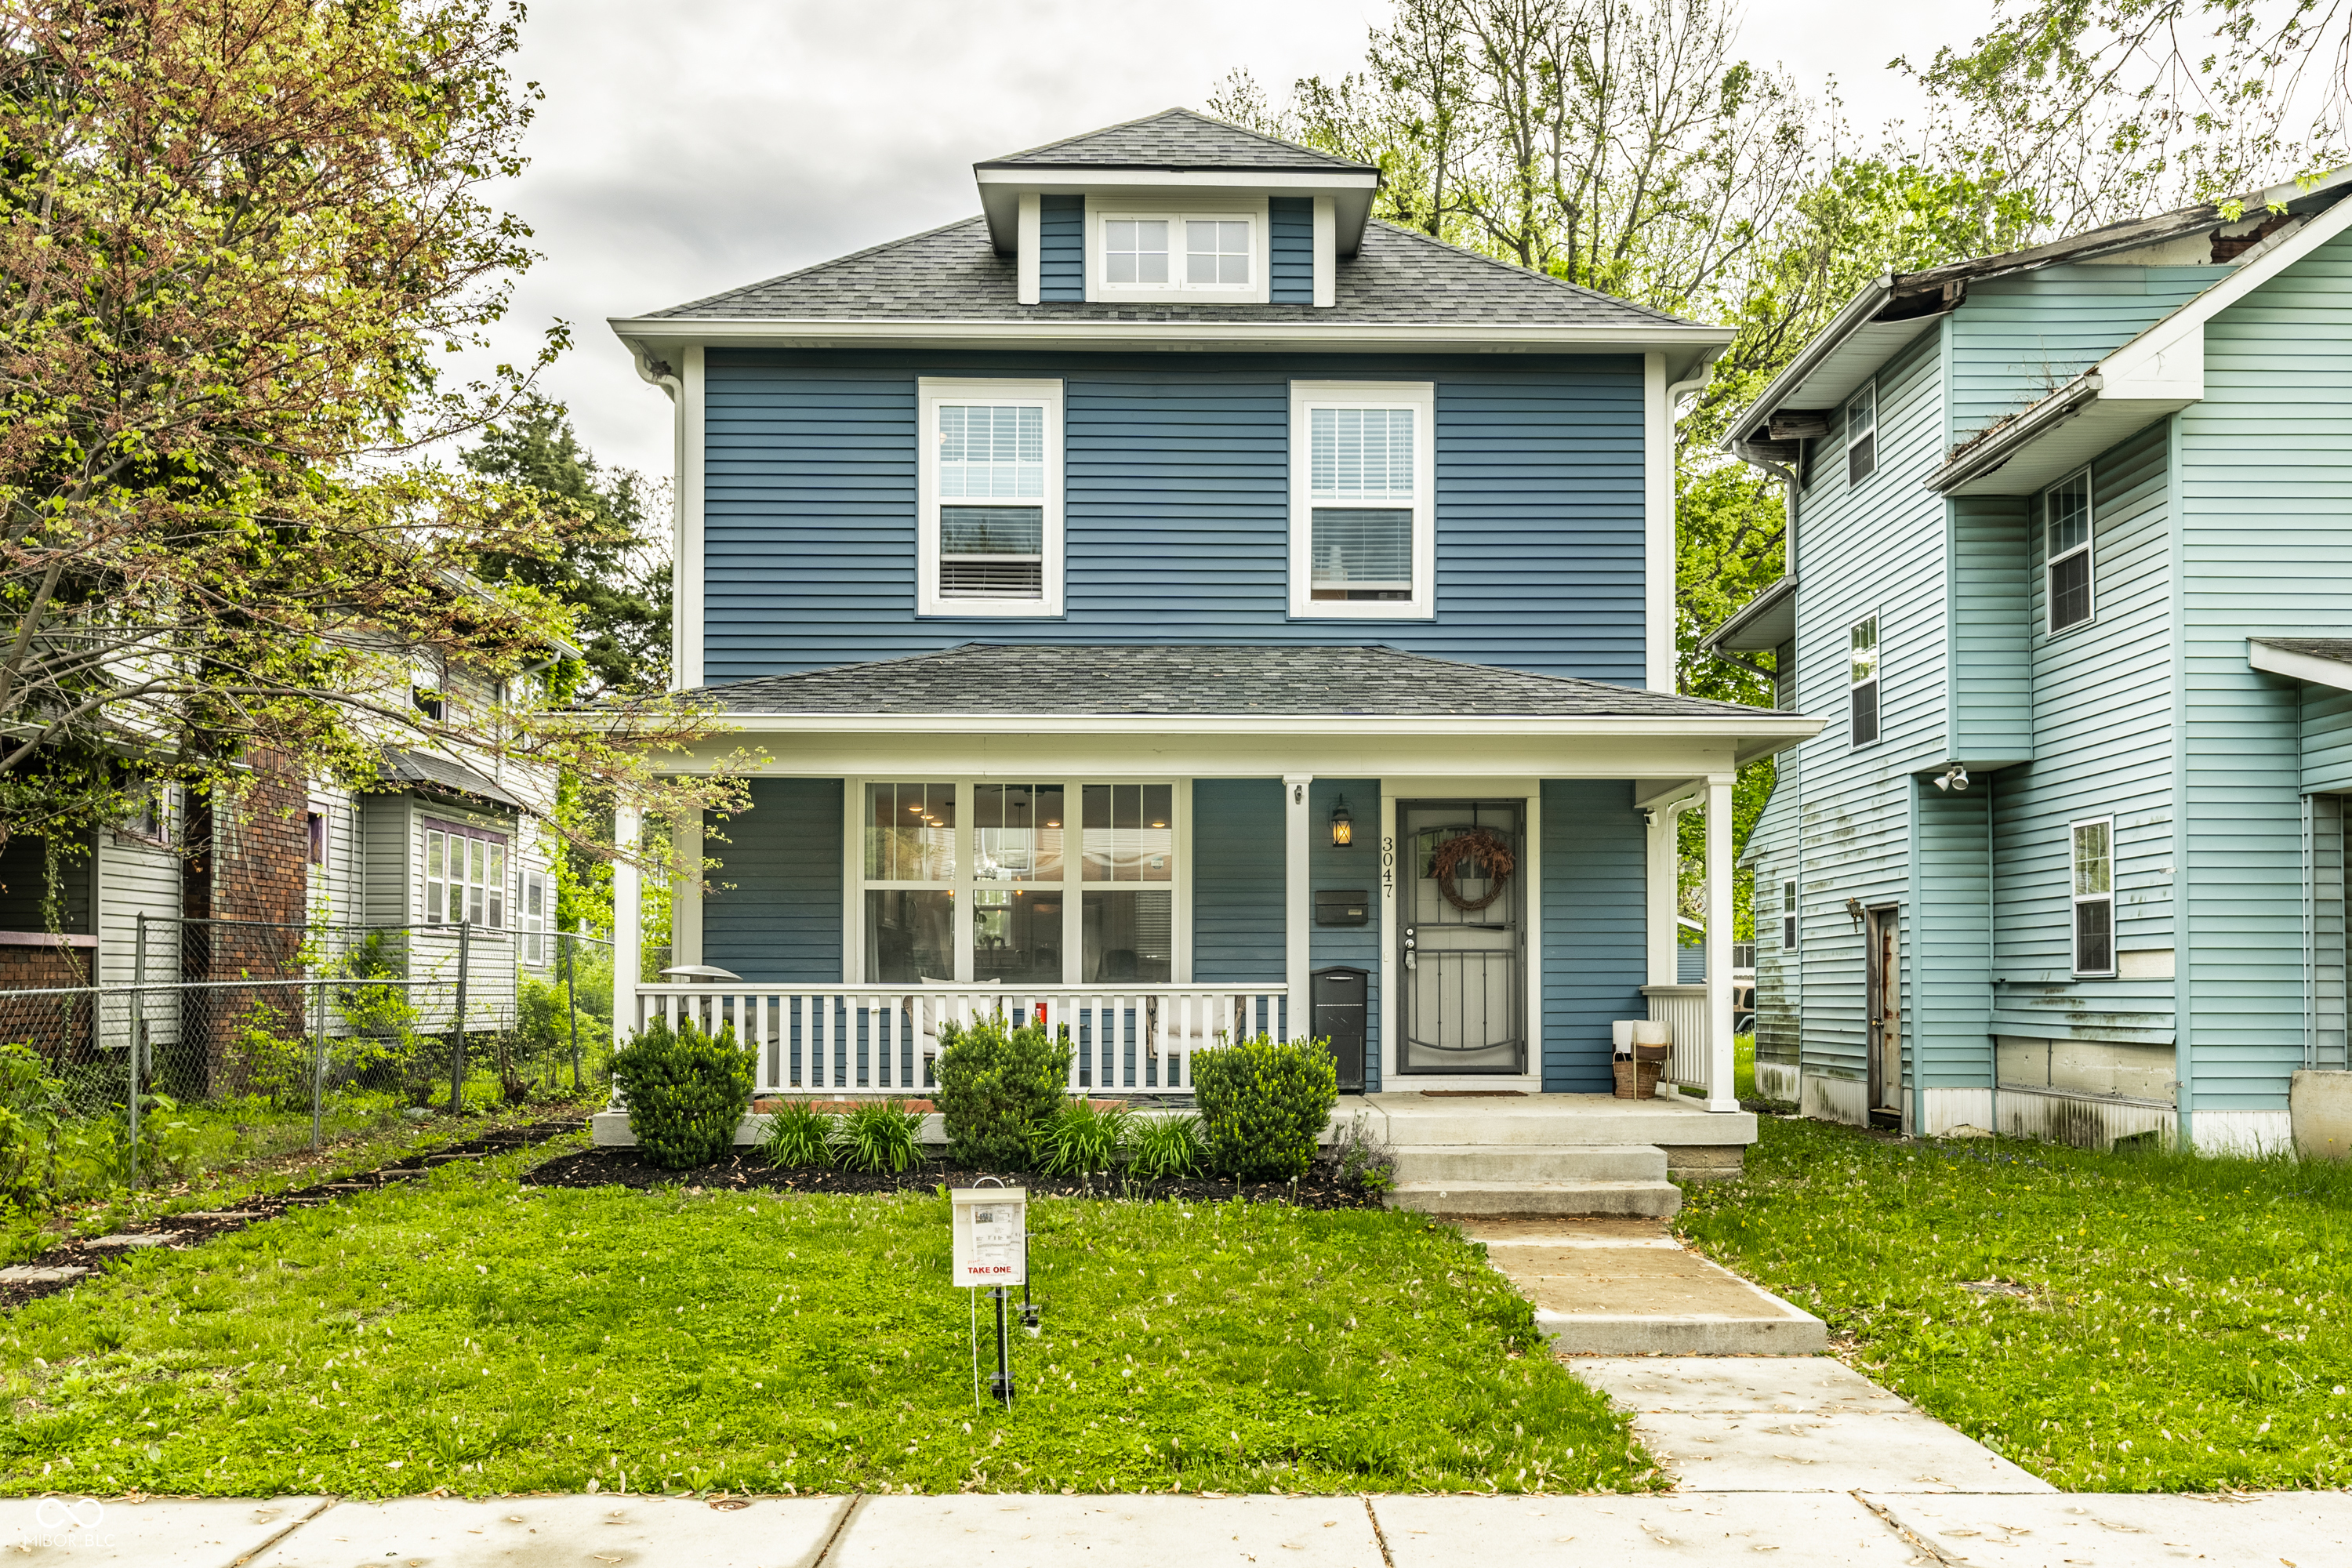
Active
$325,000
4
bds
|
3
ba
|
1,600
sqft
|
built
2018
3047 N New Jersey St, Indianapolis, IN 46205
$-184
Cash flow
-3.0%
Cash-on-Cash Return
5.6%
Cap rate
0.7%
Rent to Value Ratio
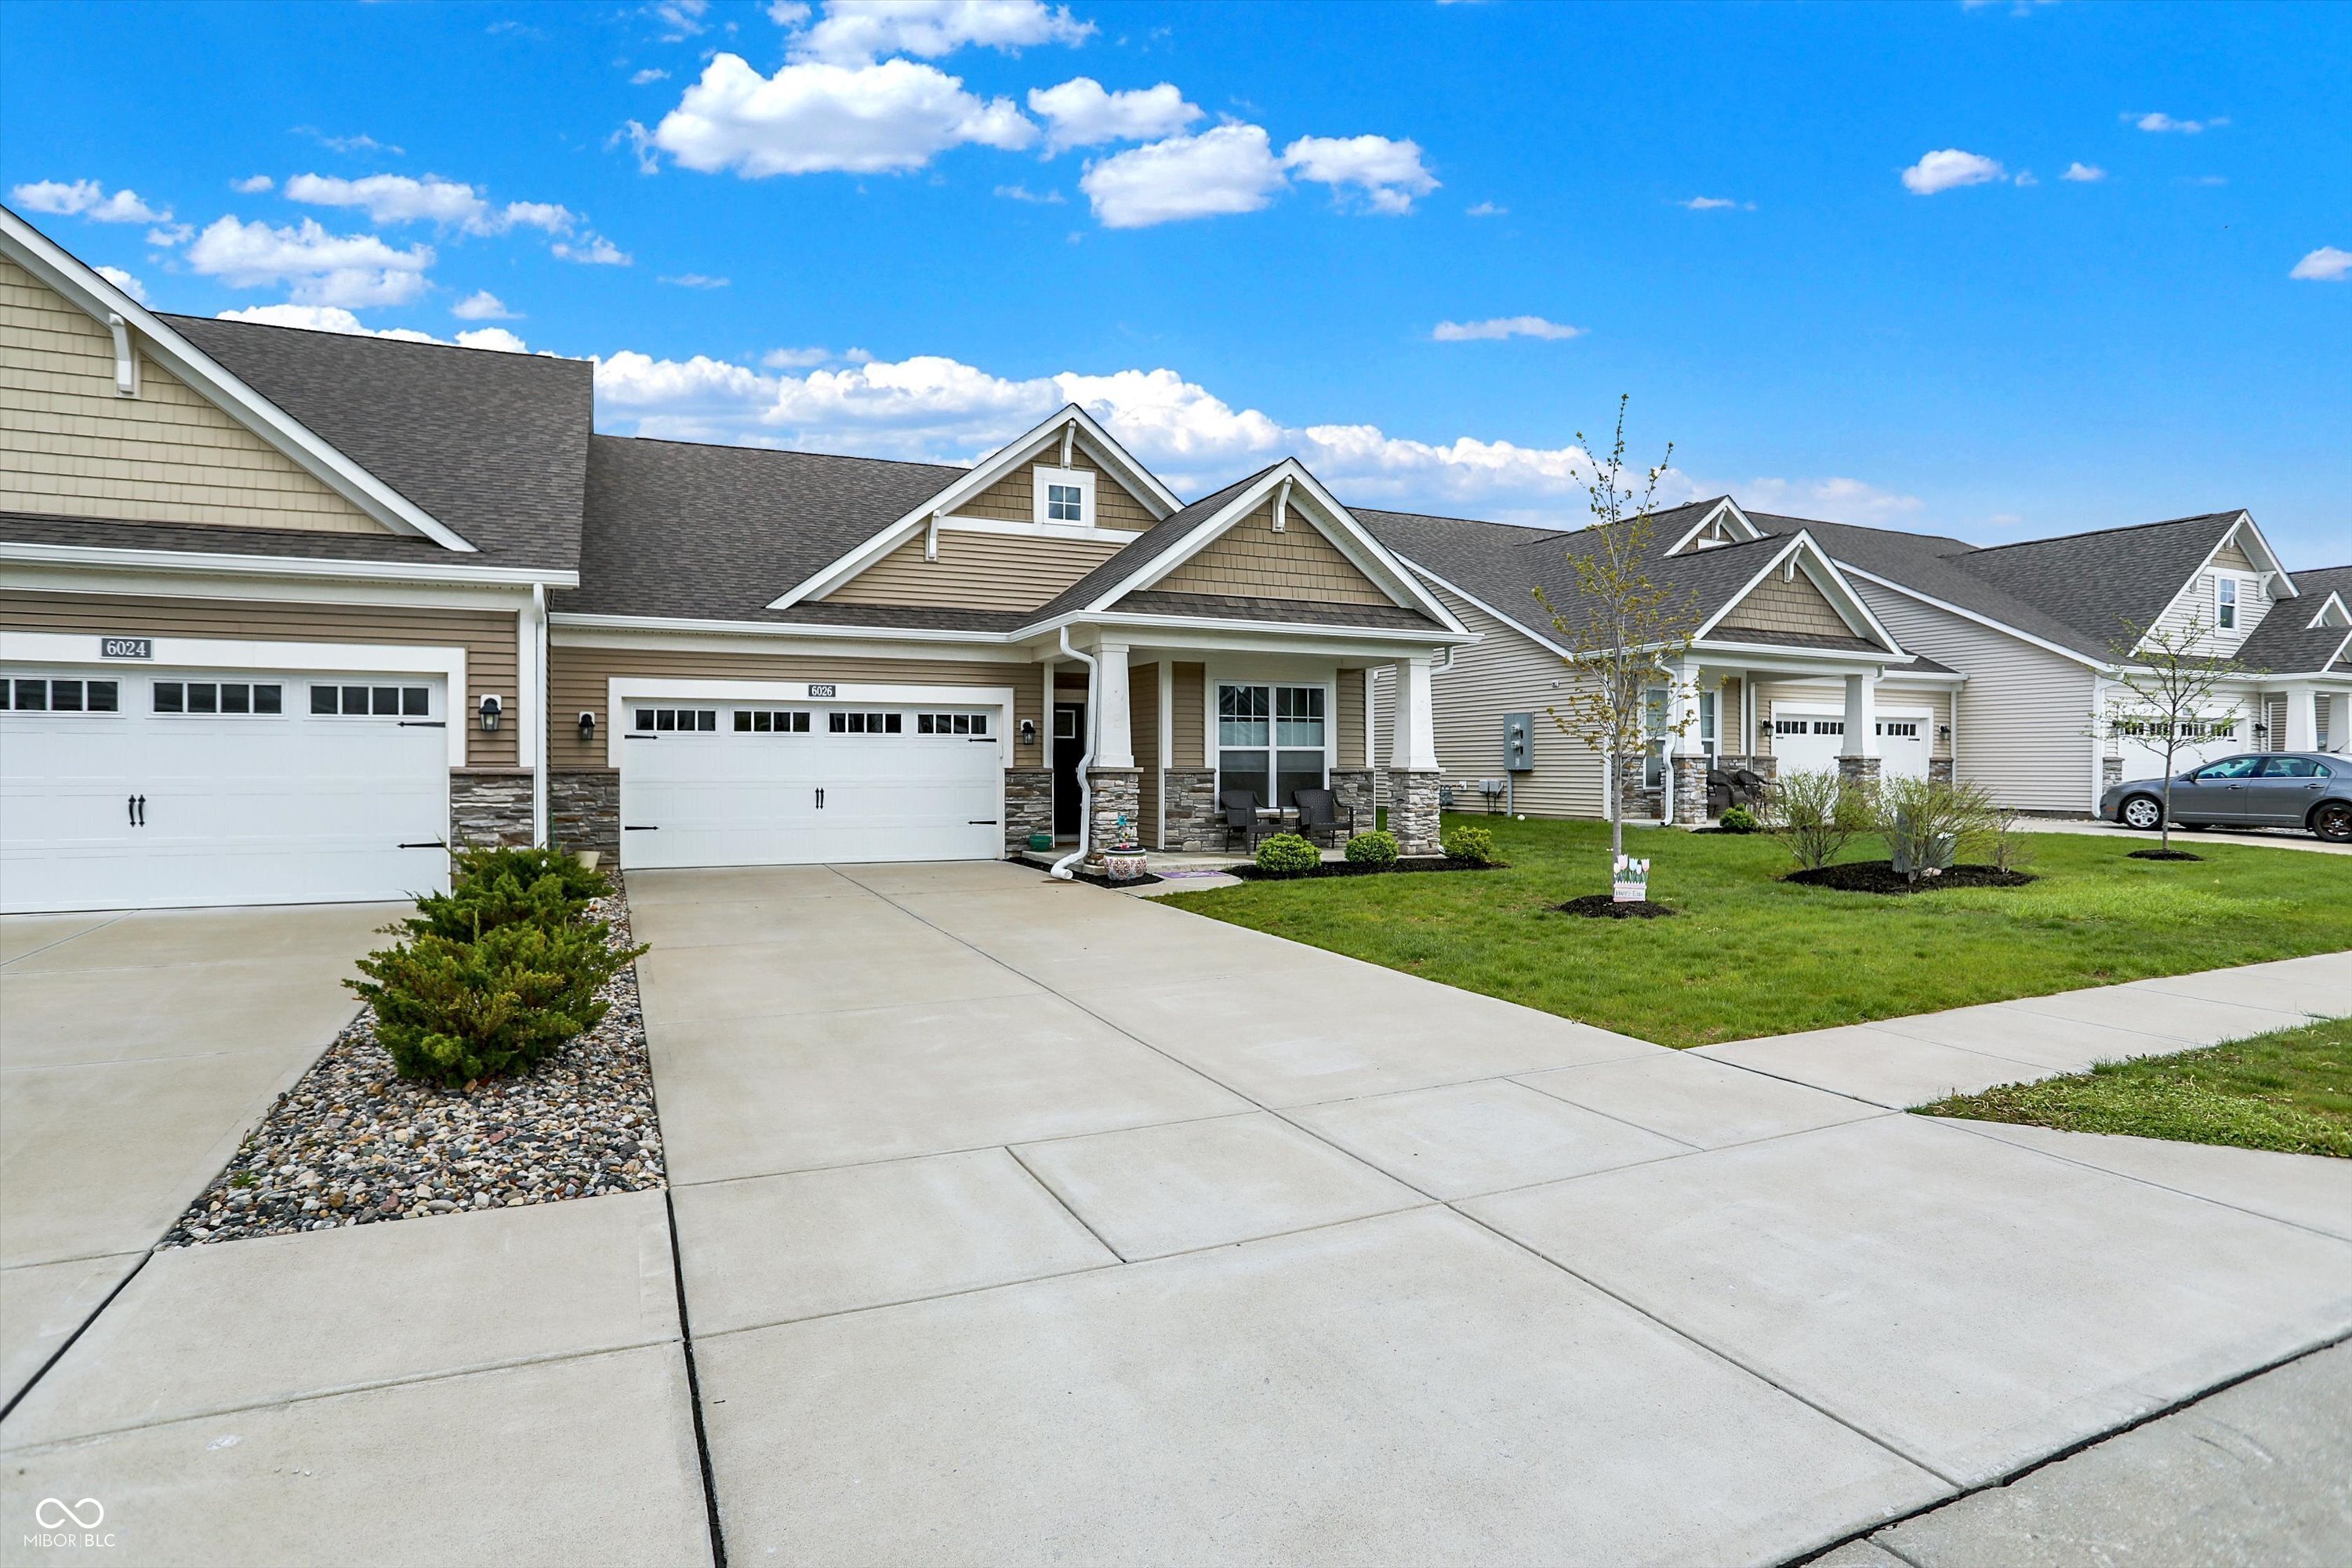
Active
$275,000
2
bds
|
2
ba
|
1,507
sqft
|
built
2018
6026 Rockdell Dr, Indianapolis, IN 46237
$-101
Cash flow
-1.9%
Cash-on-Cash Return
5.8%
Cap rate
0.7%
Rent to Value Ratio
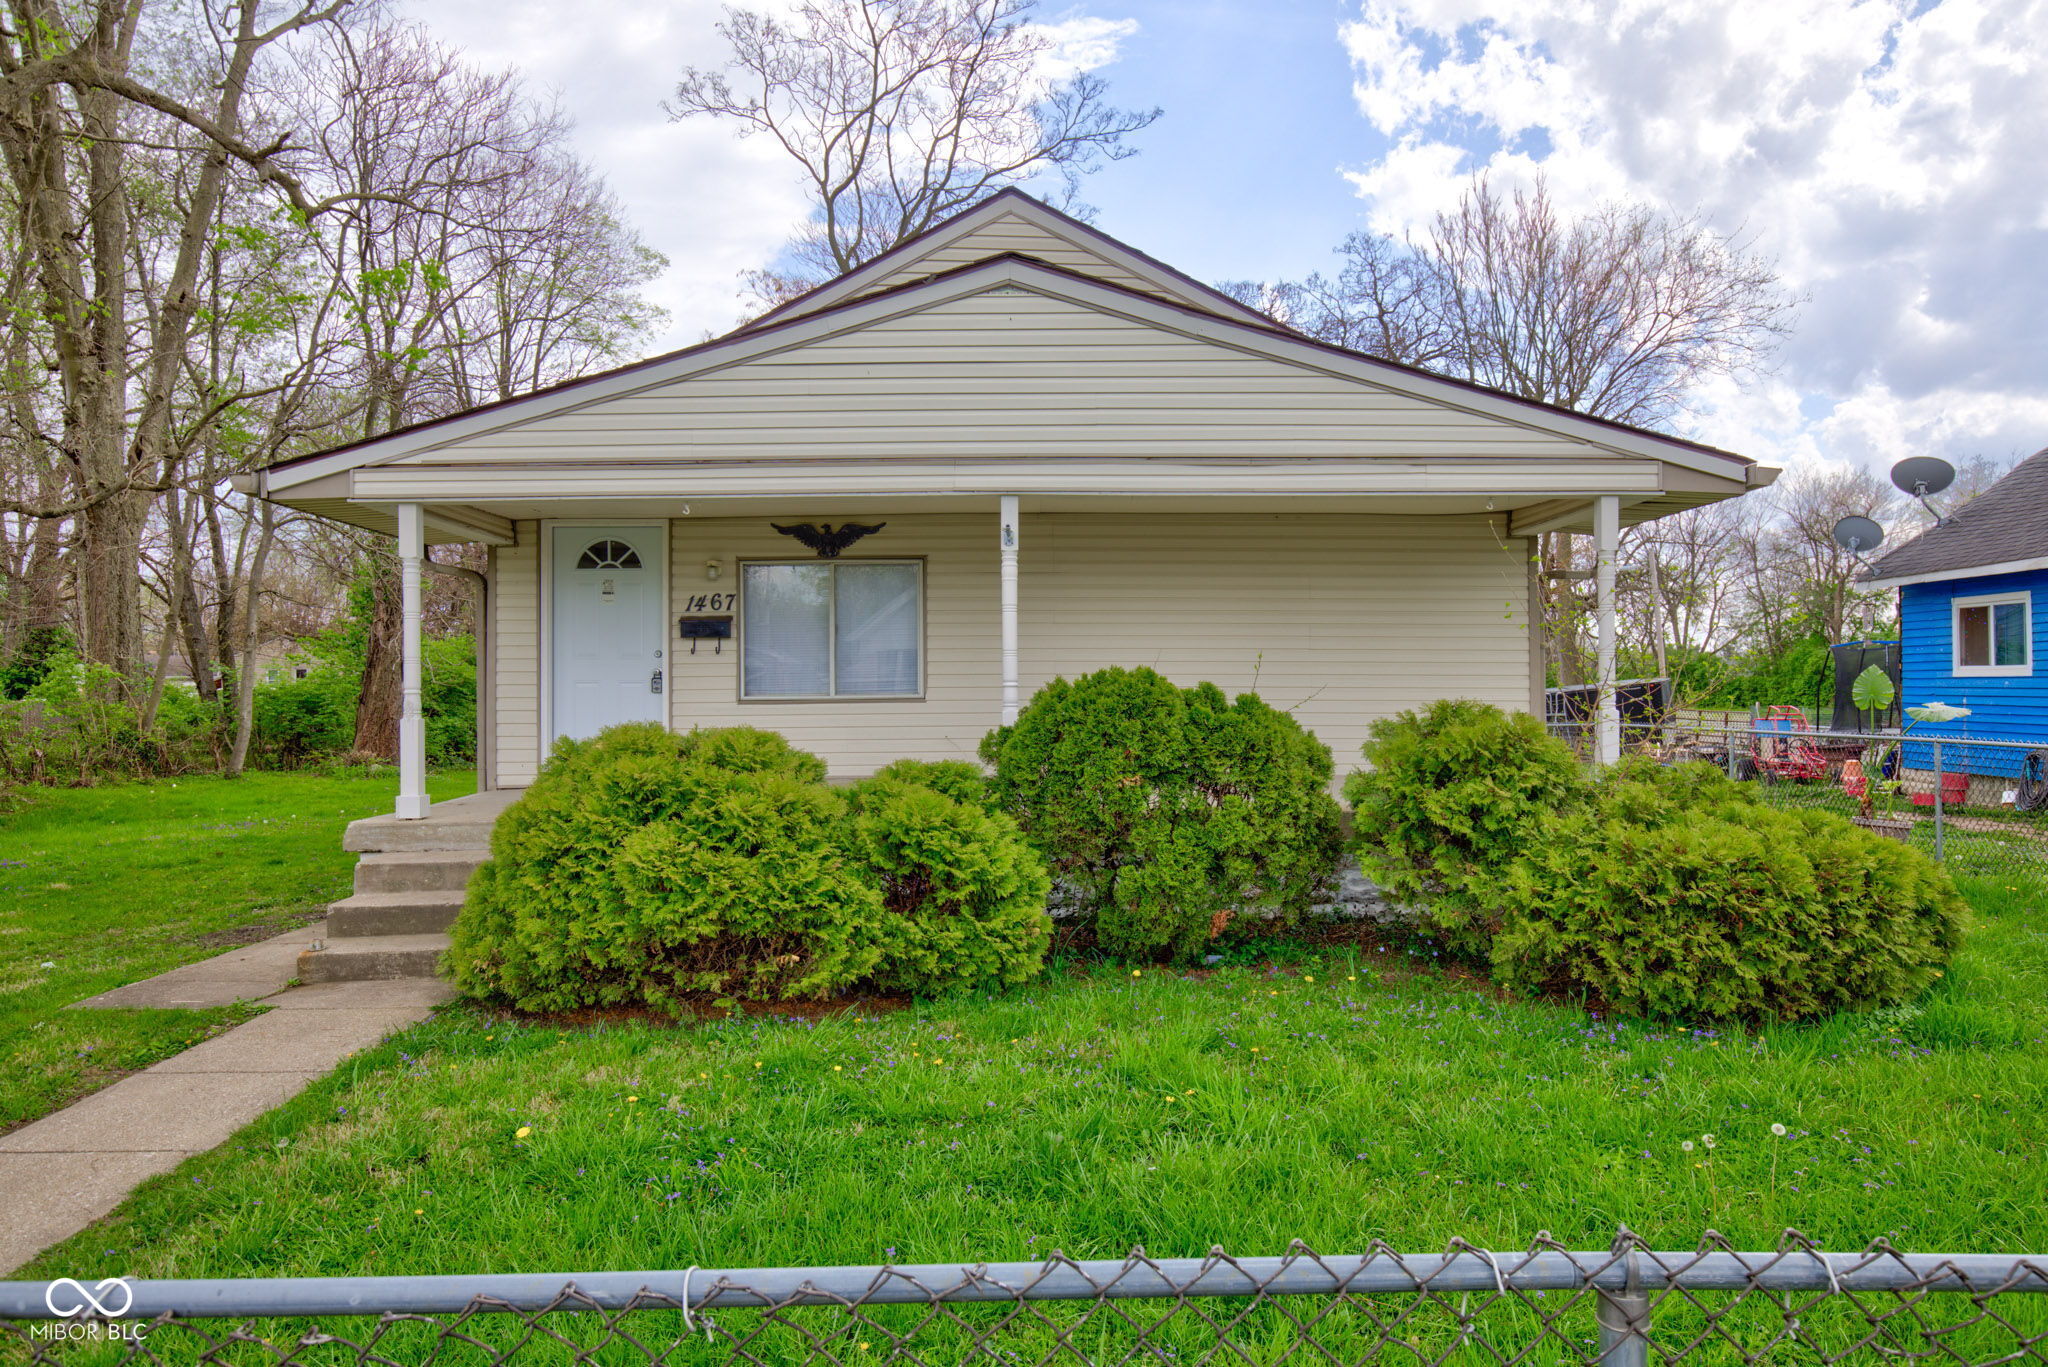
Active
$200,000
3
bds
|
2
ba
|
1,984
sqft
|
built
1930
1467 W 33rd St, Indianapolis, IN 46208
$-81
Cash flow
-2.1%
Cash-on-Cash Return
5.8%
Cap rate
0.7%
Rent to Value Ratio
Active
$539,500
3
bds
|
3
ba
|
3,294
sqft
|
built
2006
2037 Ruckle St, Indianapolis, IN 46202
$-410
Cash flow
-4.0%
Cash-on-Cash Return
5.4%
Cap rate
0.6%
Rent to Value Ratio
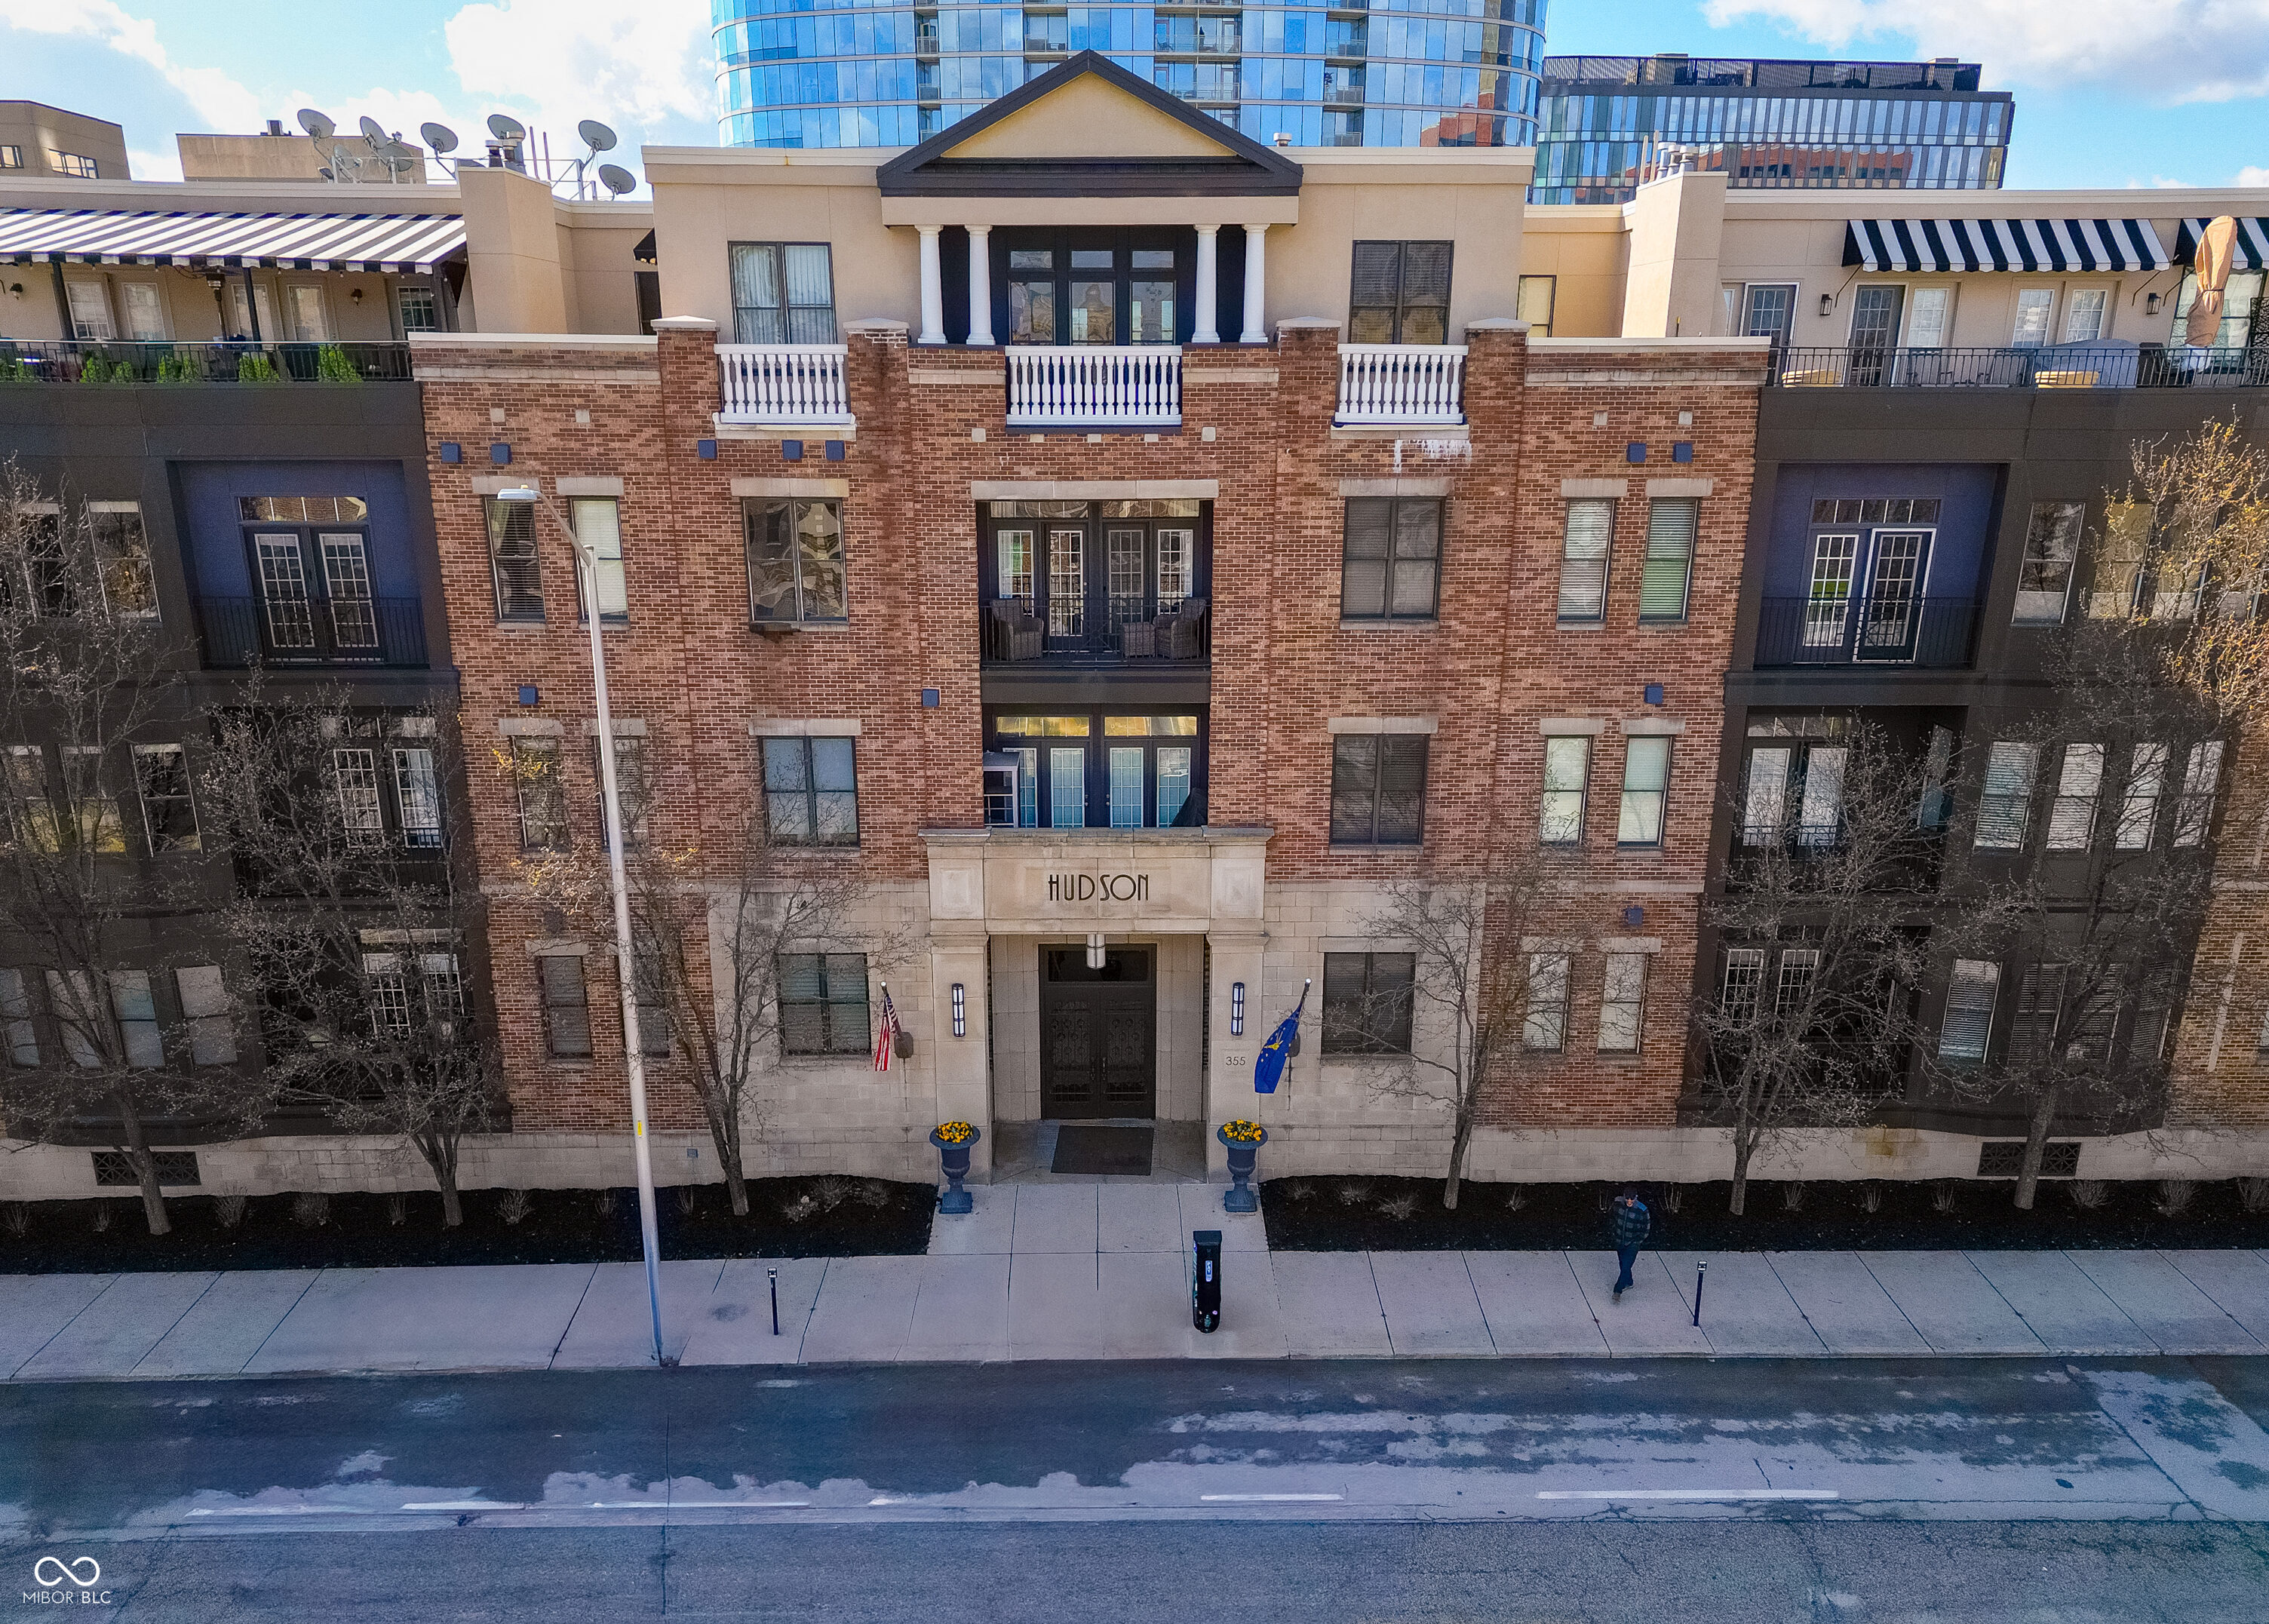
Active
$449,900
2
bds
|
2
ba
|
1,629
sqft
|
built
2006
355 E Ohio St, Indianapolis, IN 46204
$-776
Cash flow
-9.0%
Cash-on-Cash Return
4.2%
Cap rate
0.7%
Rent to Value Ratio
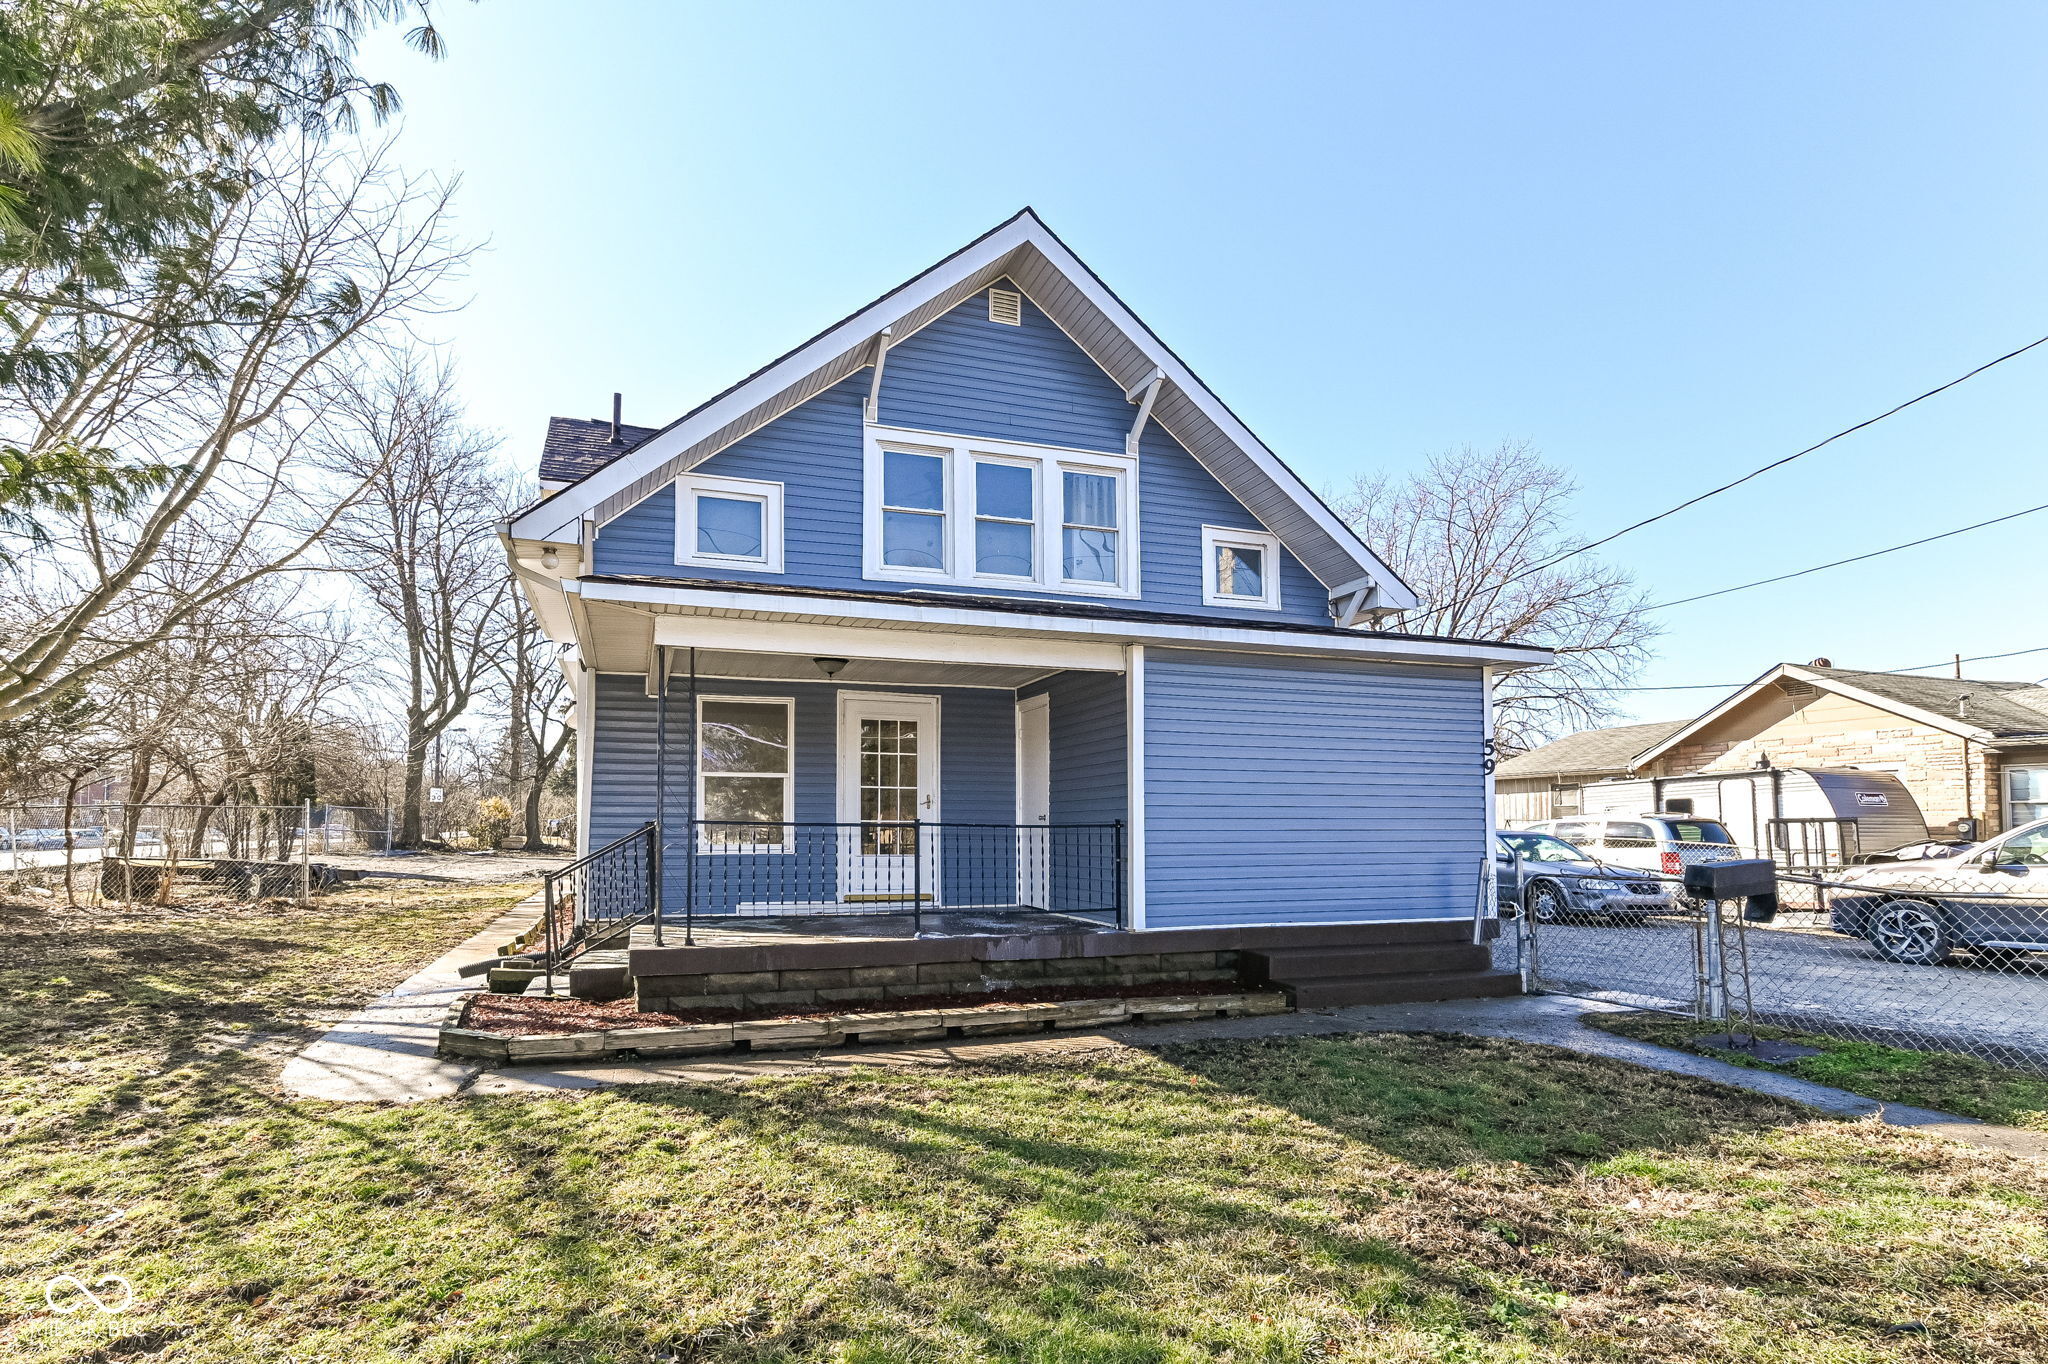
Active
$220,000
4
bds
|
3
ba
|
1,760
sqft
|
built
1910
59 E Troy Ave, Indianapolis, IN 46225
$-462
Cash flow
-11.0%
Cash-on-Cash Return
3.8%
Cap rate
0.5%
Rent to Value Ratio
Active
$284,950
2
bds
|
3
ba
|
1,585
sqft
|
built
1924
350 N Meridian St, Indianapolis, IN 46204
$-487
Cash flow
-8.9%
Cash-on-Cash Return
4.2%
Cap rate
0.9%
Rent to Value Ratio
Active
$112,900
2
bds
|
1
ba
|
720
sqft
|
built
1951
3305 E 30th St, Indianapolis, IN 46218
$444
Cash flow
20.5%
Cash-on-Cash Return
11.0%
Cap rate
1.3%
Rent to Value Ratio
Pending
$325,000
3
bds
|
2
ba
|
2,000
sqft
|
built
1964
7734 Hoover Rd, Indianapolis, IN 46260
$-115
Cash flow
-1.8%
Cash-on-Cash Return
5.9%
Cap rate
0.7%
Rent to Value Ratio
Pending
$695,000
5
bds
|
0
ba
|
0
sqft
|
built
1900
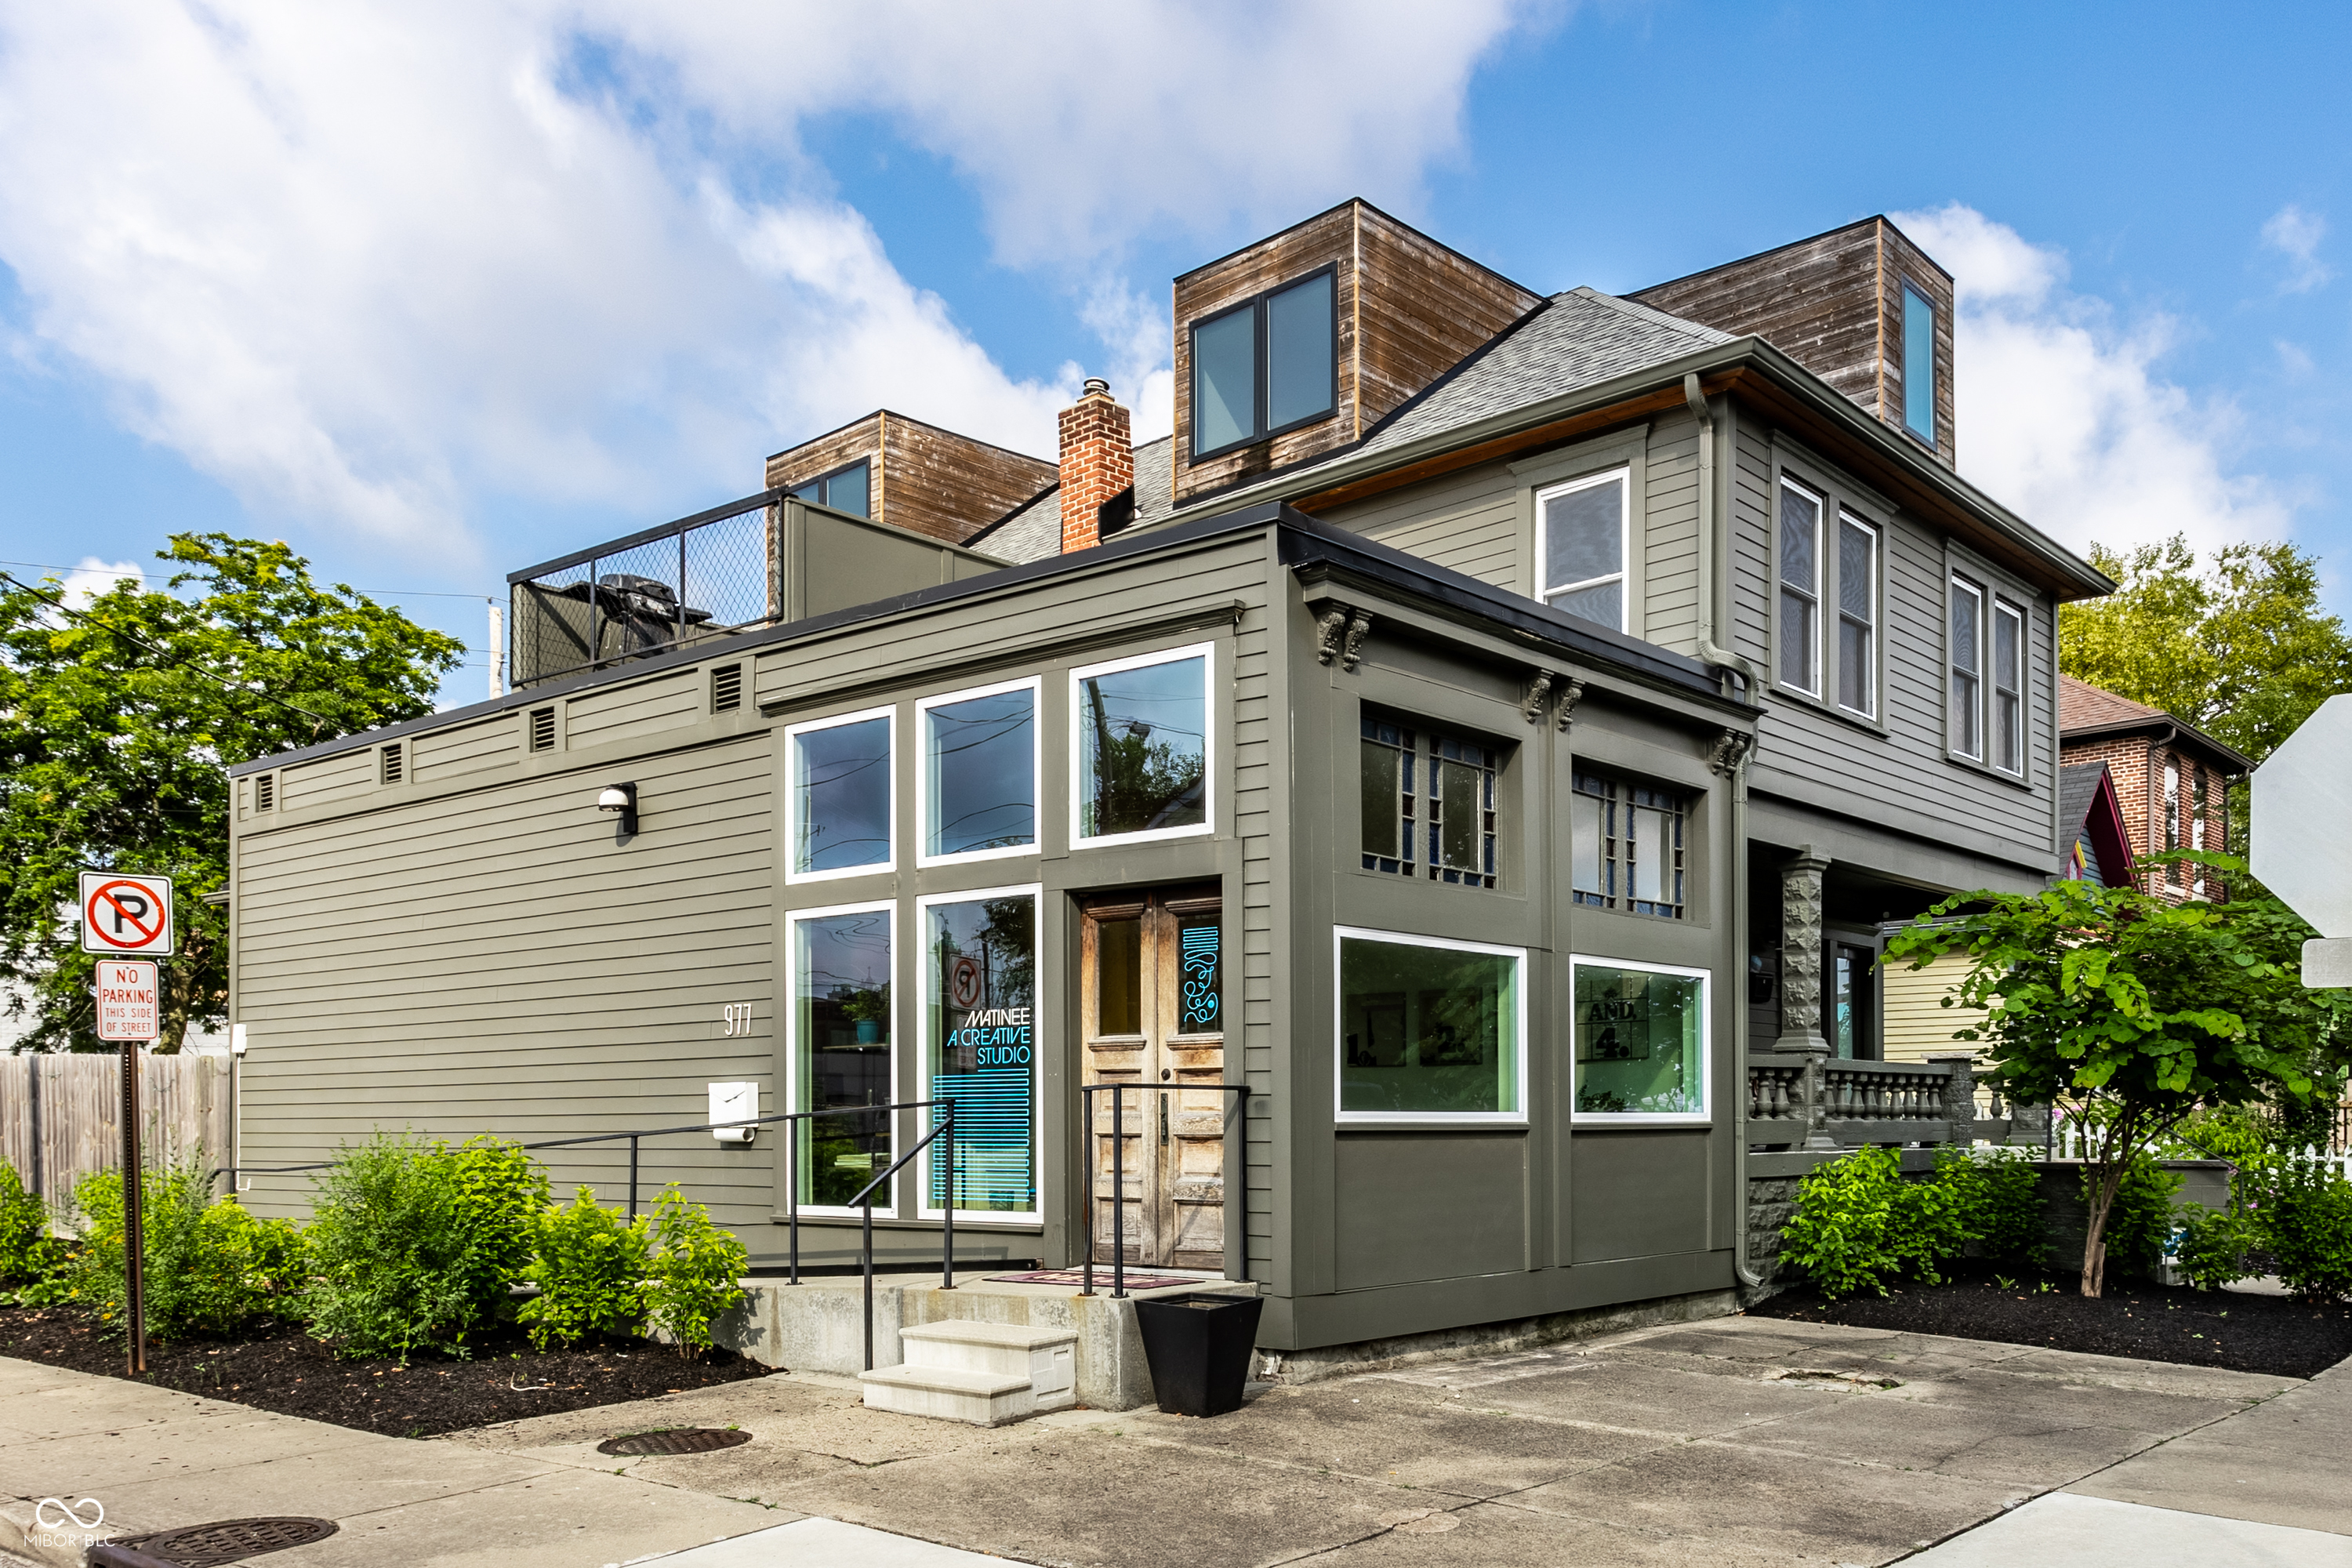
975 Hosbrook St, Indianapolis, IN 46203
$-1,846
Cash flow
-13.9%
Cash-on-Cash Return
3.1%
Cap rate
0.4%
Rent to Value Ratio
Active
$290,000
3
bds
|
3
ba
|
1,728
sqft
|
built
1901
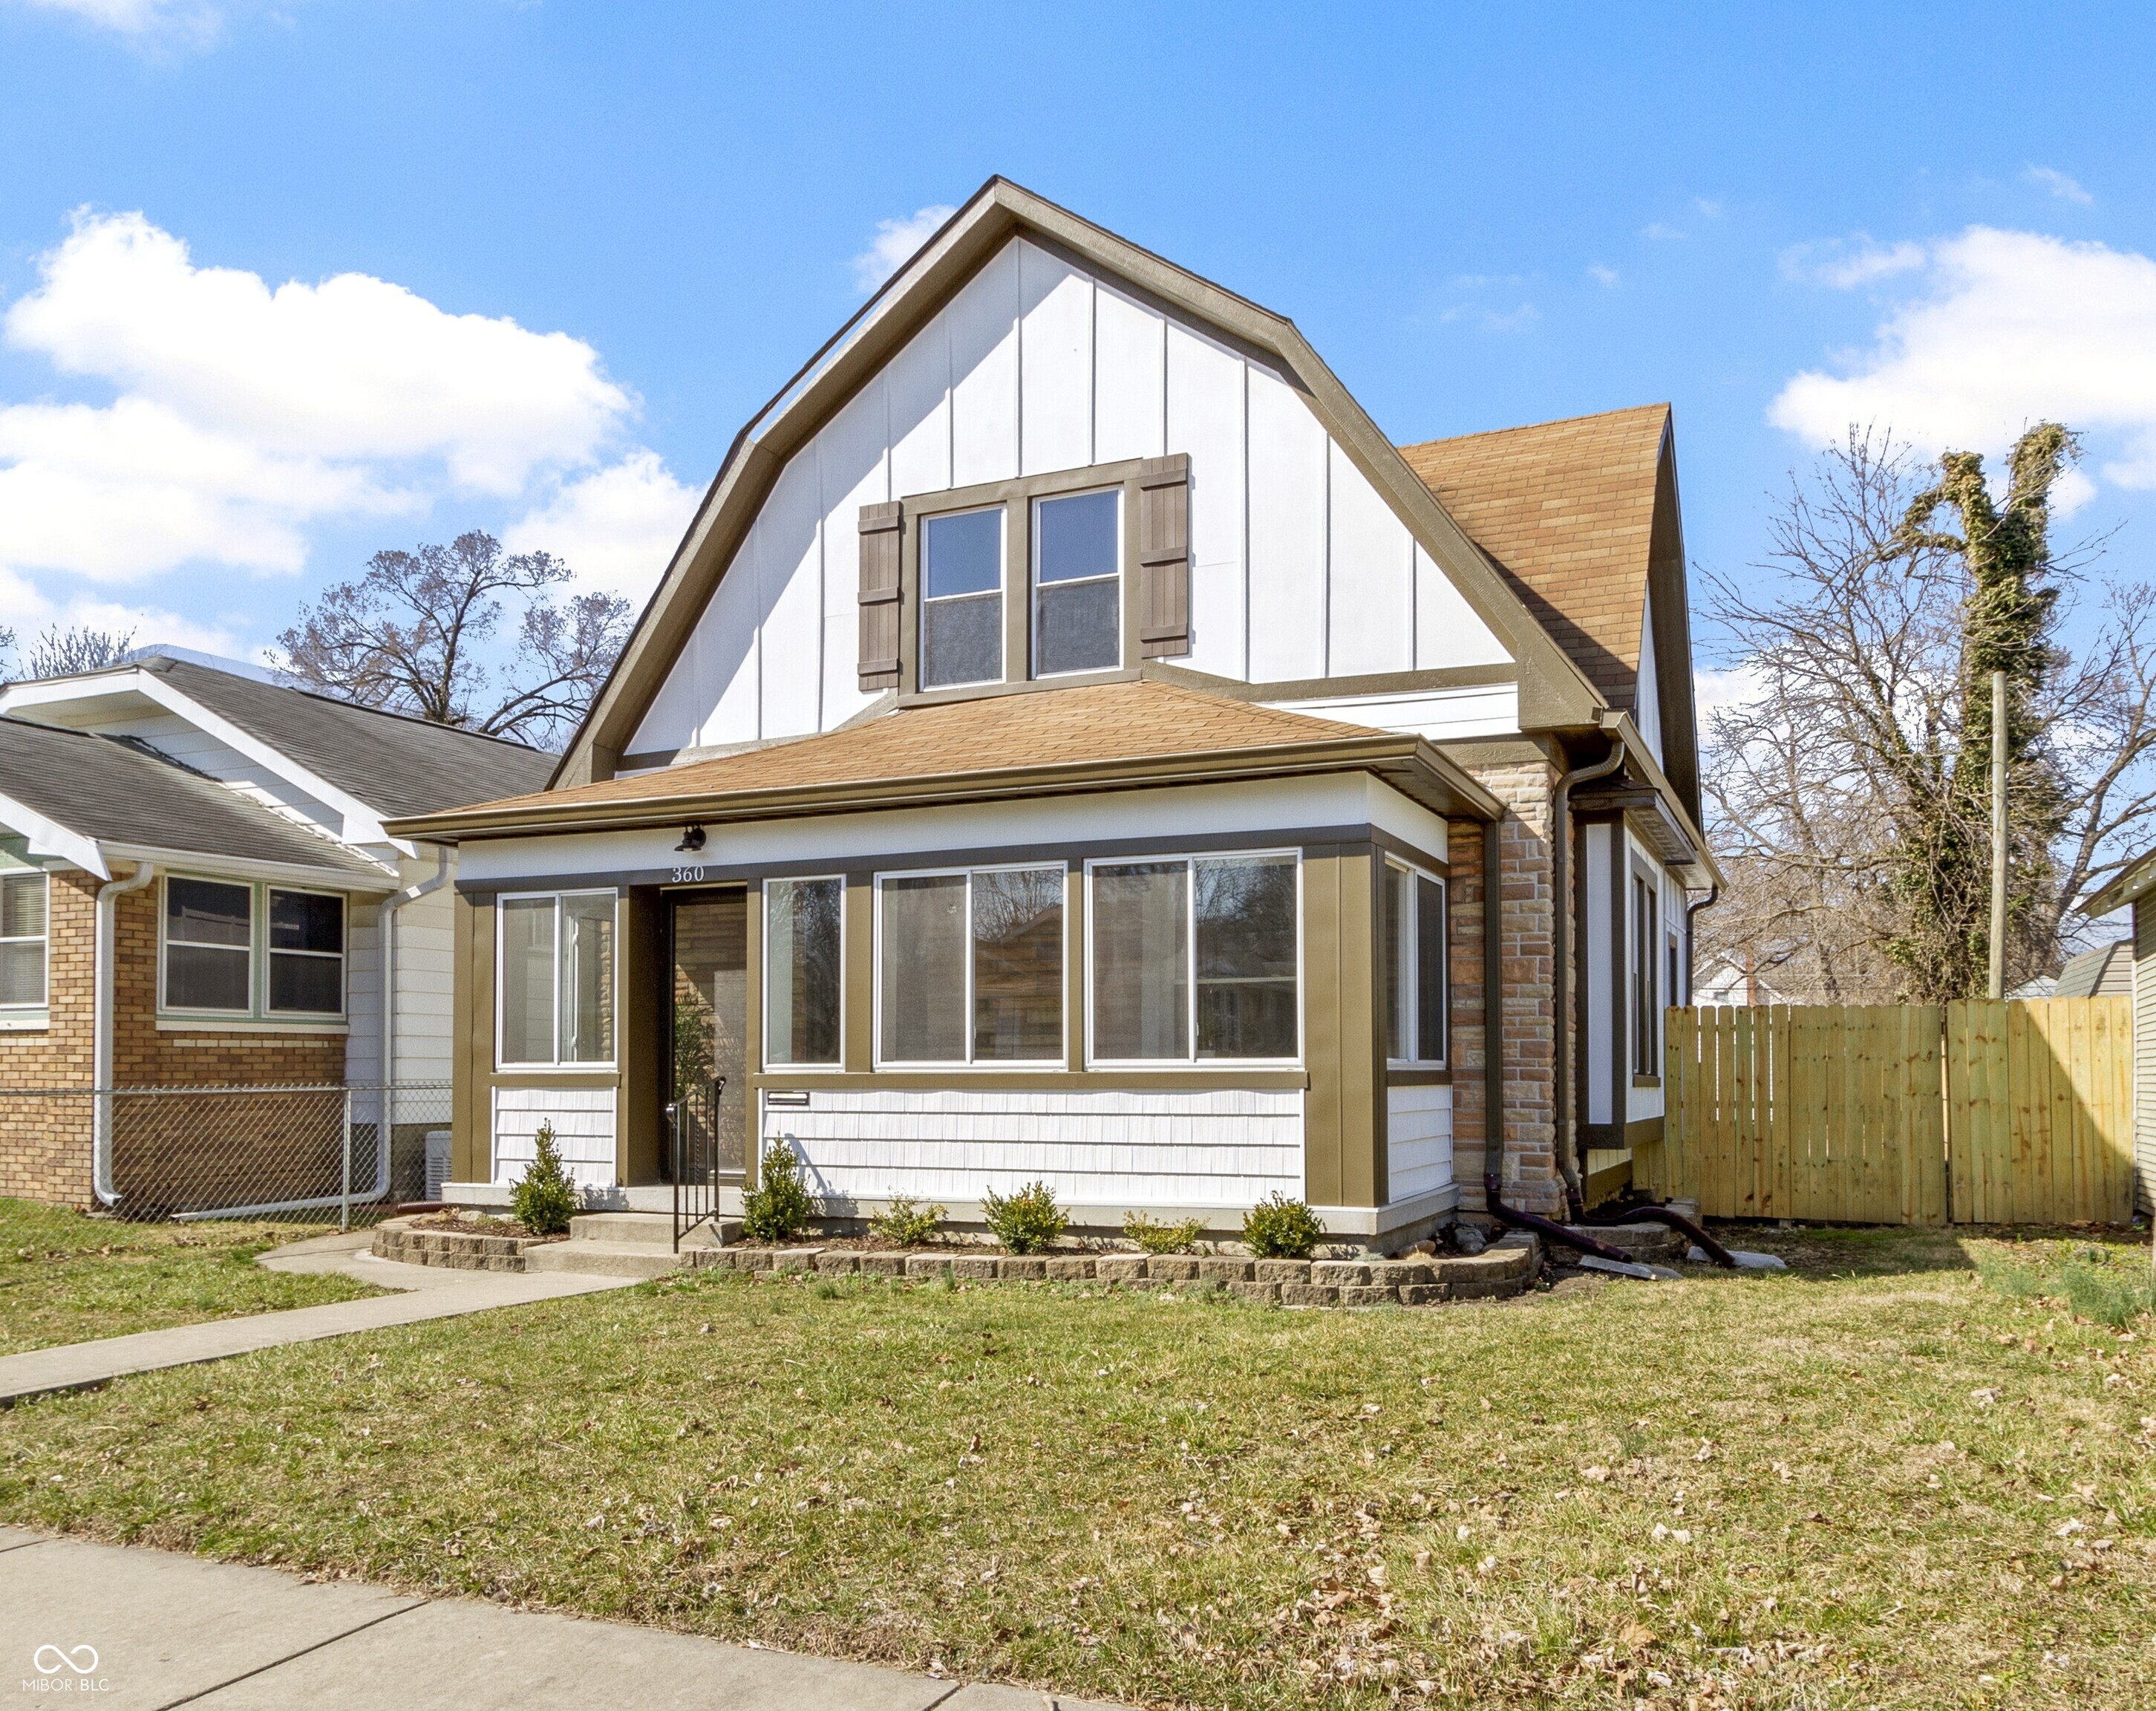
360 S Spencer Ave, Indianapolis, IN 46219
$-829
Cash flow
-14.9%
Cash-on-Cash Return
2.9%
Cap rate
0.3%
Rent to Value Ratio
Active
$600,000
5
bds
|
3
ba
|
2,454
sqft
|
built
1929
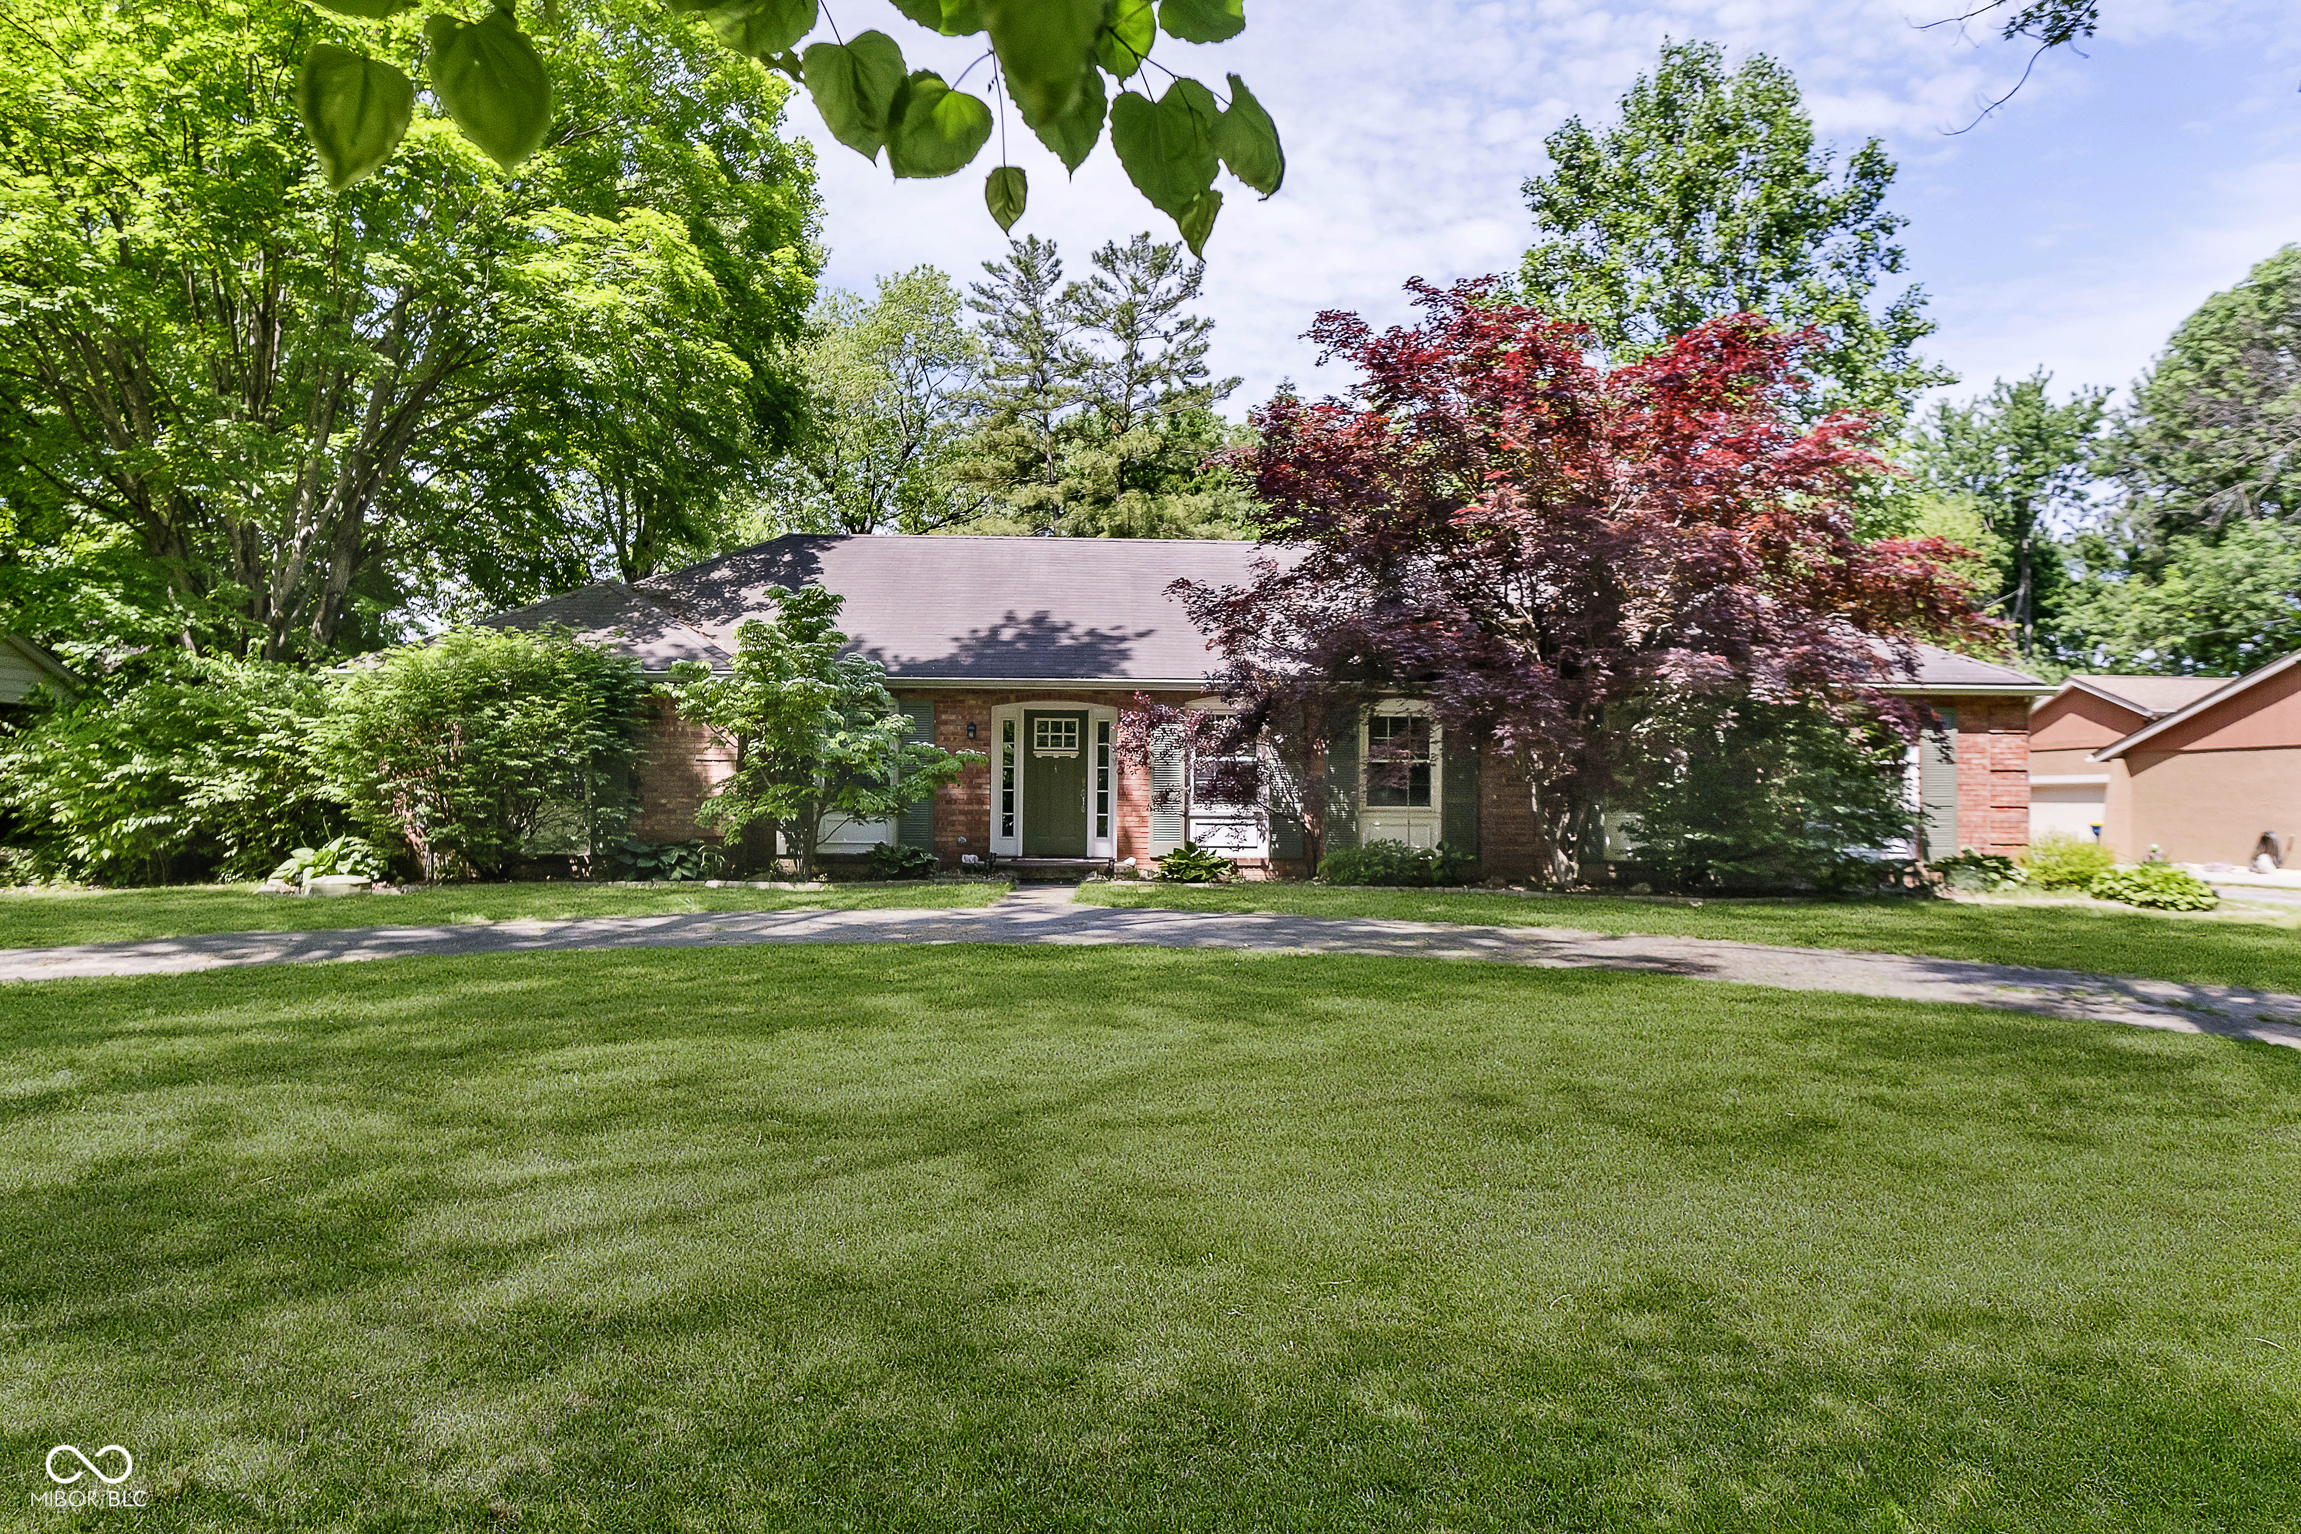
4302 Kessler Boulevard North Dr, Indianapolis, IN 46228
$-1,555
Cash flow
-13.5%
Cash-on-Cash Return
3.2%
Cap rate
0.4%
Rent to Value Ratio
Active
$499,900
4
bds
|
4
ba
|
4,055
sqft
|
built
1993
7341 Campfire Run, Indianapolis, IN 46236
$-485
Cash flow
-5.1%
Cash-on-Cash Return
5.1%
Cap rate
0.6%
Rent to Value Ratio
Active
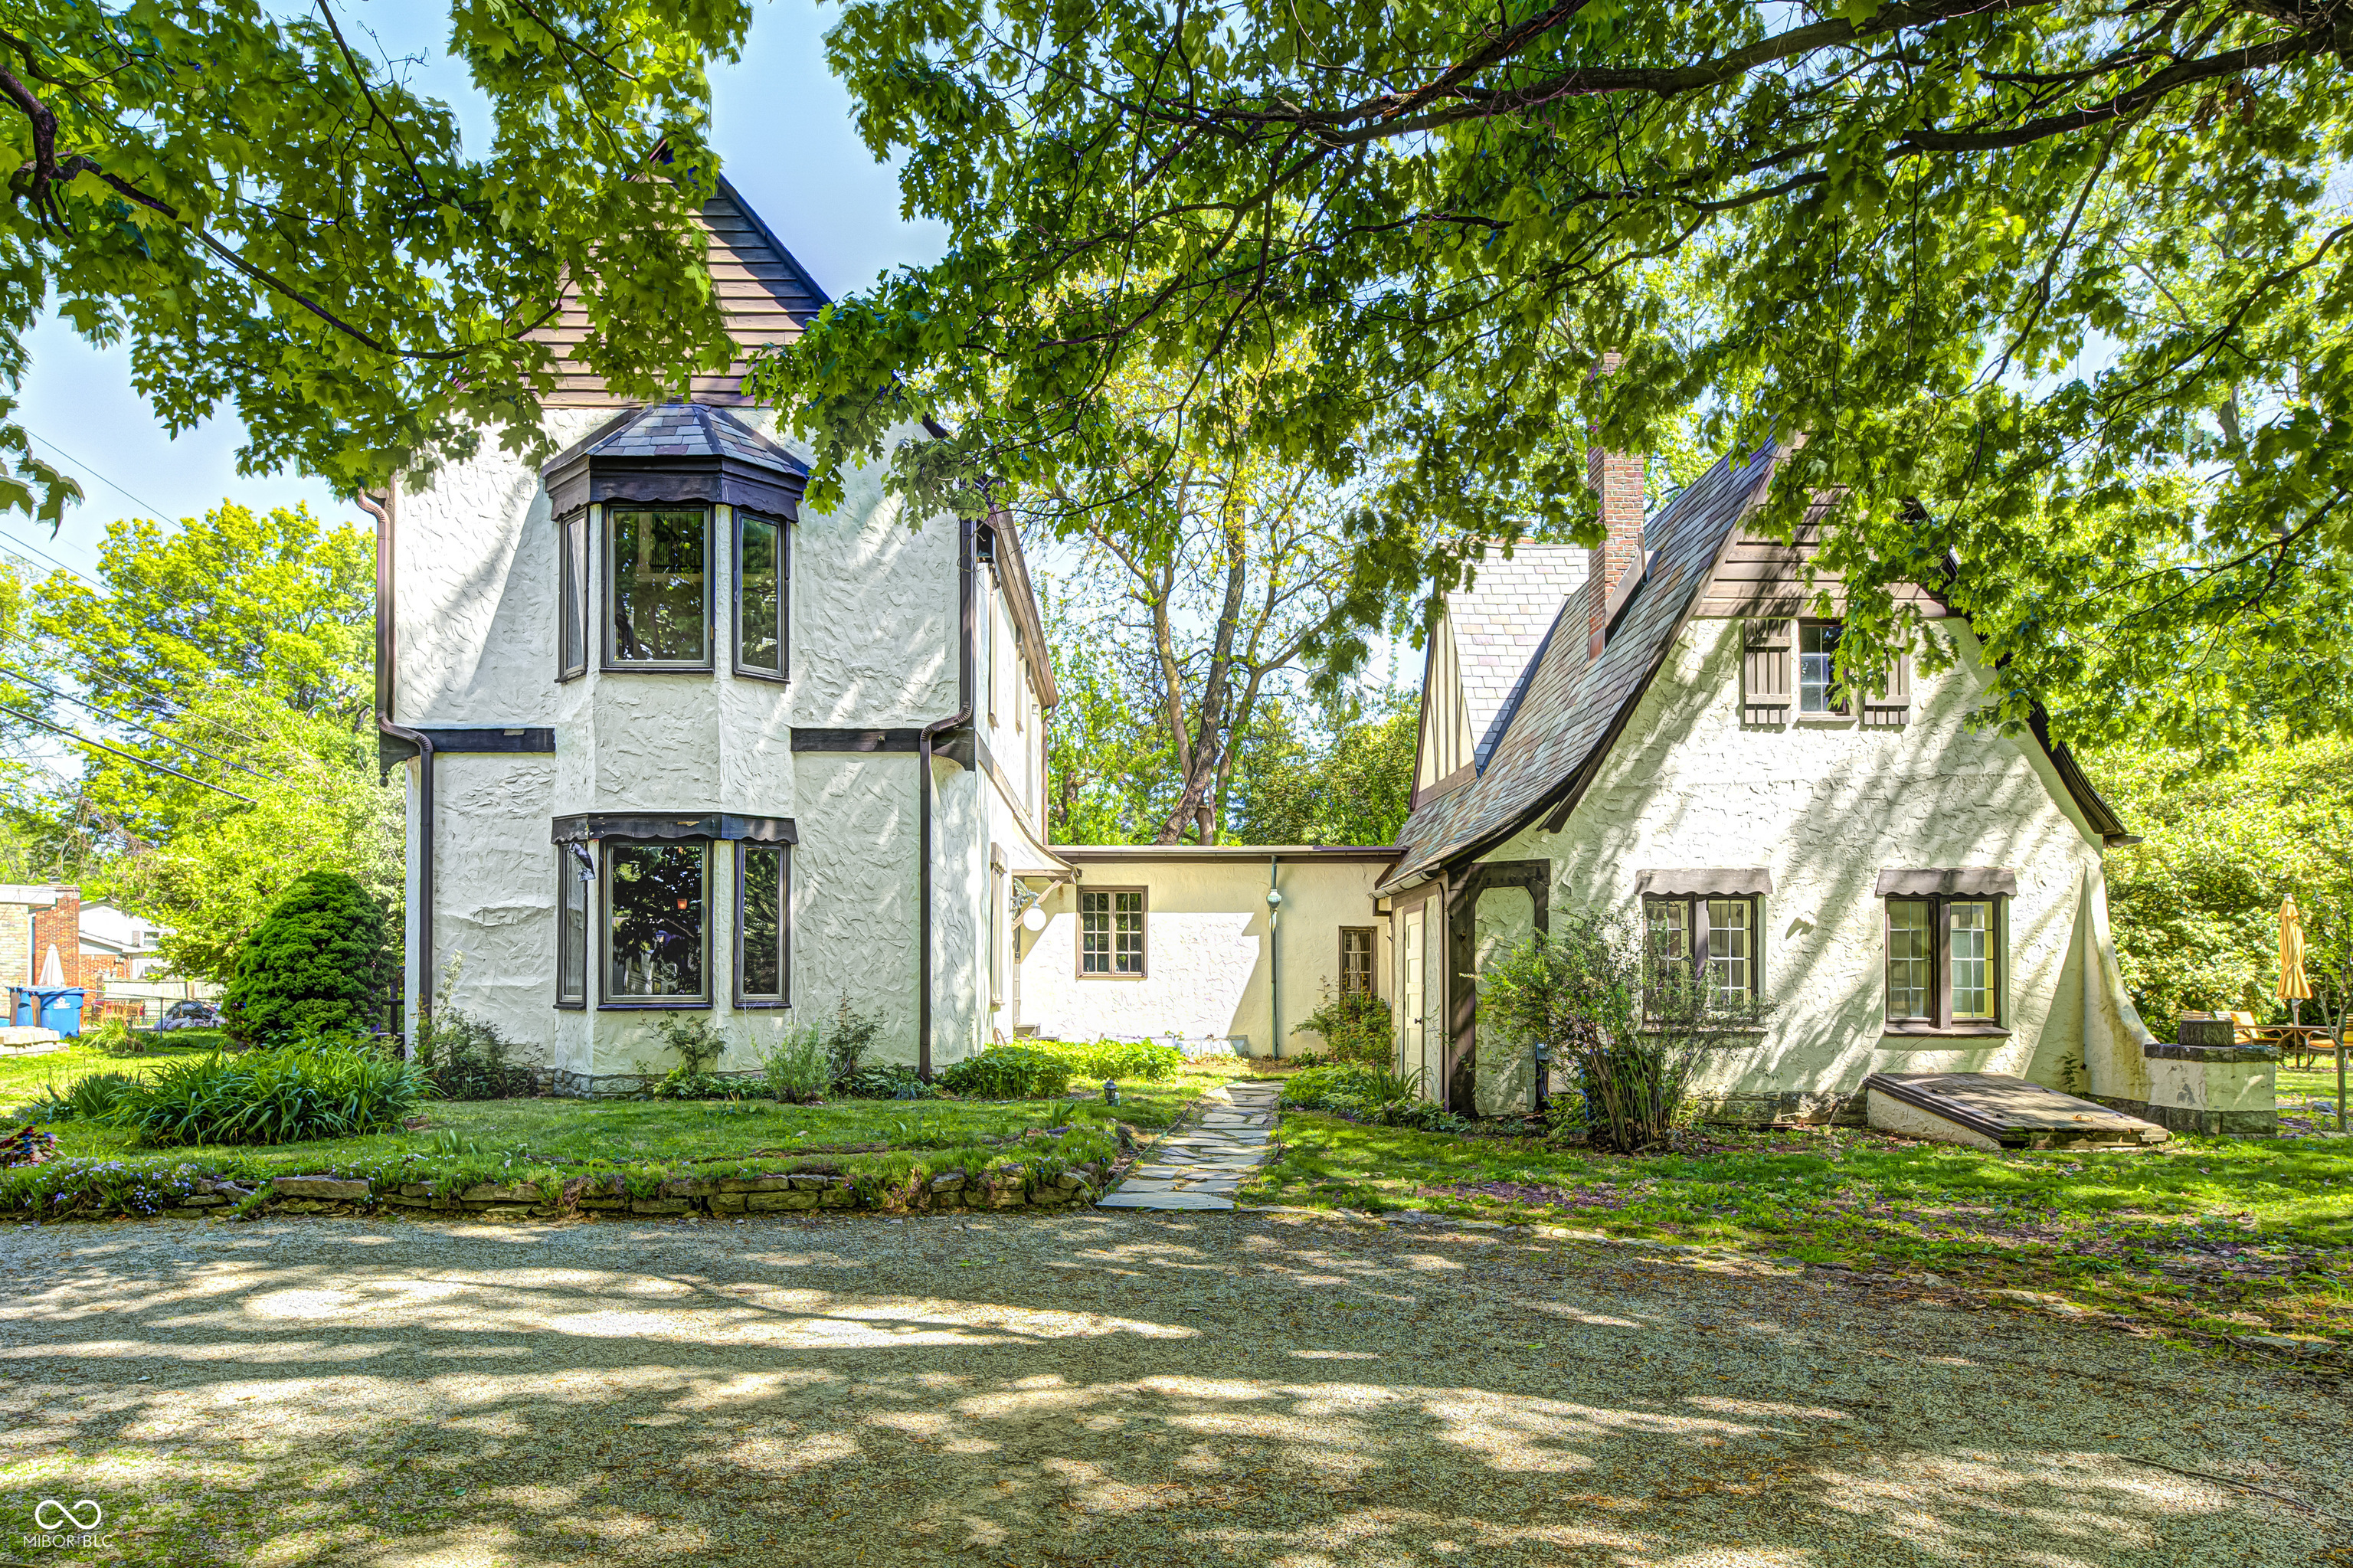
$549,900
3
bds
|
3
ba
|
2,672
sqft
|
built
2016
1409 Spann Ave, Indianapolis, IN 46203
$-396
Cash flow
-3.8%
Cash-on-Cash Return
5.4%
Cap rate
0.7%
Rent to Value Ratio
Active
$419,900
3
bds
|
0
ba
|
0
sqft
|
built
1909
4055 N College Ave, Indianapolis, IN 46205
$-1,233
Cash flow
-15.3%
Cash-on-Cash Return
2.8%
Cap rate
0.3%
Rent to Value Ratio