Indianapolis, IN Investment Properties for Sale
Browse homes for sale and investment properties in Indianapolis, IN. Refine your search by price, property type, or more.
Best cash flowing properties in Indianapolis, IN
Active
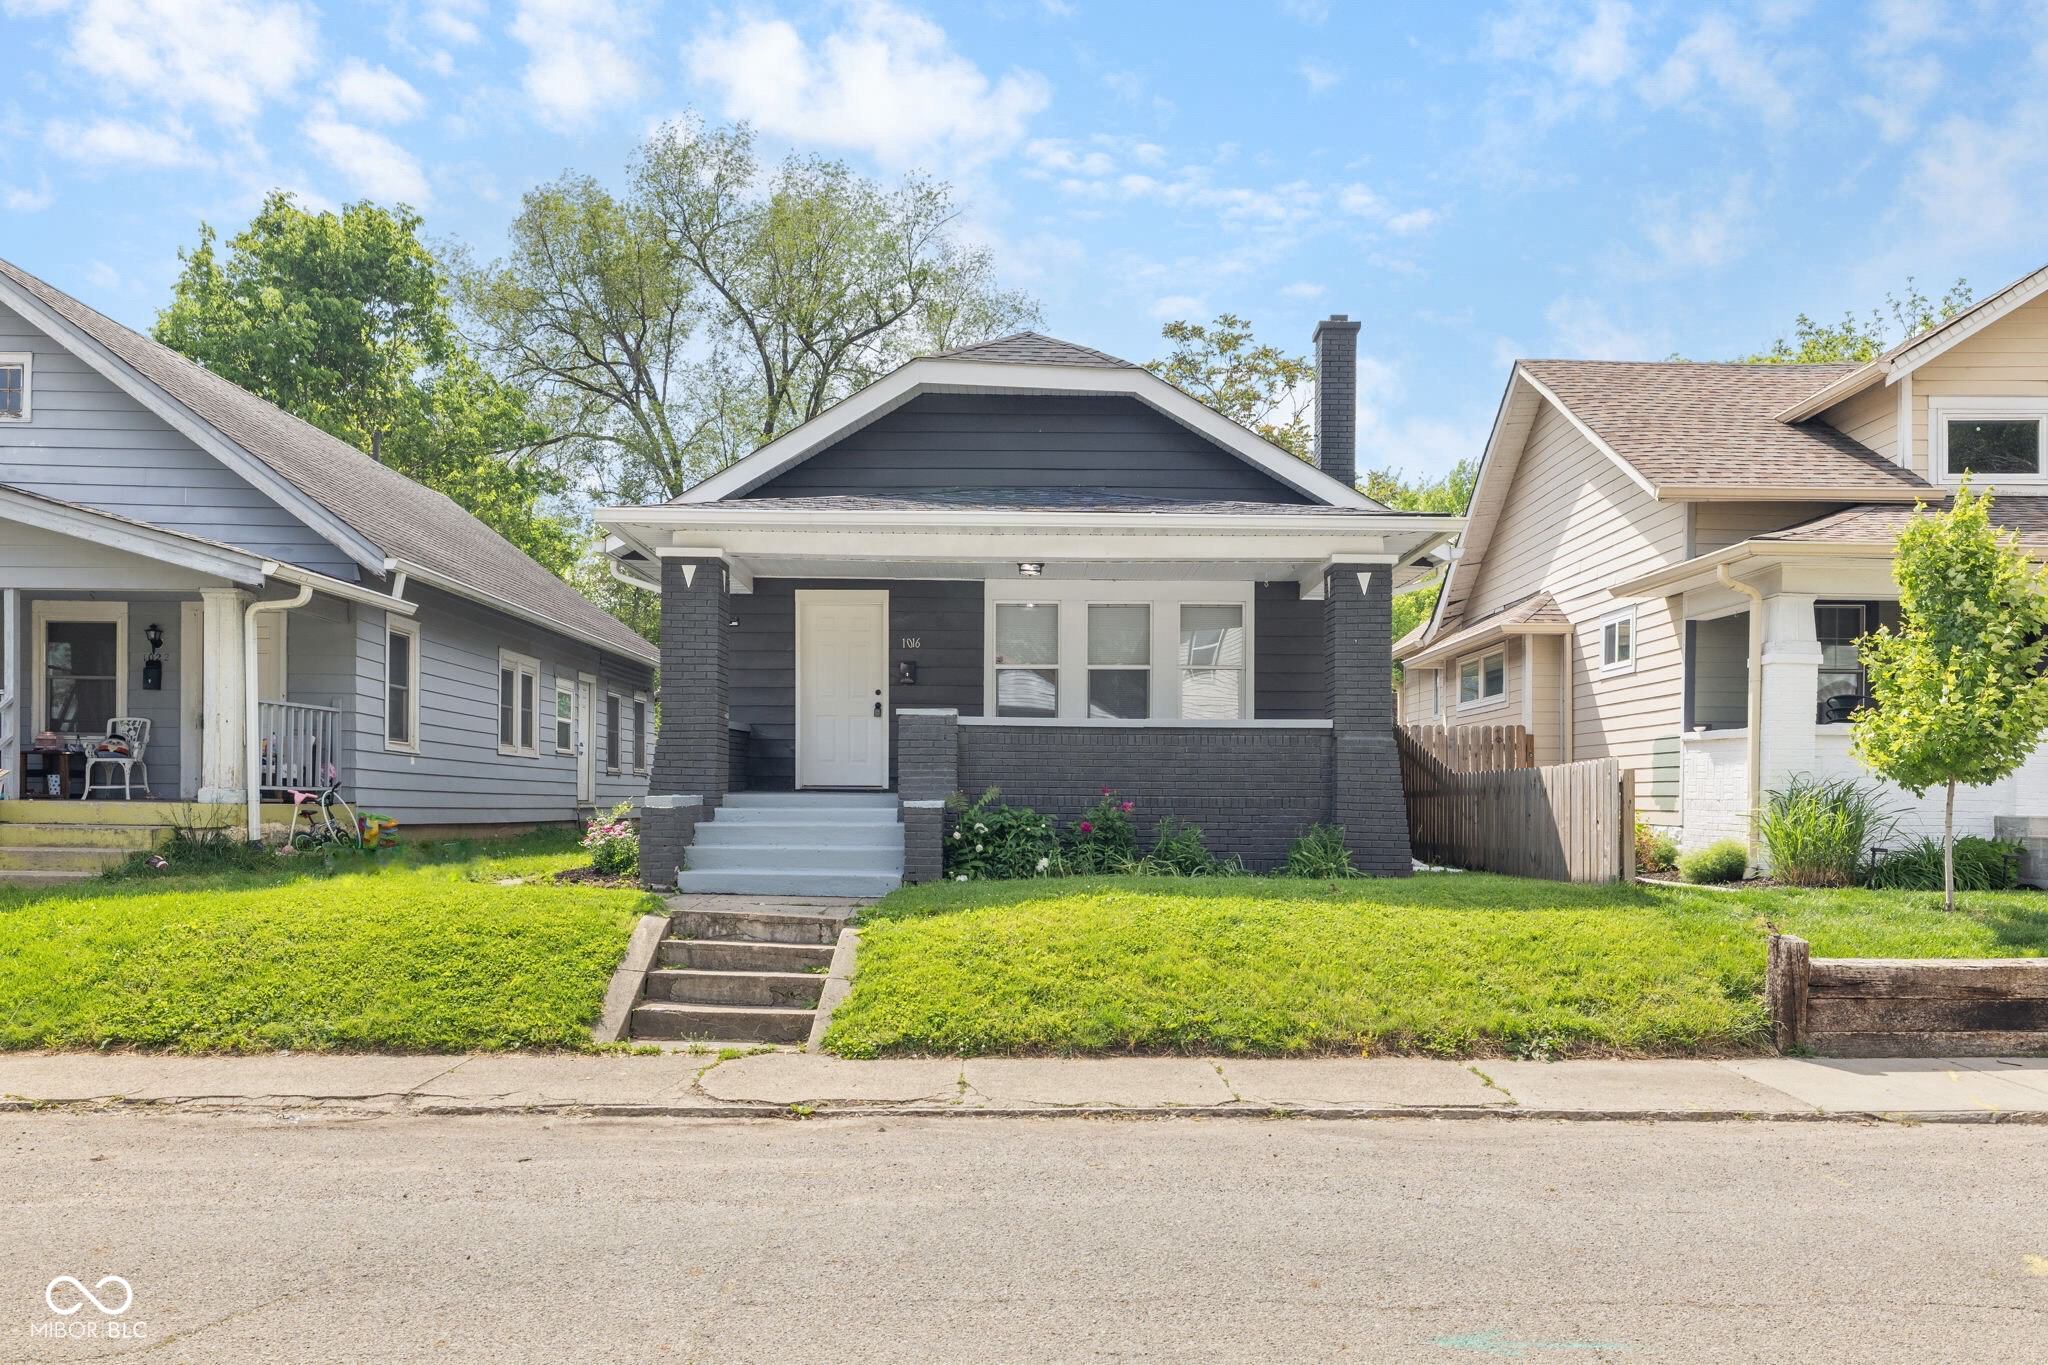
$249,900
3
bds
|
2
ba
|
1,344
sqft
|
built
1919
1016 Churchman Ave, Indianapolis, IN 46203
$485
Cash flow
10.1%
Cash-on-Cash Return
8.6%
Cap rate
1.0%
Rent to Value Ratio
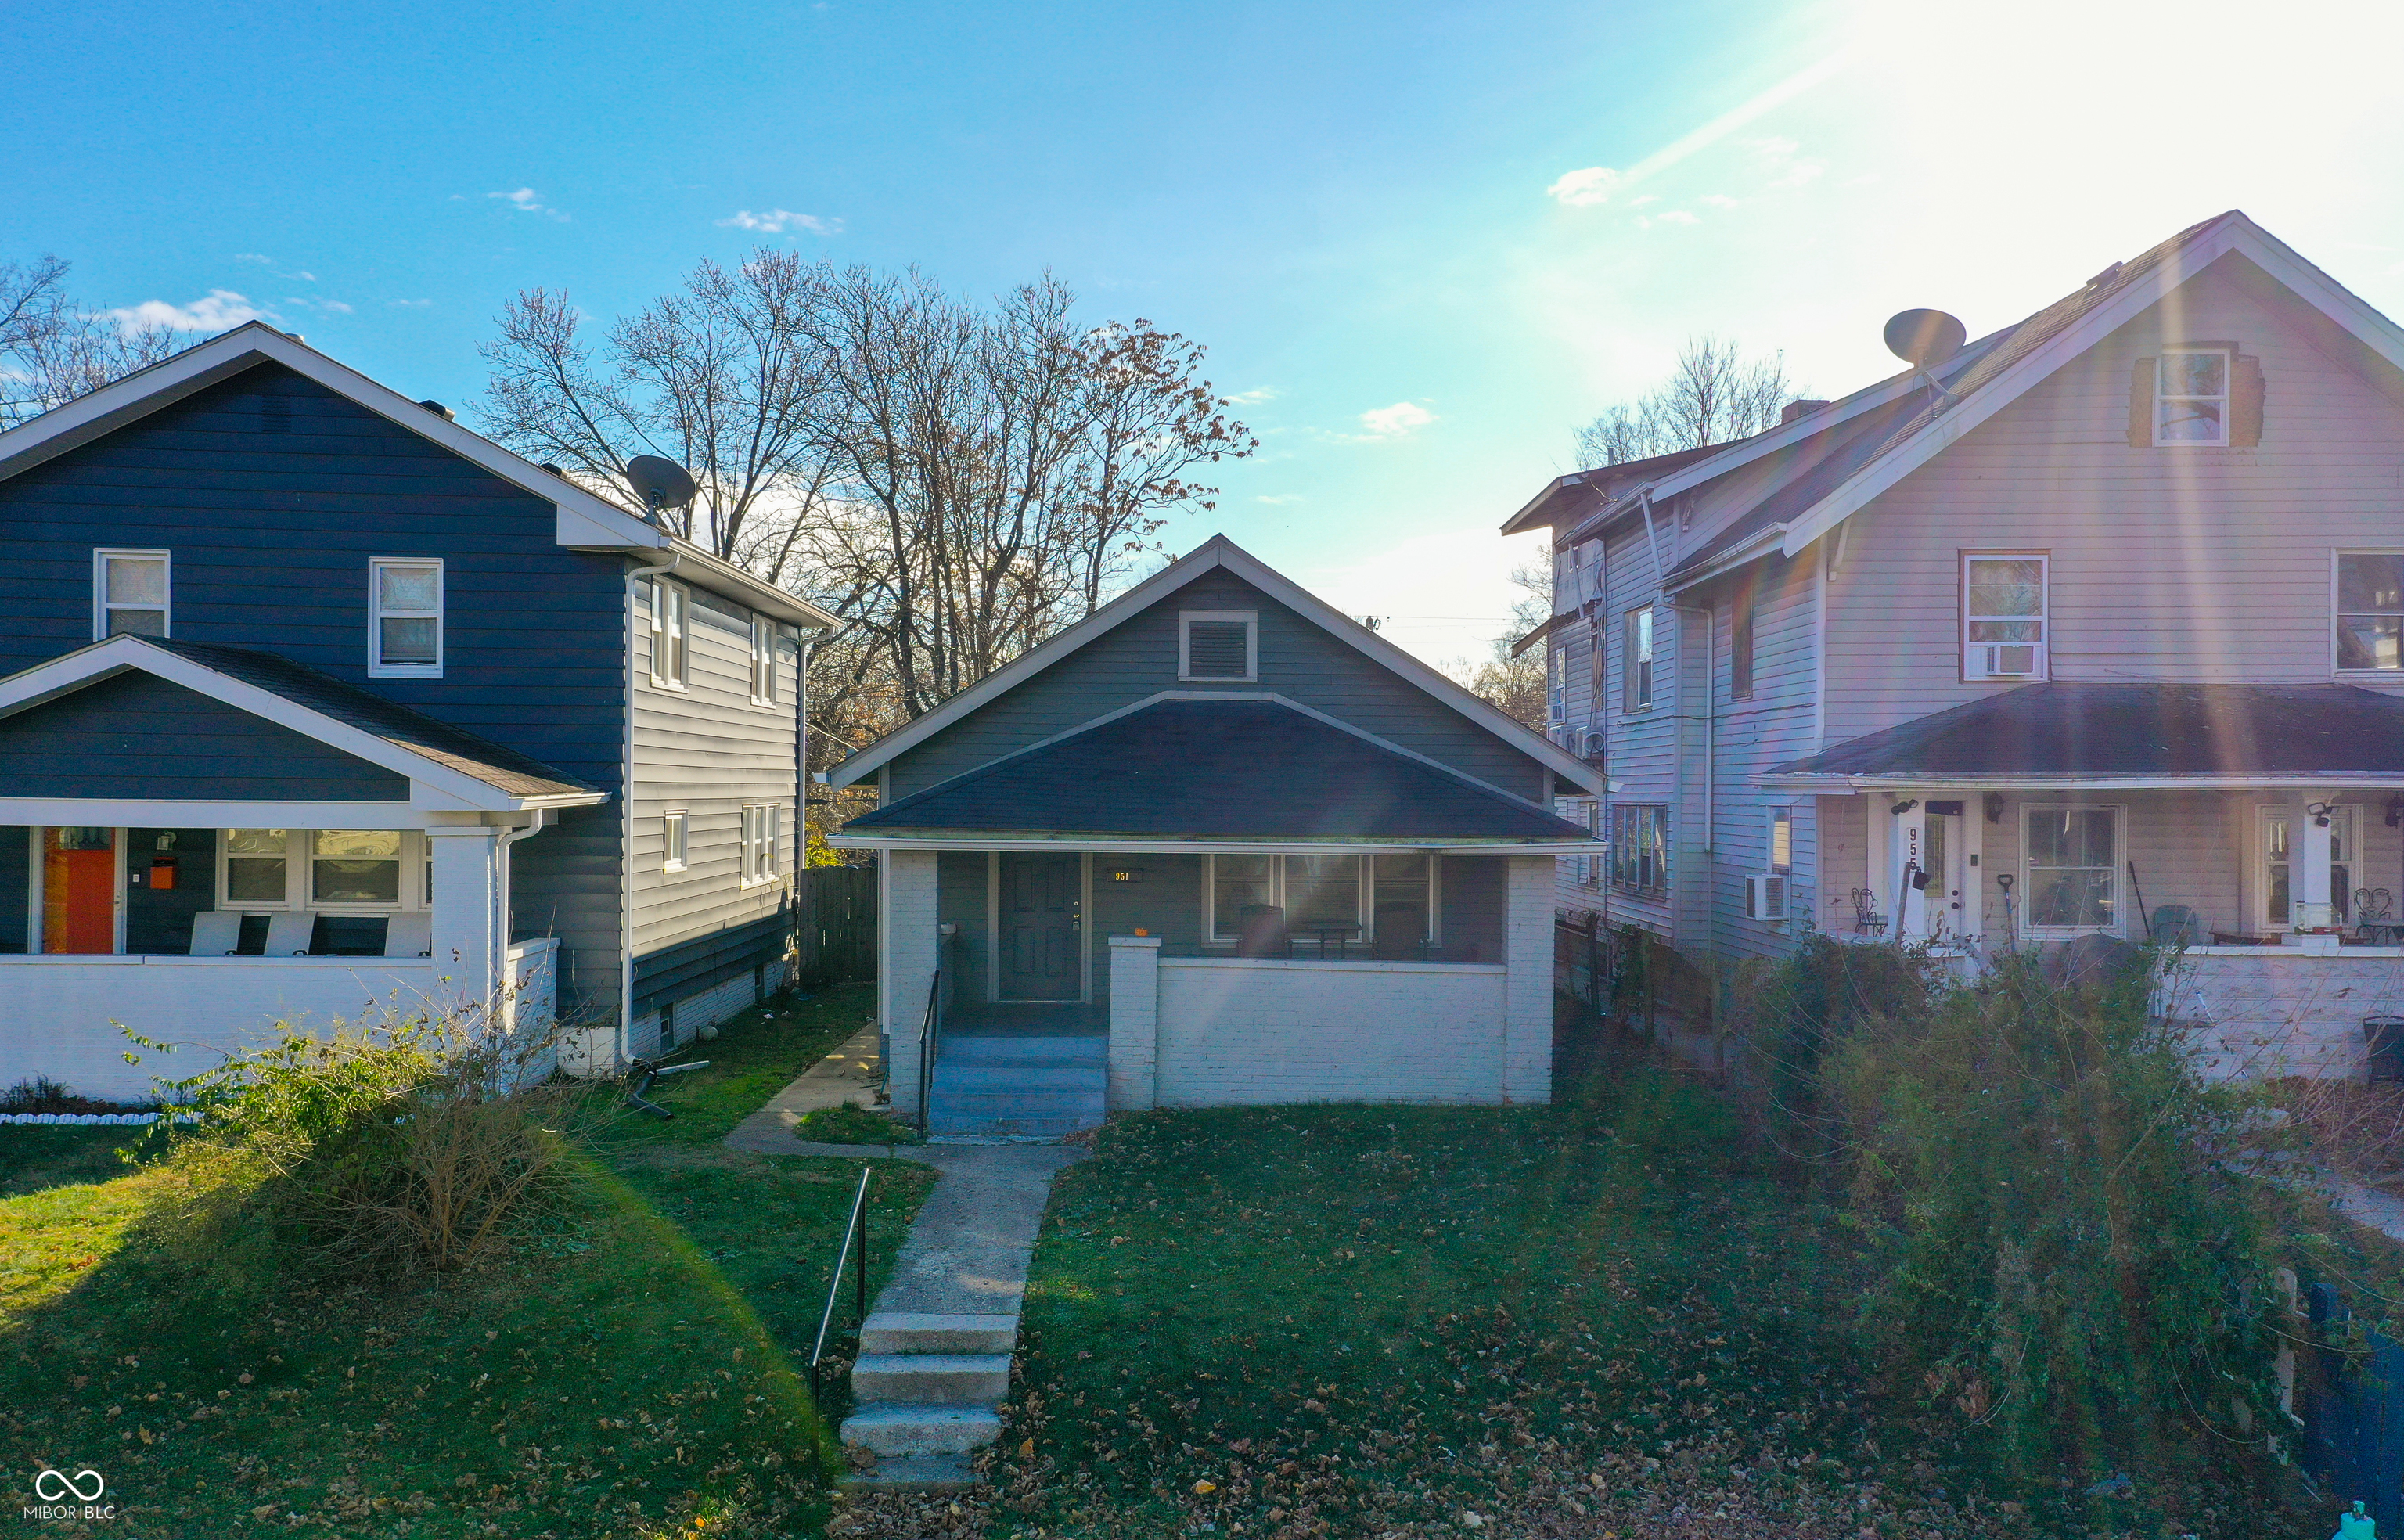
Active
$145,000
2
bds
|
1
ba
|
1,247
sqft
|
built
1928
951 W 33rd St, Indianapolis, IN 46208
$345
Cash flow
12.4%
Cash-on-Cash Return
9.1%
Cap rate
1.1%
Rent to Value Ratio
1,984 out of 2,125 properties for sale in Indianapolis, IN
Limited Results Shown
Create a free account, or log in to reveal all property listings and enjoy the complete experience.
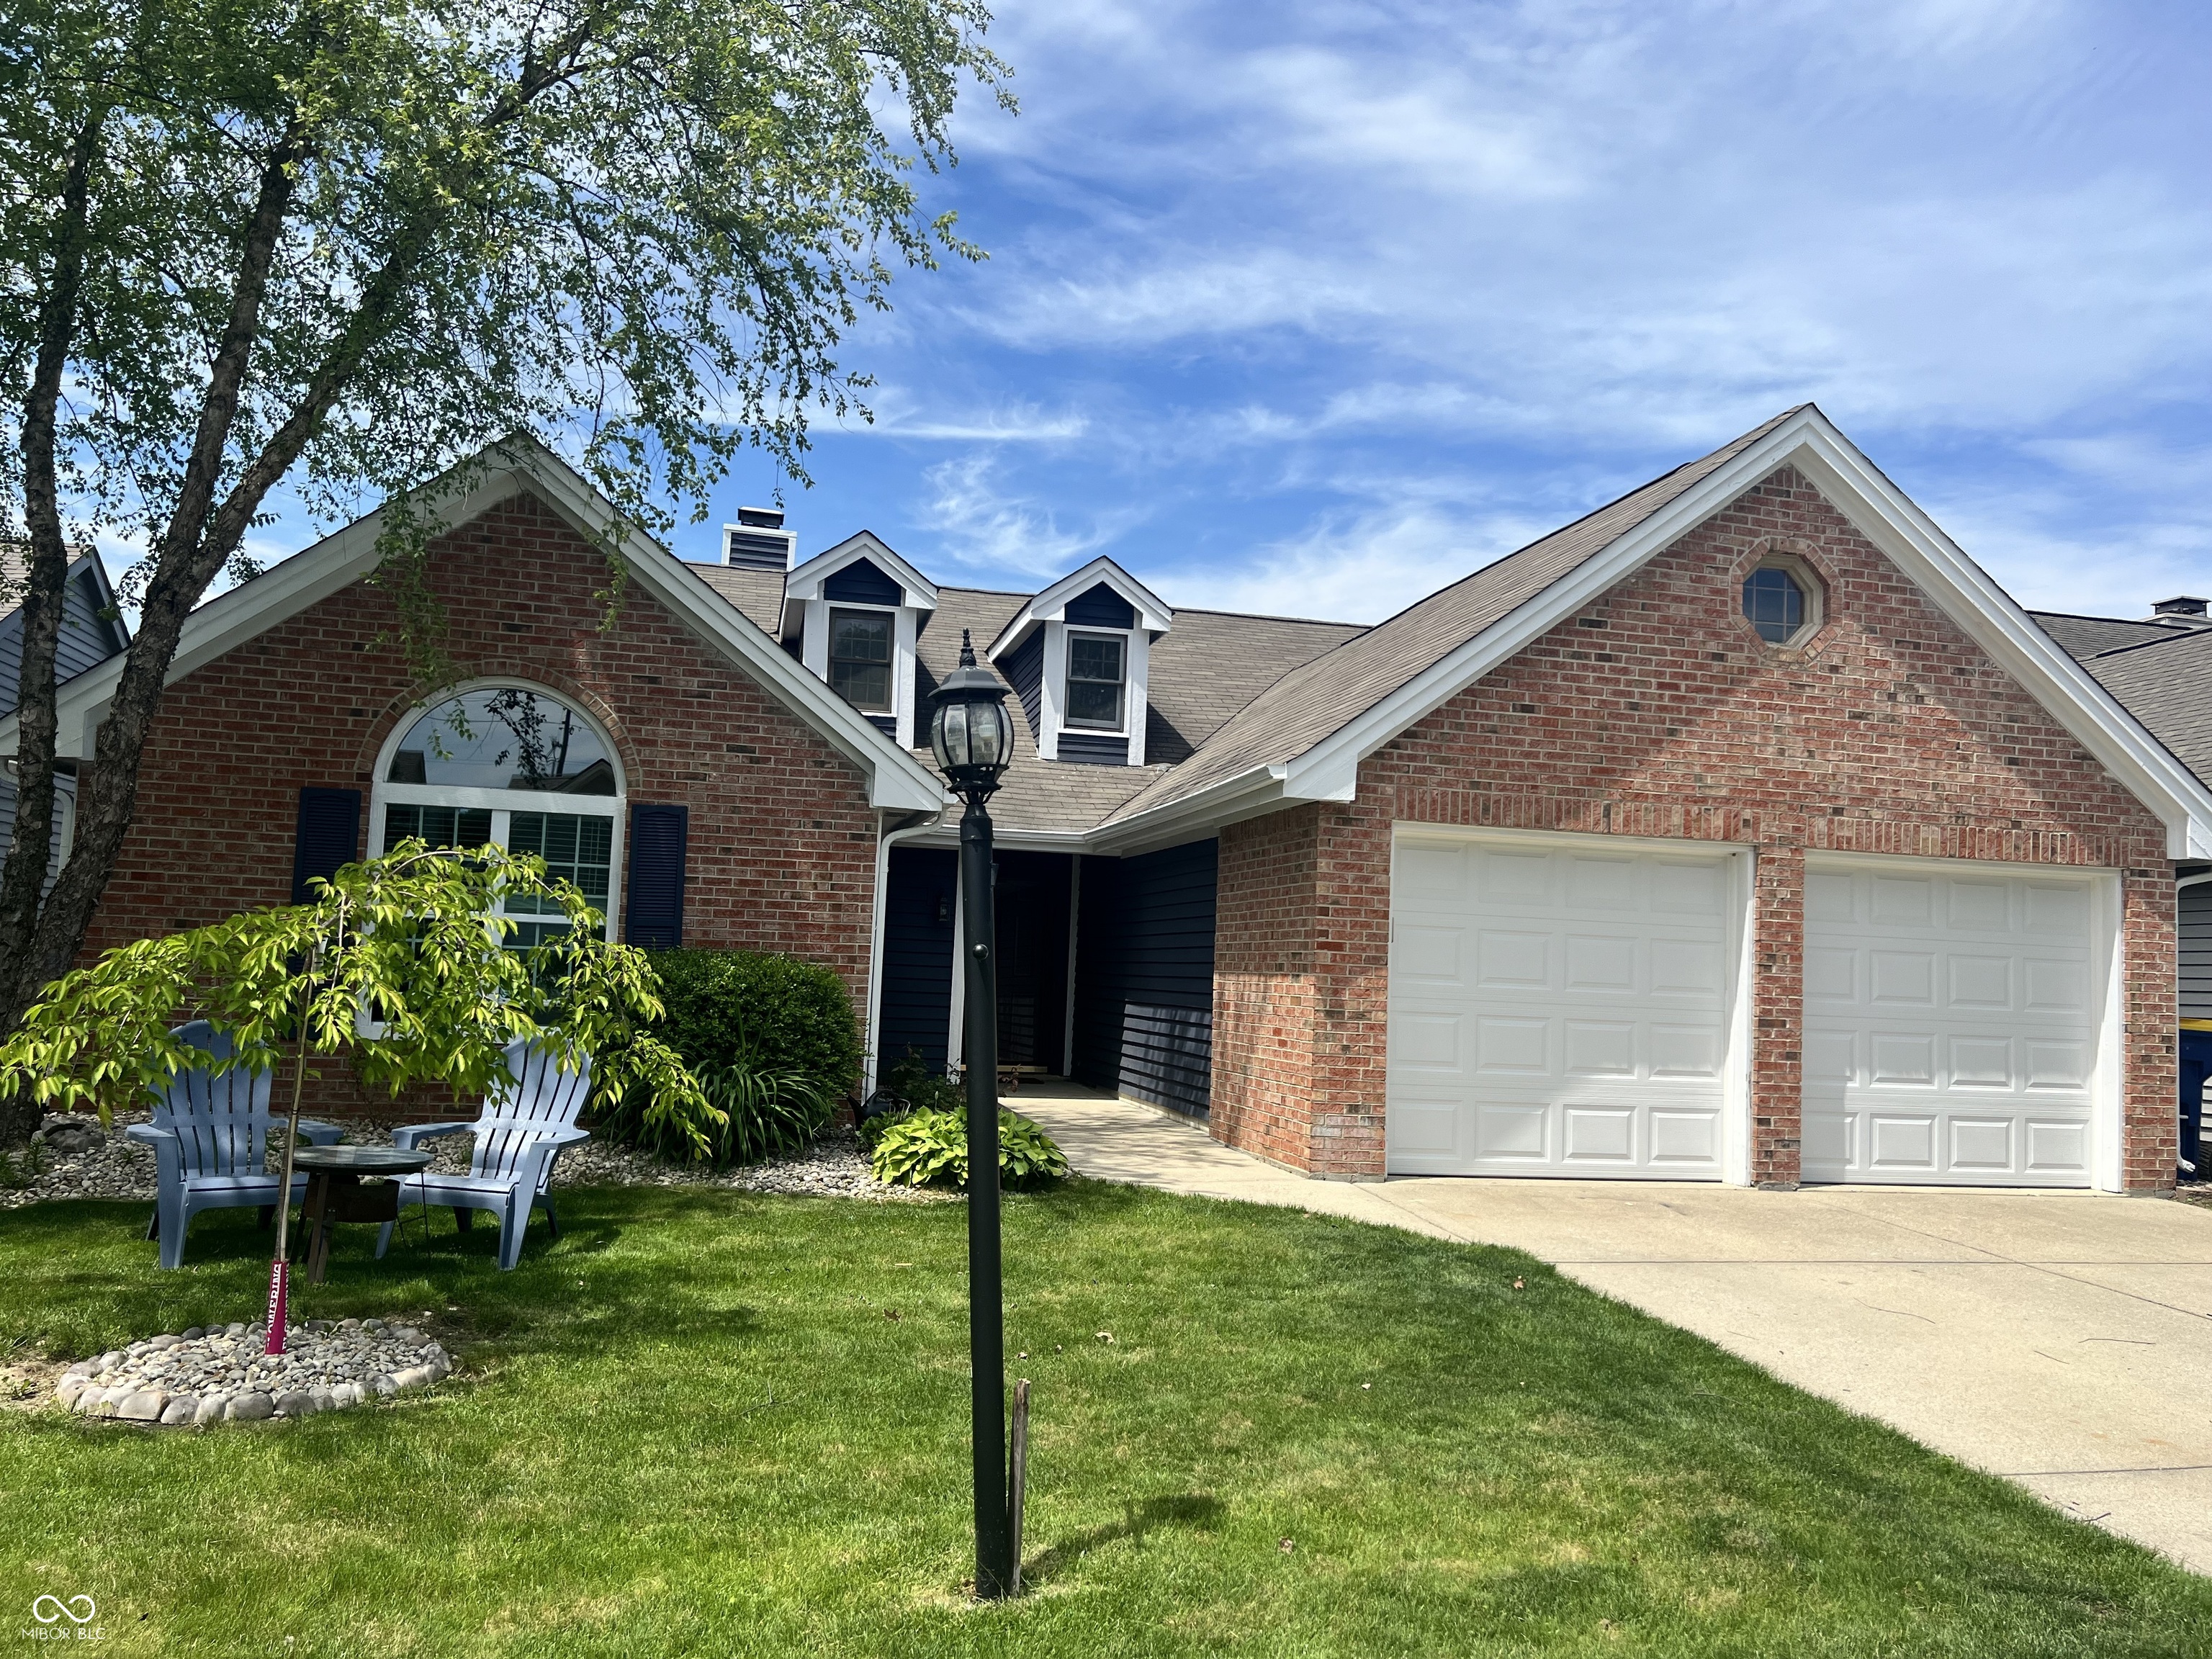
Active
$242,000
3
bds
|
3
ba
|
1,934
sqft
|
built
1998
7659 Misty Meadow Dr, Indianapolis, IN 46217
$-114
Cash flow
-2.5%
Cash-on-Cash Return
5.7%
Cap rate
0.7%
Rent to Value Ratio
Active
$349,900
3
bds
|
2
ba
|
1,452
sqft
|
built
1988
7838 Chesapeake Dr E, Indianapolis, IN 46236
$-490
Cash flow
-7.3%
Cash-on-Cash Return
4.6%
Cap rate
0.6%
Rent to Value Ratio
Active
$380,000
4
bds
|
3
ba
|
3,636
sqft
|
built
2004
10105 Yosemite Ln, Indianapolis, IN 46234
$-234
Cash flow
-3.2%
Cash-on-Cash Return
5.5%
Cap rate
0.7%
Rent to Value Ratio
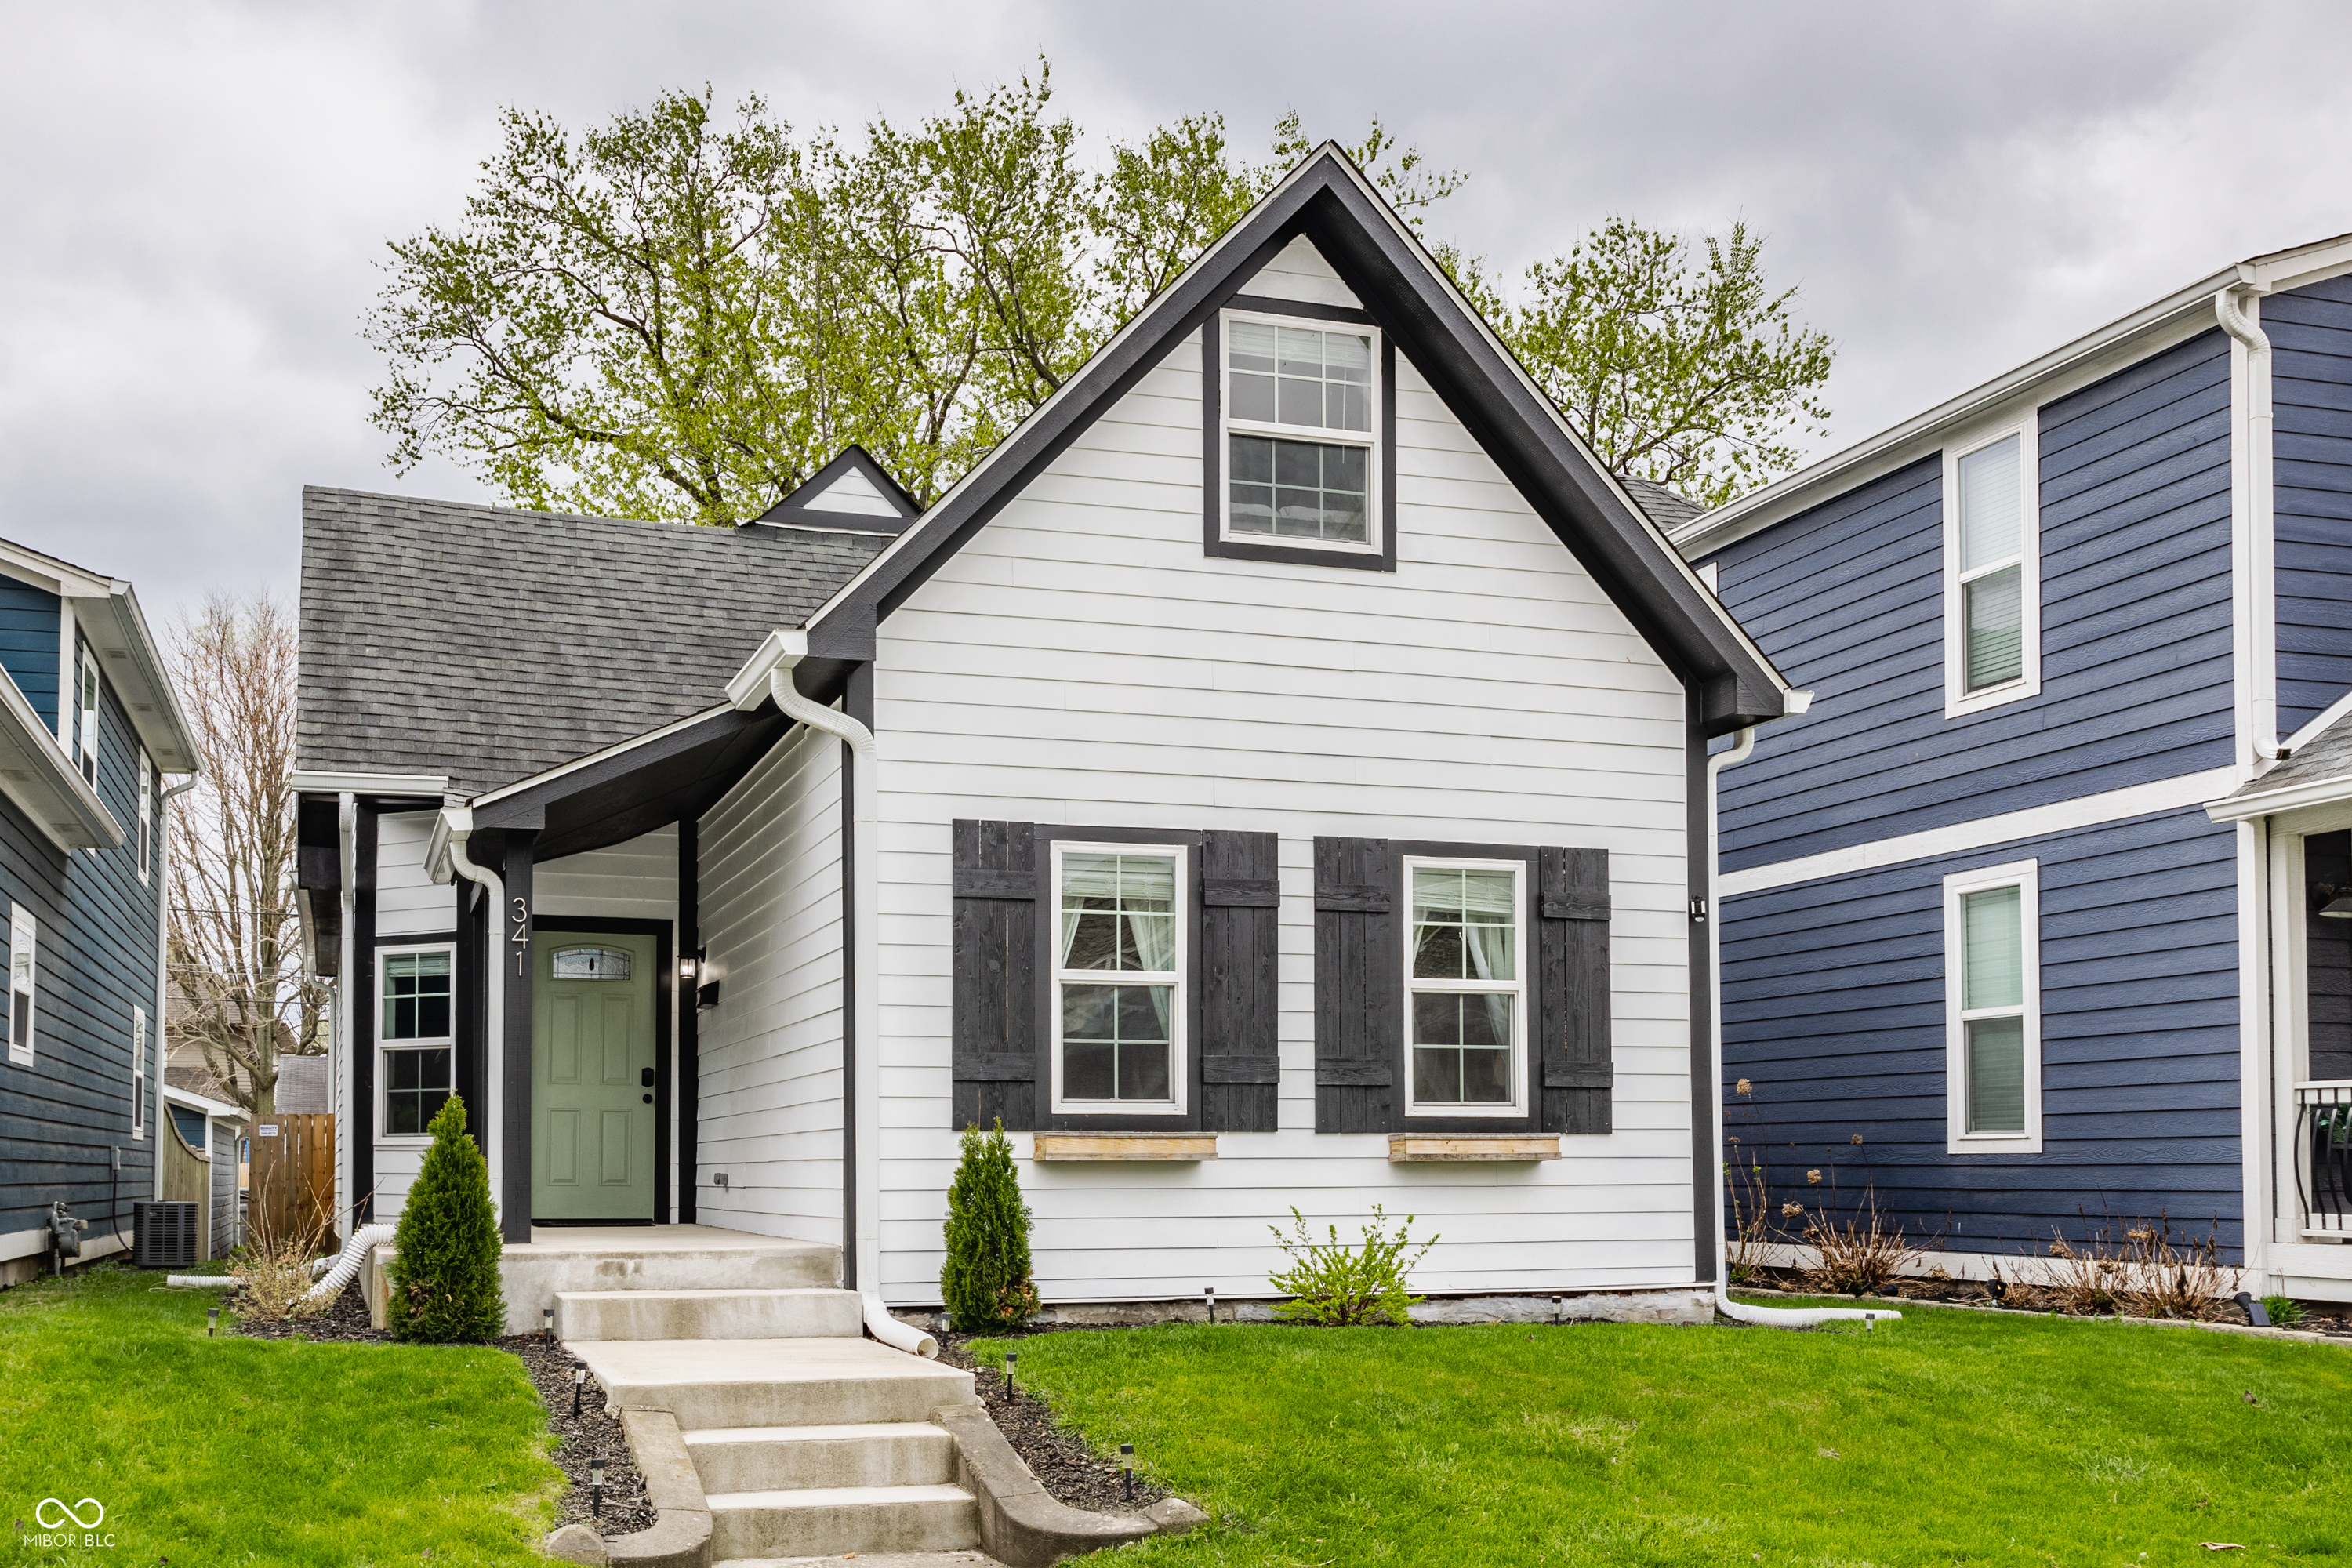
Active
$374,900
3
bds
|
3
ba
|
2,400
sqft
|
built
2019
341 Sanders St, Indianapolis, IN 46225
$-238
Cash flow
-3.3%
Cash-on-Cash Return
5.5%
Cap rate
0.7%
Rent to Value Ratio
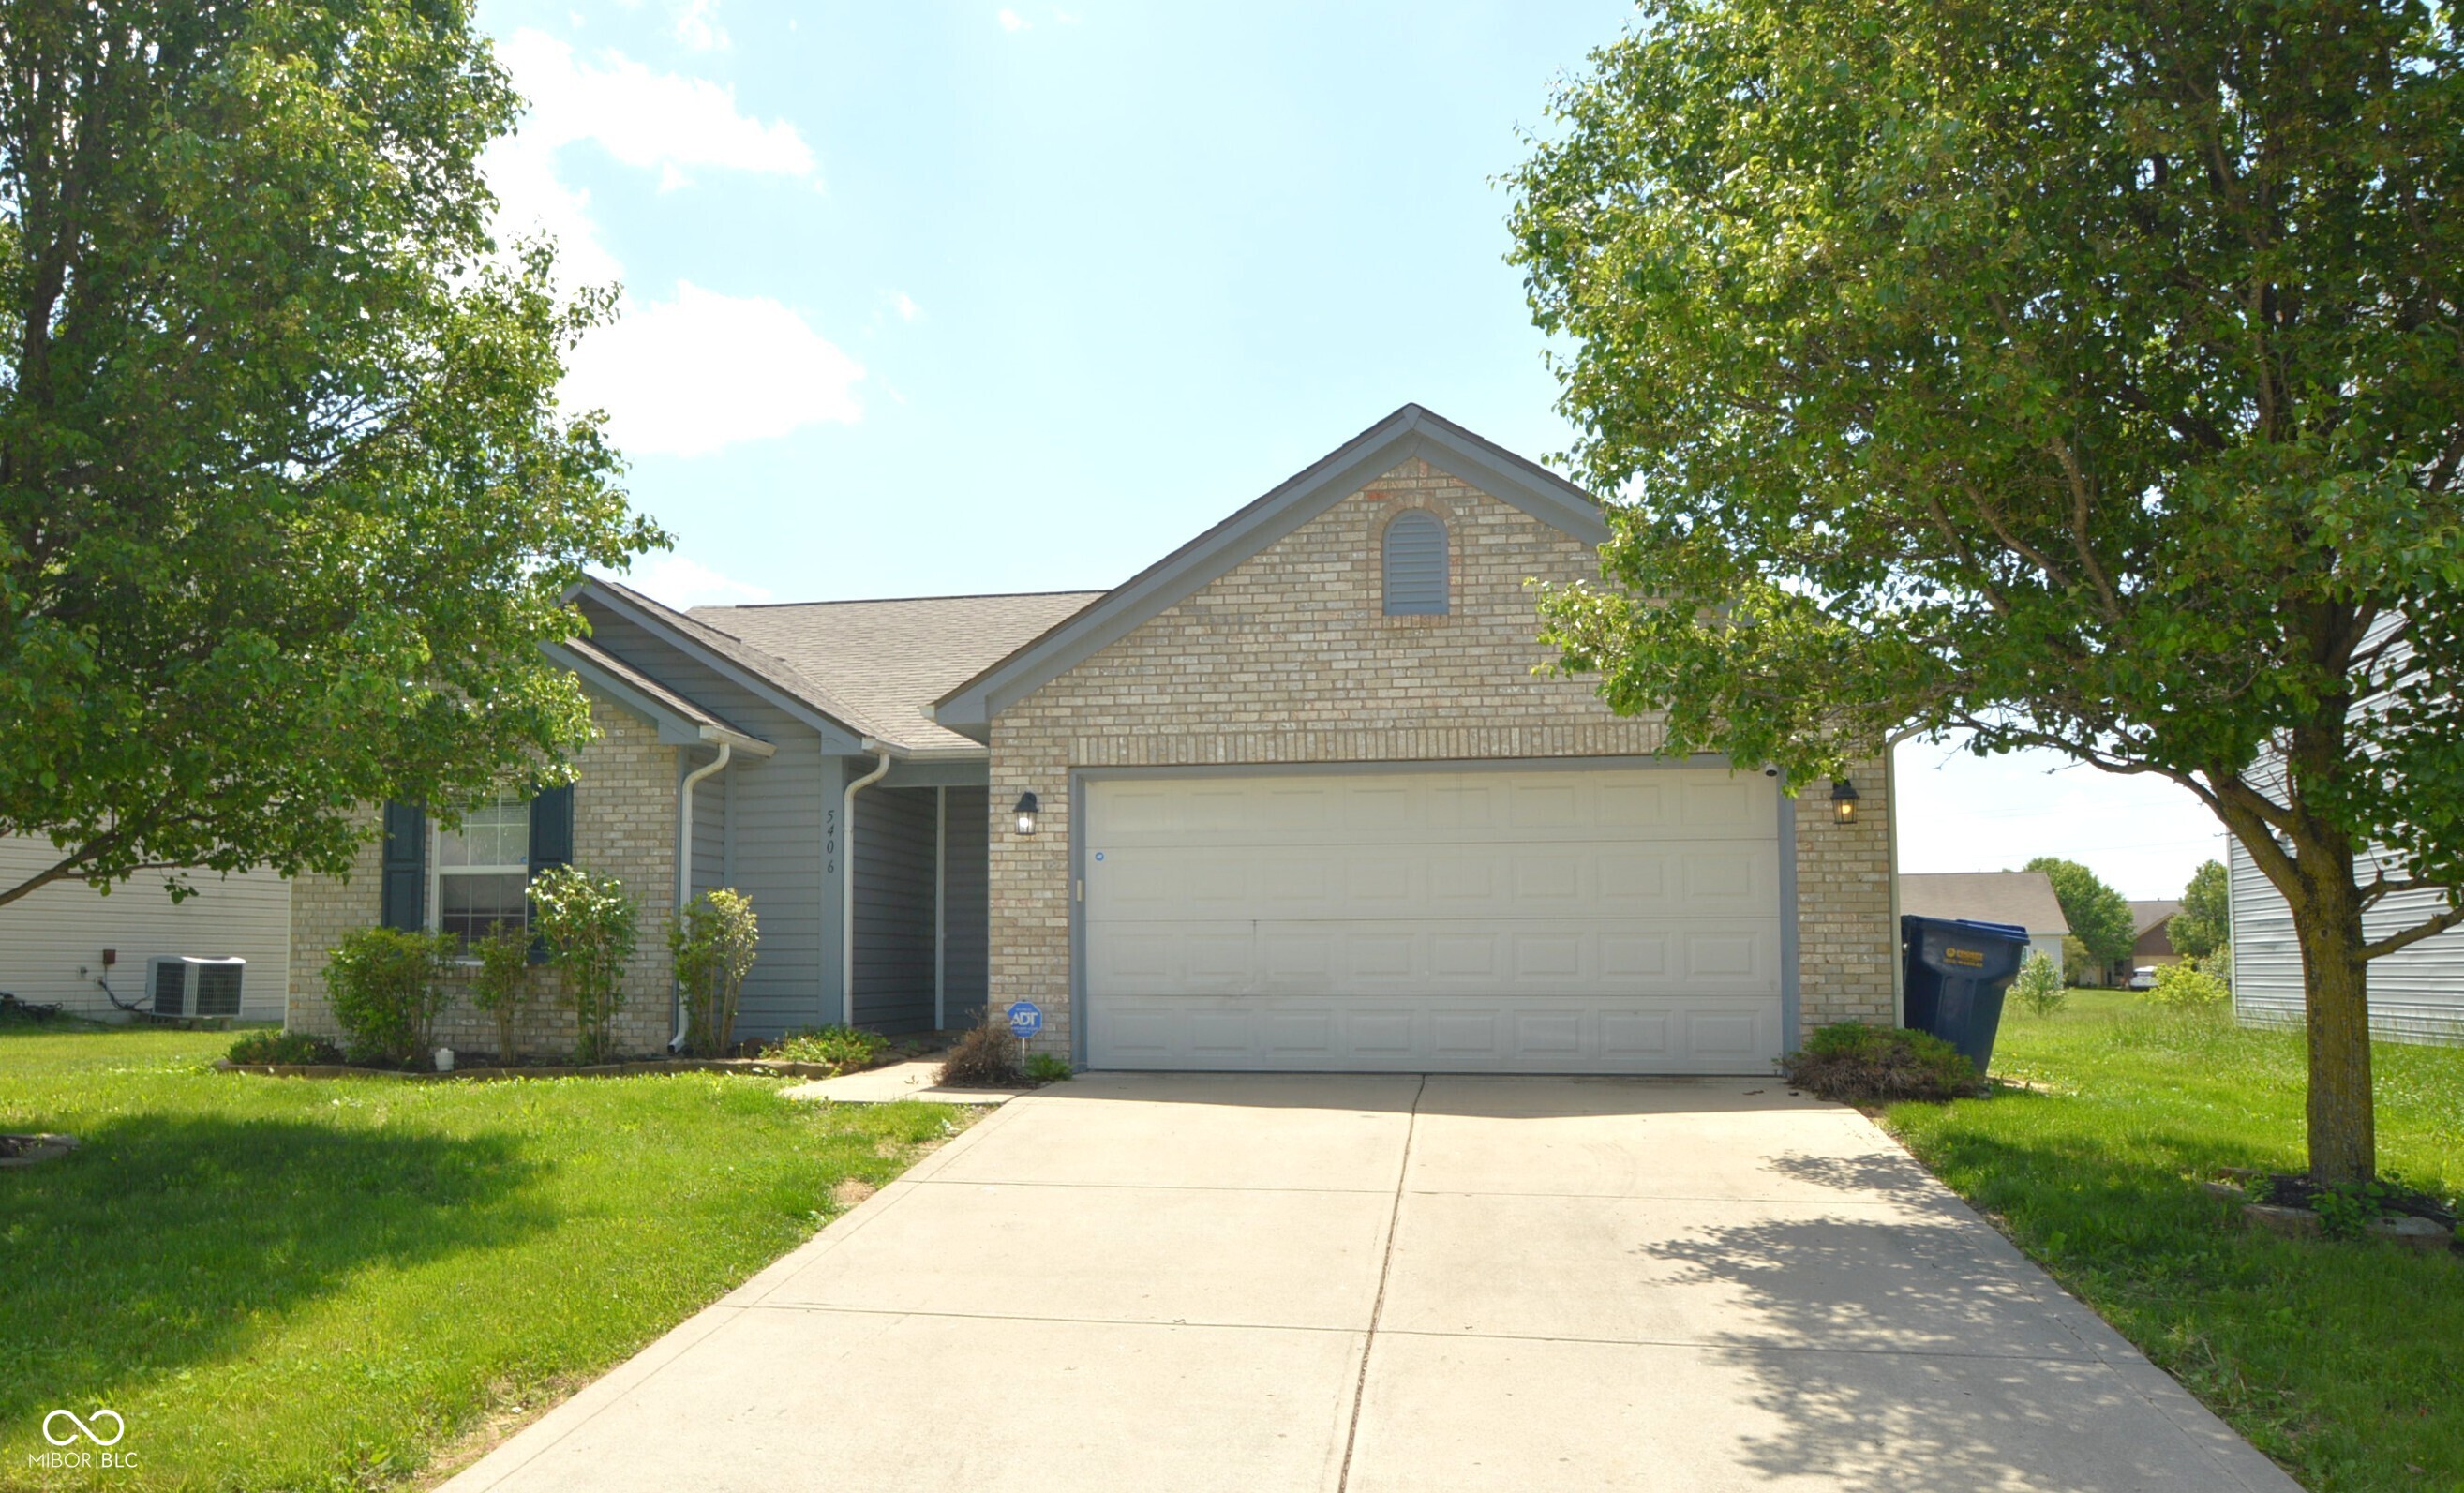
Active
$225,000
3
bds
|
2
ba
|
1,379
sqft
|
built
2006
5406 Shamus Dr, Indianapolis, IN 46235
$34
Cash flow
0.8%
Cash-on-Cash Return
6.5%
Cap rate
0.8%
Rent to Value Ratio
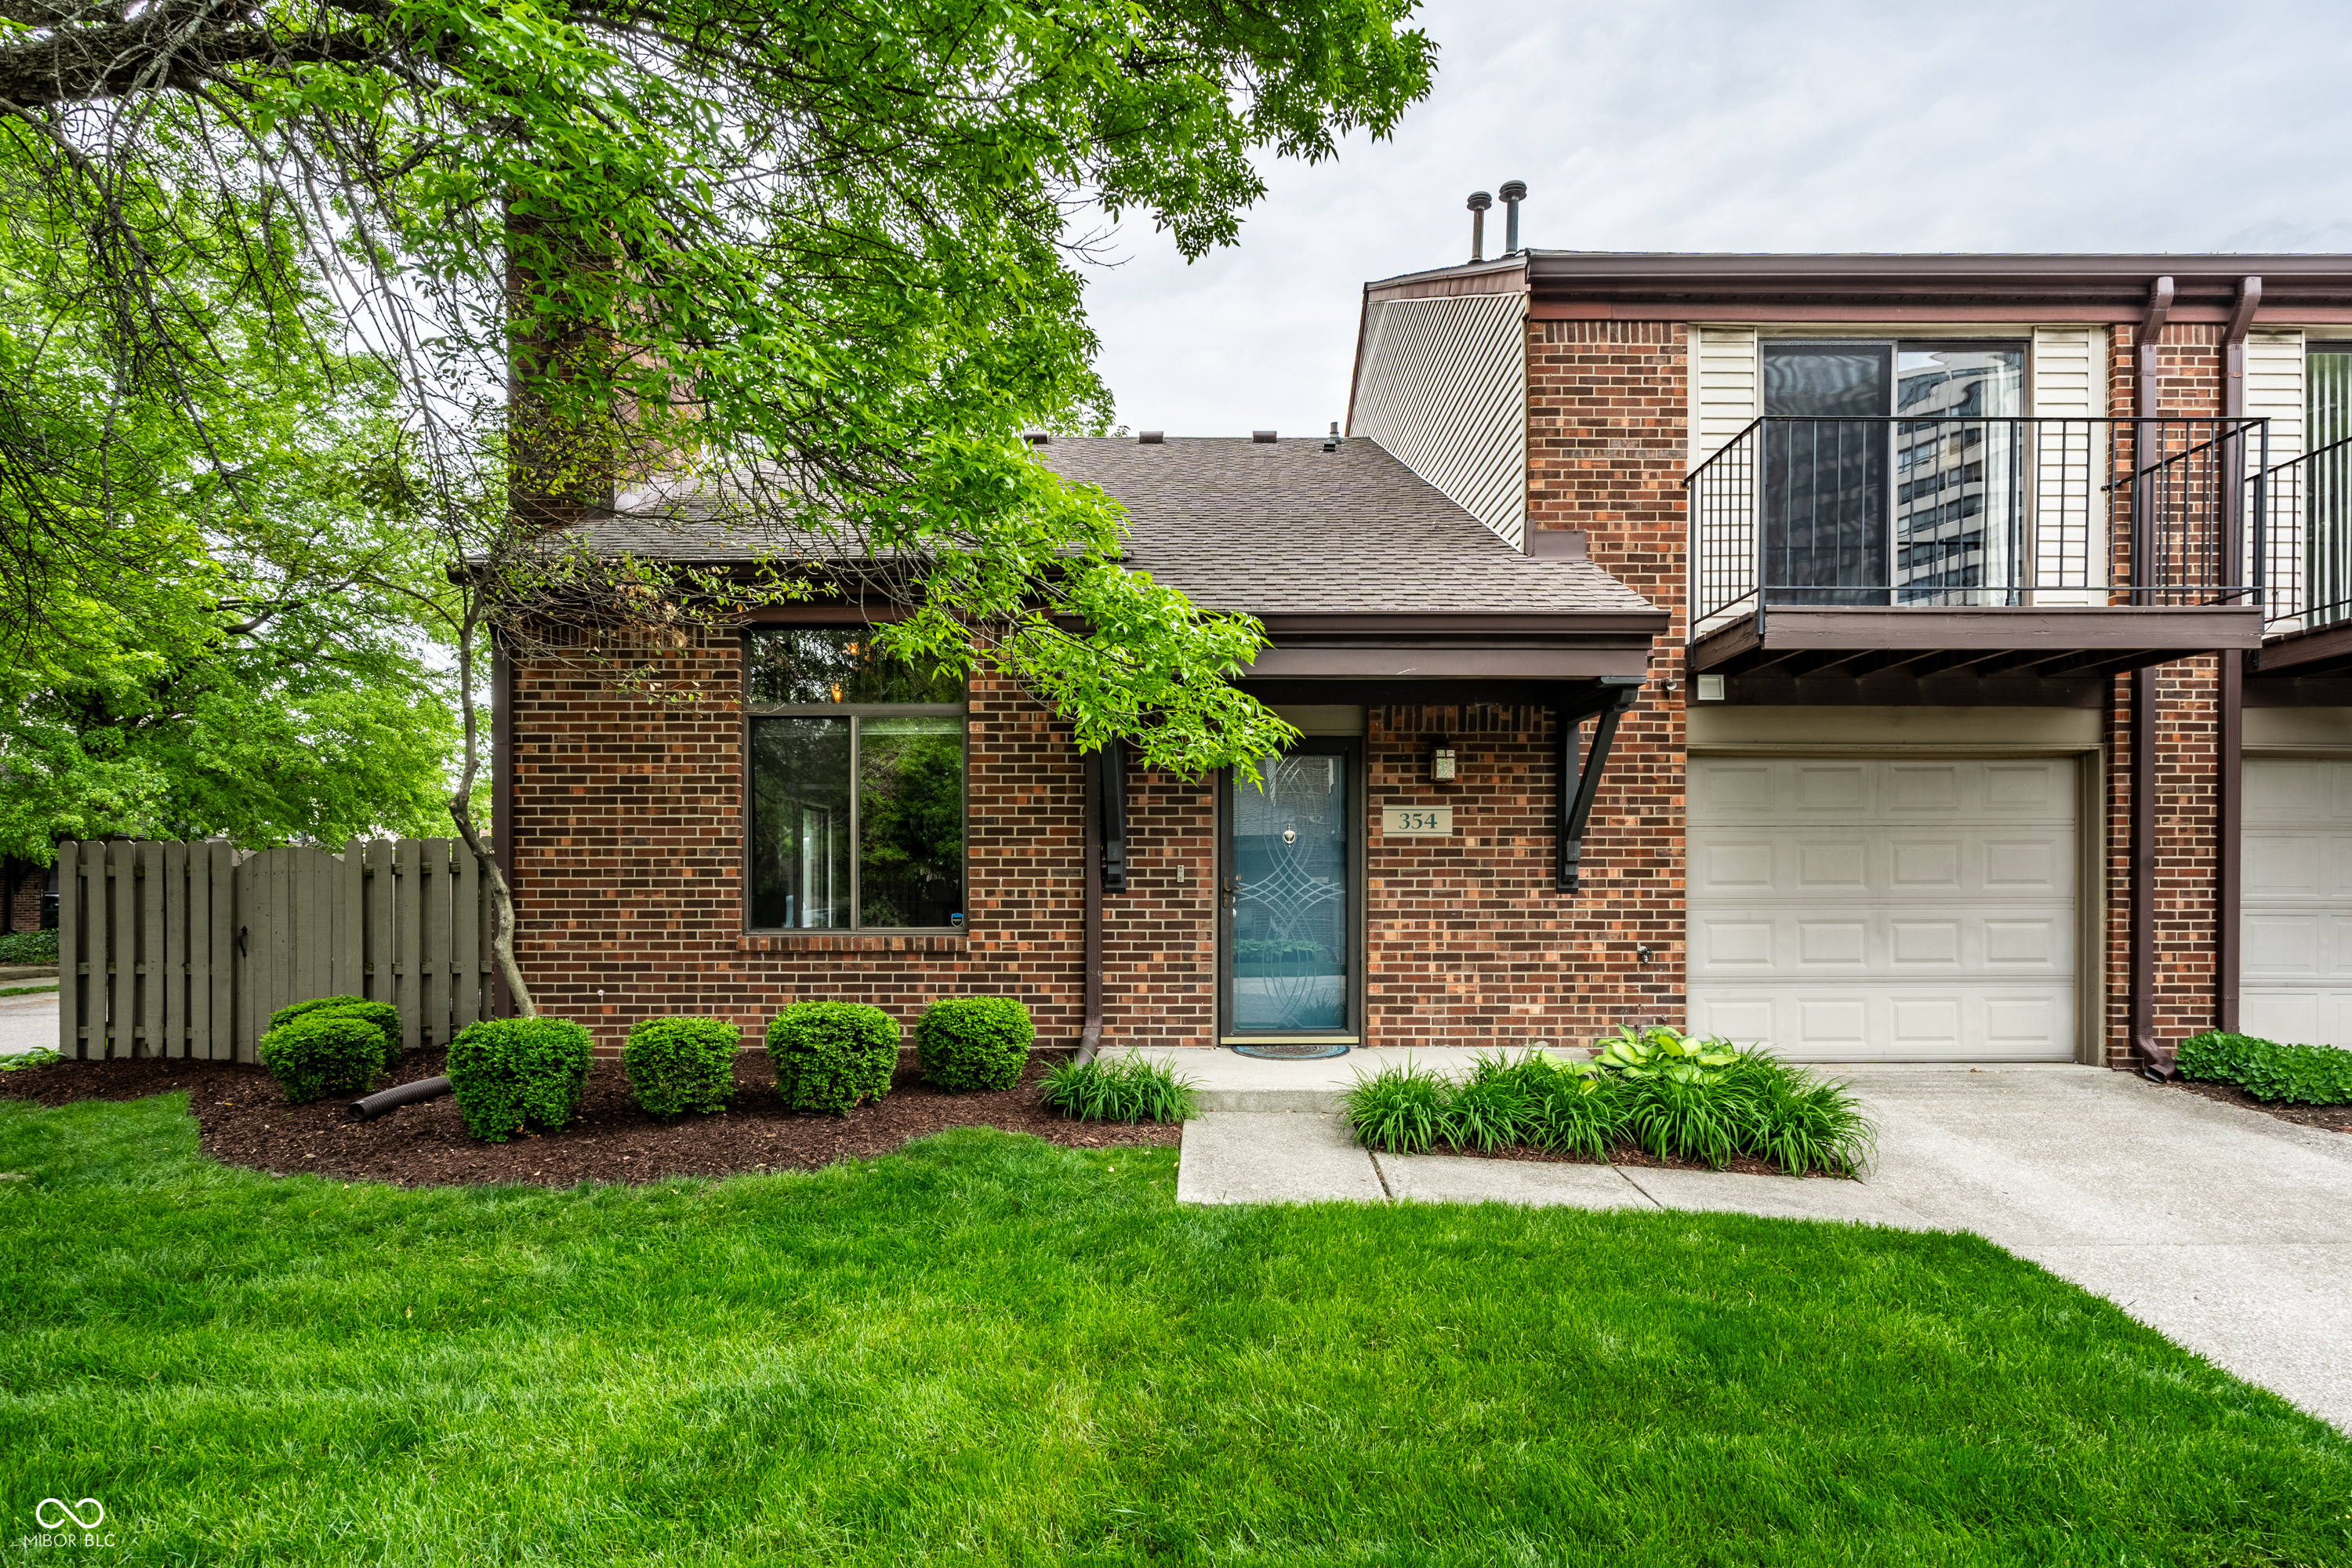
Active
$340,000
2
bds
|
2
ba
|
1,120
sqft
|
built
1982
354 E Arch St, Indianapolis, IN 46202
$-403
Cash flow
-6.2%
Cash-on-Cash Return
4.9%
Cap rate
0.7%
Rent to Value Ratio
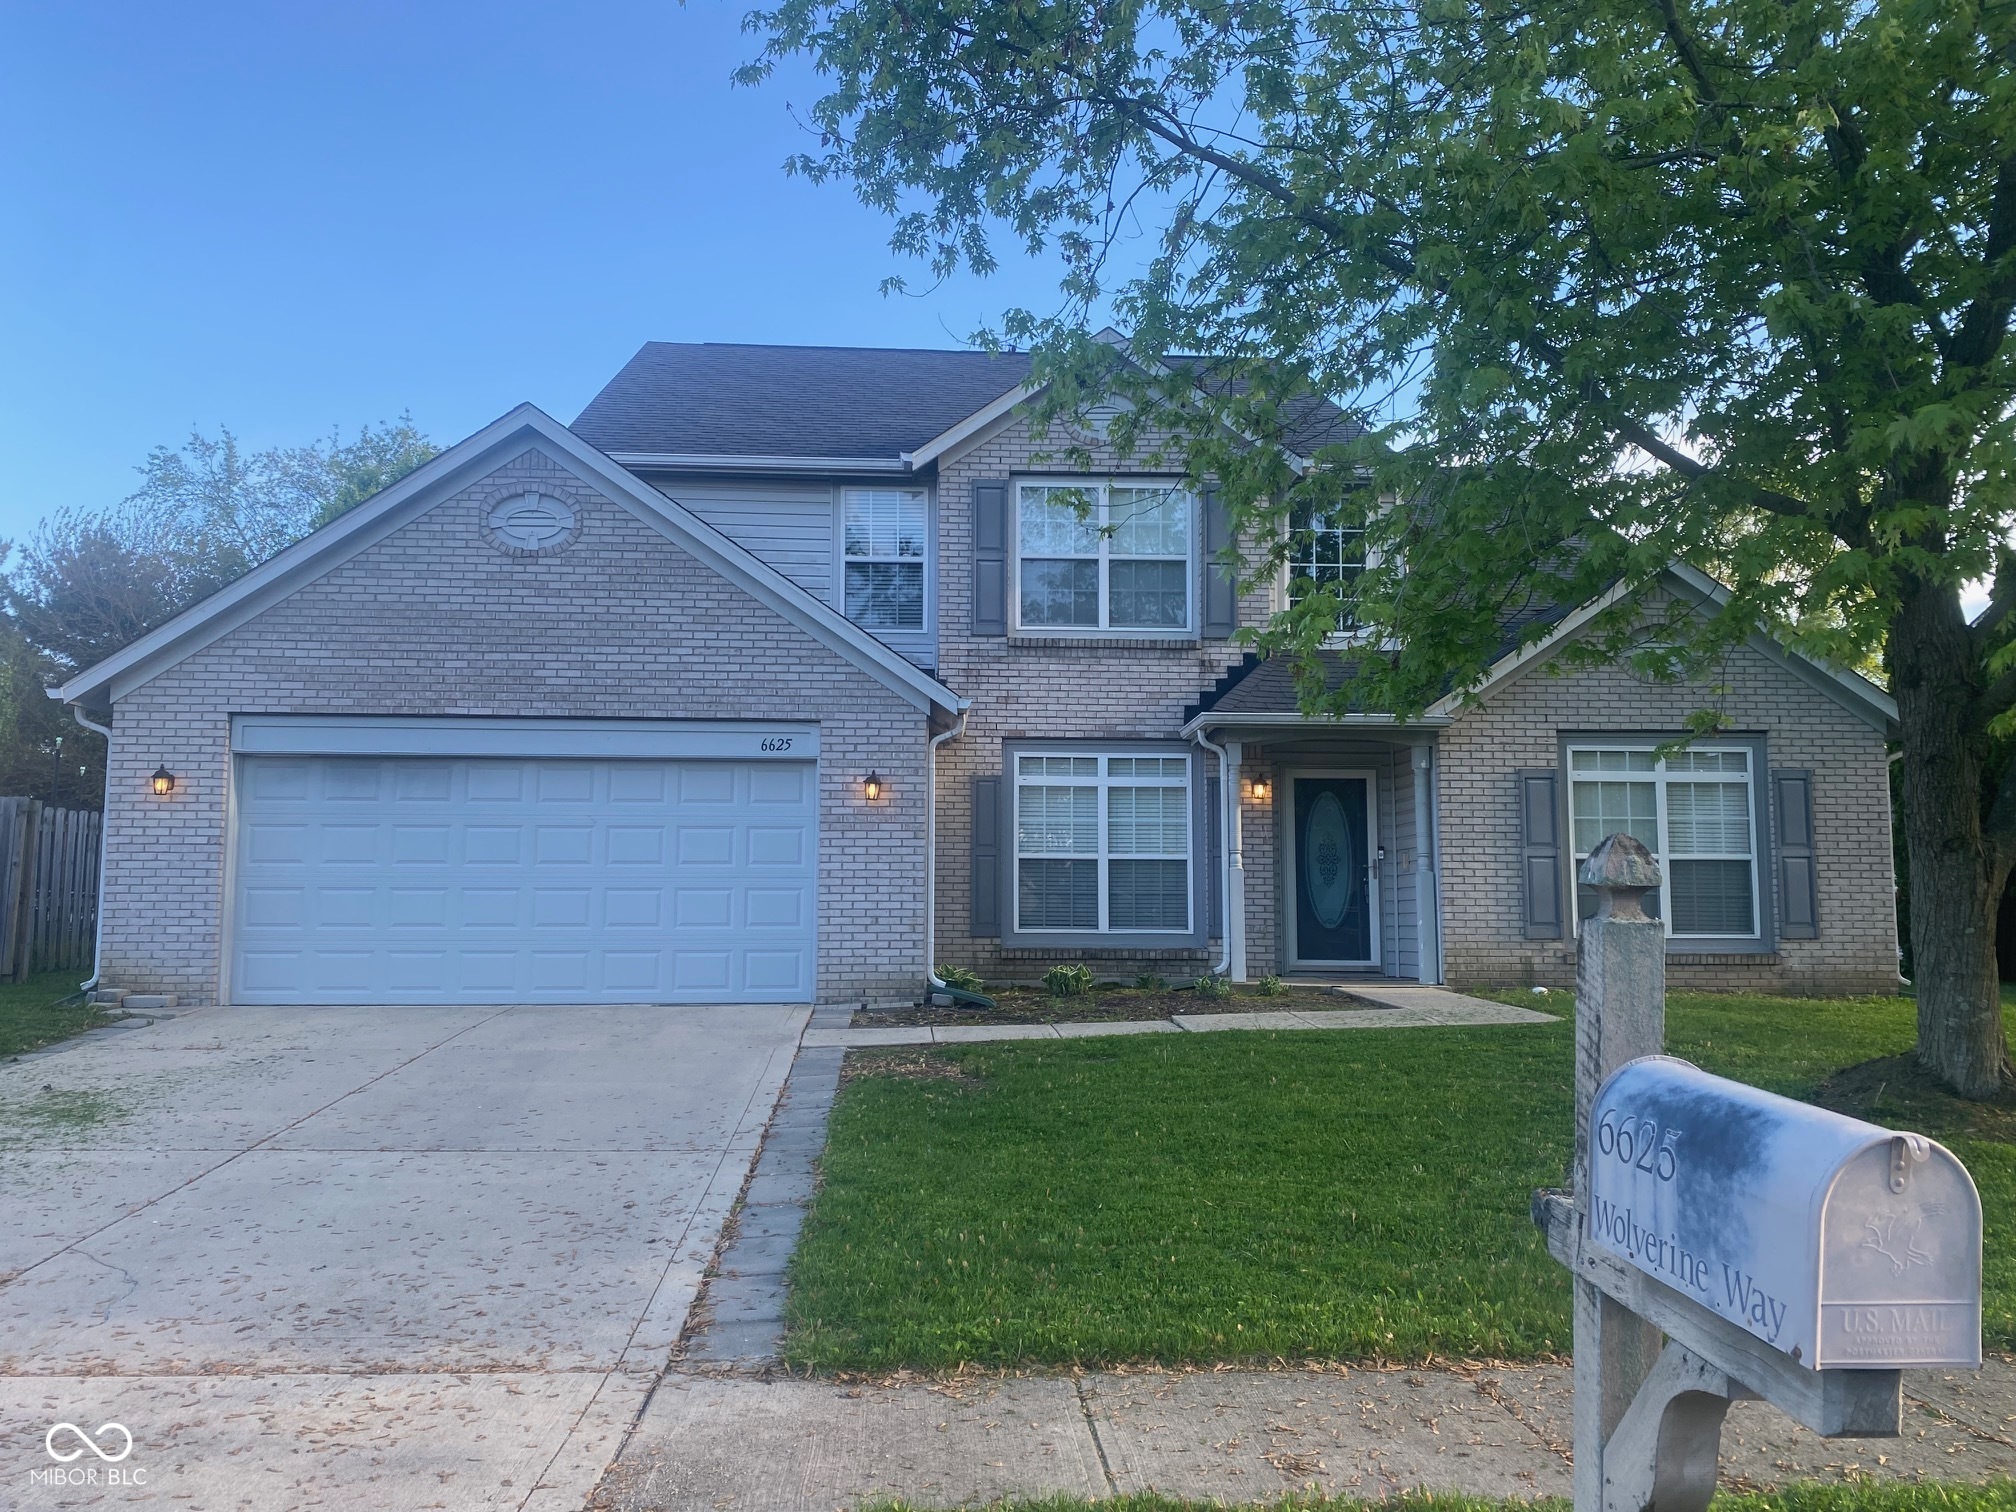
Active
$369,900
4
bds
|
3
ba
|
2,581
sqft
|
built
2005
6625 Wolverine Way, Indianapolis, IN 46237
$-380
Cash flow
-5.4%
Cash-on-Cash Return
5.1%
Cap rate
0.6%
Rent to Value Ratio
Active
$145,000
2
bds
|
1
ba
|
1,247
sqft
|
built
1928
951 W 33rd St, Indianapolis, IN 46208
$345
Cash flow
12.4%
Cash-on-Cash Return
9.1%
Cap rate
1.1%
Rent to Value Ratio
Active
$319,900
3
bds
|
3
ba
|
3,030
sqft
|
built
2014
11851 Fawn Crest Dr, Indianapolis, IN 46235
$50
Cash flow
0.8%
Cash-on-Cash Return
6.5%
Cap rate
0.8%
Rent to Value Ratio
Active
$242,000
3
bds
|
4
ba
|
2,692
sqft
|
built
1962
2521 Beechcrest Dr, Indianapolis, IN 46203
$113
Cash flow
2.4%
Cash-on-Cash Return
6.8%
Cap rate
0.8%
Rent to Value Ratio
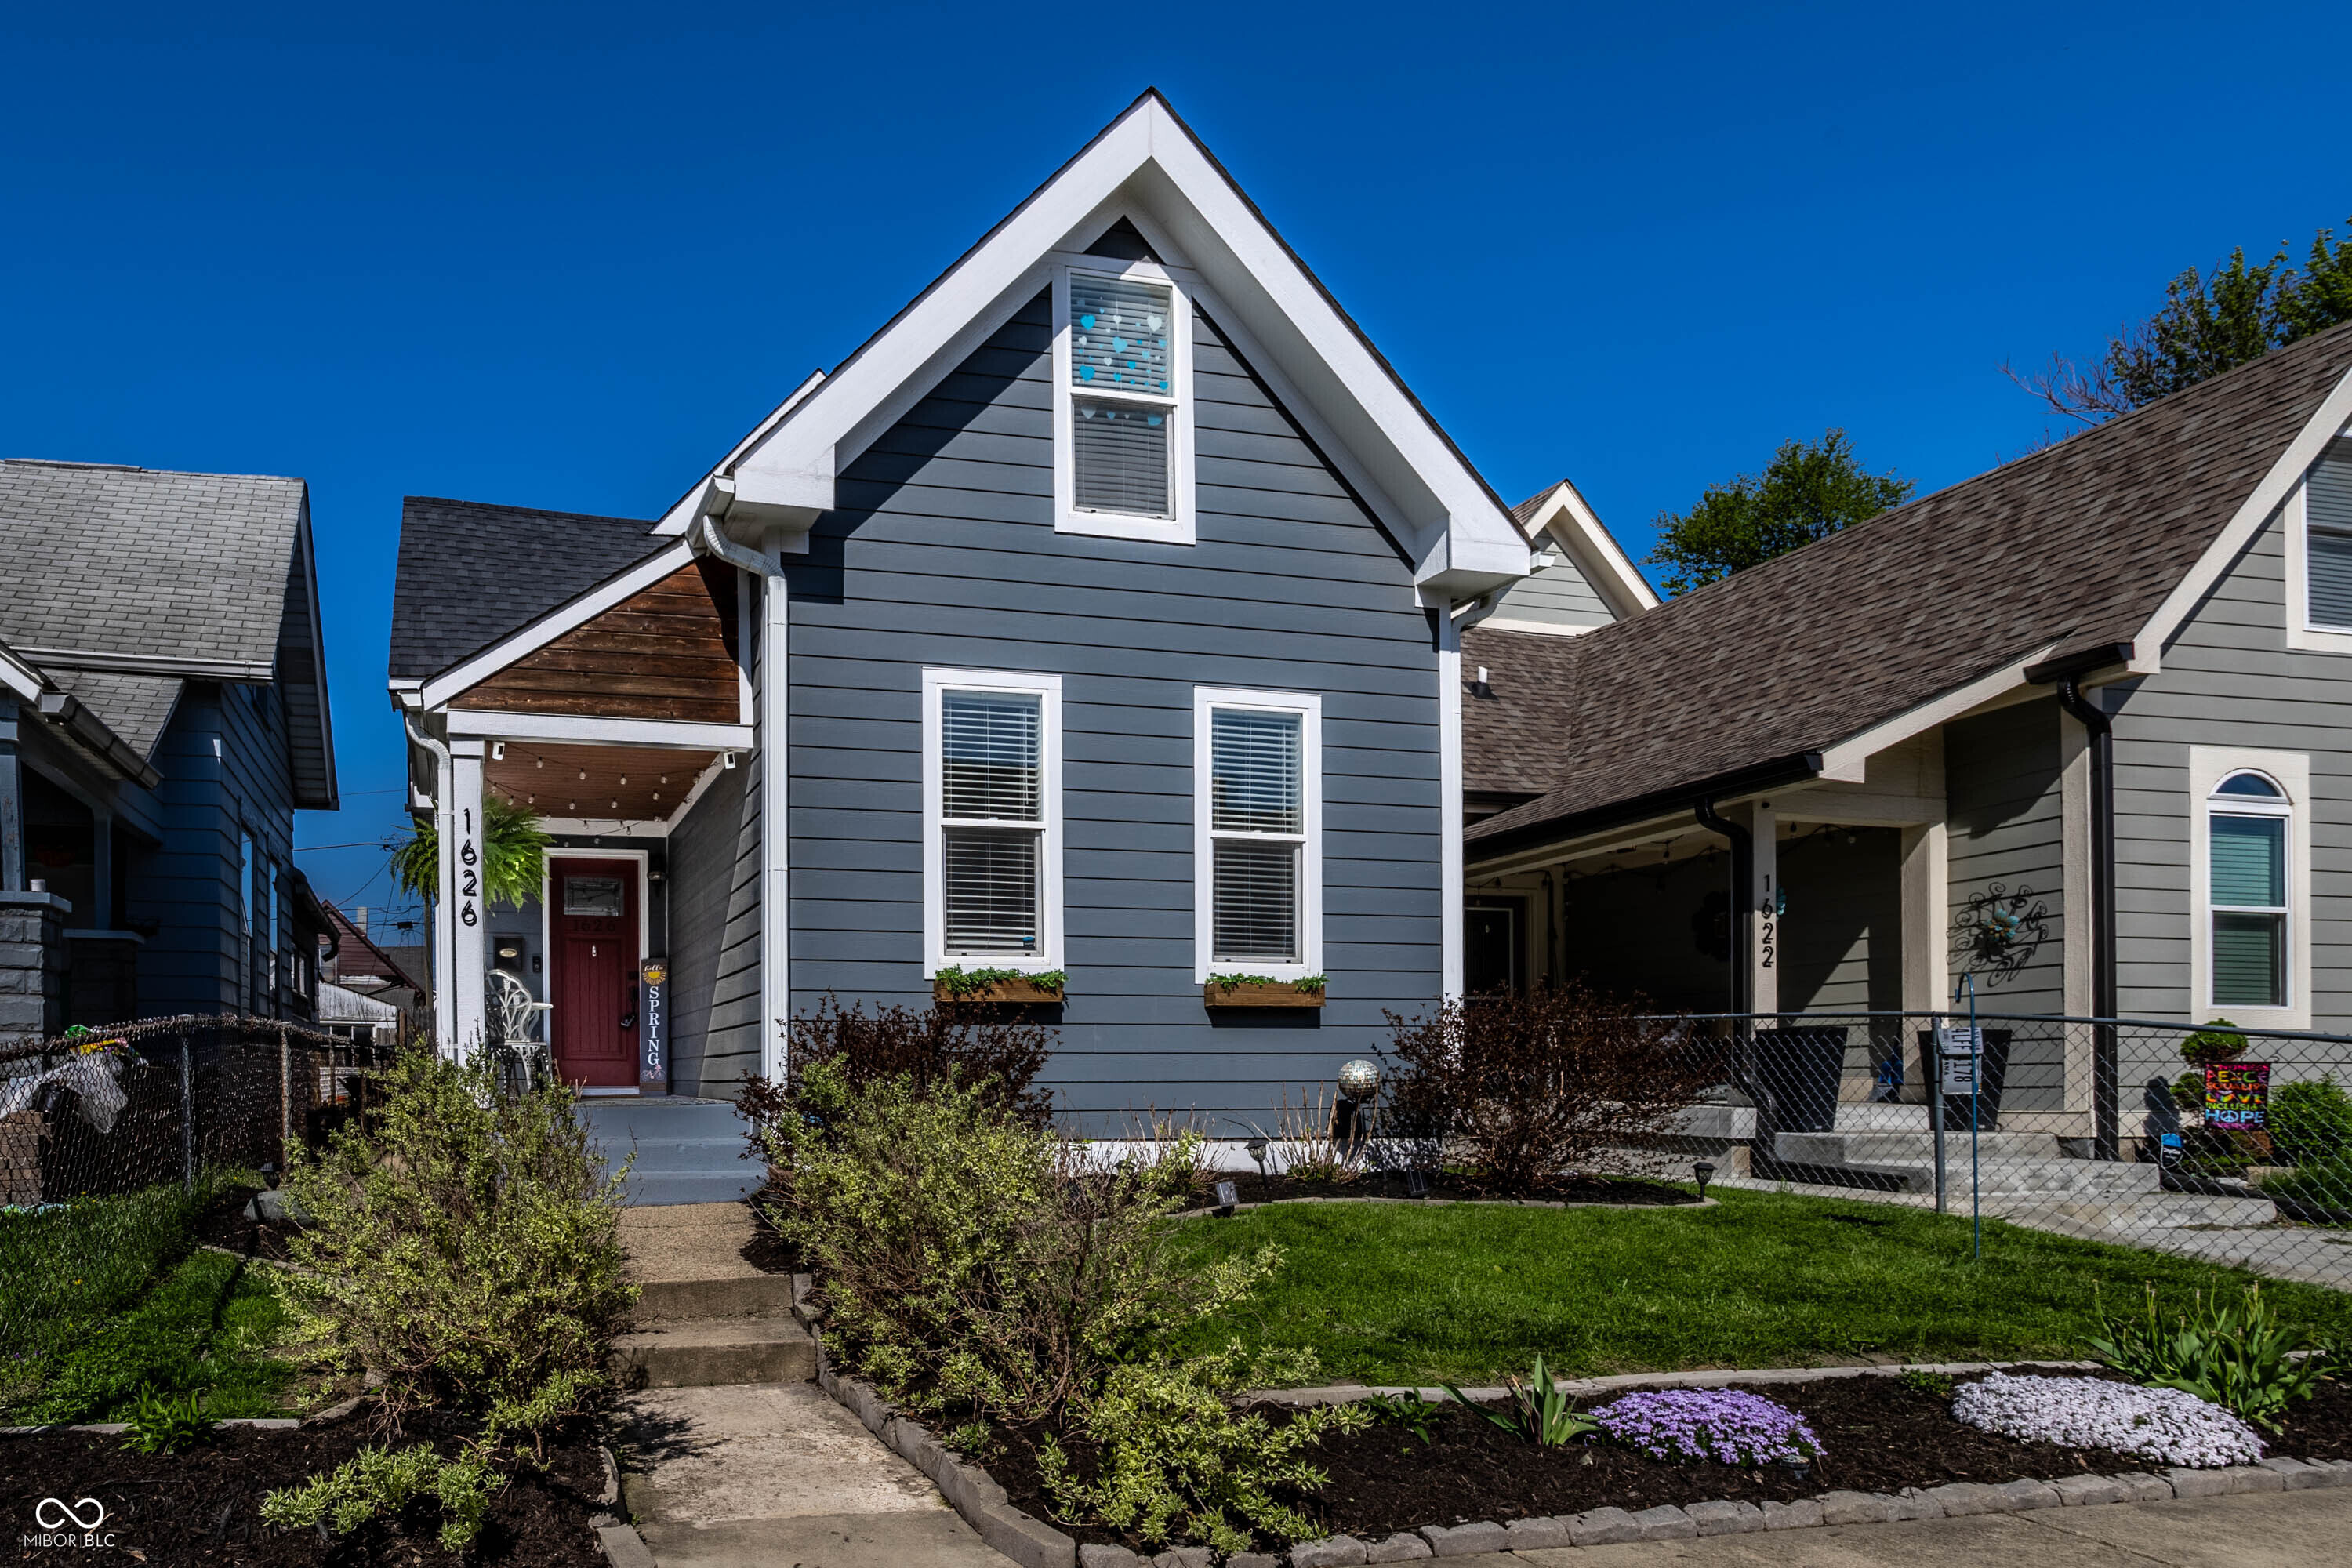
Active
$324,900
3
bds
|
3
ba
|
2,008
sqft
|
built
1890
1626 S Delaware St, Indianapolis, IN 46225
$93
Cash flow
1.5%
Cash-on-Cash Return
6.6%
Cap rate
0.8%
Rent to Value Ratio
Active
$134,900
2
bds
|
1
ba
|
1,845
sqft
|
built
1910
724 E Beecher St, Indianapolis, IN 46203
$260
Cash flow
10.1%
Cash-on-Cash Return
8.6%
Cap rate
1.0%
Rent to Value Ratio
Active
$249,900
3
bds
|
2
ba
|
1,344
sqft
|
built
1919
1016 Churchman Ave, Indianapolis, IN 46203
$485
Cash flow
10.1%
Cash-on-Cash Return
8.6%
Cap rate
1.0%
Rent to Value Ratio
Active
$88,900
2
bds
|
1
ba
|
1,041
sqft
|
built
1925
3610 Robson St, Indianapolis, IN 46201
$293
Cash flow
17.2%
Cash-on-Cash Return
10.2%
Cap rate
1.2%
Rent to Value Ratio
Pending
$124,900
3
bds
|
1
ba
|
1,568
sqft
|
built
1910
1164 Groff Ave, Indianapolis, IN 46222
$312
Cash flow
13.0%
Cash-on-Cash Return
9.3%
Cap rate
1.1%
Rent to Value Ratio
Active
$260,000
3
bds
|
3
ba
|
1,794
sqft
|
built
1921
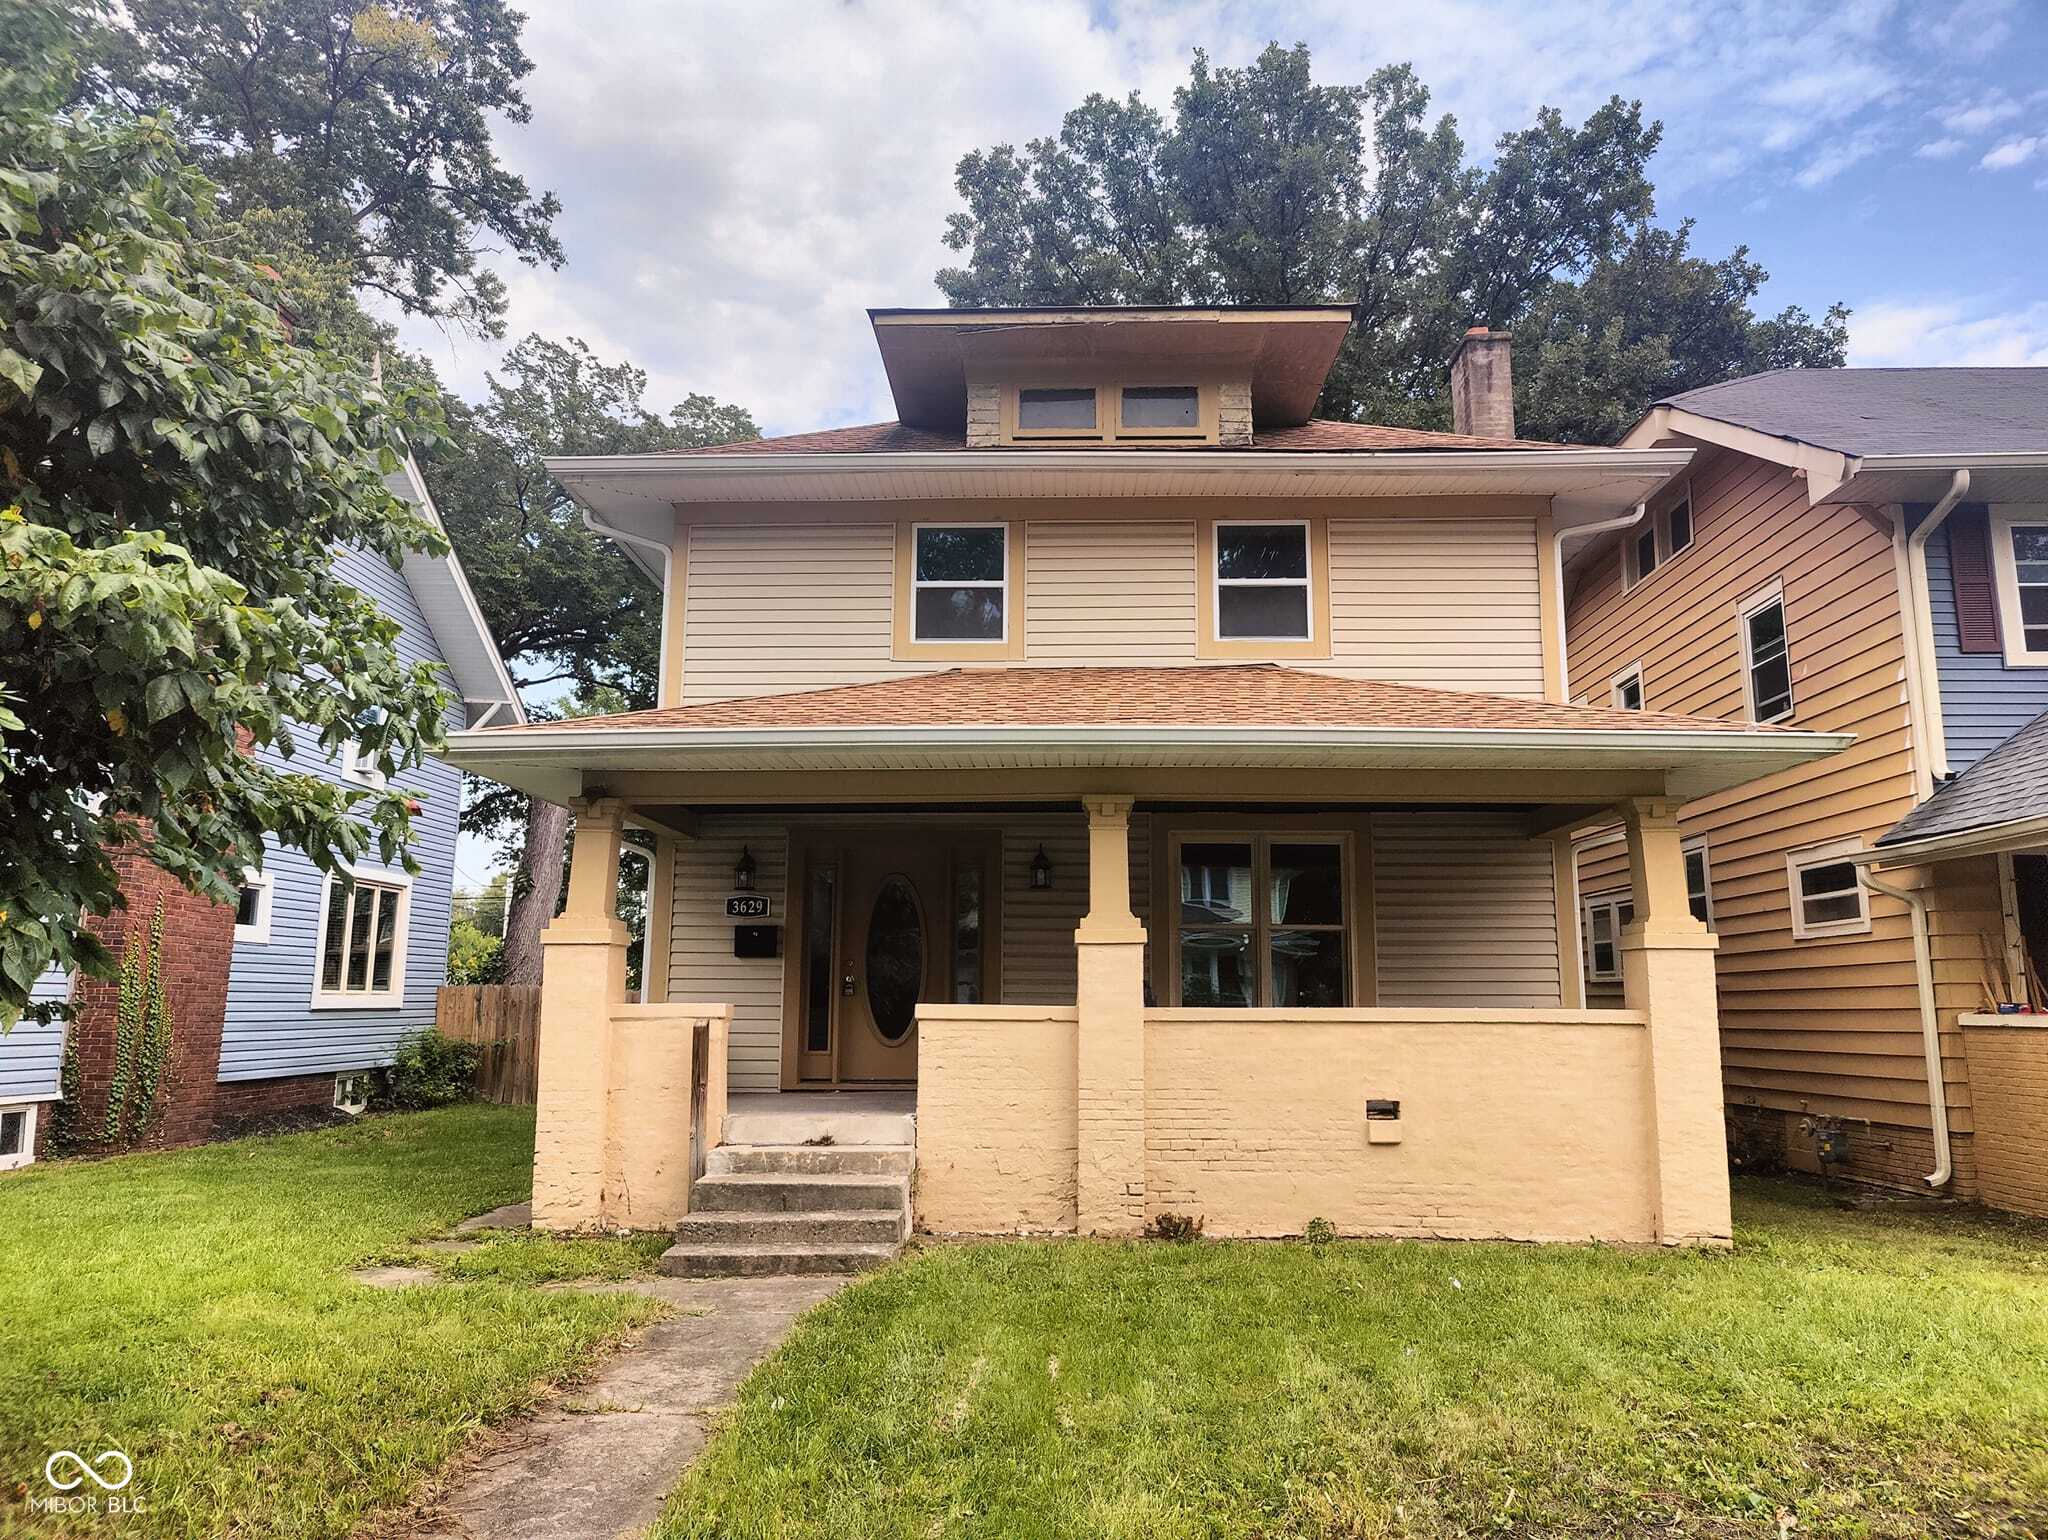
3629 Birchwood Ave, Indianapolis, IN 46205
$18
Cash flow
0.4%
Cash-on-Cash Return
6.4%
Cap rate
0.8%
Rent to Value Ratio
Active
$155,000
3
bds
|
1
ba
|
1,809
sqft
|
built
1949
3305 N Keystone Ave, Indianapolis, IN 46218
$85
Cash flow
2.9%
Cash-on-Cash Return
6.9%
Cap rate
0.8%
Rent to Value Ratio
Active
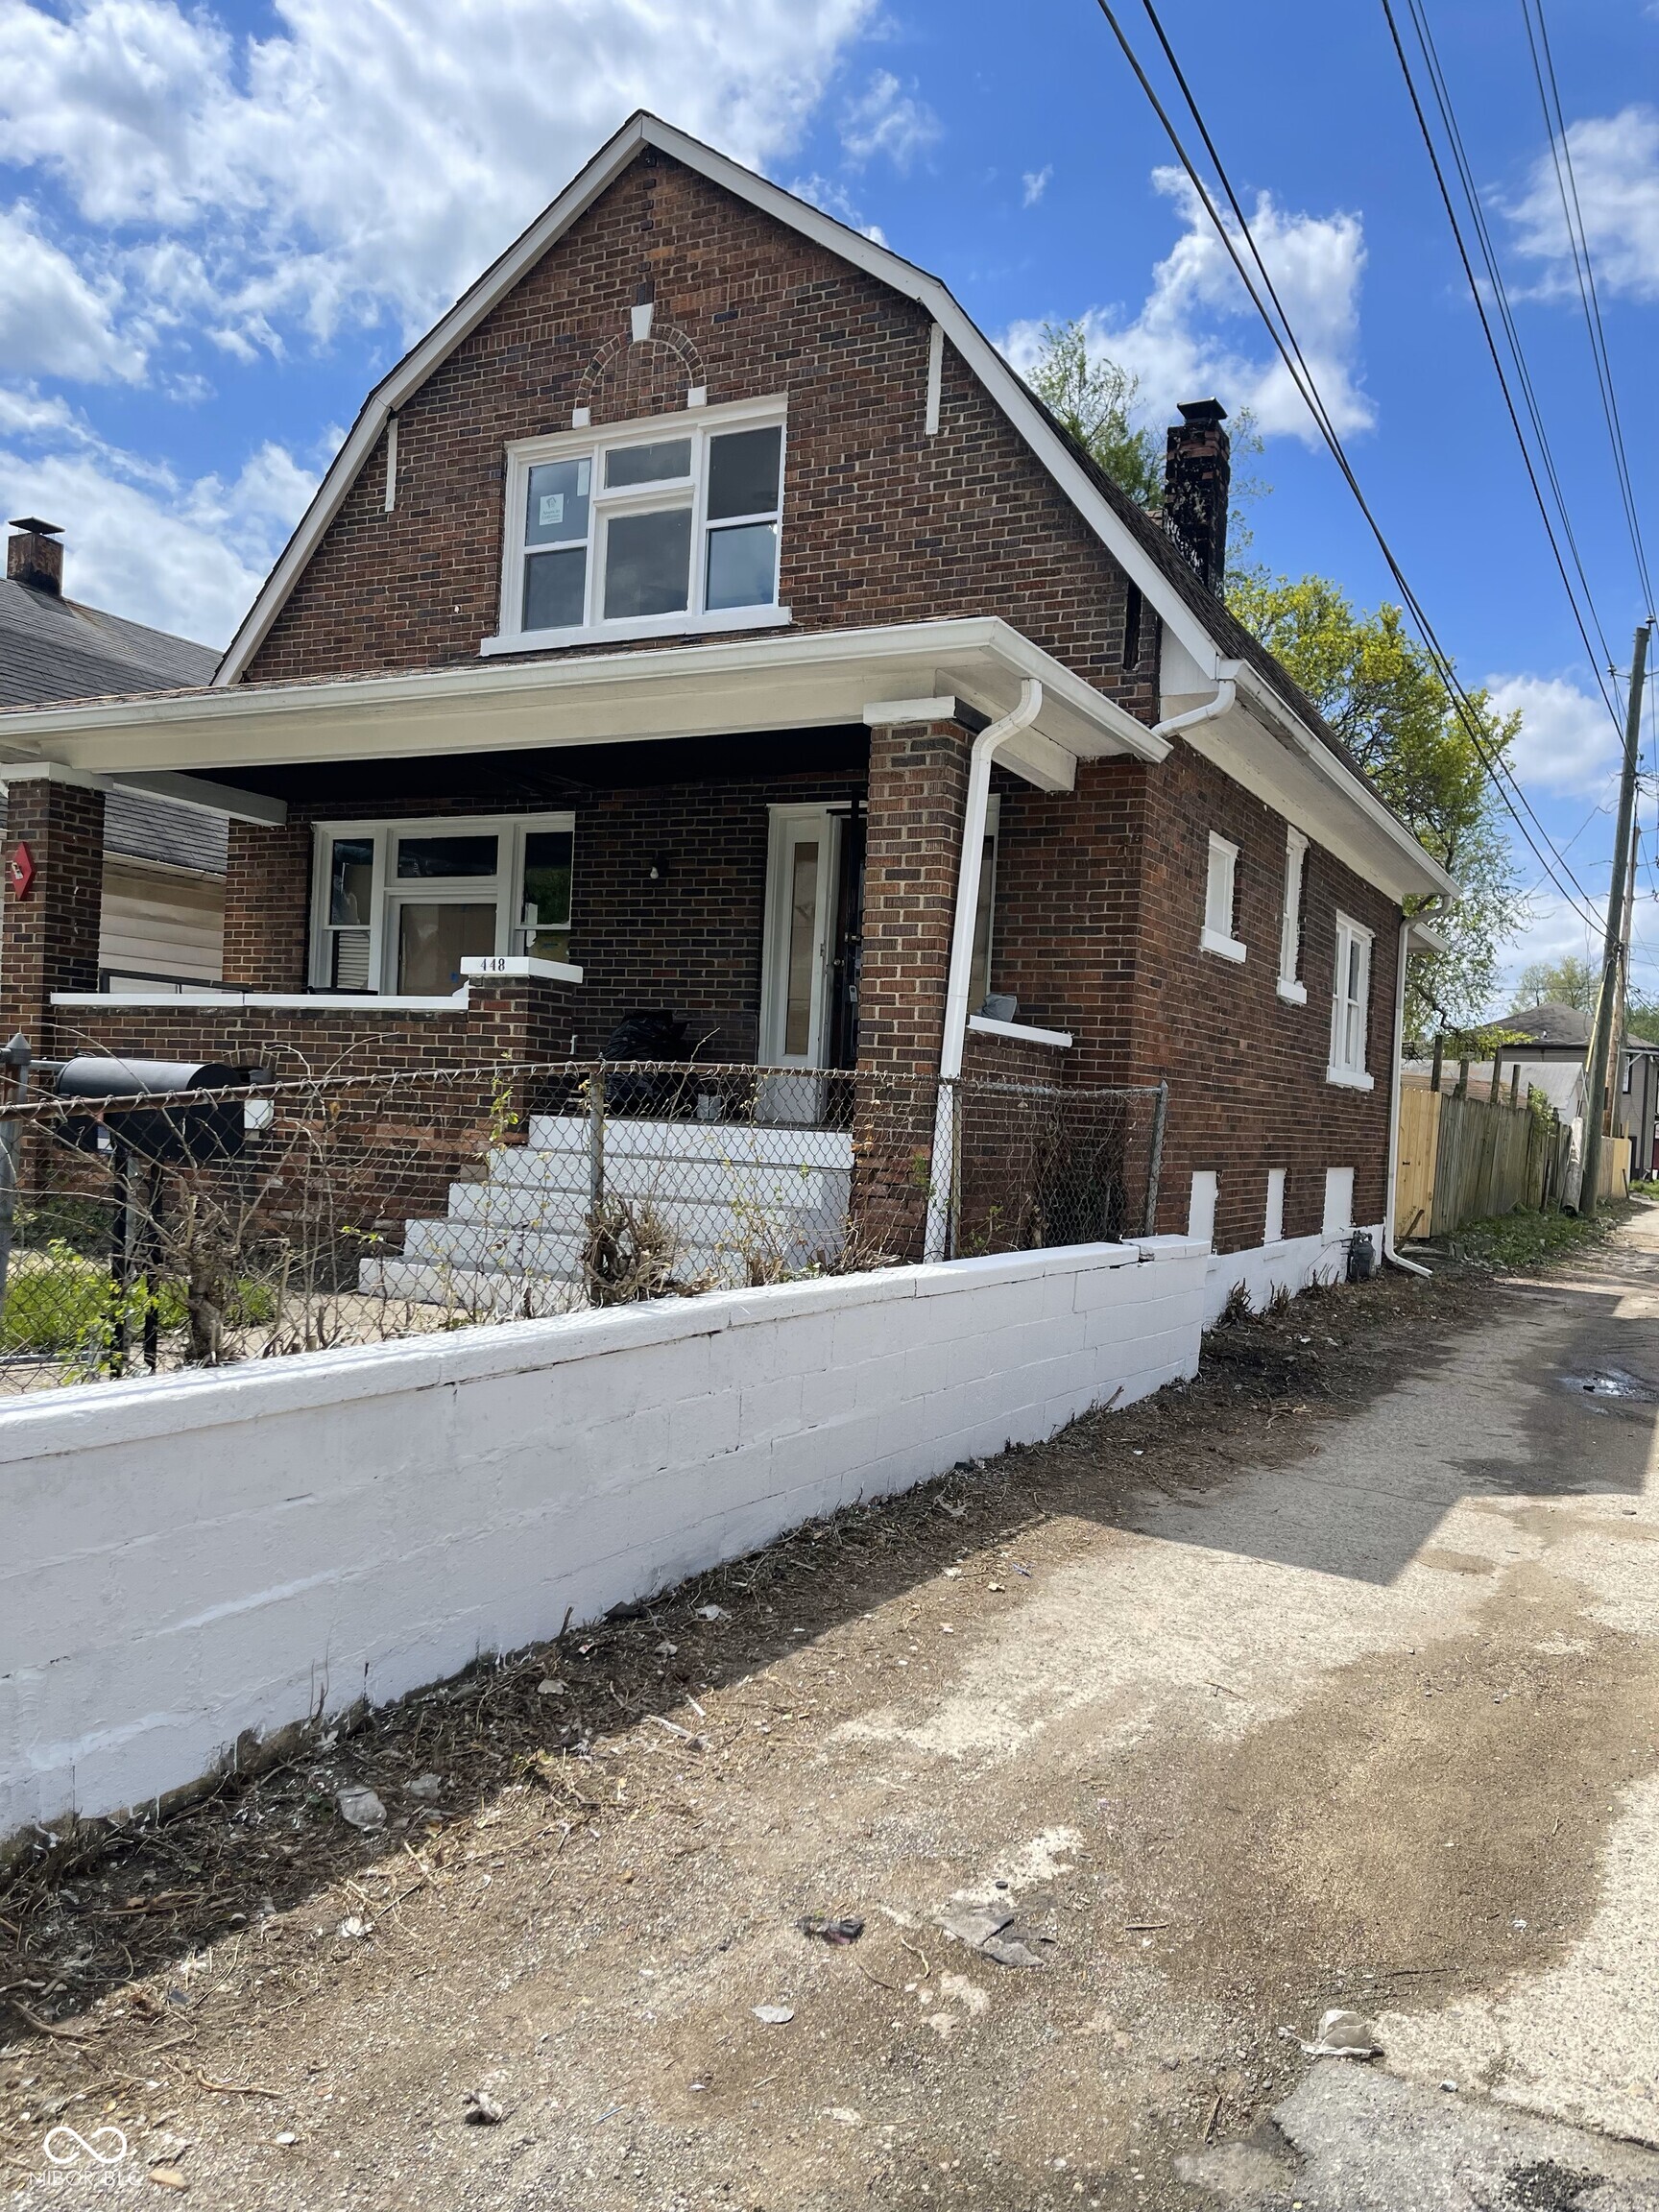
$175,000
2
bds
|
1
ba
|
1,642
sqft
|
built
1920
448 N Gray St, Indianapolis, IN 46201
$188
Cash flow
5.6%
Cash-on-Cash Return
7.6%
Cap rate
0.9%
Rent to Value Ratio
Active
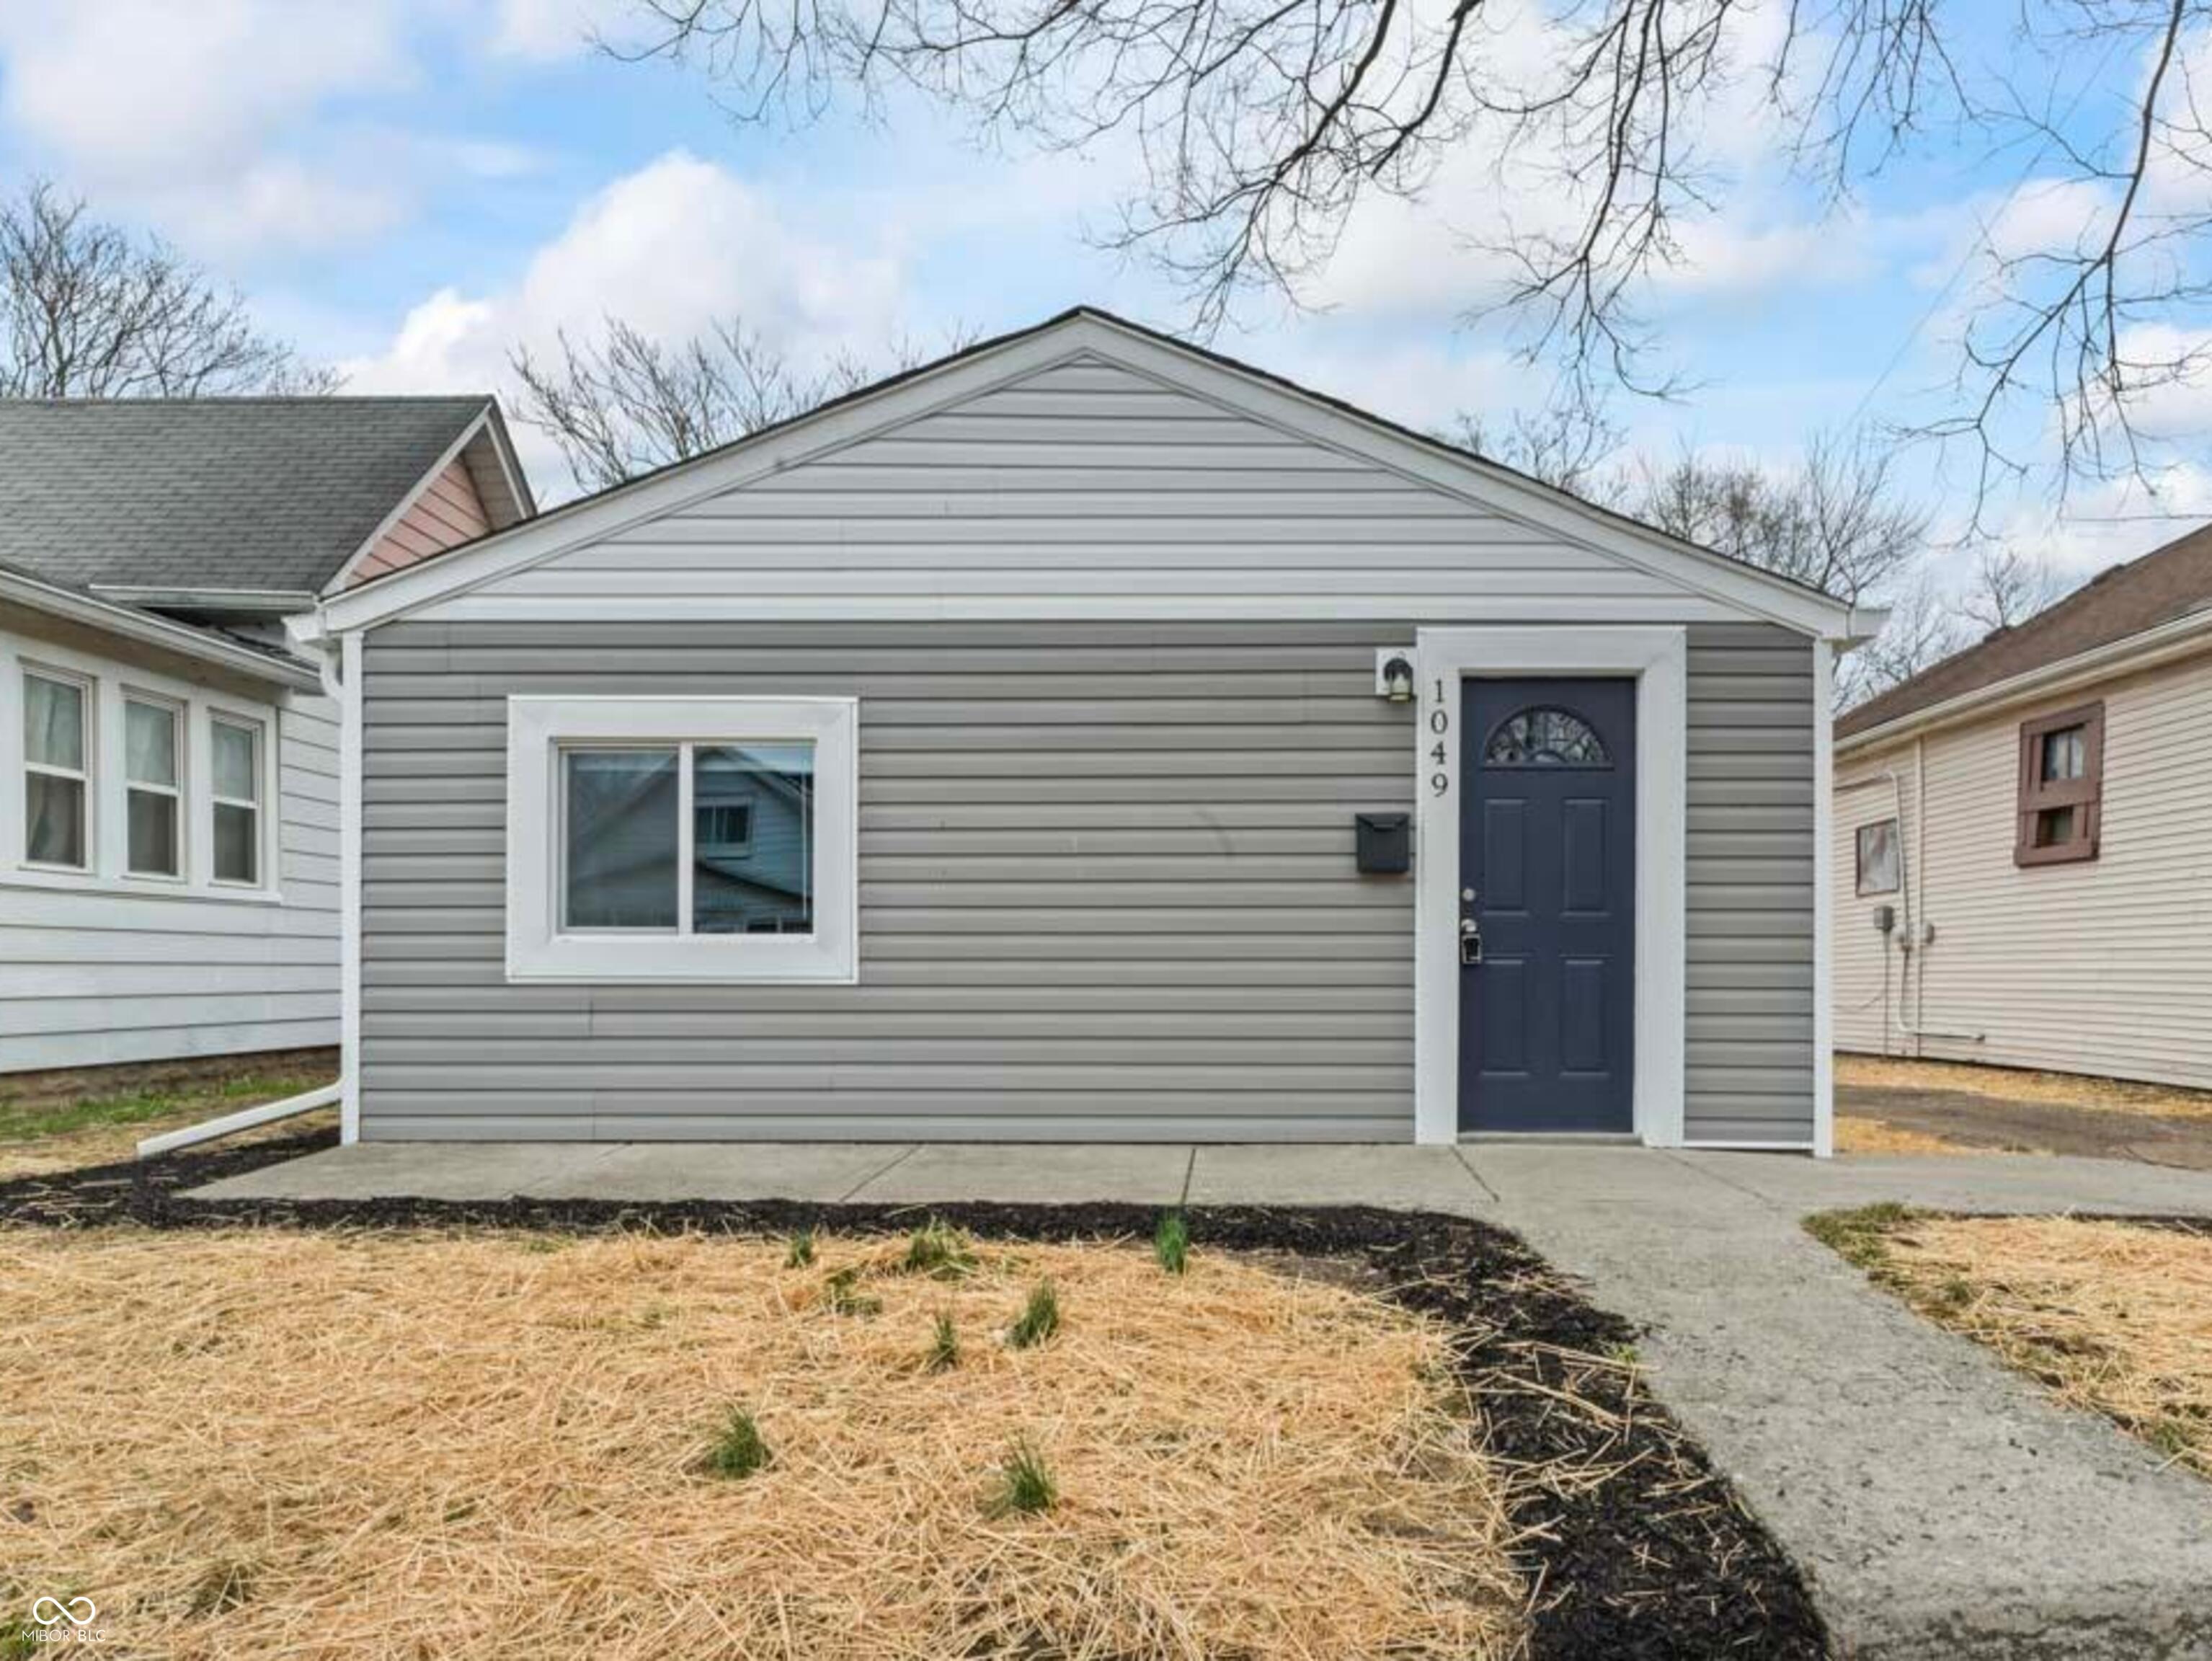
$109,900
2
bds
|
1
ba
|
606
sqft
|
built
1955
1049 N Traub Ave, Indianapolis, IN 46222
$183
Cash flow
8.7%
Cash-on-Cash Return
8.3%
Cap rate
1.0%
Rent to Value Ratio
Active
$84,900
2
bds
|
2
ba
|
1,584
sqft
|
built
1911
439 N Colorado Ave, Indianapolis, IN 46201
$314
Cash flow
19.3%
Cash-on-Cash Return
10.7%
Cap rate
1.3%
Rent to Value Ratio
Active
$599,900
3
bds
|
7
ba
|
3,072
sqft
|
built
1868
902 Broadway St, Indianapolis, IN 46202
$239
Cash flow
2.1%
Cash-on-Cash Return
6.8%
Cap rate
0.8%
Rent to Value Ratio
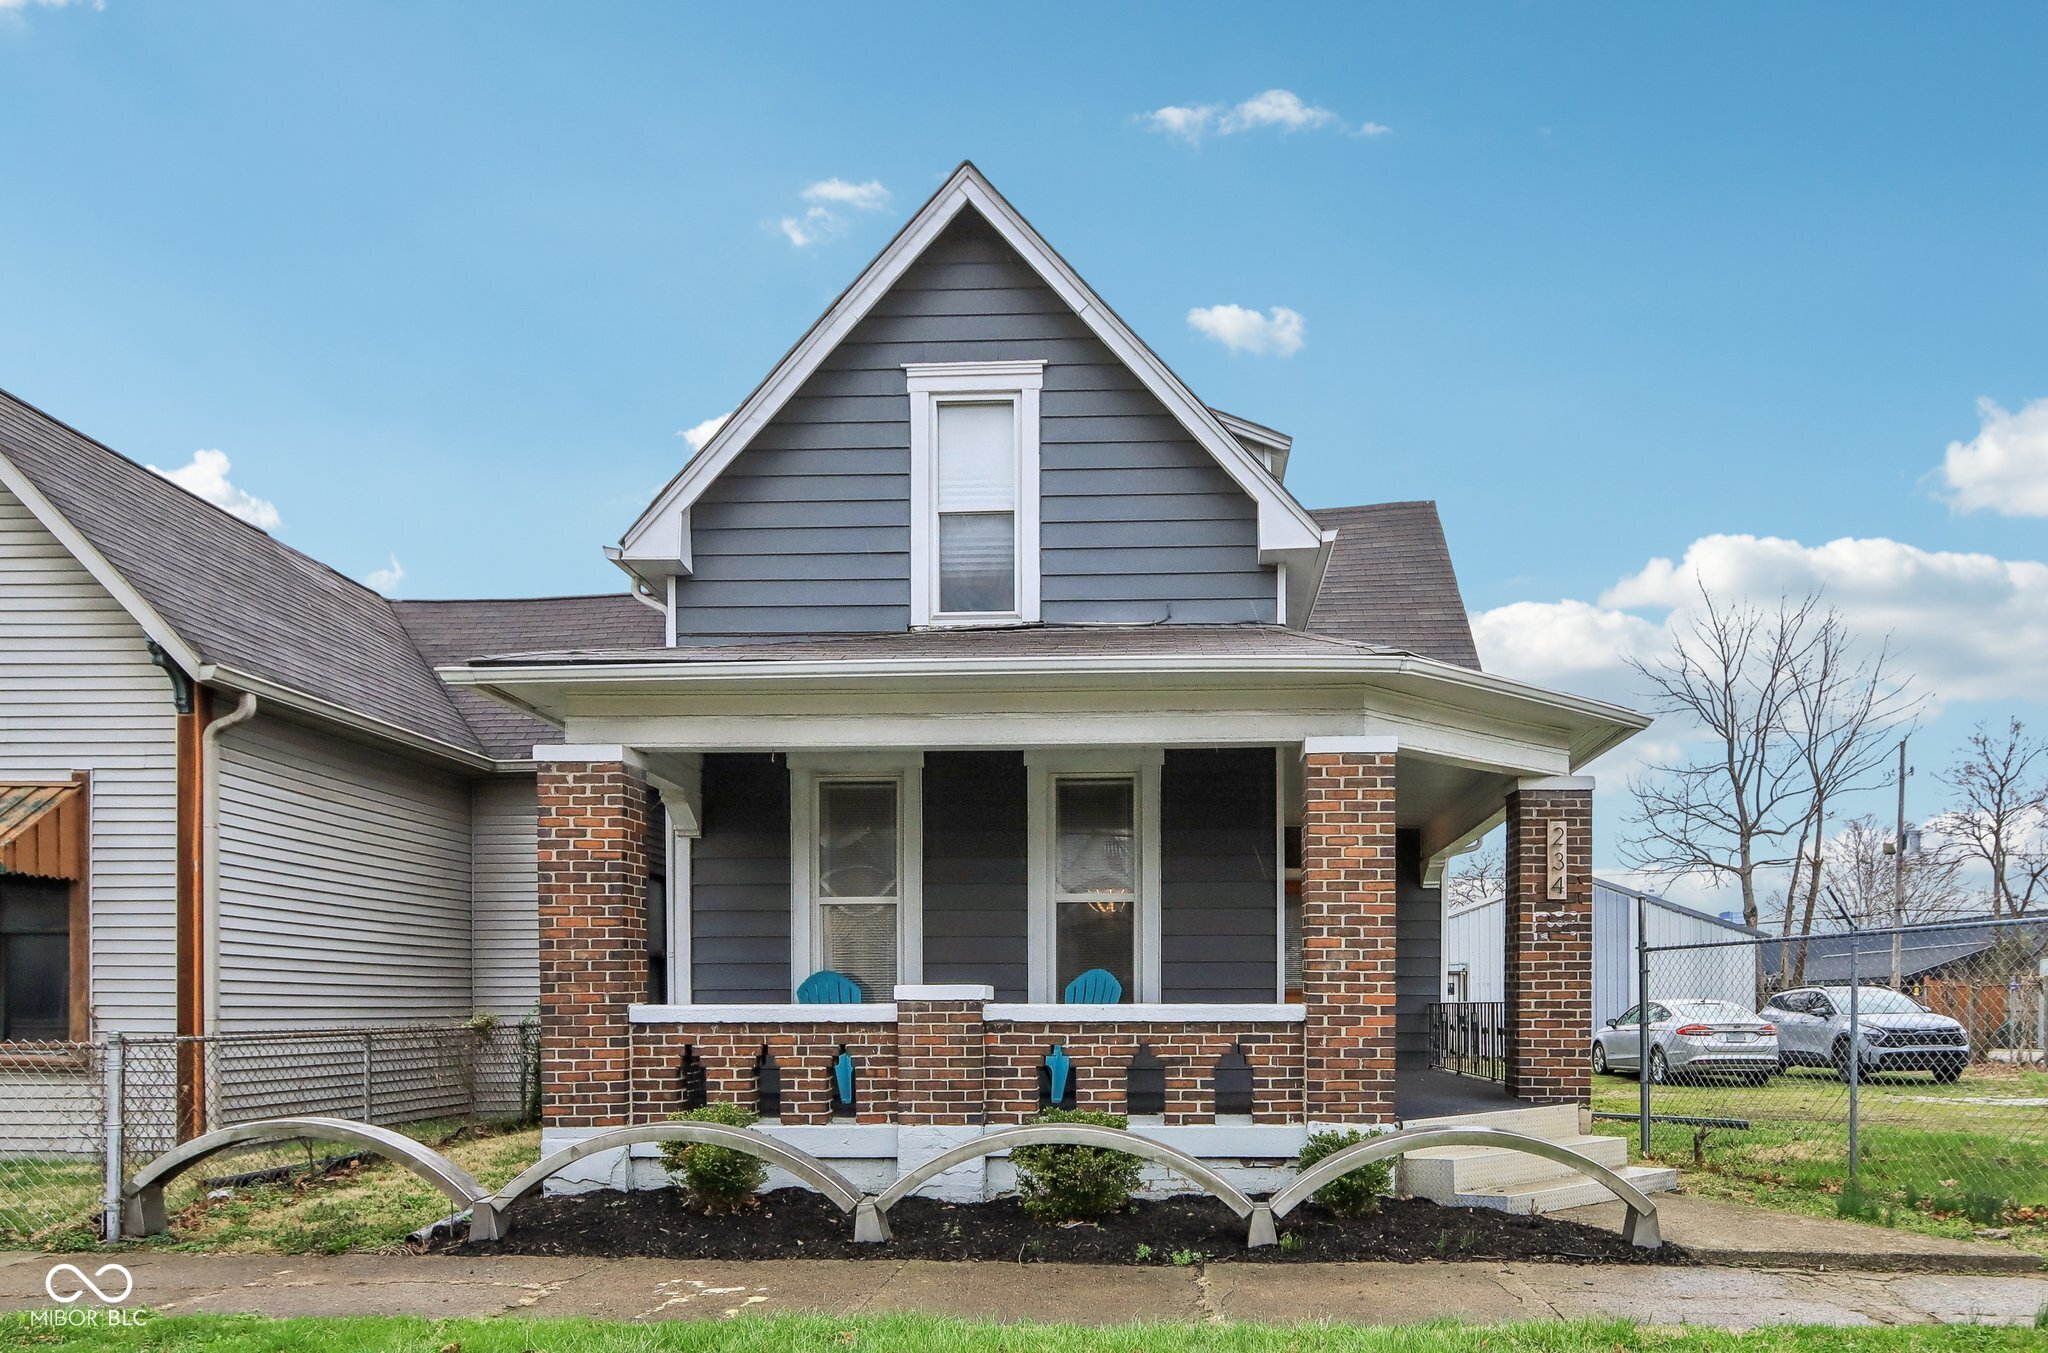
Active
$263,000
4
bds
|
2
ba
|
2,270
sqft
|
built
1920
234 S State Ave, Indianapolis, IN 46201
$210
Cash flow
4.2%
Cash-on-Cash Return
7.2%
Cap rate
0.9%
Rent to Value Ratio
Active
$190,000
3
bds
|
1
ba
|
1,128
sqft
|
built
1962
1601 Draper St, Indianapolis, IN 46203
$247
Cash flow
6.8%
Cash-on-Cash Return
7.8%
Cap rate
0.9%
Rent to Value Ratio
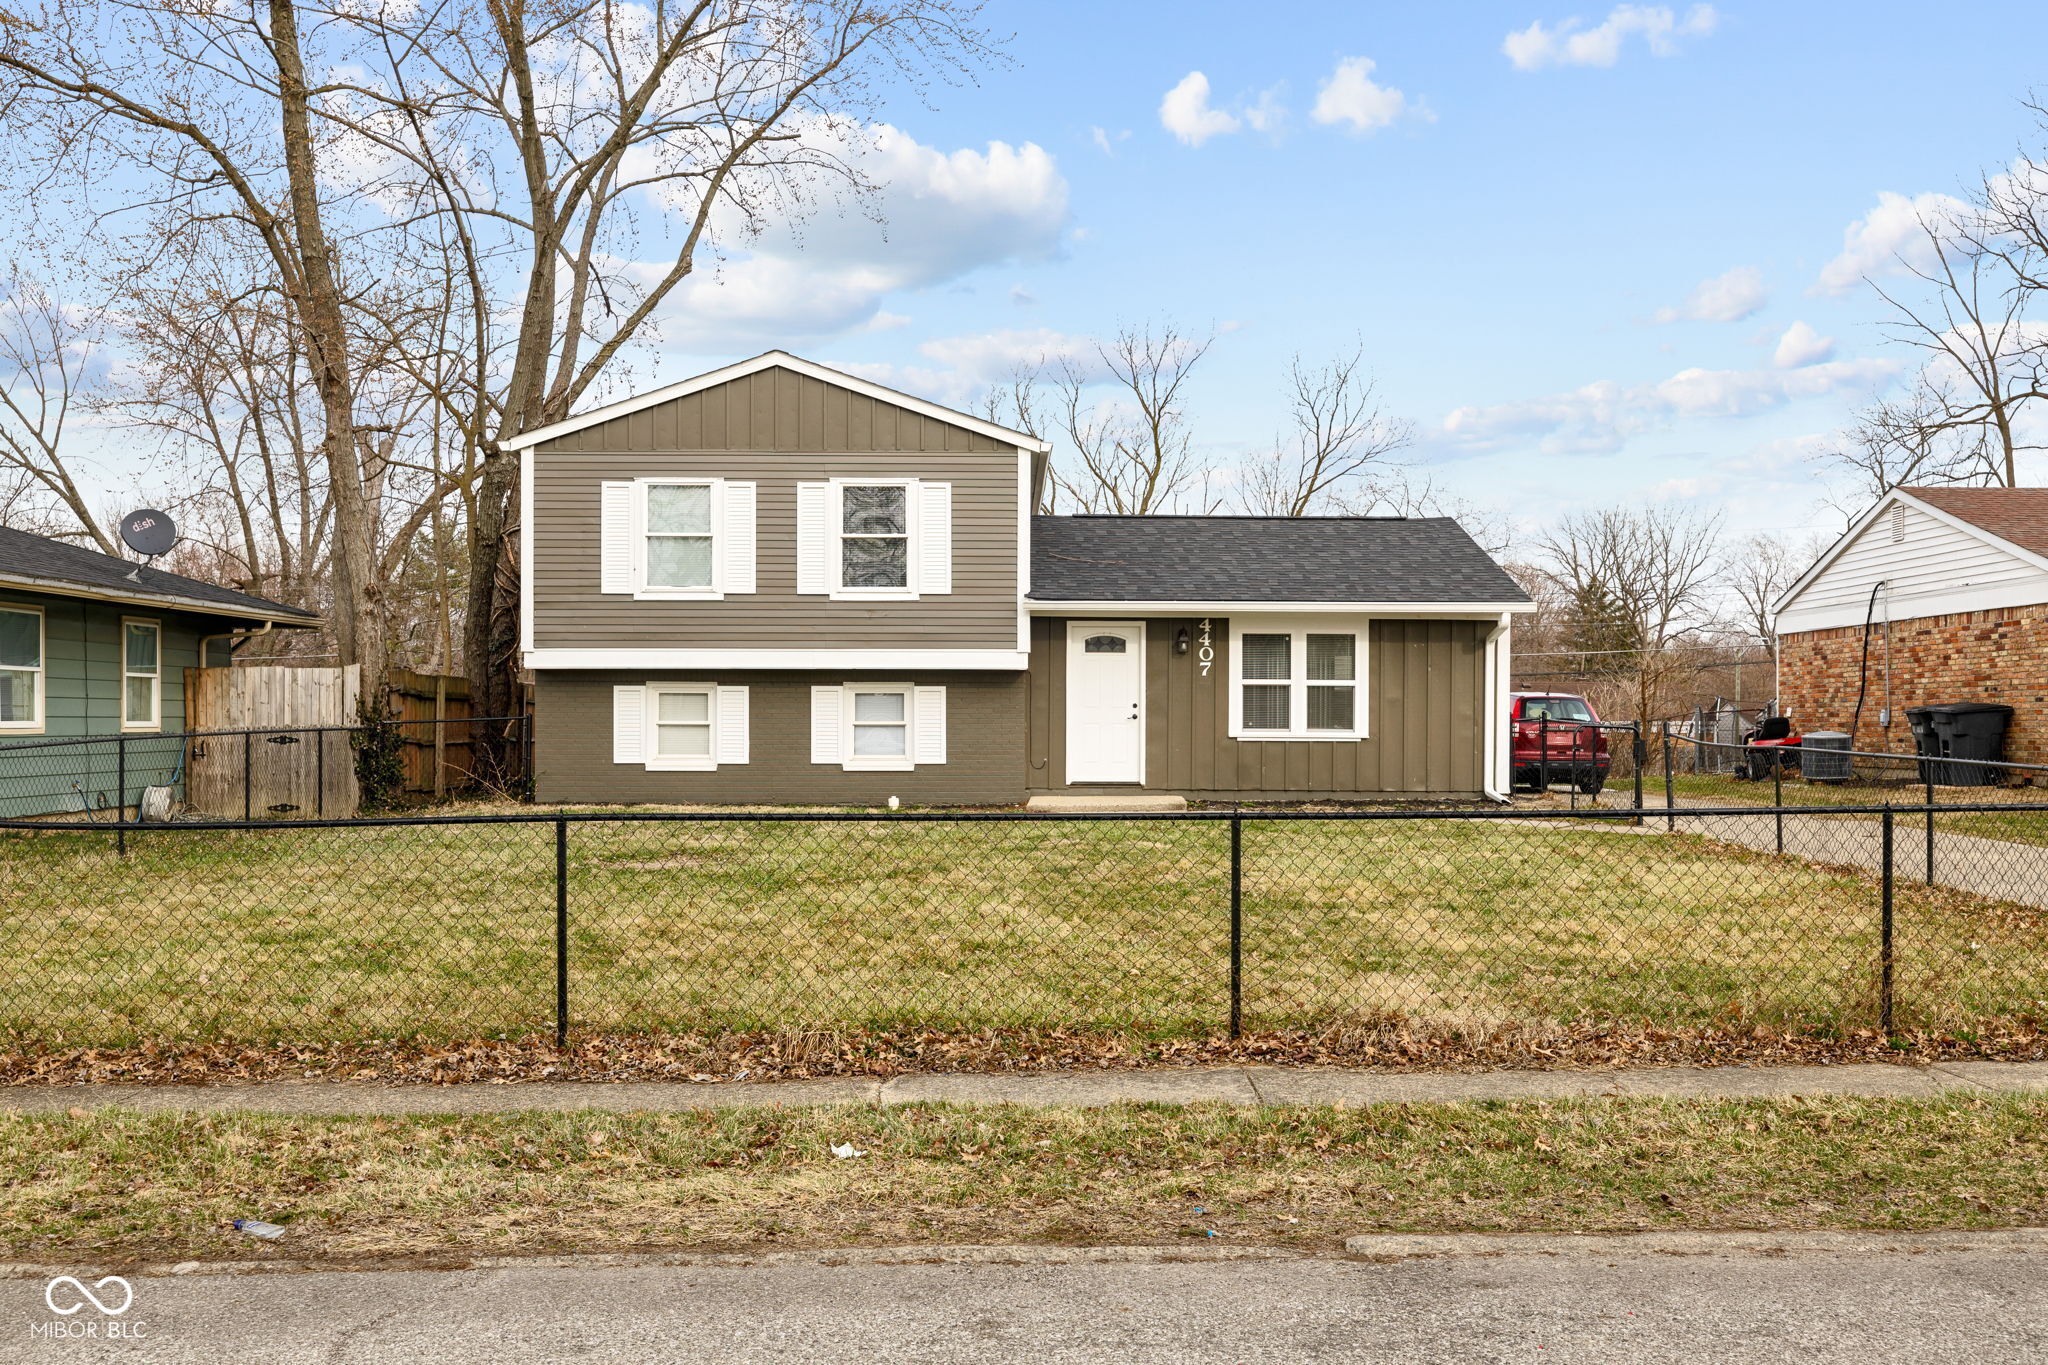
Active
$250,000
4
bds
|
2
ba
|
1,616
sqft
|
built
1960
4407 Barnor Dr, Indianapolis, IN 46226
$71
Cash flow
1.5%
Cash-on-Cash Return
6.6%
Cap rate
0.8%
Rent to Value Ratio
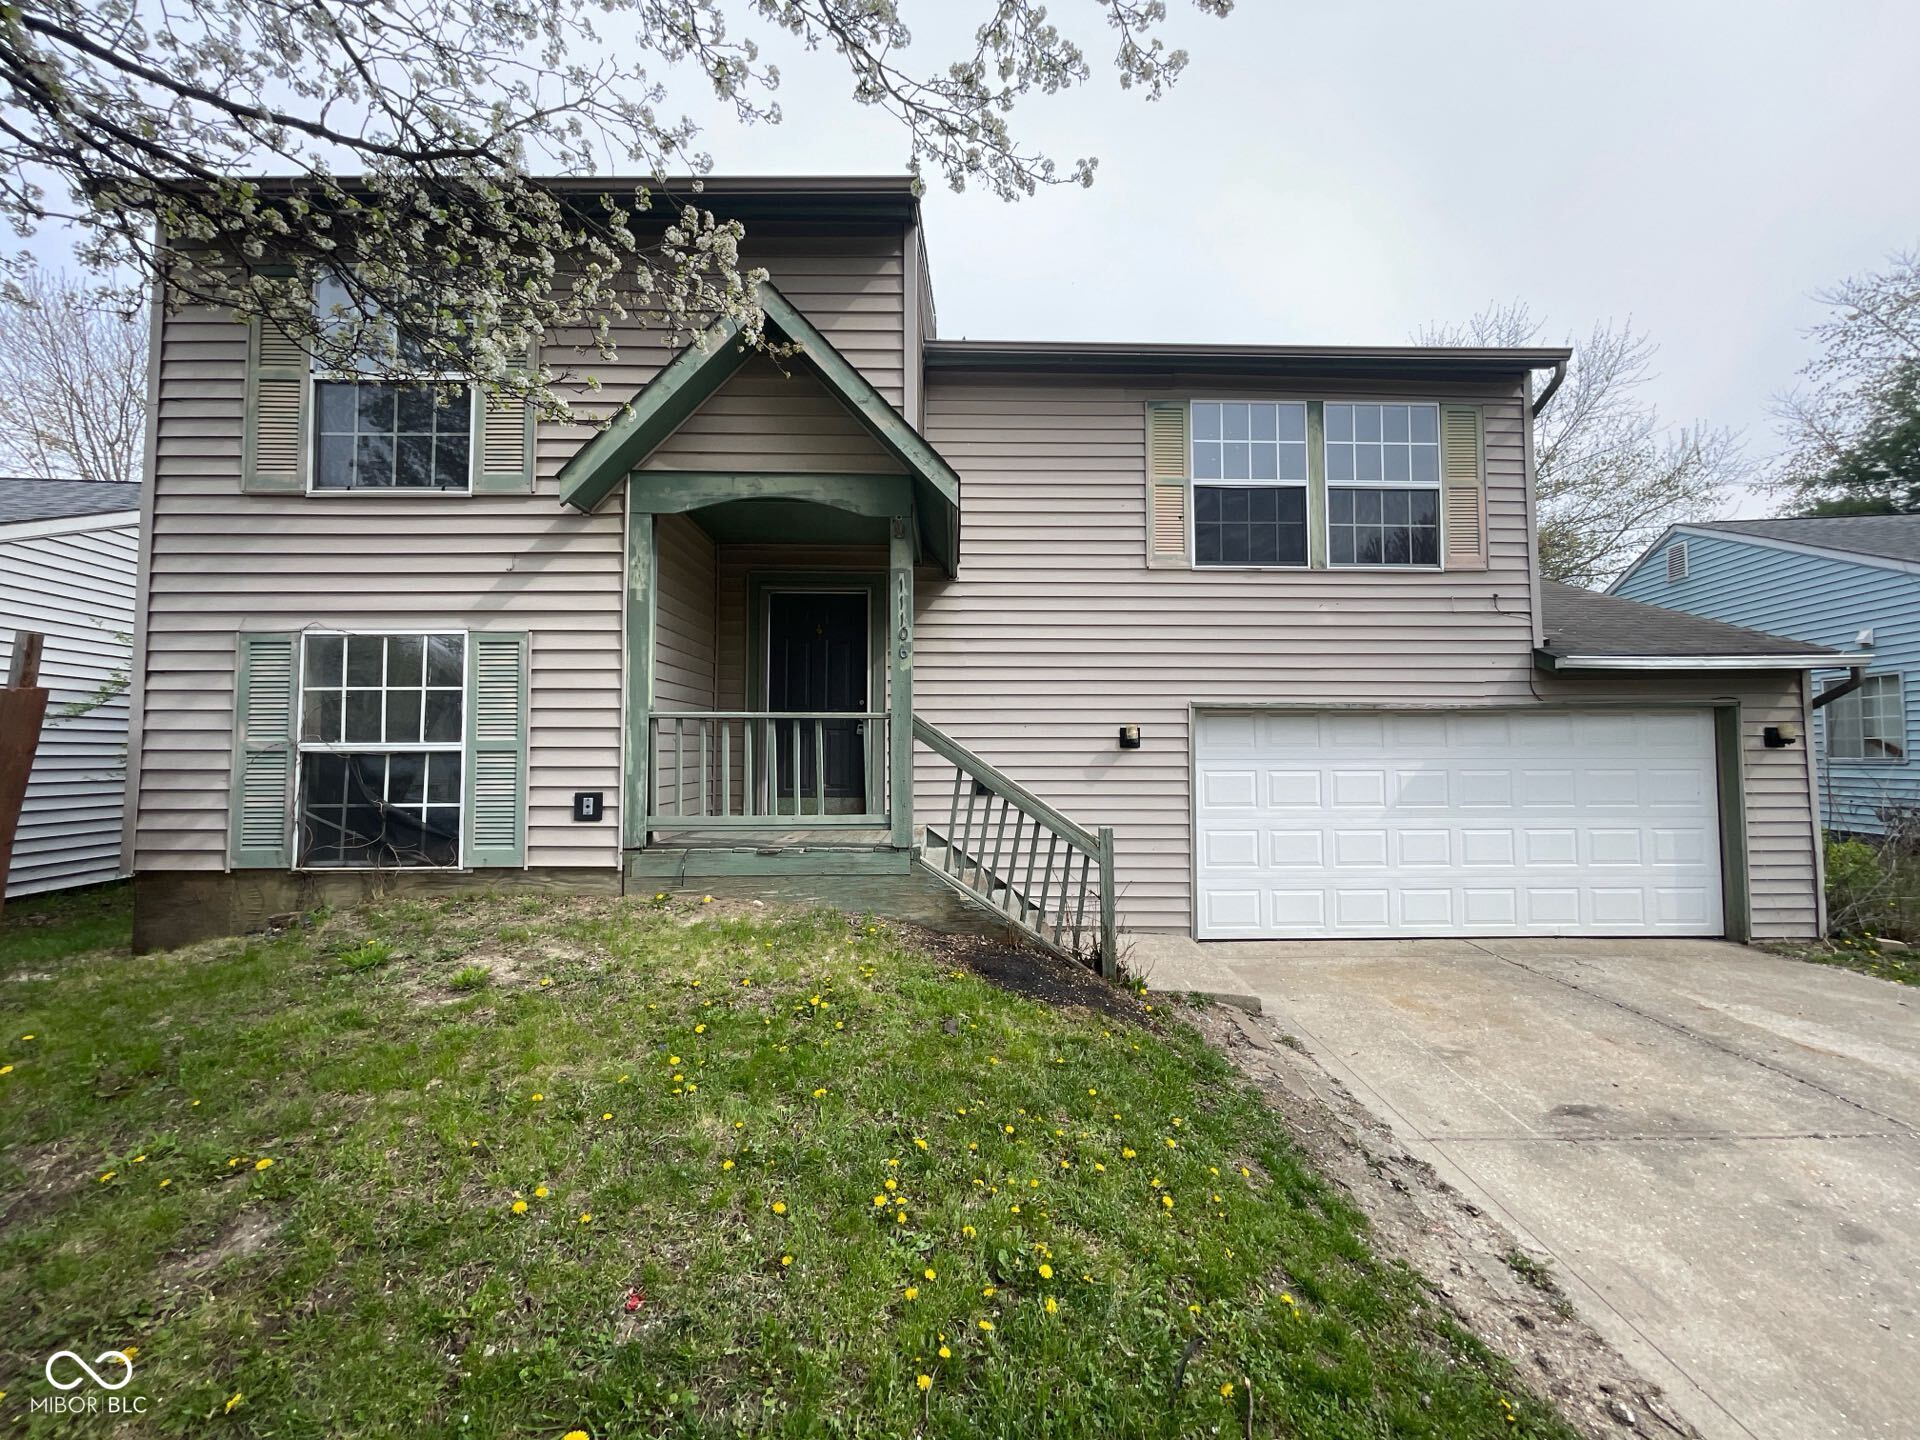
Active
$192,000
3
bds
|
2
ba
|
1,500
sqft
|
built
1991
11106 Wismar Dr, Indianapolis, IN 46235
$237
Cash flow
6.4%
Cash-on-Cash Return
7.8%
Cap rate
0.9%
Rent to Value Ratio
Active
$185,000
3
bds
|
1
ba
|
836
sqft
|
built
1927
531 N Alton Ave, Indianapolis, IN 46222
$-3
Cash flow
-0.1%
Cash-on-Cash Return
6.3%
Cap rate
0.8%
Rent to Value Ratio
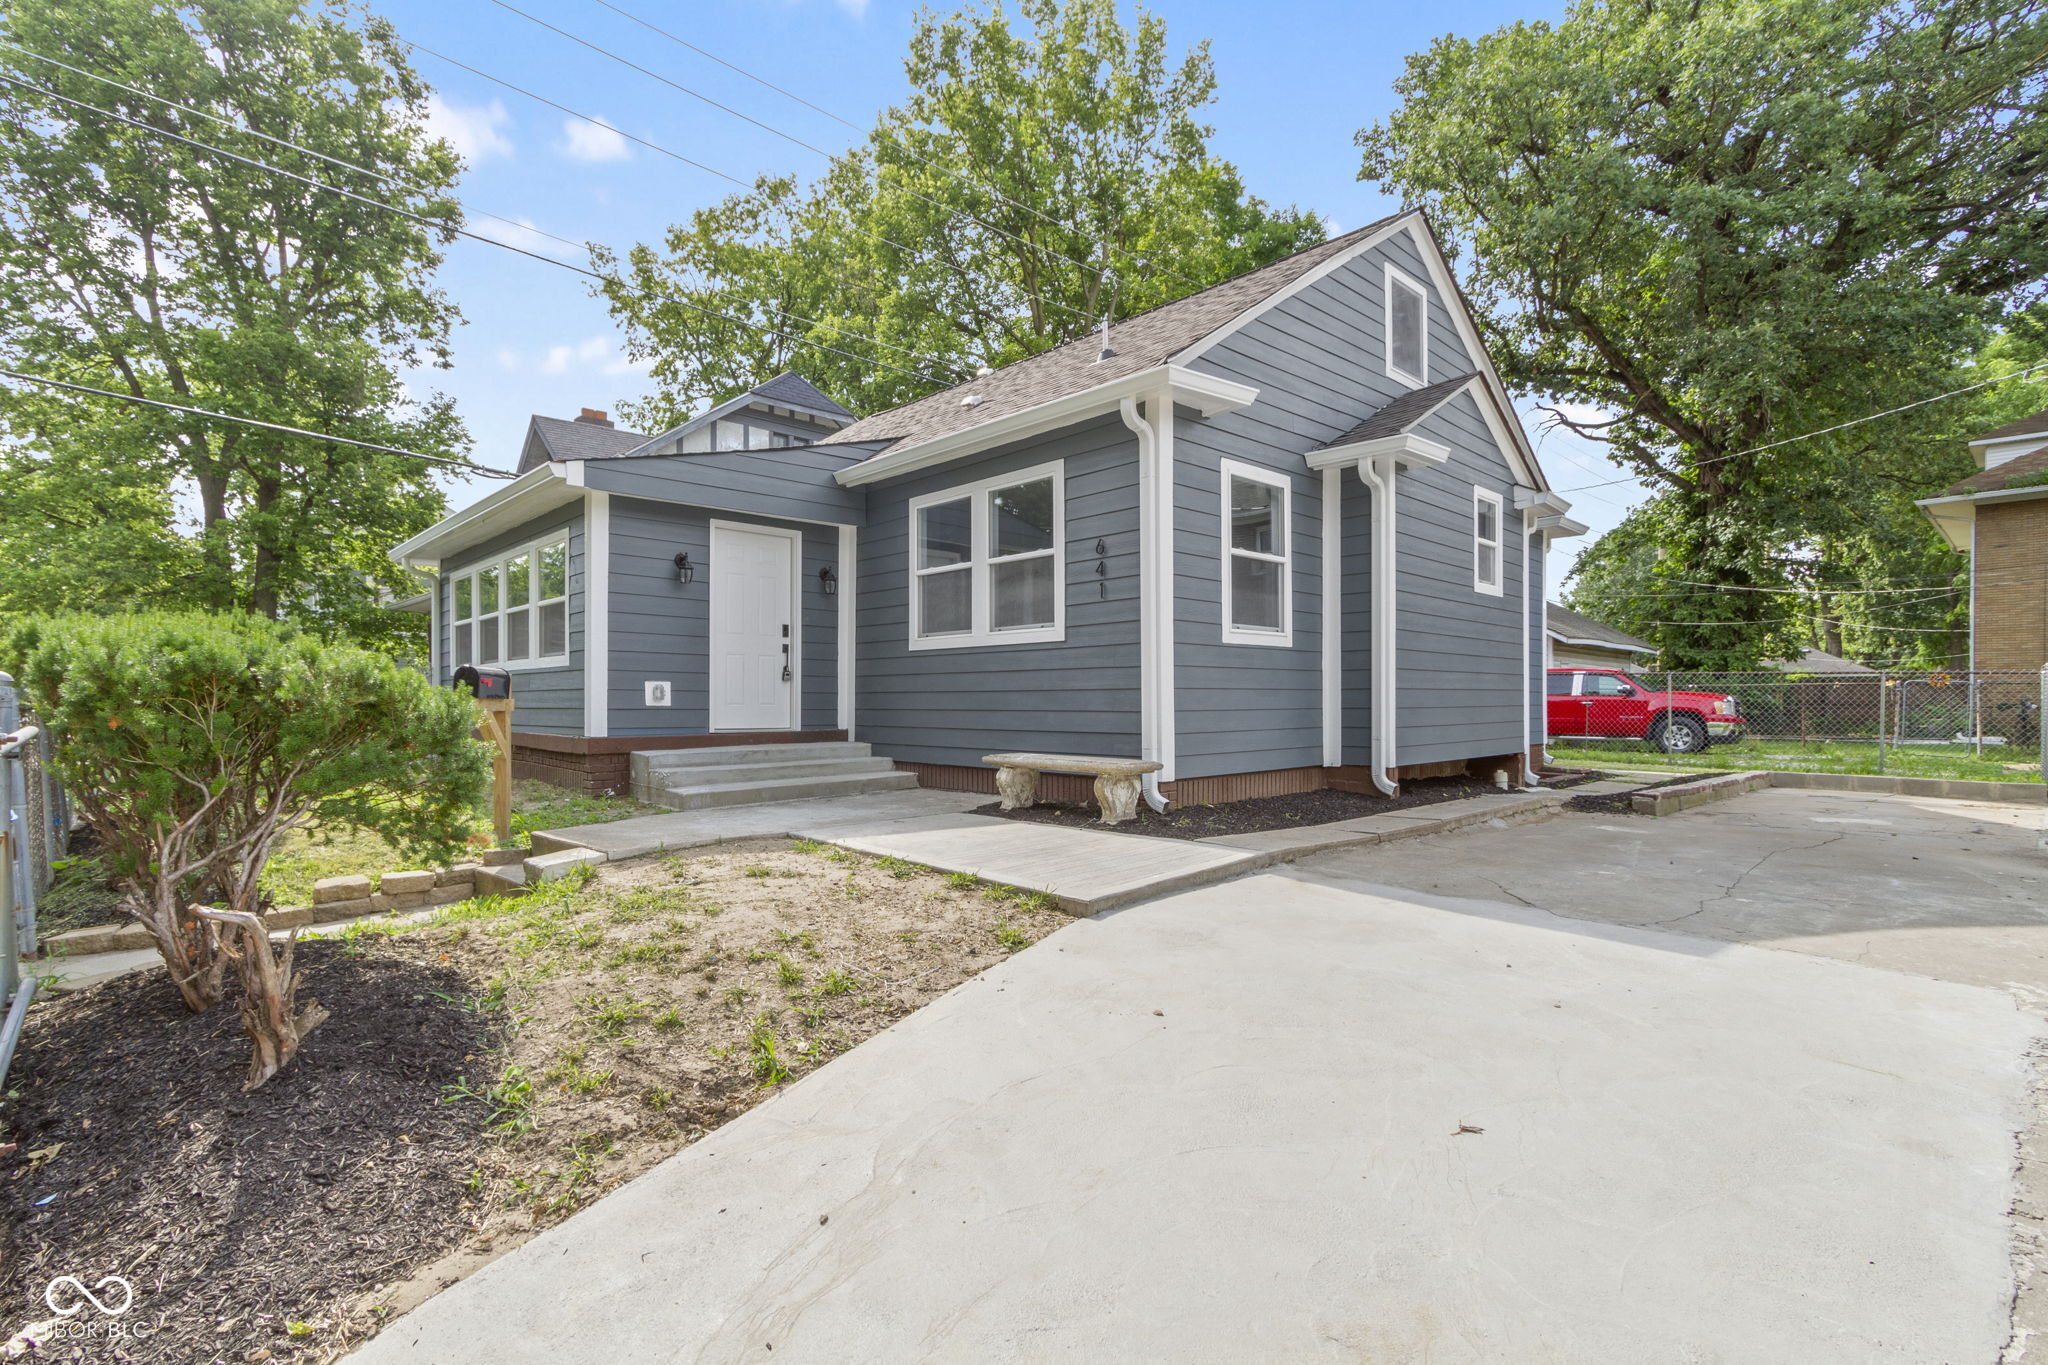
Active
$249,950
4
bds
|
3
ba
|
1,963
sqft
|
built
1923
641 E 33rd St, Indianapolis, IN 46205
$71
Cash flow
1.5%
Cash-on-Cash Return
6.6%
Cap rate
0.8%
Rent to Value Ratio
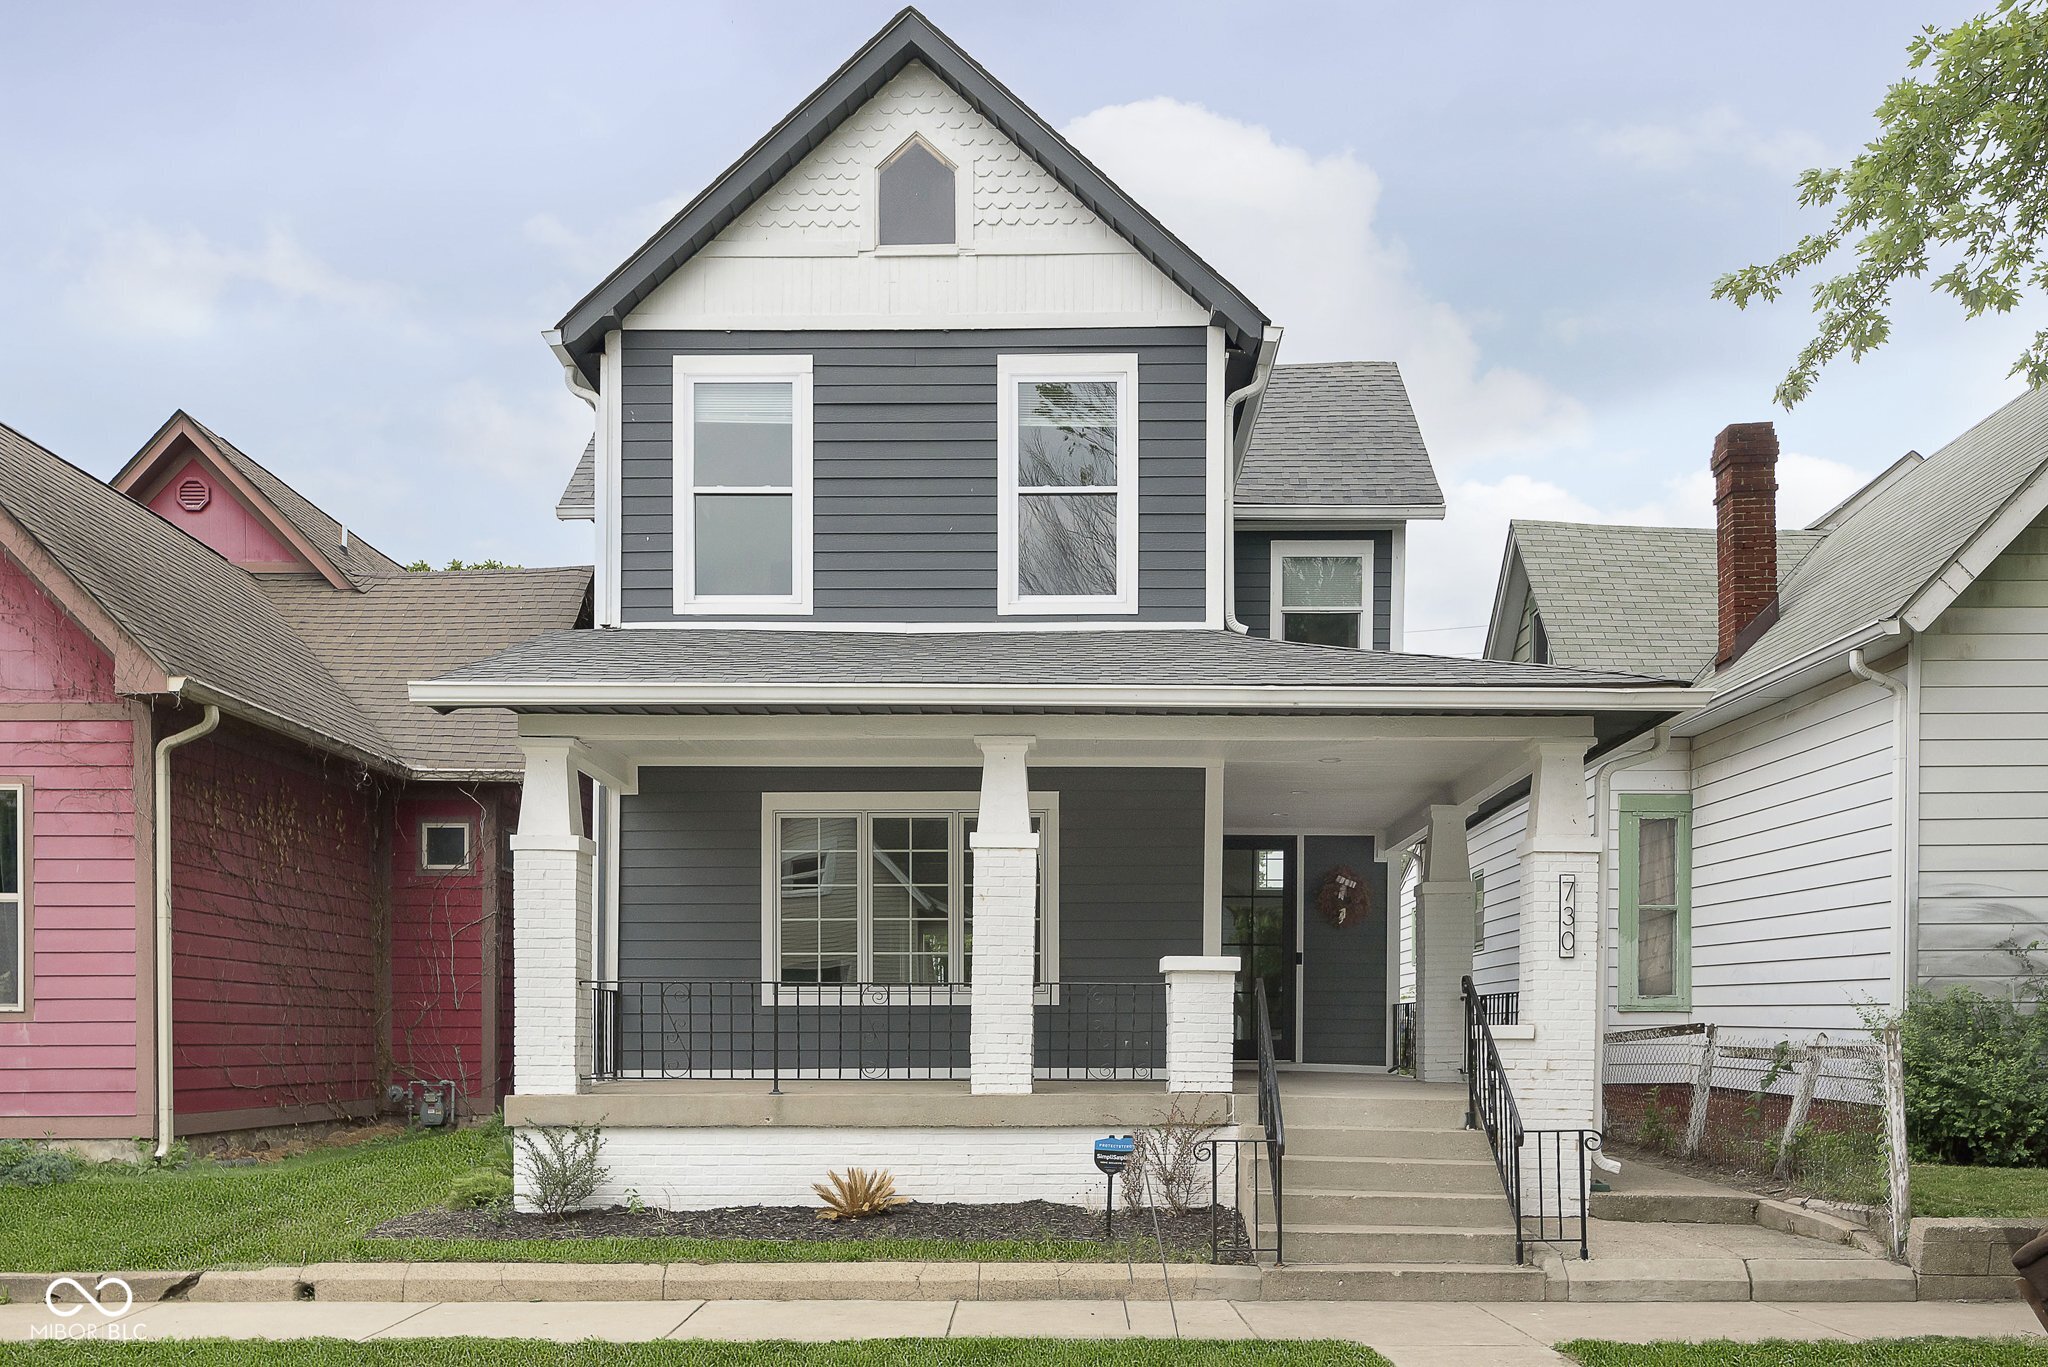
Active
$359,900
3
bds
|
3
ba
|
1,760
sqft
|
built
1880
730 Sanders St, Indianapolis, IN 46203
$47
Cash flow
0.7%
Cash-on-Cash Return
6.4%
Cap rate
0.8%
Rent to Value Ratio
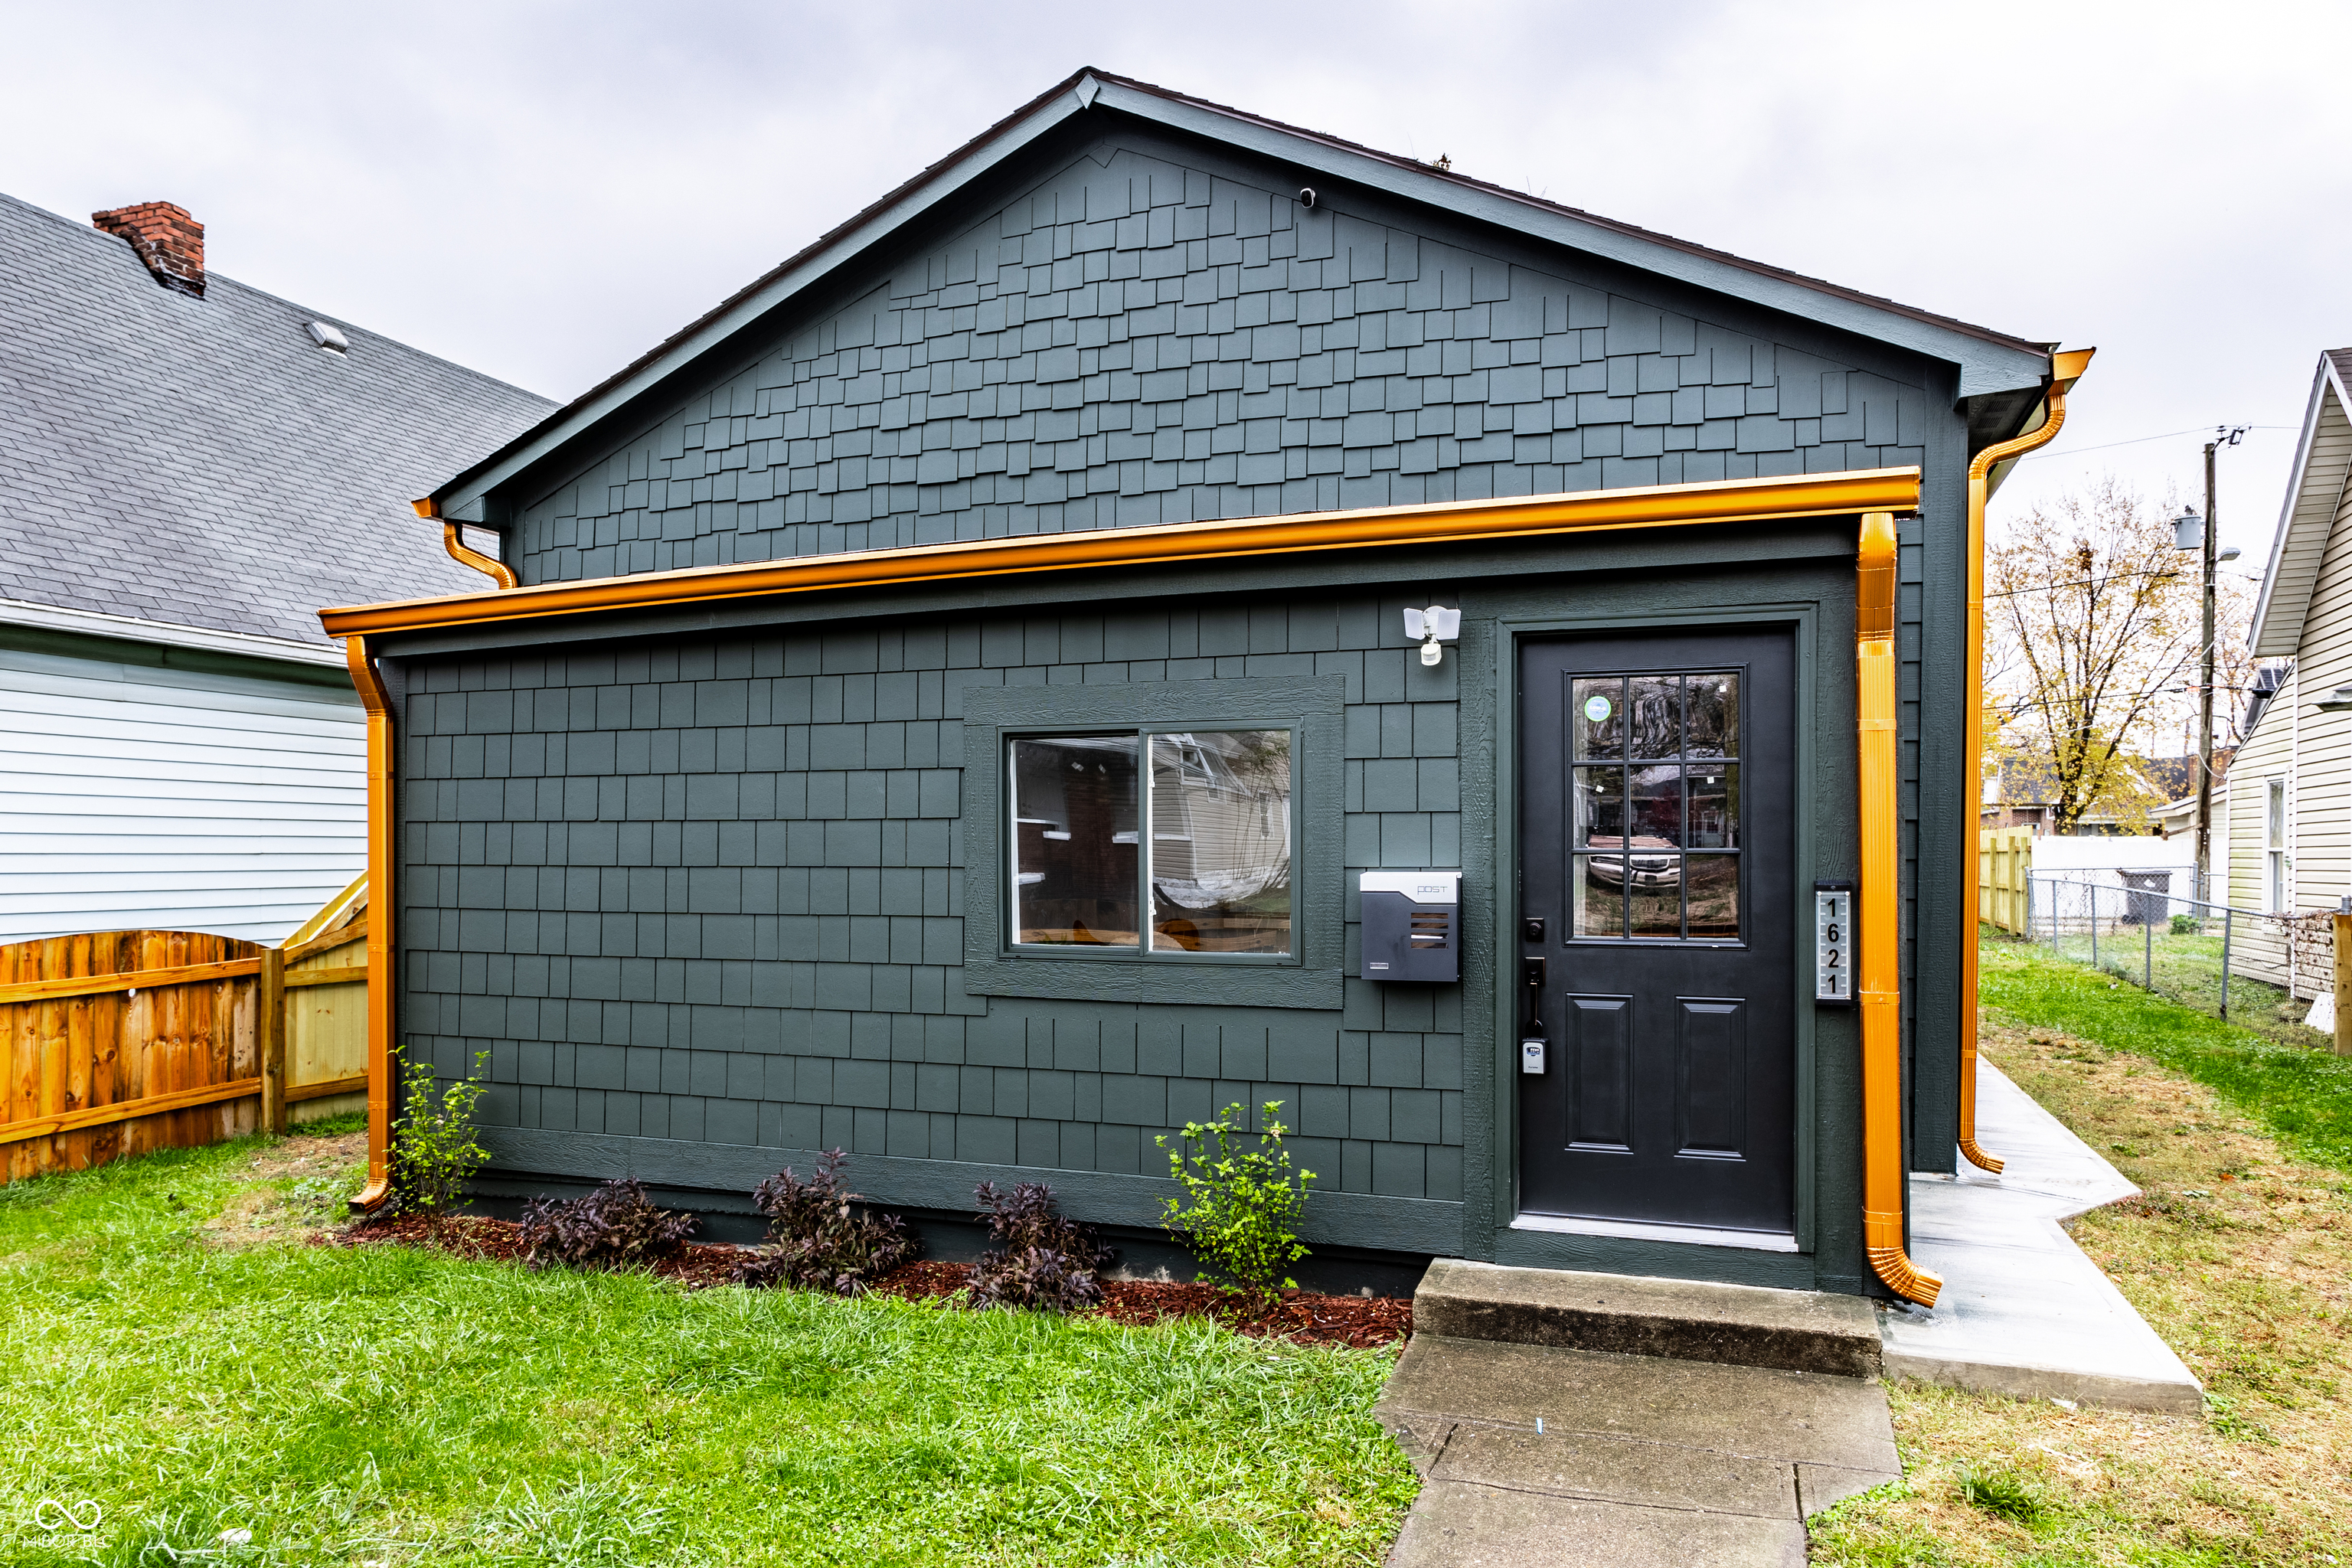
Active
$239,000
3
bds
|
2
ba
|
1,770
sqft
|
built
1920
1621 Draper St, Indianapolis, IN 46203
$266
Cash flow
5.8%
Cash-on-Cash Return
7.6%
Cap rate
0.9%
Rent to Value Ratio
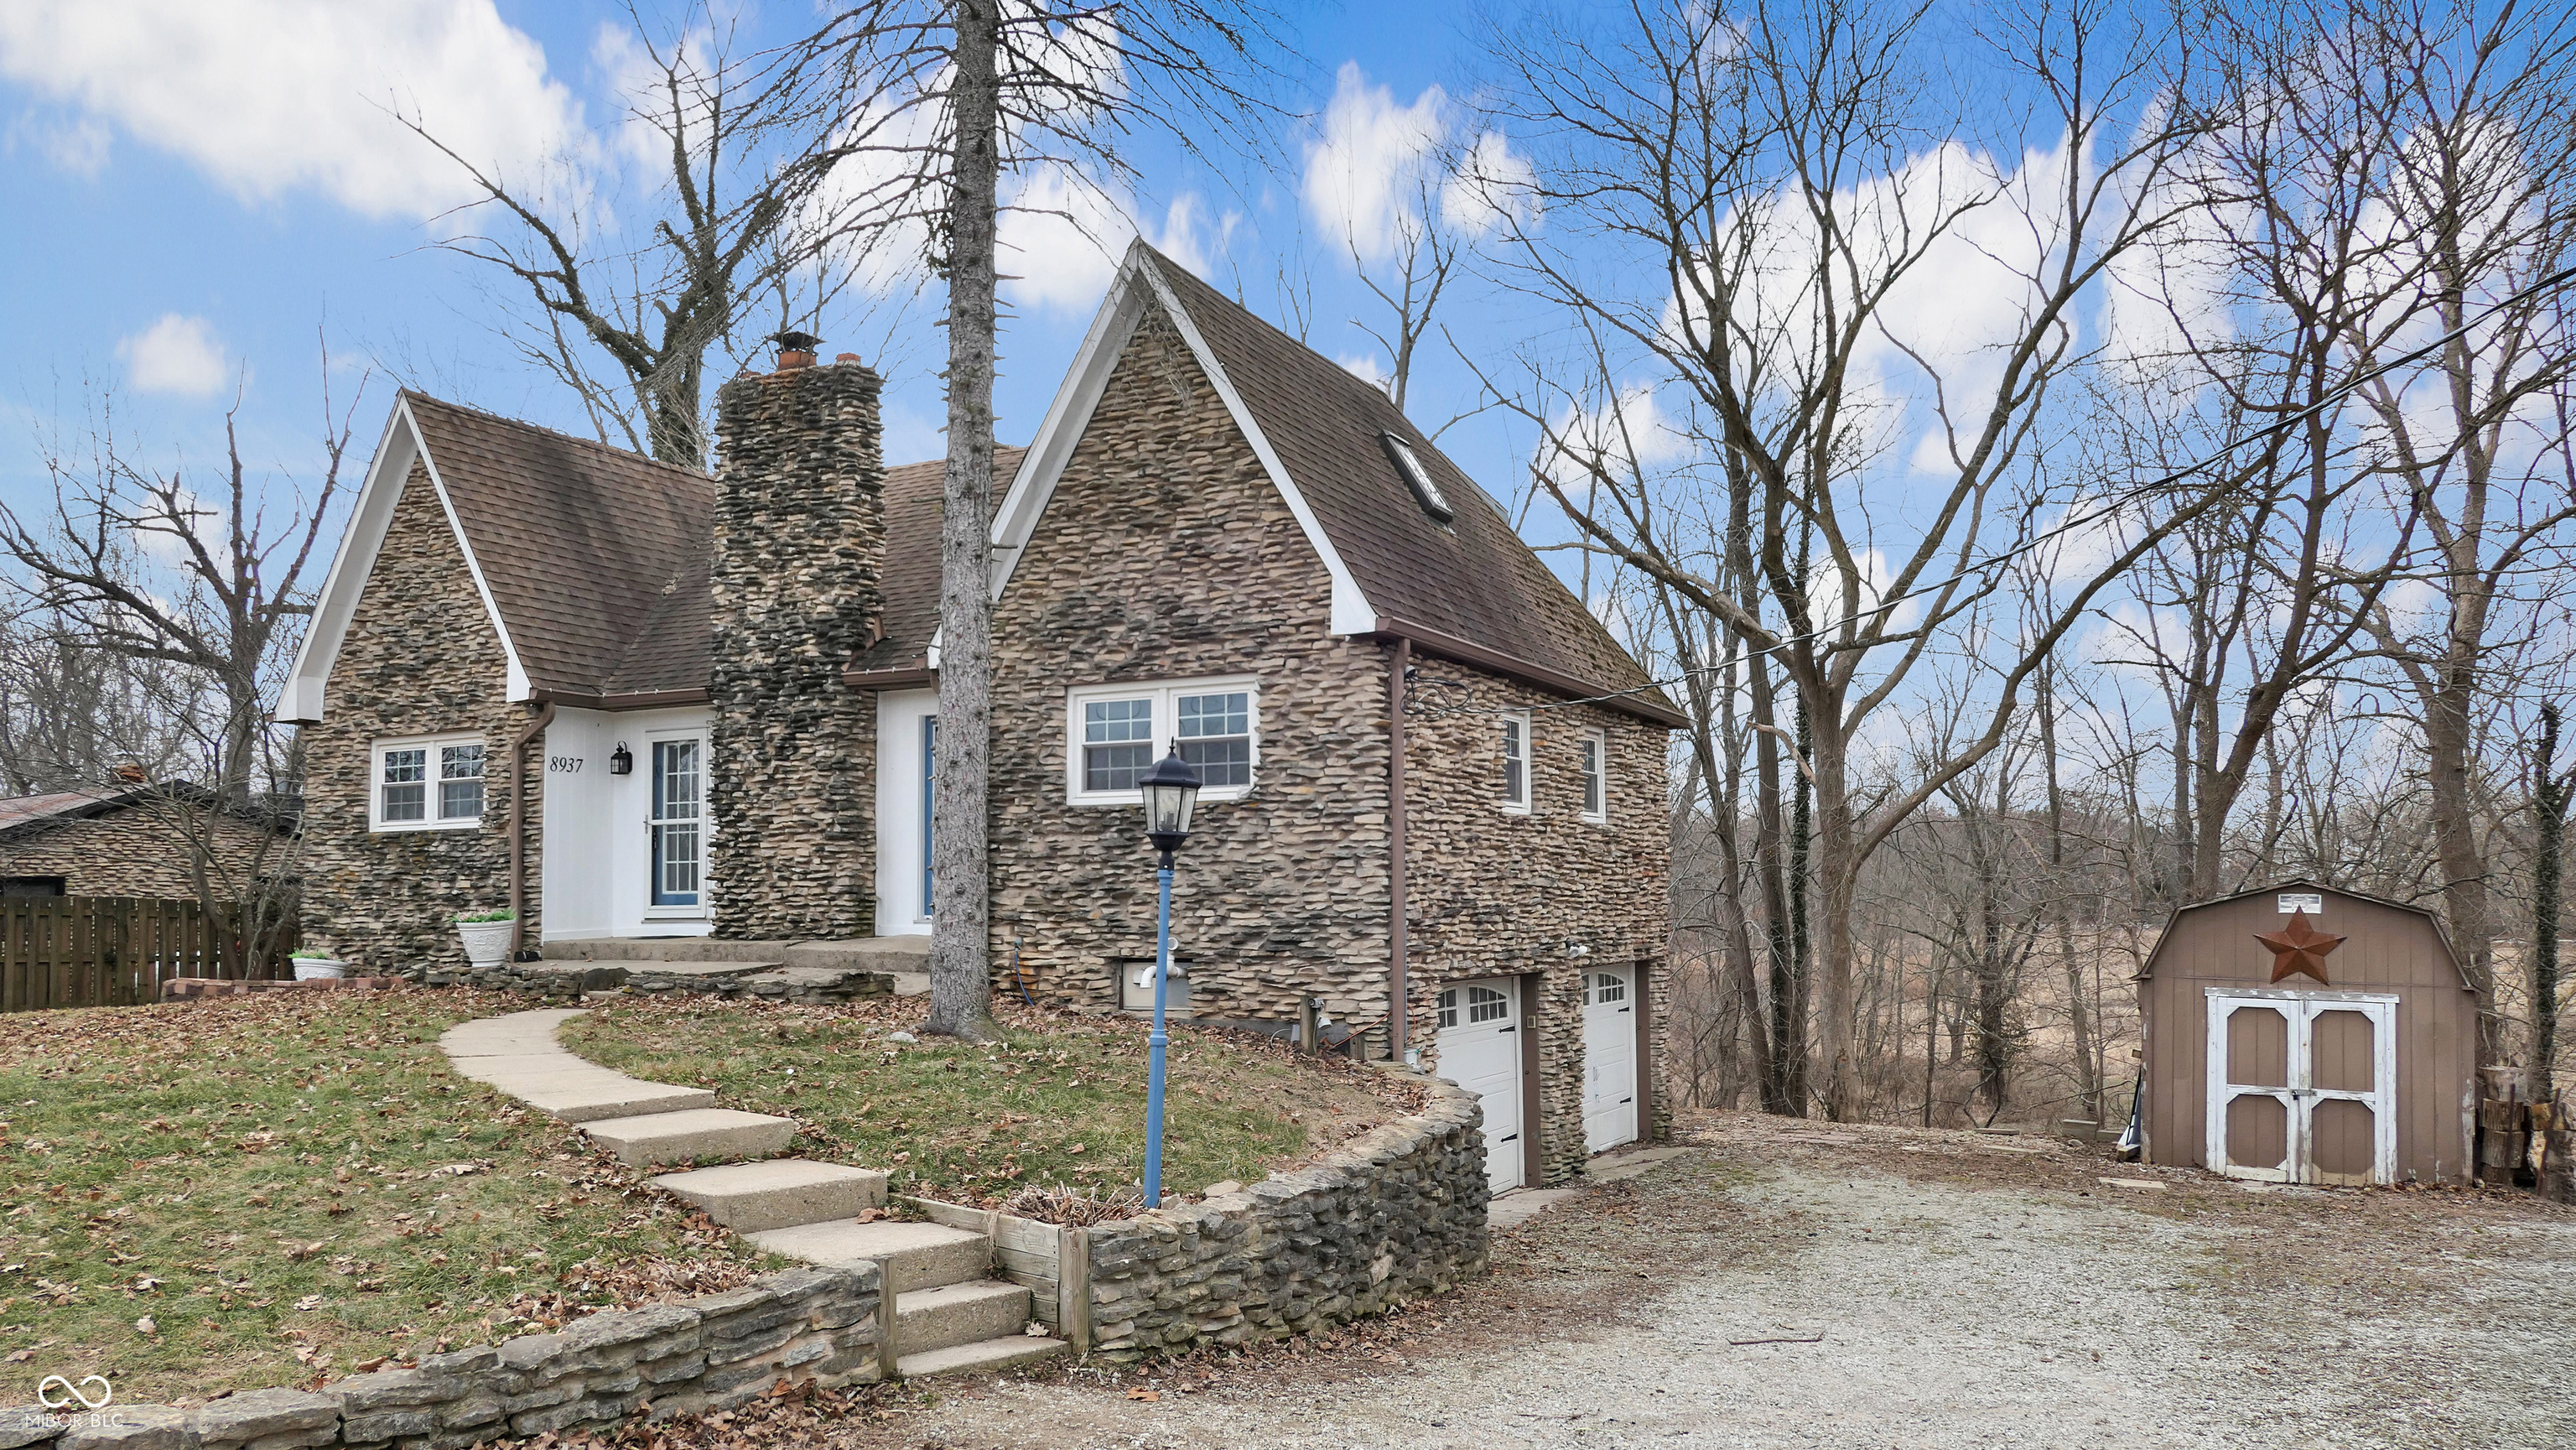
Active
$350,000
4
bds
|
2
ba
|
2,757
sqft
|
built
1967
8937 W 800 N, Indianapolis, IN 46259
$168
Cash flow
2.5%
Cash-on-Cash Return
6.9%
Cap rate
0.8%
Rent to Value Ratio
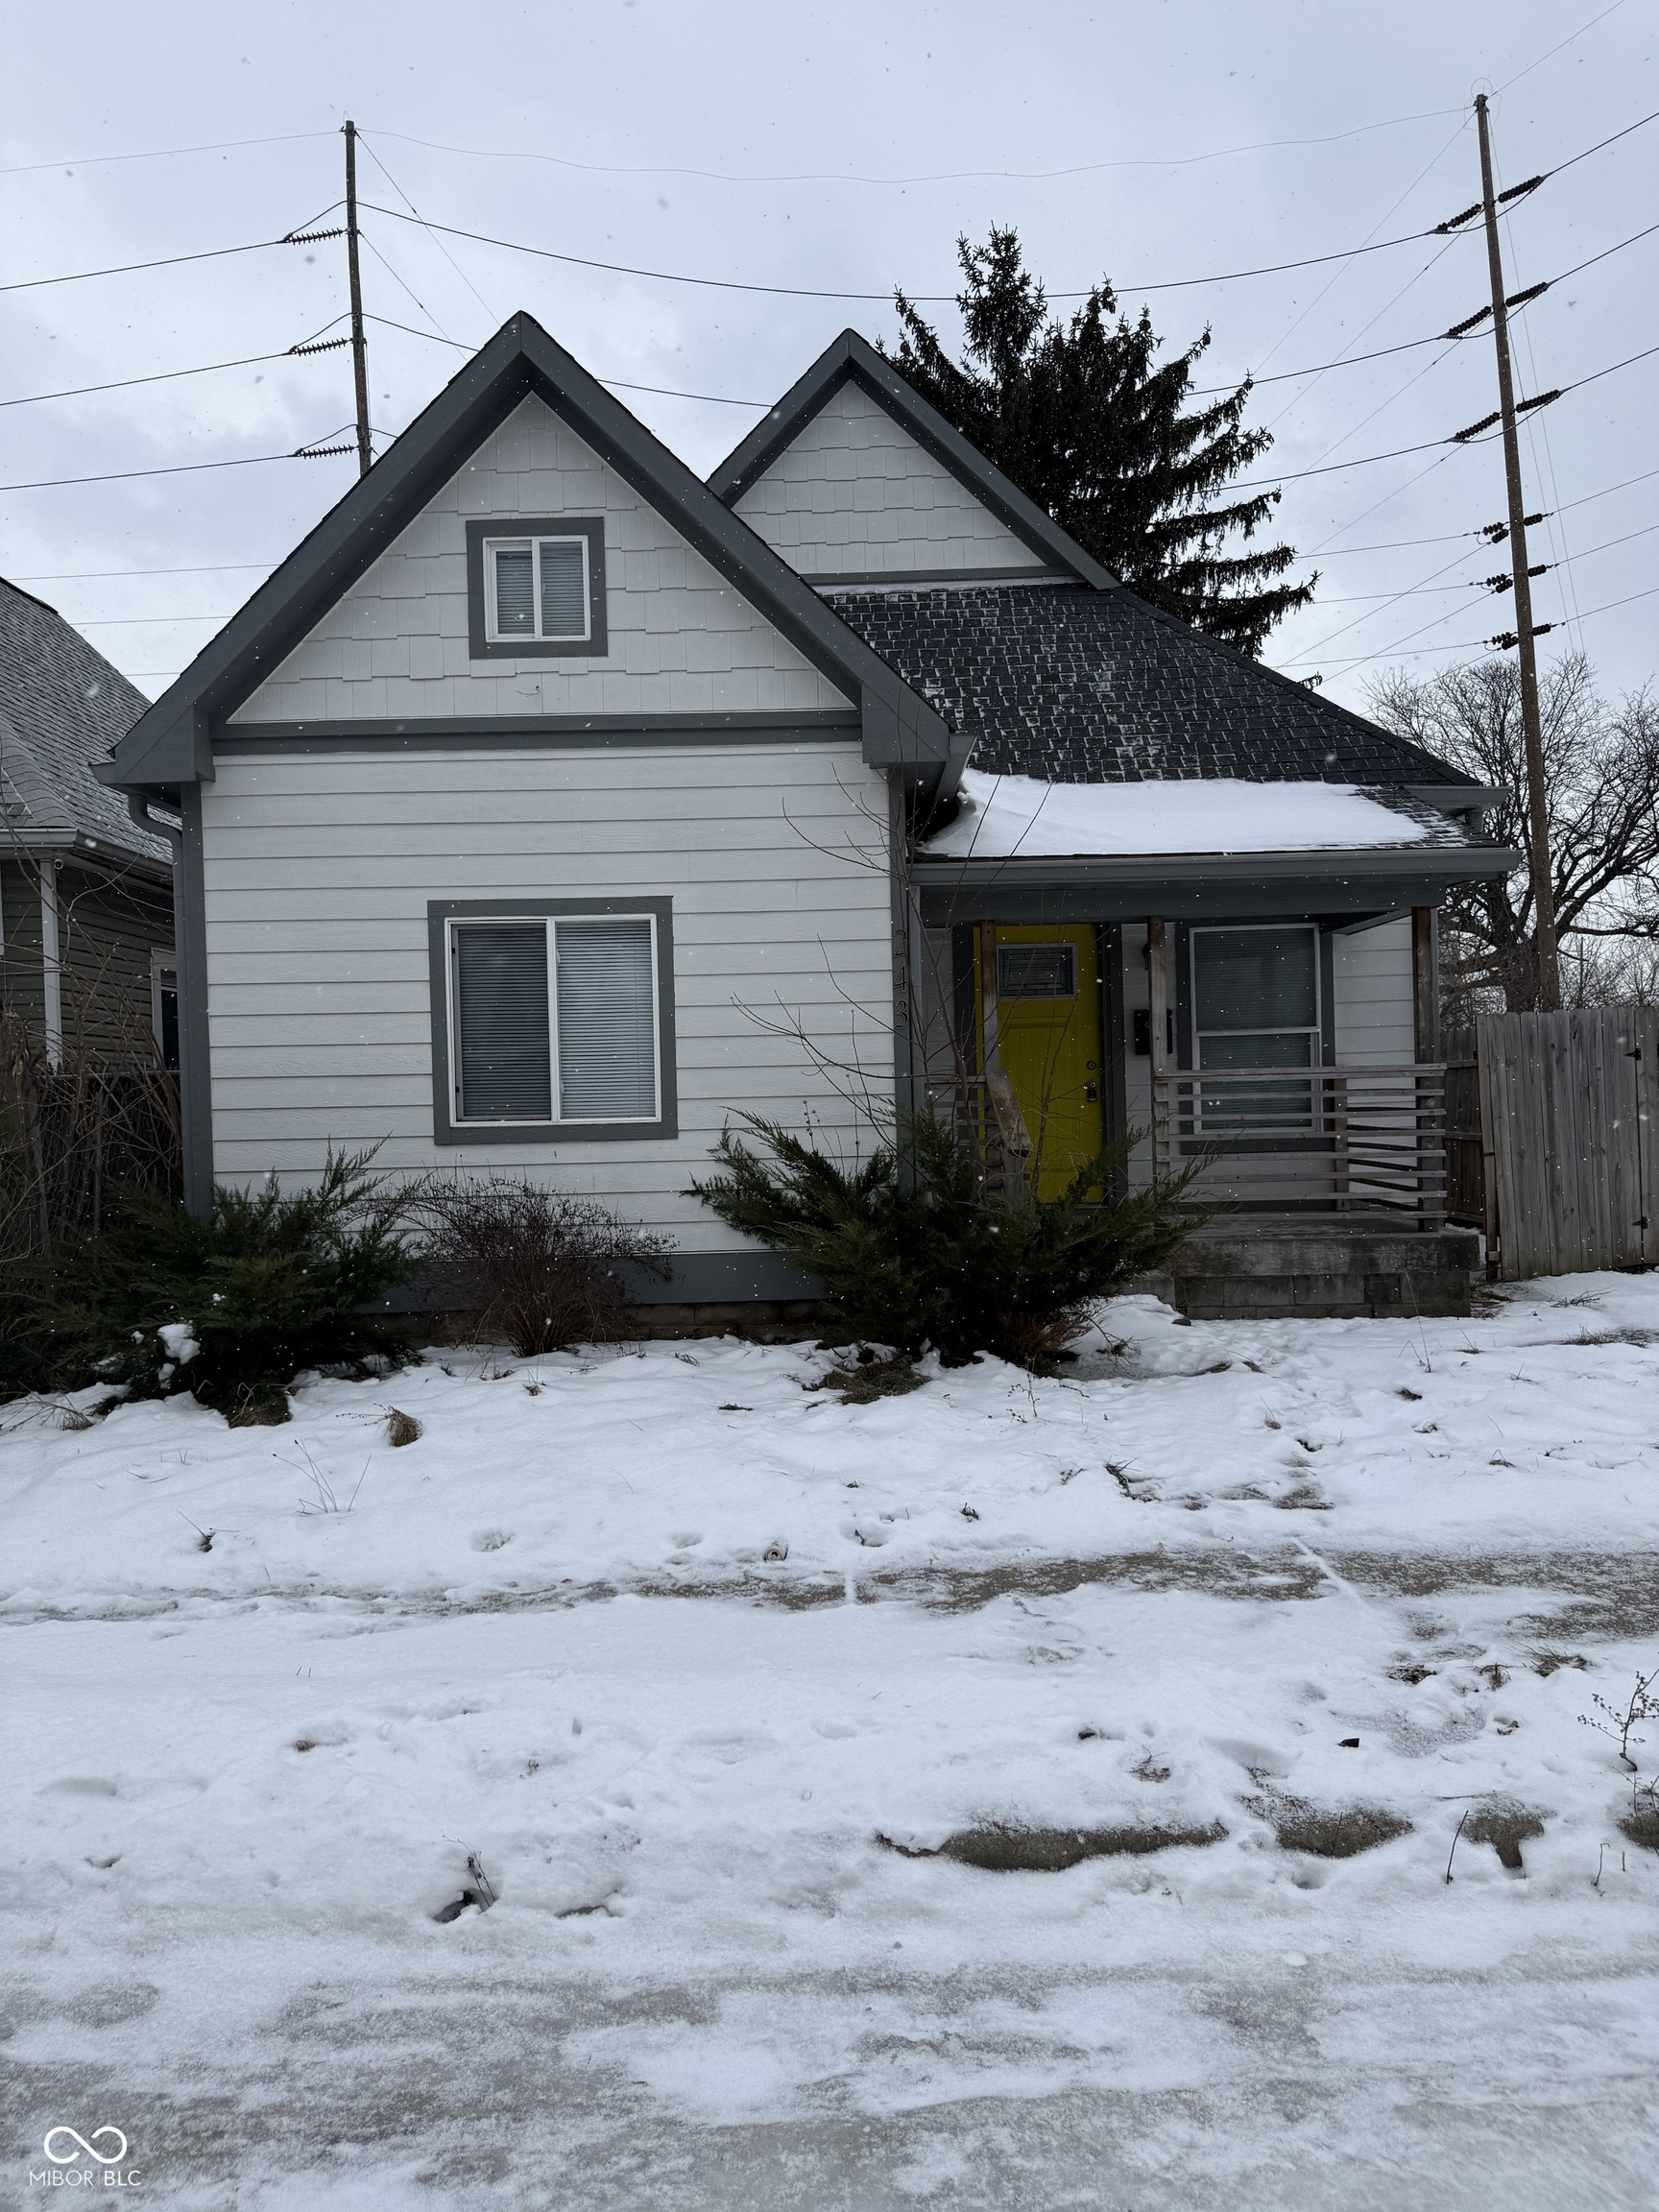
Active
$164,900
3
bds
|
1
ba
|
1,582
sqft
|
built
2014
243 E Caven St, Indianapolis, IN 46225
$102
Cash flow
3.2%
Cash-on-Cash Return
7.0%
Cap rate
0.8%
Rent to Value Ratio
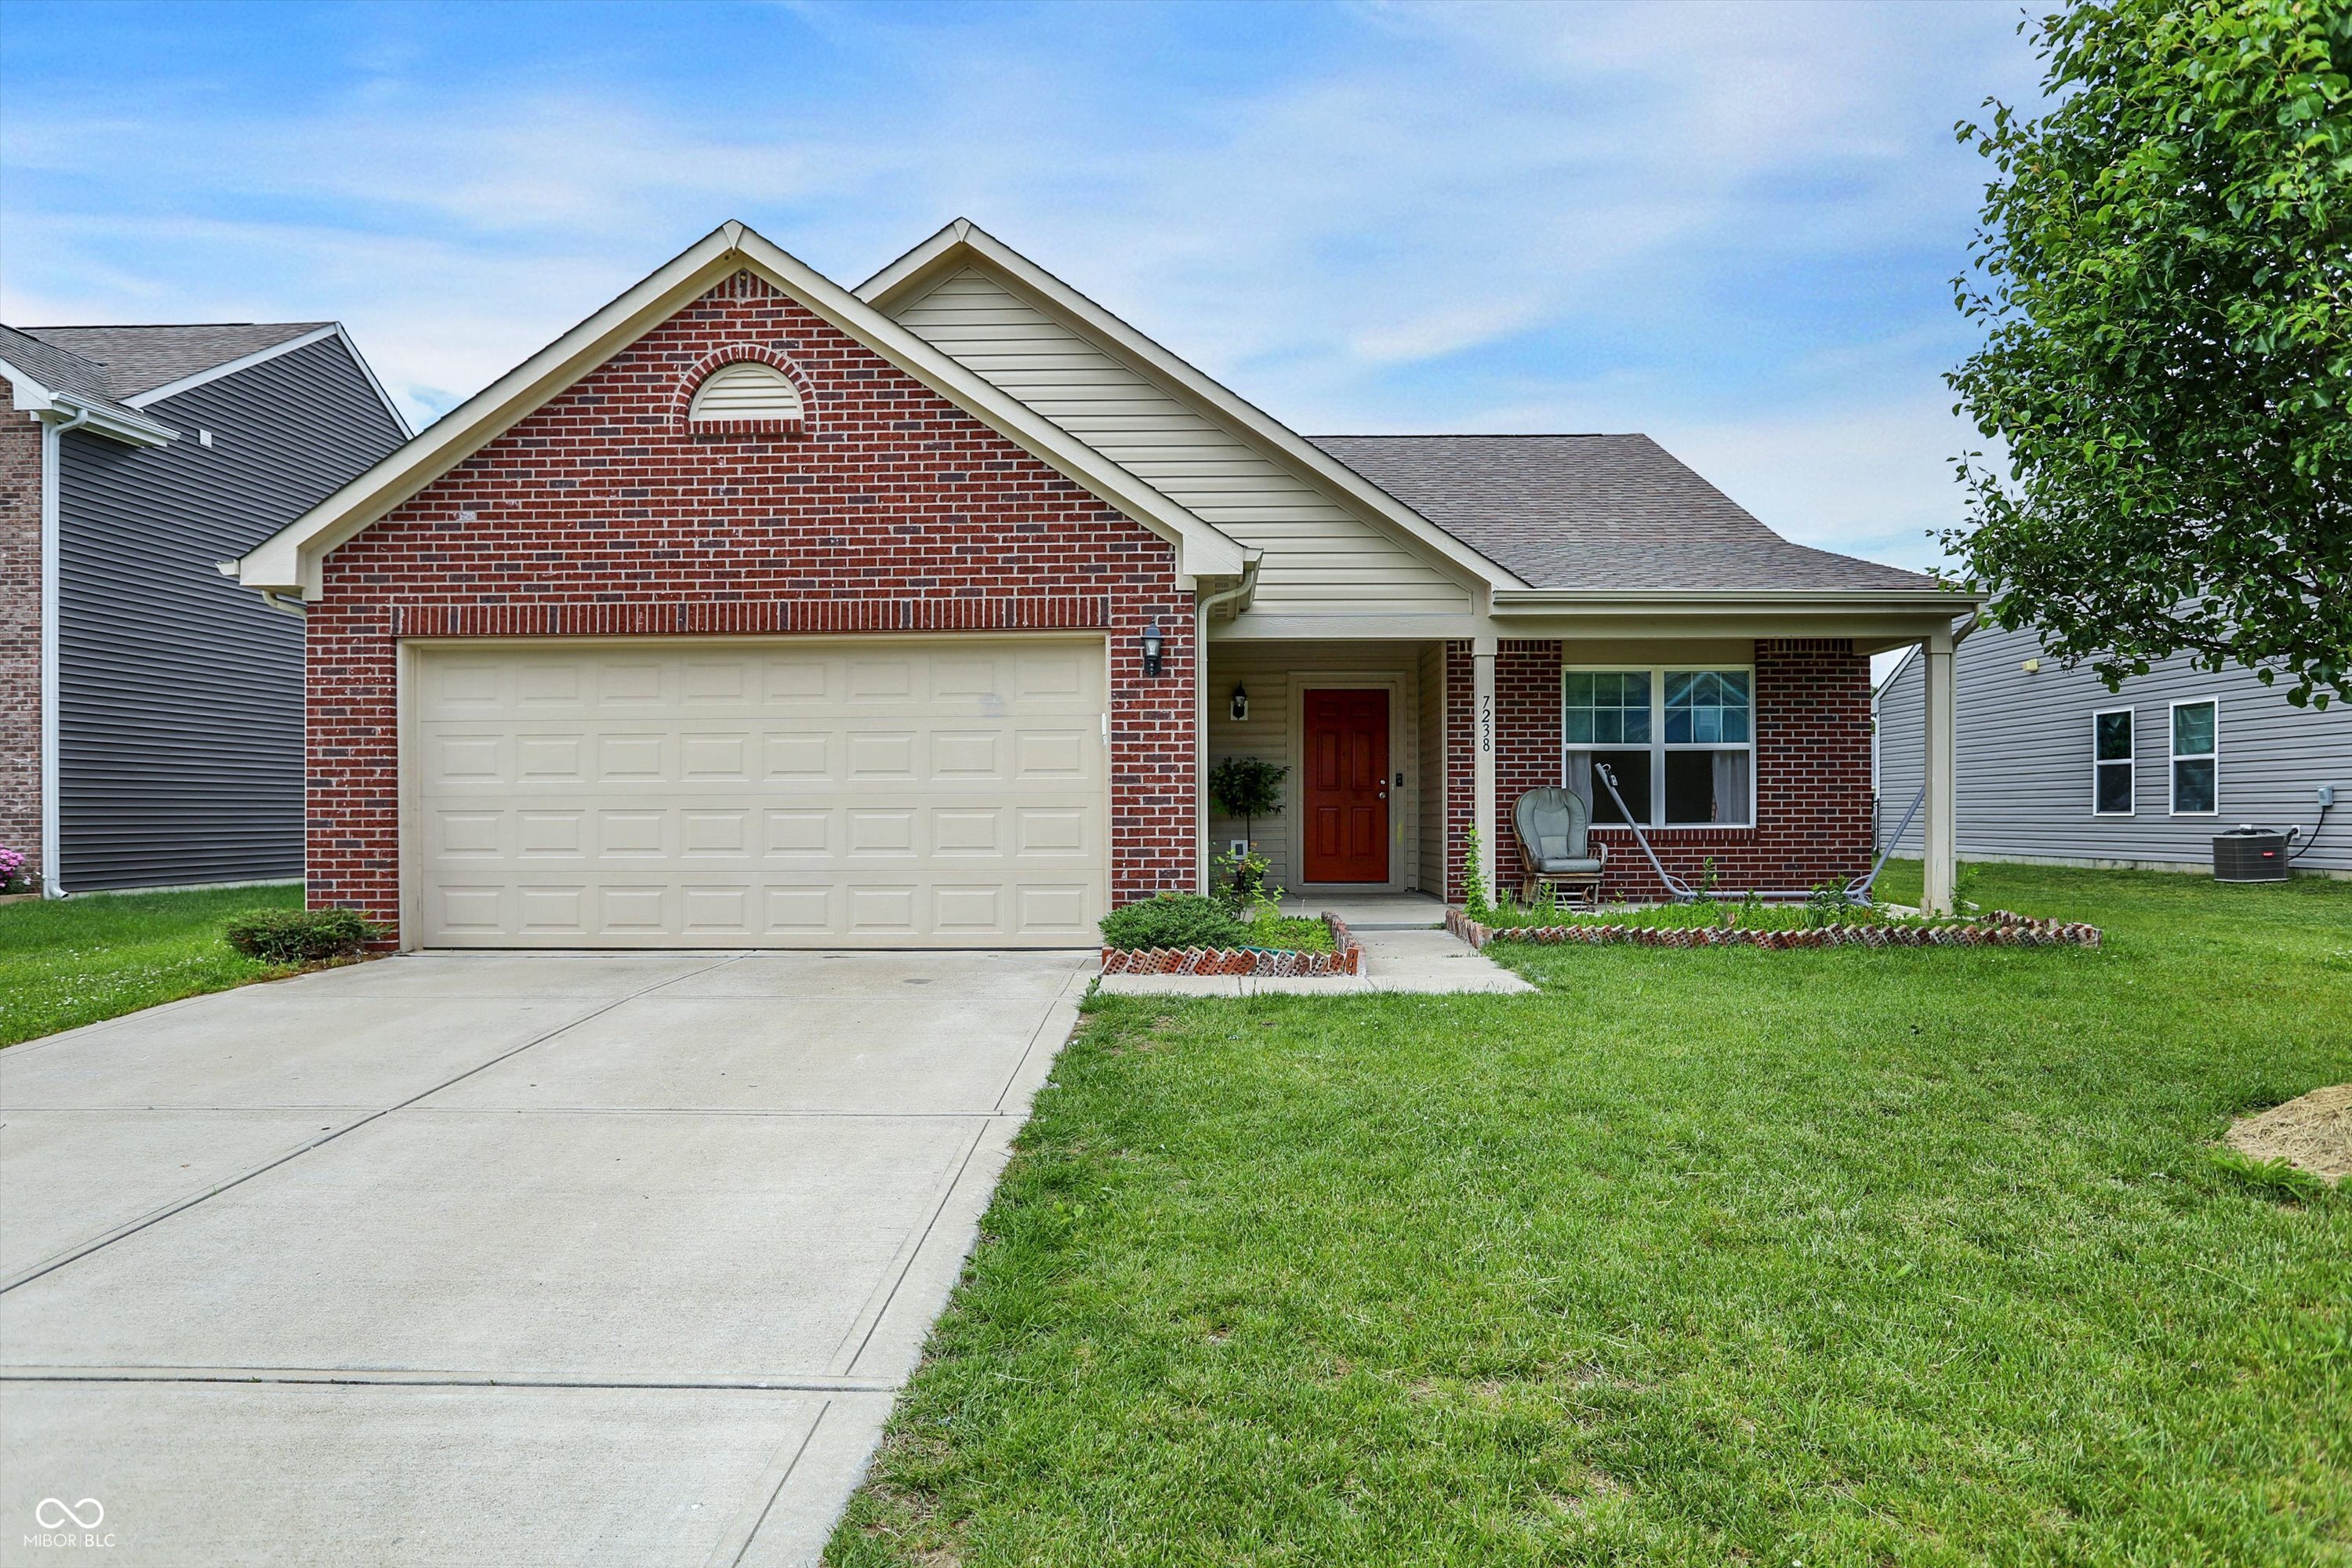
Active
$279,000
3
bds
|
2
ba
|
1,618
sqft
|
built
2018
7238 Moultrie Dr, Indianapolis, IN 46217
$-242
Cash flow
-4.5%
Cash-on-Cash Return
5.2%
Cap rate
0.6%
Rent to Value Ratio
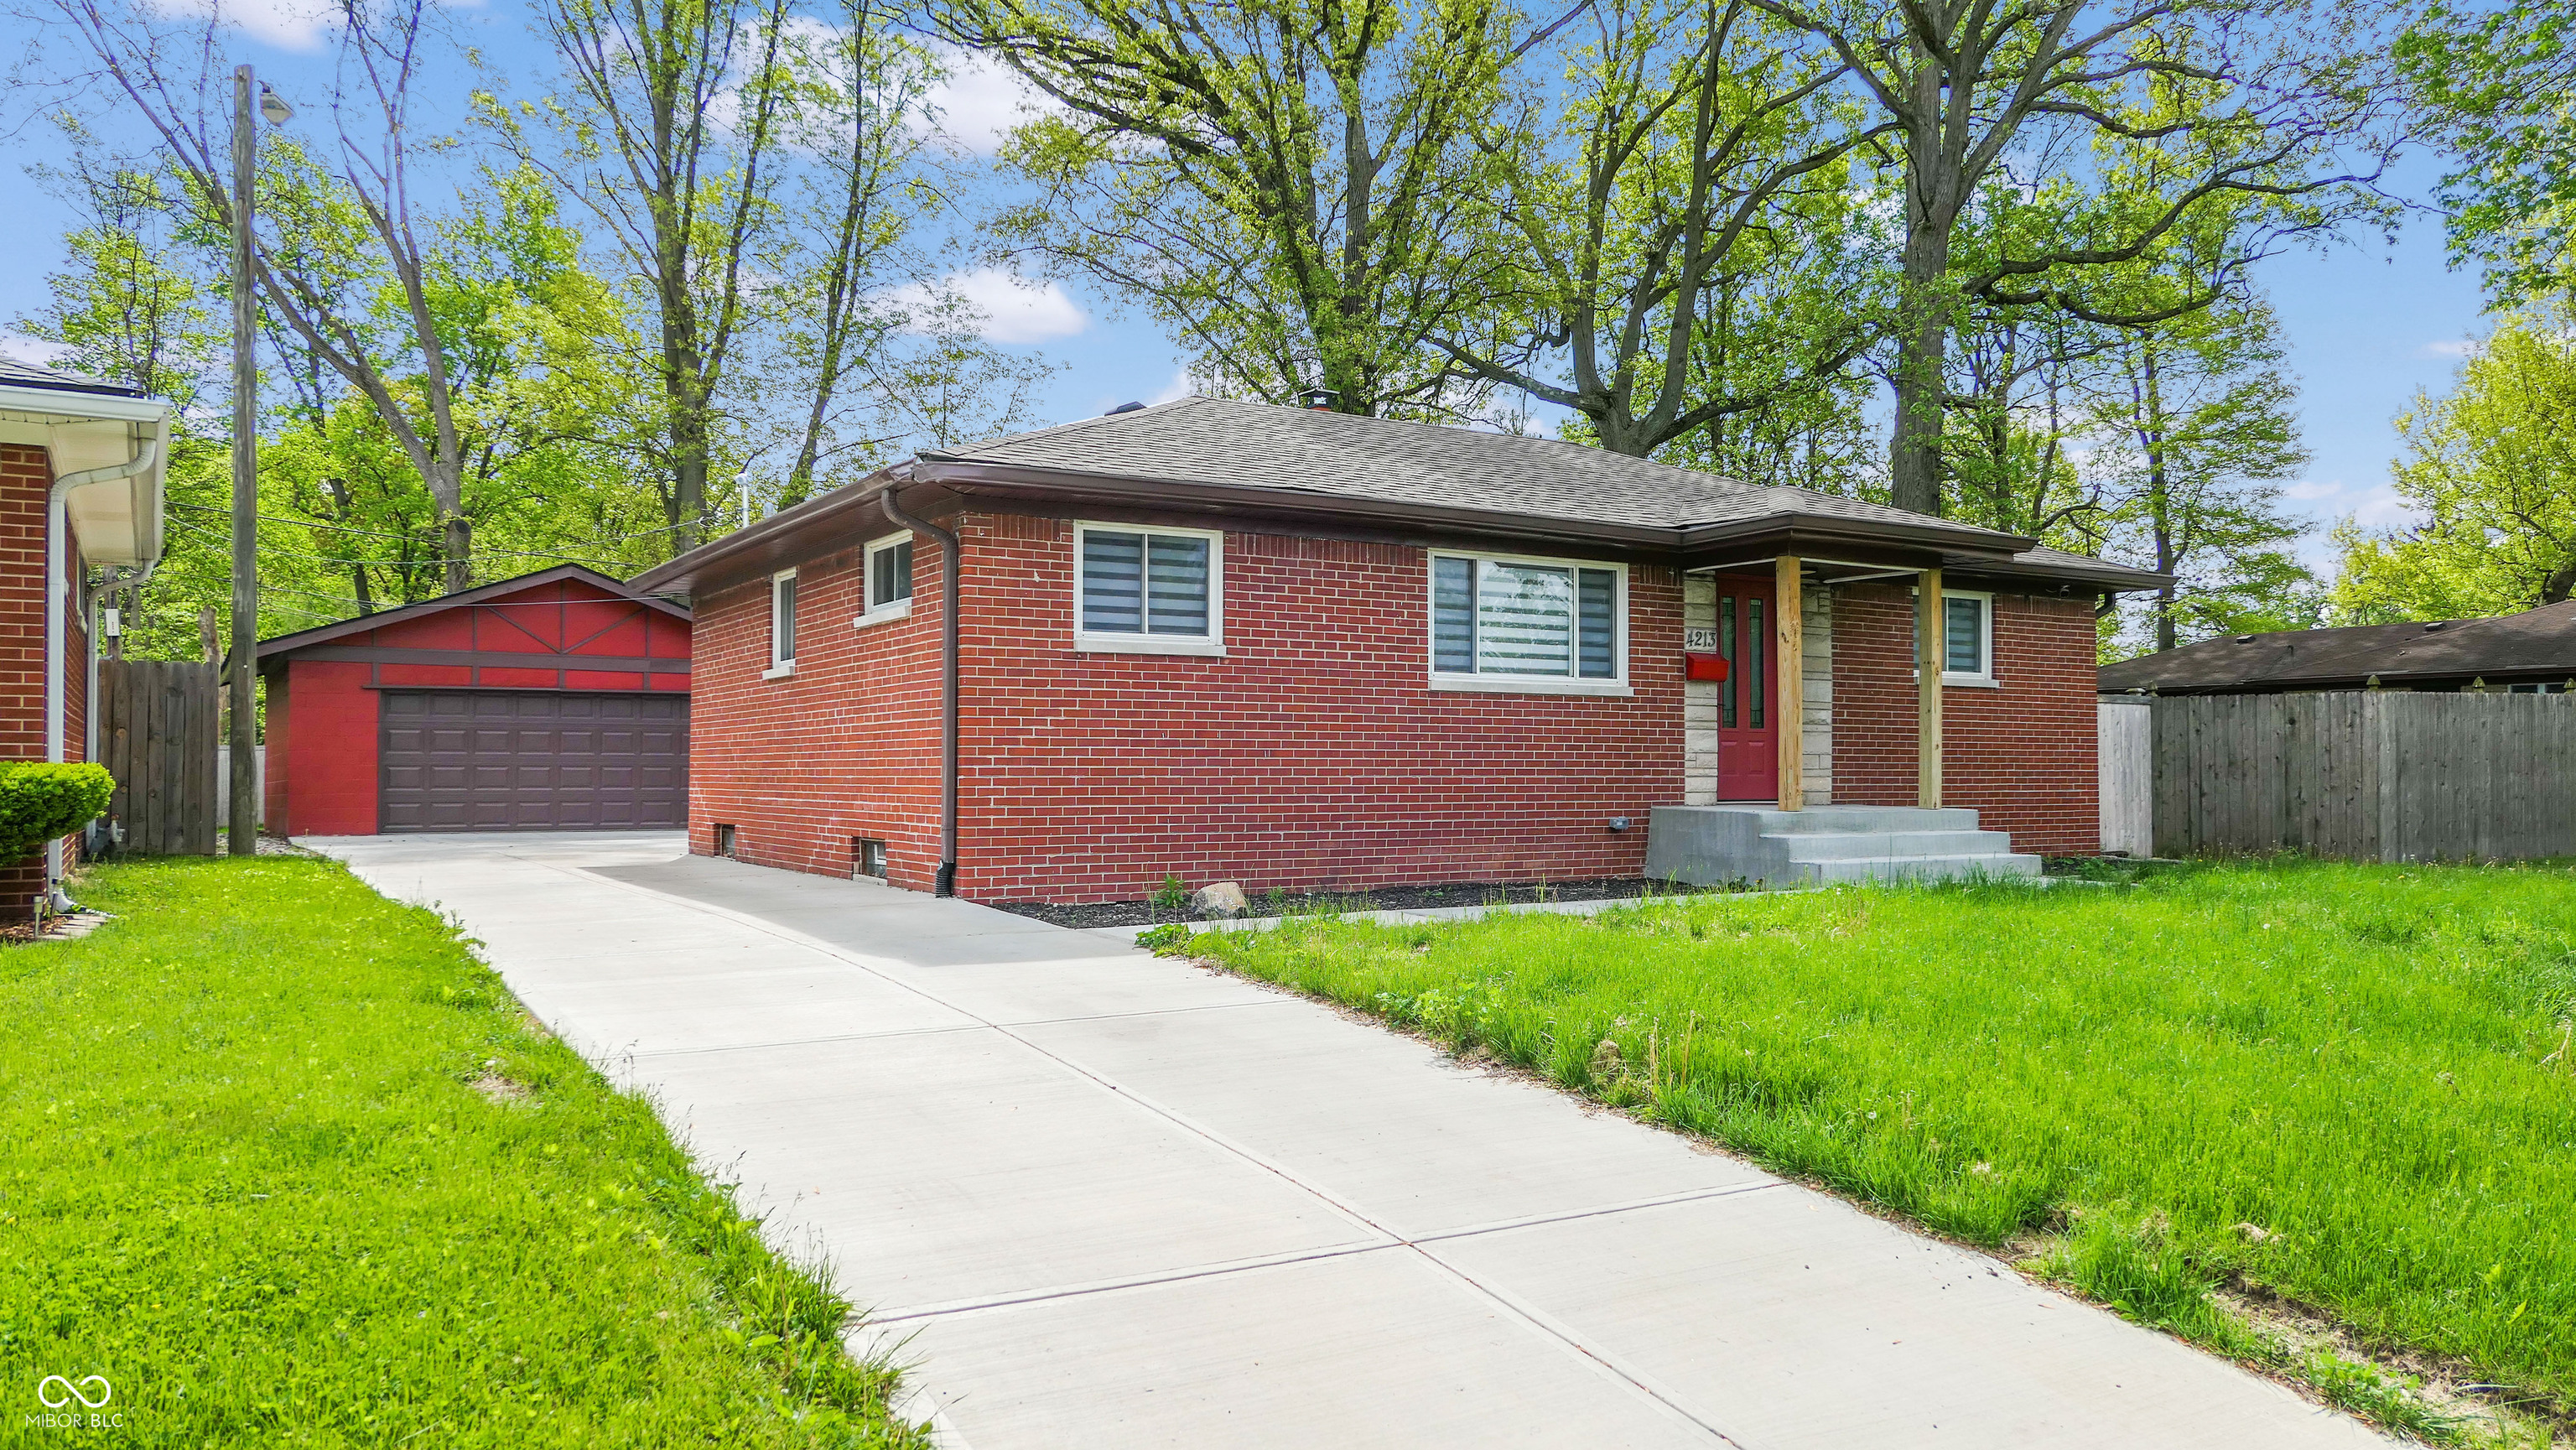
Active
$225,000
3
bds
|
1
ba
|
1,040
sqft
|
built
1955
4213 N Audubon Rd, Indianapolis, IN 46226
$-5
Cash flow
-0.1%
Cash-on-Cash Return
6.3%
Cap rate
0.8%
Rent to Value Ratio
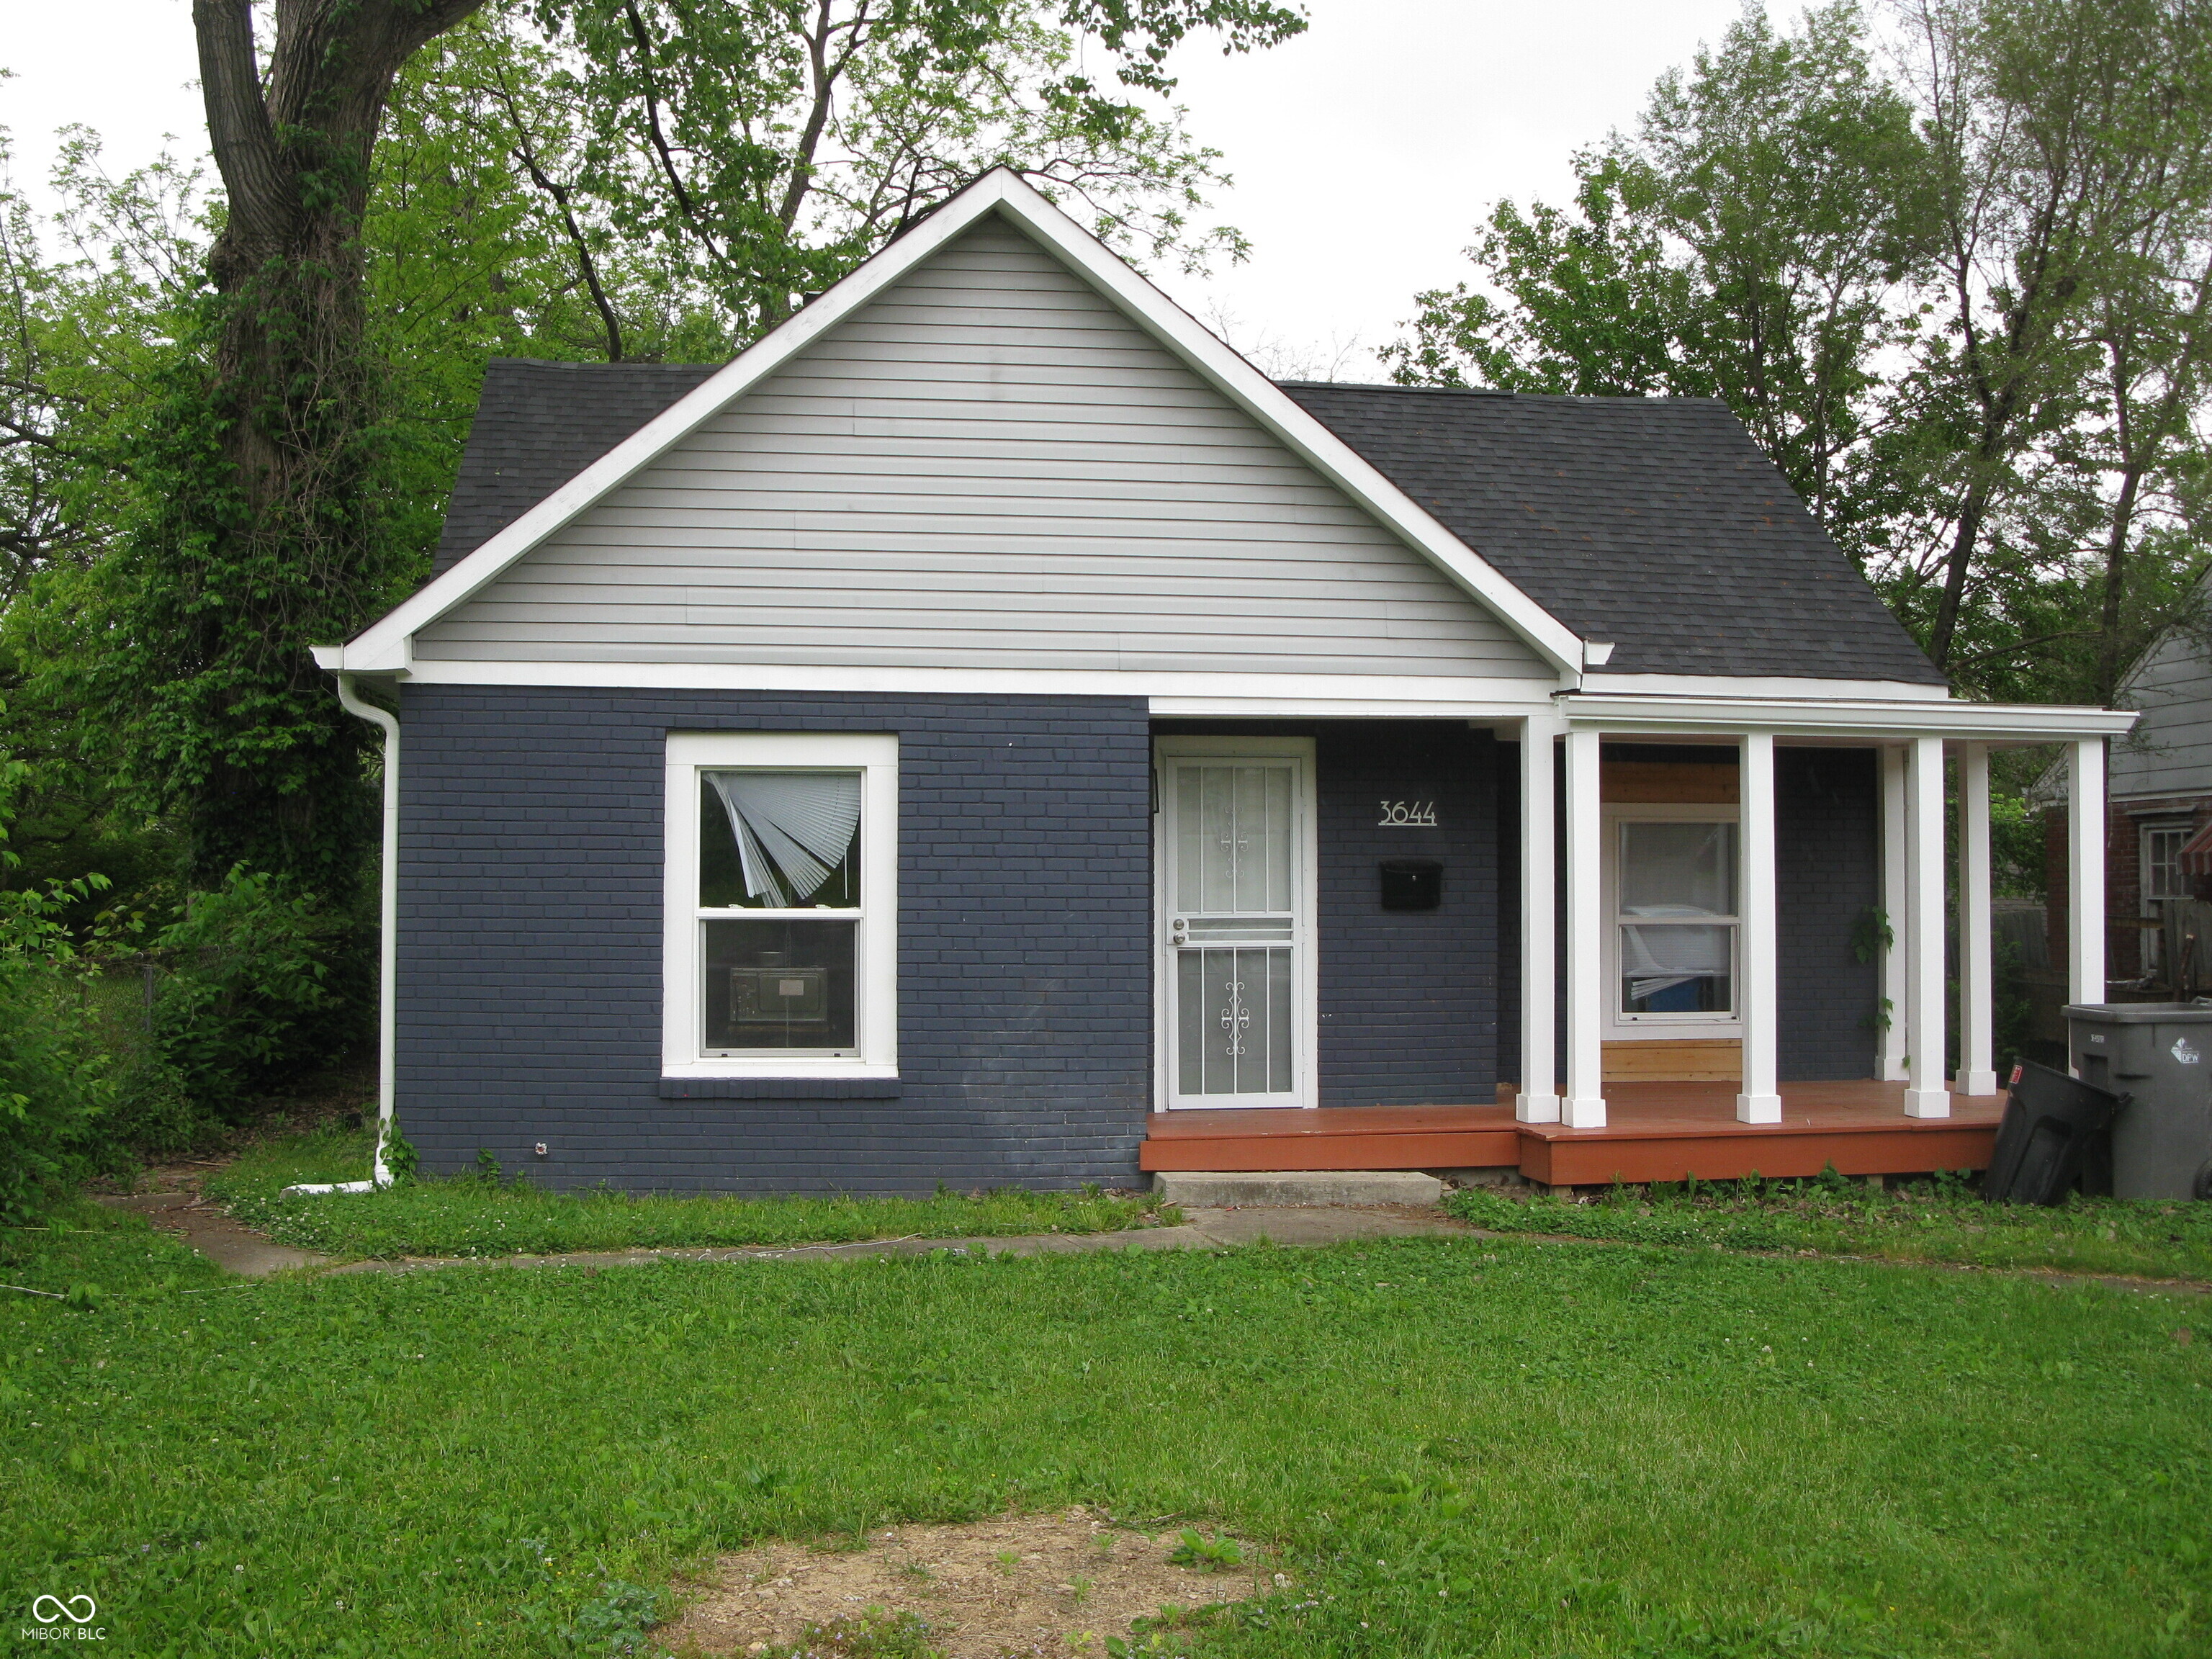
Active
$172,500
2
bds
|
1
ba
|
872
sqft
|
built
1944
3644 N Parker Ave, Indianapolis, IN 46218
$-75
Cash flow
-2.3%
Cash-on-Cash Return
5.8%
Cap rate
0.7%
Rent to Value Ratio
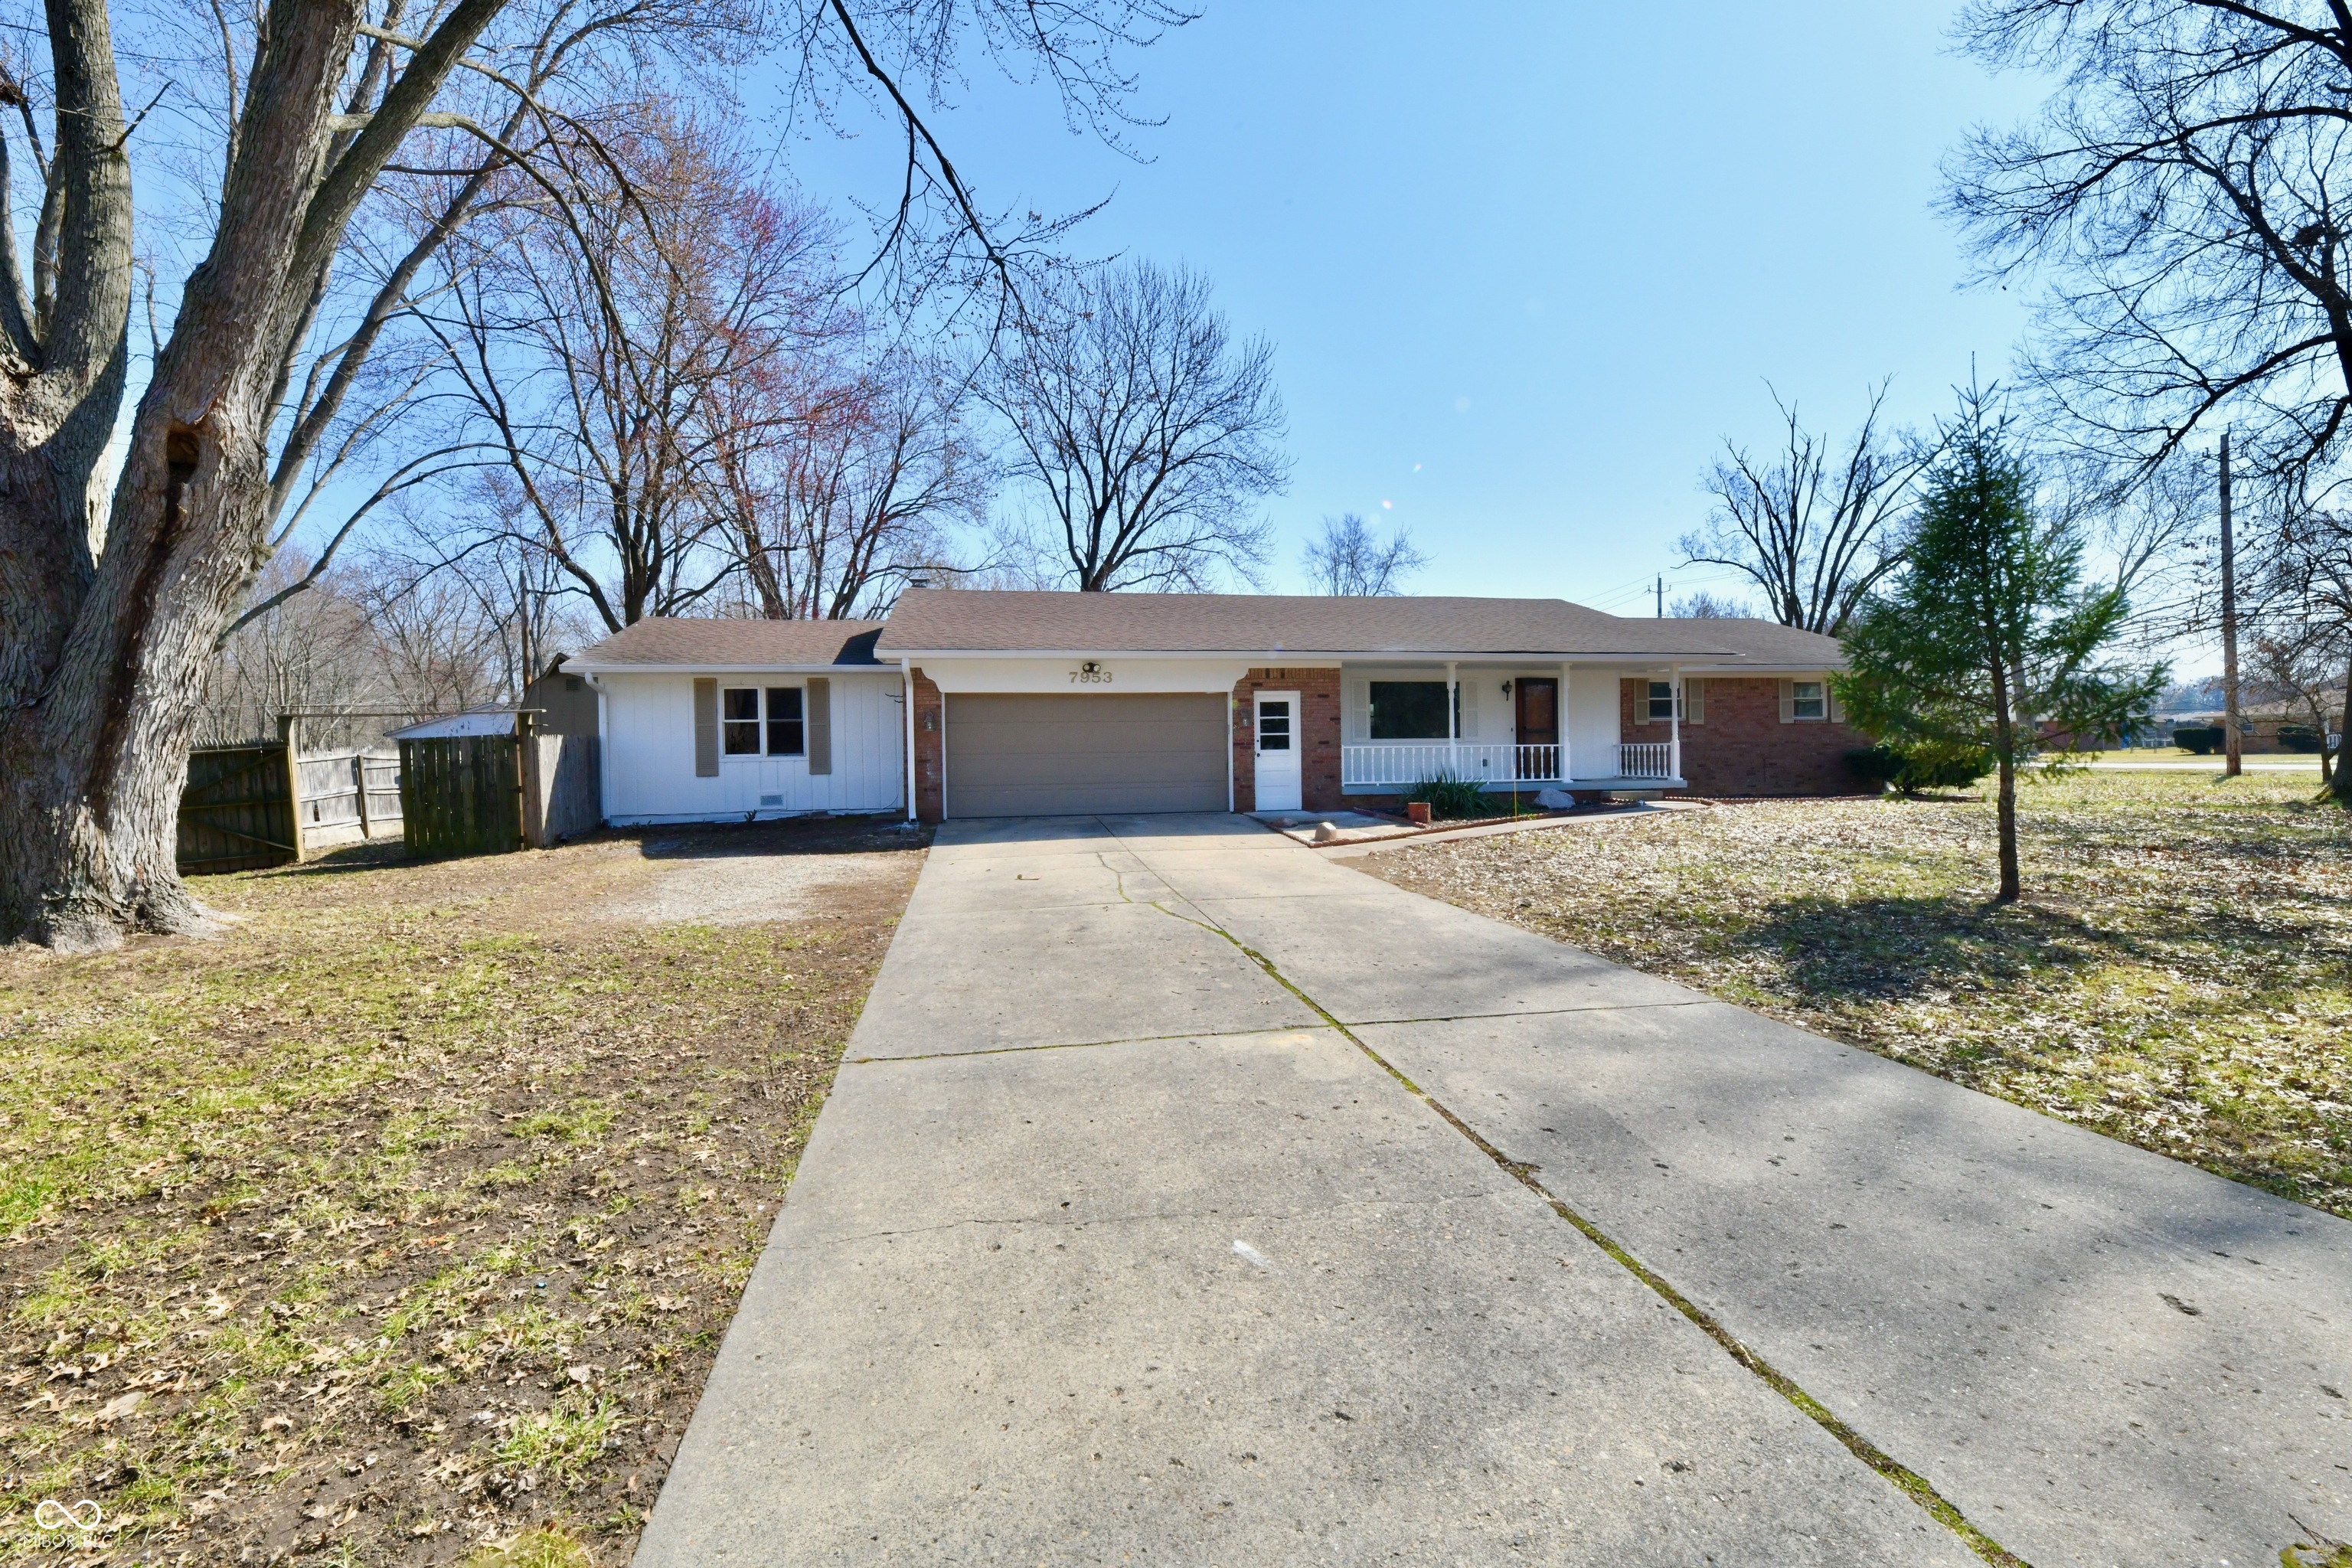
Active
$275,000
4
bds
|
3
ba
|
1,901
sqft
|
built
1966
7953 Forest Park Dr, Indianapolis, IN 46217
$-267
Cash flow
-5.1%
Cash-on-Cash Return
5.1%
Cap rate
0.6%
Rent to Value Ratio
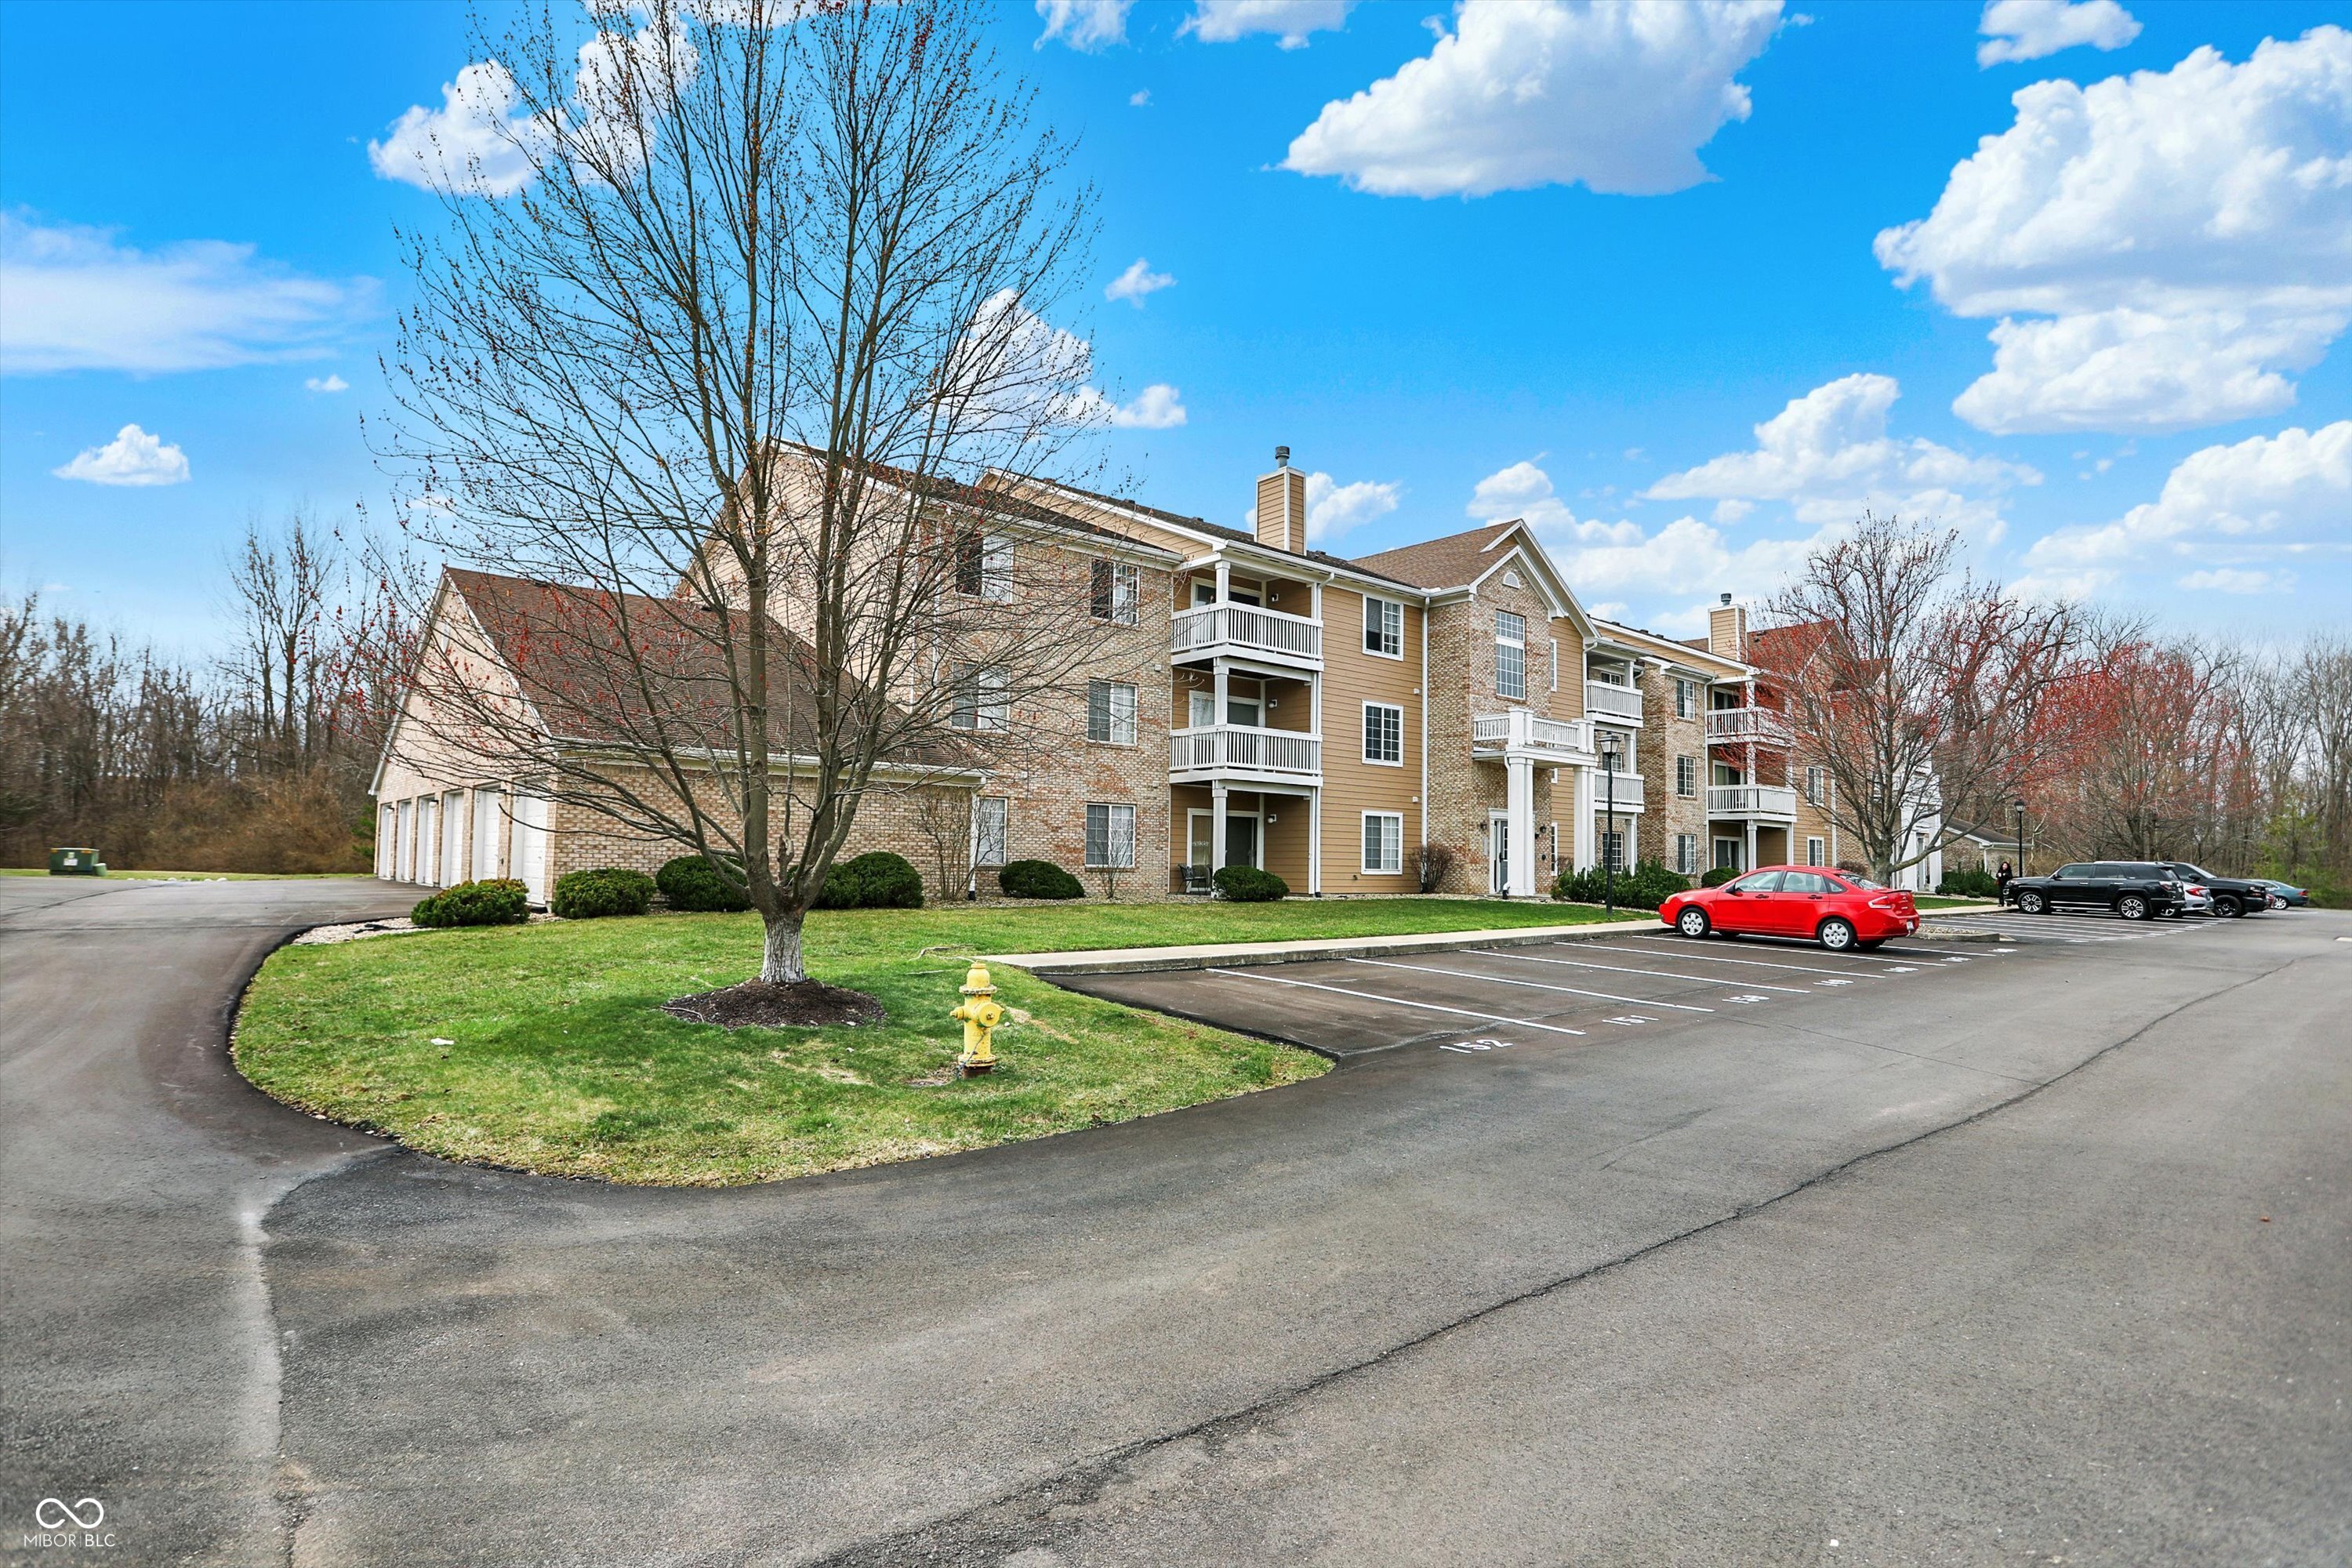
Active
$173,000
2
bds
|
2
ba
|
1,124
sqft
|
built
2003
4925 Opal Ridge Ln, Indianapolis, IN 46237
$-177
Cash flow
-5.3%
Cash-on-Cash Return
5.1%
Cap rate
0.8%
Rent to Value Ratio
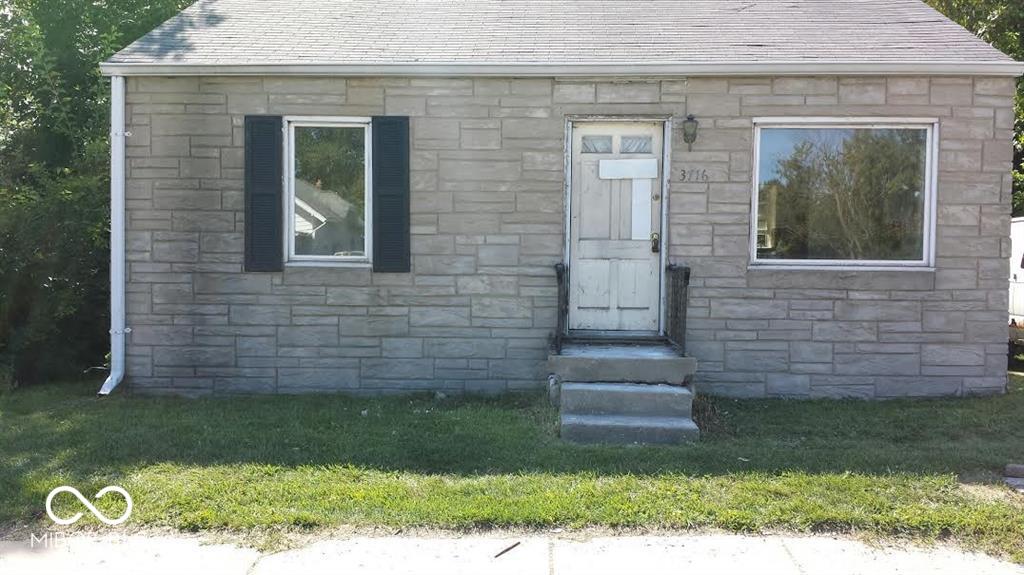
Active
$219,900
2
bds
|
1
ba
|
672
sqft
|
built
1950
3716 N Emerson Ave, Indianapolis, IN 46218
$-393
Cash flow
-9.3%
Cash-on-Cash Return
4.1%
Cap rate
0.5%
Rent to Value Ratio
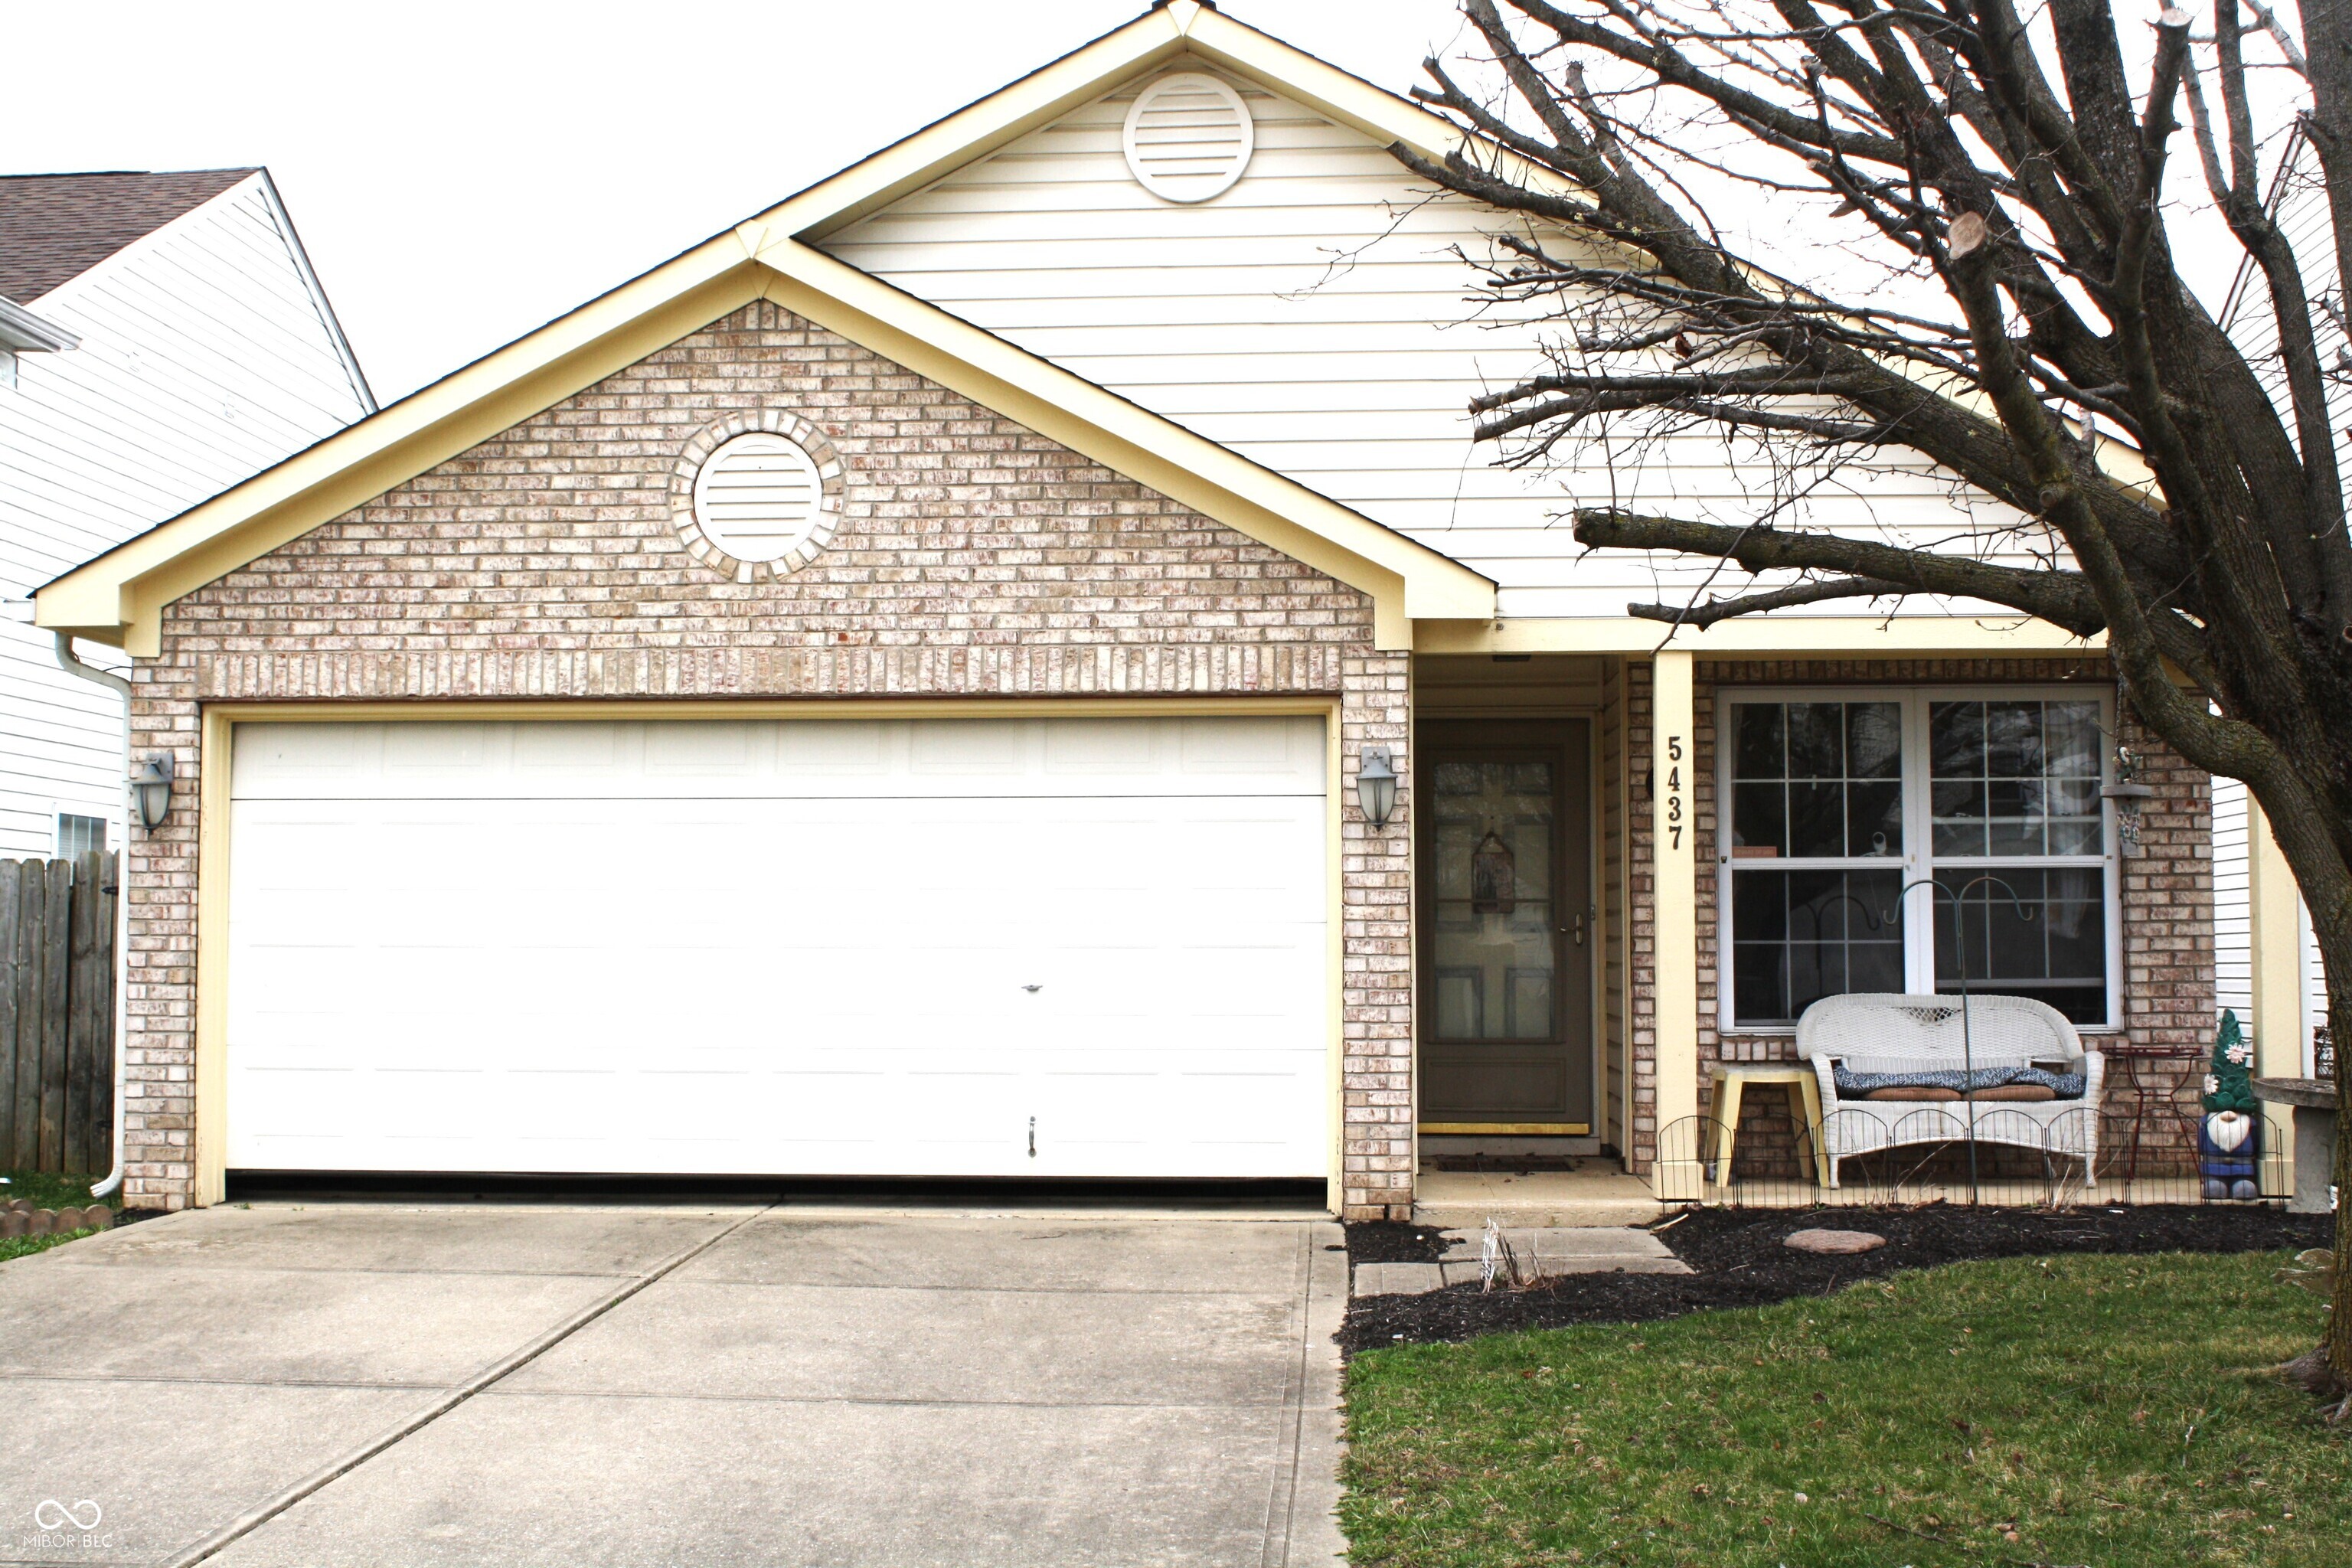
Active
$249,900
4
bds
|
2
ba
|
1,380
sqft
|
built
2003
5437 Powder River Ct, Indianapolis, IN 46221
$-223
Cash flow
-4.7%
Cash-on-Cash Return
5.2%
Cap rate
0.6%
Rent to Value Ratio
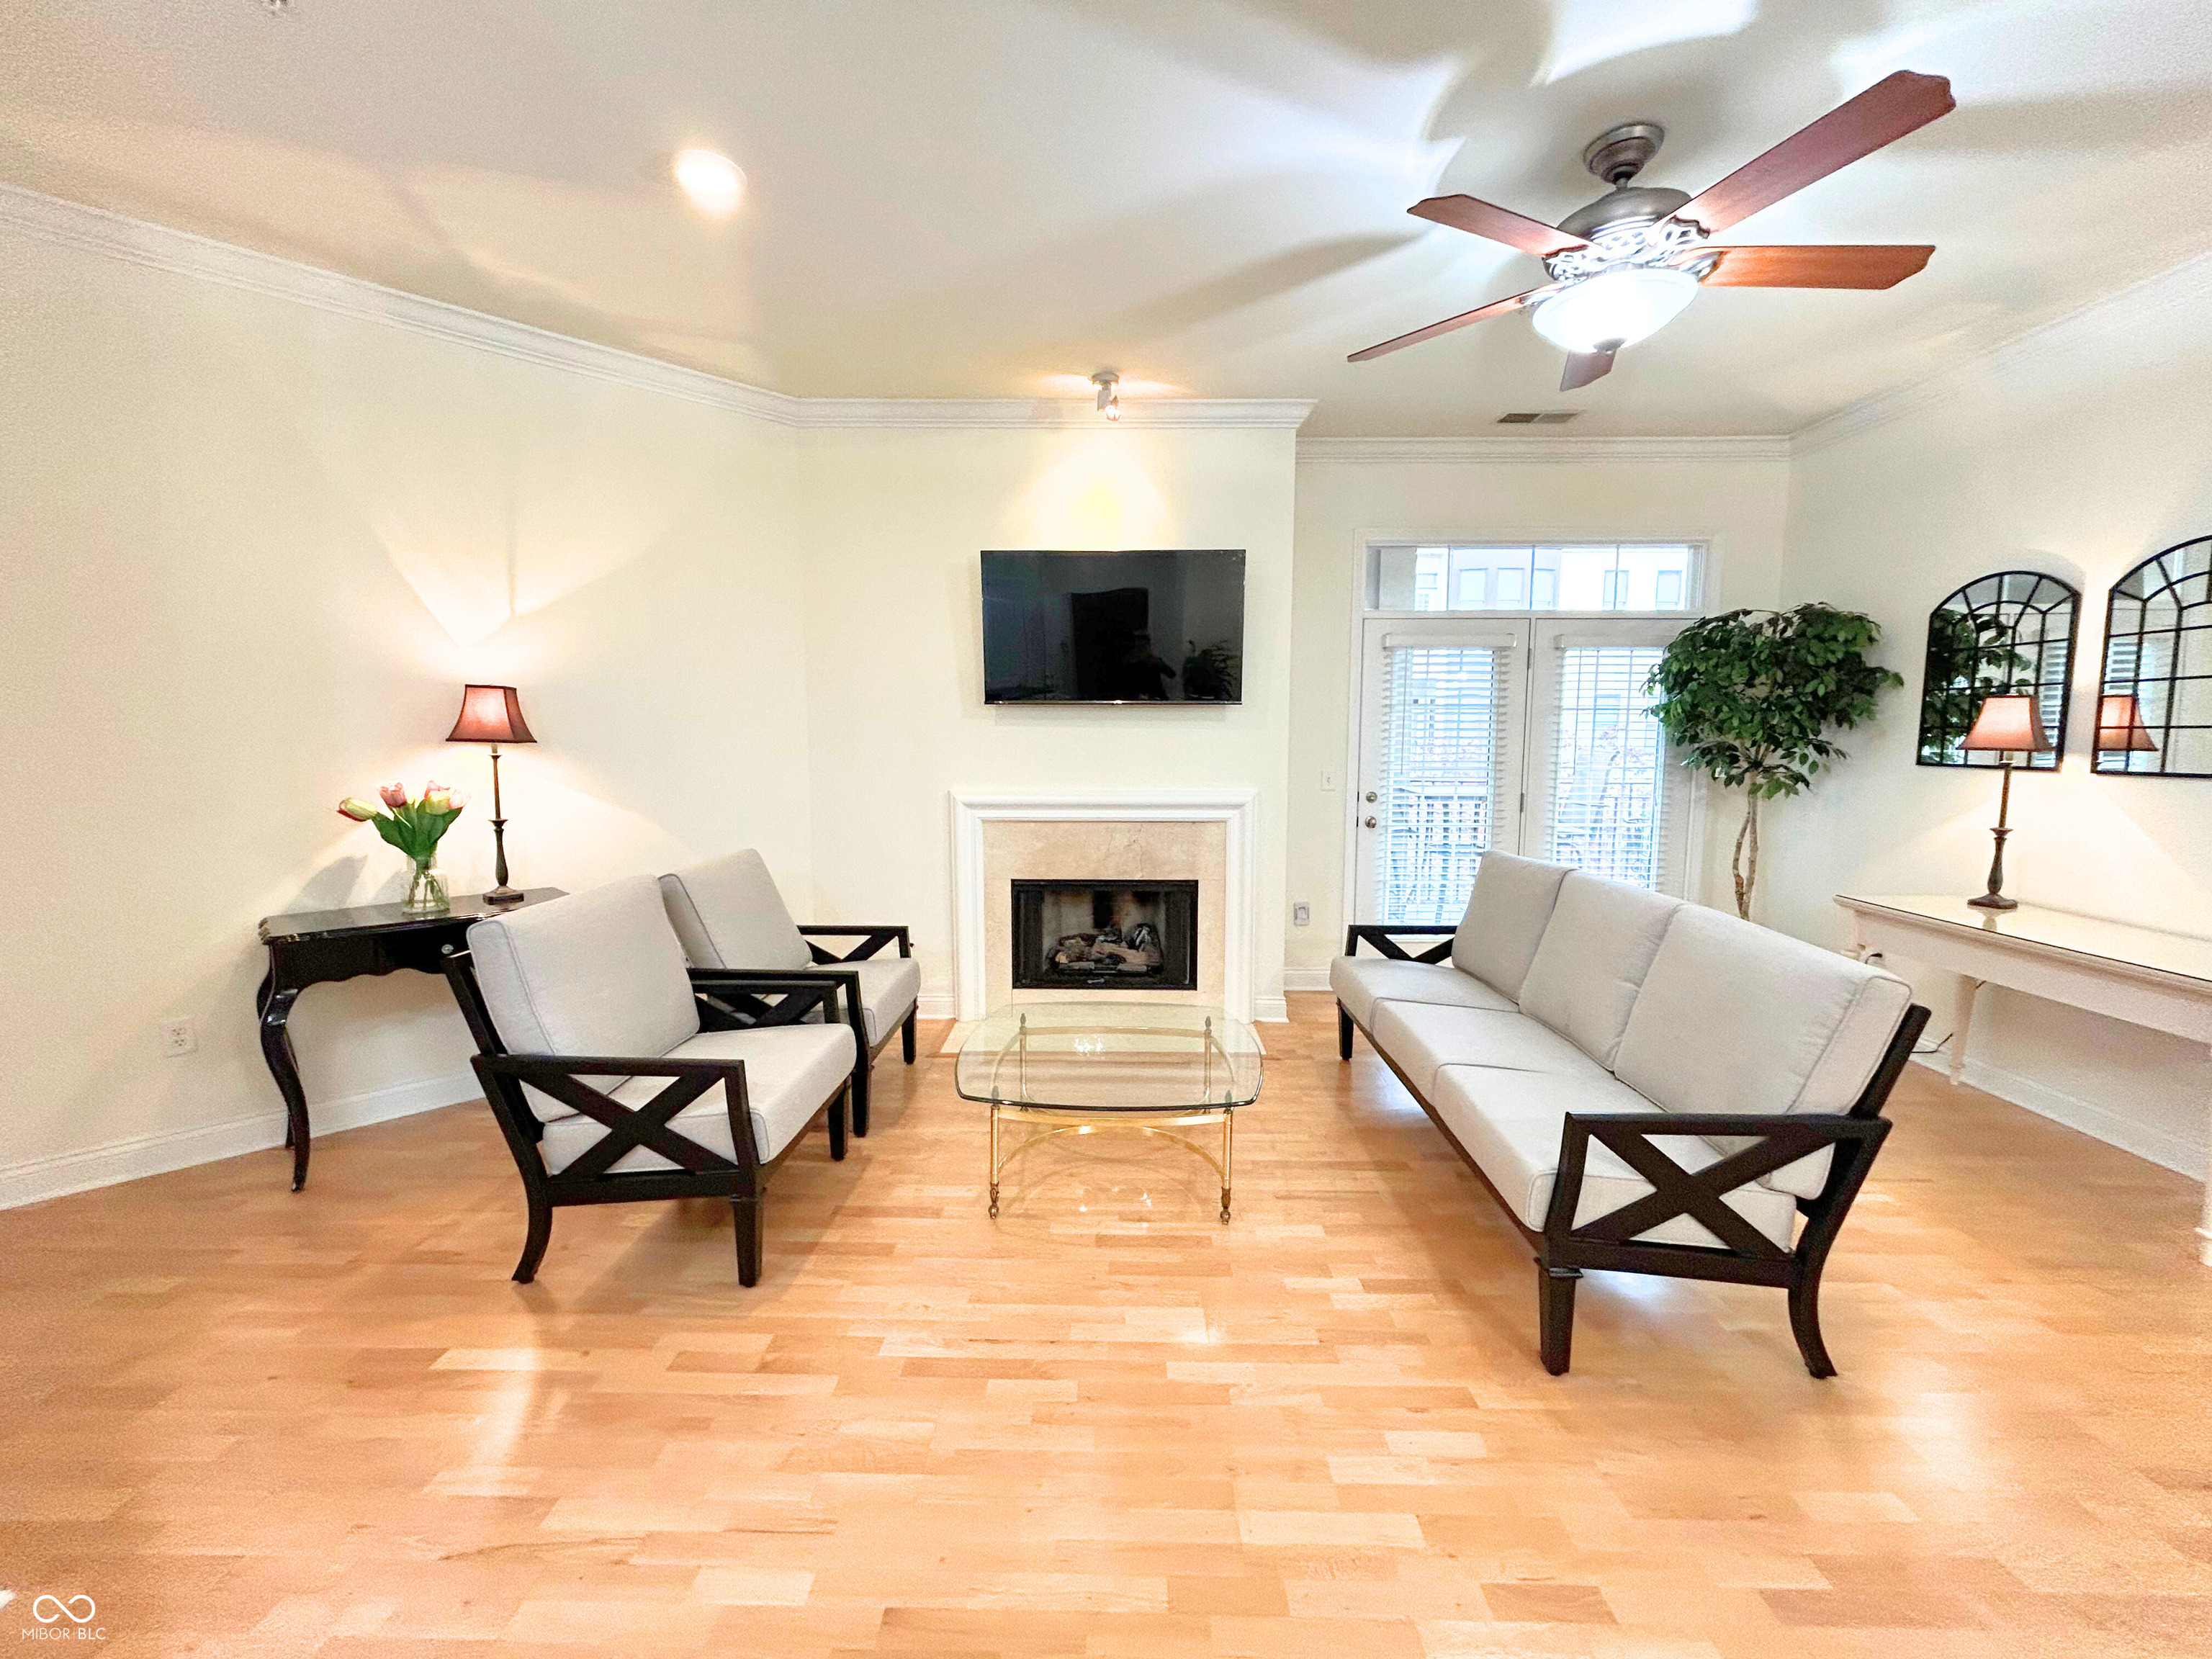
Active
$350,000
2
bds
|
2
ba
|
1,255
sqft
|
built
2006
355 E Ohio St, Indianapolis, IN 46204
$-333
Cash flow
-5.0%
Cash-on-Cash Return
5.1%
Cap rate
0.8%
Rent to Value Ratio
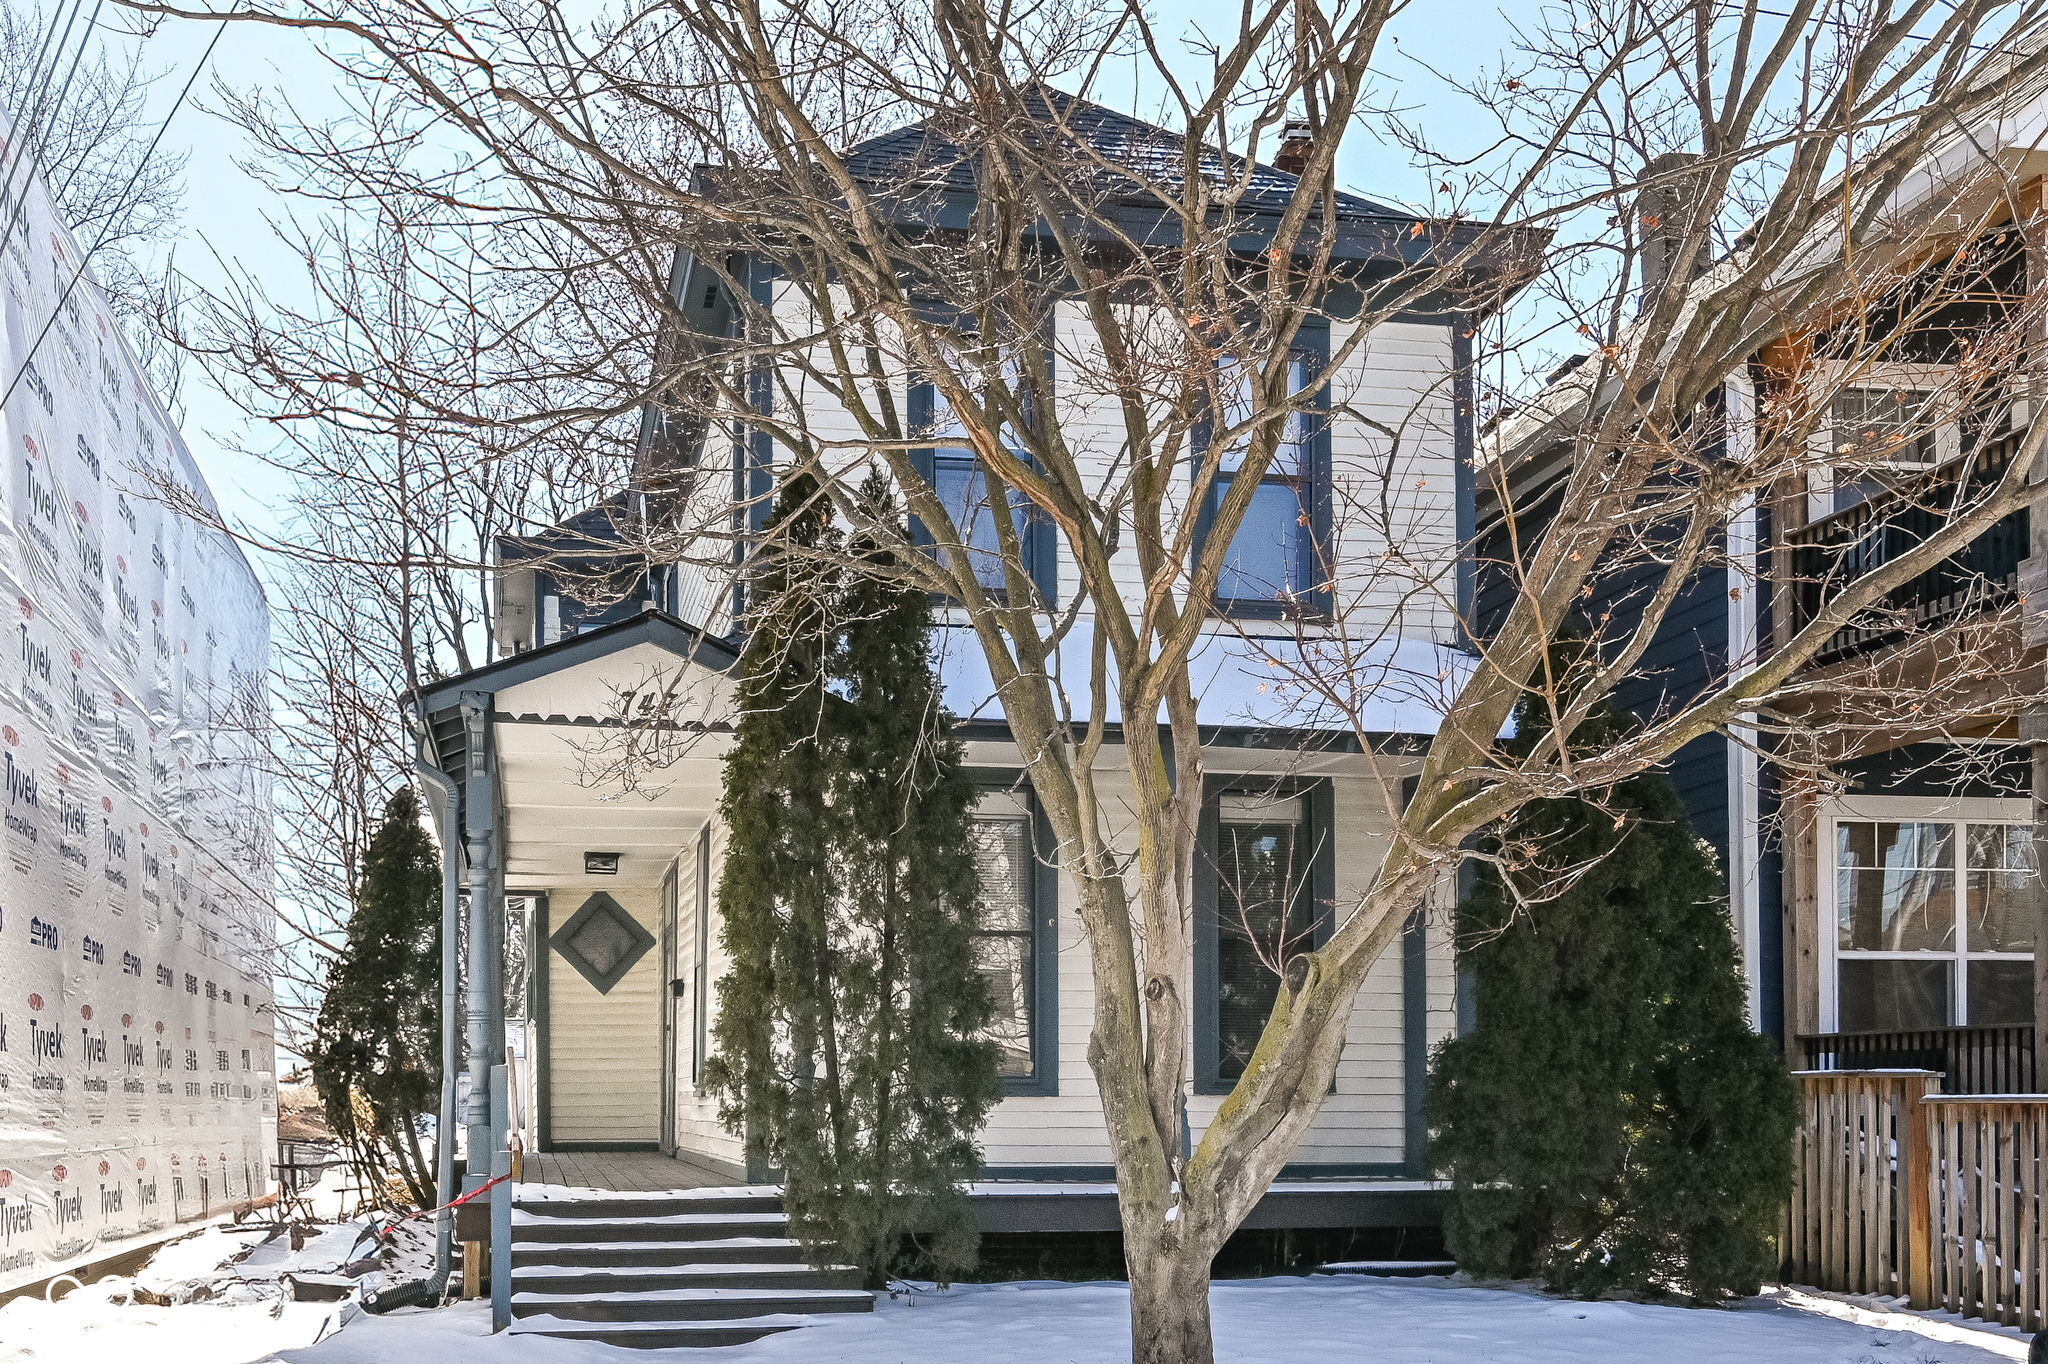
Active
$289,900
3
bds
|
2
ba
|
1,822
sqft
|
built
1900
747 E Mc Carty St, Indianapolis, IN 46203
$0
Cash flow
0.0%
Cash-on-Cash Return
6.3%
Cap rate
0.8%
Rent to Value Ratio