Indianapolis, IN Investment Properties for Sale
Browse homes for sale and investment properties in Indianapolis, IN. Refine your search by price, property type, or more.
Best cash flowing properties in Indianapolis, IN
Active
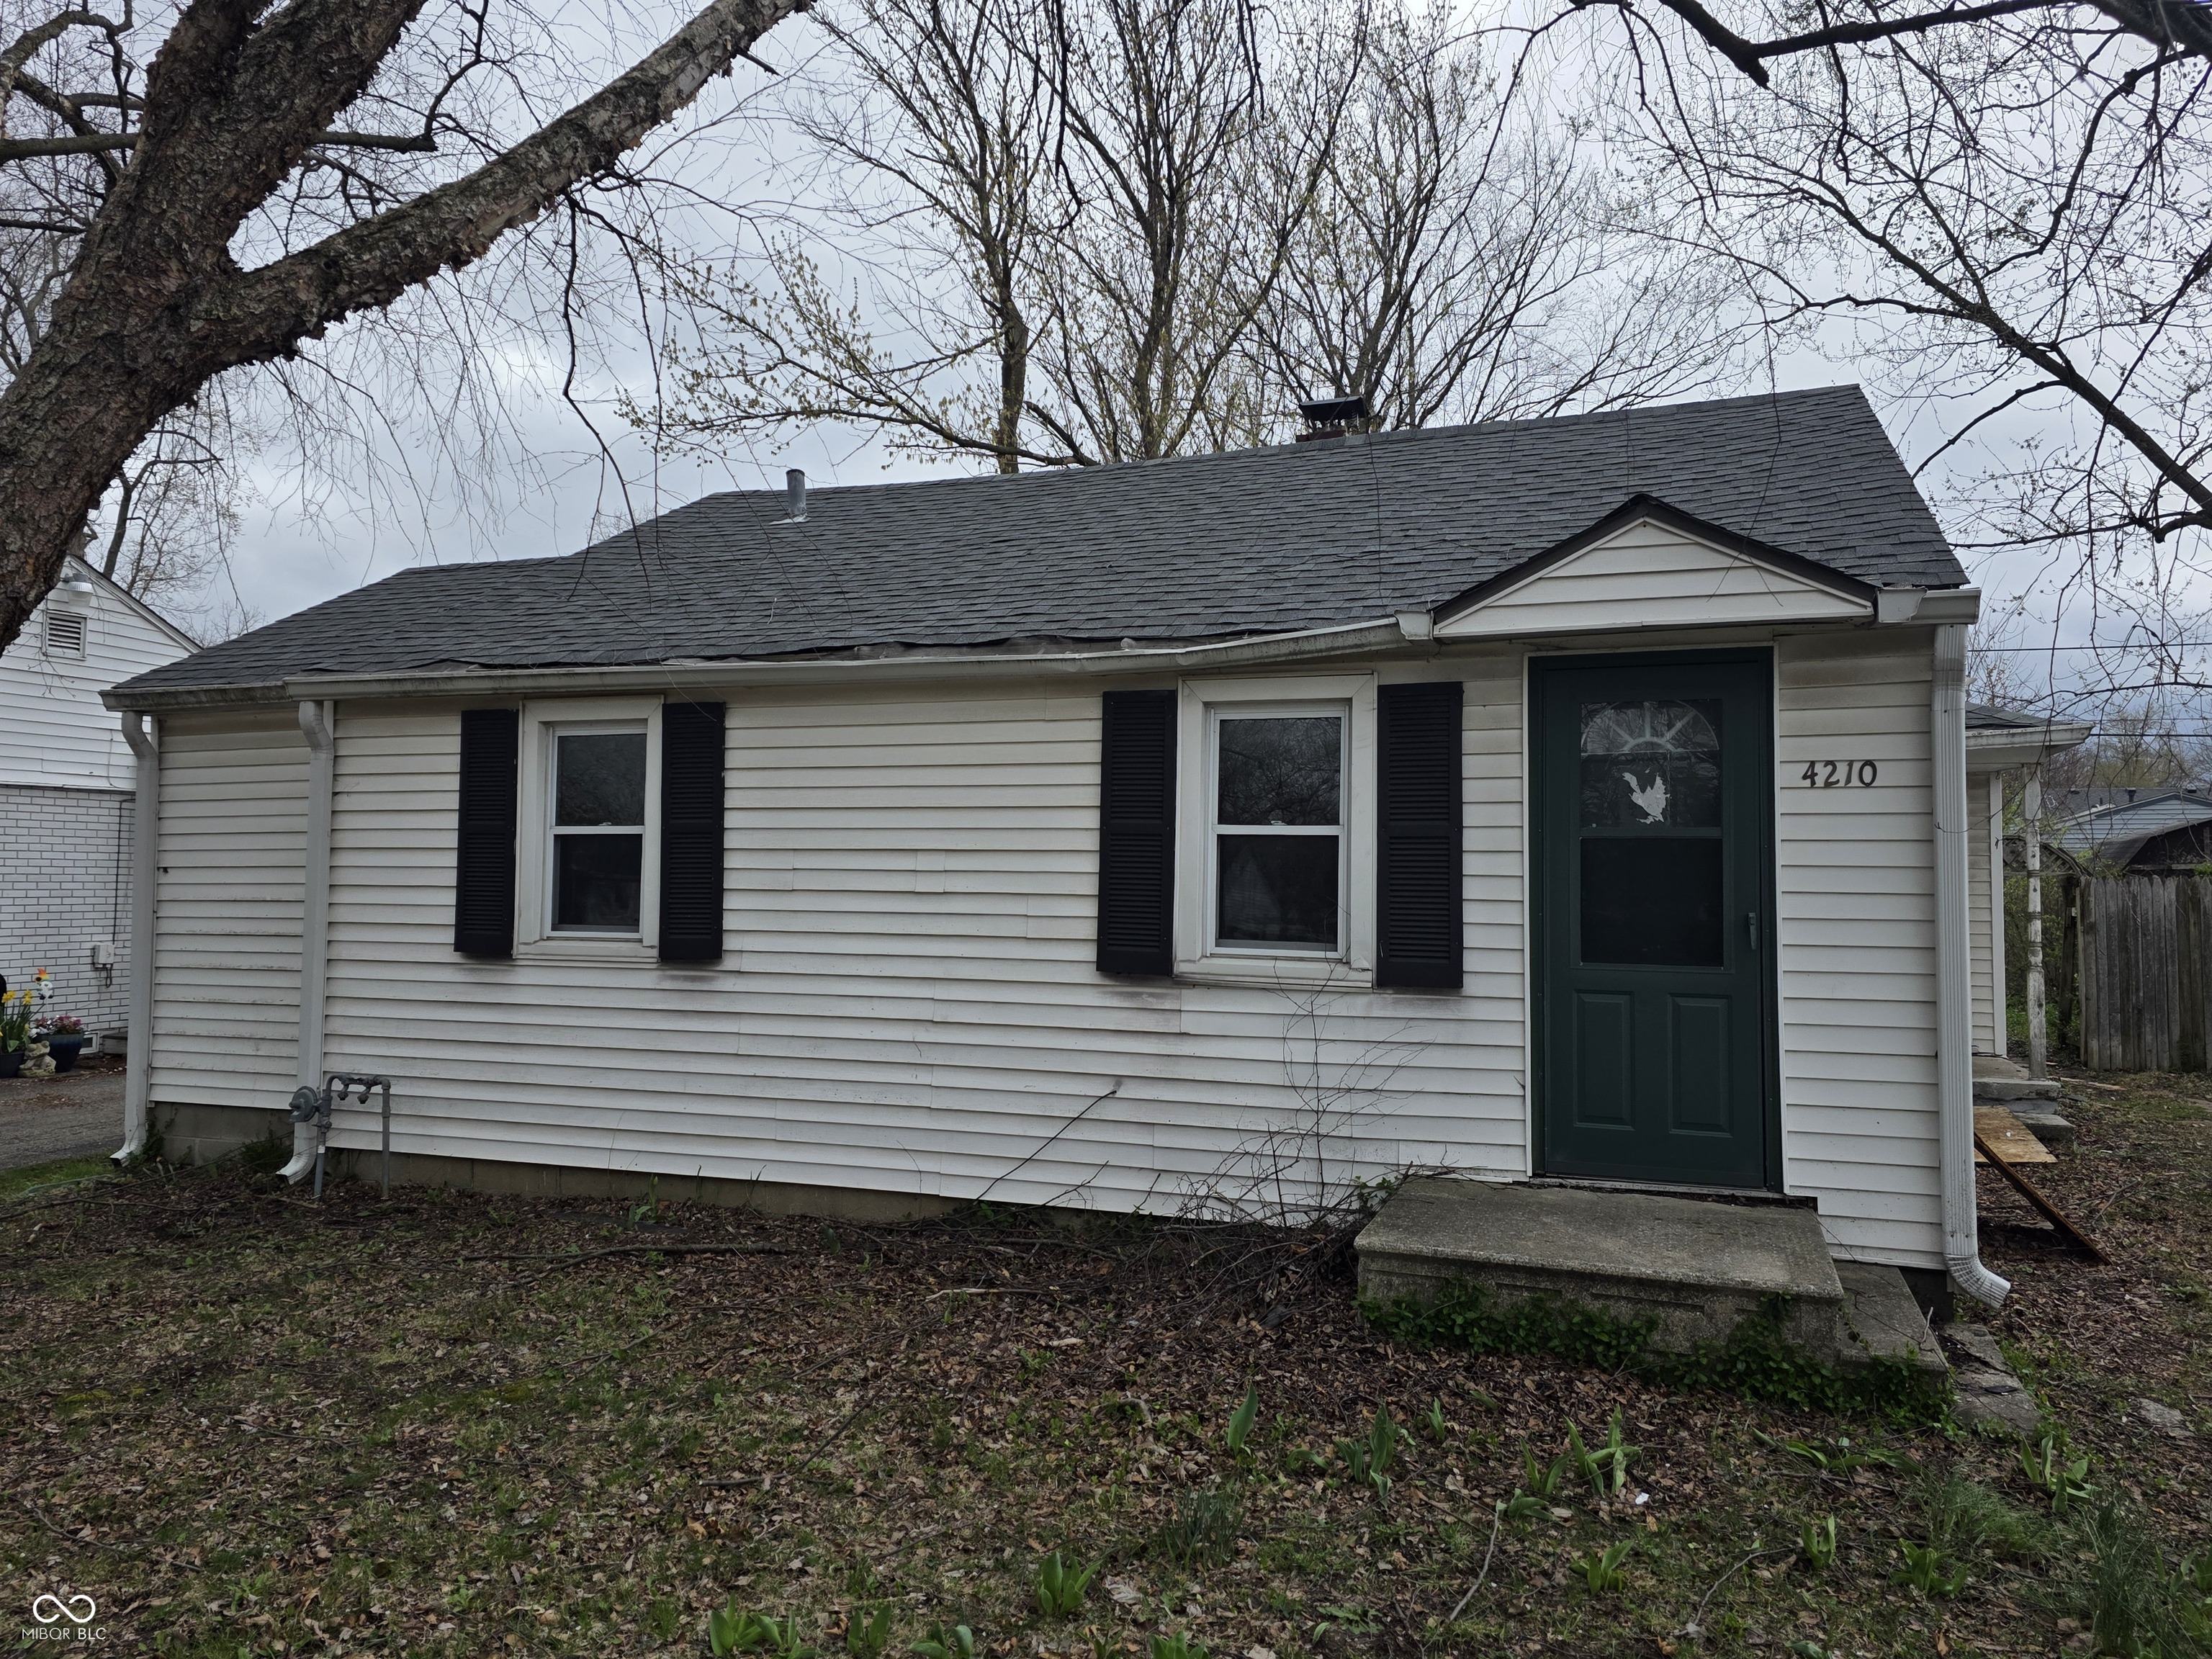
$65,000
3
bds
|
1
ba
|
1,108
sqft
|
built
1947
4210 E Naomi St, Indianapolis, IN 46203
$966
Cash flow
17.3%
Cash-on-Cash Return
17.8%
Cap rate
2.2%
Rent to Value Ratio
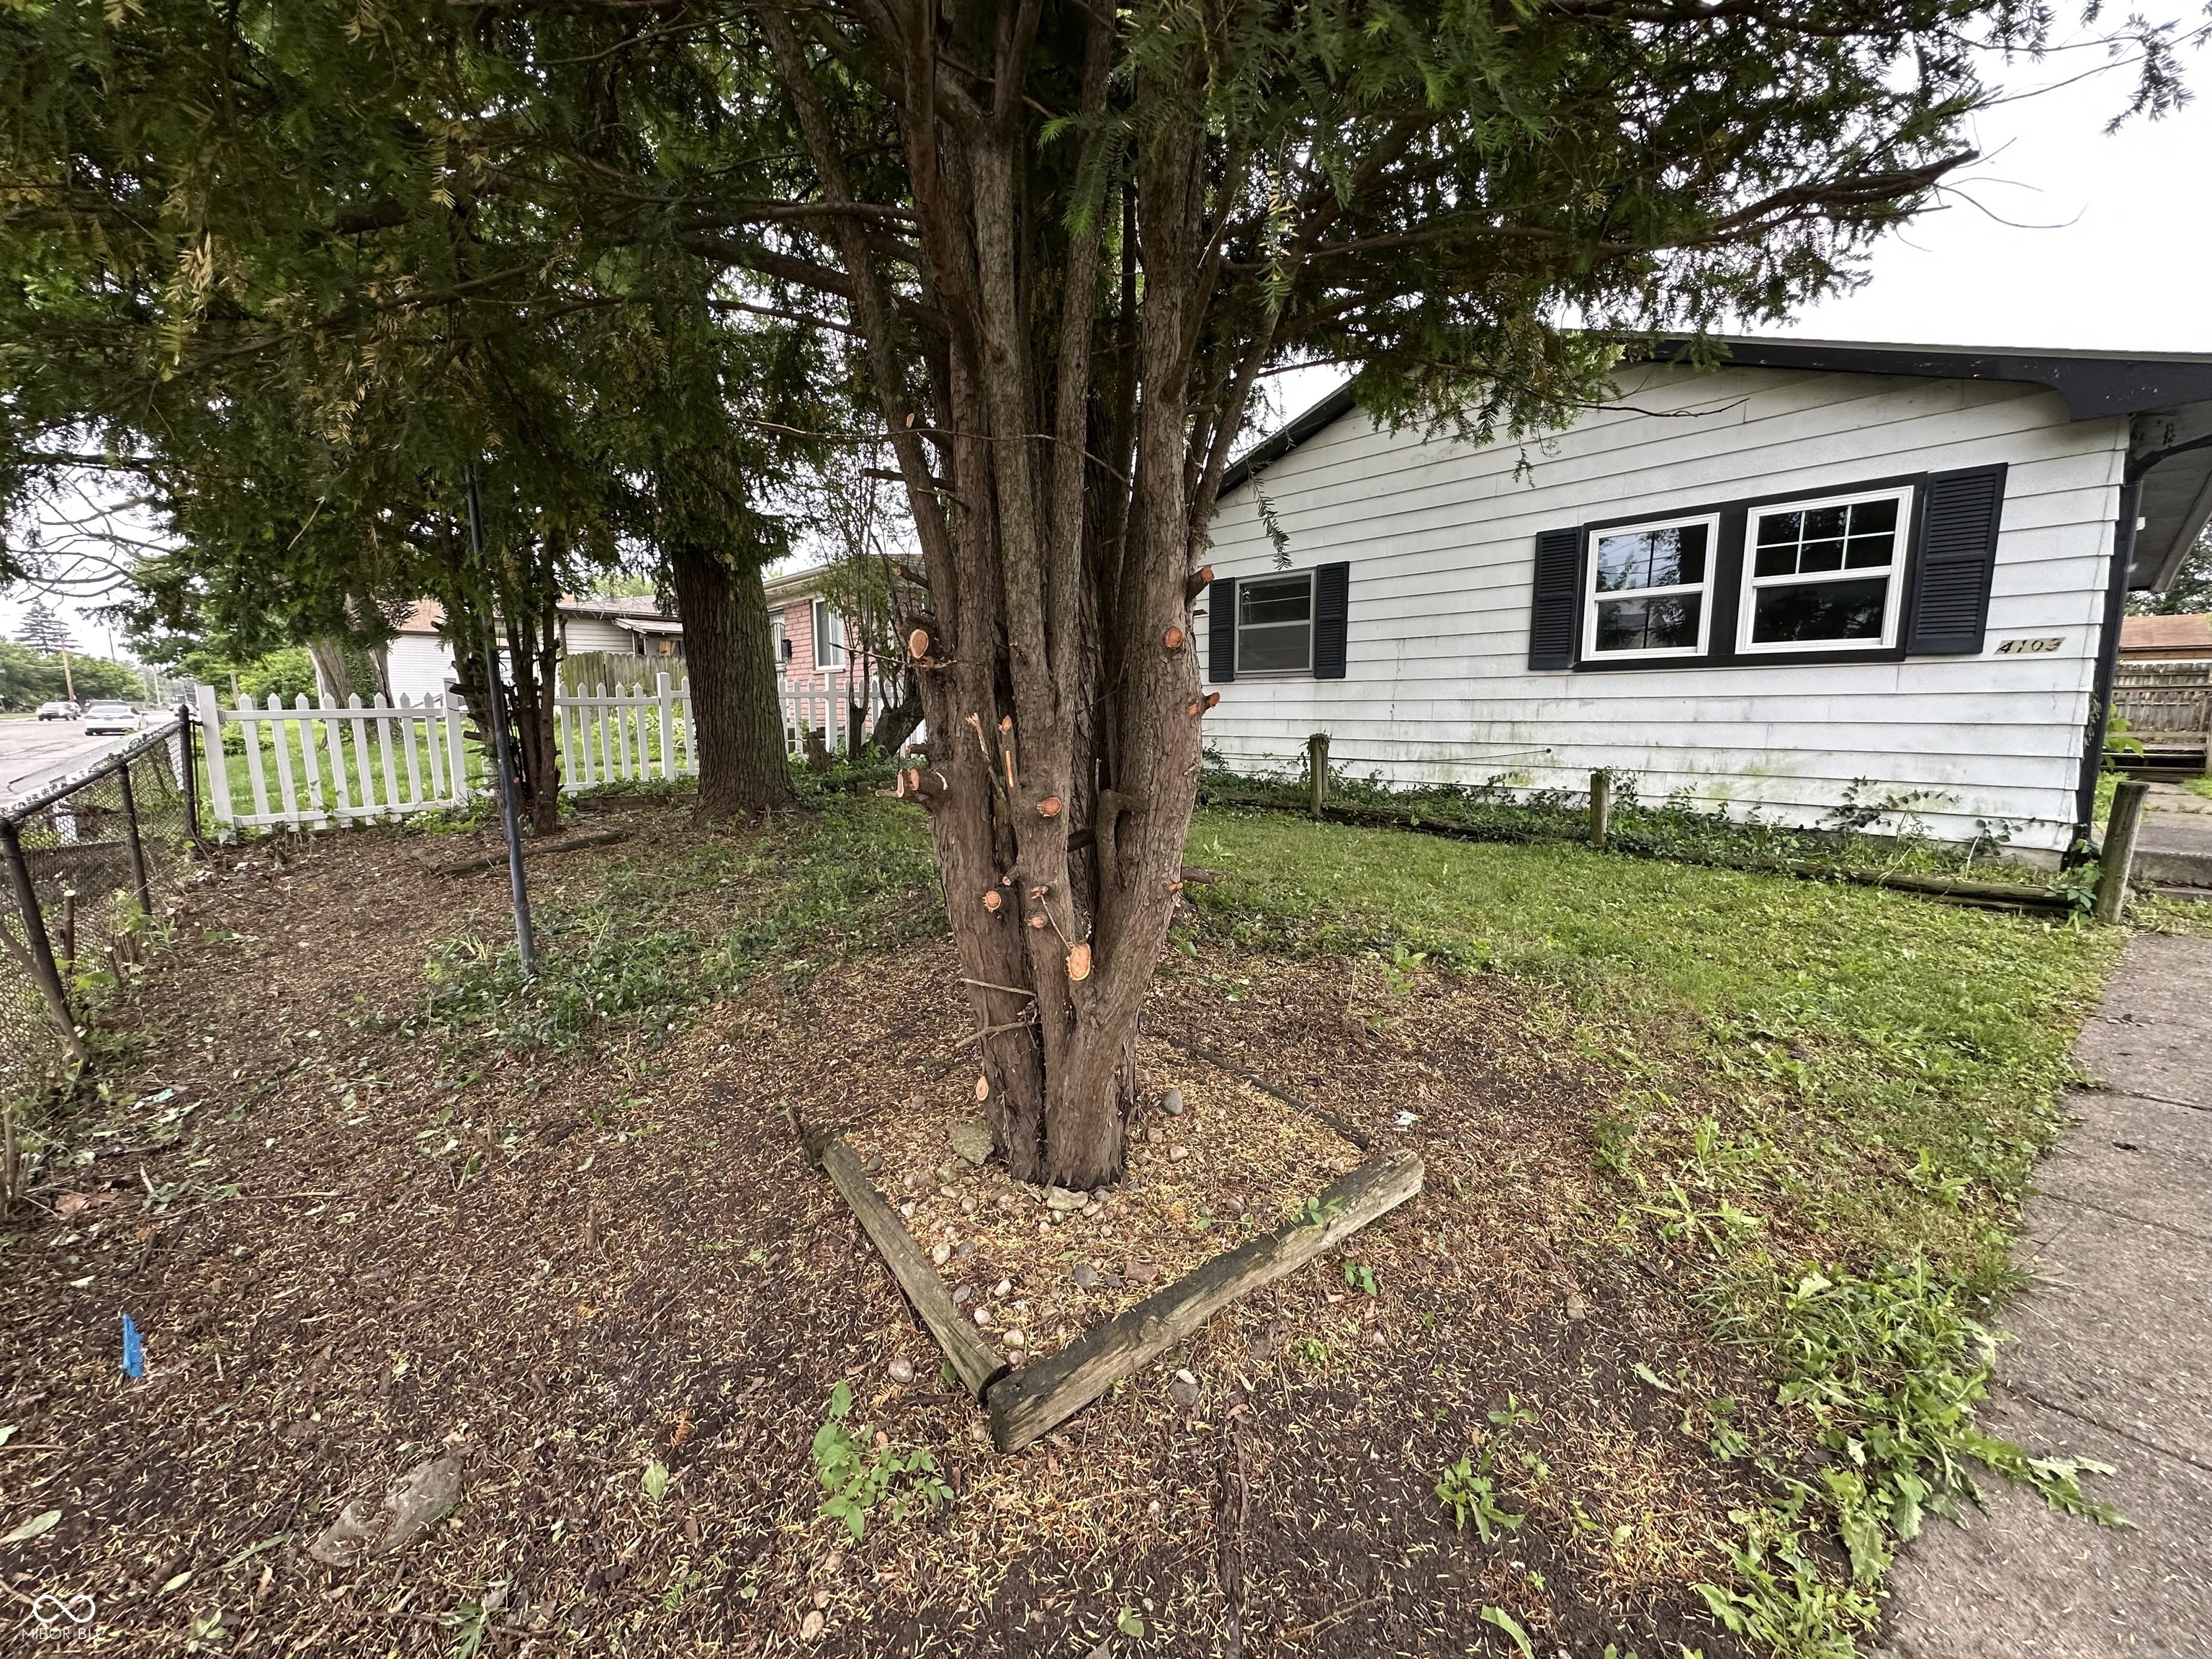
Active
$95,000
3
bds
|
1
ba
|
1,080
sqft
|
built
1951
4109 E 21st St, Indianapolis, IN 46218
$410
Cash flow
22.5%
Cash-on-Cash Return
11.3%
Cap rate
1.4%
Rent to Value Ratio
1,974 out of 2,115 properties for sale in Indianapolis, IN
Limited Results Shown
Create a free account, or log in to reveal all property listings and enjoy the complete experience.
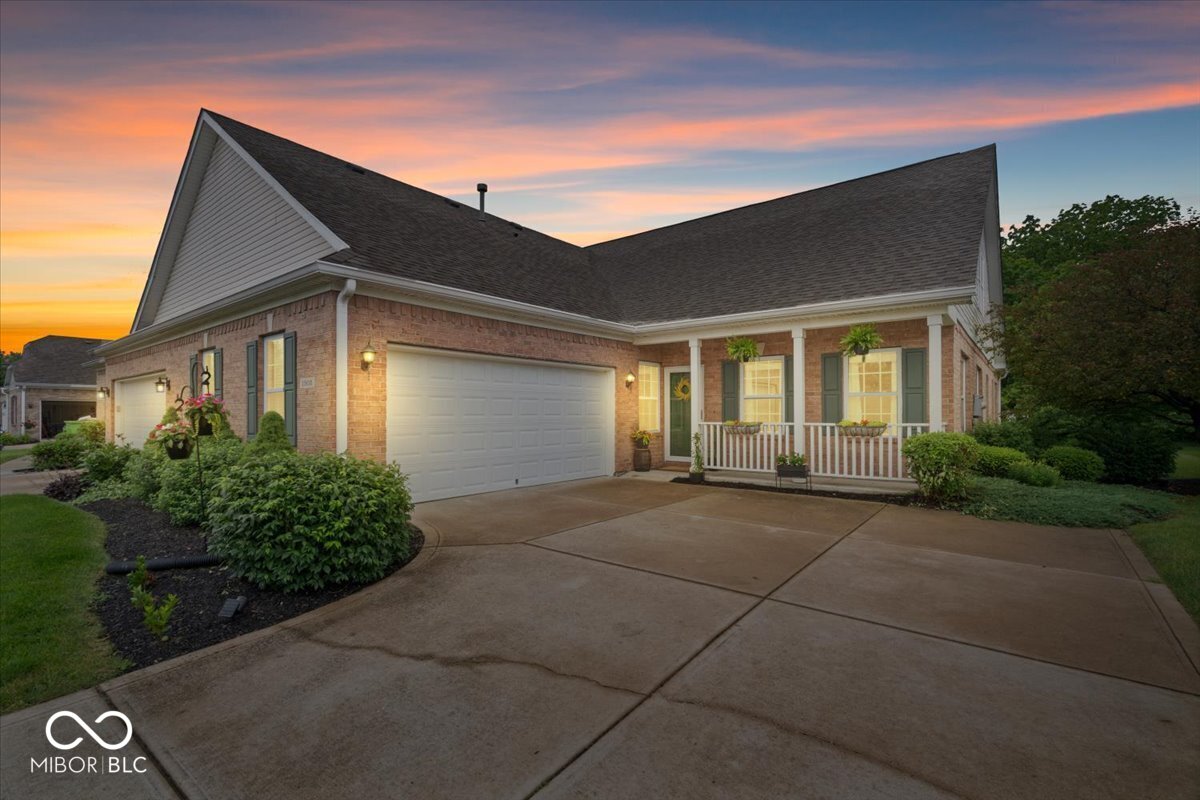
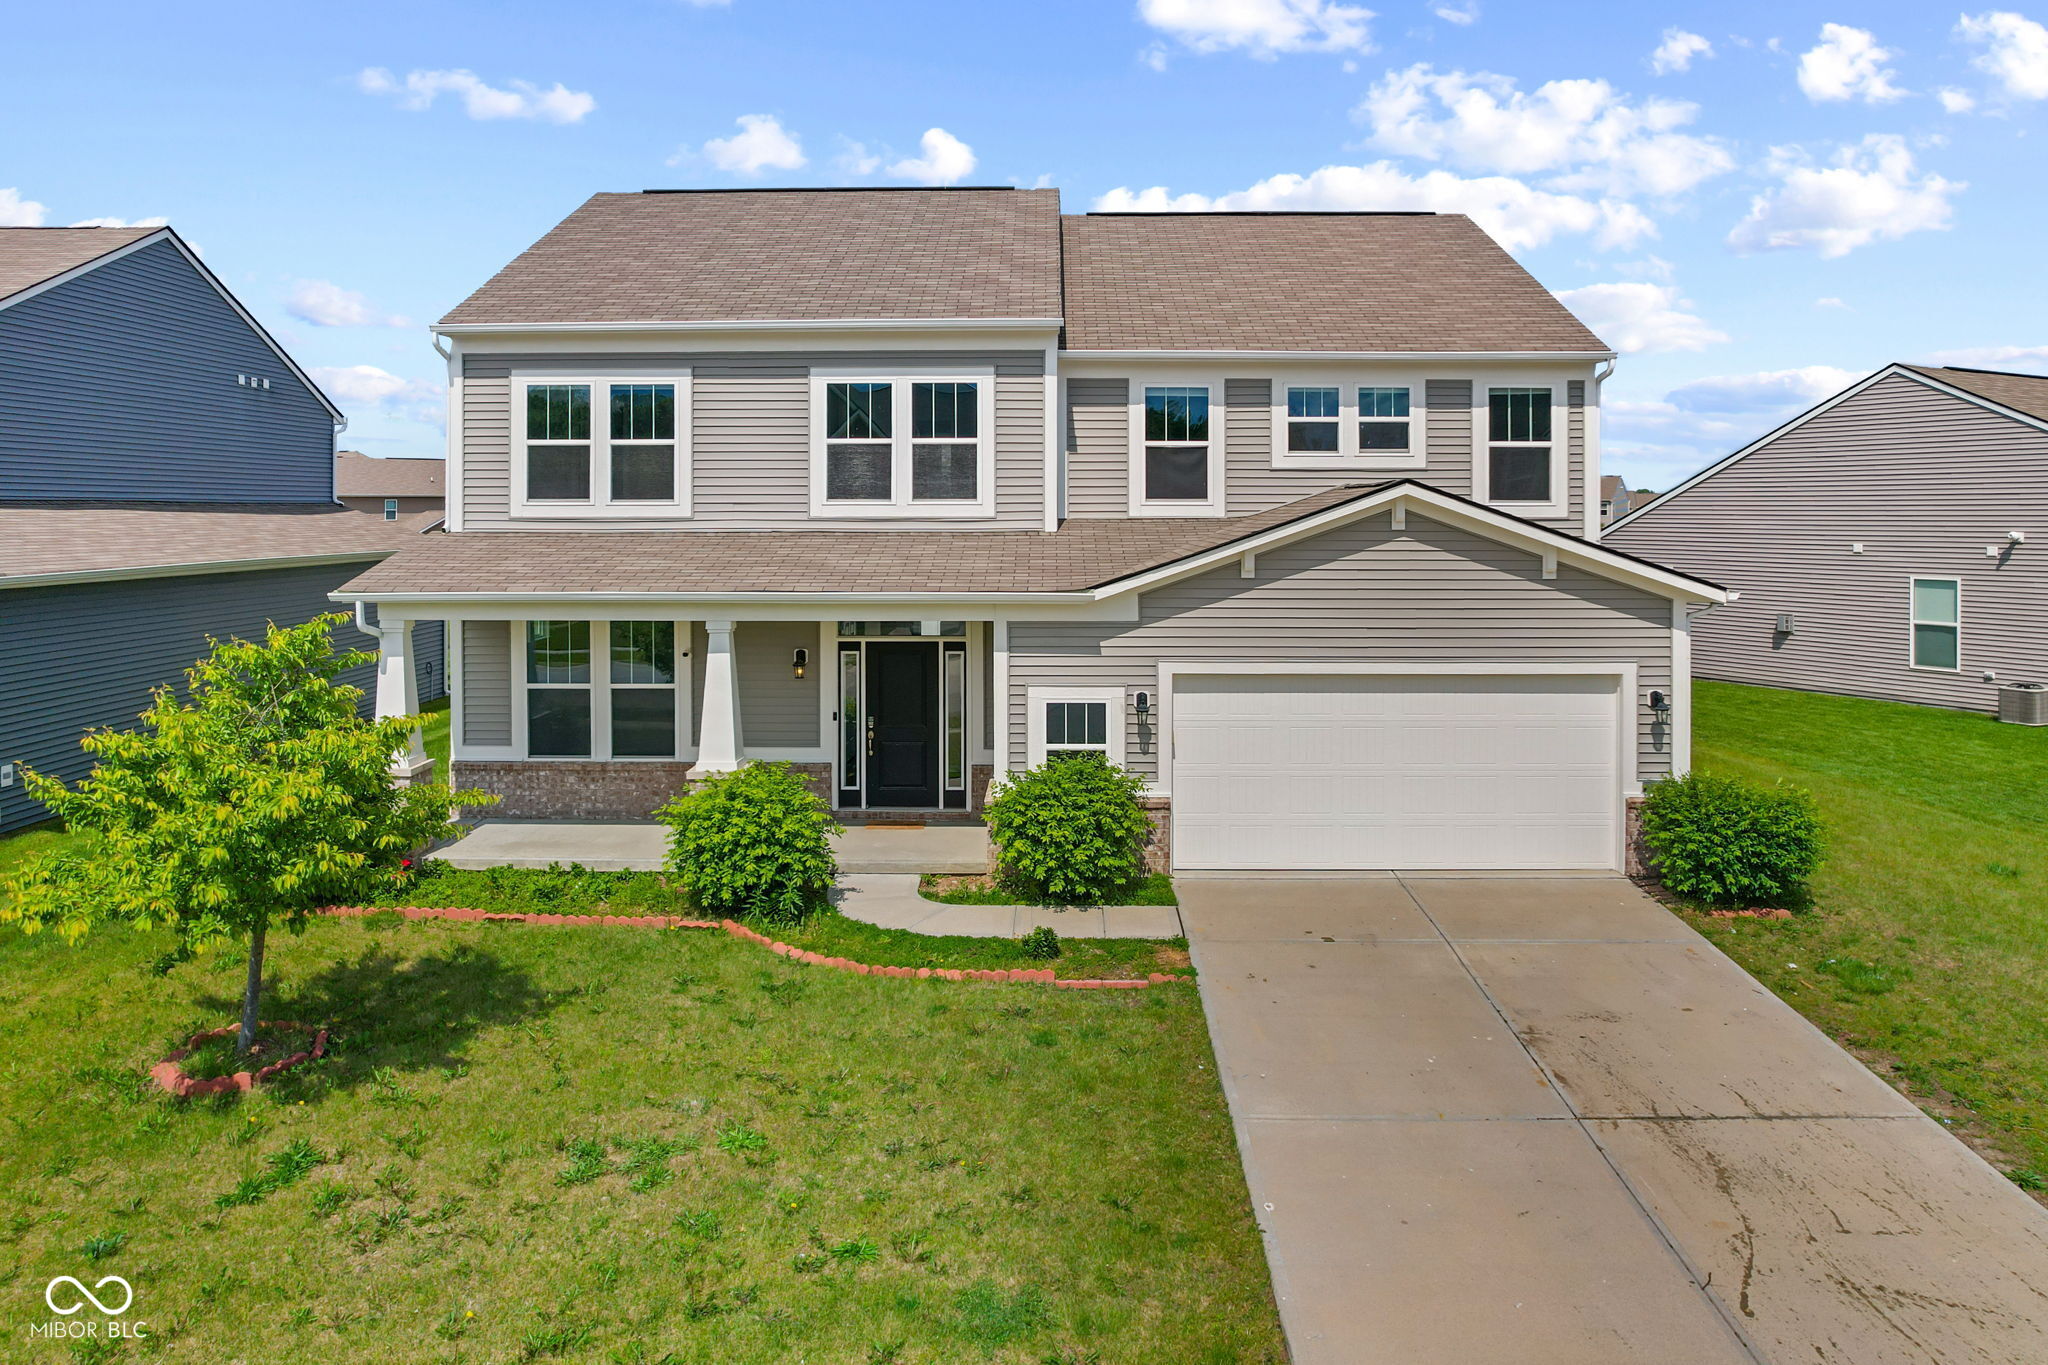
Active
$350,000
3
bds
|
3
ba
|
2,214
sqft
|
built
2007
1905 Persimmon Grove Dr, Indianapolis, IN 46234
$-449
Cash flow
-6.7%
Cash-on-Cash Return
4.6%
Cap rate
0.7%
Rent to Value Ratio
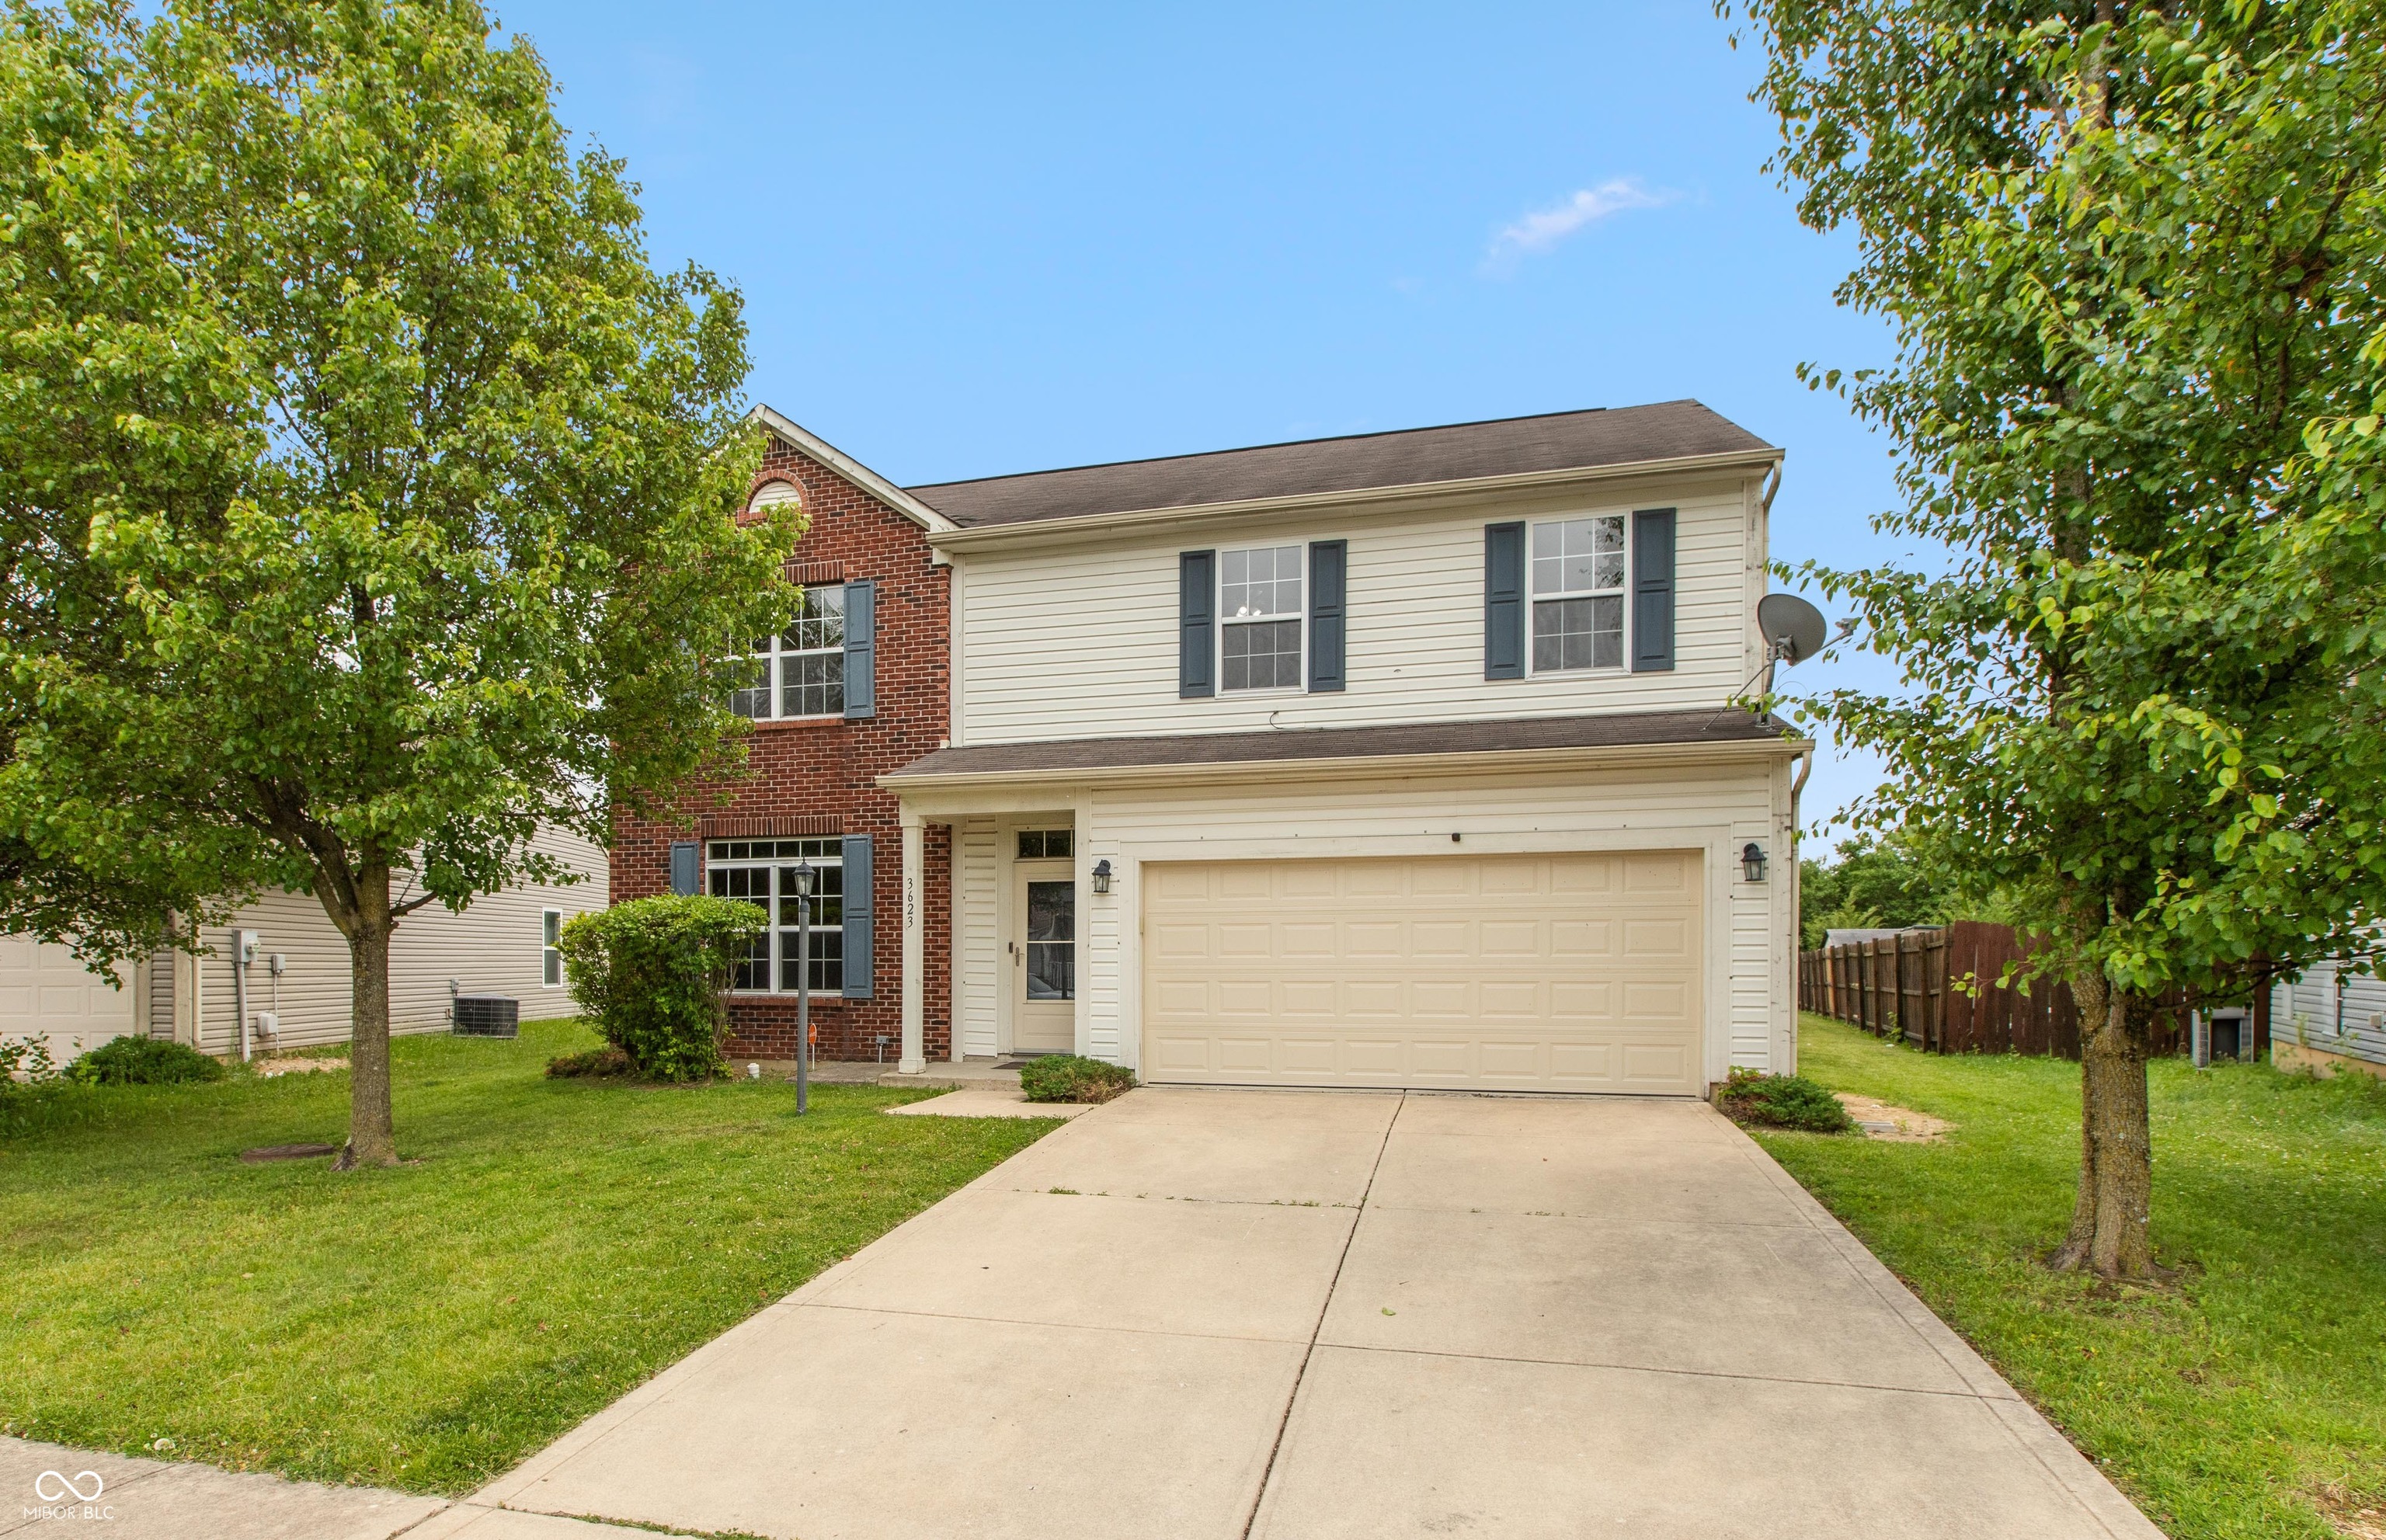
Active
$260,000
4
bds
|
3
ba
|
2,080
sqft
|
built
2005
3623 Carroll Farms Dr, Indianapolis, IN 46235
$169
Cash flow
3.4%
Cash-on-Cash Return
6.9%
Cap rate
0.8%
Rent to Value Ratio
Active
$415,000
3
bds
|
2
ba
|
1,680
sqft
|
built
1926
715 Kessler Boulevard East Dr, Indianapolis, IN 46220
$-539
Cash flow
-6.8%
Cash-on-Cash Return
4.6%
Cap rate
0.6%
Rent to Value Ratio
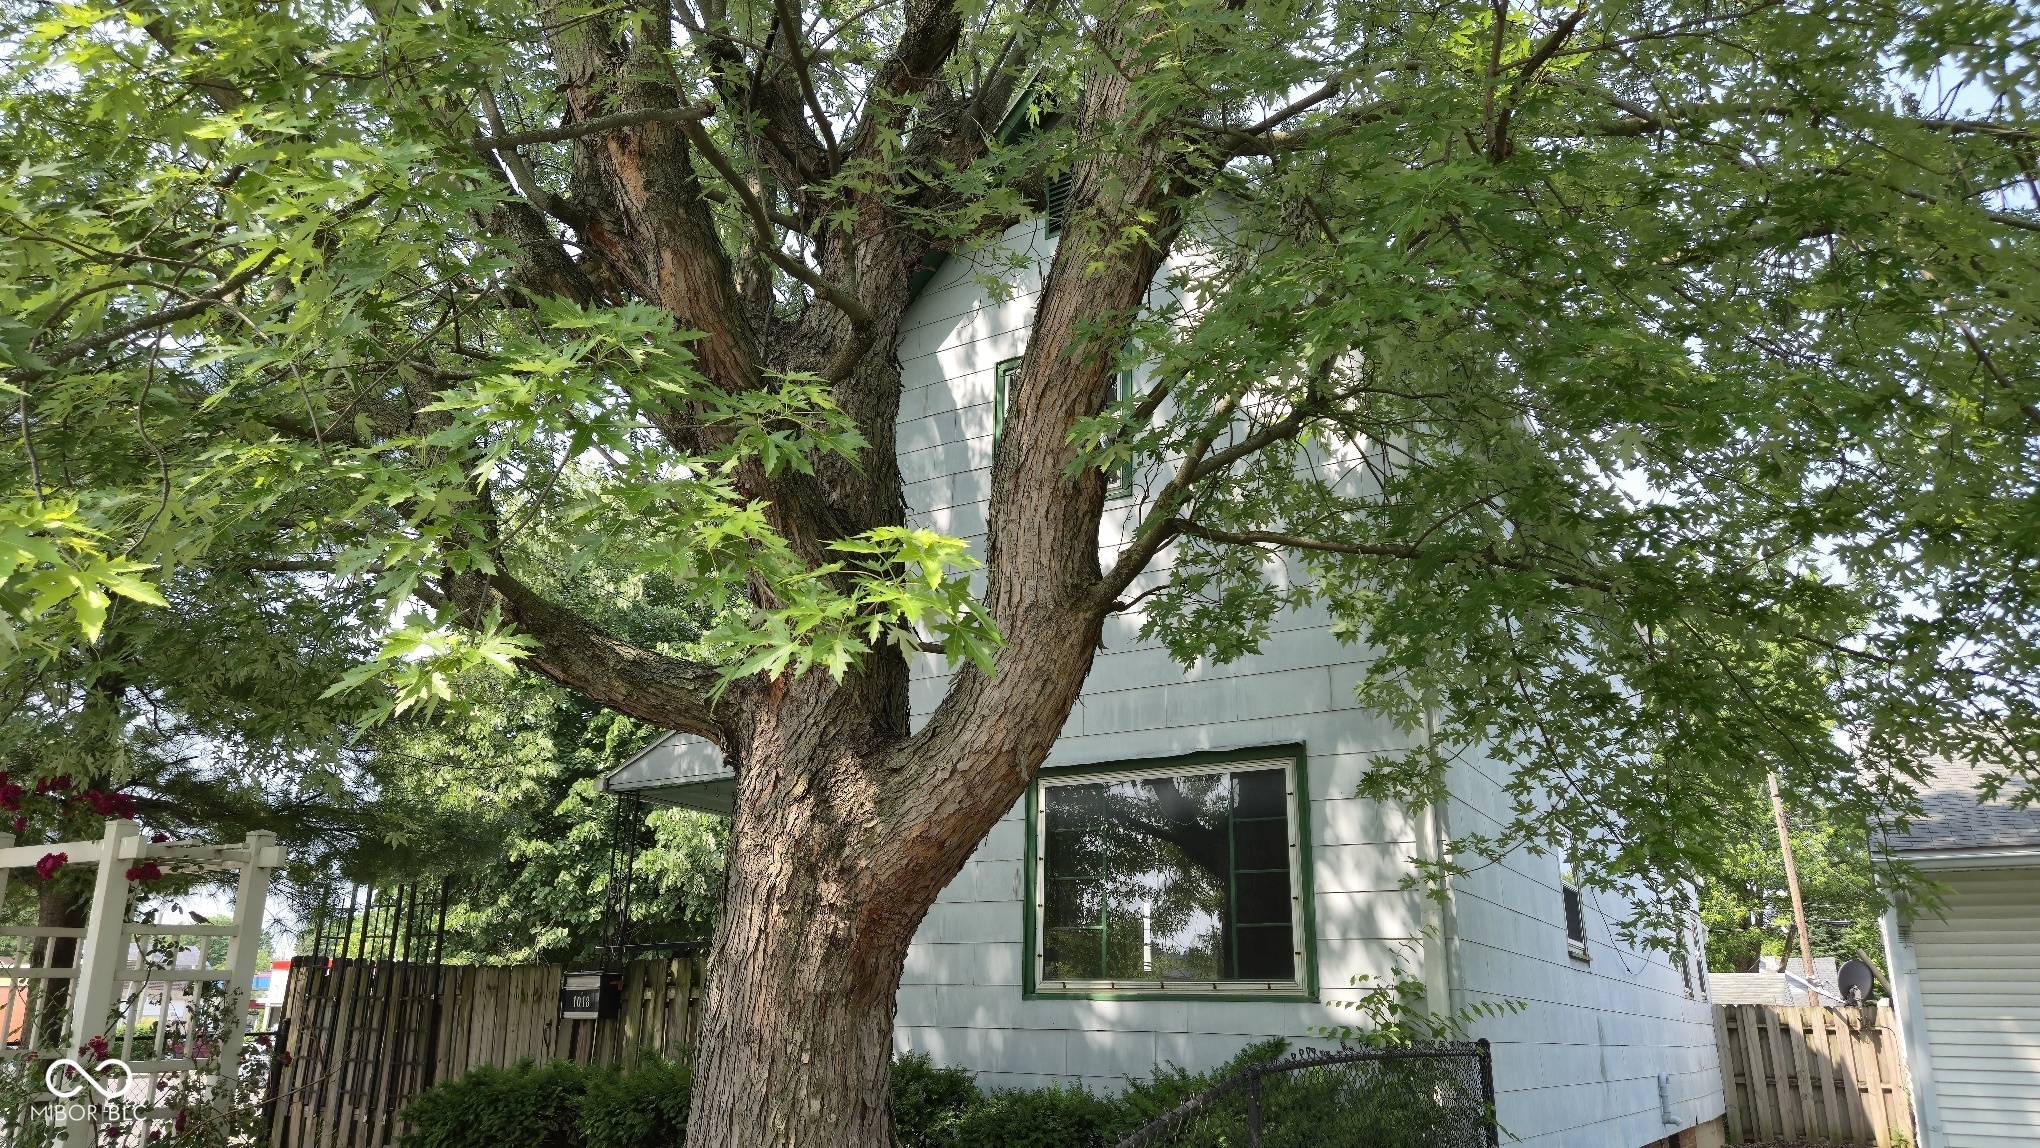
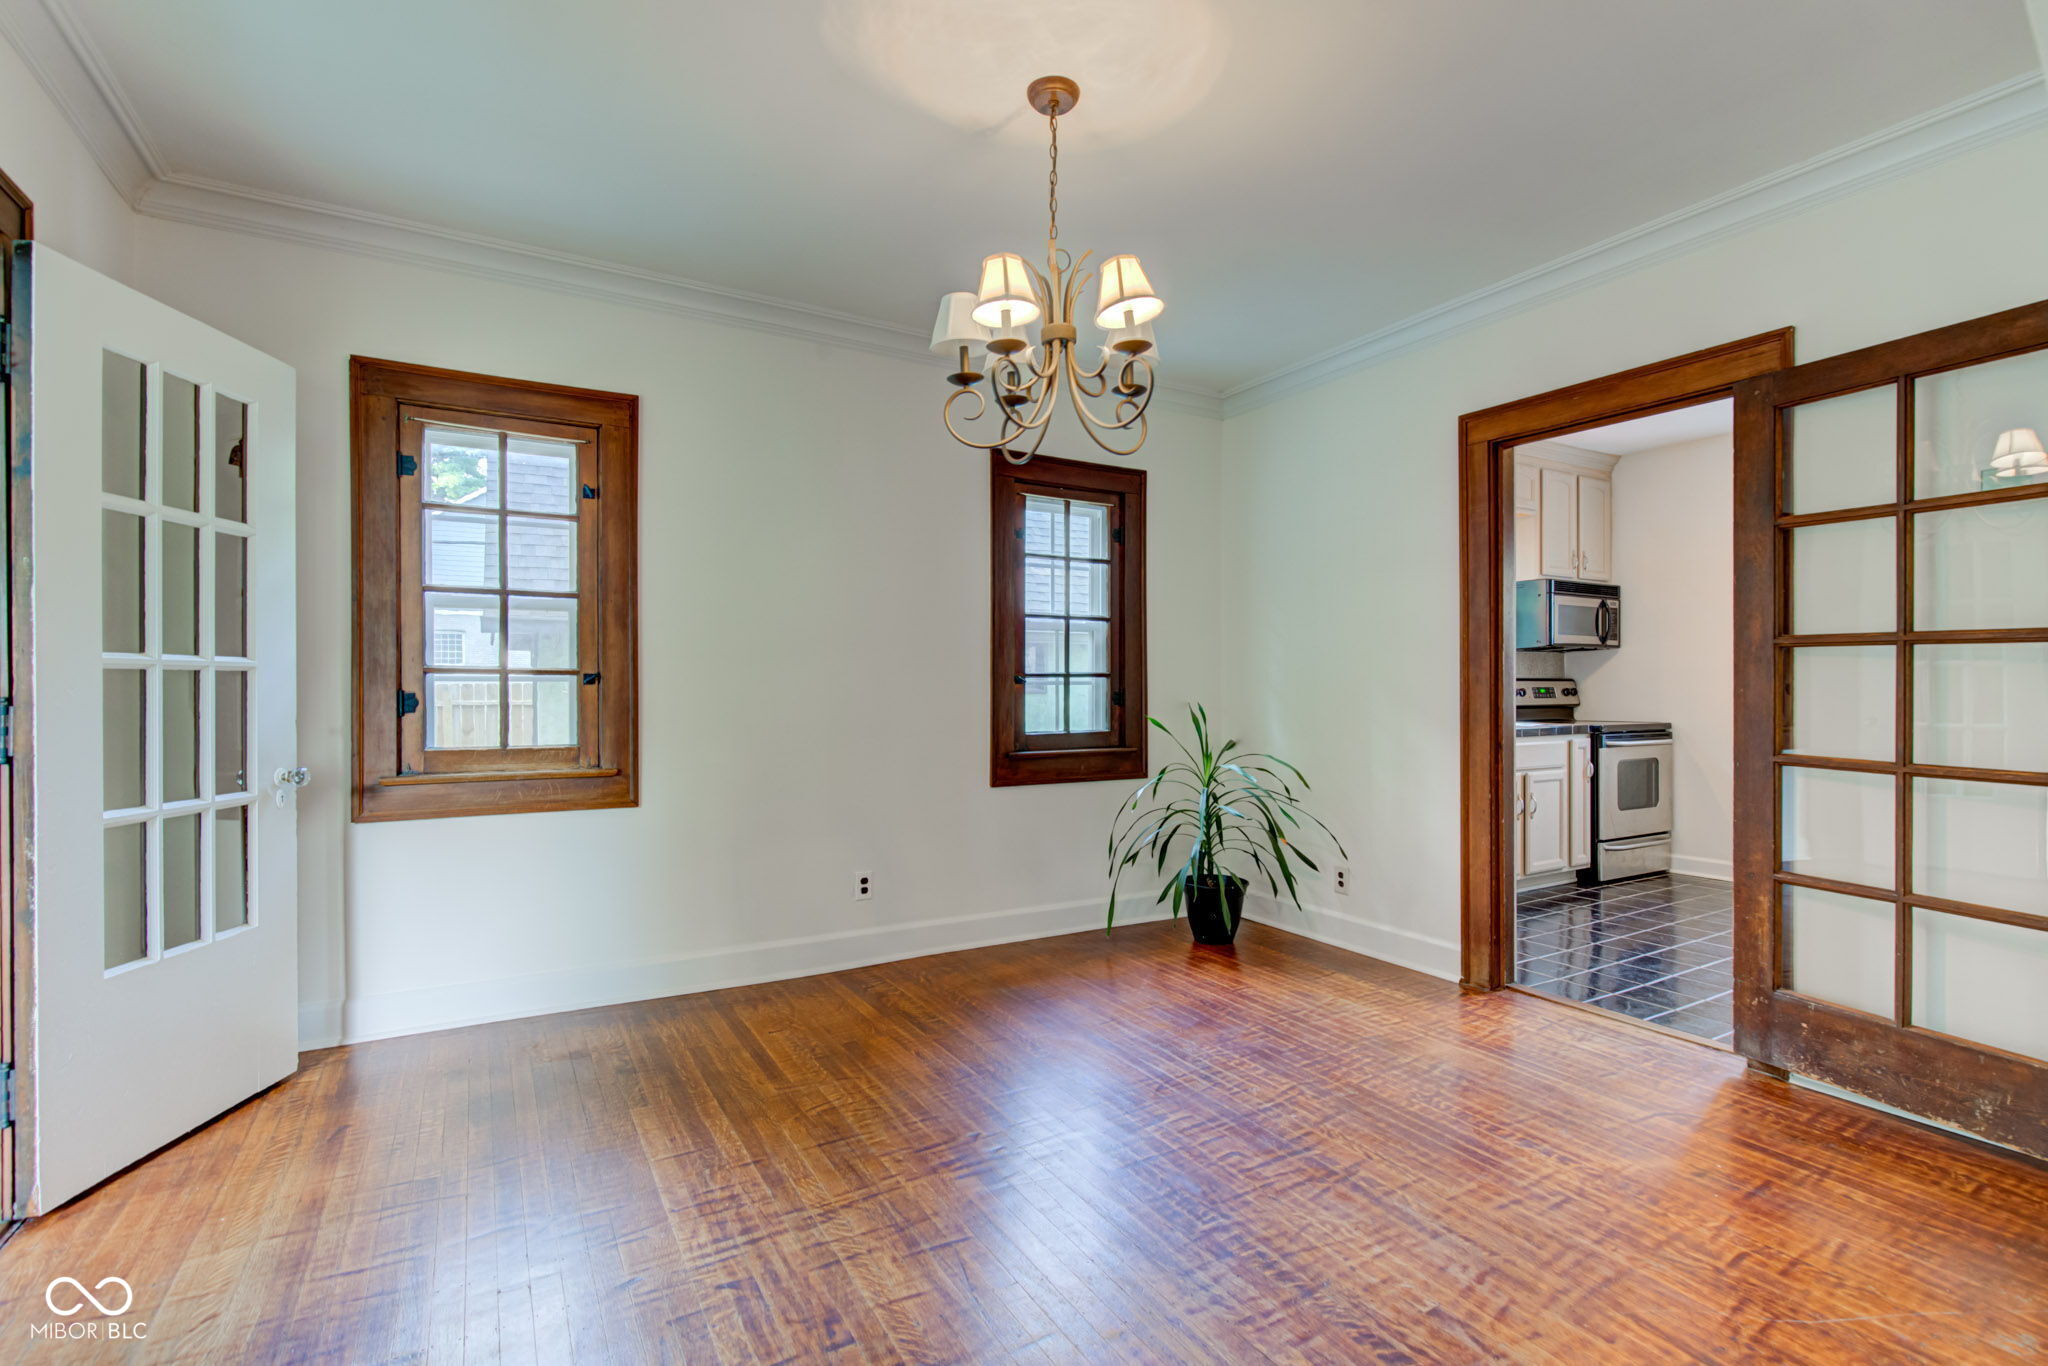
Active
$204,900
3
bds
|
2
ba
|
1,650
sqft
|
built
1920
1018 Jefferson Ave, Indianapolis, IN 46201
$54
Cash flow
1.4%
Cash-on-Cash Return
6.5%
Cap rate
0.8%
Rent to Value Ratio
Active
$299,000
2
bds
|
2
ba
|
1,555
sqft
|
built
2006
2326 N Pennsylvania St, Indianapolis, IN 46205
$-332
Cash flow
-5.8%
Cash-on-Cash Return
4.8%
Cap rate
0.7%
Rent to Value Ratio
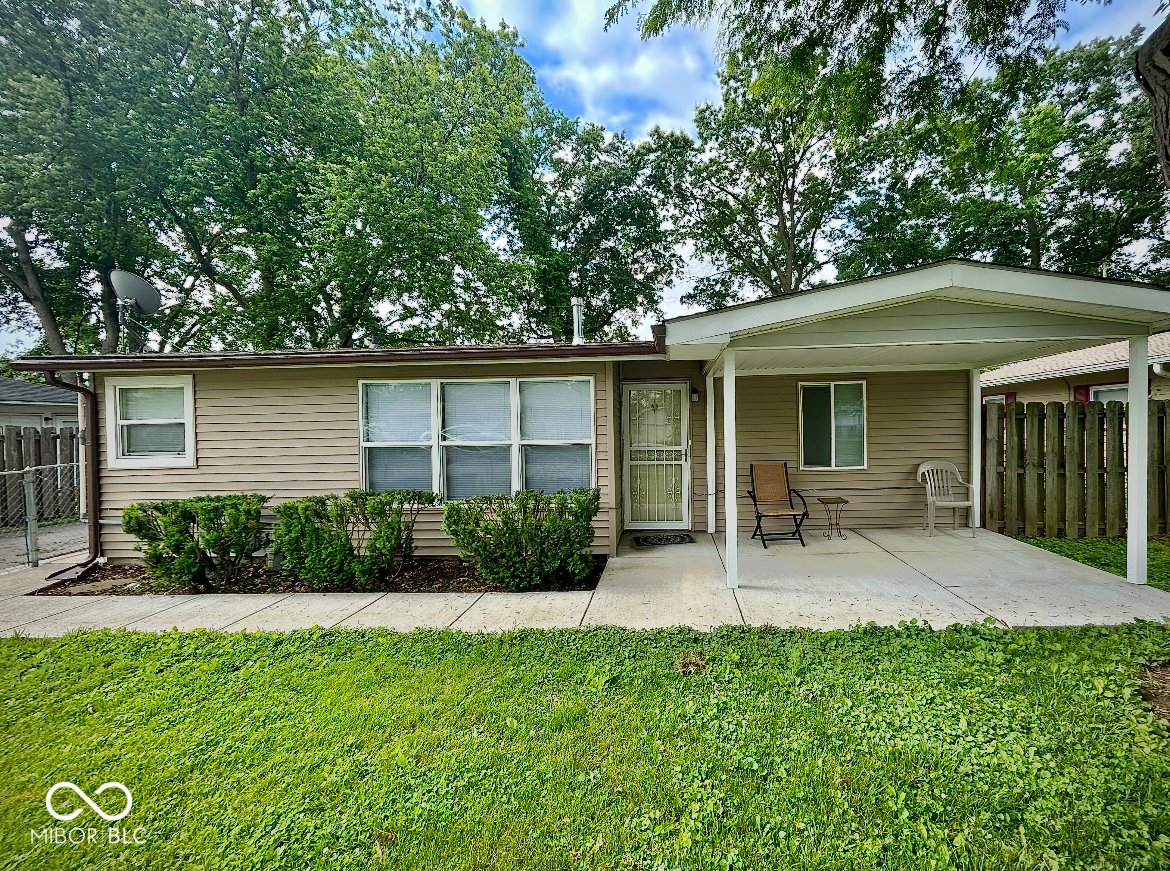
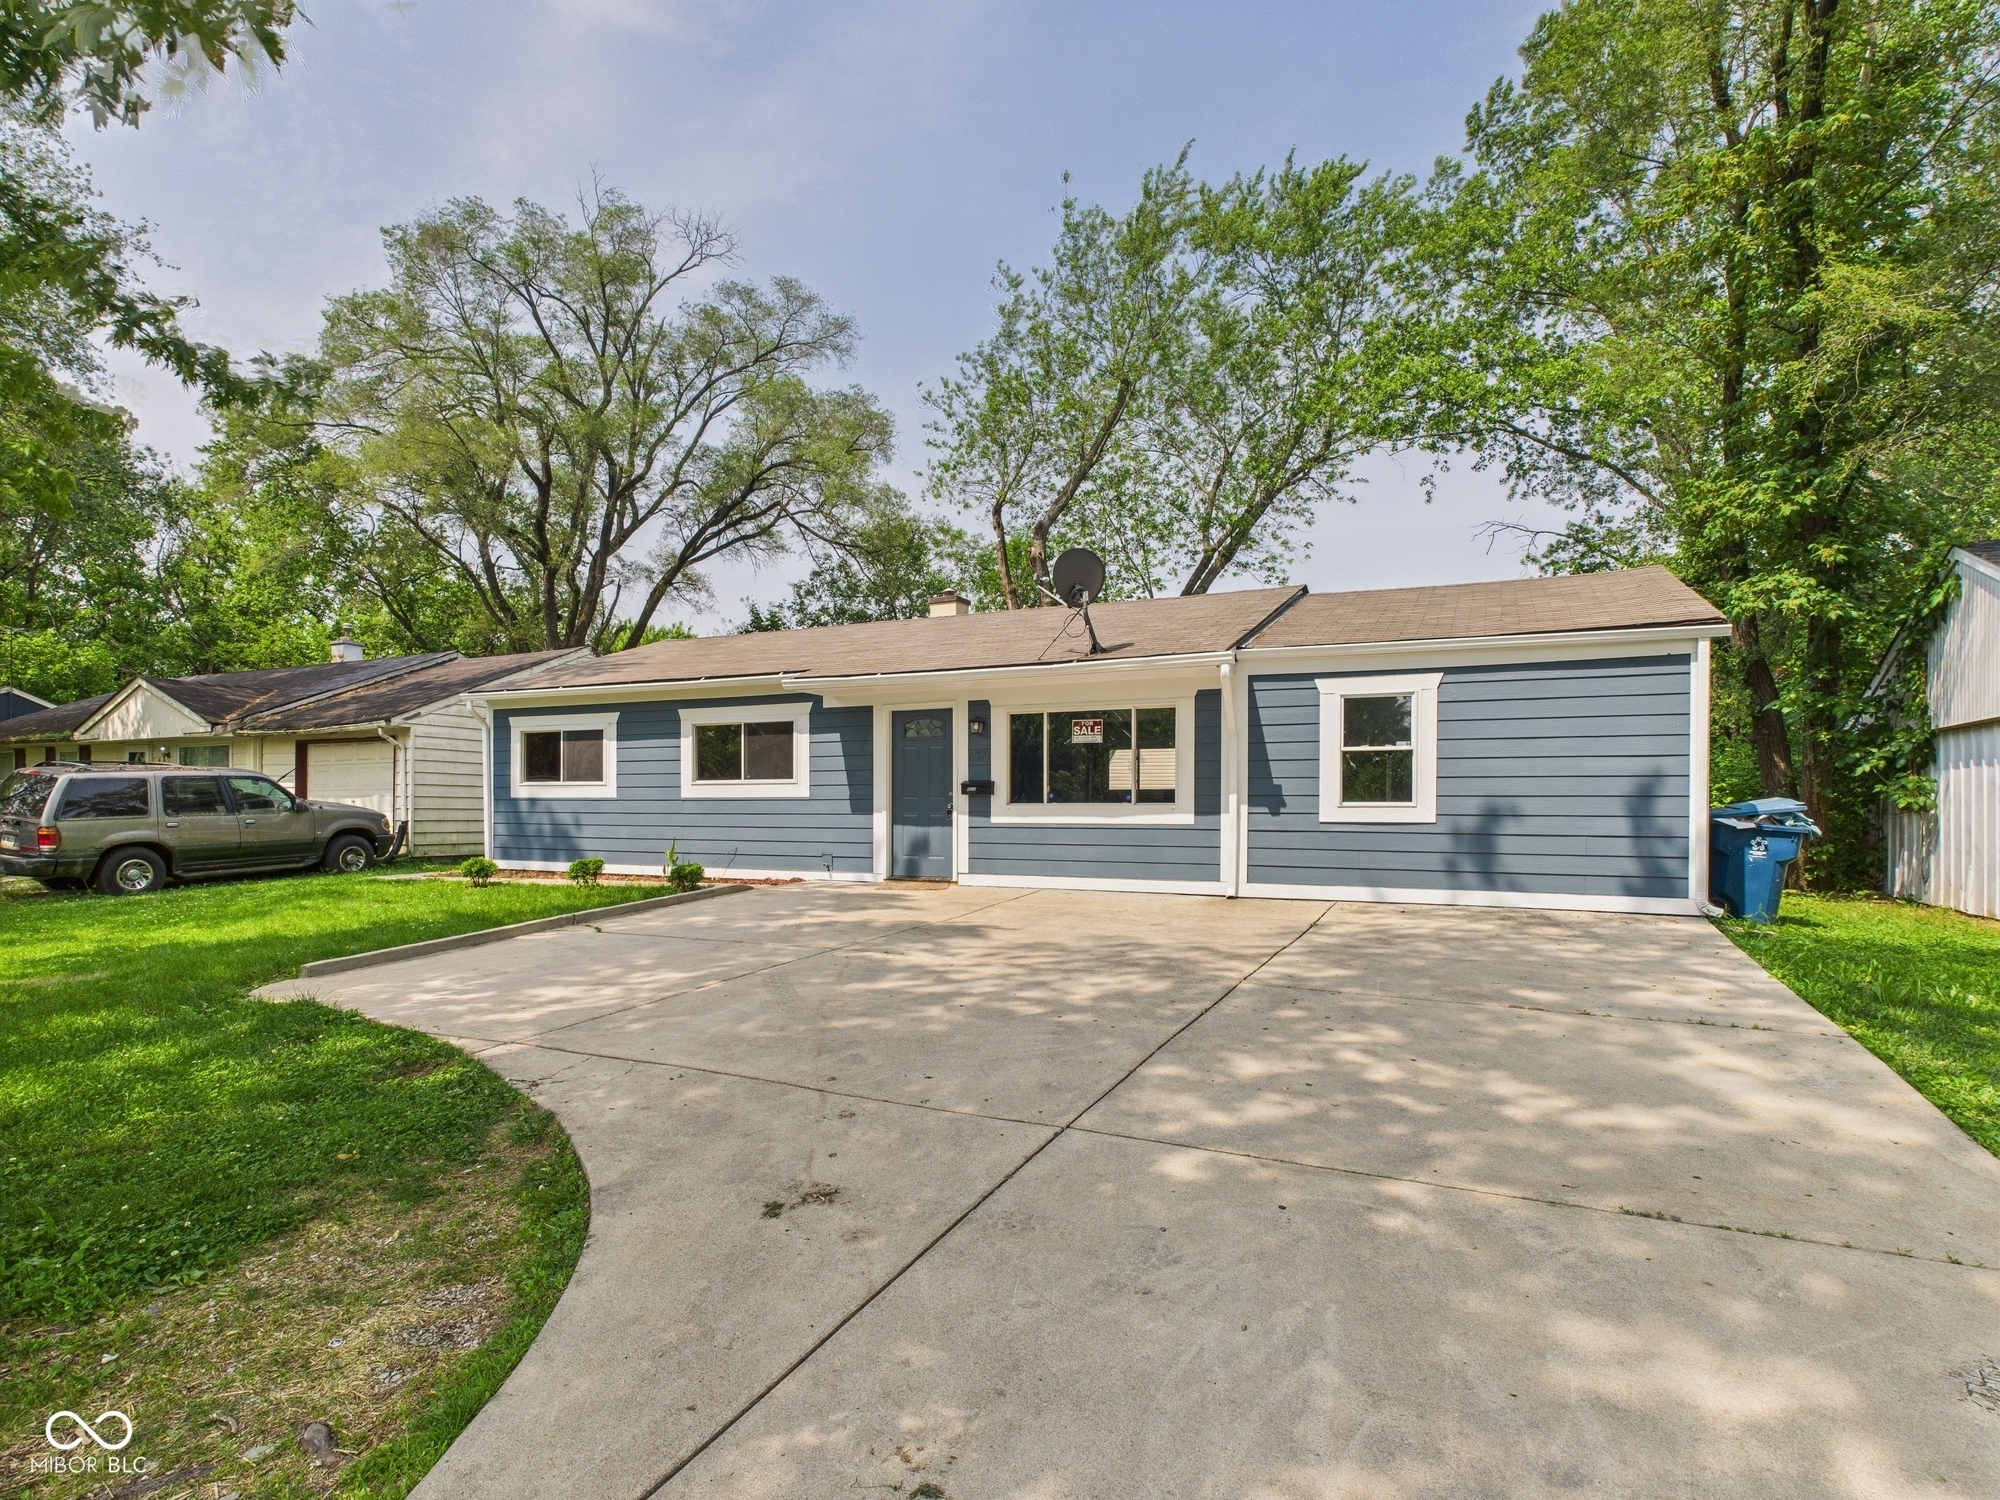
Active
$199,000
4
bds
|
1
ba
|
1,500
sqft
|
built
1955
3161 Normandy Rd, Indianapolis, IN 46222
$85
Cash flow
2.2%
Cash-on-Cash Return
6.7%
Cap rate
0.8%
Rent to Value Ratio
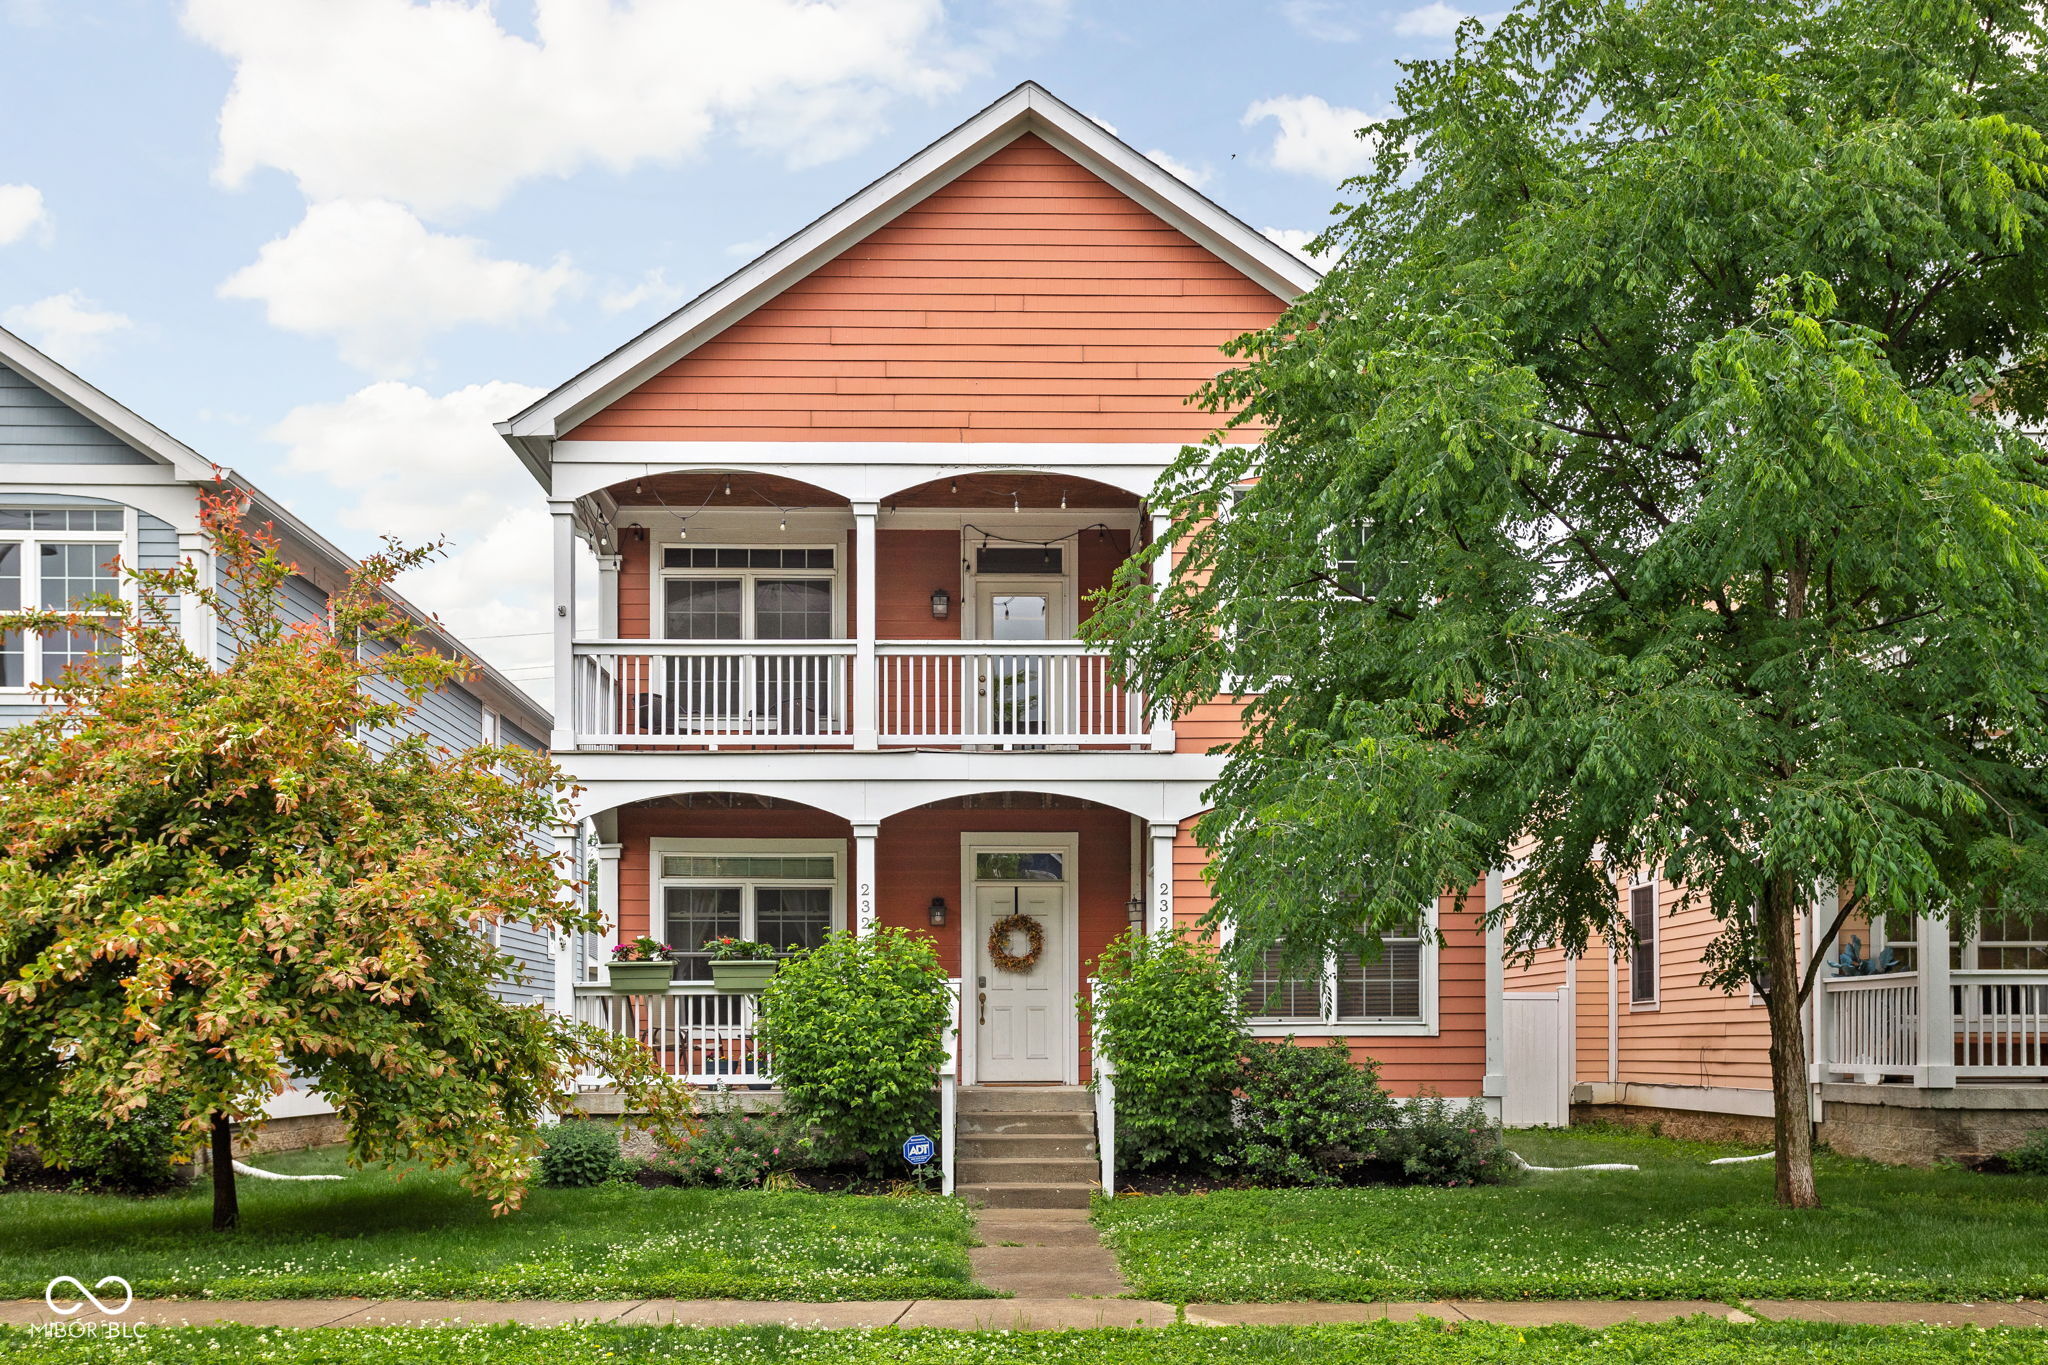
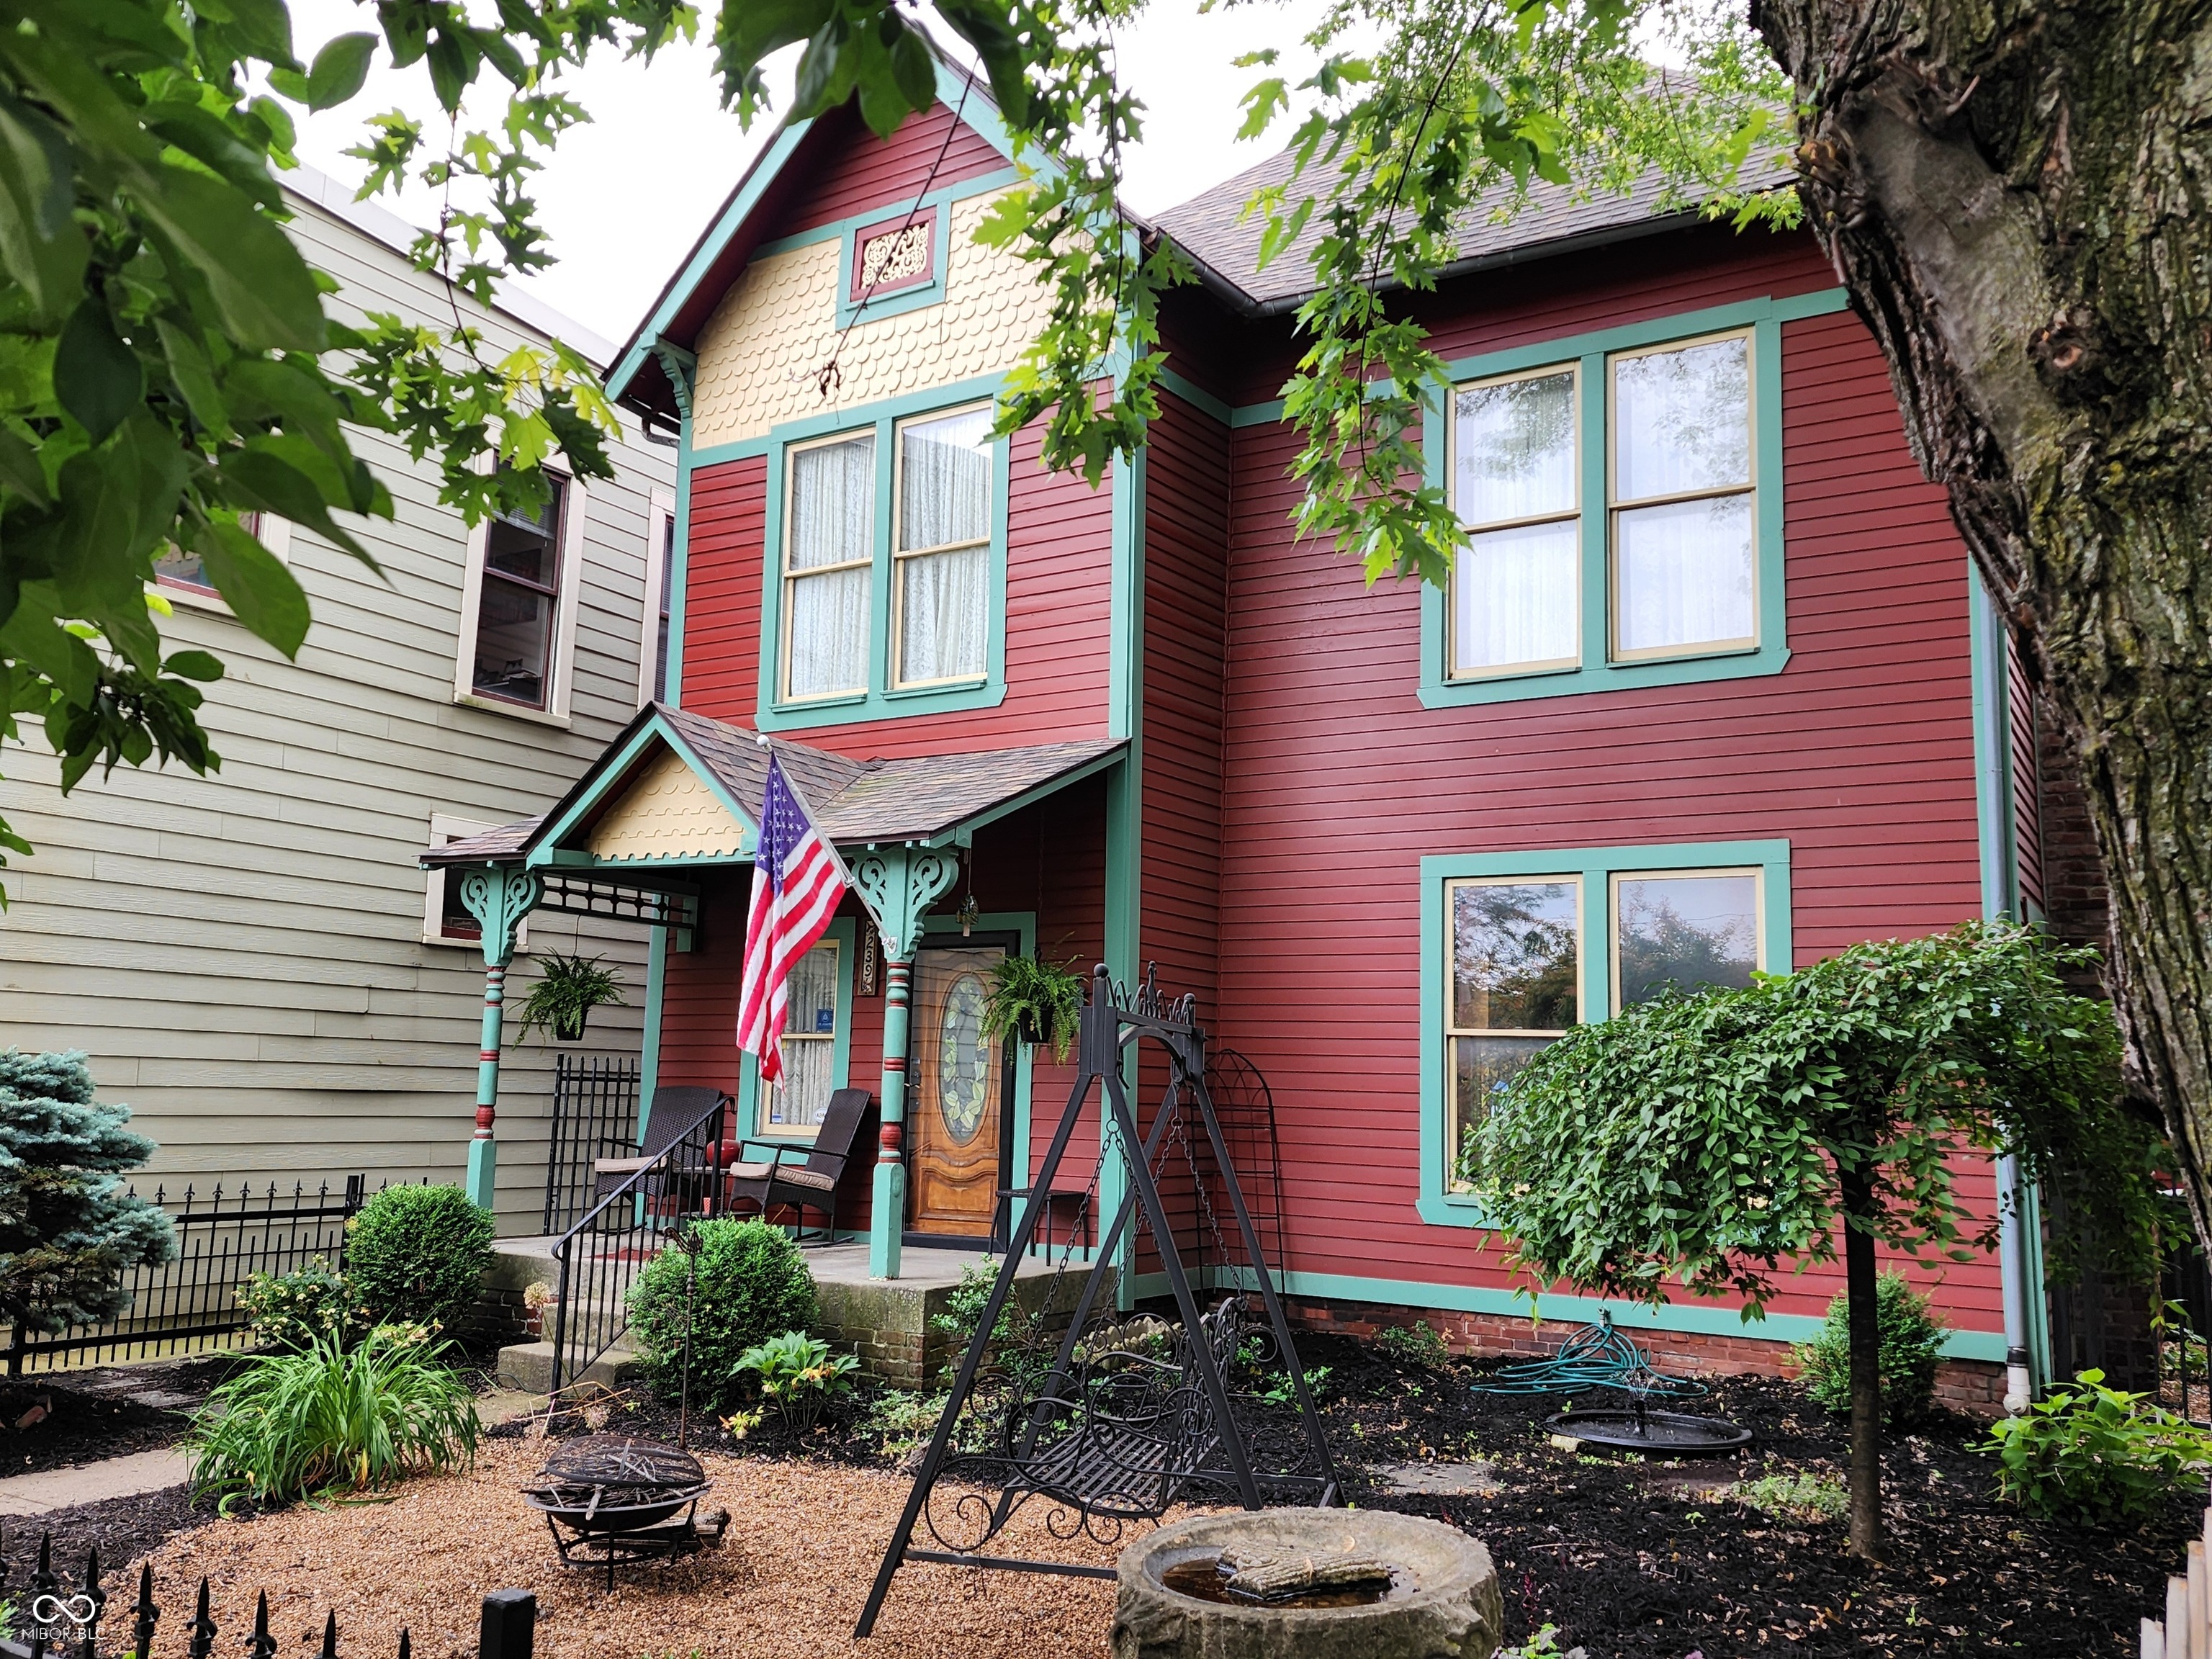
Active
$285,000
3
bds
|
3
ba
|
2,052
sqft
|
built
1914
2936 N New Jersey St, Indianapolis, IN 46205
$265
Cash flow
4.9%
Cash-on-Cash Return
7.3%
Cap rate
0.9%
Rent to Value Ratio
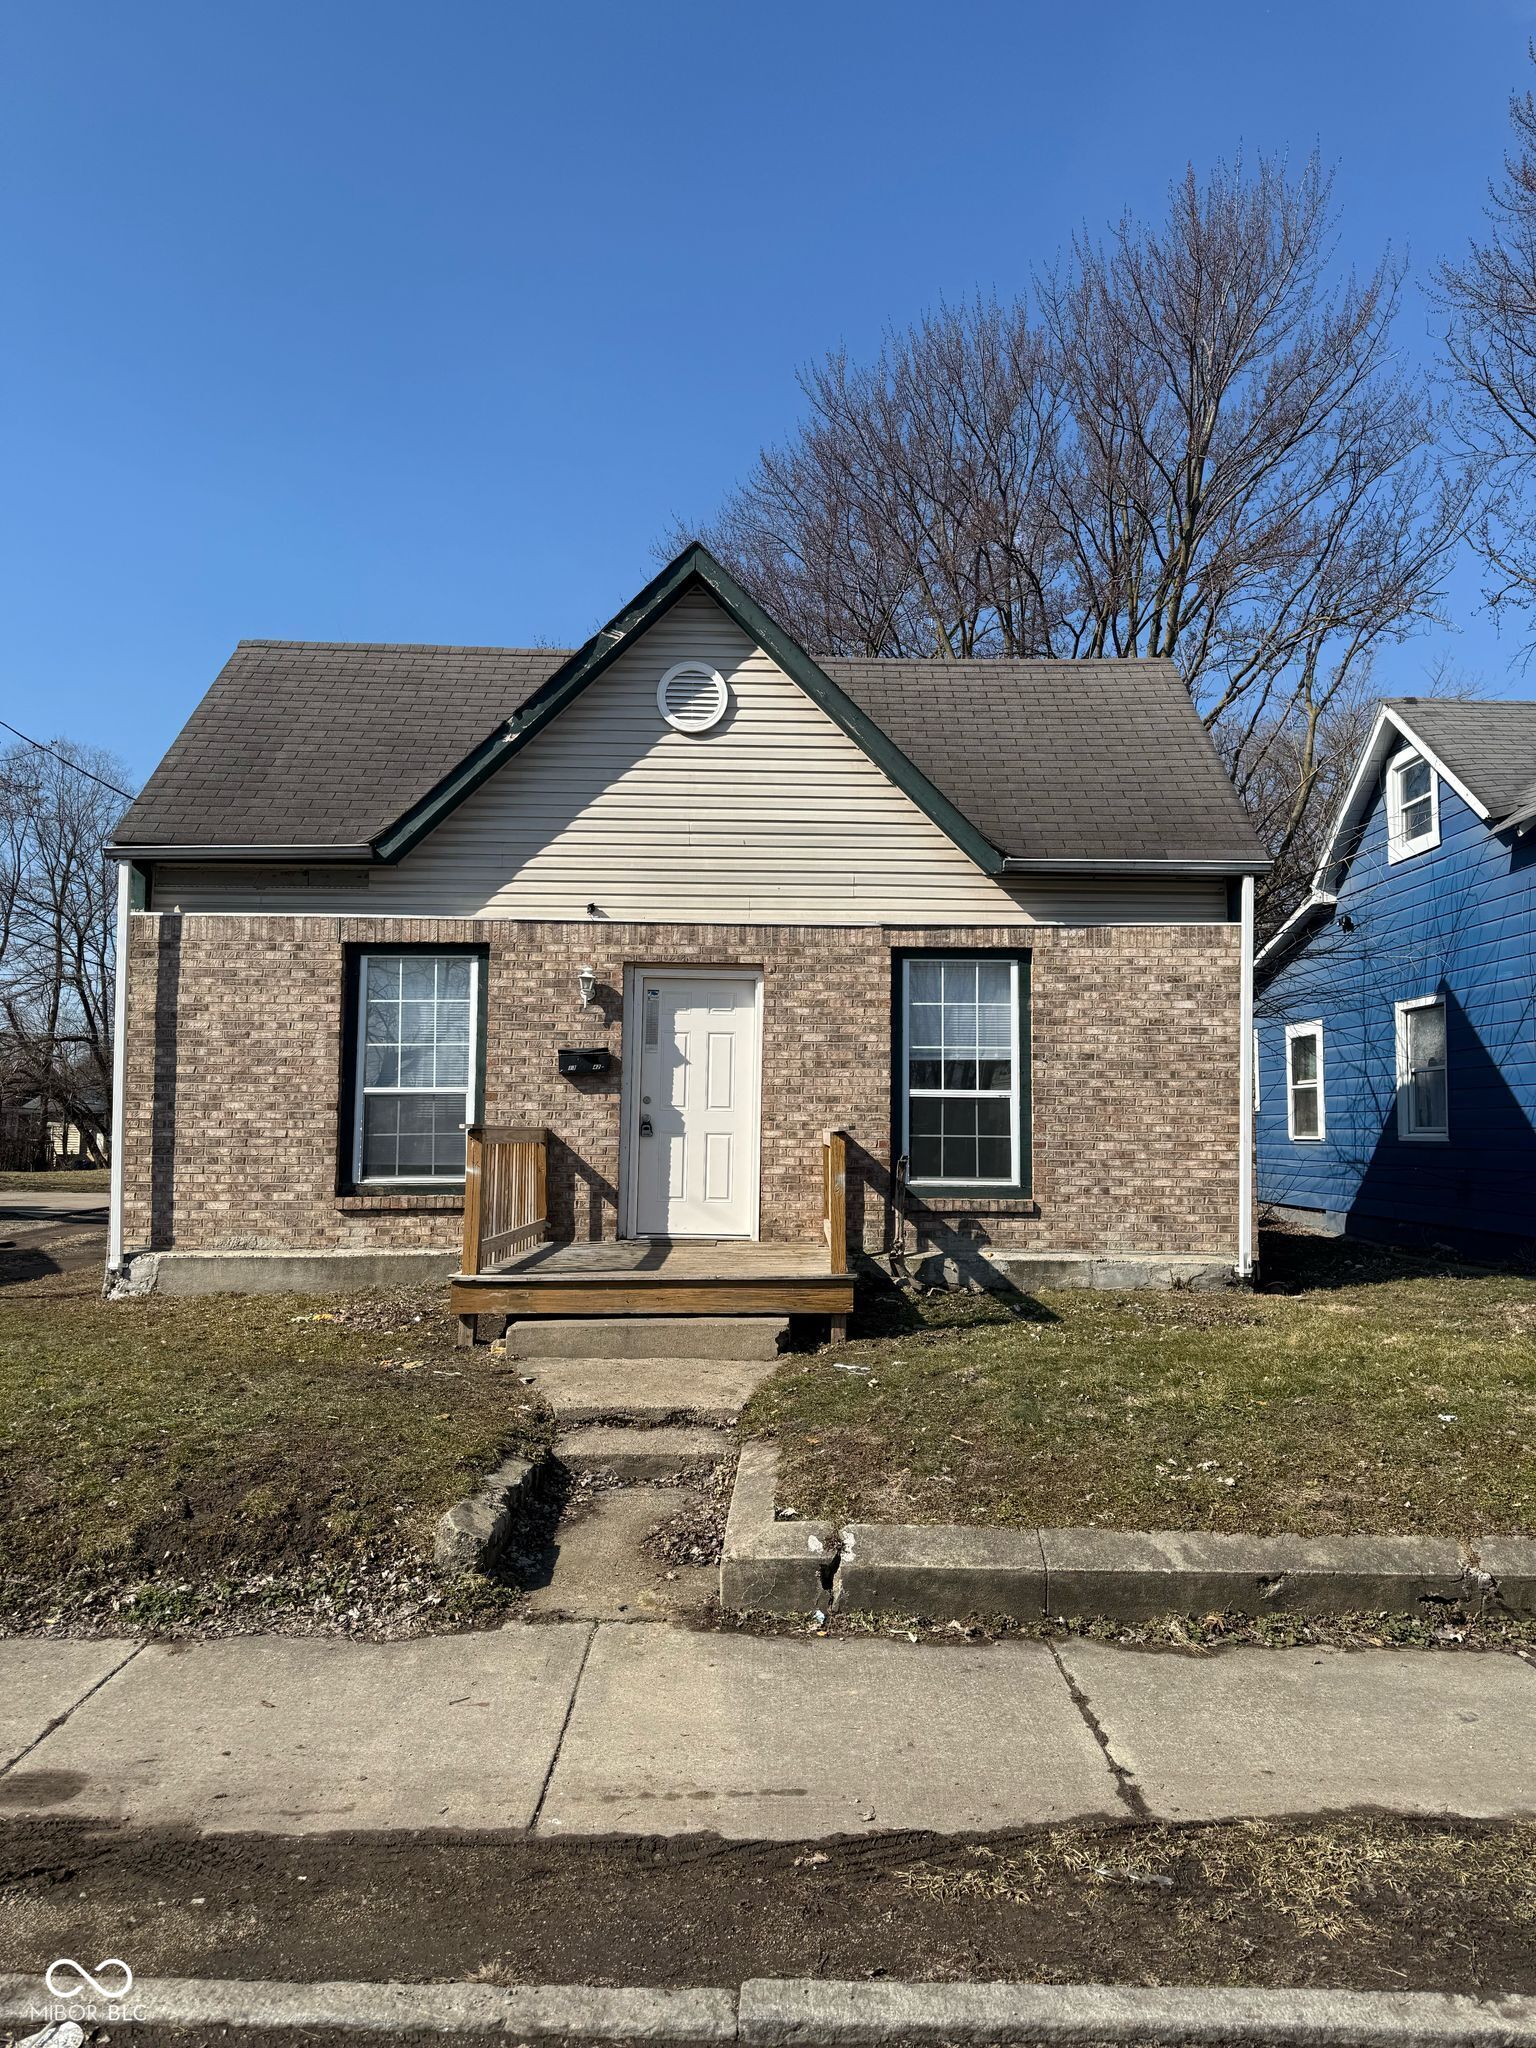
Active
$119,000
3
bds
|
2
ba
|
834
sqft
|
built
1955
1342 Lee St, Indianapolis, IN 46221
$356
Cash flow
15.6%
Cash-on-Cash Return
9.7%
Cap rate
1.2%
Rent to Value Ratio
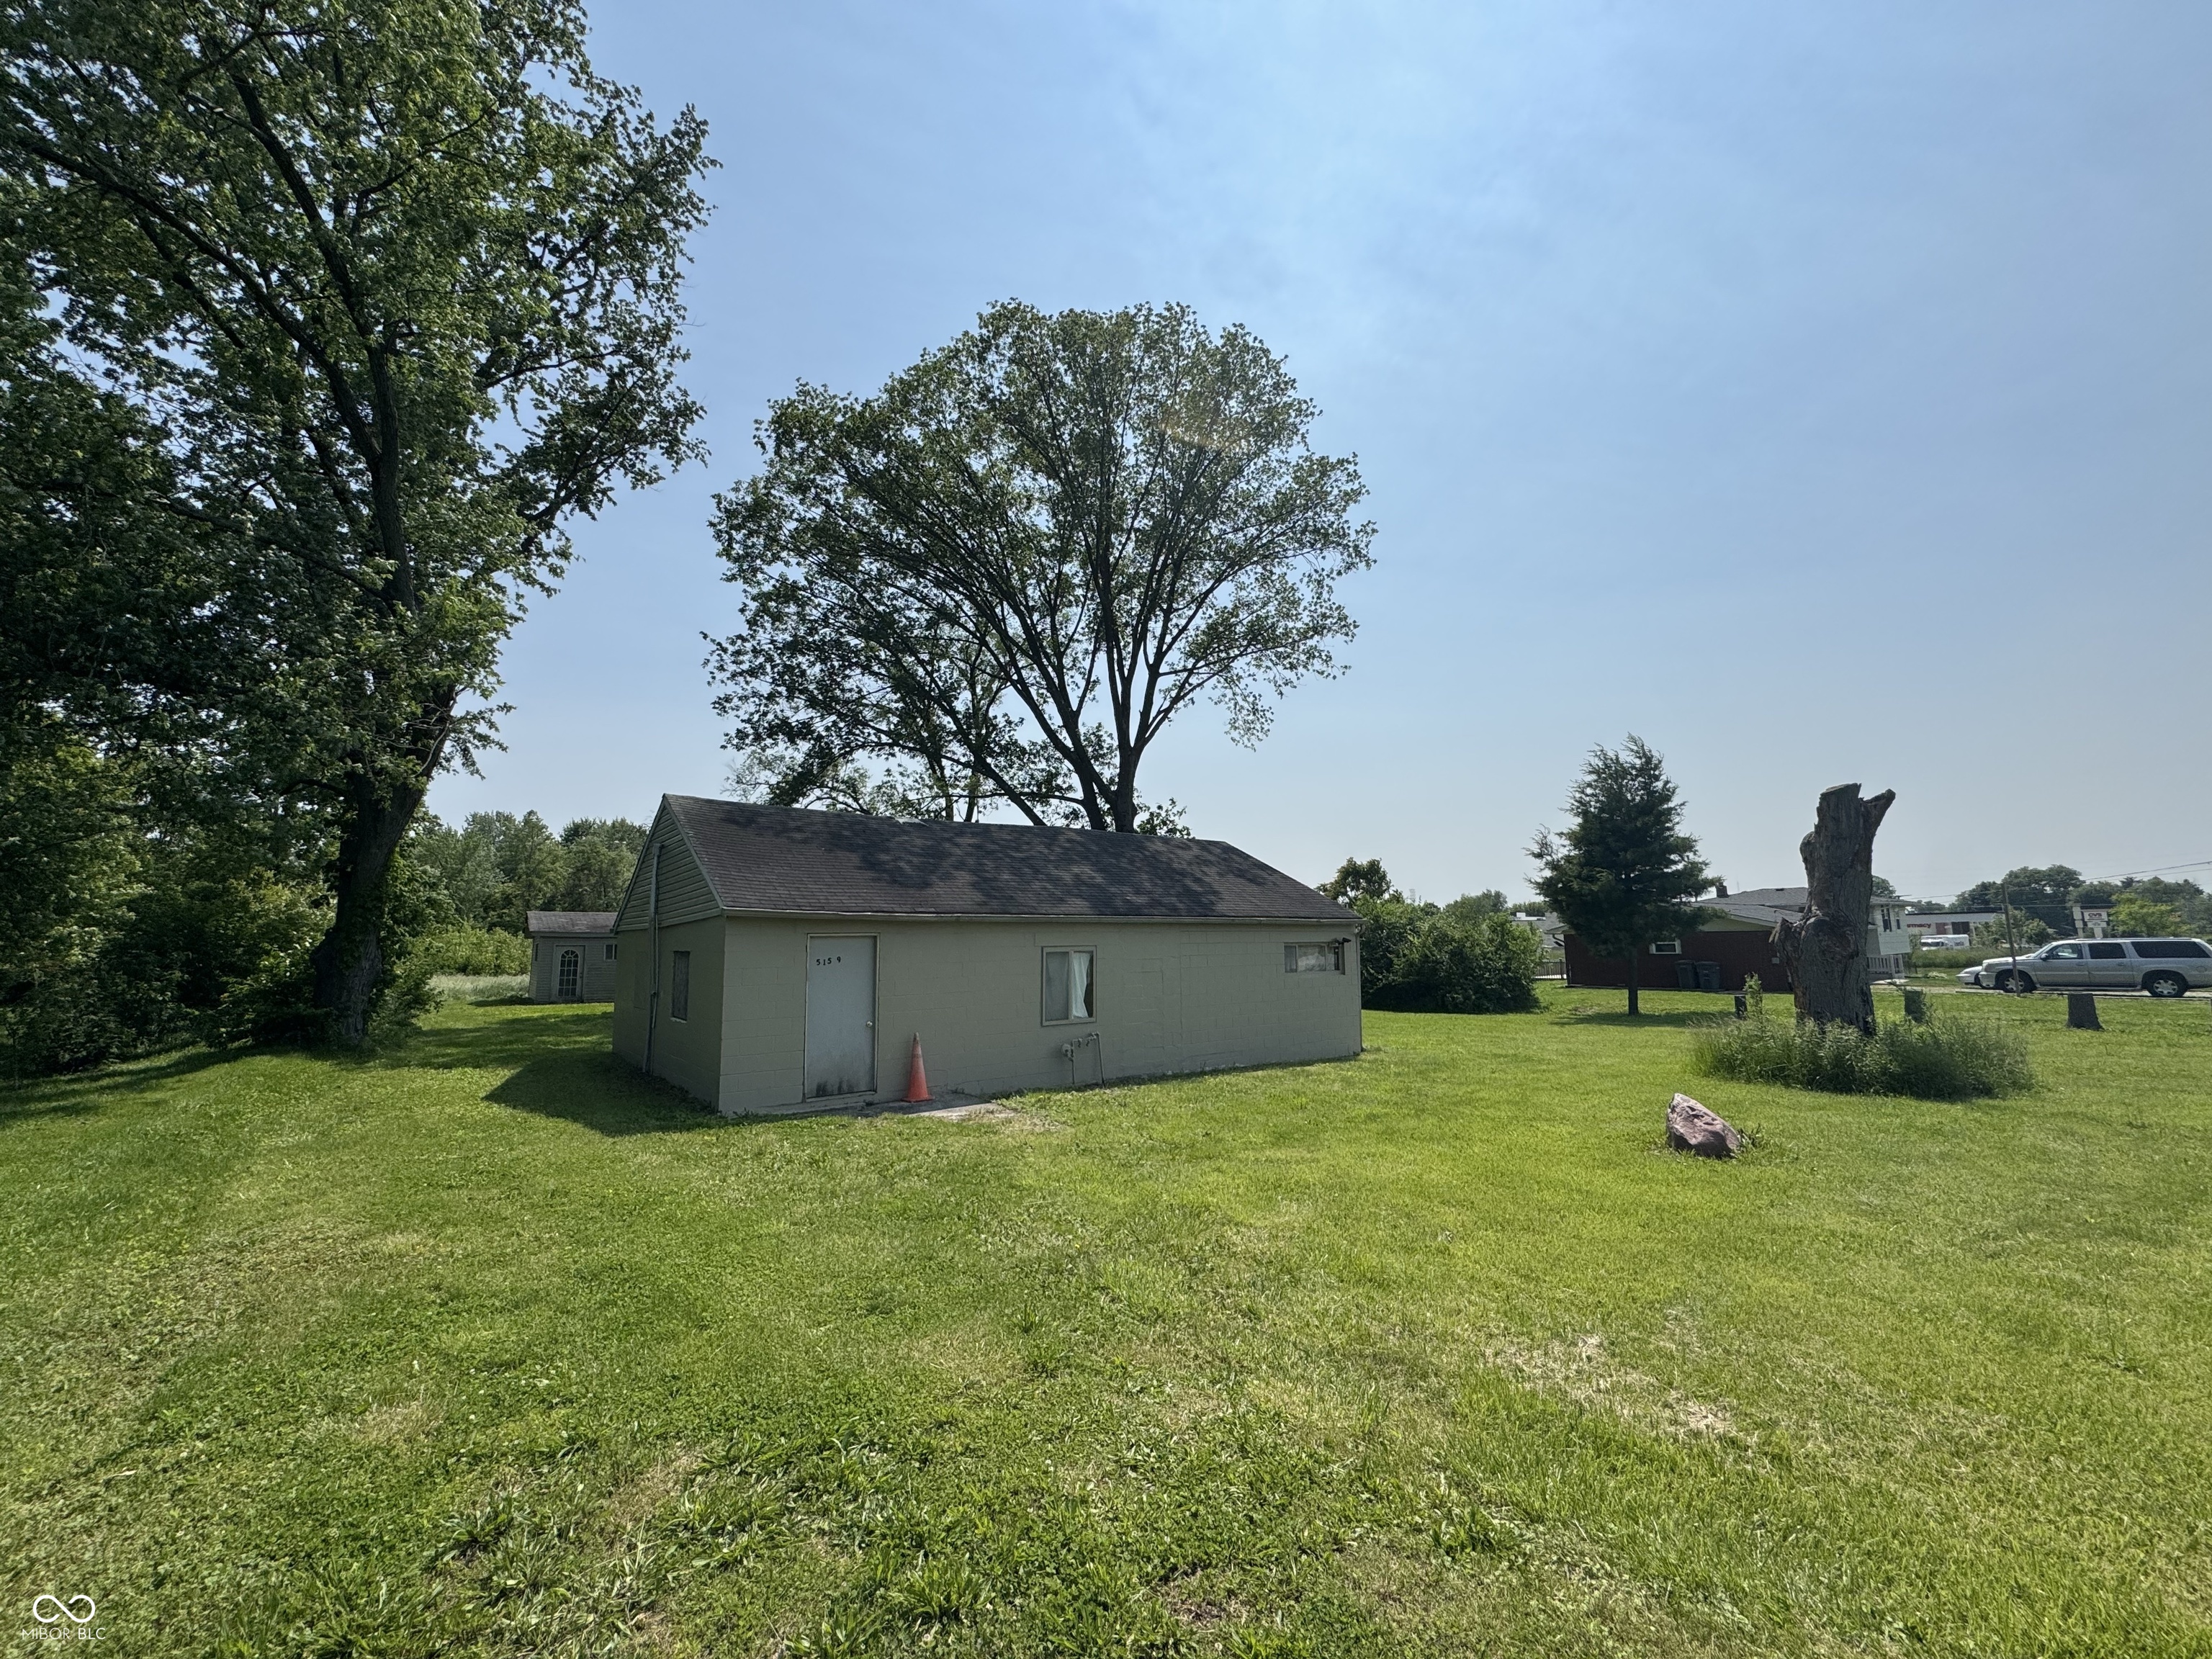
Active
$260,000
2
bds
|
0
ba
|
960
sqft
|
built
1950
5159 E Edgewood Ave, Indianapolis, IN 46237
$-228
Cash flow
-4.6%
Cash-on-Cash Return
5.1%
Cap rate
0.6%
Rent to Value Ratio
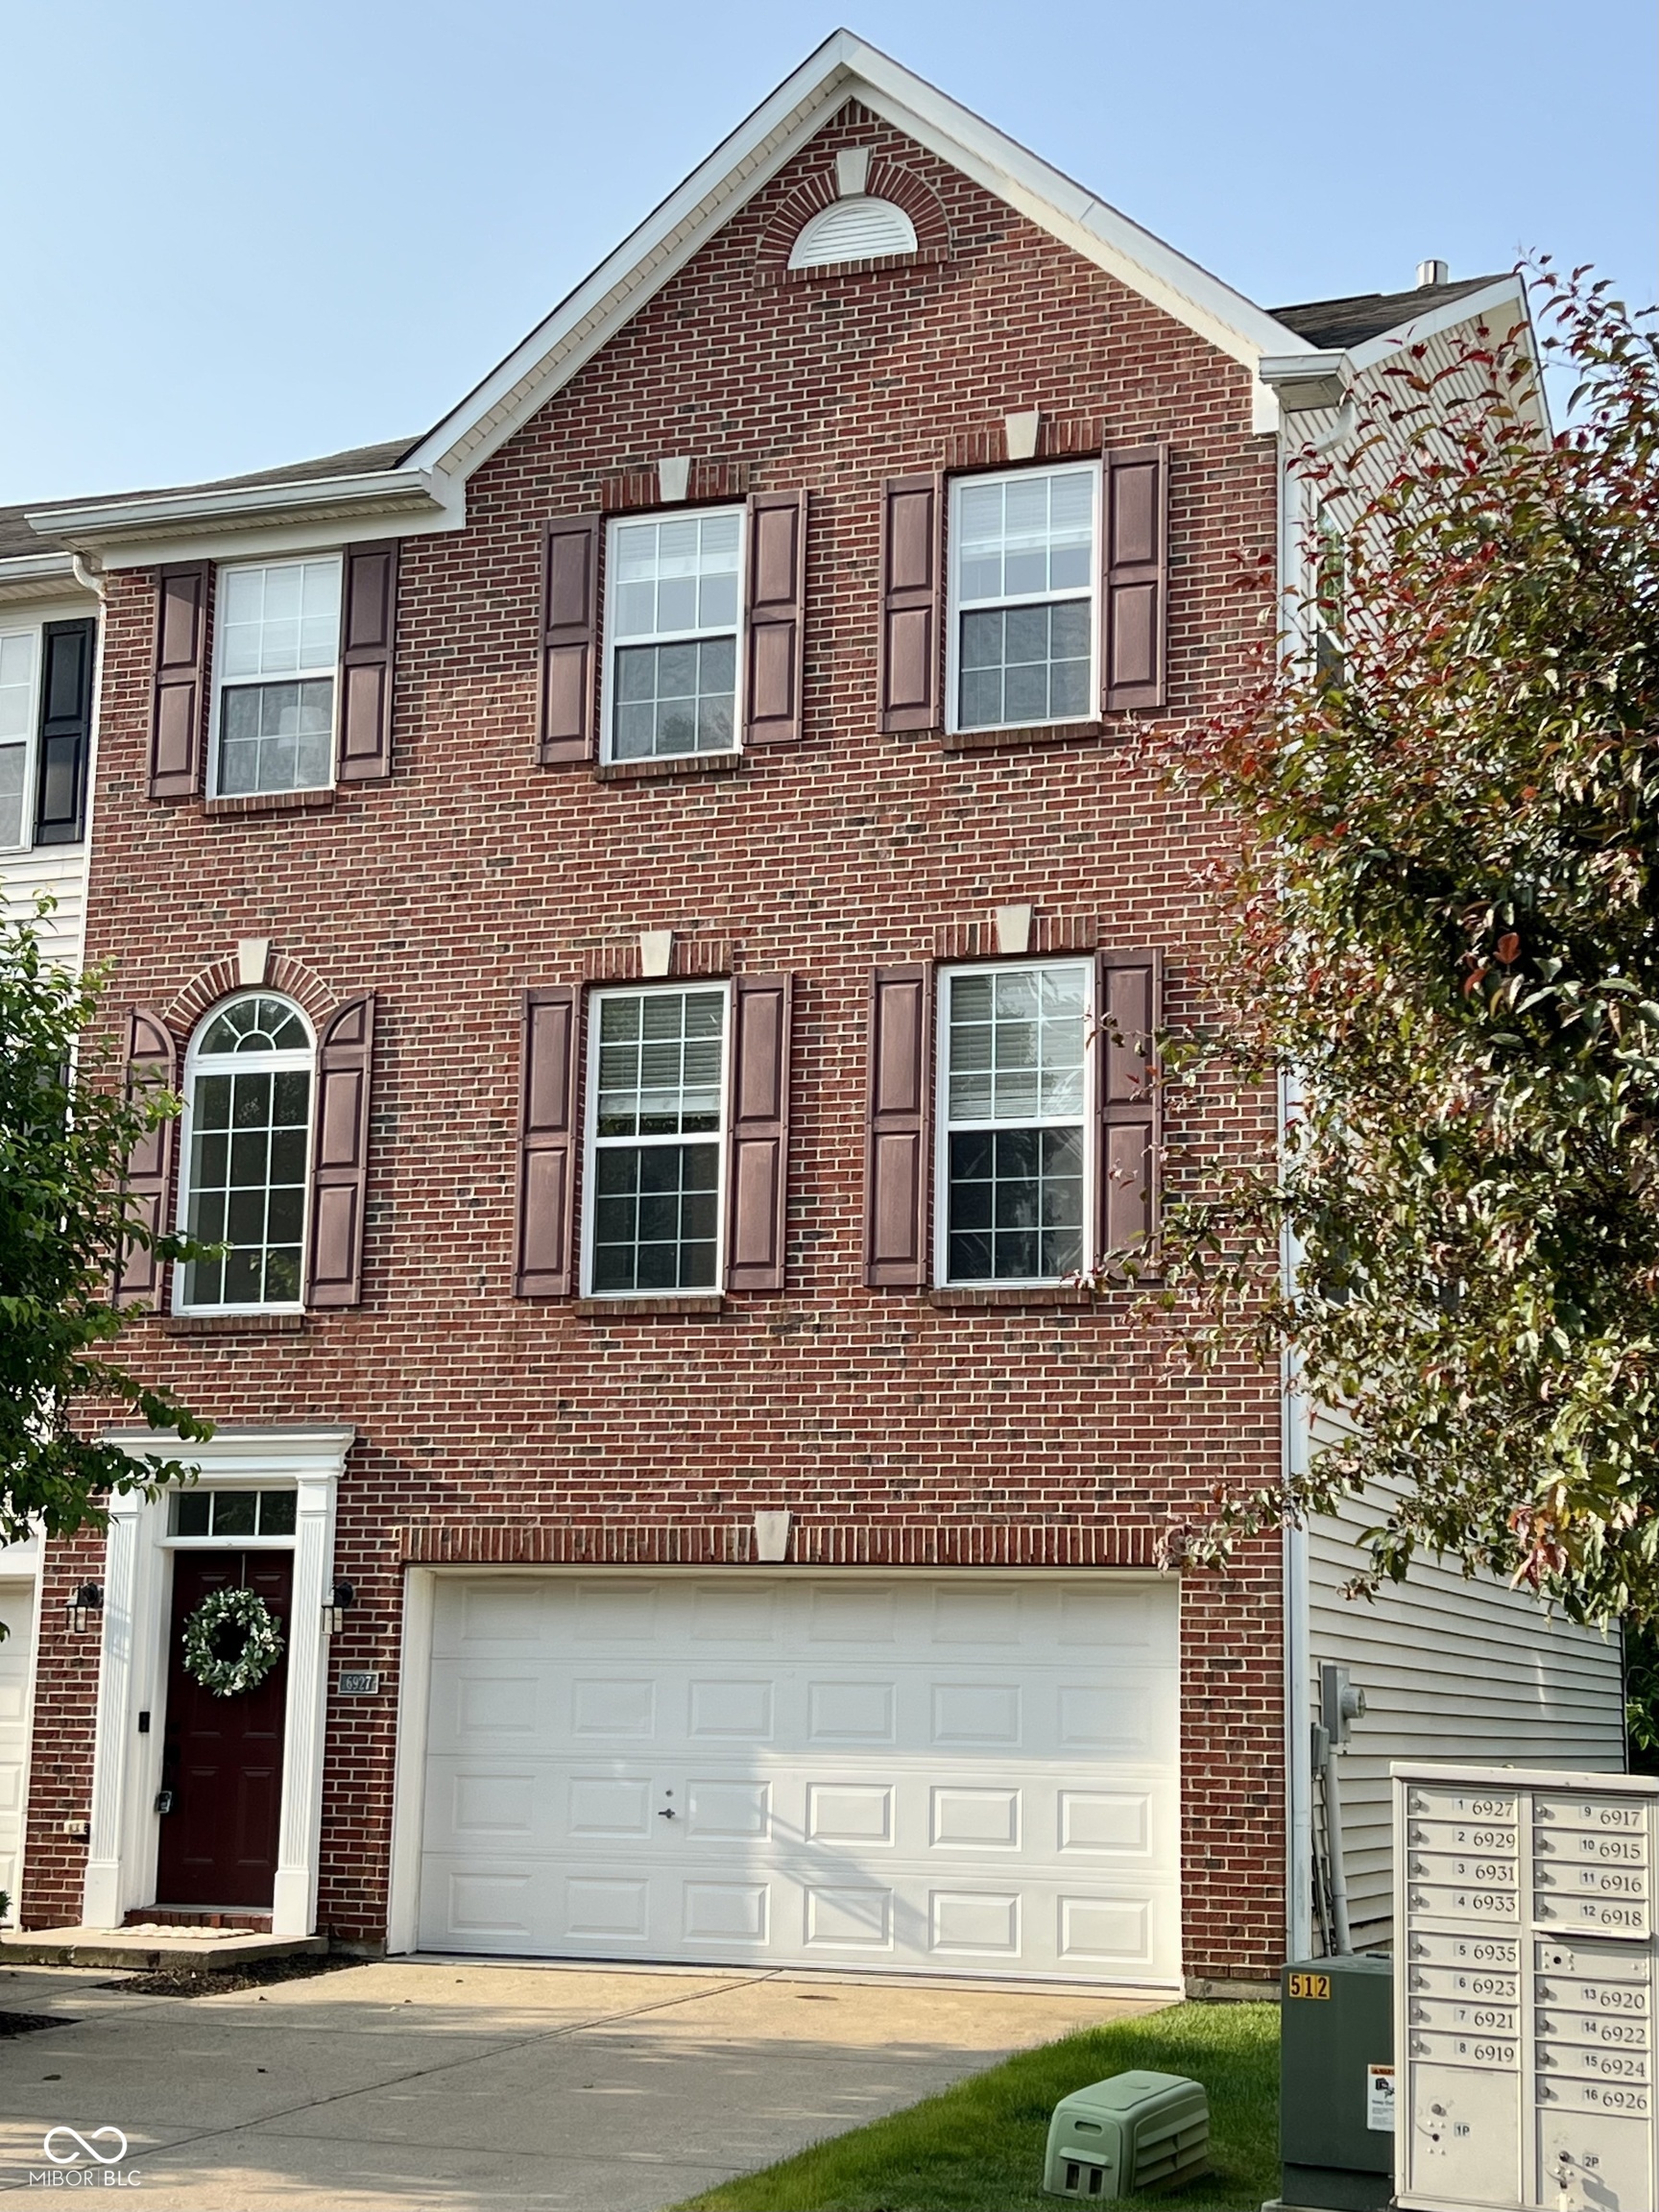
Active
$314,900
3
bds
|
4
ba
|
2,502
sqft
|
built
2005
6927 Havenmoor Pl, Indianapolis, IN 46250
$-149
Cash flow
-2.5%
Cash-on-Cash Return
5.6%
Cap rate
0.7%
Rent to Value Ratio

Active
$205,000
2
bds
|
5
ba
|
1,740
sqft
|
built
1995
11621 Coastal Dr, Indianapolis, IN 46229
$34
Cash flow
0.9%
Cash-on-Cash Return
6.3%
Cap rate
0.9%
Rent to Value Ratio
Active
$399,900
2
bds
|
3
ba
|
1,702
sqft
|
built
1924
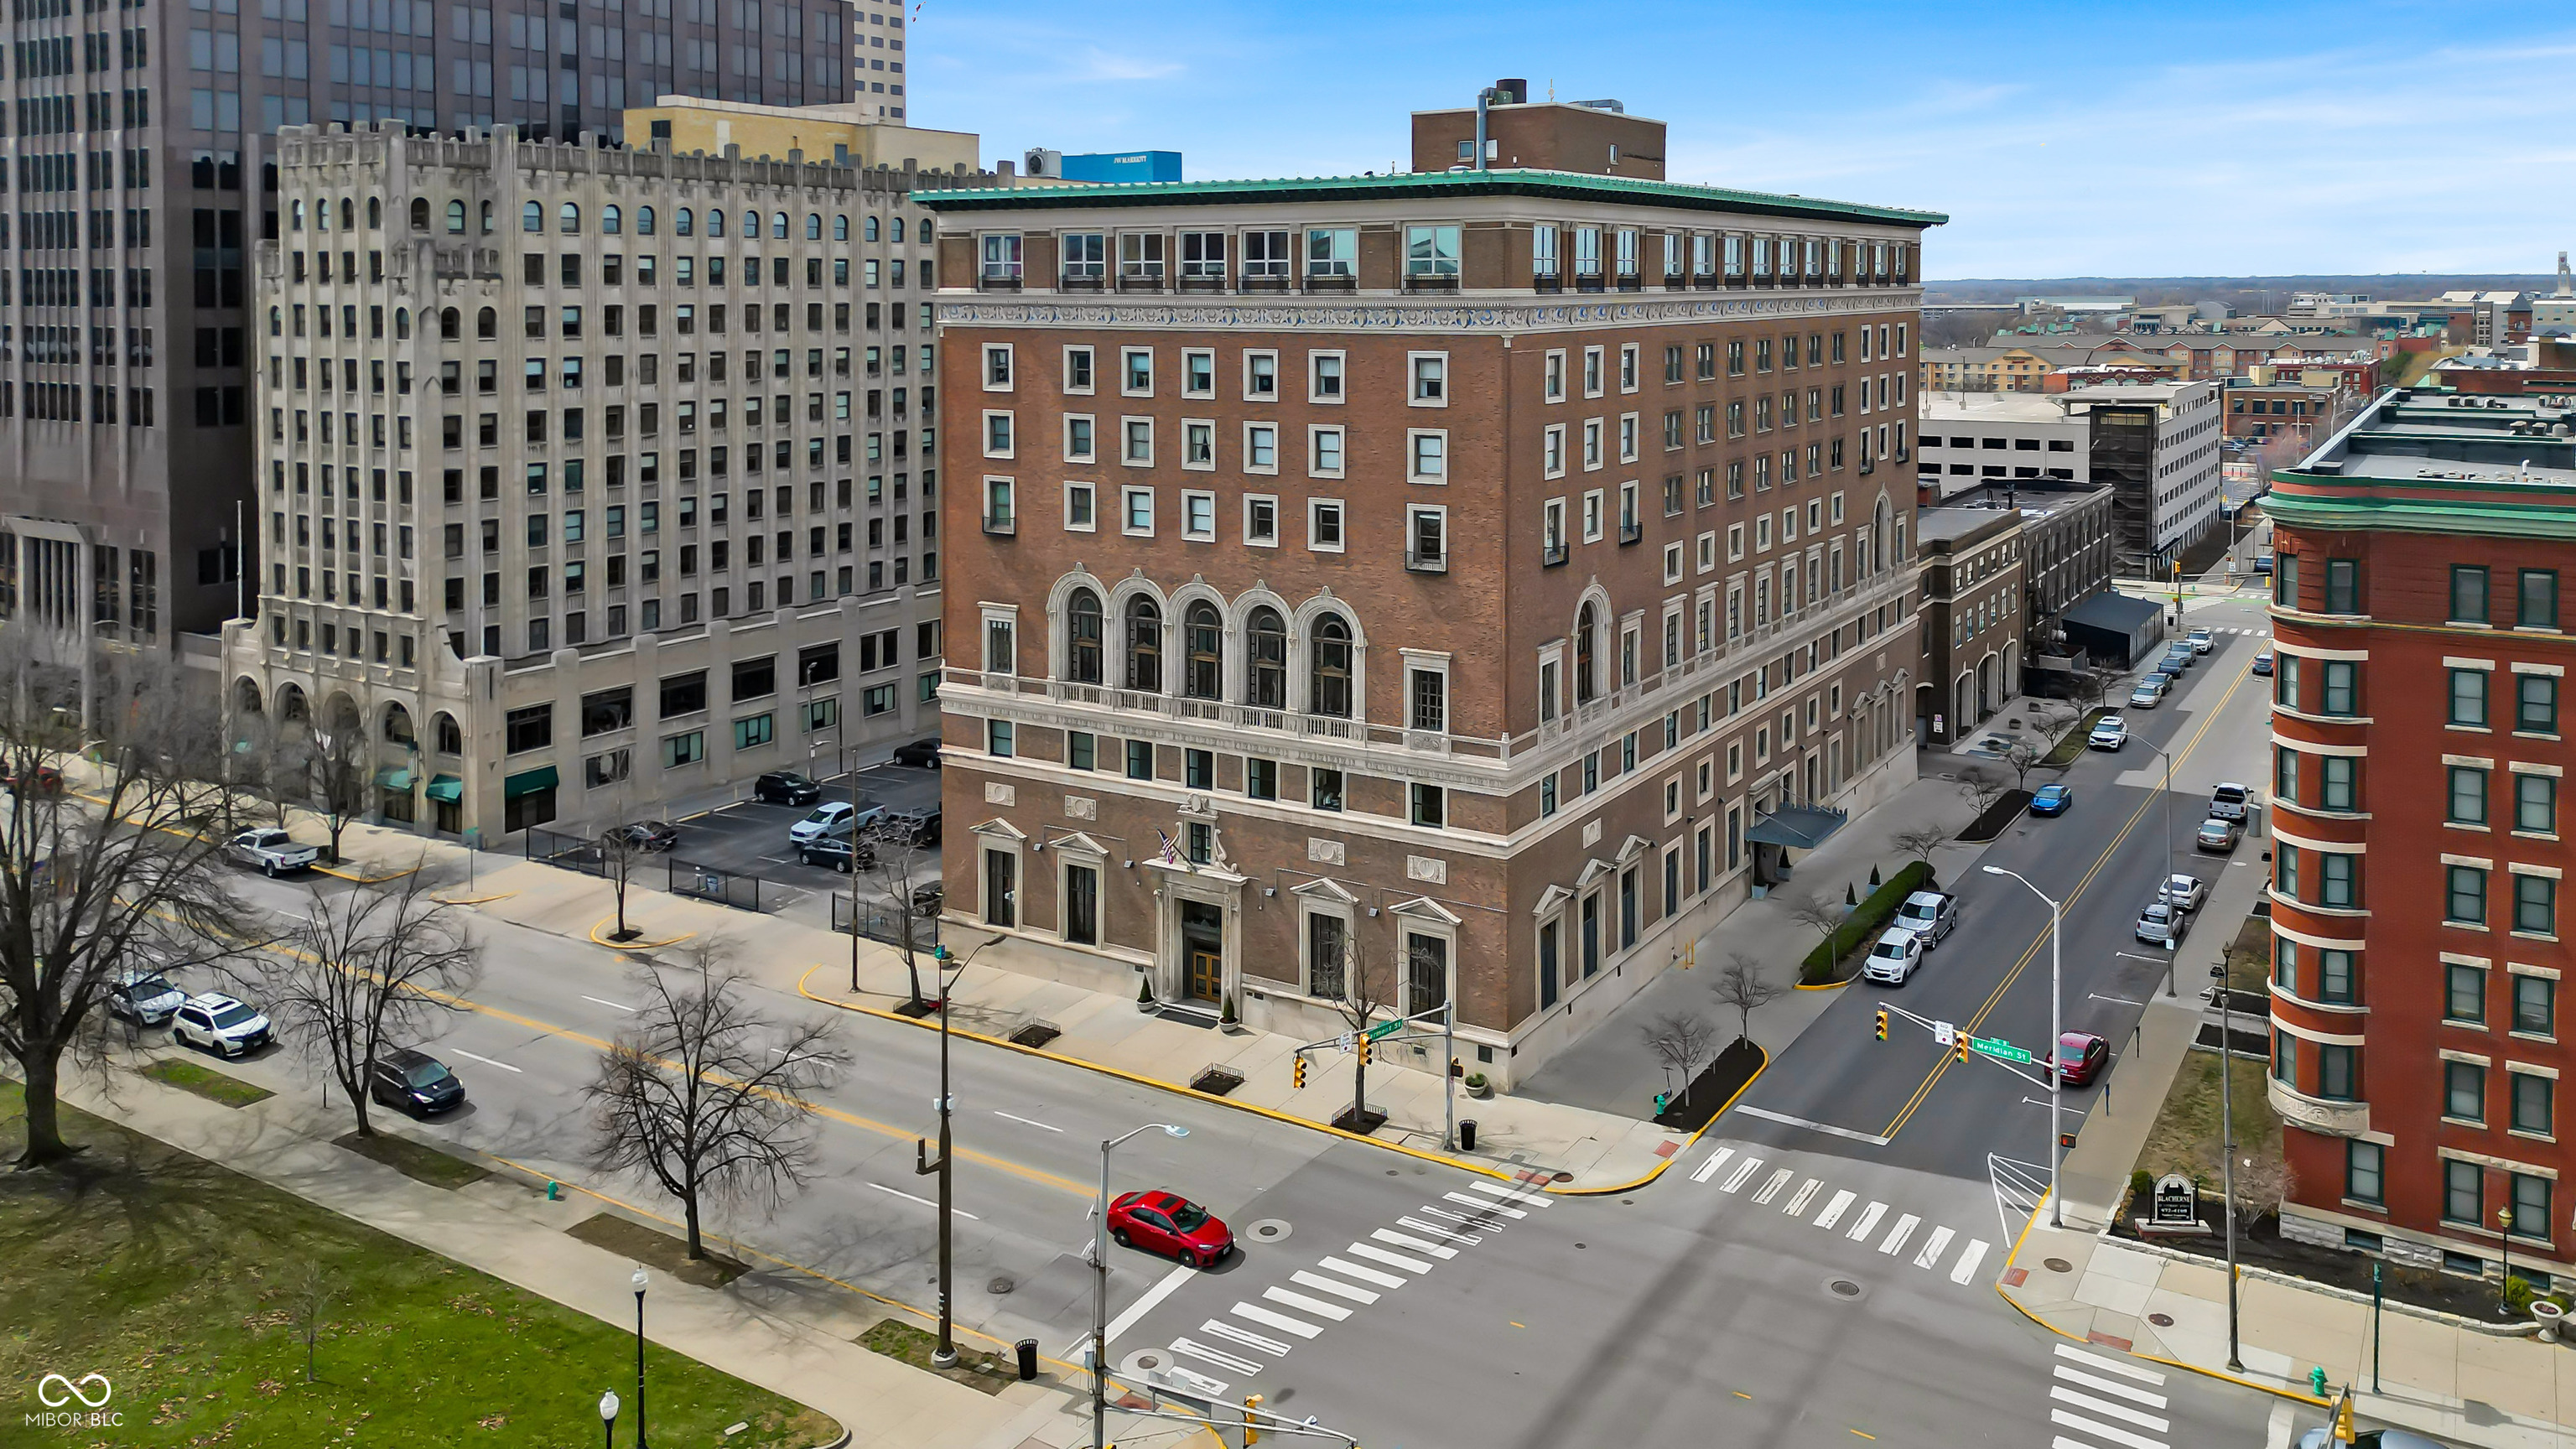
350 N Meridian St, Indianapolis, IN 46204
$-985
Cash flow
-12.9%
Cash-on-Cash Return
3.2%
Cap rate
0.7%
Rent to Value Ratio
Active
$299,900
3
bds
|
2
ba
|
1,420
sqft
|
built
1994
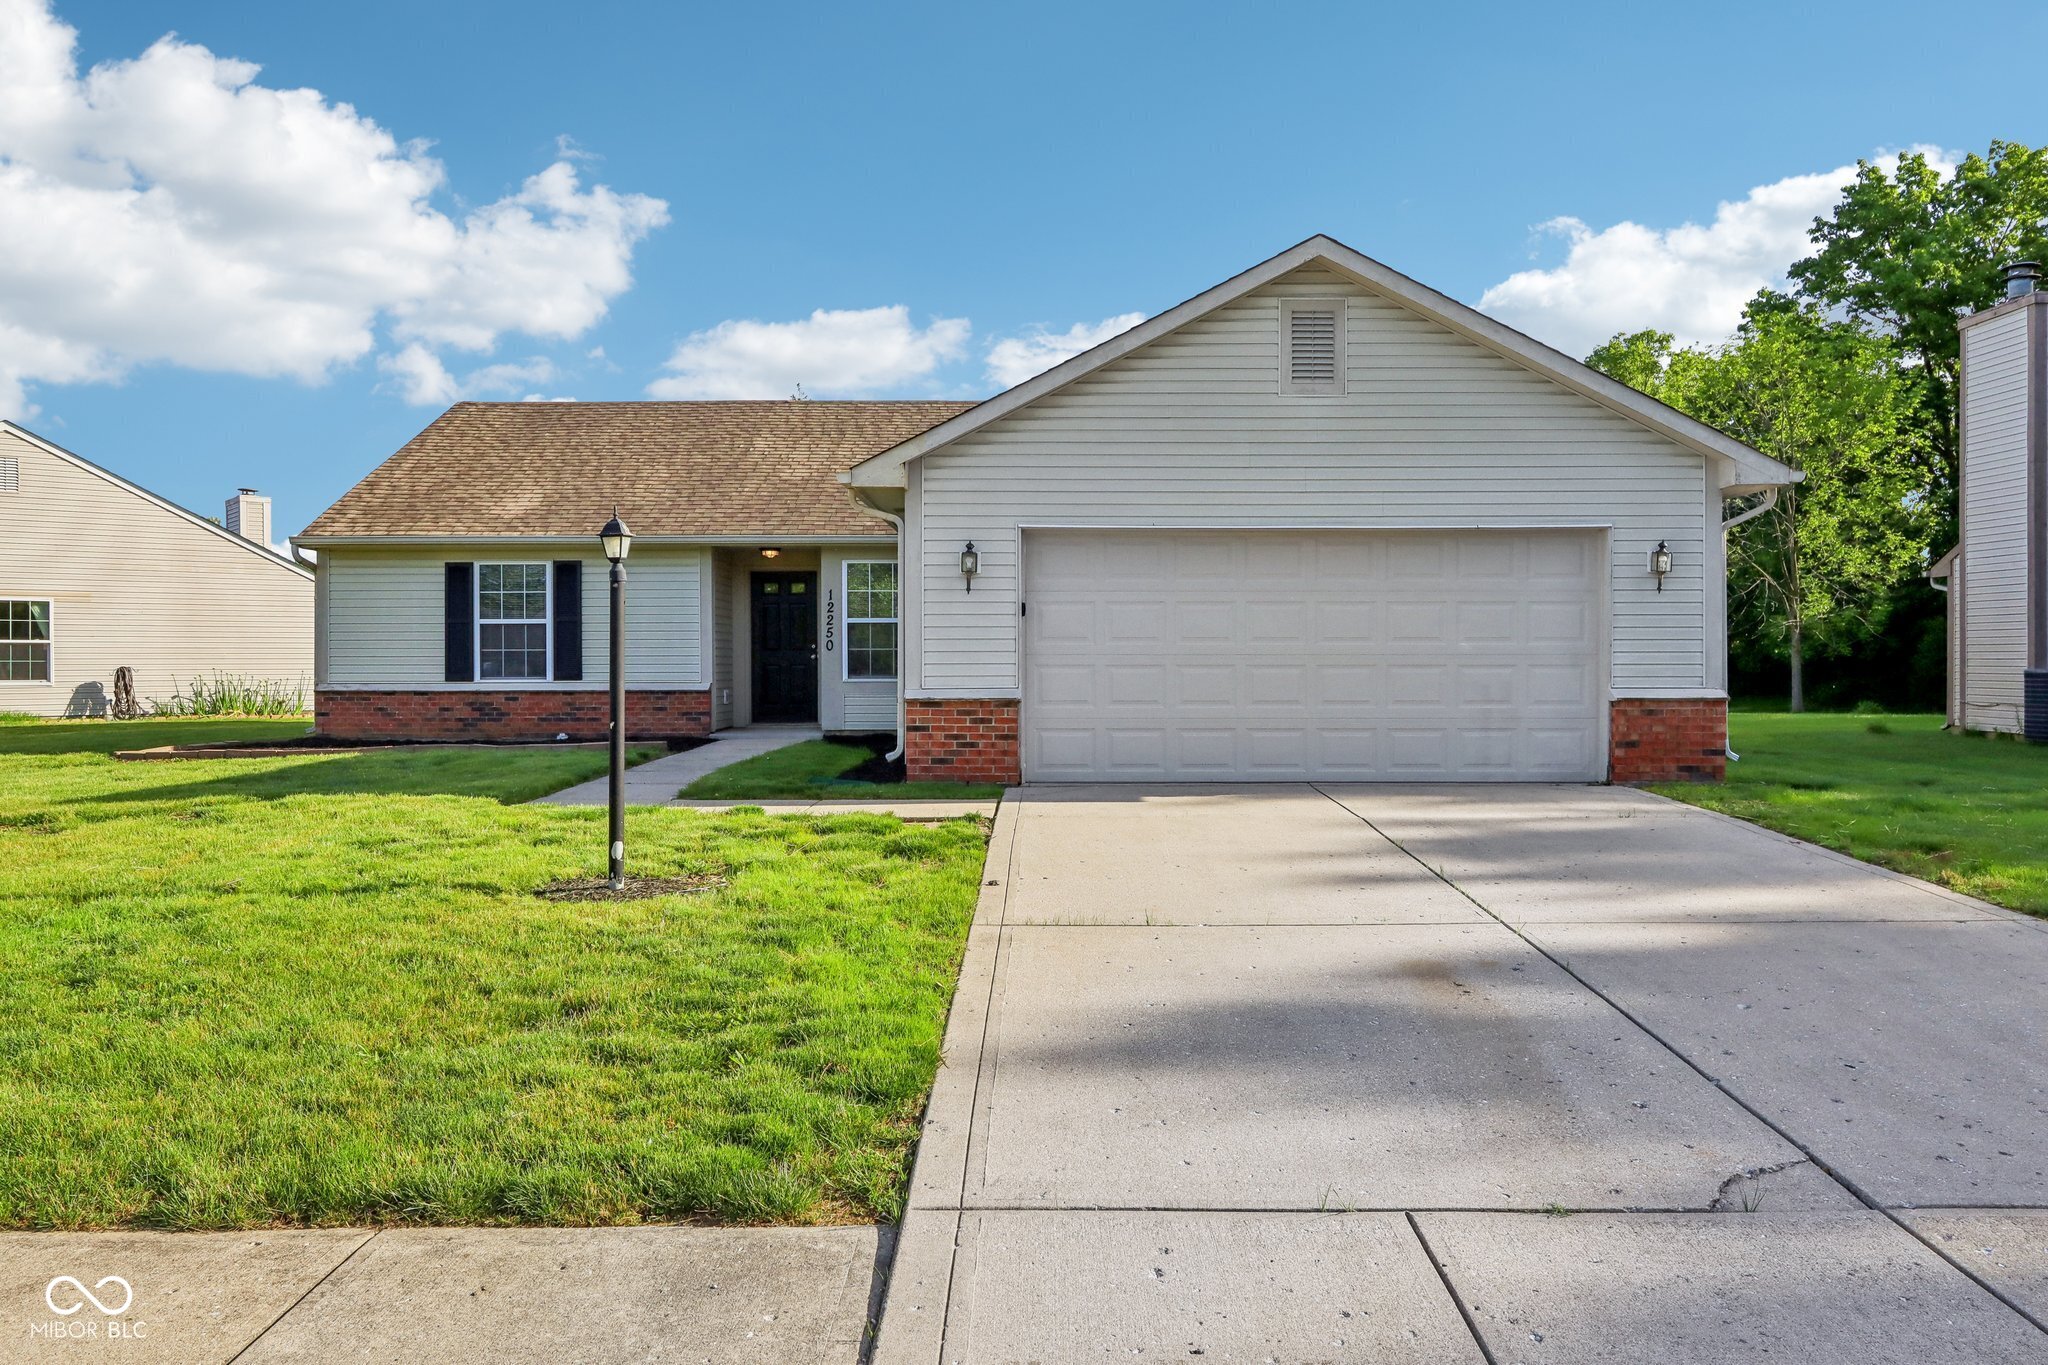
12250 Longstraw Dr, Indianapolis, IN 46236
$-167
Cash flow
-2.9%
Cash-on-Cash Return
5.5%
Cap rate
0.7%
Rent to Value Ratio
Active
$394,500
4
bds
|
2
ba
|
1,743
sqft
|
built
1960
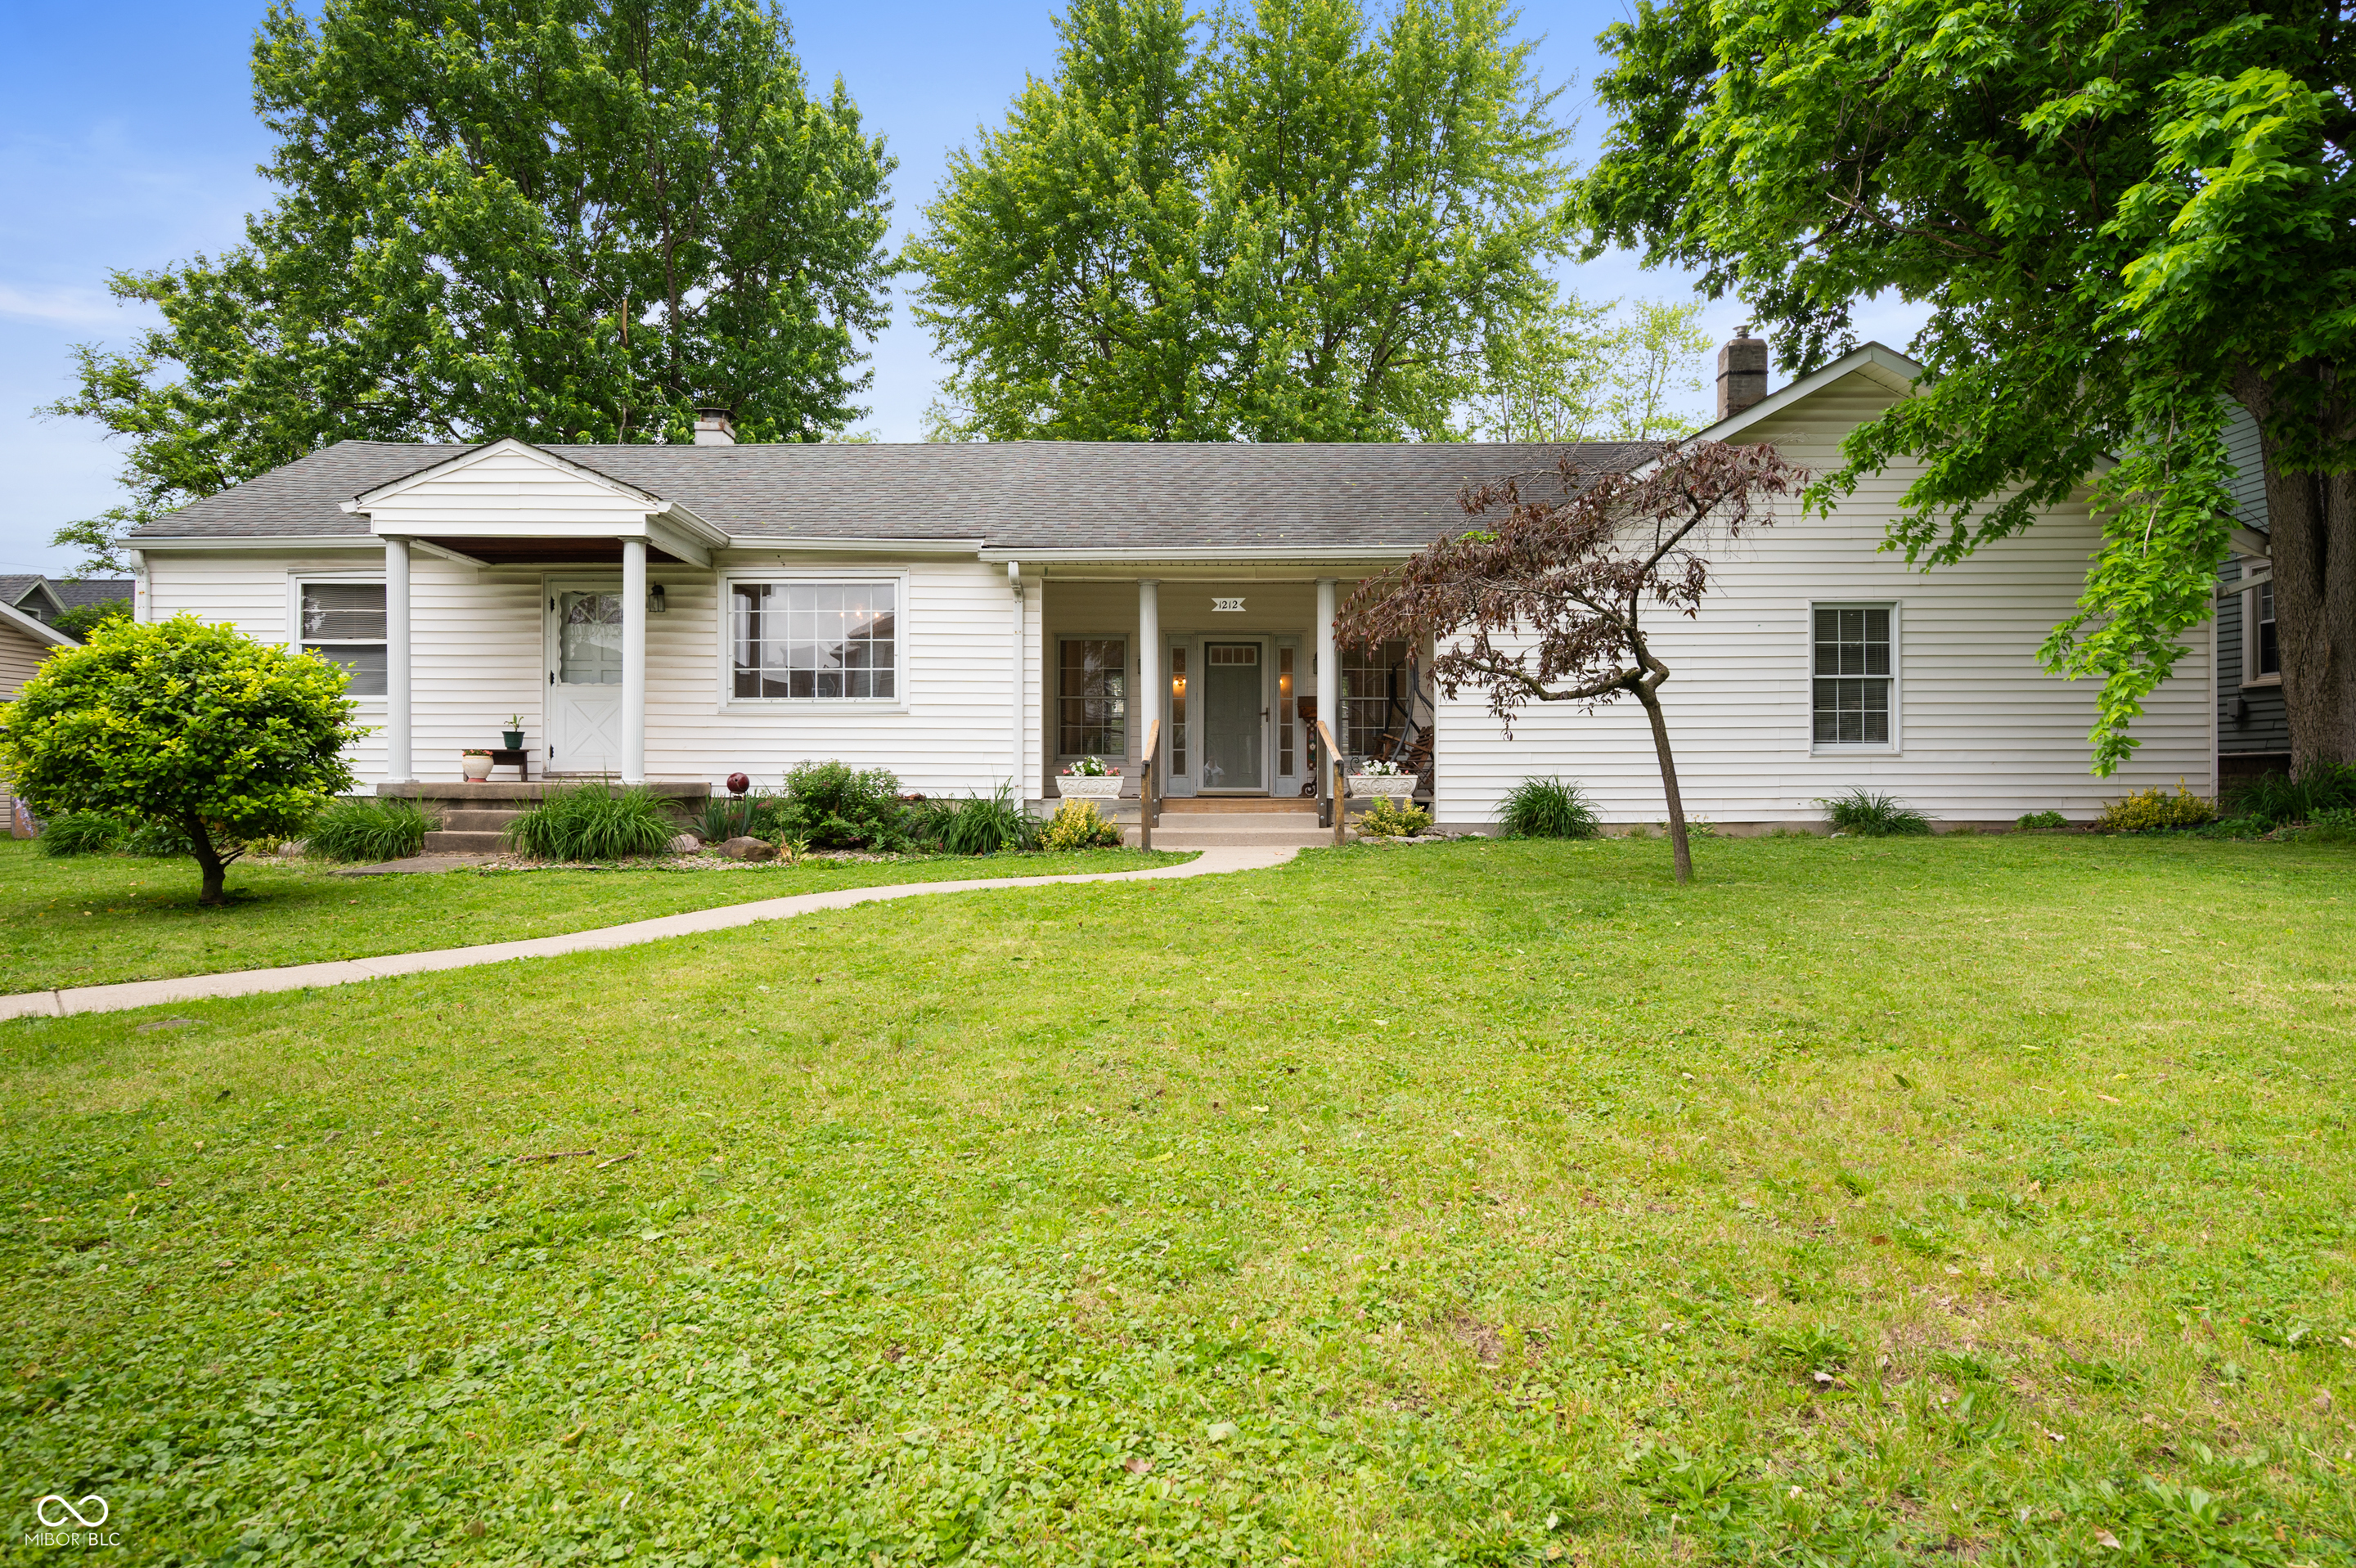
1212 Woodlawn Ave, Indianapolis, IN 46203
$-641
Cash flow
-8.5%
Cash-on-Cash Return
4.2%
Cap rate
0.5%
Rent to Value Ratio
Pending
$209,000
4
bds
|
1
ba
|
1,500
sqft
|
built
1959
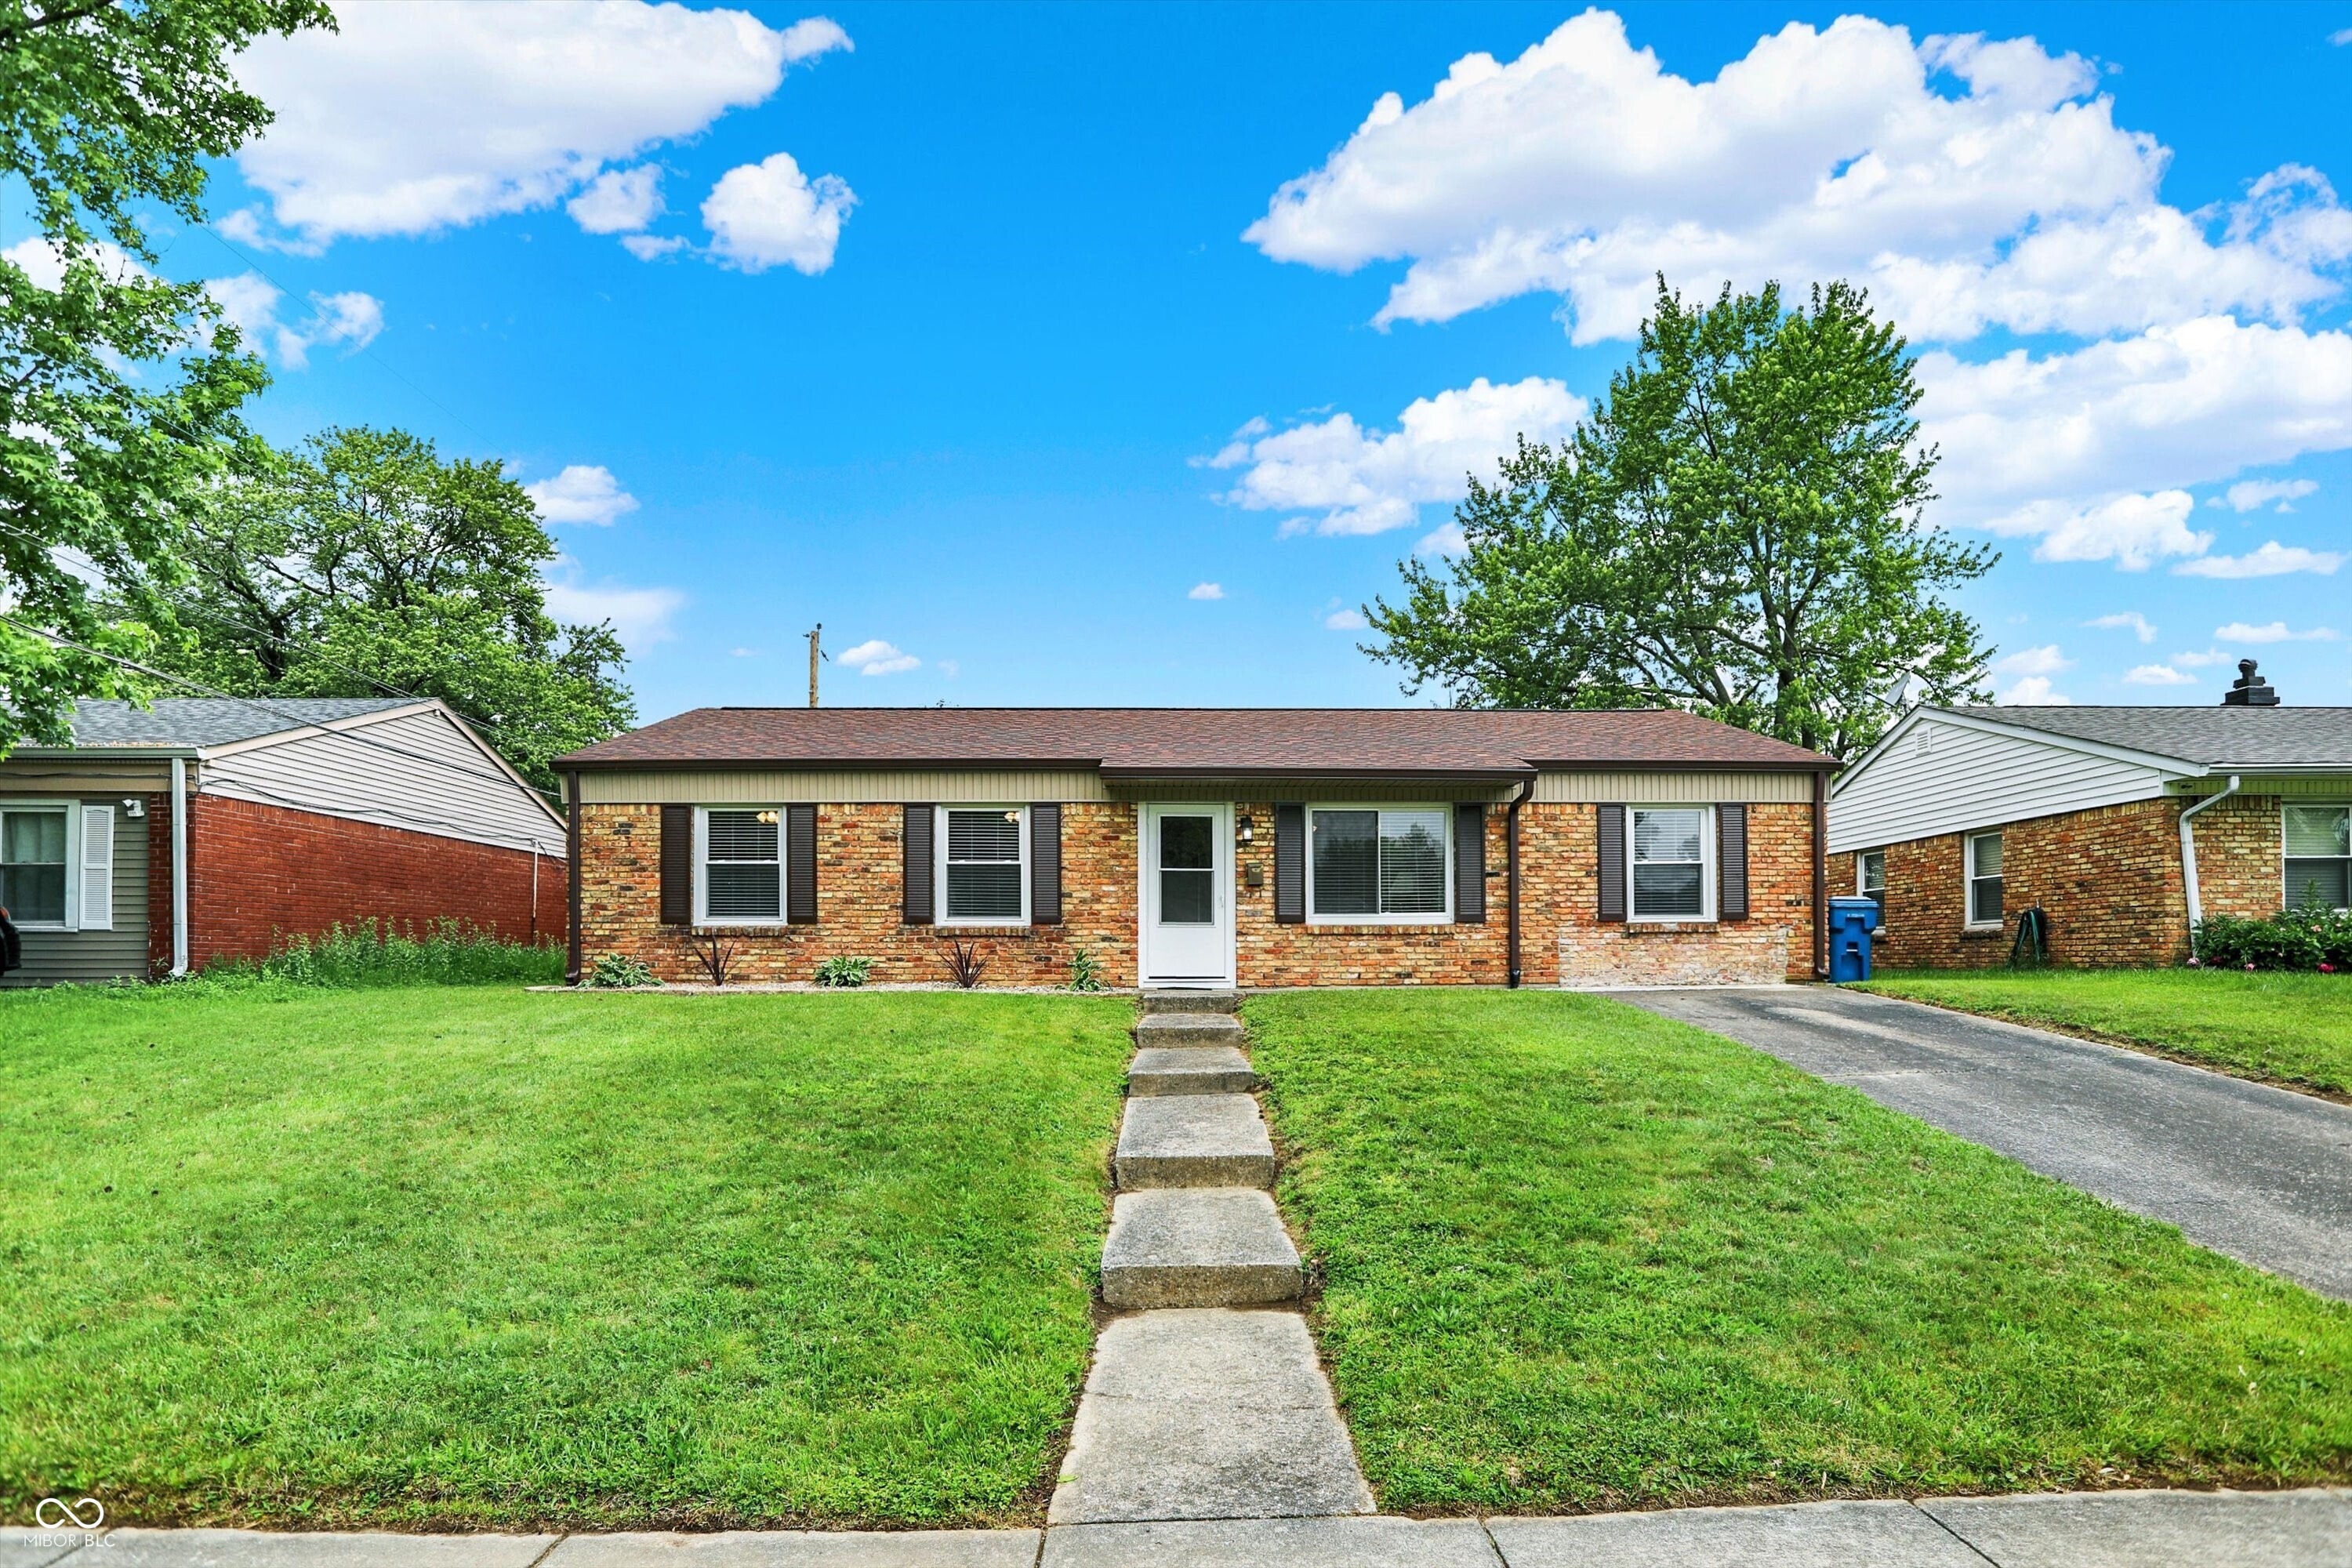
2538 Sickle Rd, Indianapolis, IN 46219
$33
Cash flow
0.8%
Cash-on-Cash Return
6.3%
Cap rate
0.8%
Rent to Value Ratio
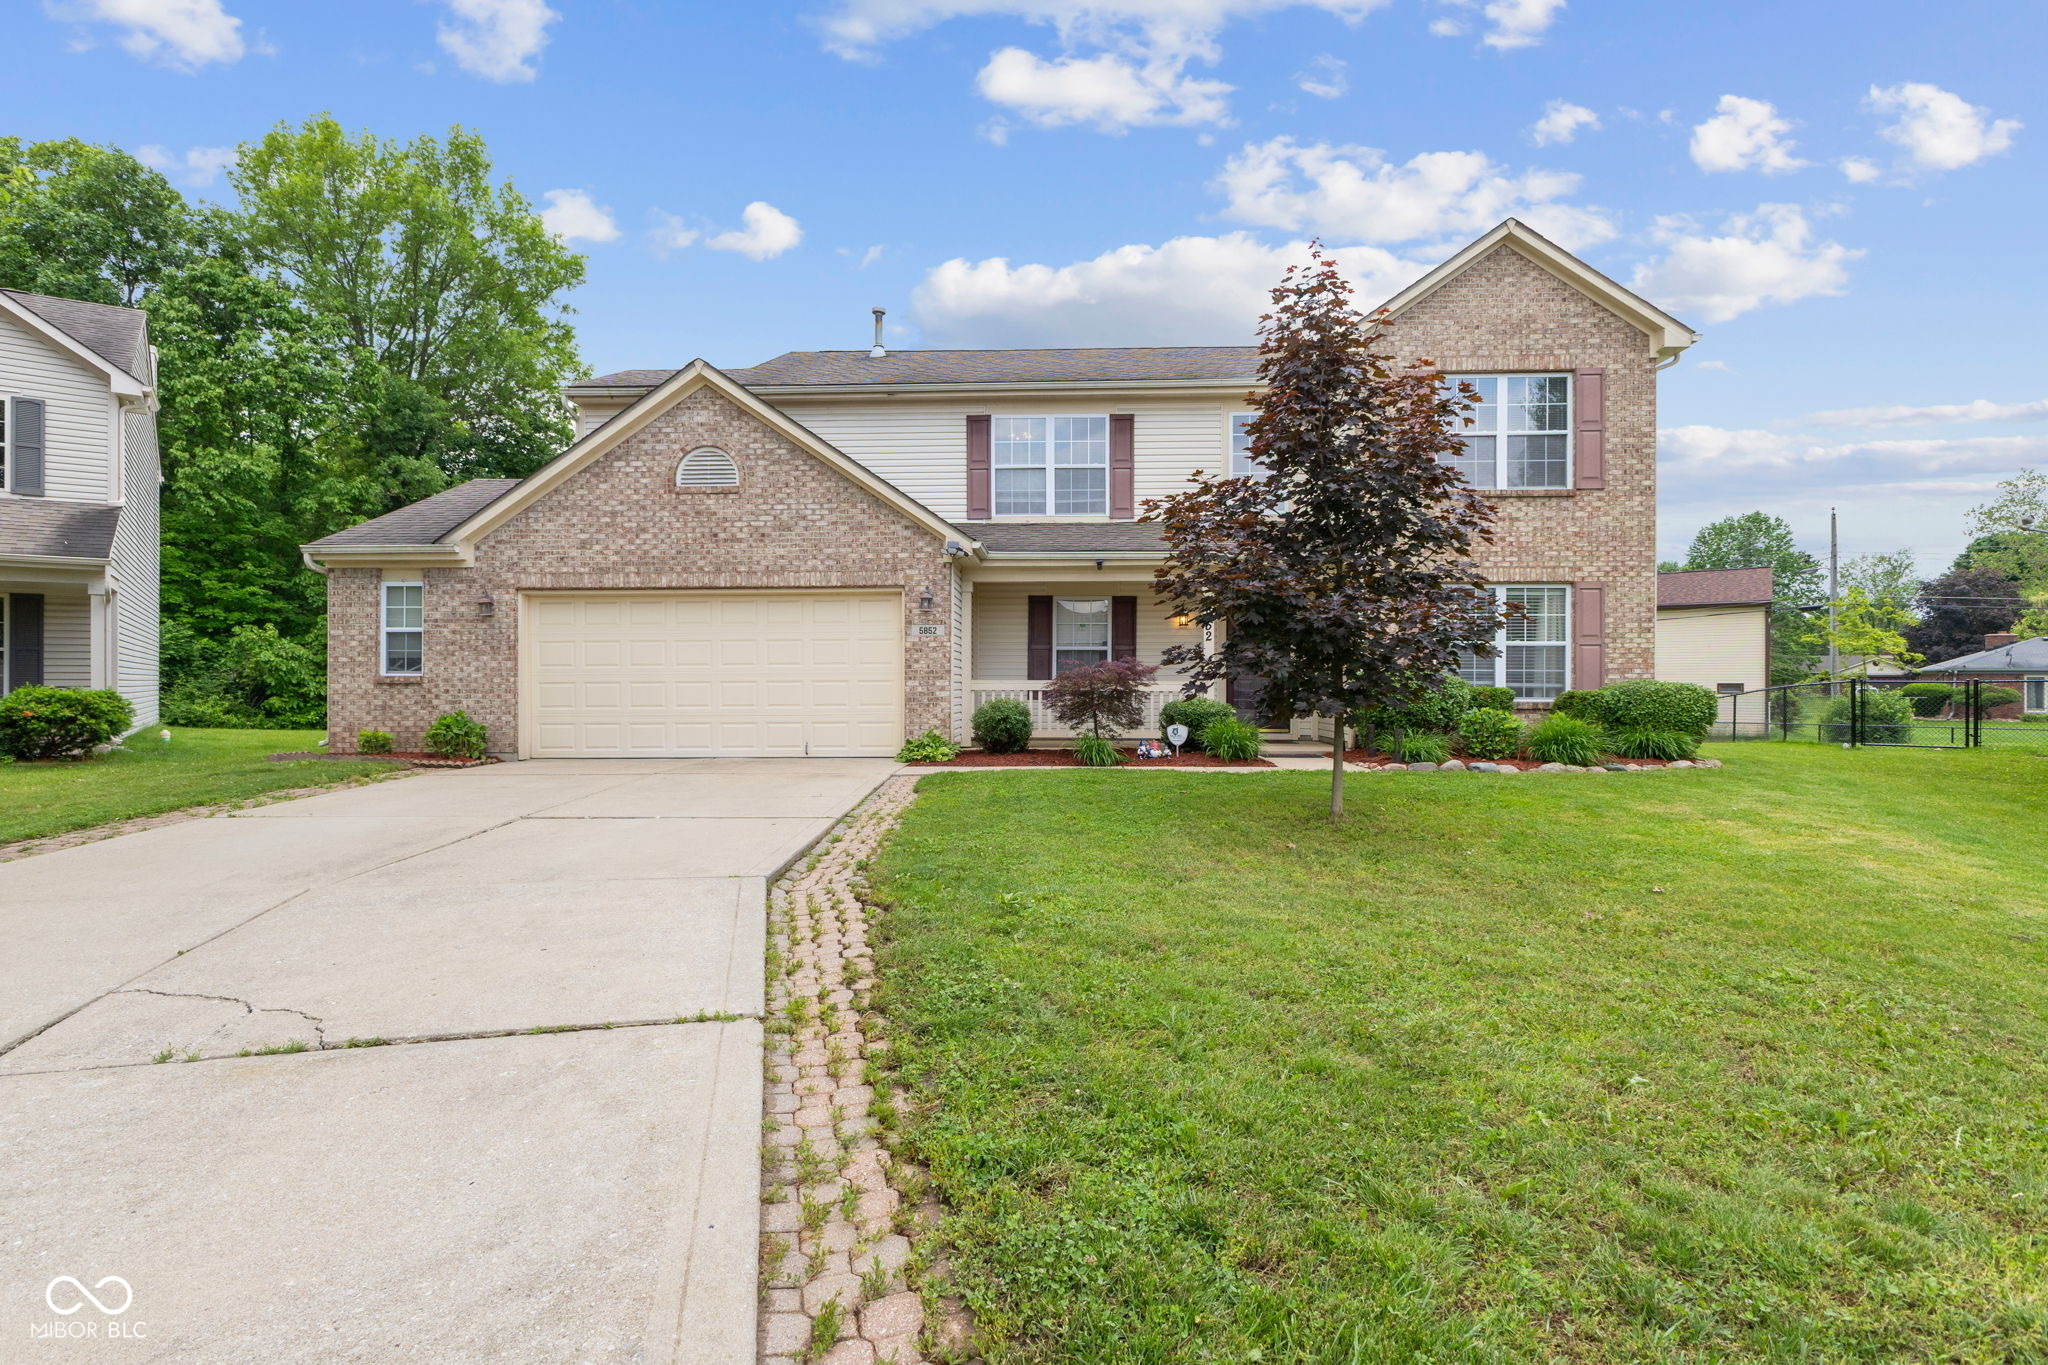
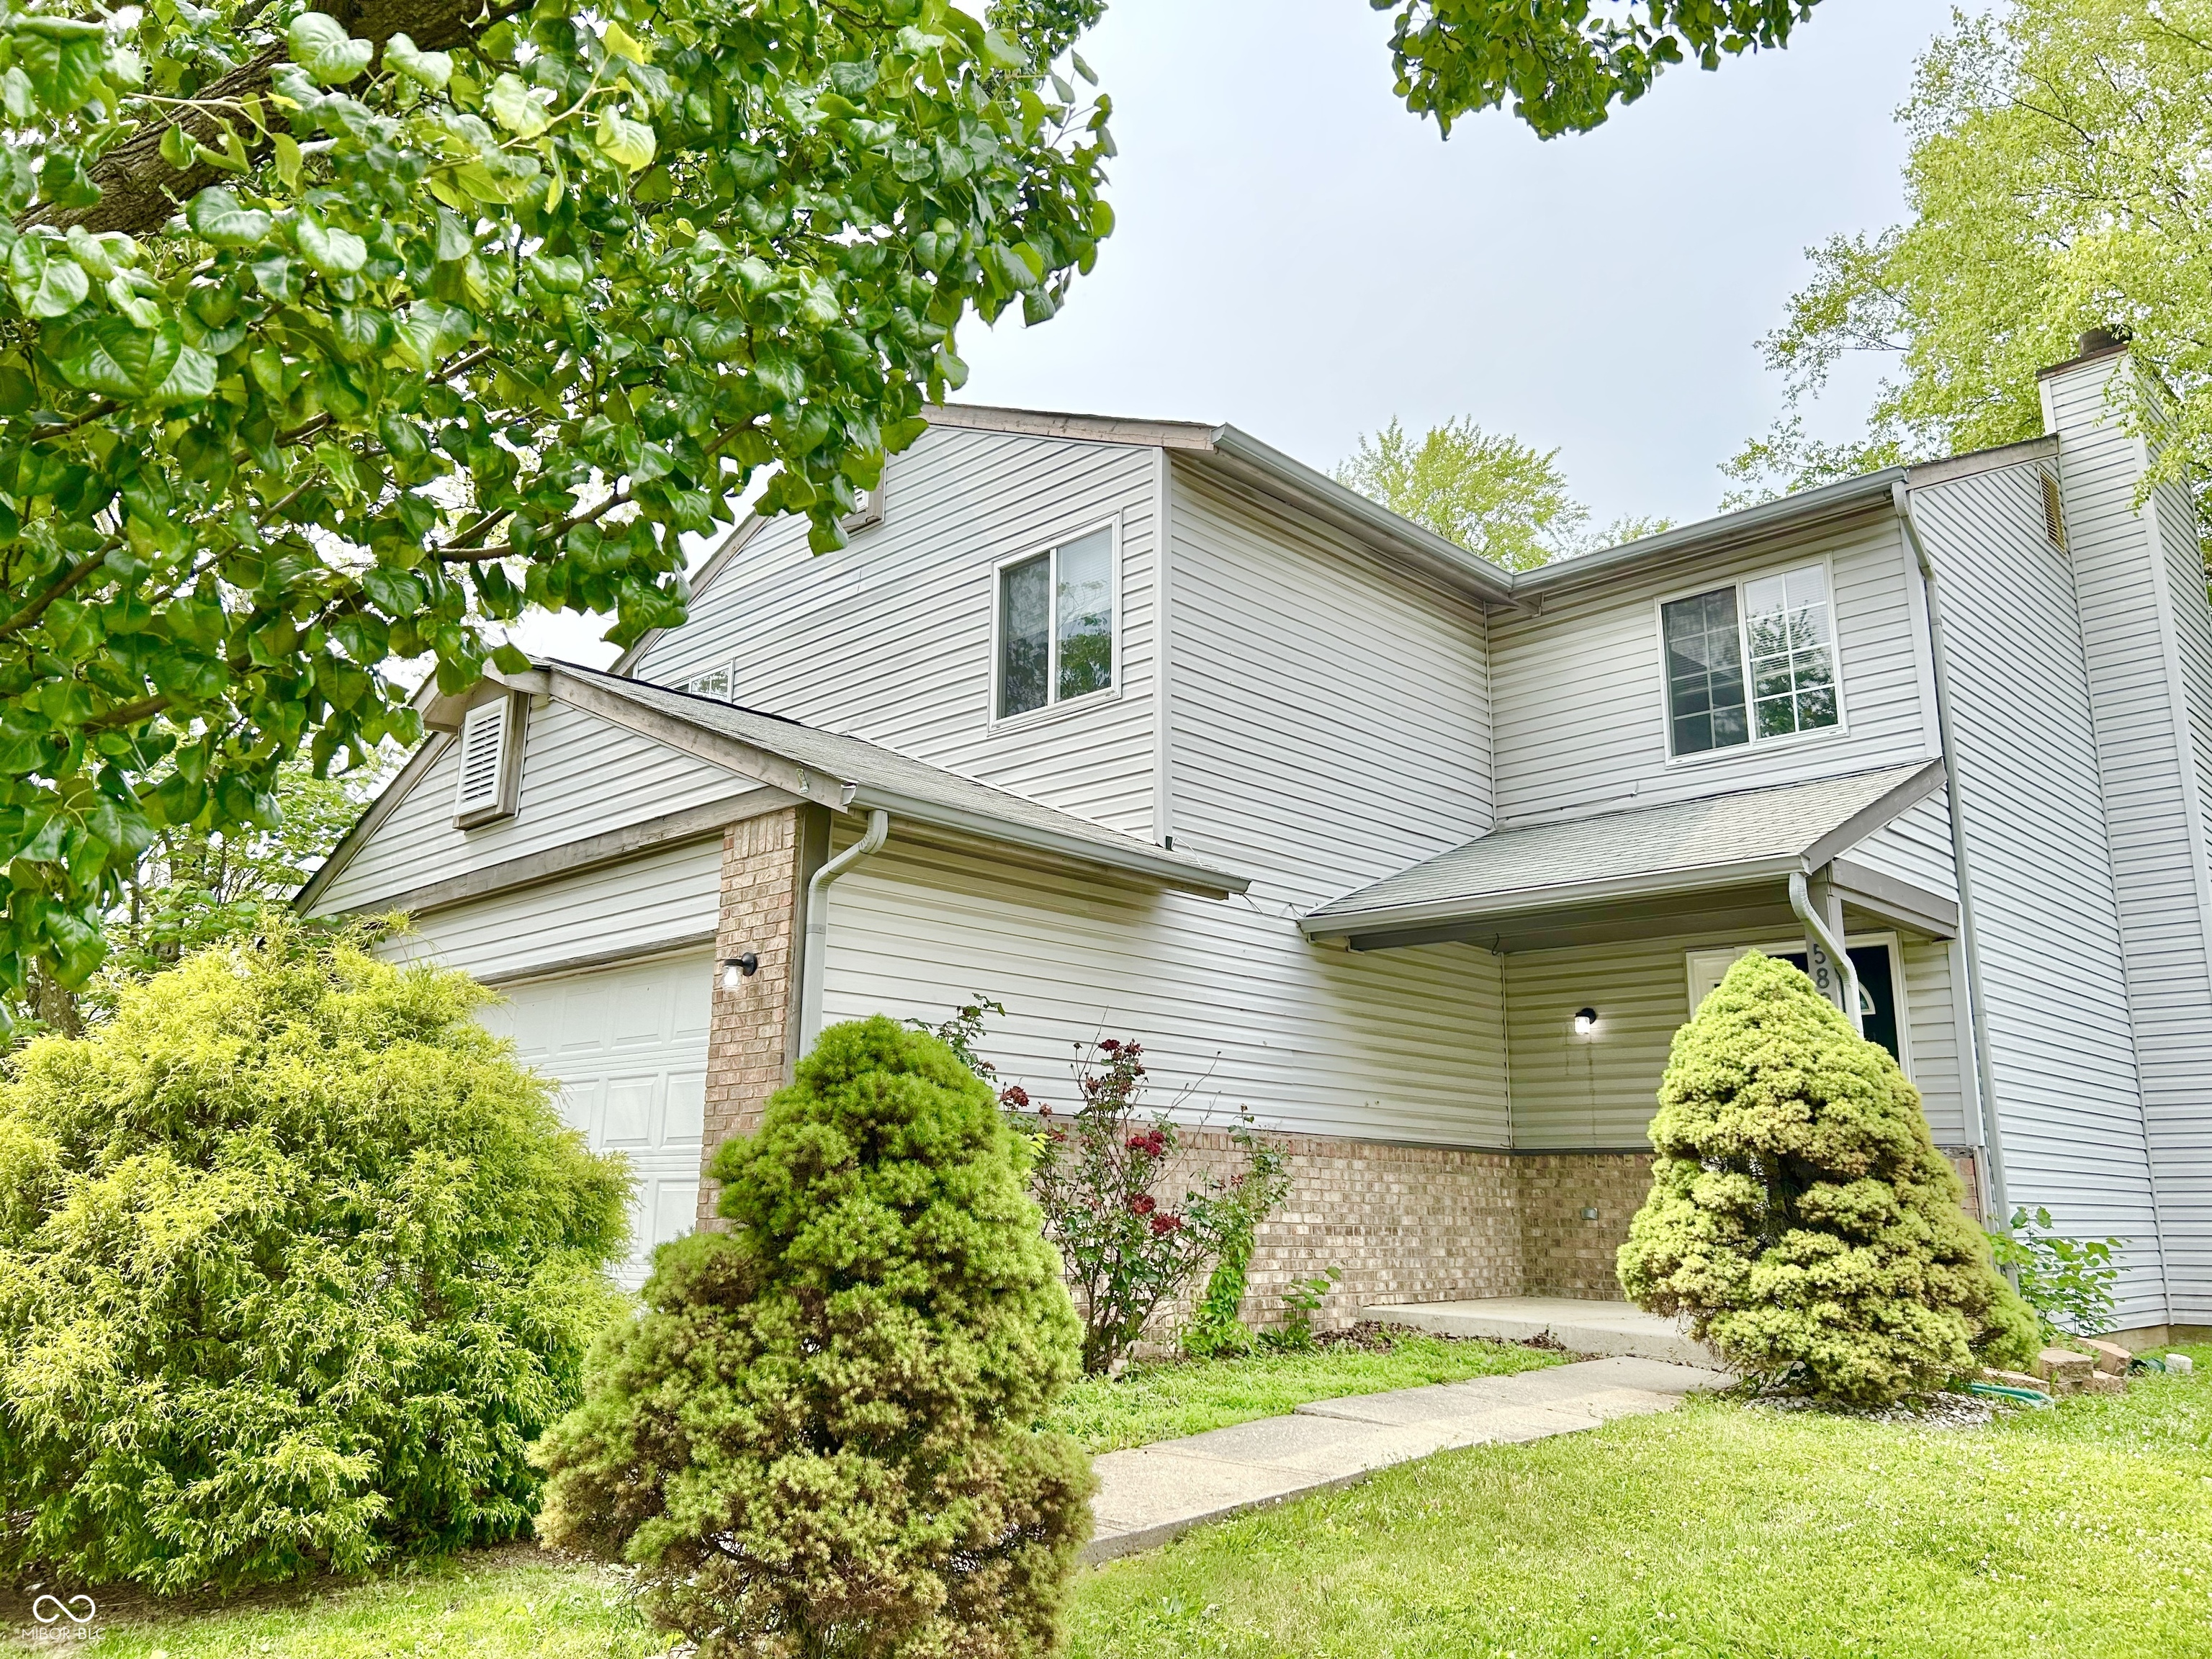
Pending
$309,000
4
bds
|
3
ba
|
2,788
sqft
|
built
2002
5852 Long Ridge Pl, Indianapolis, IN 46221
$-88
Cash flow
-1.5%
Cash-on-Cash Return
5.8%
Cap rate
0.7%
Rent to Value Ratio
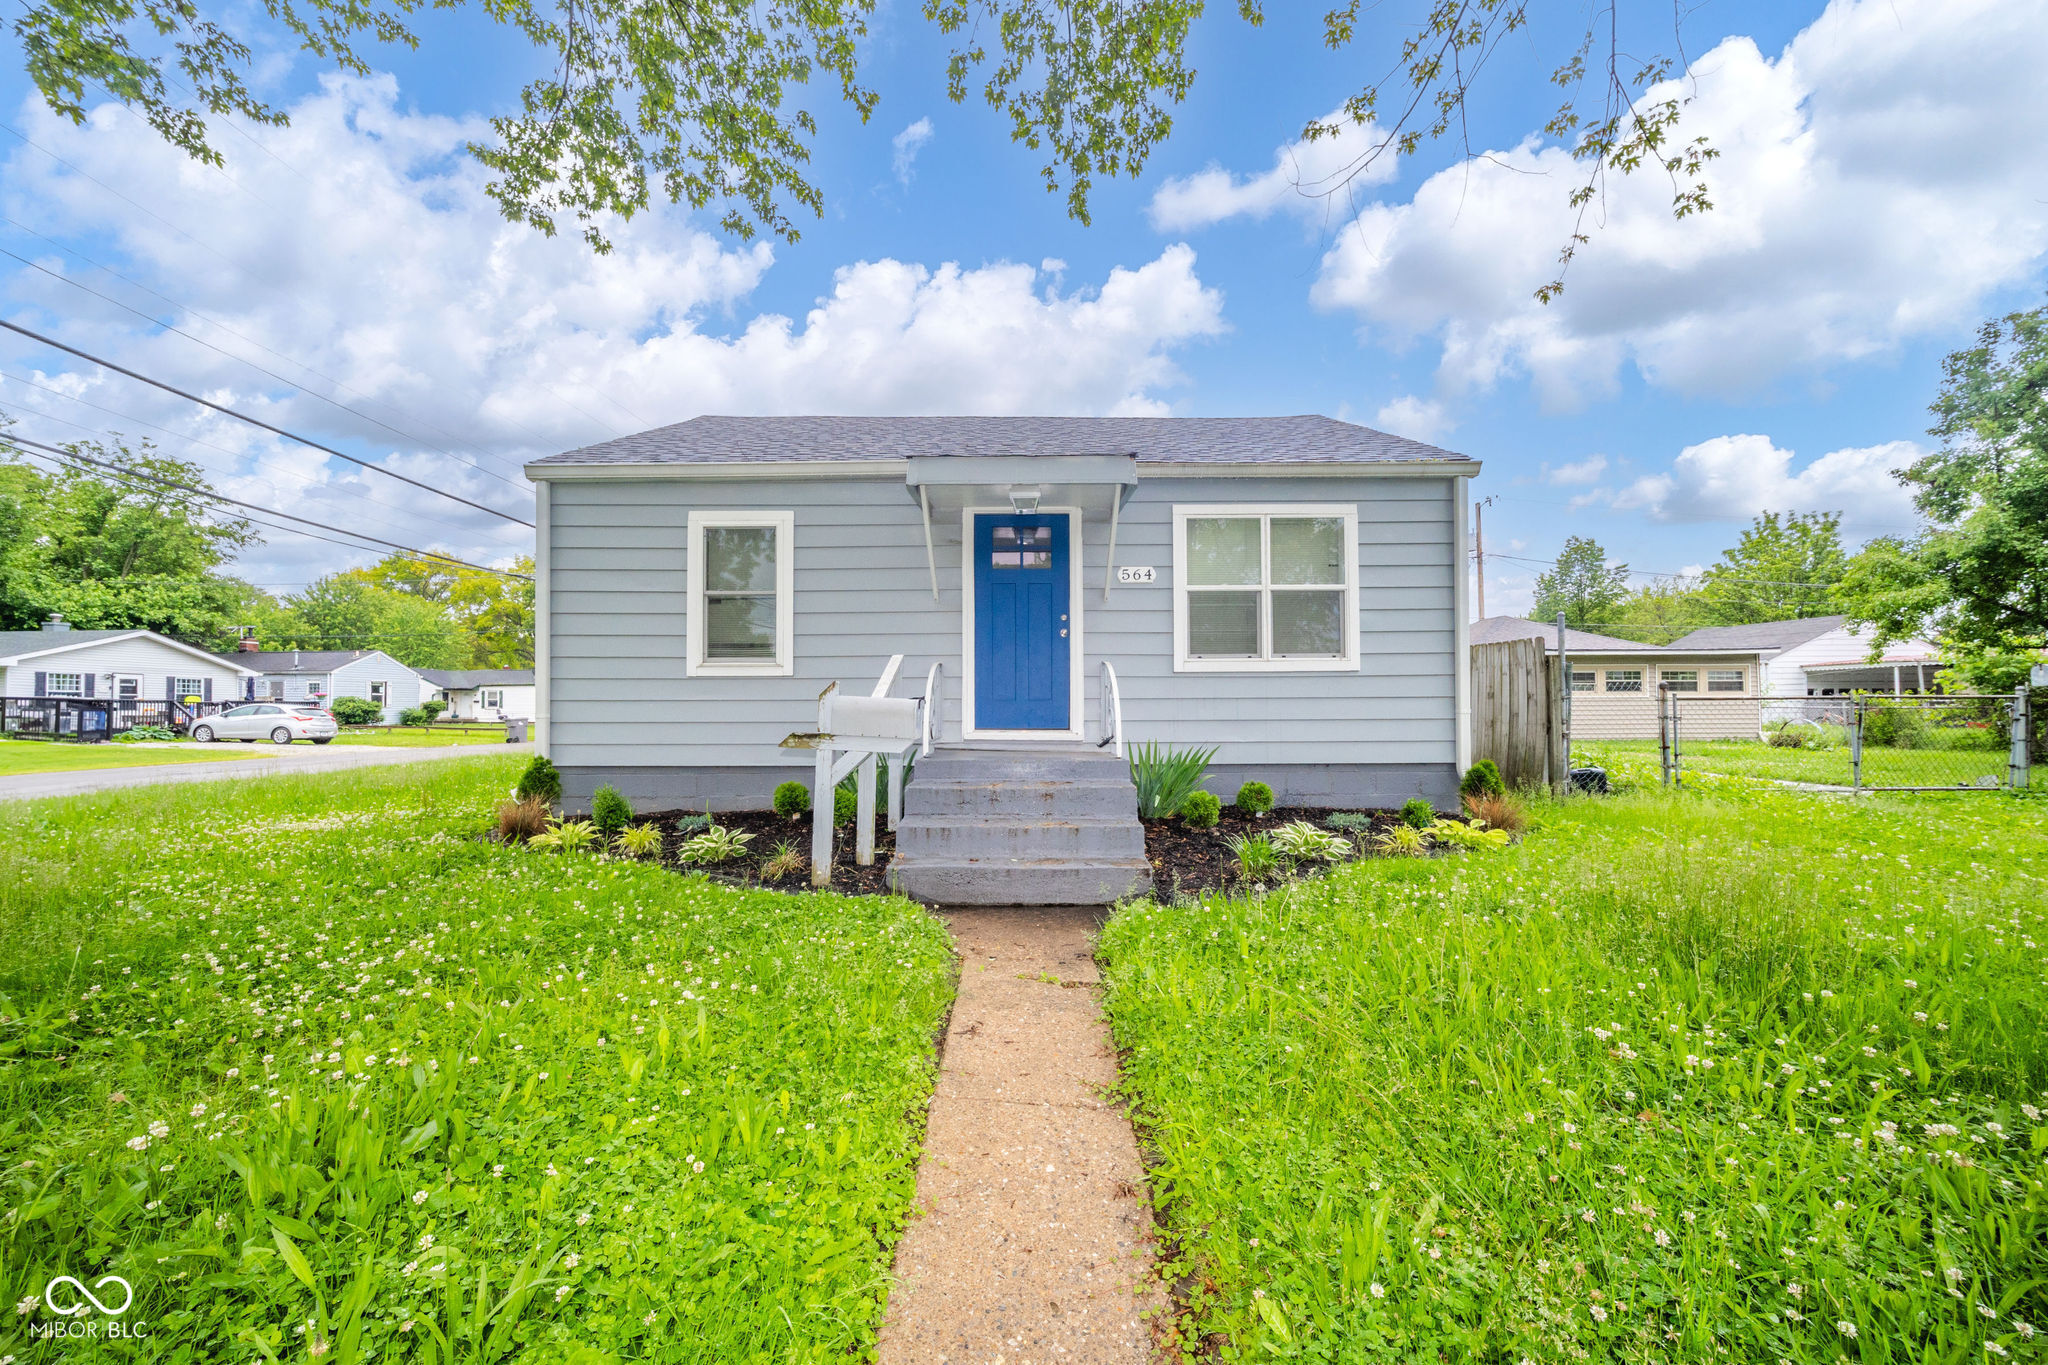
Active
$150,000
2
bds
|
1
ba
|
672
sqft
|
built
1949
564 S Bosart Ave, Indianapolis, IN 46203
$129
Cash flow
4.5%
Cash-on-Cash Return
7.2%
Cap rate
0.9%
Rent to Value Ratio
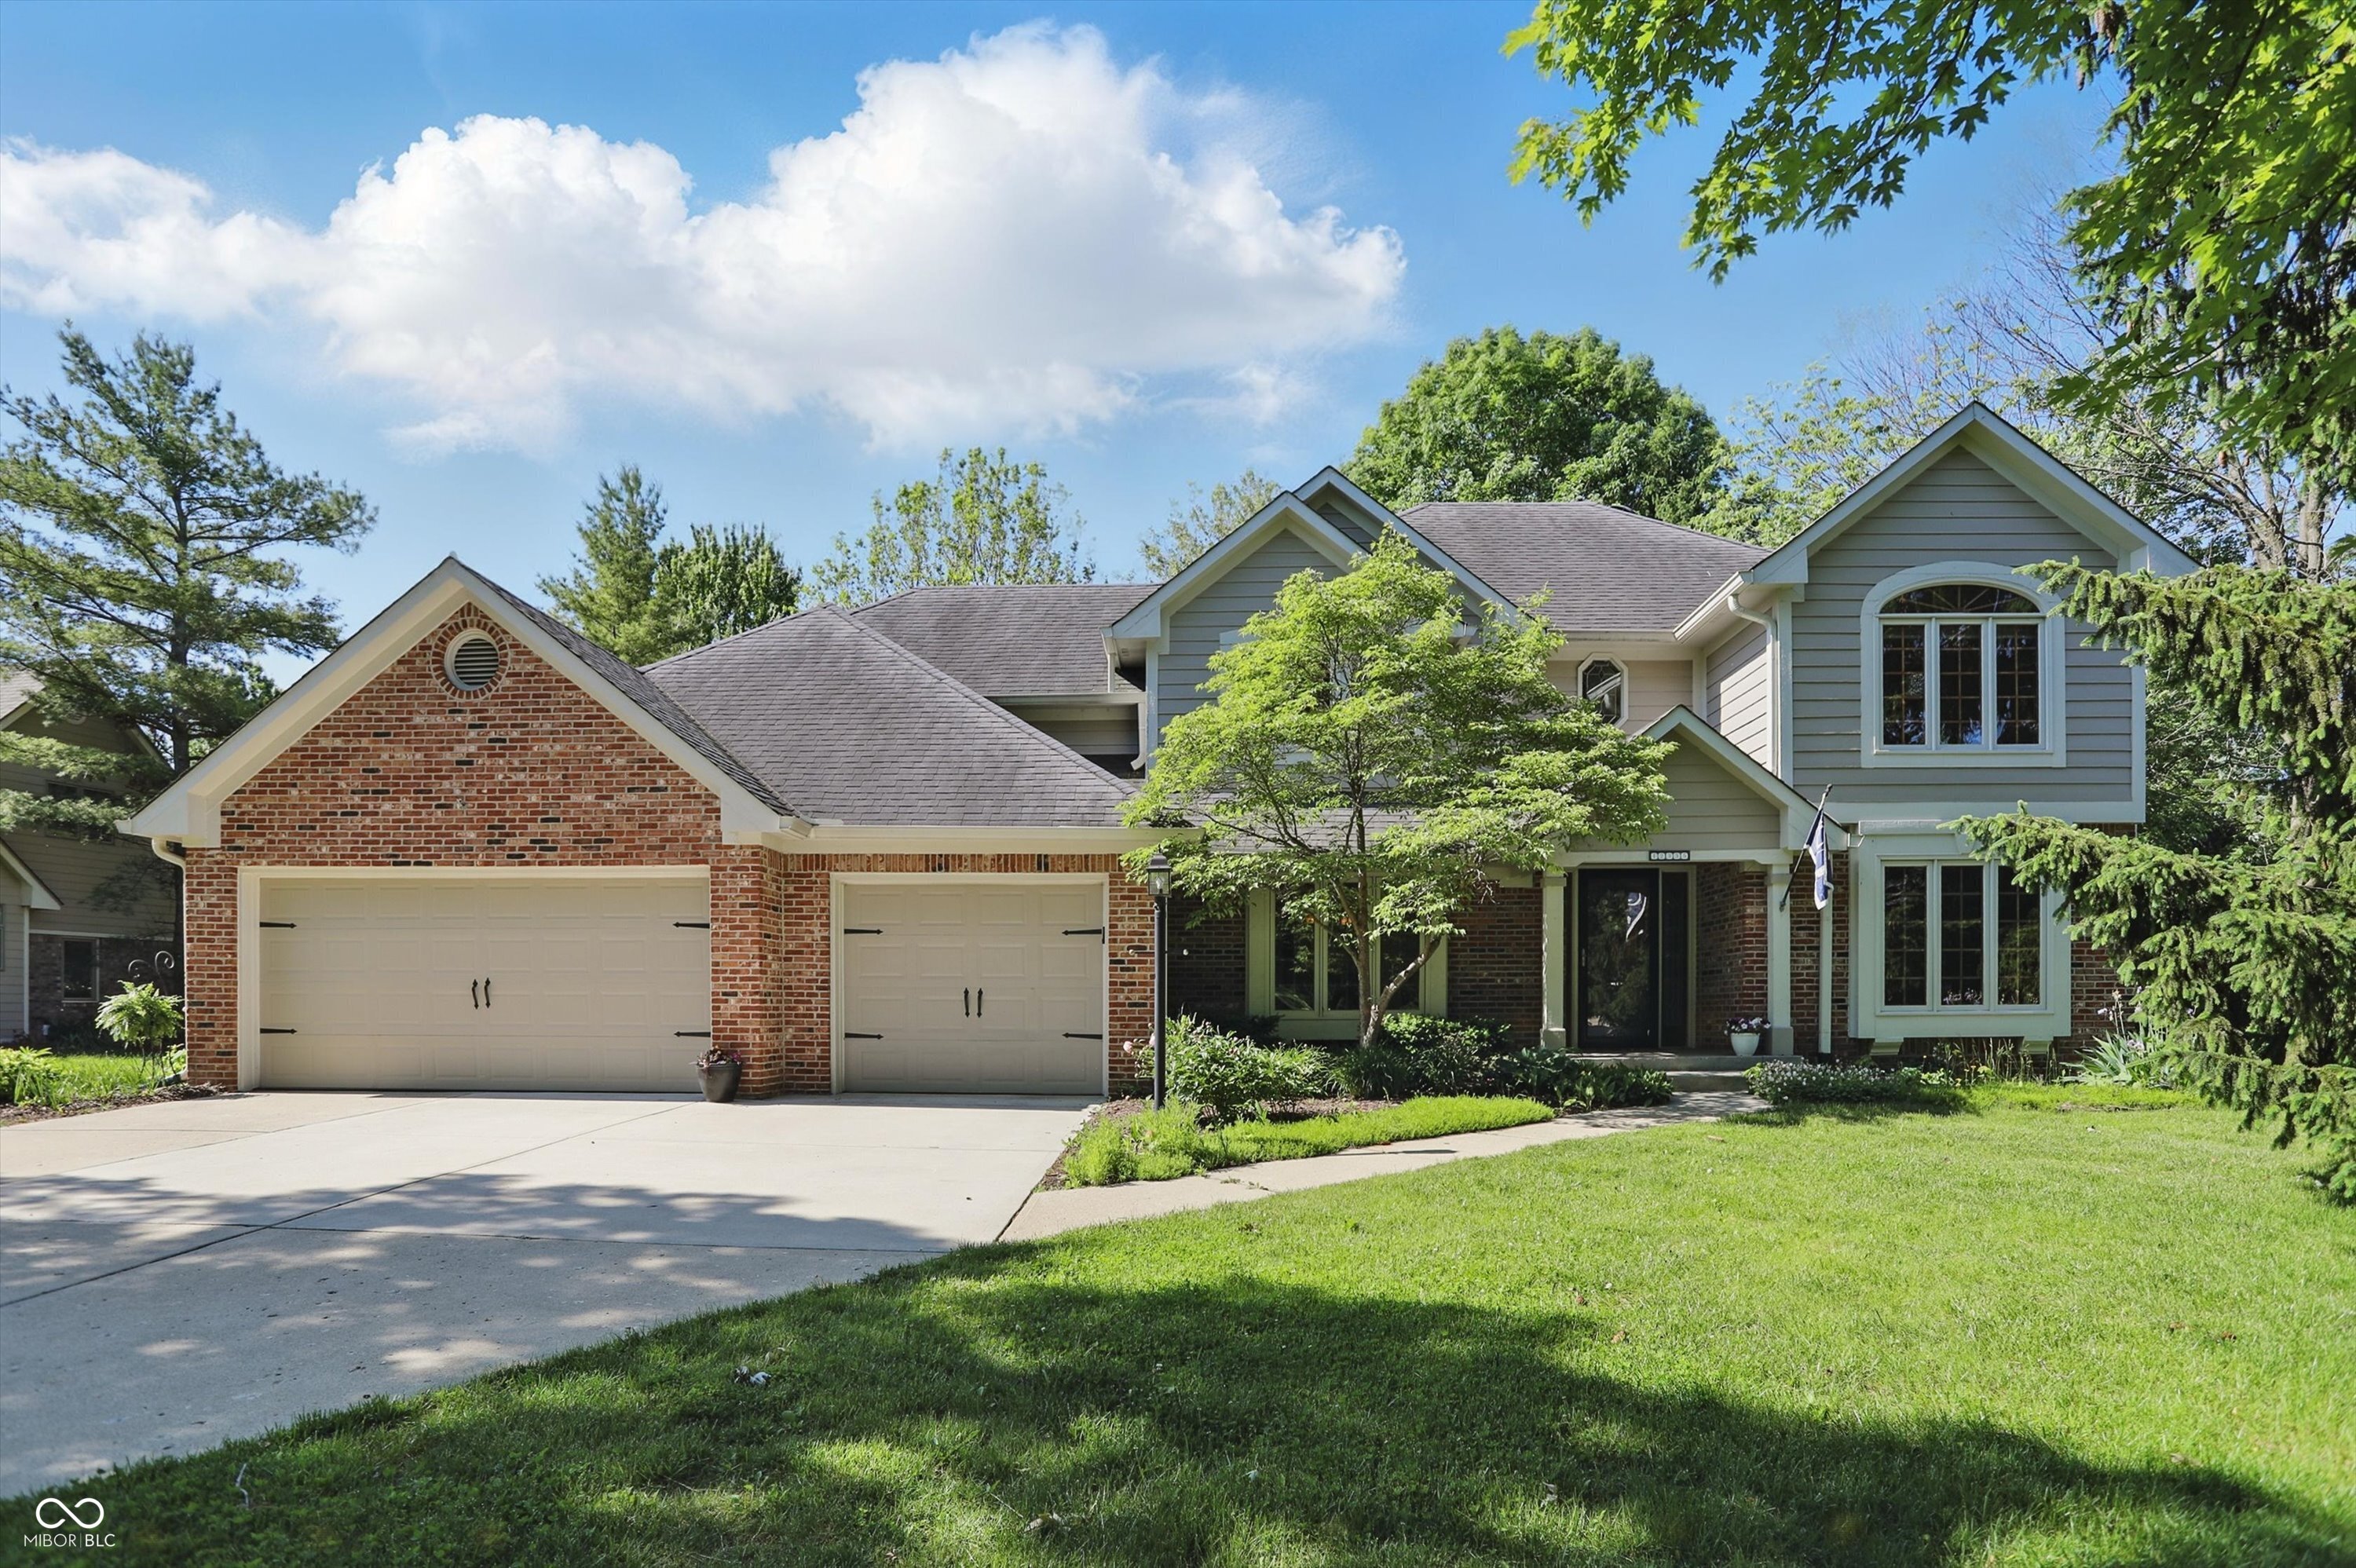
Active
$549,900
4
bds
|
3
ba
|
3,203
sqft
|
built
1993
12335 Old Stone Dr, Indianapolis, IN 46236
$-446
Cash flow
-4.2%
Cash-on-Cash Return
5.2%
Cap rate
0.6%
Rent to Value Ratio
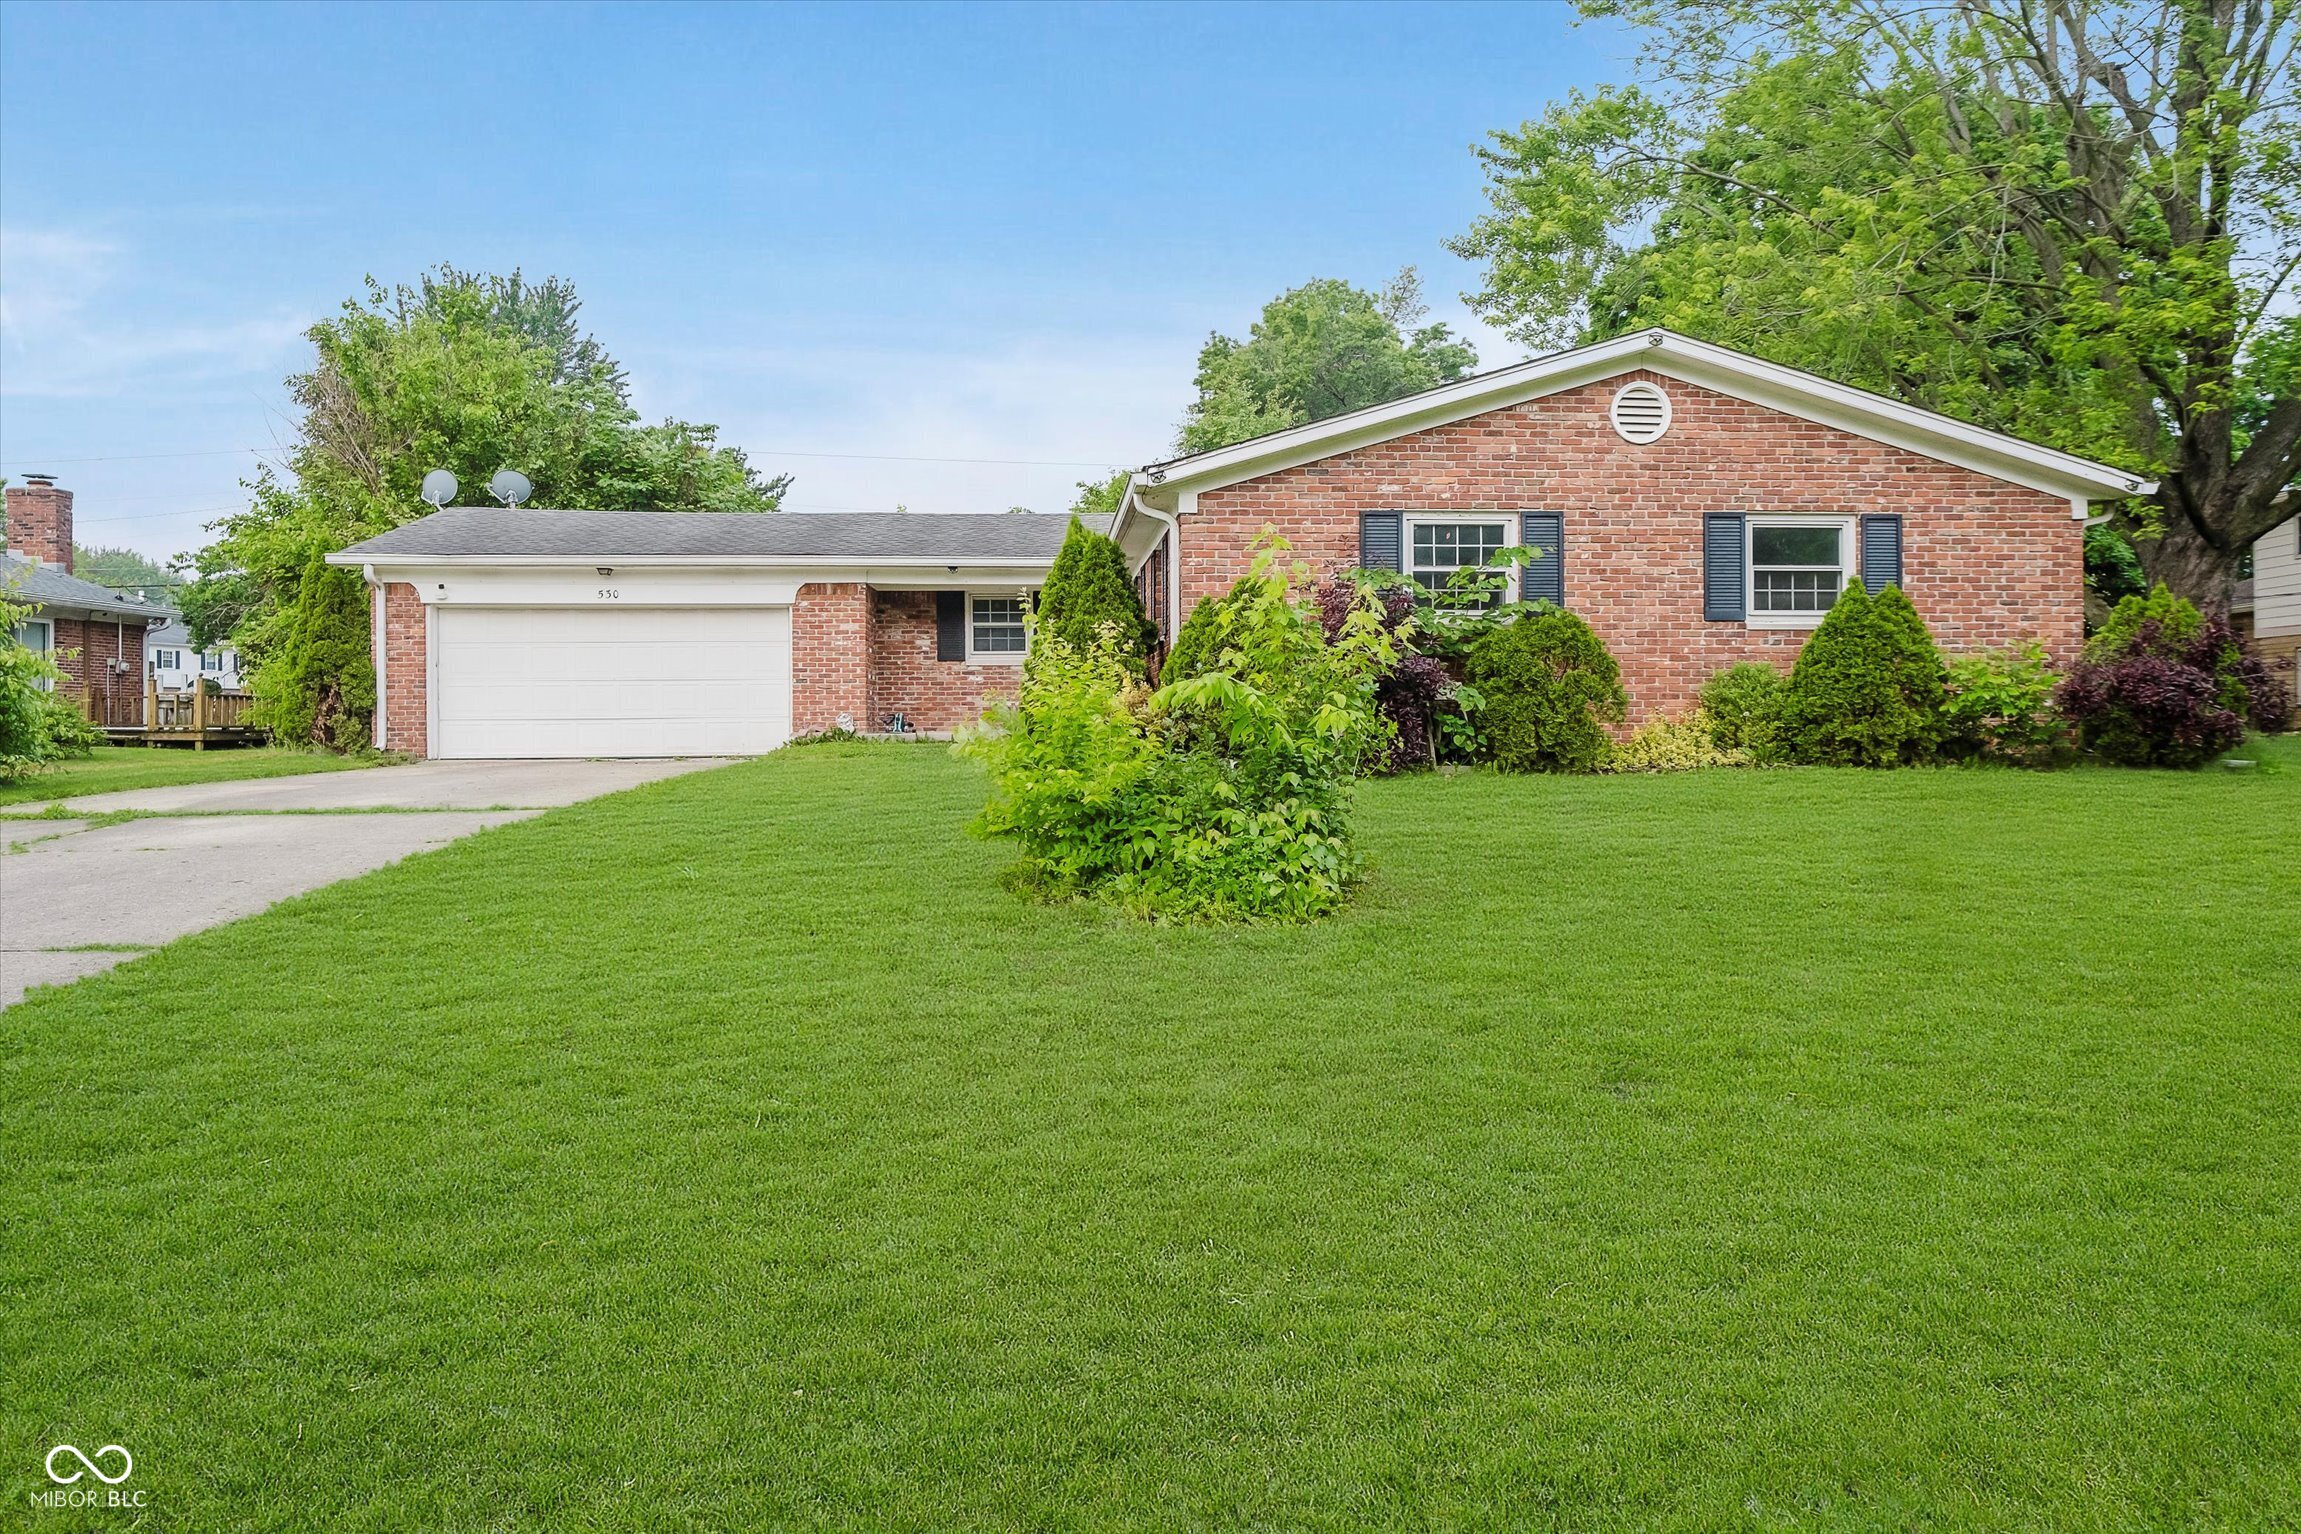
Active
$225,000
3
bds
|
2
ba
|
1,710
sqft
|
built
1968
530 Westmore Dr, Indianapolis, IN 46214
$227
Cash flow
5.3%
Cash-on-Cash Return
7.4%
Cap rate
0.9%
Rent to Value Ratio
Pending
$169,900
2
bds
|
1
ba
|
1,080
sqft
|
built
1968
5806 E 19th St, Indianapolis, IN 46218
$-42
Cash flow
-1.3%
Cash-on-Cash Return
5.8%
Cap rate
0.7%
Rent to Value Ratio
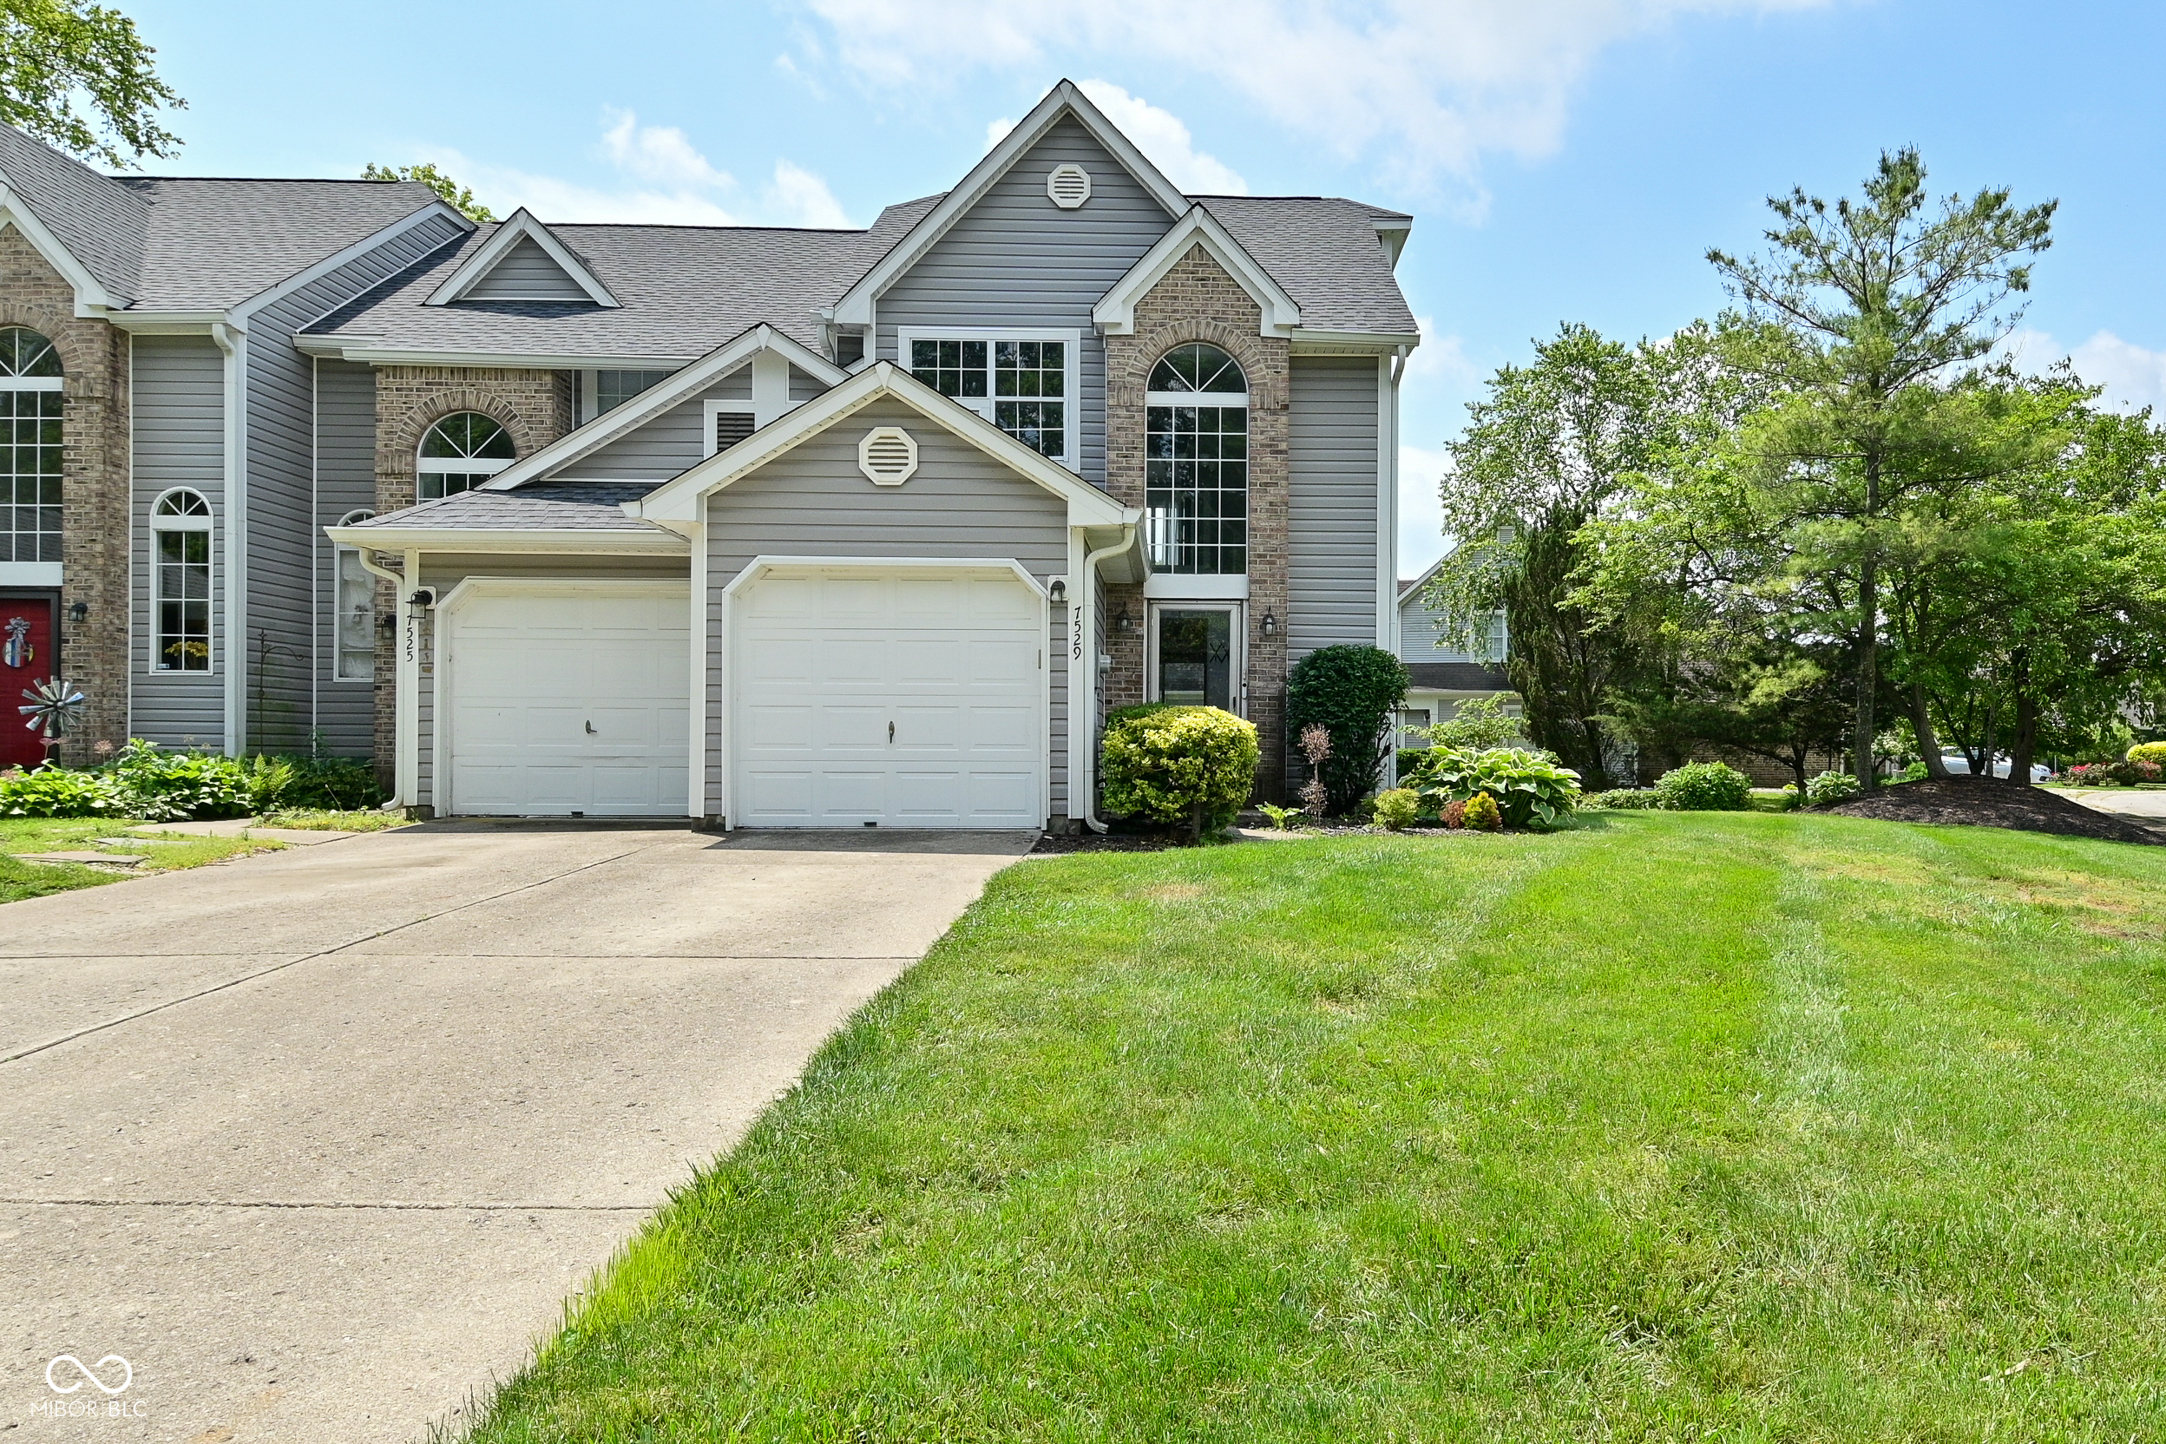
Active
$225,000
2
bds
|
3
ba
|
1,286
sqft
|
built
1991
7529 Oceanline Dr, Indianapolis, IN 46214
$-121
Cash flow
-2.8%
Cash-on-Cash Return
5.5%
Cap rate
0.8%
Rent to Value Ratio
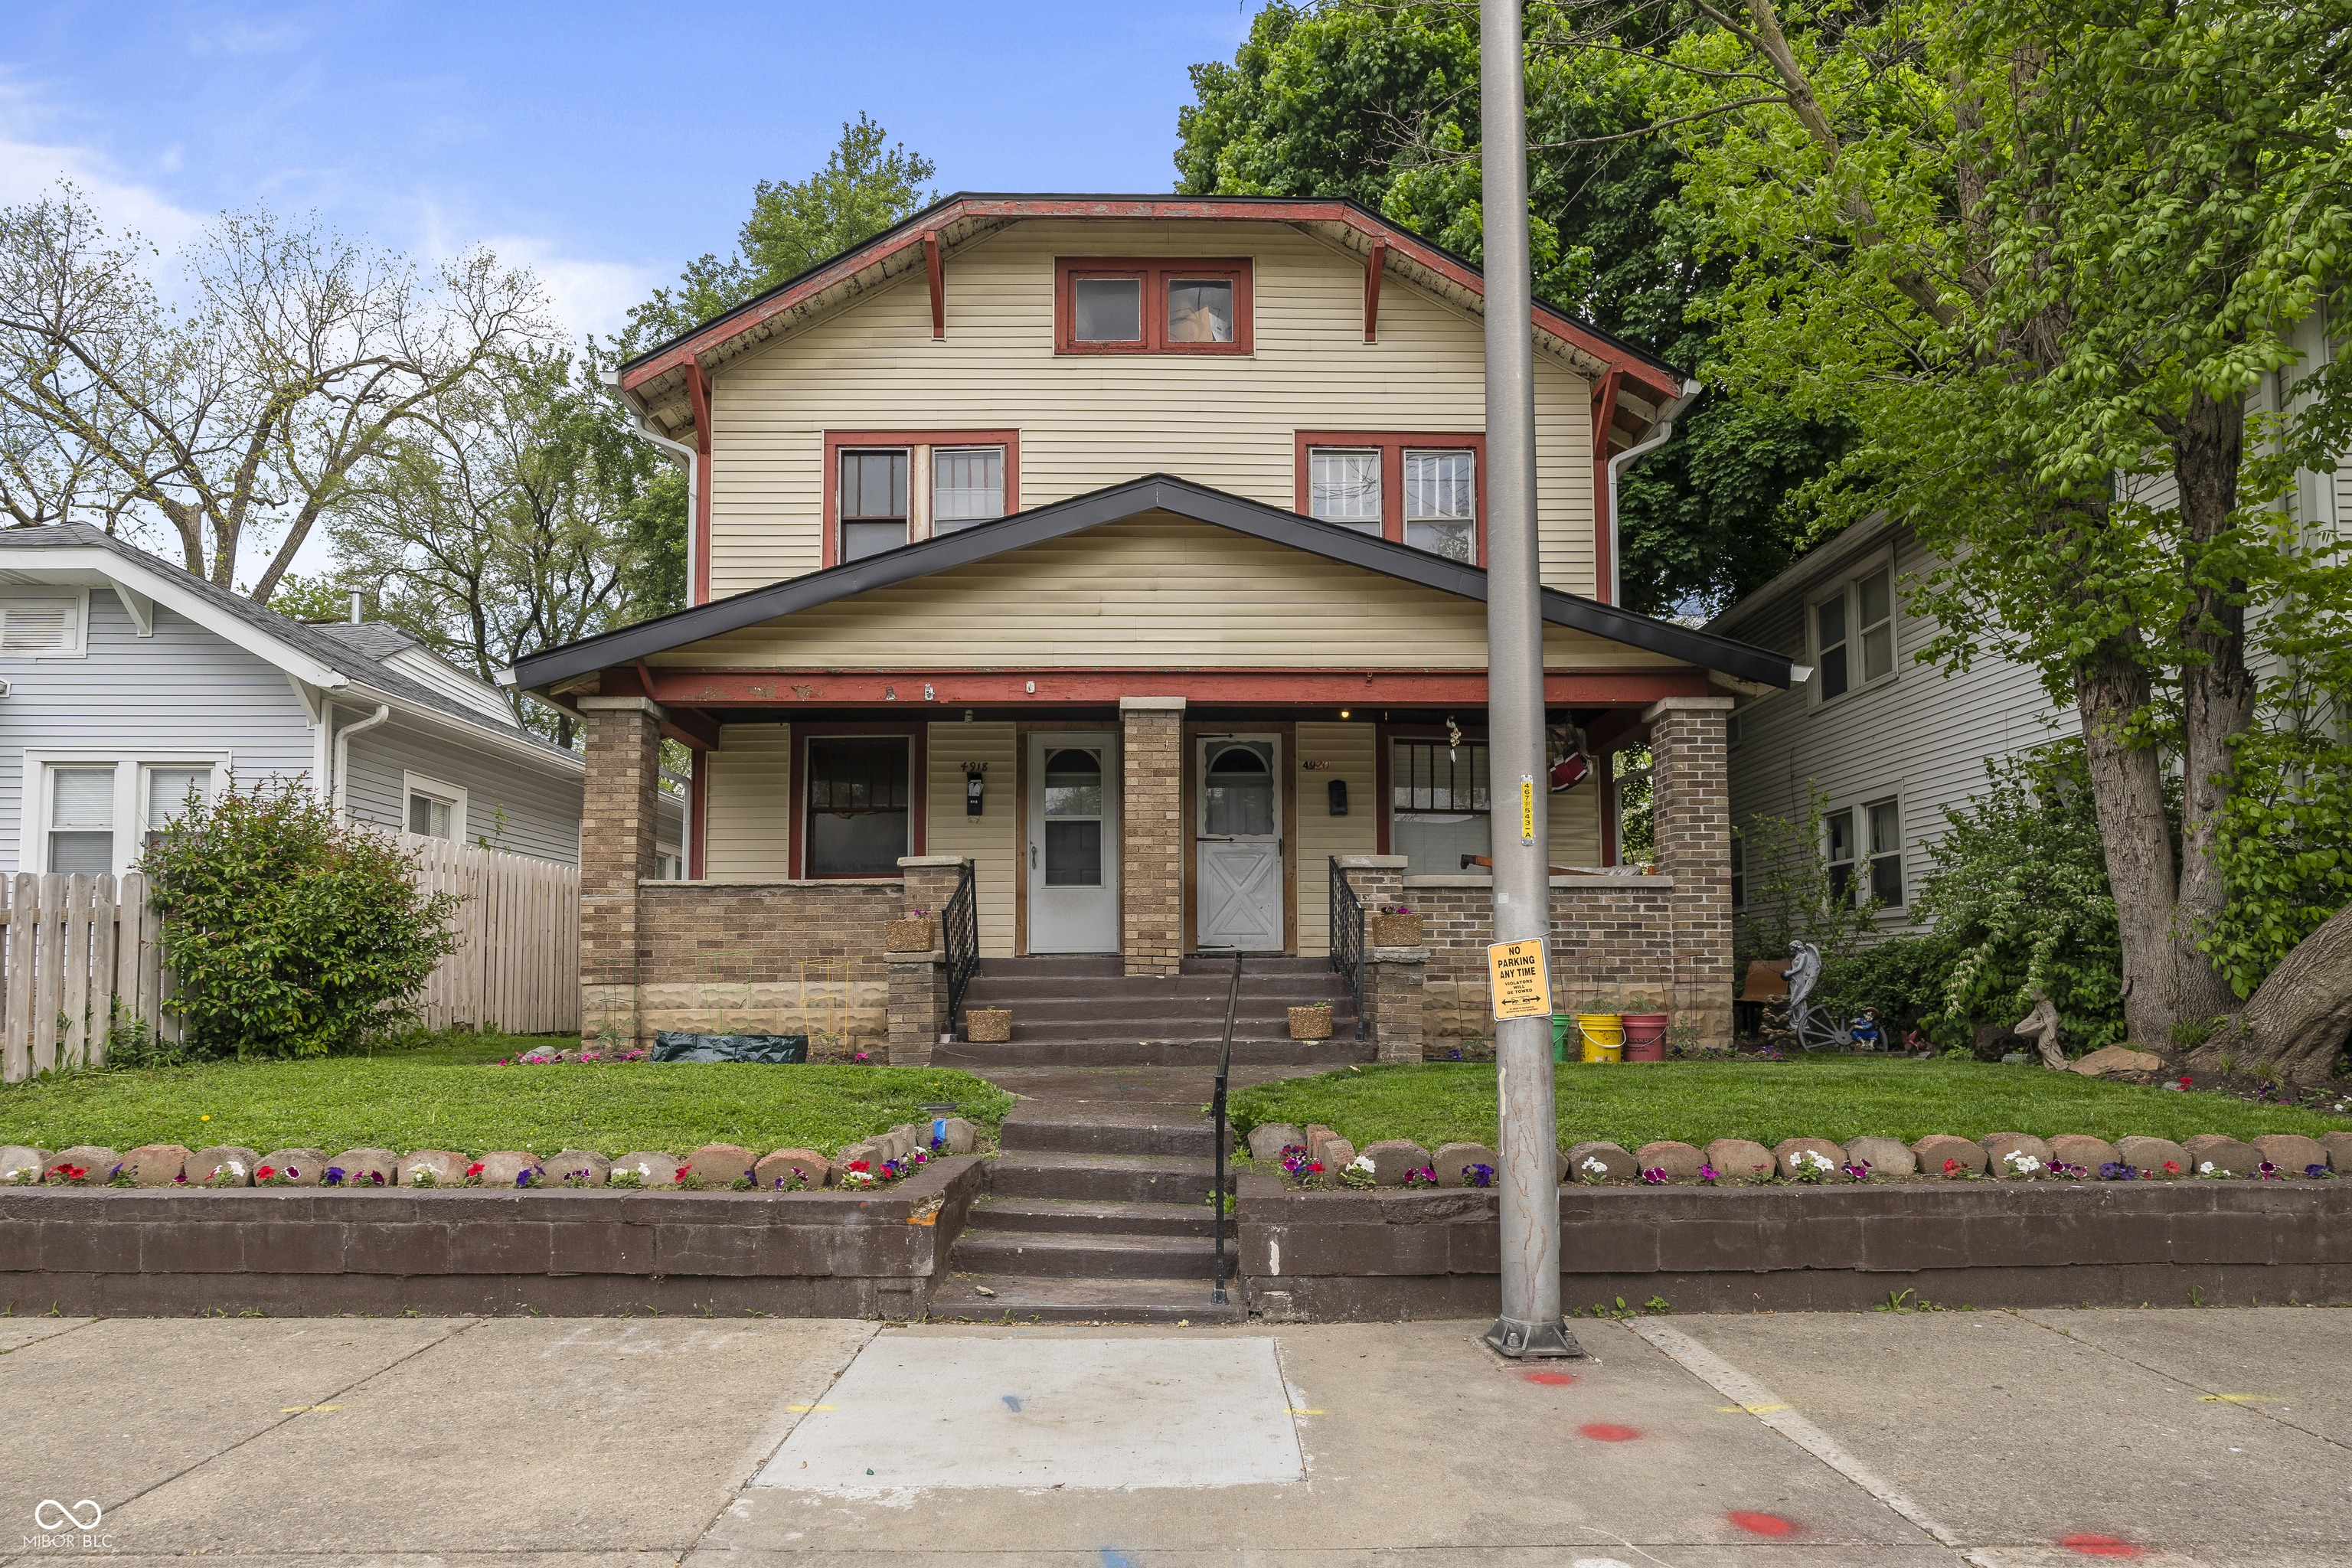
Active
$170,000
0
bds
|
0
ba
|
0
sqft
|
built
1920
4918 E New York St, Indianapolis, IN 46201
$-457
Cash flow
-14.0%
Cash-on-Cash Return
2.9%
Cap rate
0.4%
Rent to Value Ratio
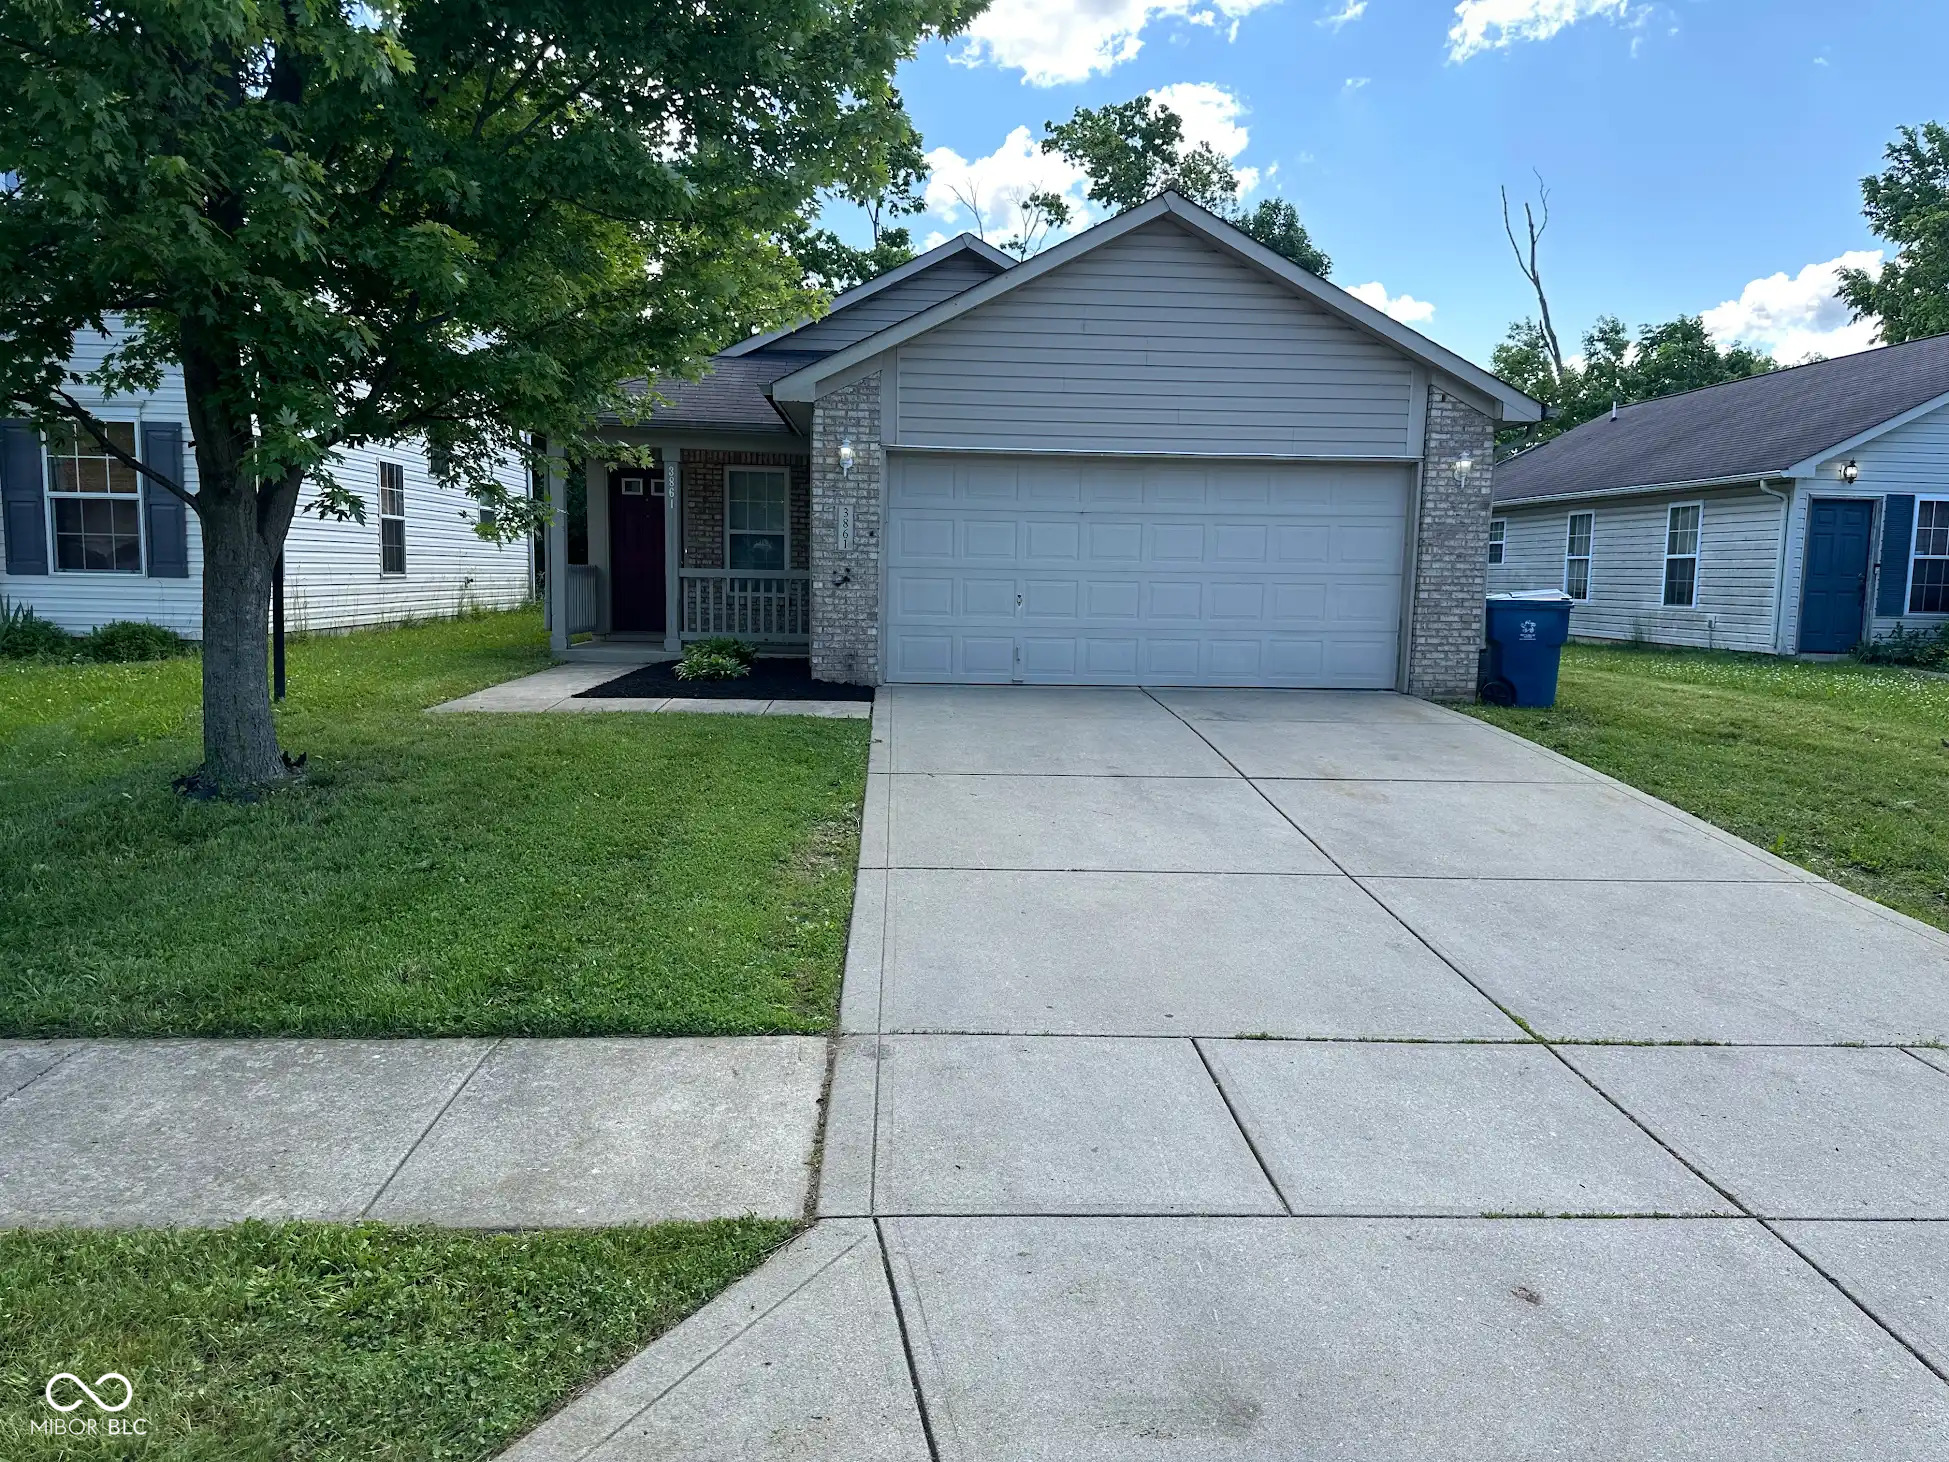
Pending
$219,000
3
bds
|
2
ba
|
1,240
sqft
|
built
2003
3861 Candle Berry Dr, Indianapolis, IN 46235
$41
Cash flow
1.0%
Cash-on-Cash Return
6.4%
Cap rate
0.8%
Rent to Value Ratio
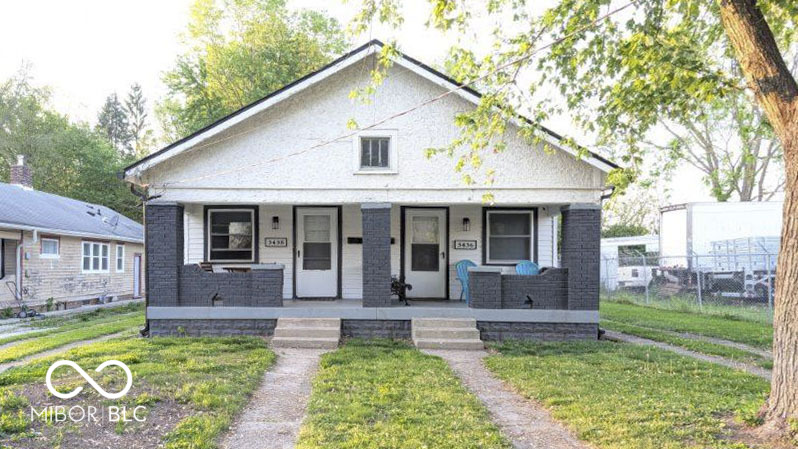
Pending
$235,000
3
bds
|
0
ba
|
0
sqft
|
built
1920
3436 Garden Ave, Indianapolis, IN 46222
$-376
Cash flow
-8.3%
Cash-on-Cash Return
4.2%
Cap rate
0.5%
Rent to Value Ratio
Active
$440,000
5
bds
|
3
ba
|
3,116
sqft
|
built
2017
4539 Maldenhair Dr, Indianapolis, IN 46239
$-363
Cash flow
-4.3%
Cash-on-Cash Return
5.2%
Cap rate
0.6%
Rent to Value Ratio
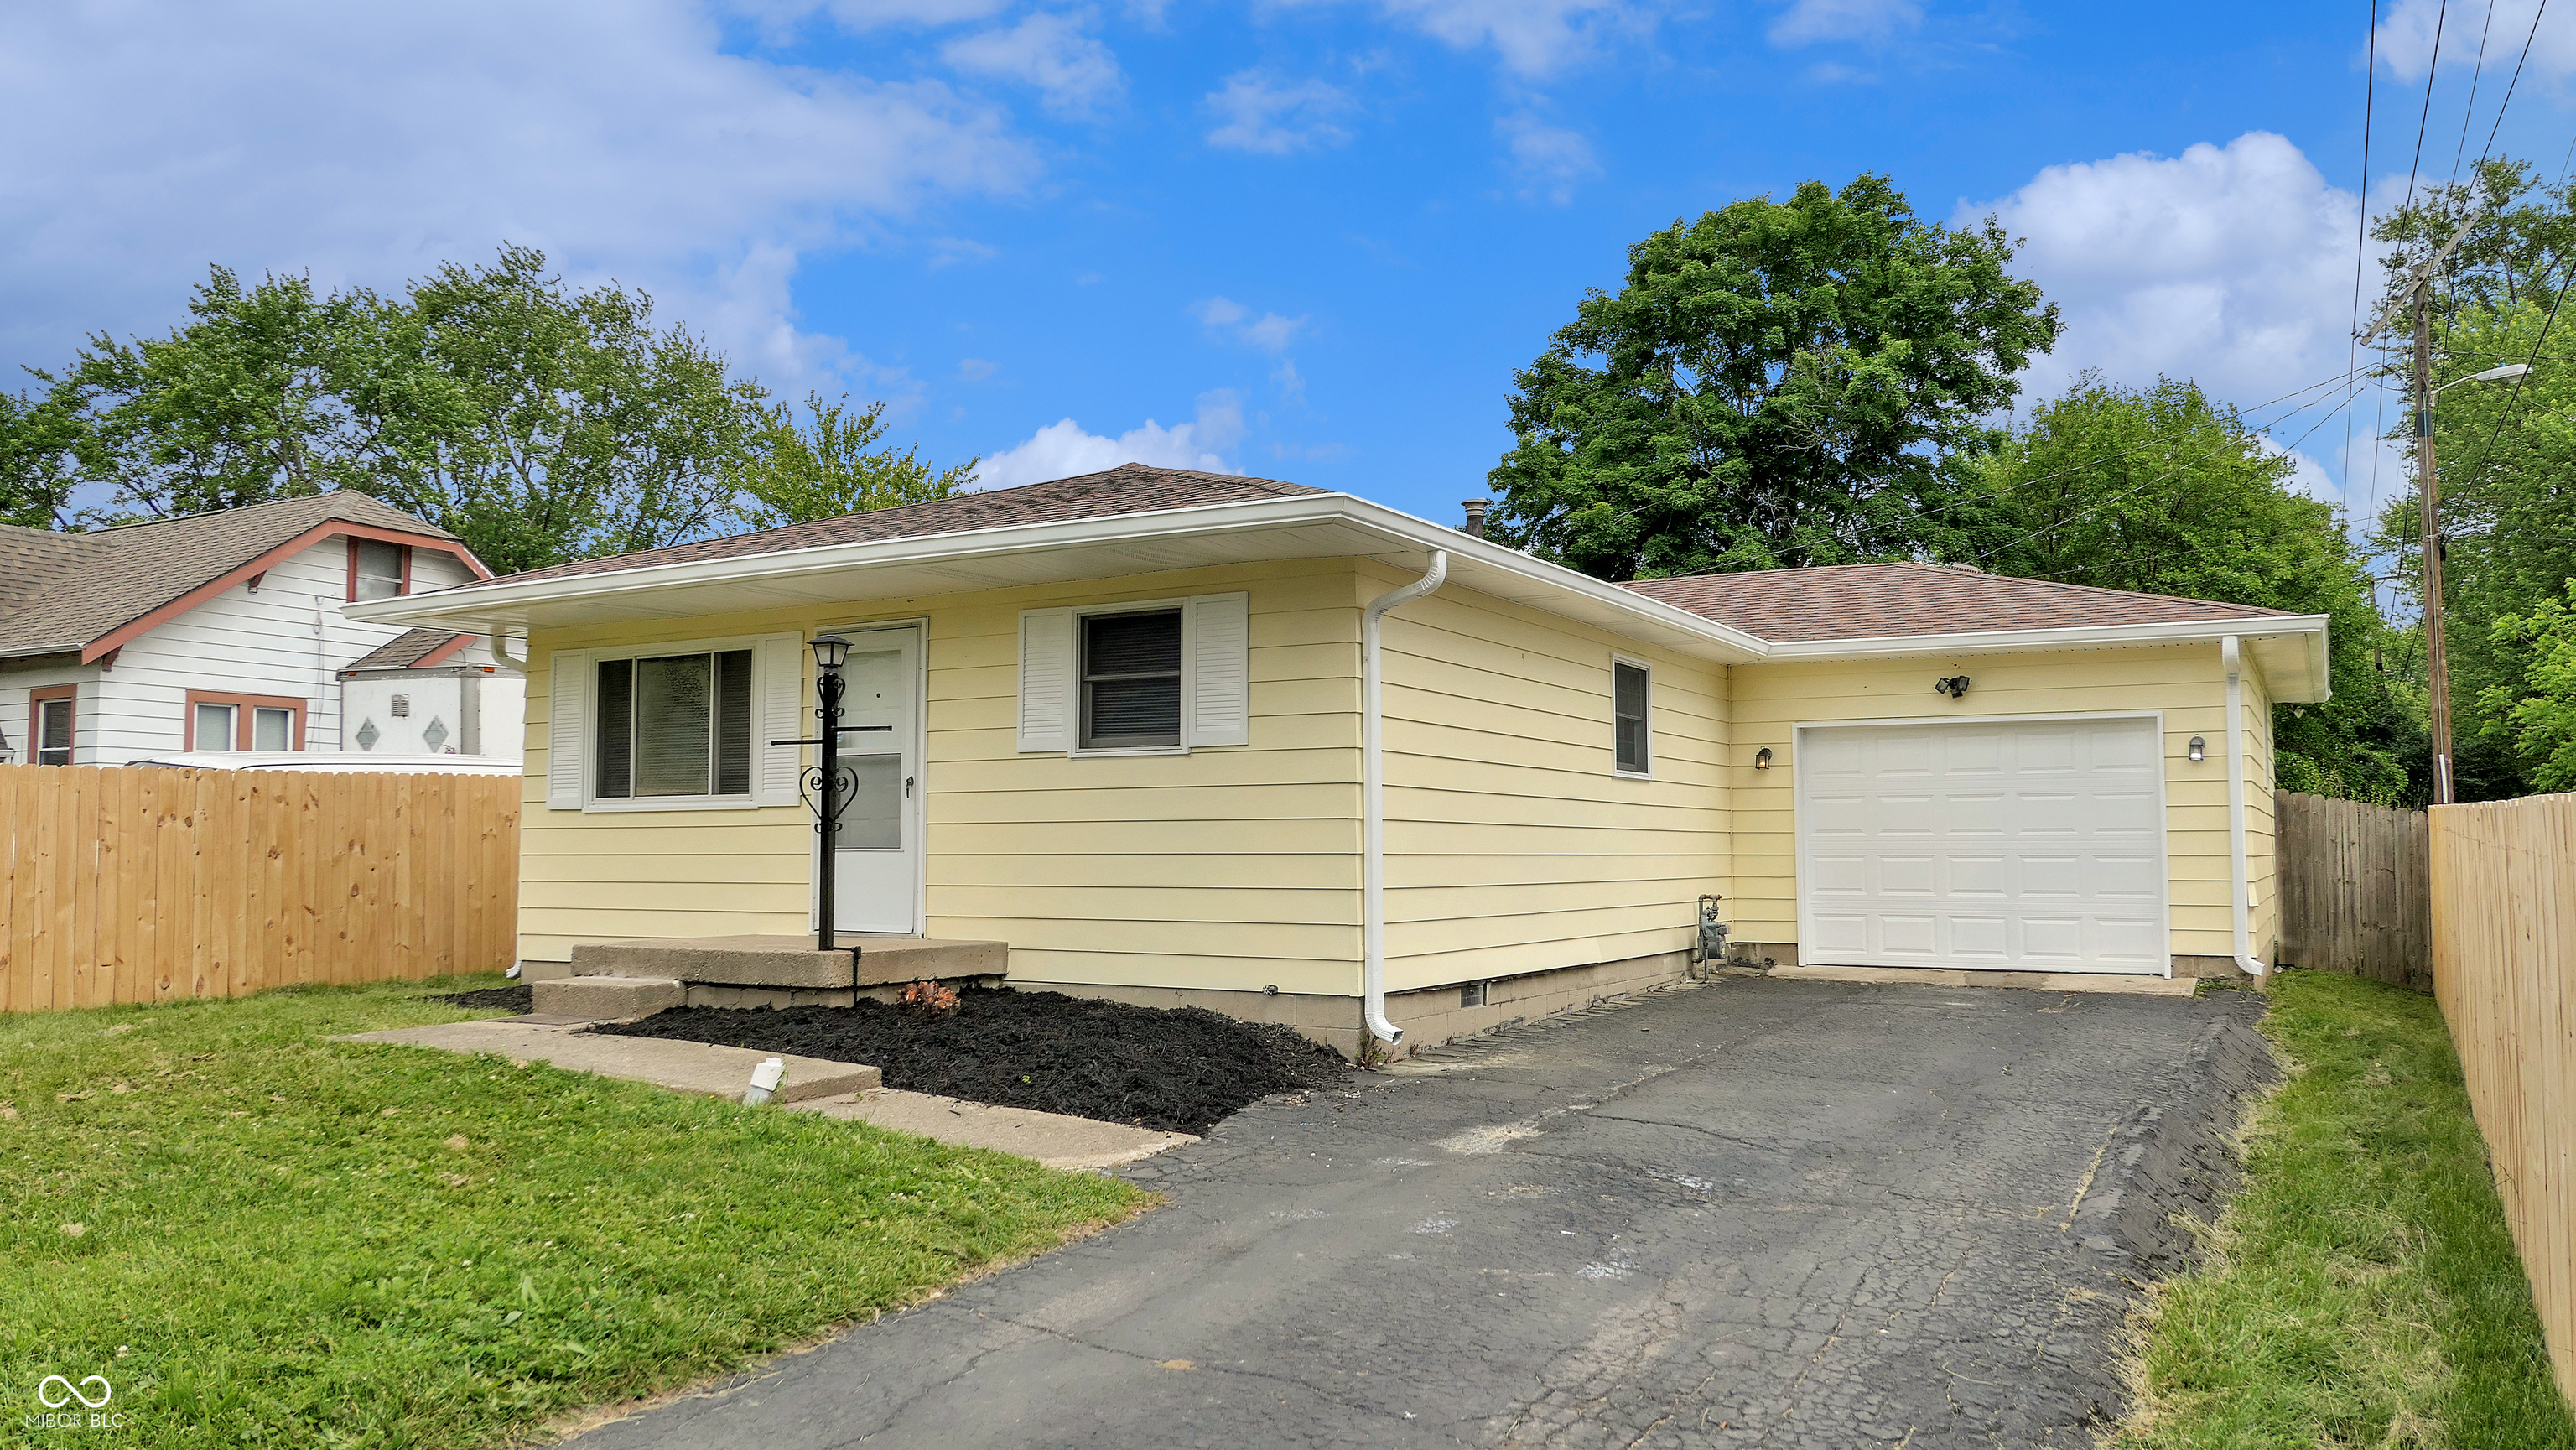
Active
$95,000
3
bds
|
1
ba
|
1,080
sqft
|
built
1951
4109 E 21st St, Indianapolis, IN 46218
$410
Cash flow
22.5%
Cash-on-Cash Return
11.3%
Cap rate
1.4%
Rent to Value Ratio
Active
$599,000
3
bds
|
4
ba
|
2,082
sqft
|
built
1980
239 E 11th St, Indianapolis, IN 46202
$-1,136
Cash flow
-9.9%
Cash-on-Cash Return
3.9%
Cap rate
0.5%
Rent to Value Ratio
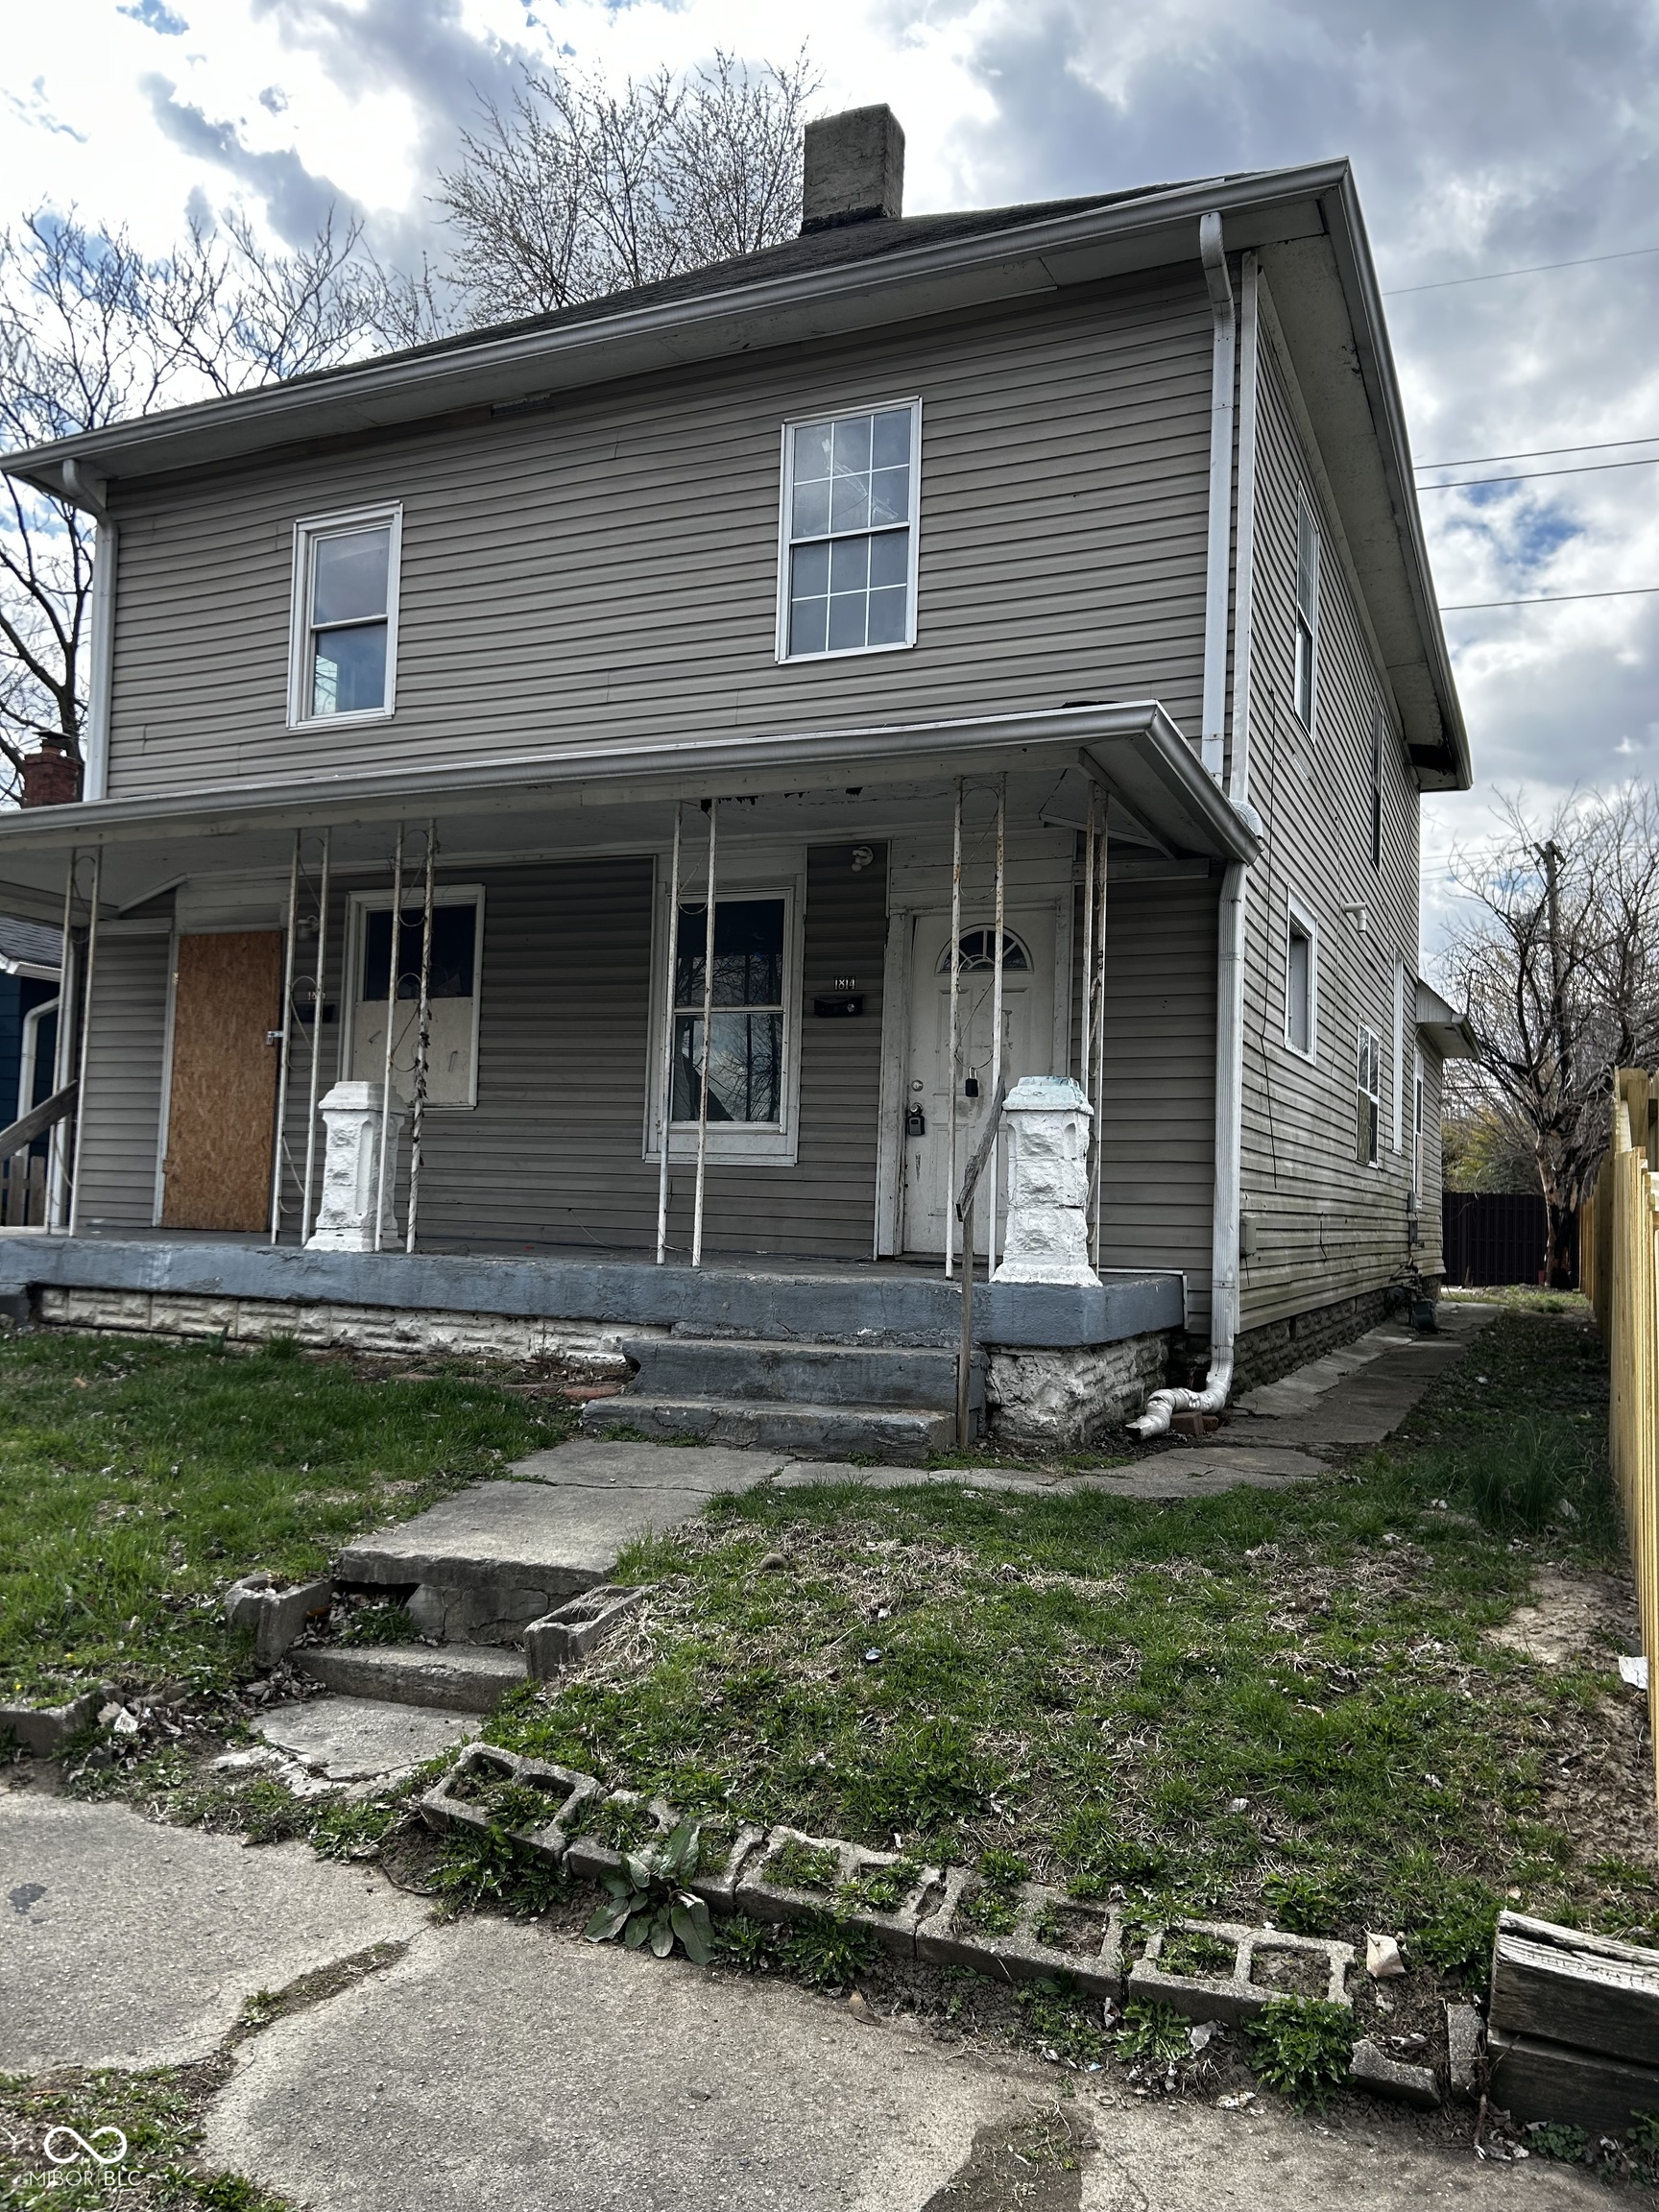
Active
$130,000
3
bds
|
0
ba
|
0
sqft
|
built
1922
1816 Olive St, Indianapolis, IN 46203
$93
Cash flow
3.7%
Cash-on-Cash Return
7.0%
Cap rate
0.8%
Rent to Value Ratio
Active
$65,000
3
bds
|
1
ba
|
1,108
sqft
|
built
1947
4210 E Naomi St, Indianapolis, IN 46203
$966
Cash flow
17.3%
Cash-on-Cash Return
17.8%
Cap rate
2.2%
Rent to Value Ratio
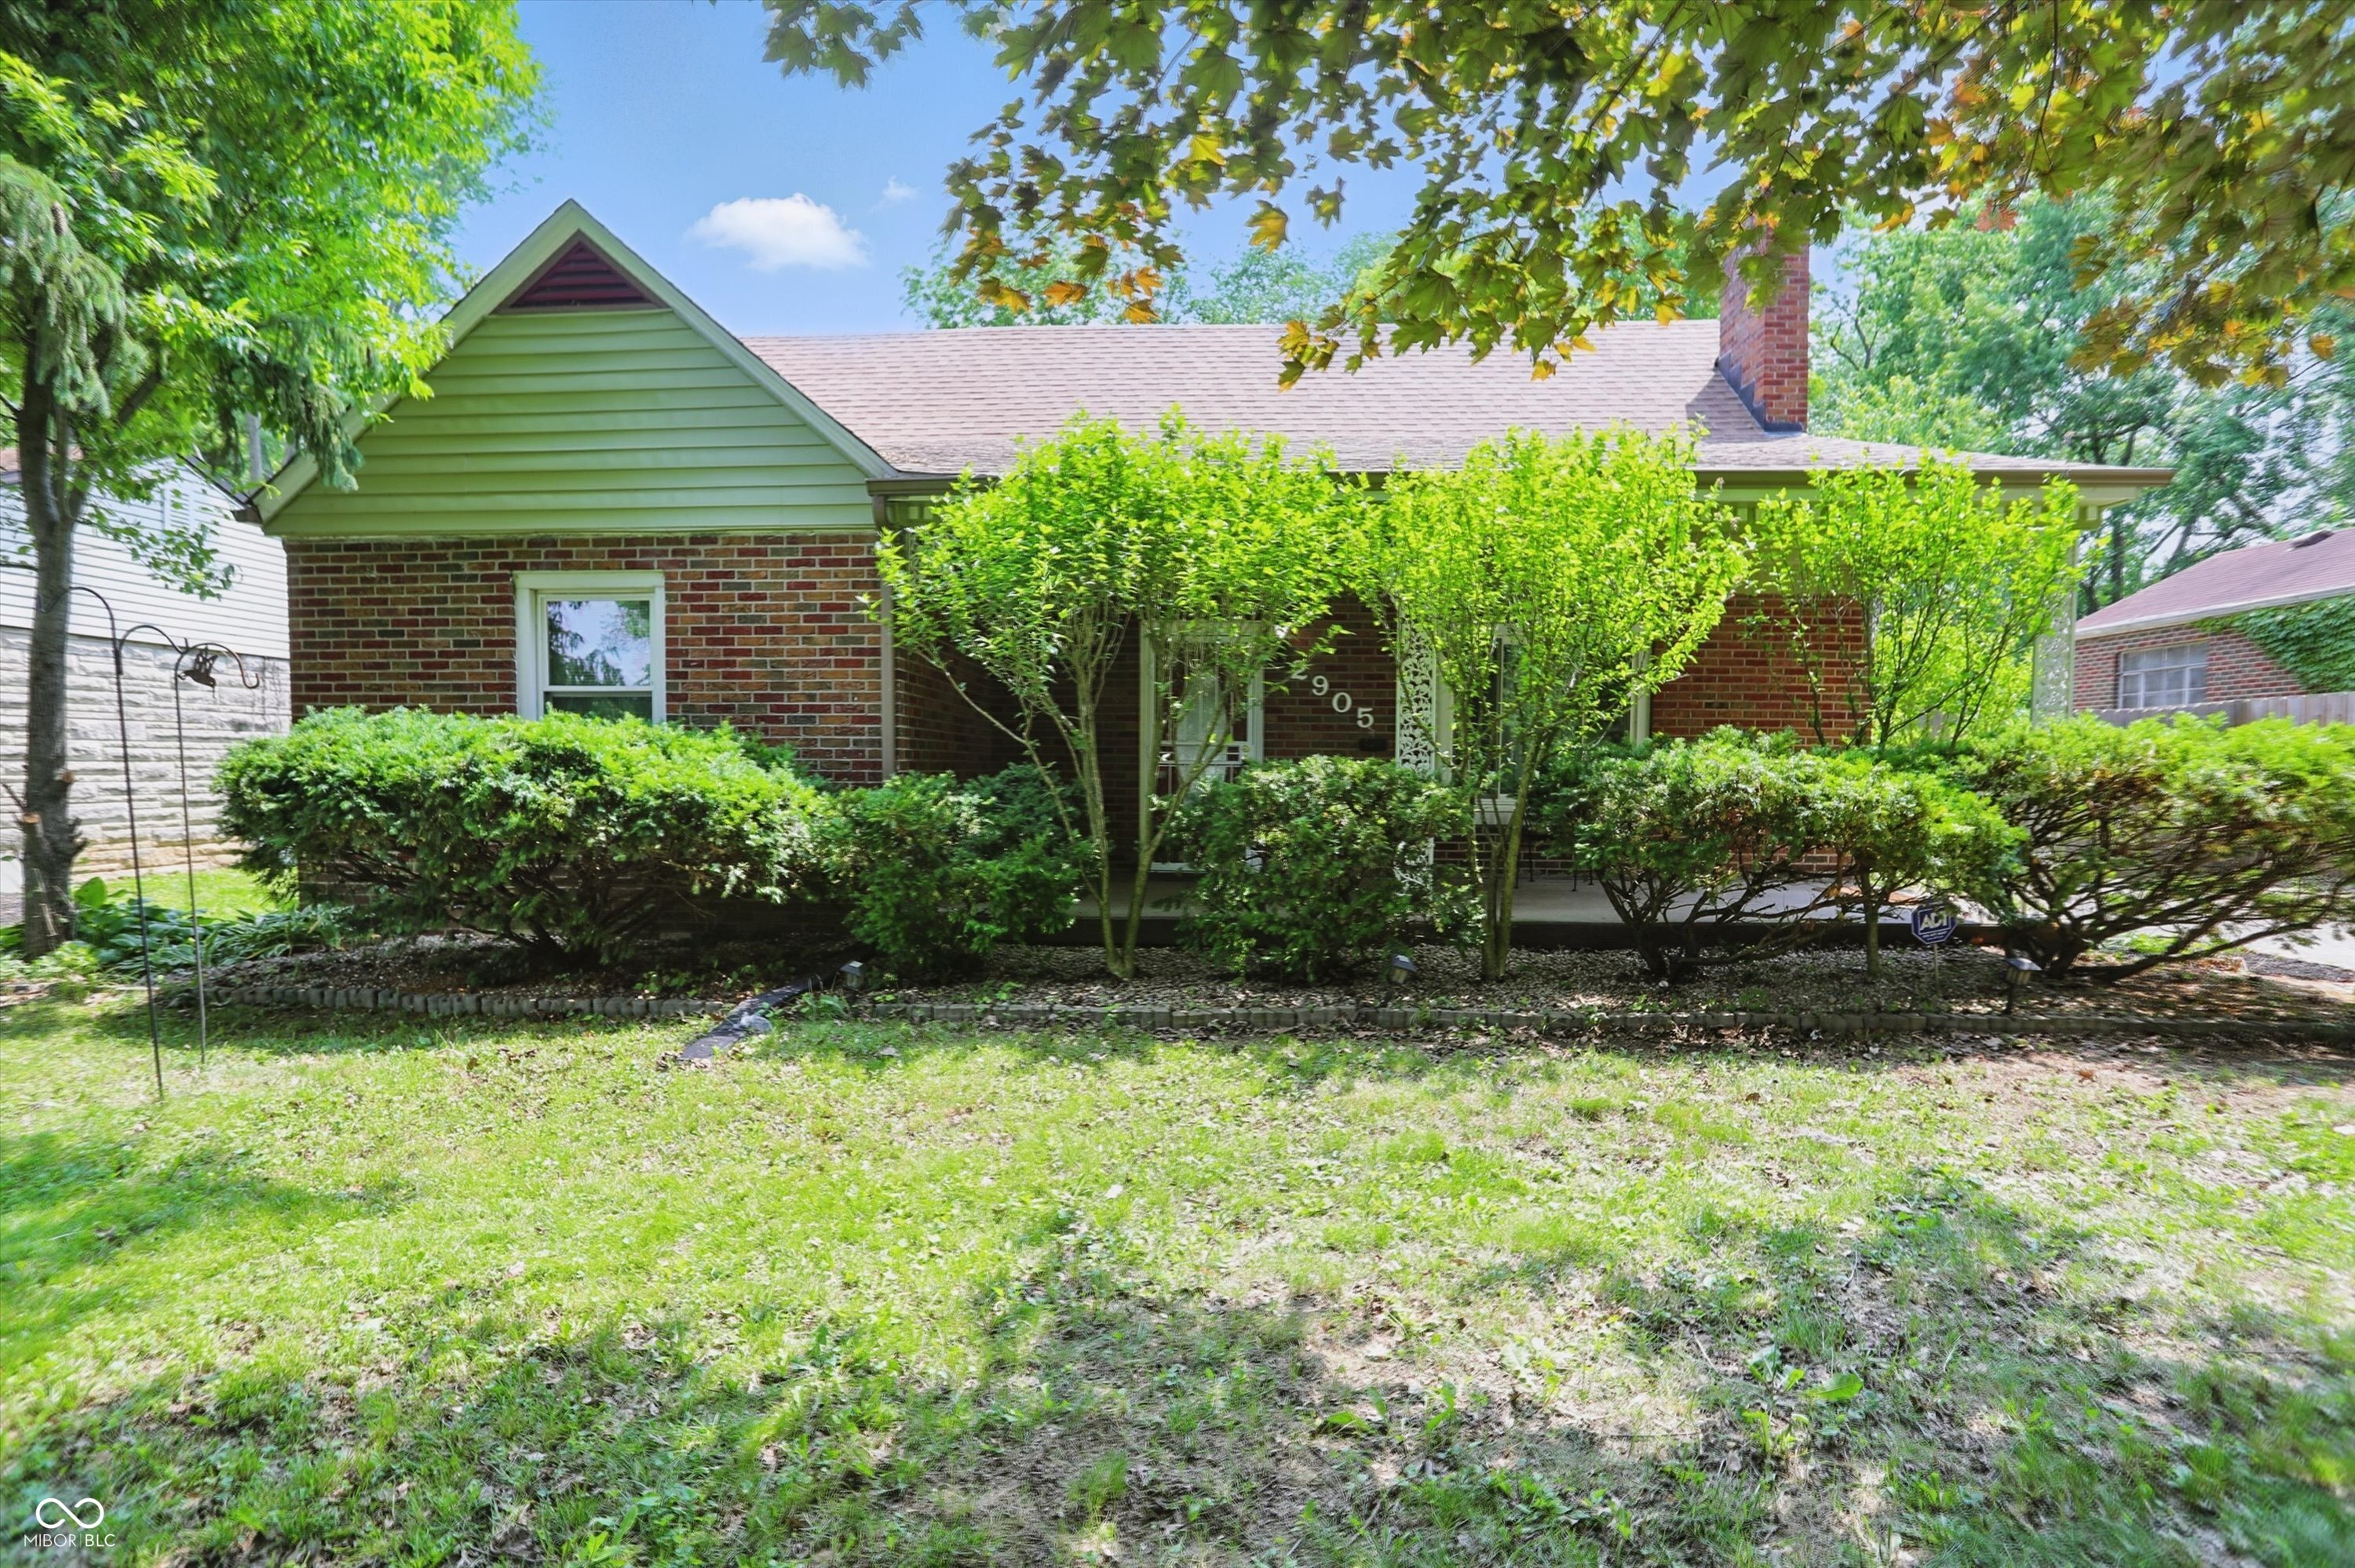
Active
$265,000
4
bds
|
2
ba
|
1,634
sqft
|
built
1949
2905 N Warman Ave, Indianapolis, IN 46222
$161
Cash flow
3.2%
Cash-on-Cash Return
6.9%
Cap rate
0.8%
Rent to Value Ratio
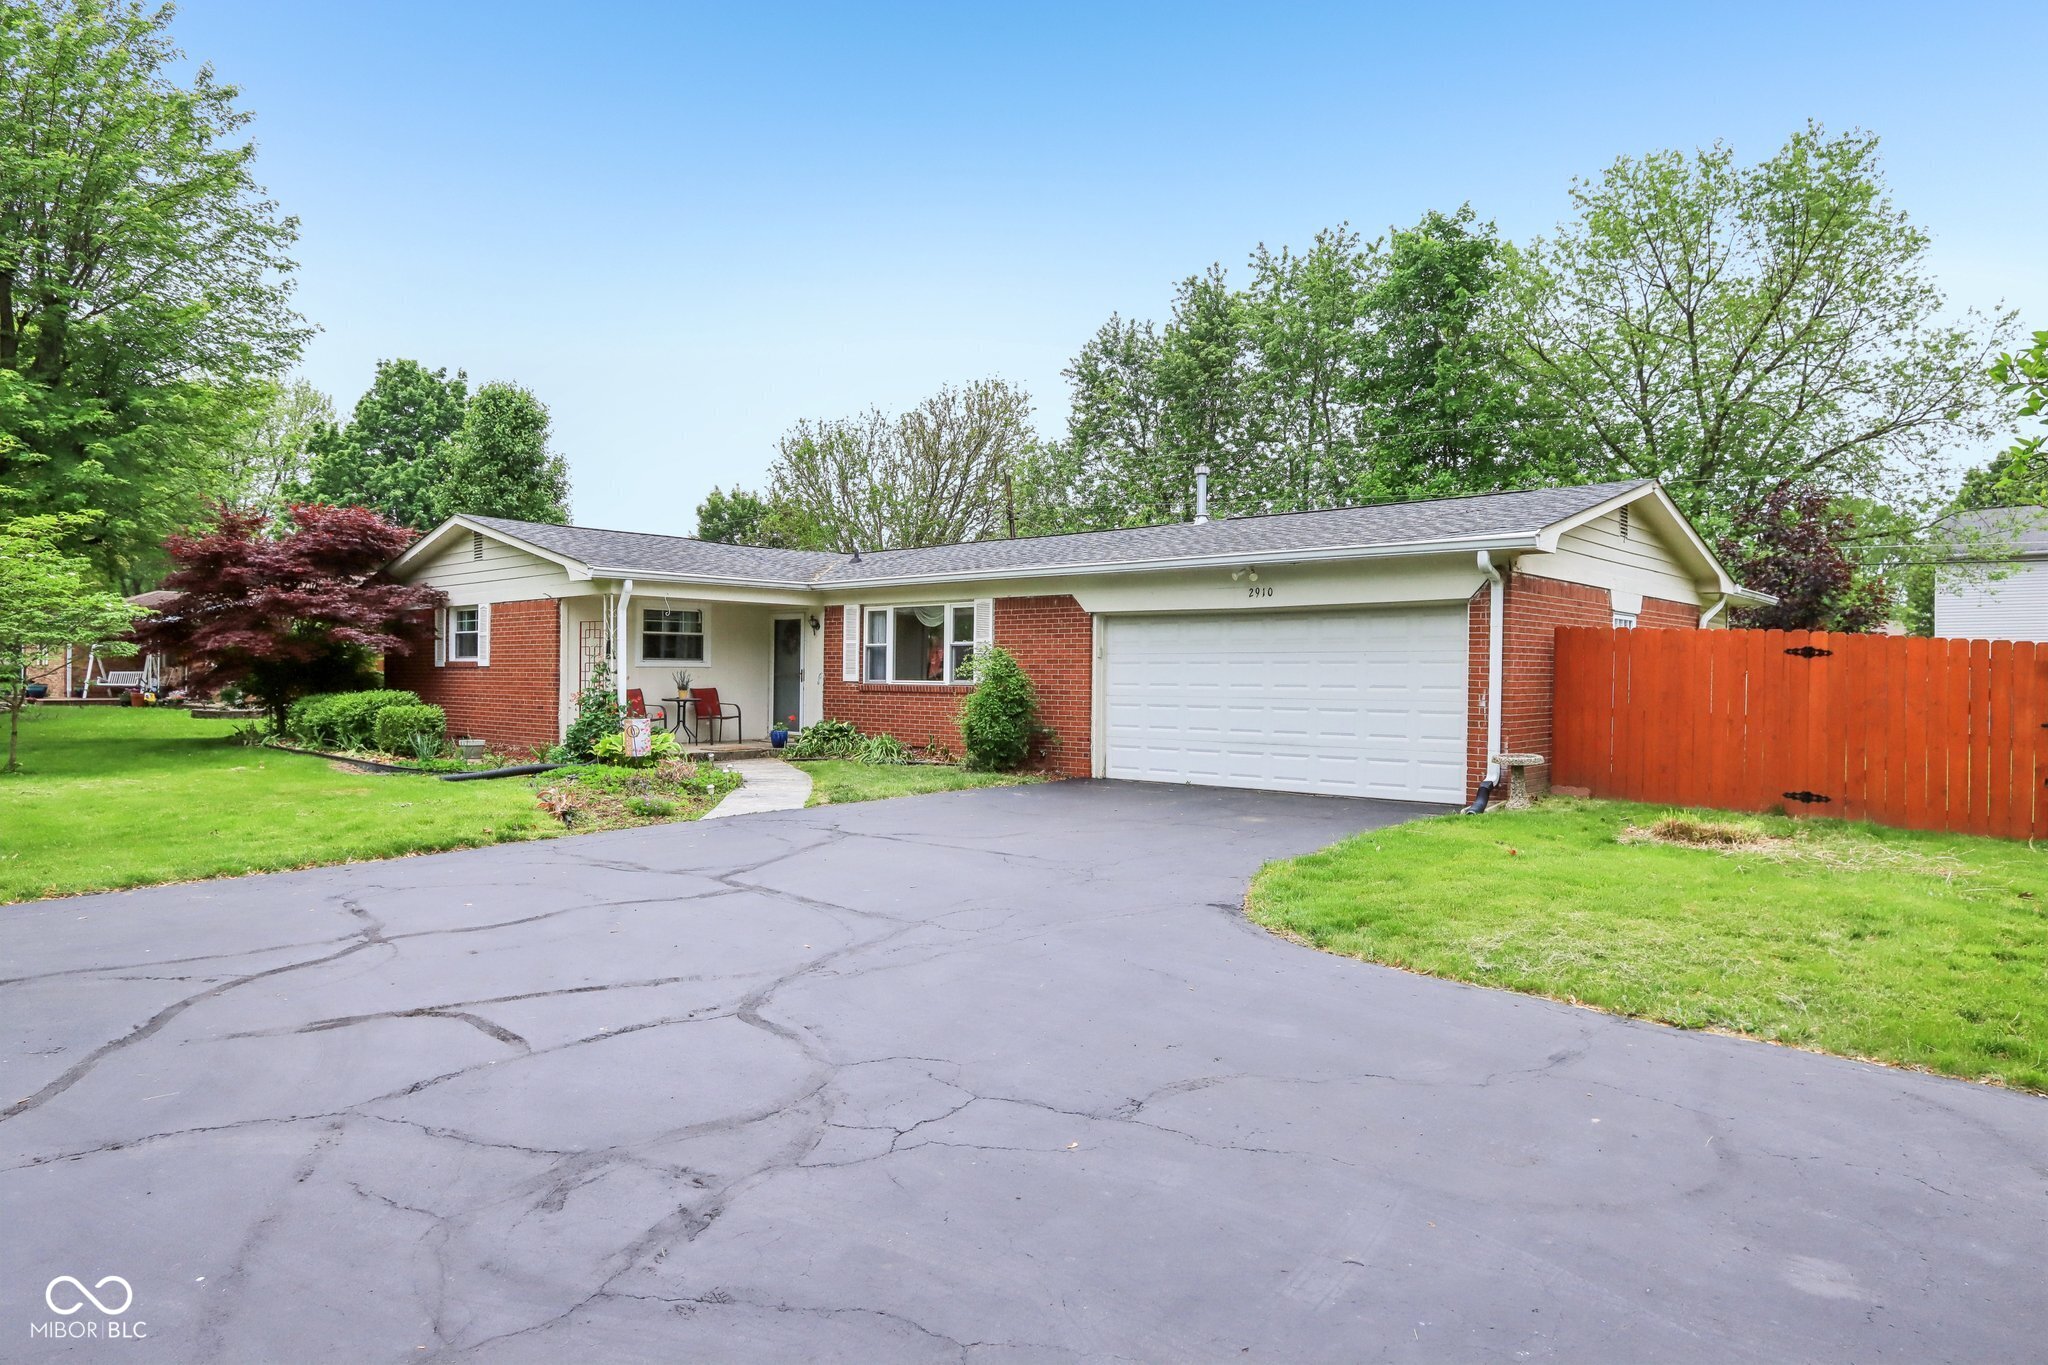
Pending
$265,000
4
bds
|
2
ba
|
2,043
sqft
|
built
1963
2910 S Sheridan Ave, Indianapolis, IN 46203
$-115
Cash flow
-2.3%
Cash-on-Cash Return
5.6%
Cap rate
0.7%
Rent to Value Ratio
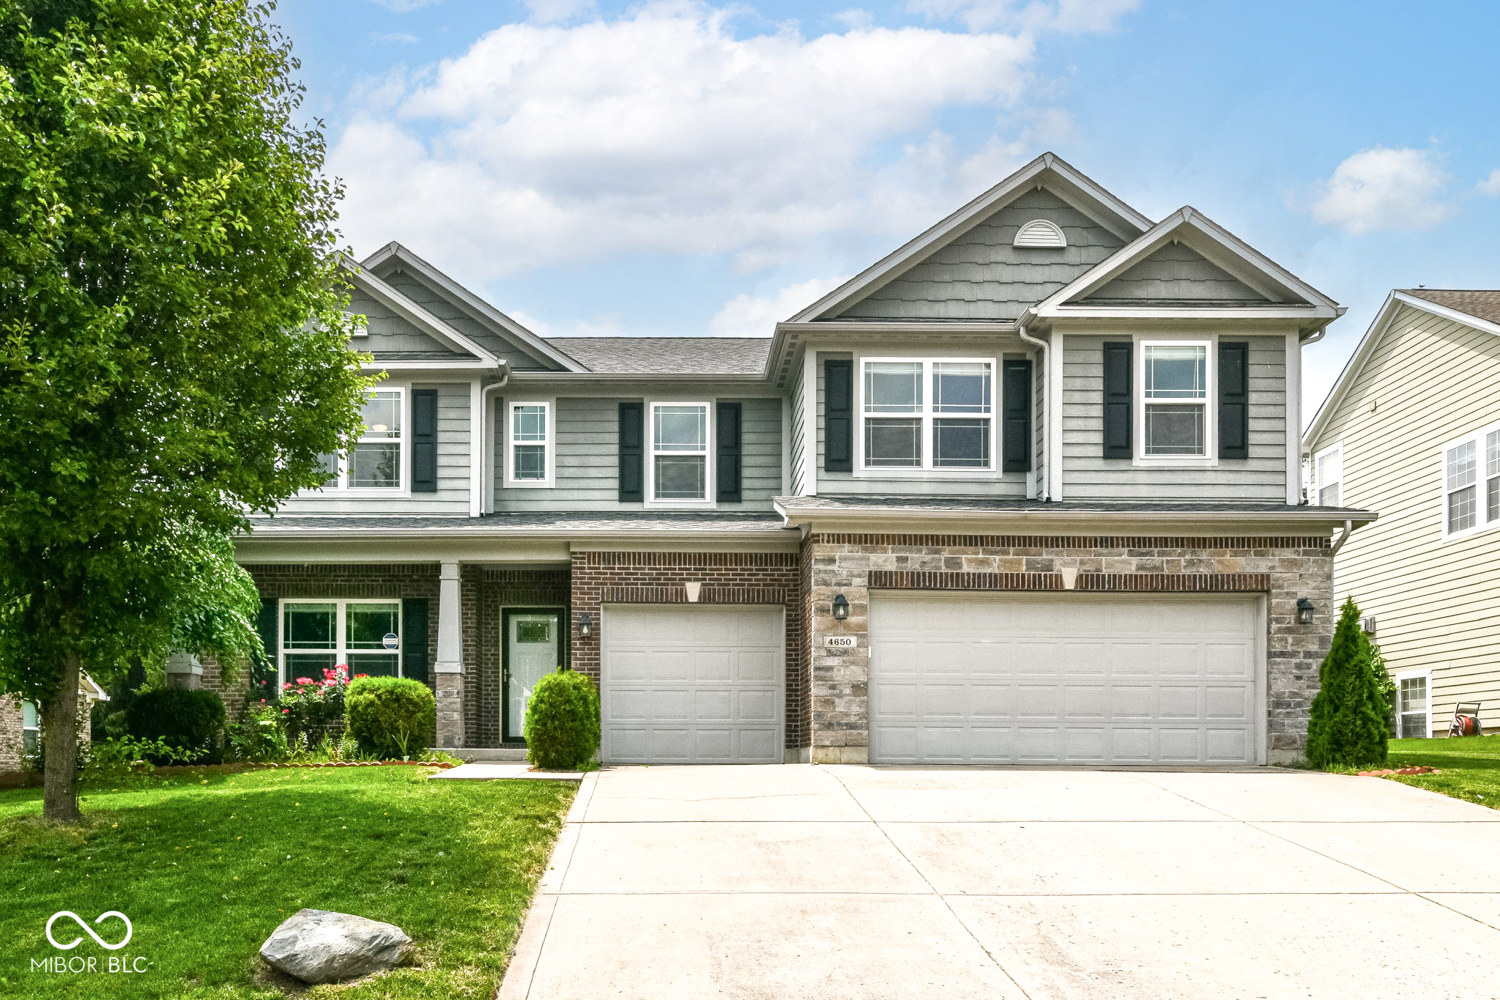
Active
$400,000
5
bds
|
3
ba
|
3,112
sqft
|
built
2013
4650 Blue Marlin Way, Indianapolis, IN 46239
$-146
Cash flow
-1.9%
Cash-on-Cash Return
5.7%
Cap rate
0.7%
Rent to Value Ratio
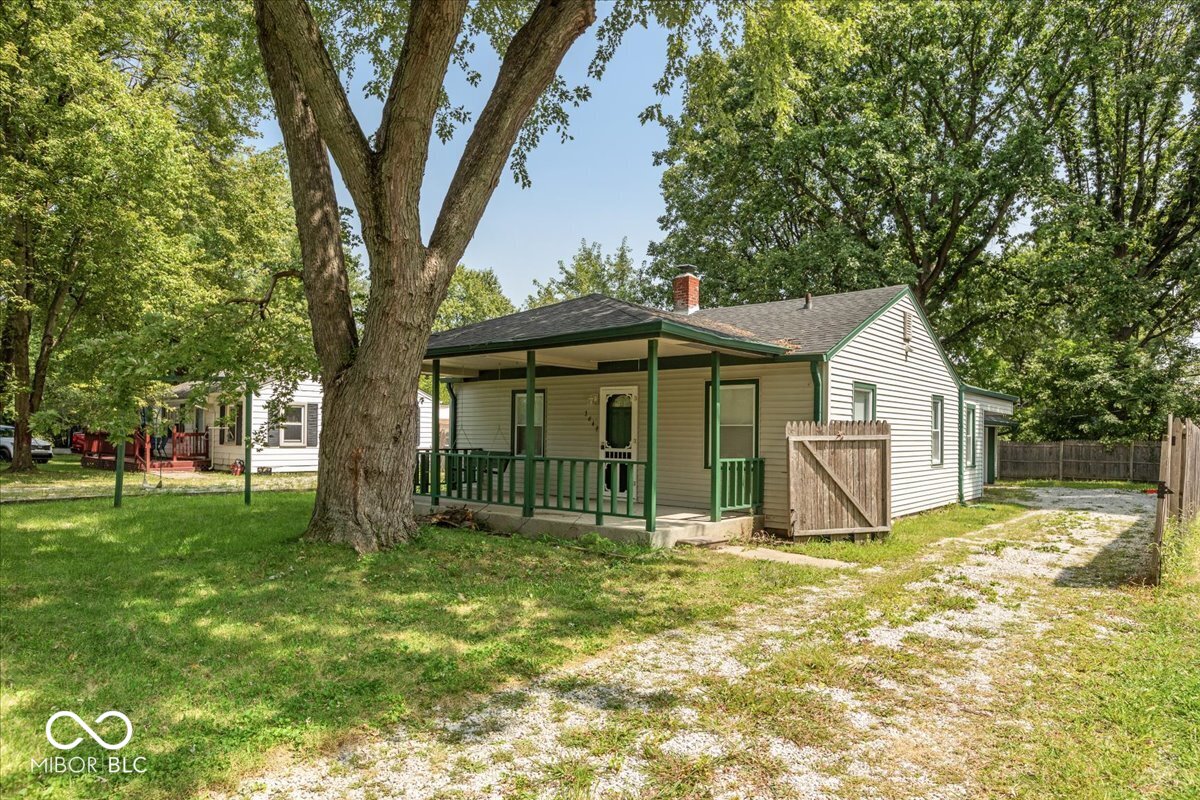
Active
$185,000
3
bds
|
1
ba
|
1,224
sqft
|
built
1954
3649 N Sadlier Dr, Indianapolis, IN 46226
$156
Cash flow
4.4%
Cash-on-Cash Return
7.2%
Cap rate
0.9%
Rent to Value Ratio
Active
$292,000
3
bds
|
2
ba
|
1,668
sqft
|
built
1952
6047 W 56th St, Indianapolis, IN 46254
$-254
Cash flow
-4.5%
Cash-on-Cash Return
5.1%
Cap rate
0.6%
Rent to Value Ratio
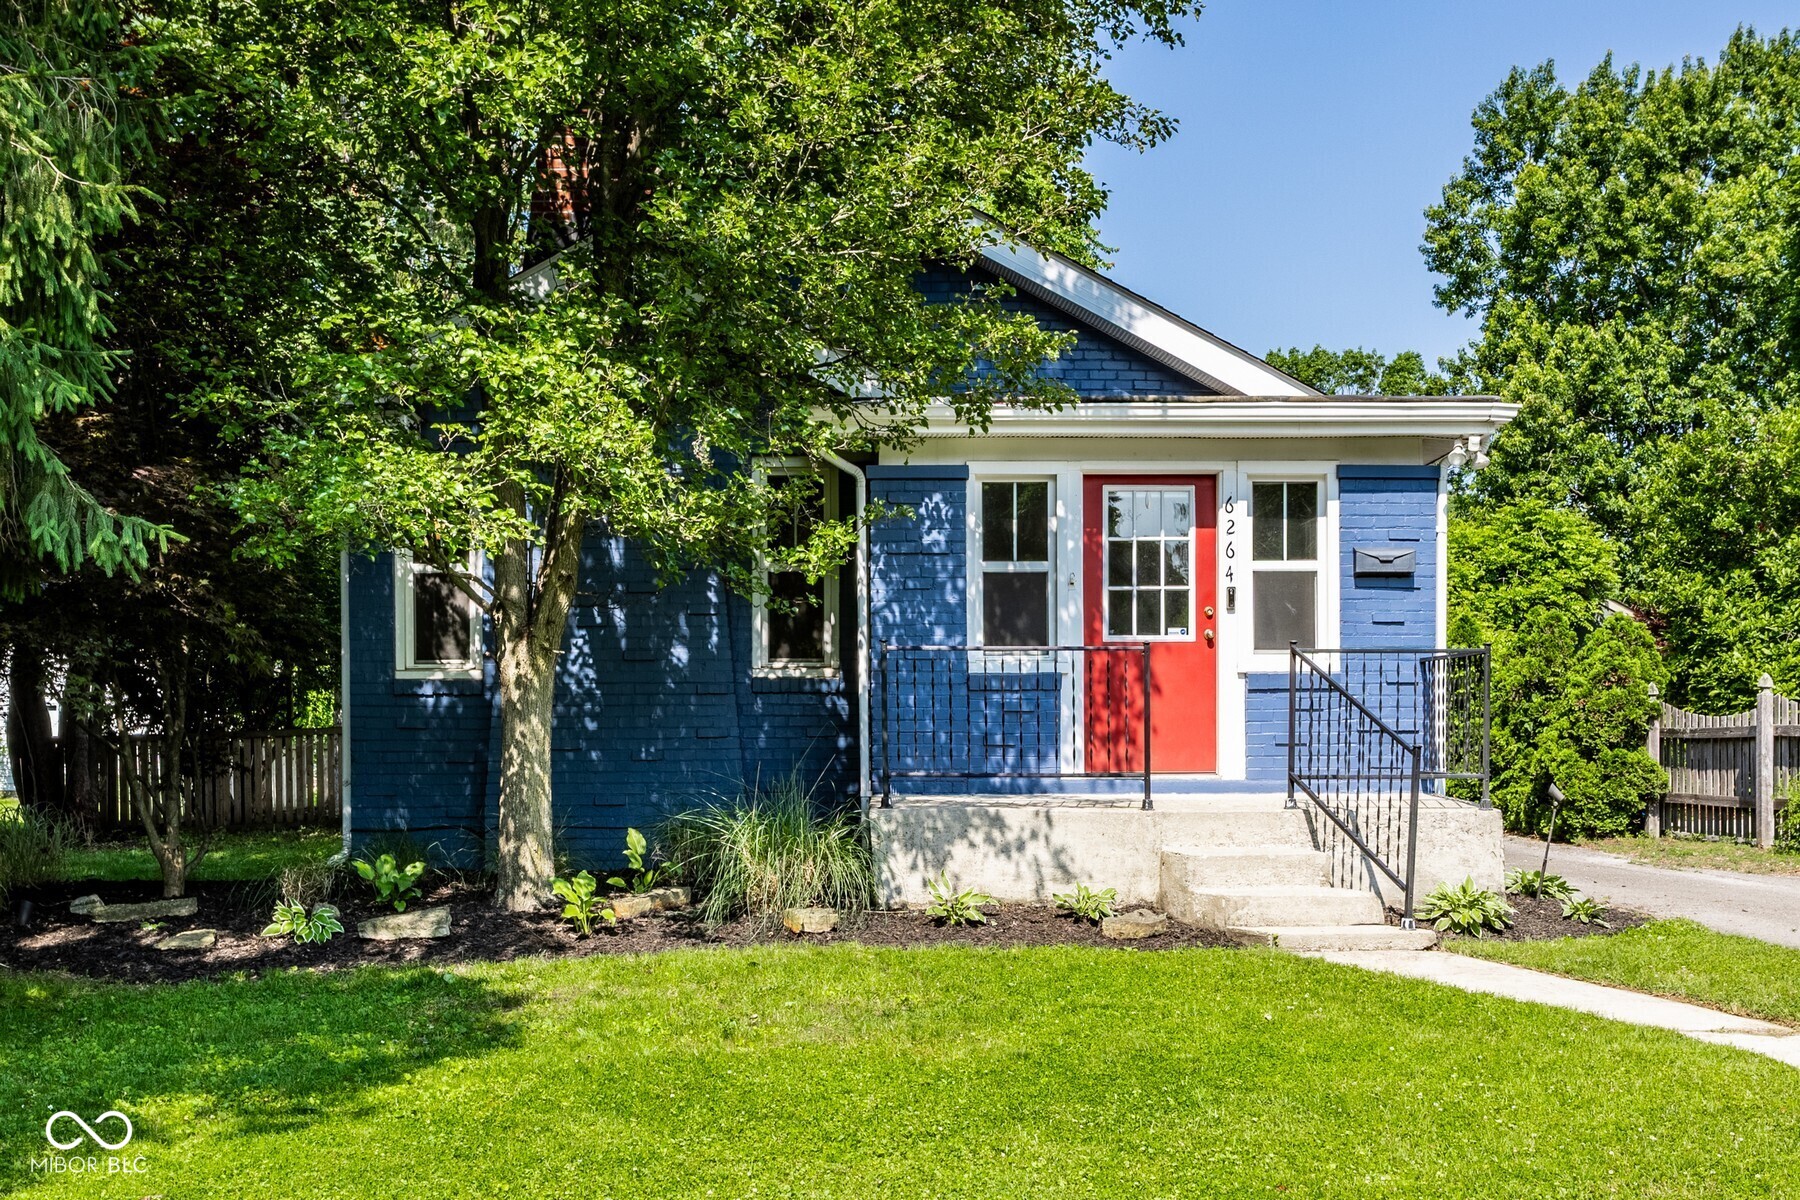
Pending
$335,000
2
bds
|
1
ba
|
900
sqft
|
built
1928
6264 Central Ave, Indianapolis, IN 46220
$9
Cash flow
0.1%
Cash-on-Cash Return
6.2%
Cap rate
0.7%
Rent to Value Ratio
Pending
$300,000
3
bds
|
3
ba
|
2,032
sqft
|
built
2004
10432 Dark Star Dr, Indianapolis, IN 46234
$-199
Cash flow
-3.5%
Cash-on-Cash Return
5.4%
Cap rate
0.7%
Rent to Value Ratio
Active
$275,000
2
bds
|
2
ba
|
1,428
sqft
|
built
1985
7707 River Rd, Indianapolis, IN 46240
$-429
Cash flow
-8.1%
Cash-on-Cash Return
4.3%
Cap rate
0.7%
Rent to Value Ratio
Active
$233,900
5
bds
|
2
ba
|
2,053
sqft
|
built
1964
4020 N Mitthoefer Rd, Indianapolis, IN 46235
$-94
Cash flow
-2.1%
Cash-on-Cash Return
5.7%
Cap rate
0.7%
Rent to Value Ratio
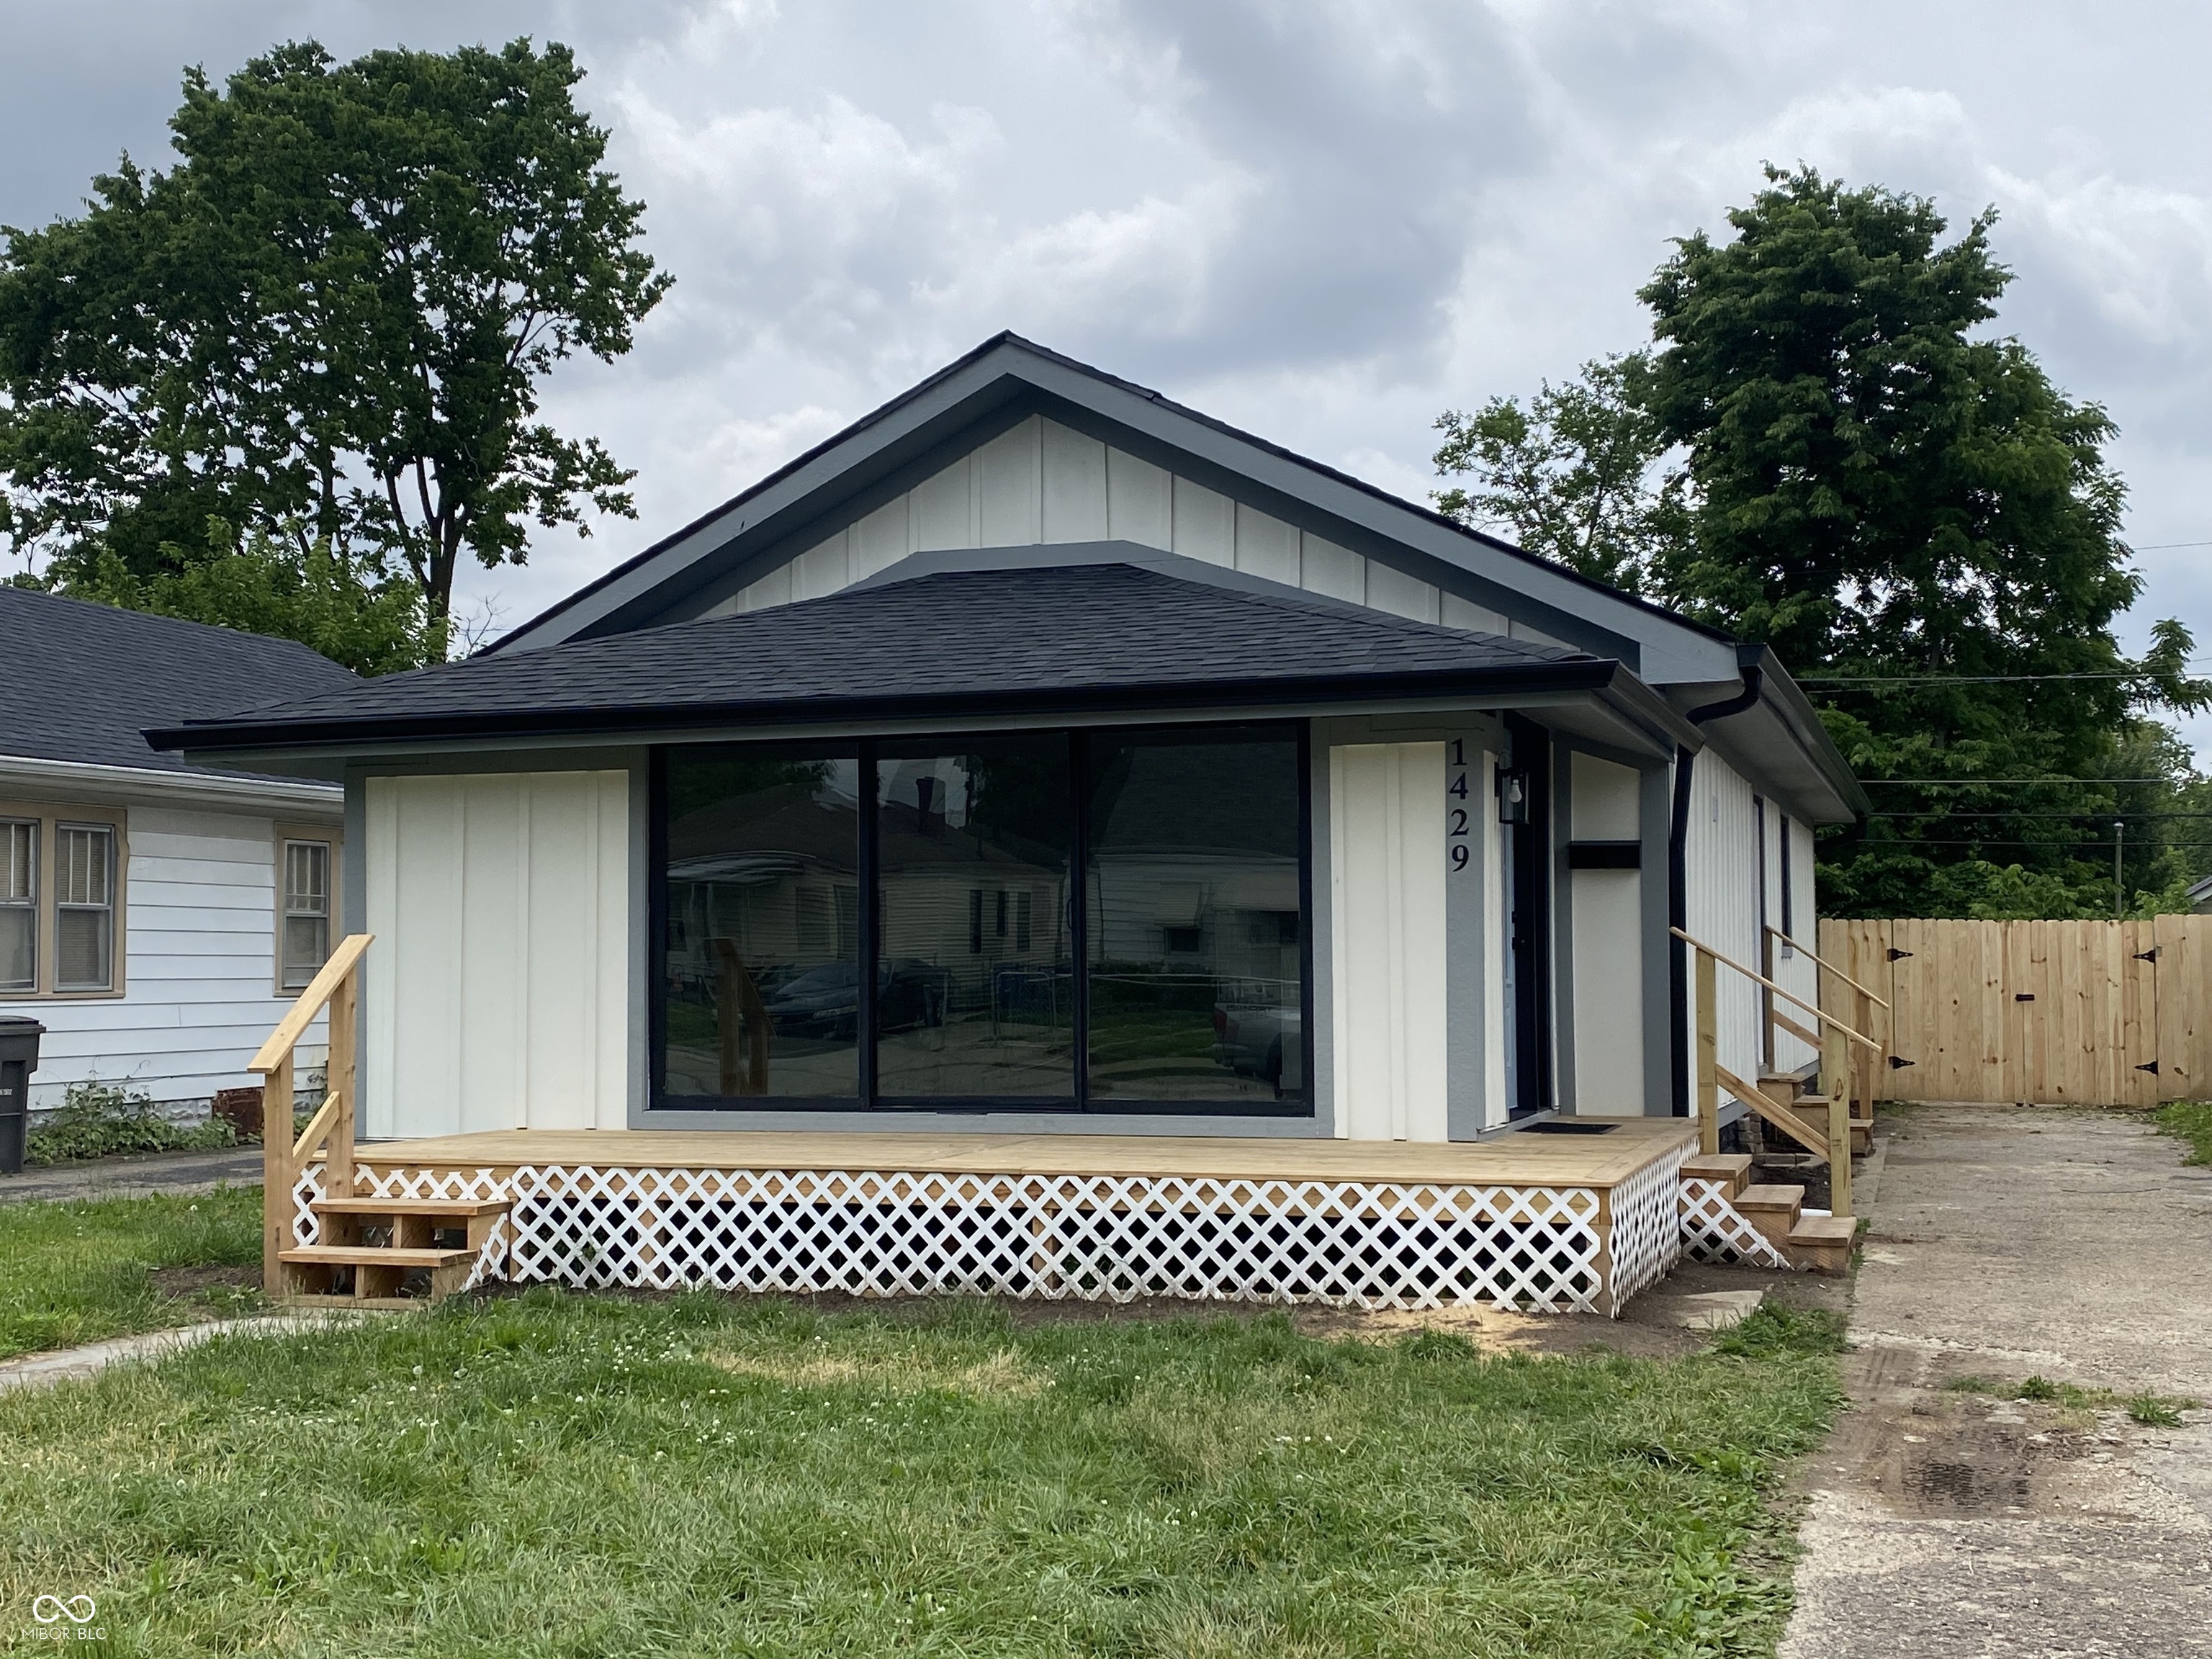
Active
$259,000
4
bds
|
3
ba
|
1,411
sqft
|
built
1931
1429 Udell St, Indianapolis, IN 46208
$-361
Cash flow
-7.3%
Cash-on-Cash Return
4.5%
Cap rate
0.5%
Rent to Value Ratio
Pending
$220,000
4
bds
|
3
ba
|
1,740
sqft
|
built
1995
5826 Buck Rill Dr, Indianapolis, IN 46237
$115
Cash flow
2.7%
Cash-on-Cash Return
6.8%
Cap rate
0.8%
Rent to Value Ratio