Indianapolis, IN Investment Properties for Sale
Browse homes for sale and investment properties in Indianapolis, IN. Refine your search by price, property type, or more.
Best cash flowing properties in Indianapolis, IN
Active
$43,000
bds
|
0
ba
|
576
sqft
|
built
1995
1254 S Leland Ave, Indianapolis, IN 46203
$759
Cash flow
20.6%
Cash-on-Cash Return
21.2%
Cap rate
2.6%
Rent to Value Ratio
Pending
$78,000
2
bds
|
1
ba
|
778
sqft
|
built
1955
1929 Wilcox St, Indianapolis, IN 46222
$566
Cash flow
37.9%
Cash-on-Cash Return
14.9%
Cap rate
1.8%
Rent to Value Ratio
1,974 out of 2,115 properties for sale in Indianapolis, IN
Limited Results Shown
Create a free account, or log in to reveal all property listings and enjoy the complete experience.
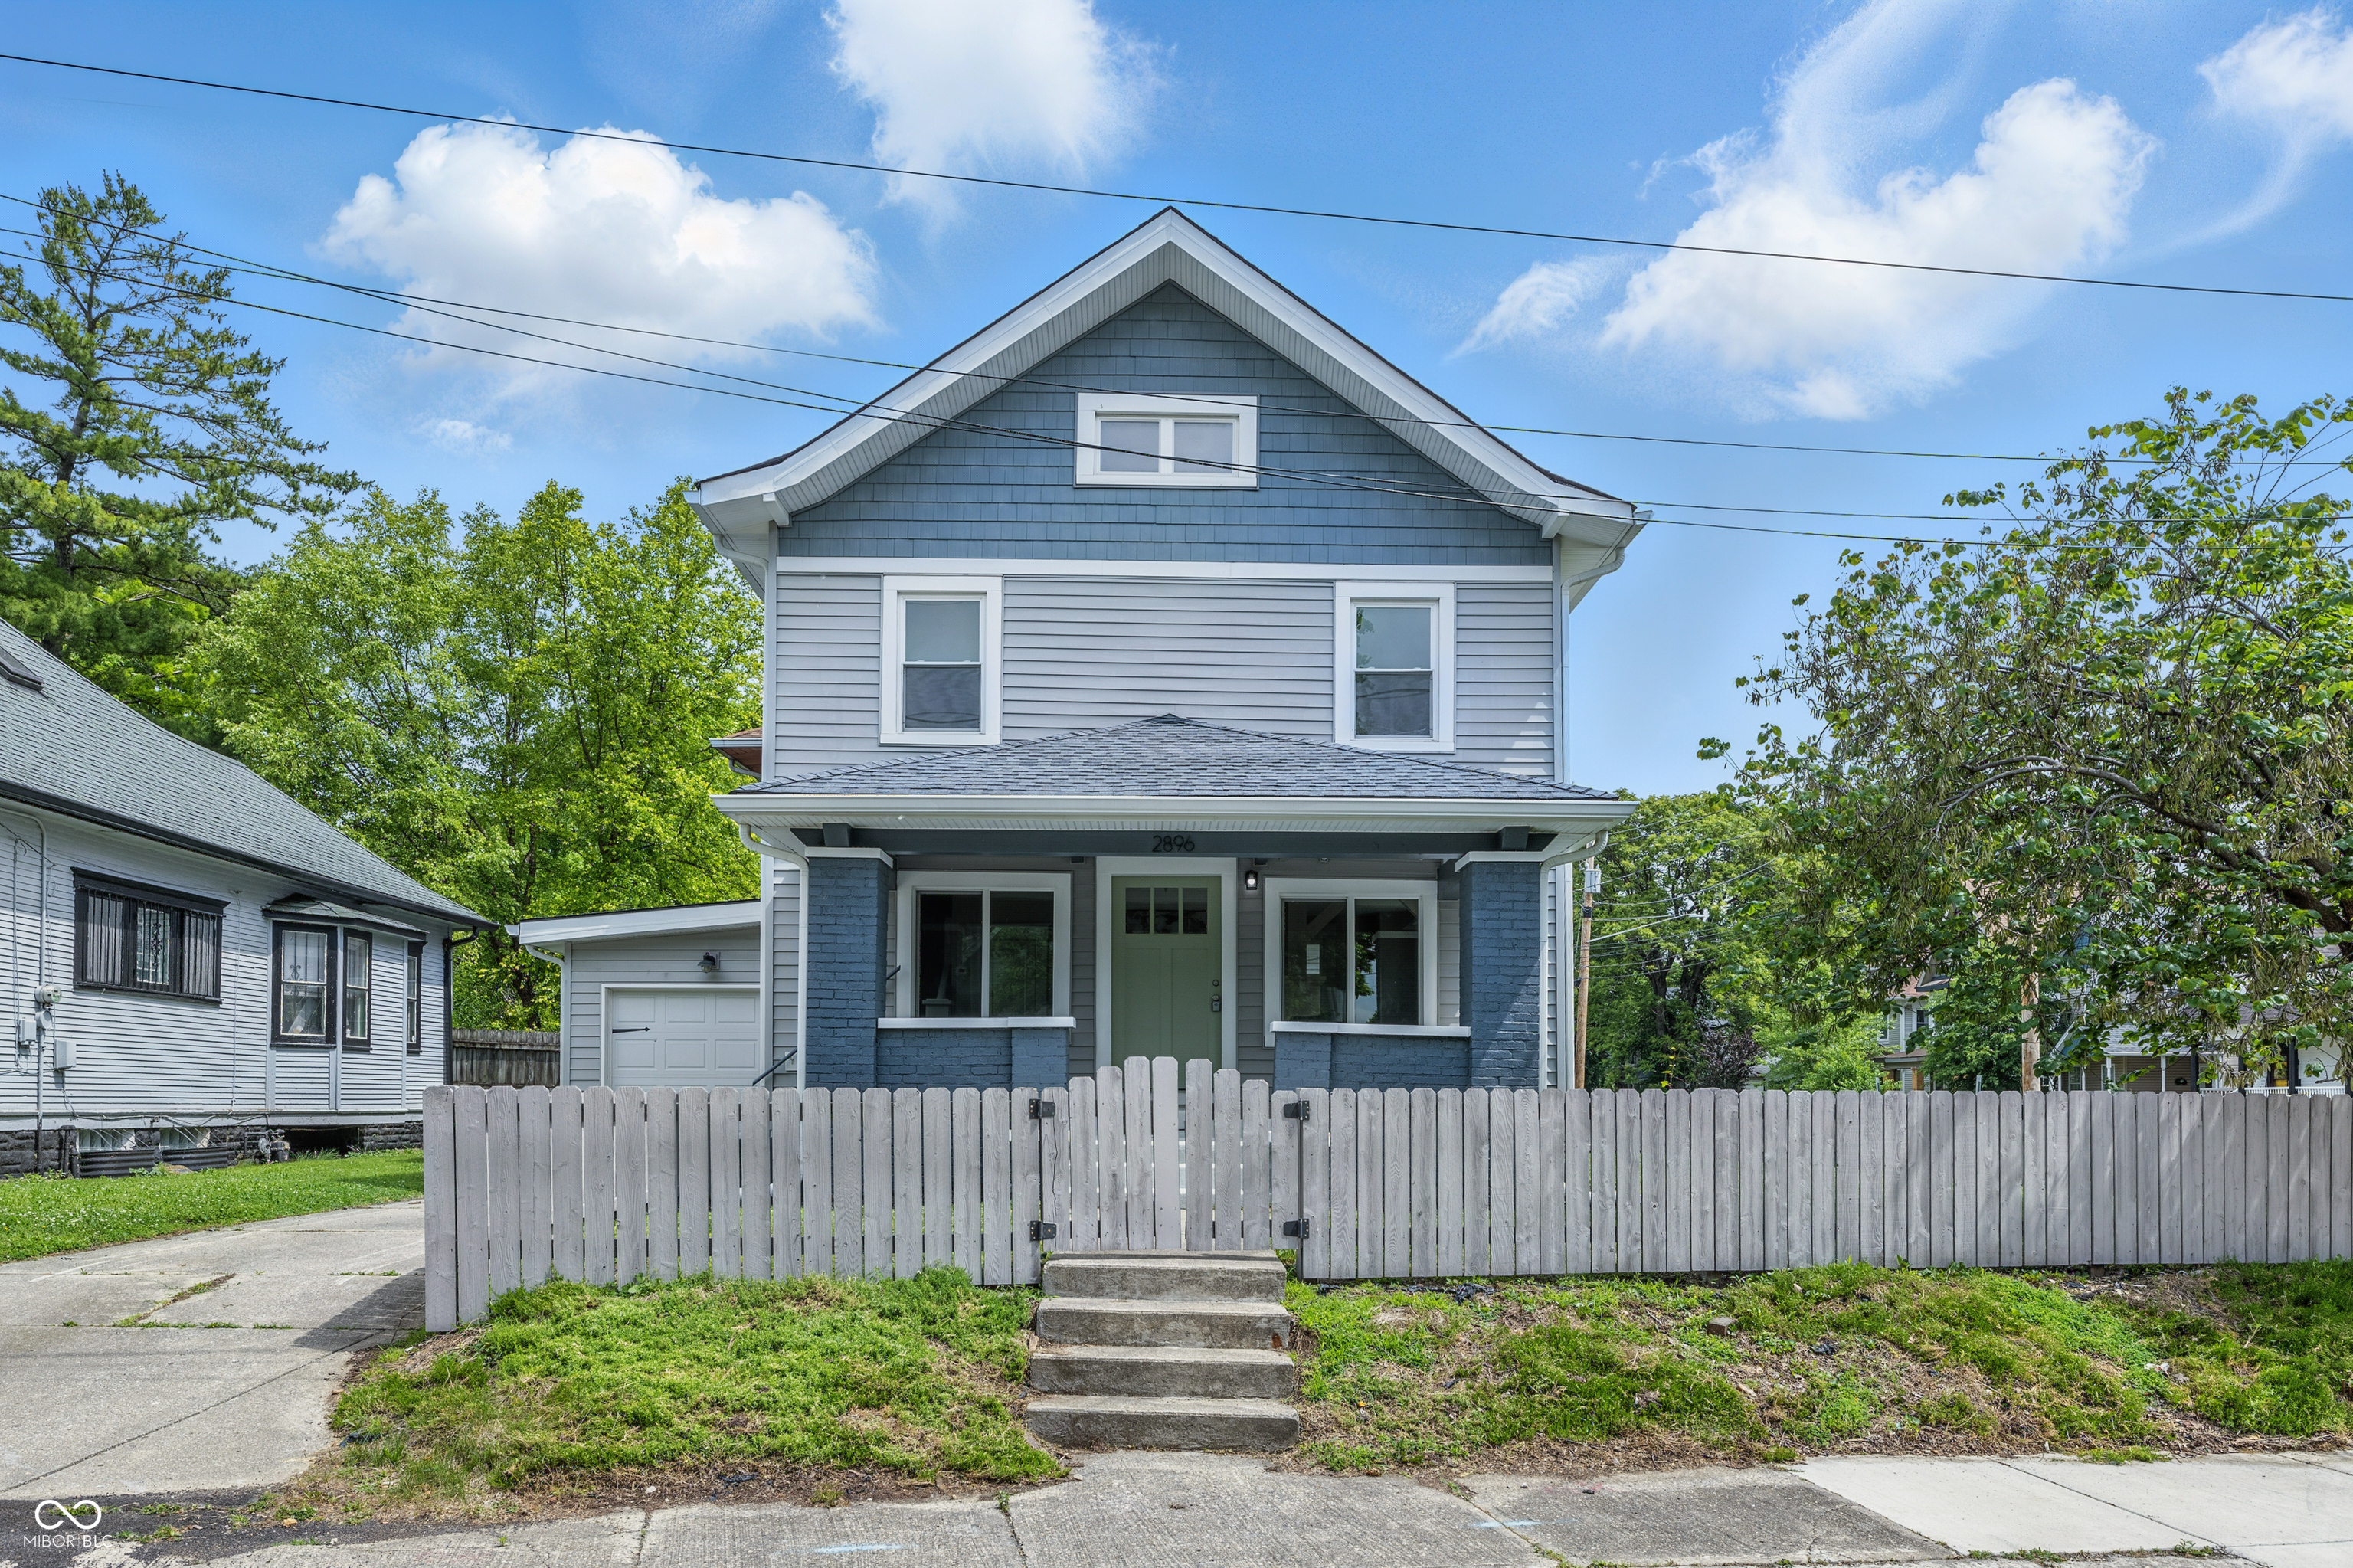
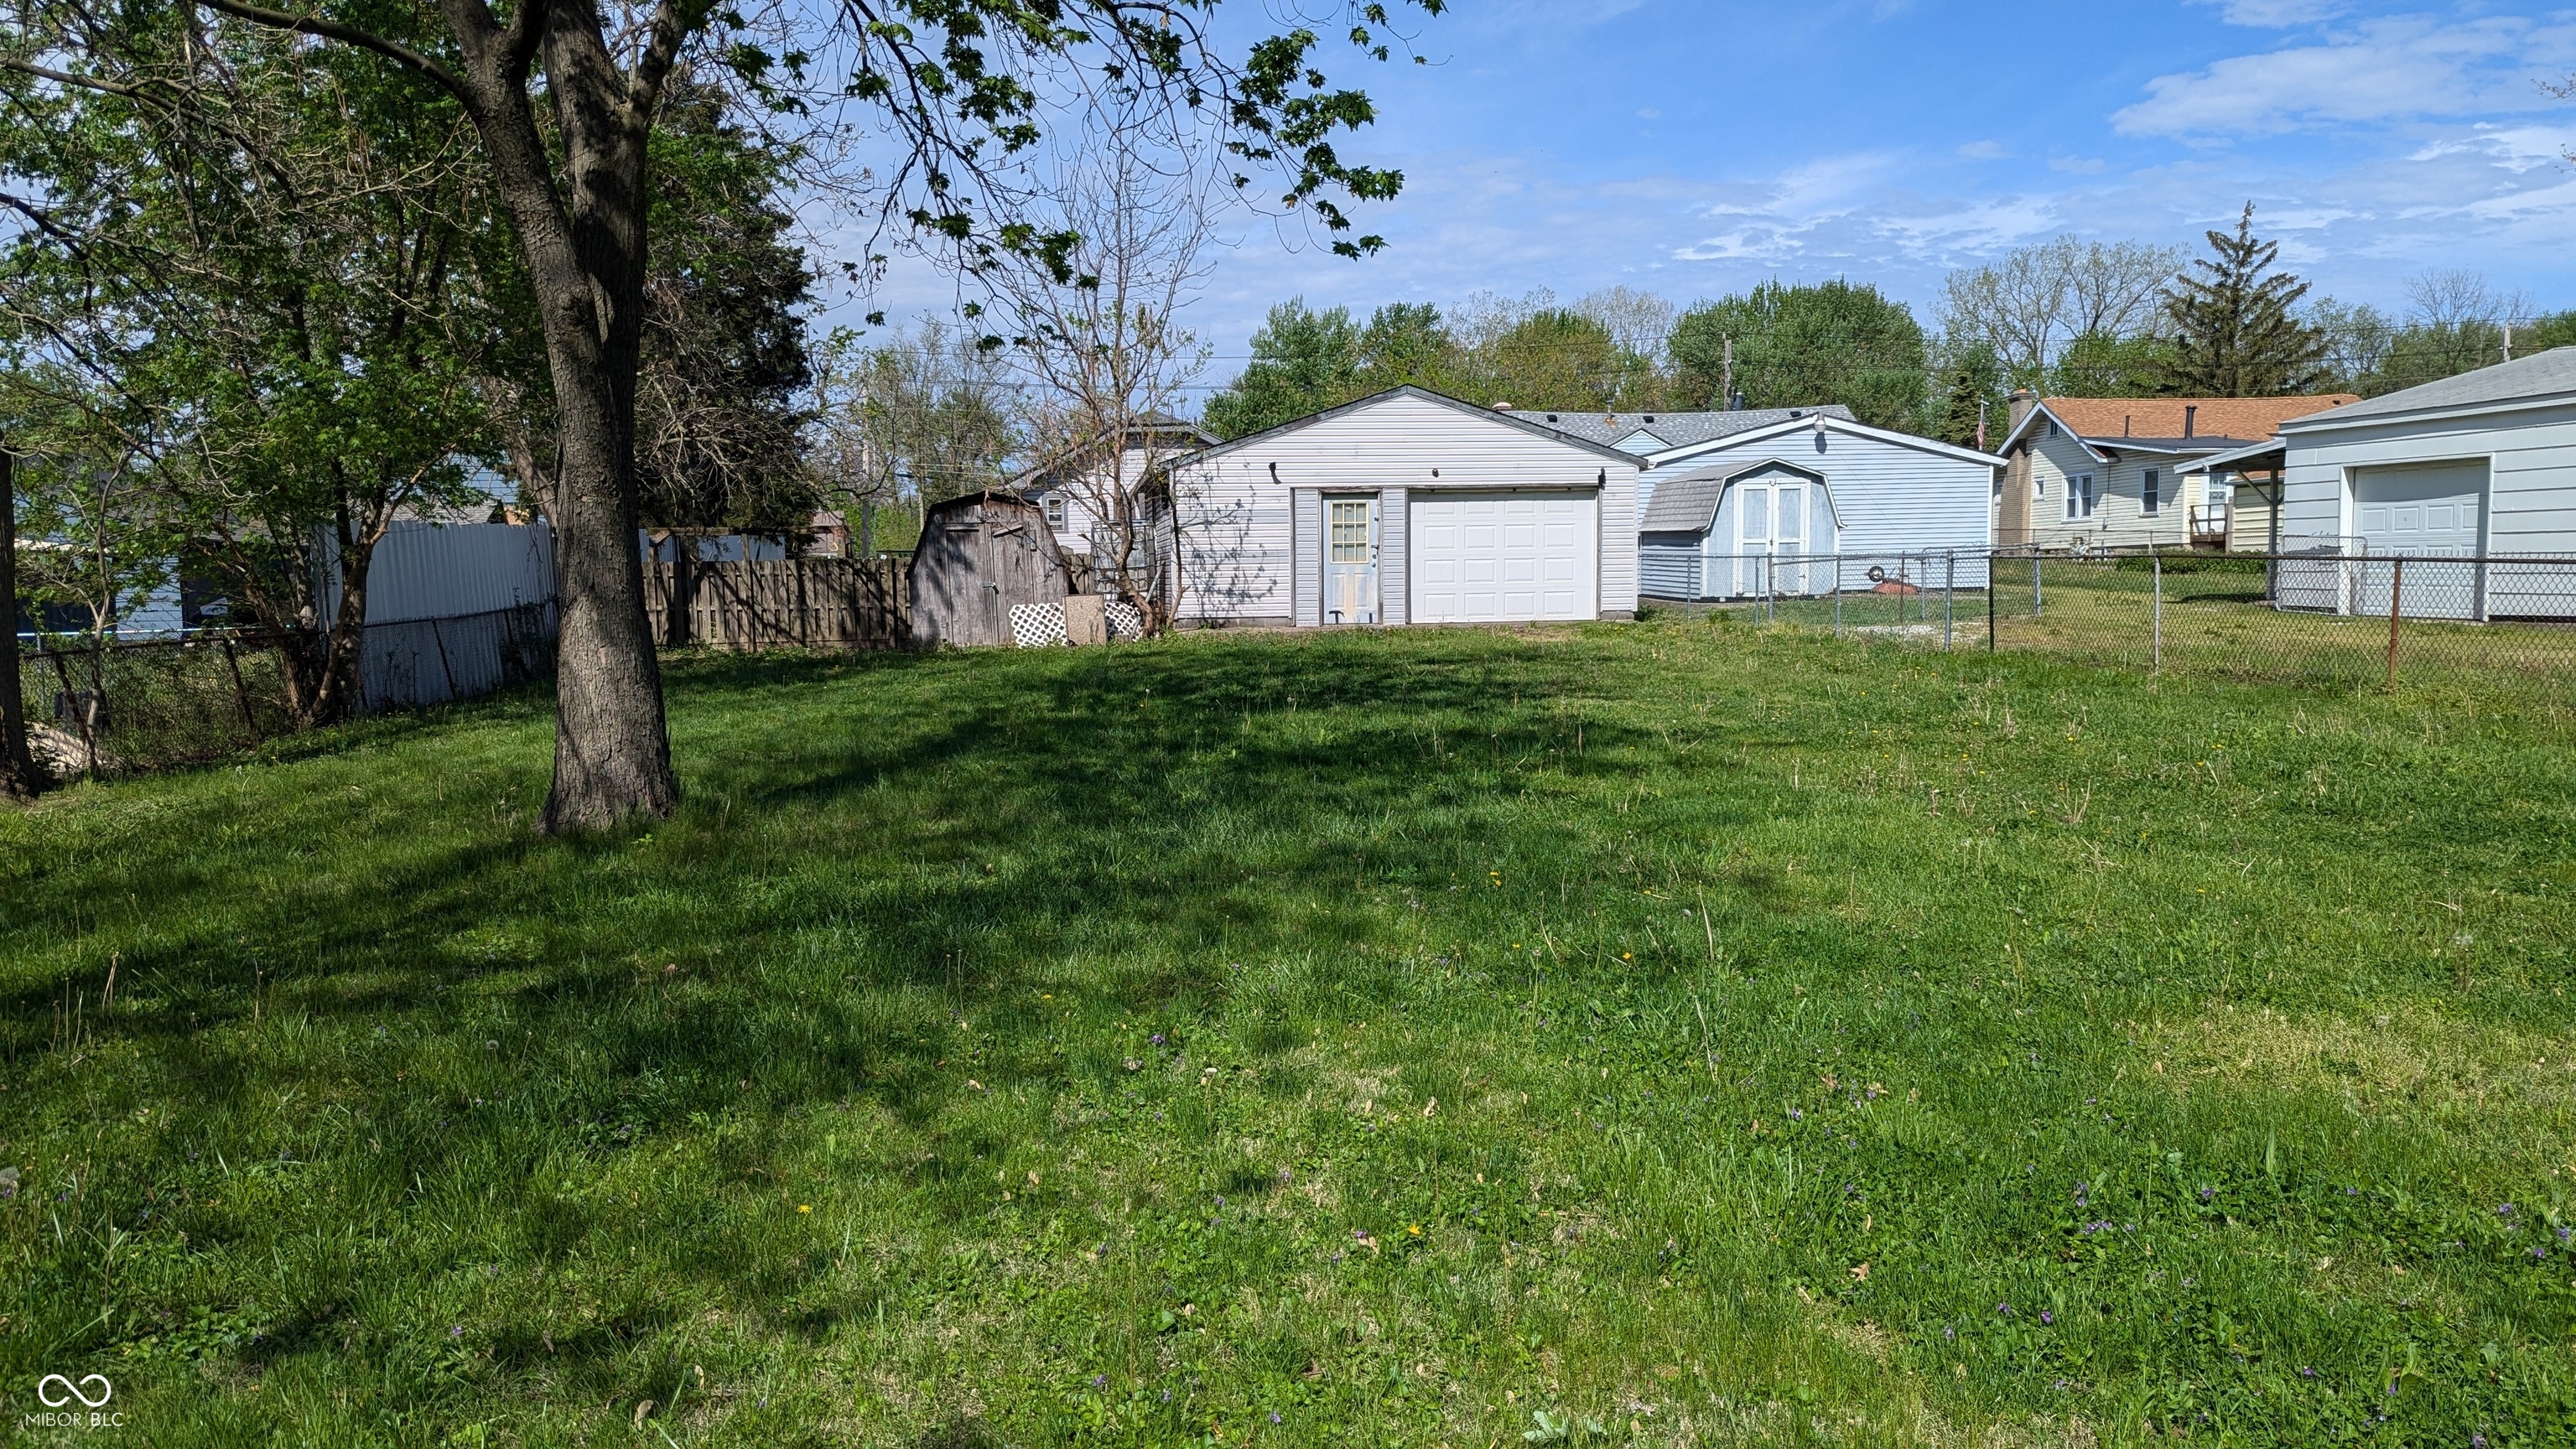
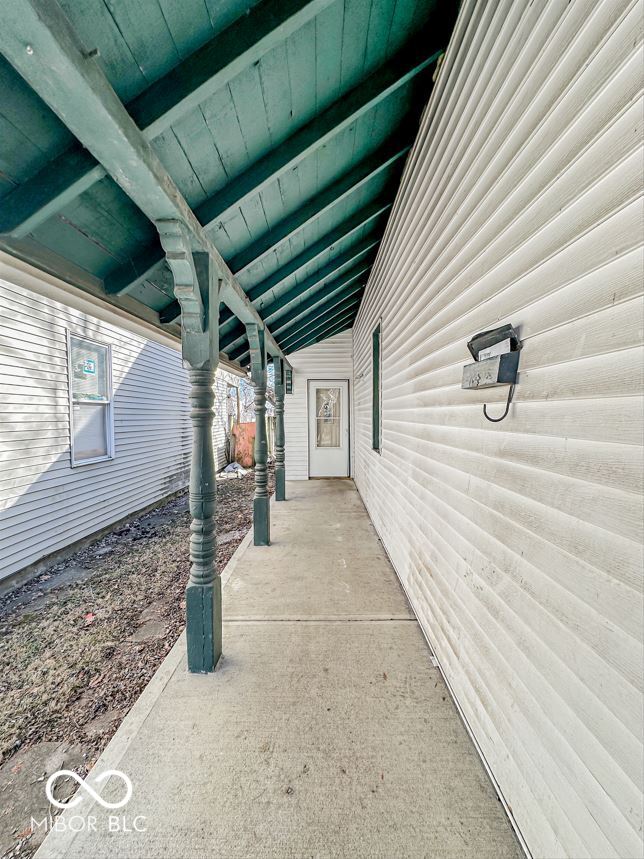
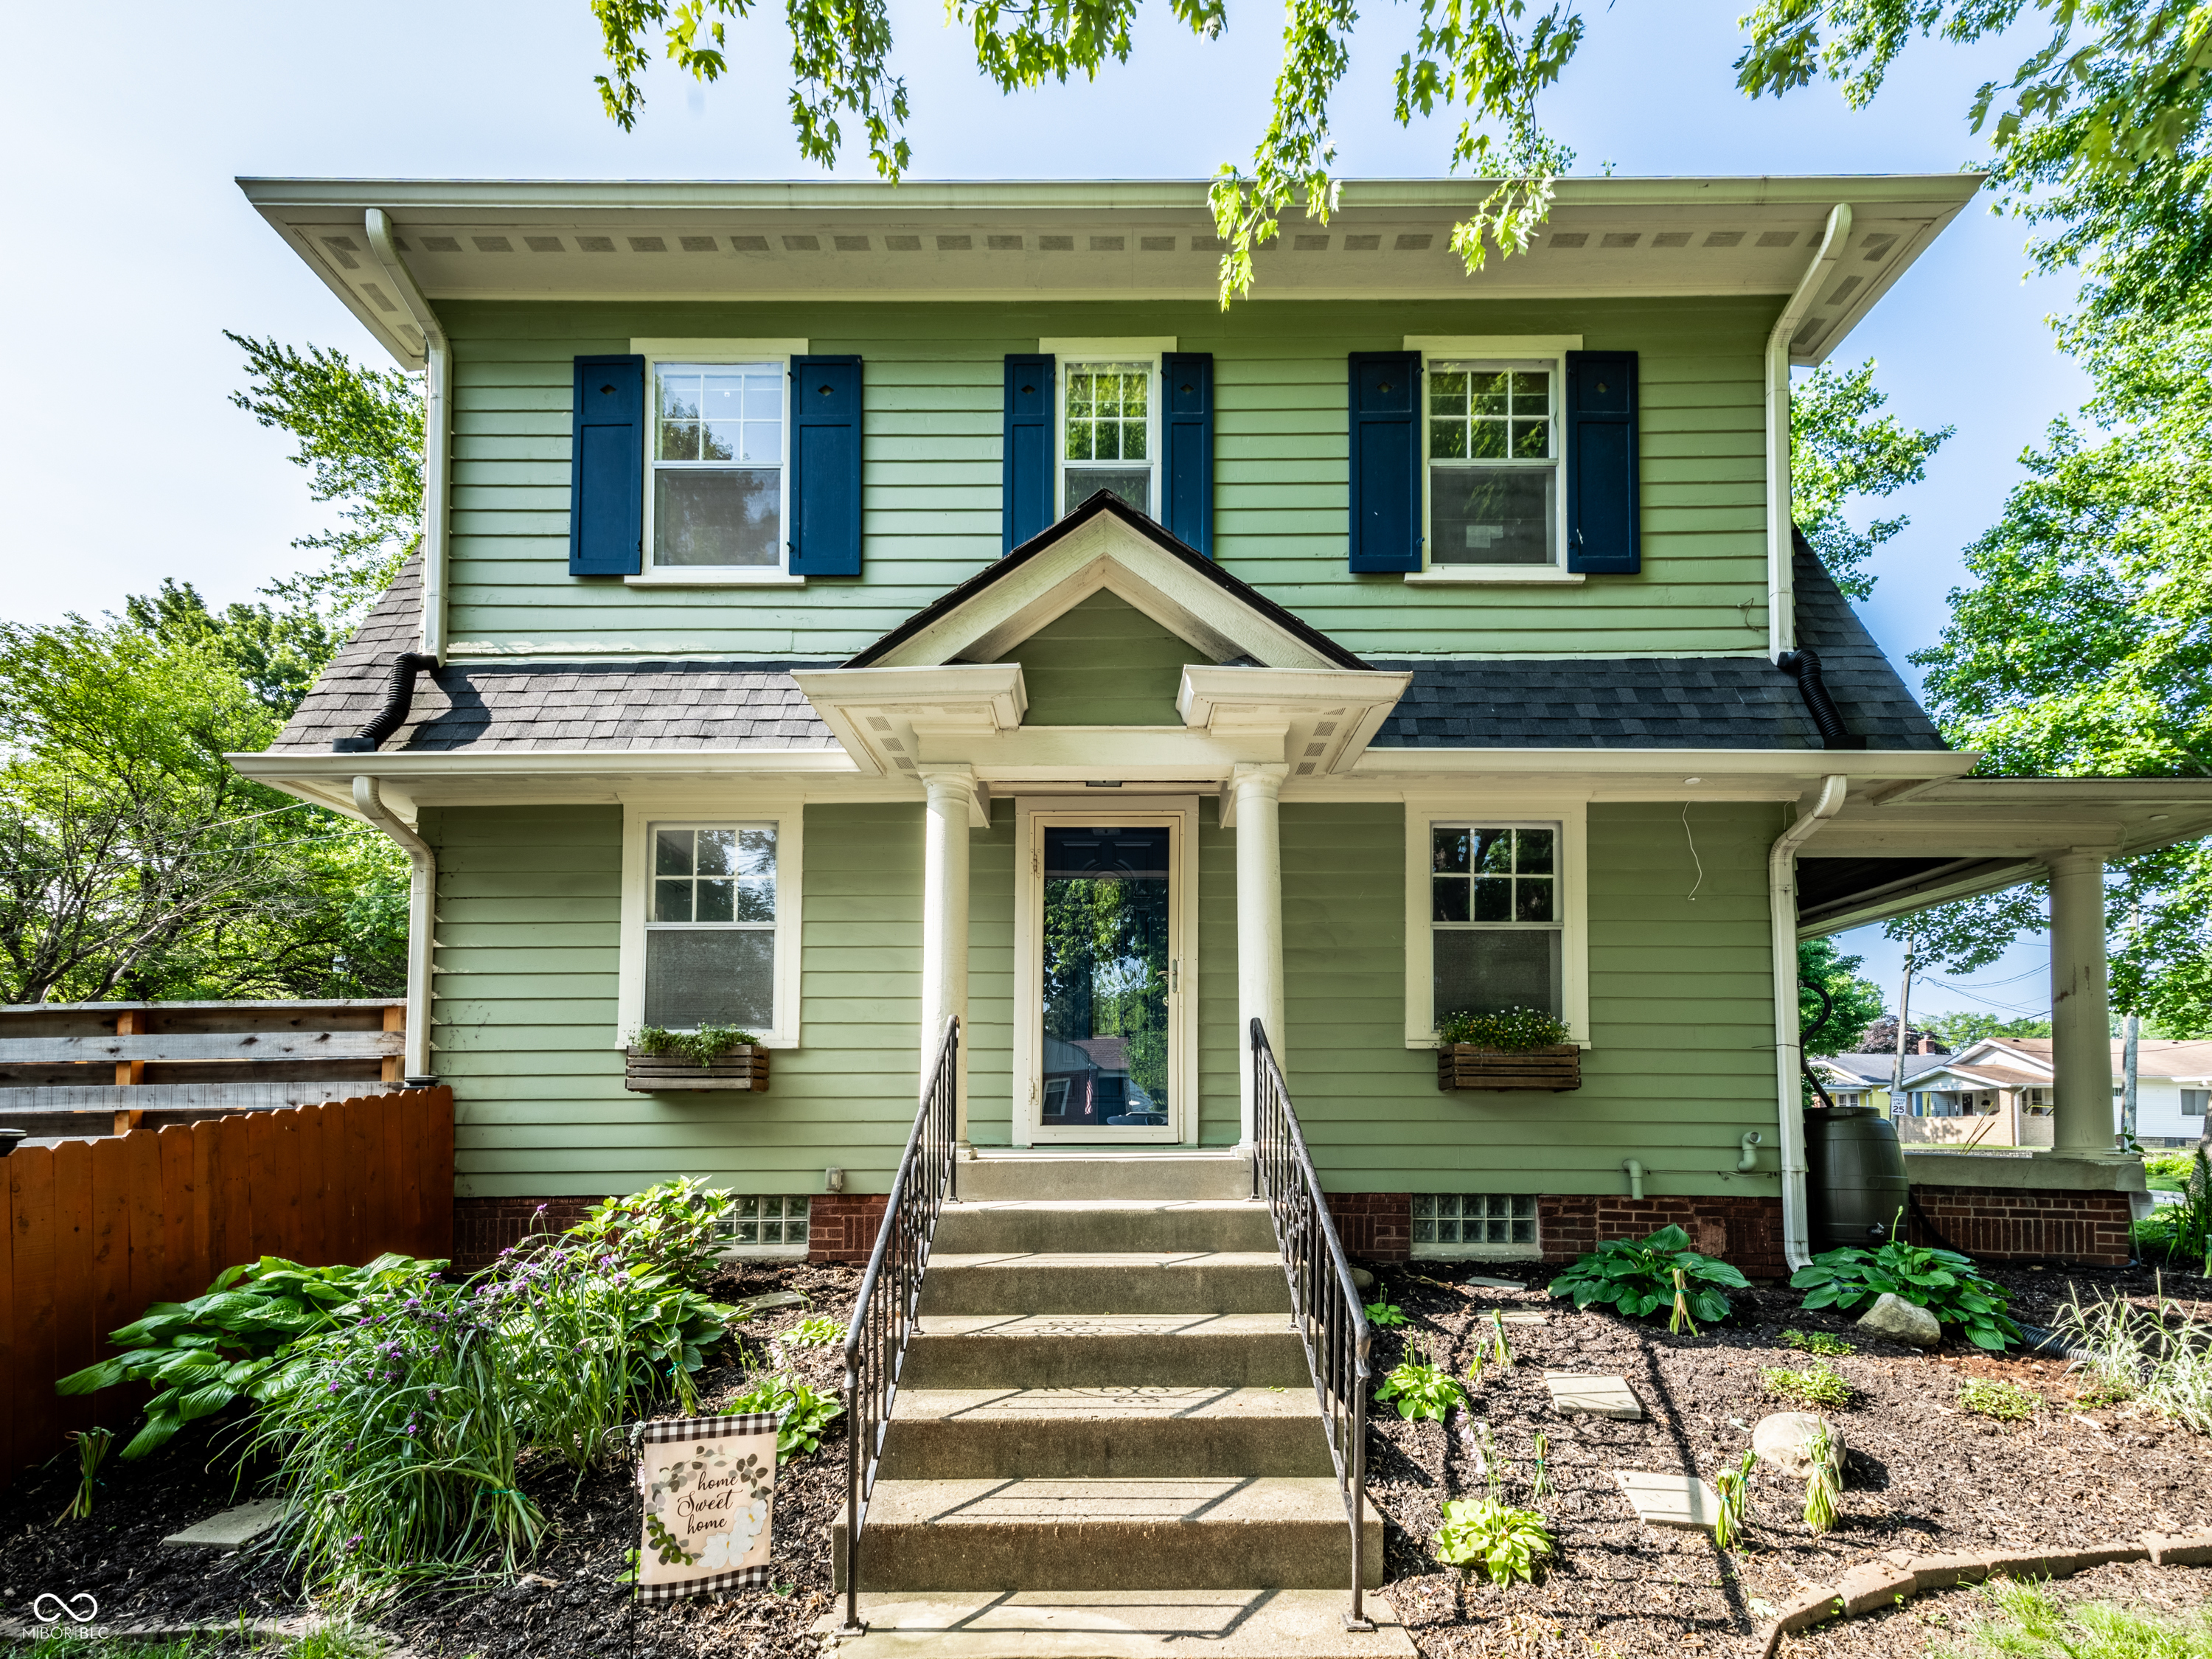
Active
$299,900
3
bds
|
3
ba
|
2,062
sqft
|
built
1915
2896 Sutherland Ave, Indianapolis, IN 46205
$51
Cash flow
0.9%
Cash-on-Cash Return
6.4%
Cap rate
0.8%
Rent to Value Ratio
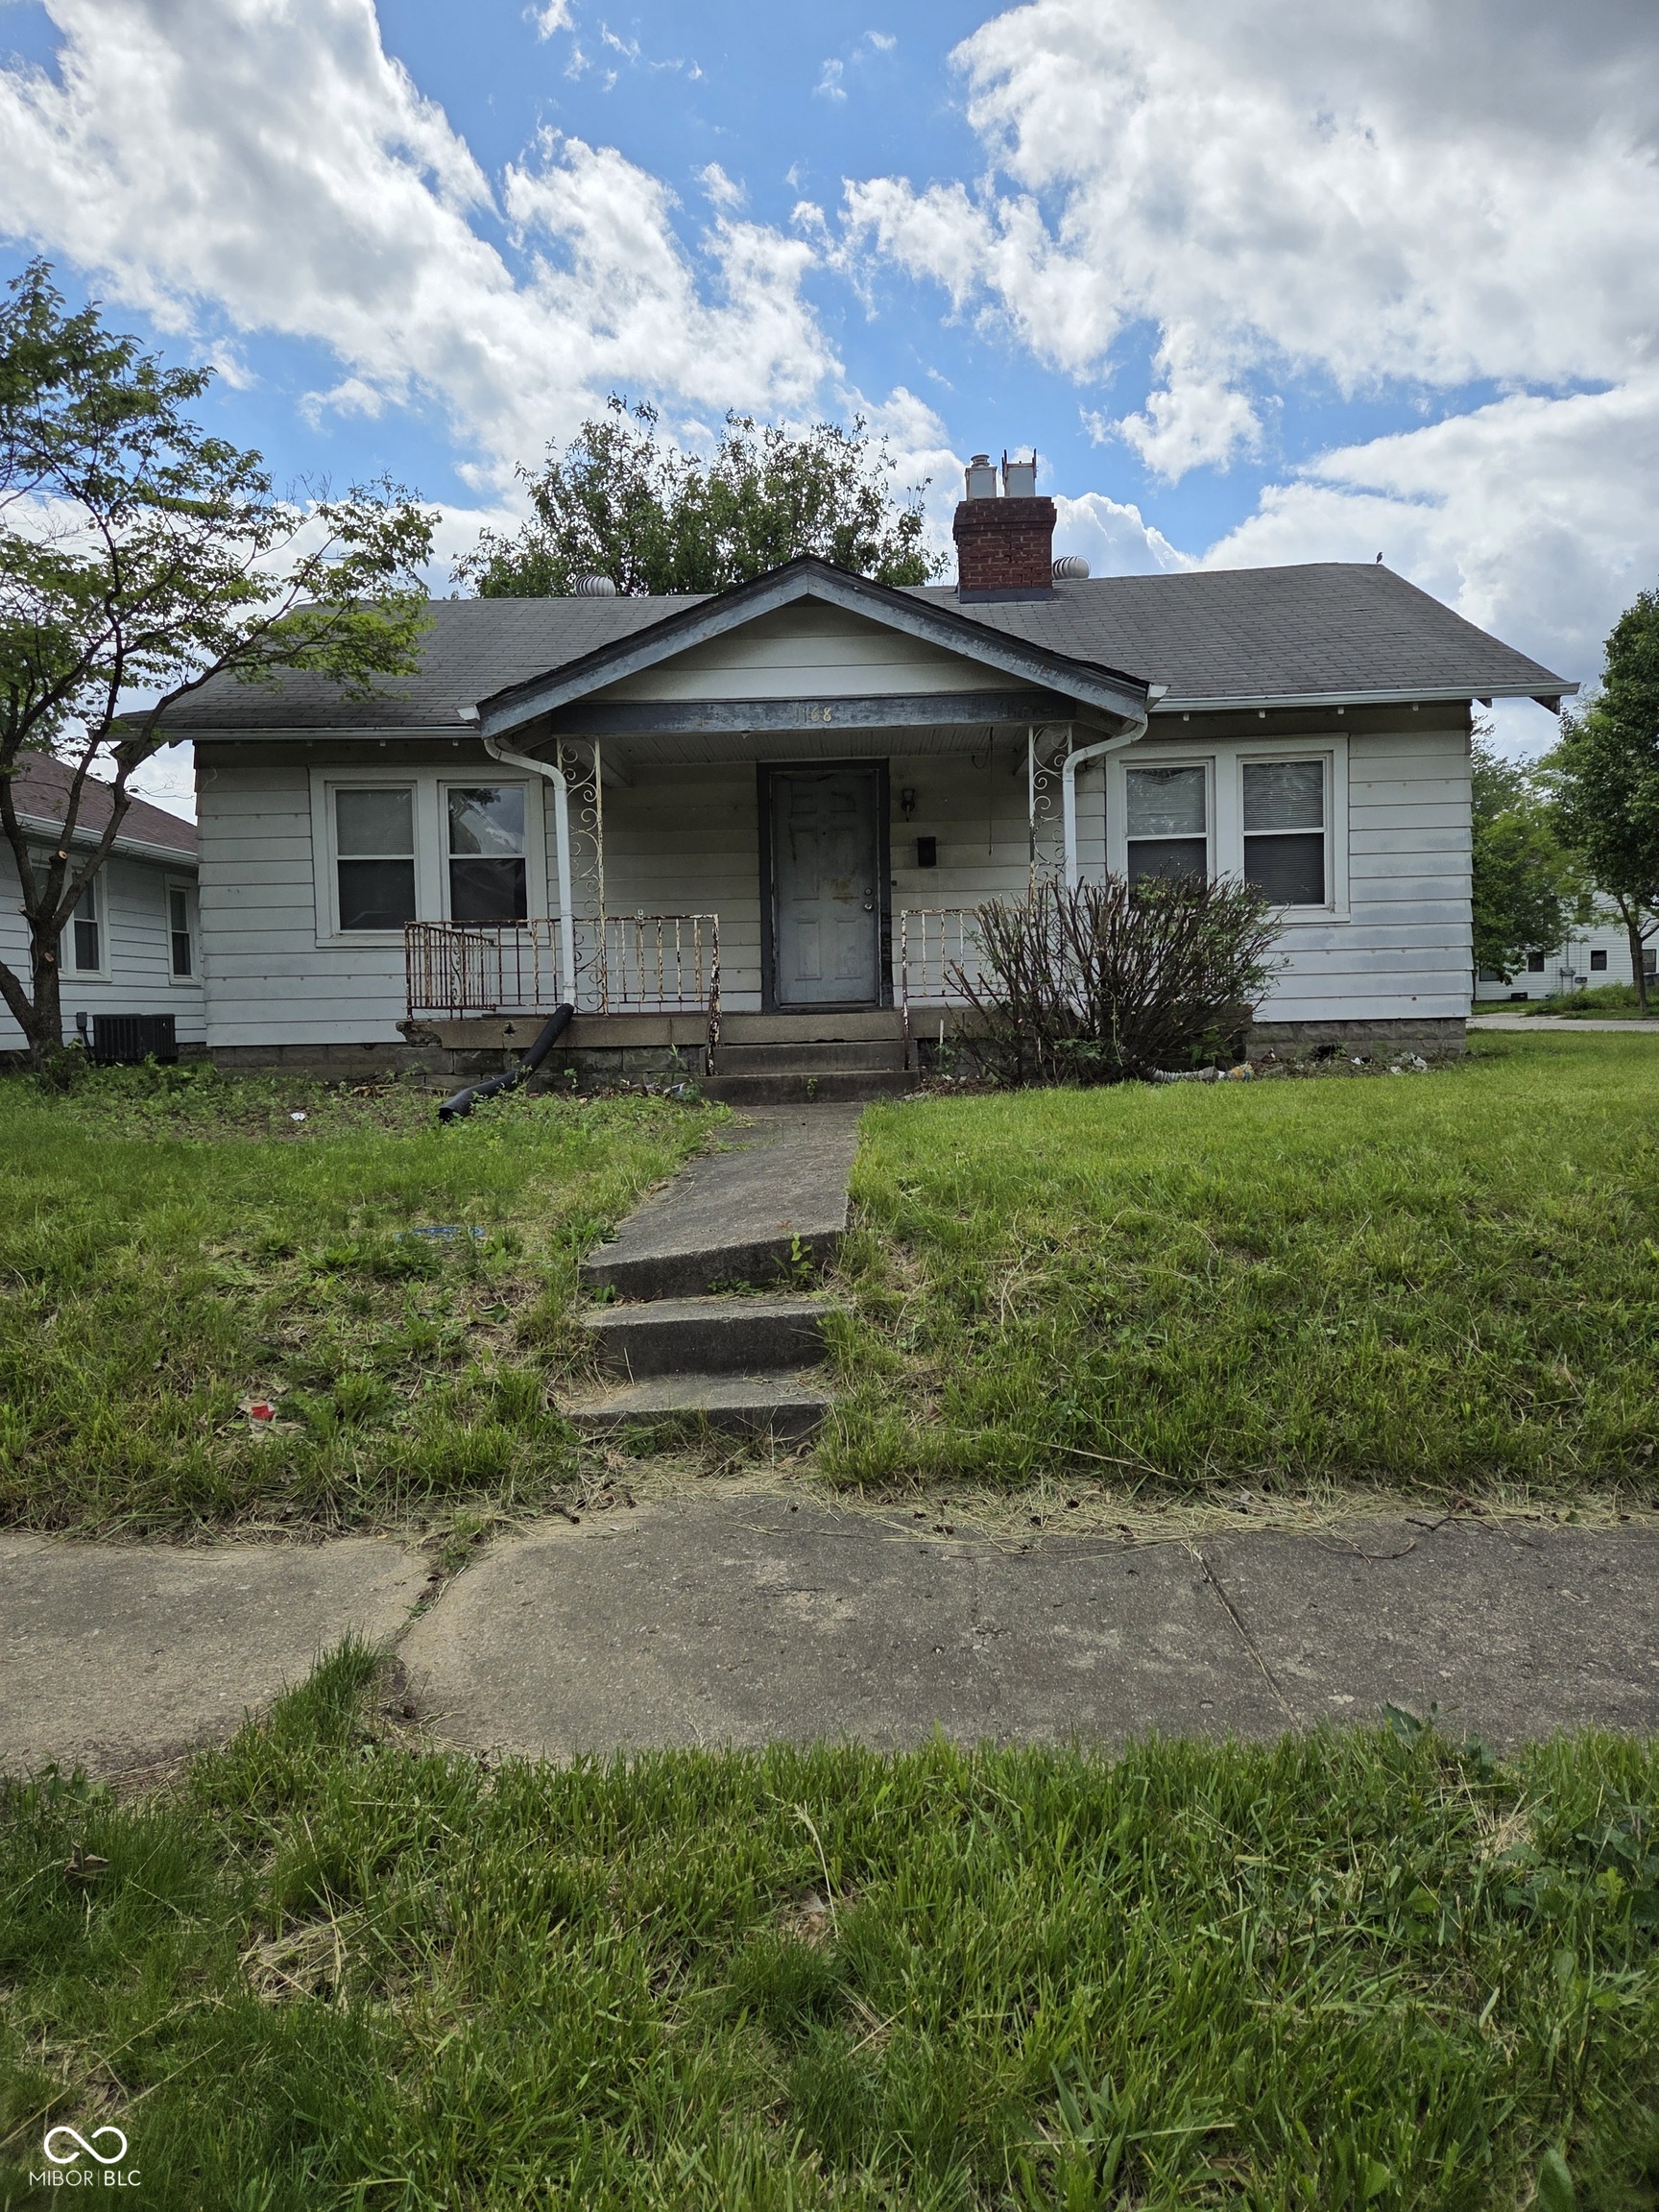
Active
$134,900
2
bds
|
1
ba
|
936
sqft
|
built
1928
1168 N Gladstone Ave, Indianapolis, IN 46201
$275
Cash flow
10.6%
Cash-on-Cash Return
8.6%
Cap rate
1.0%
Rent to Value Ratio
Active
$500,000
4
bds
|
4
ba
|
2,817
sqft
|
built
1985
8310 Fall Creek Rd, Indianapolis, IN 46256
$-629
Cash flow
-6.6%
Cash-on-Cash Return
4.6%
Cap rate
0.6%
Rent to Value Ratio
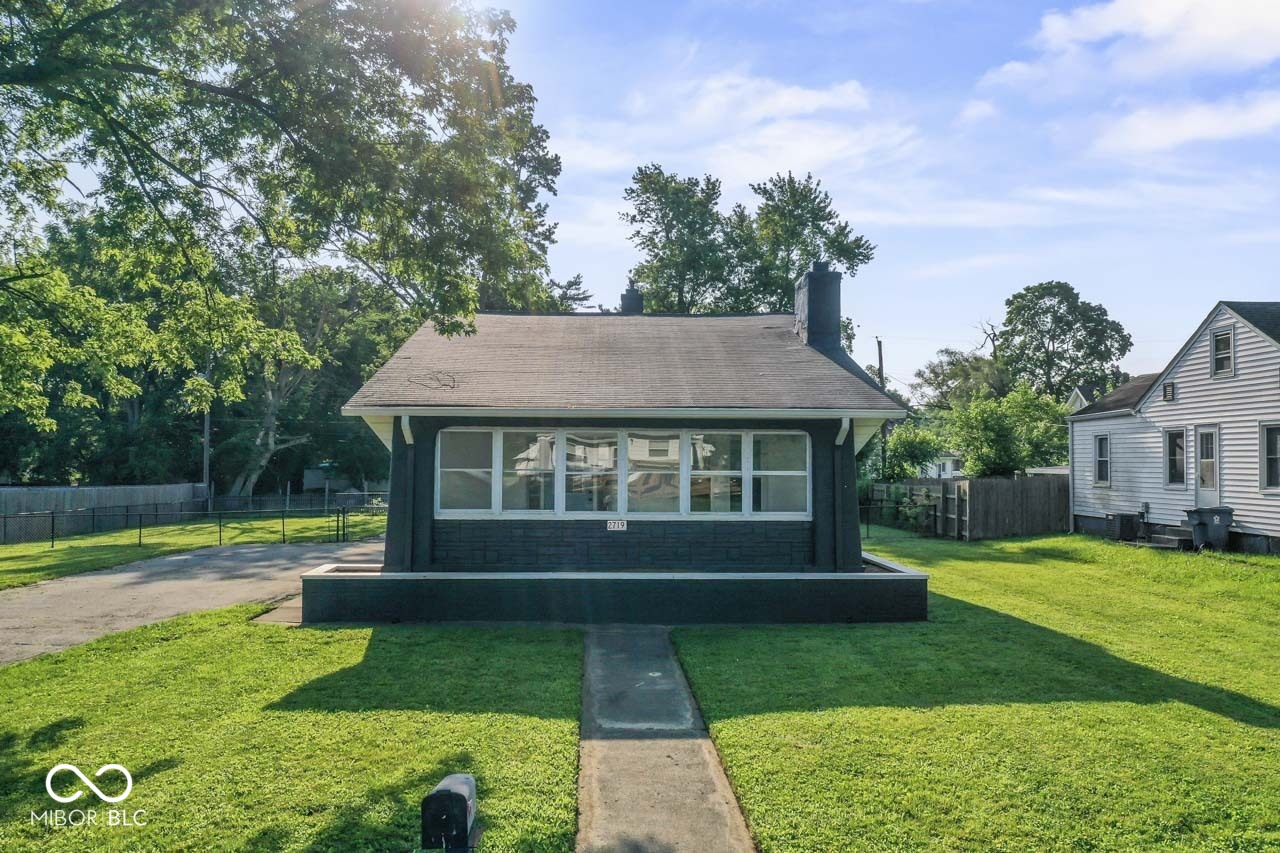
Pending
$214,900
3
bds
|
2
ba
|
1,208
sqft
|
built
1920
2719 Denison St, Indianapolis, IN 46241
$-135
Cash flow
-3.3%
Cash-on-Cash Return
5.4%
Cap rate
0.7%
Rent to Value Ratio
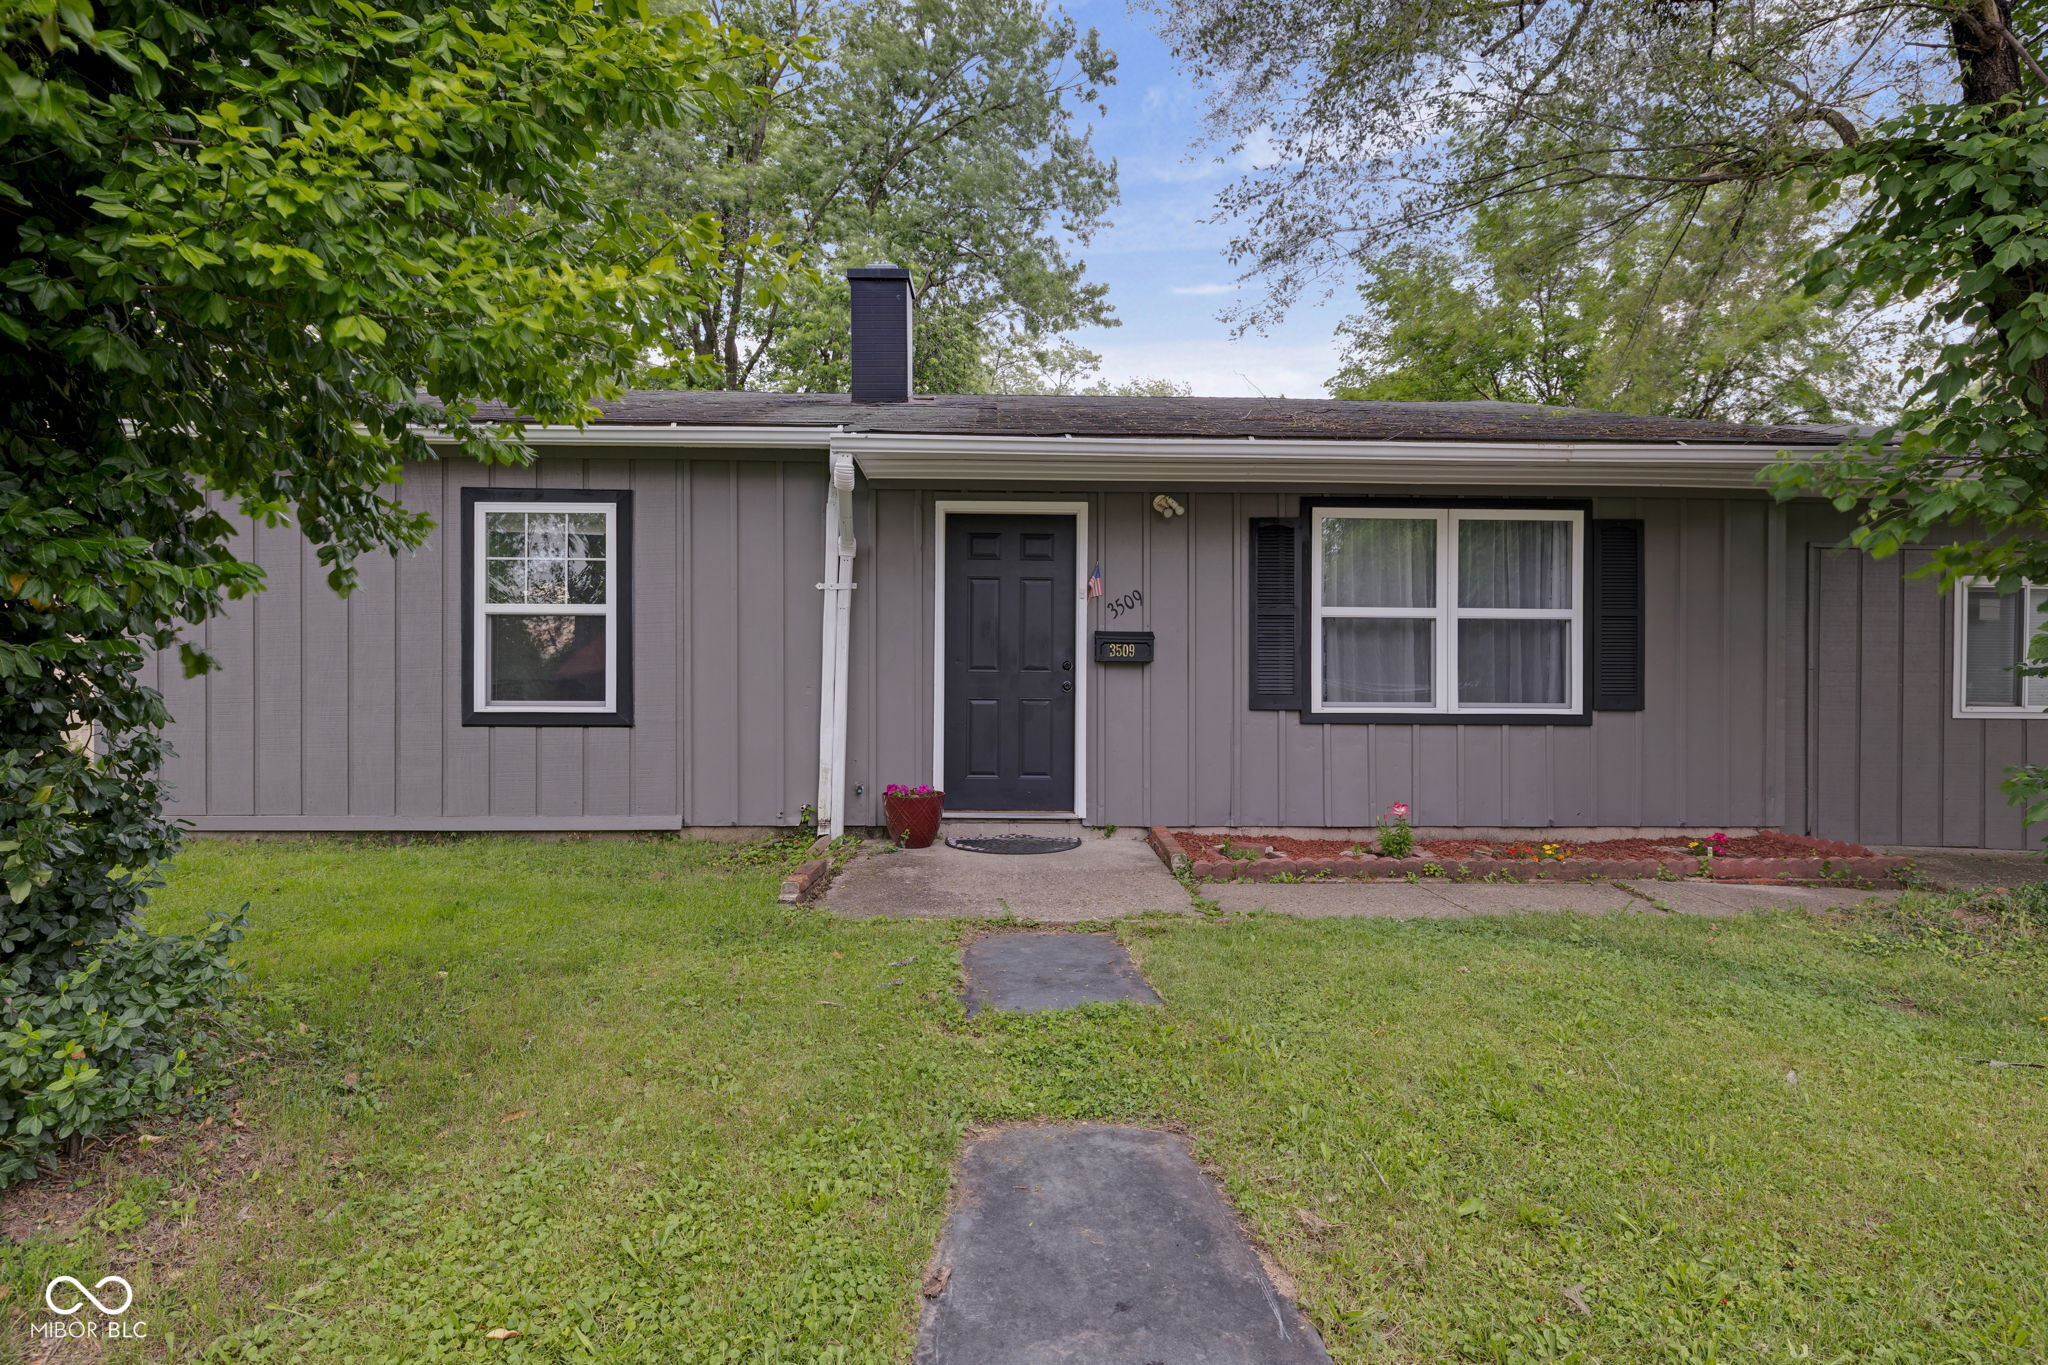
Active
$174,900
3
bds
|
1
ba
|
1,073
sqft
|
built
1963
3509 N Wittfield St, Indianapolis, IN 46235
$139
Cash flow
4.1%
Cash-on-Cash Return
7.1%
Cap rate
0.9%
Rent to Value Ratio
Pending
$287,500
3
bds
|
1
ba
|
1,542
sqft
|
built
1921
357 N Kenyon St, Indianapolis, IN 46219
$45
Cash flow
0.8%
Cash-on-Cash Return
6.3%
Cap rate
0.8%
Rent to Value Ratio
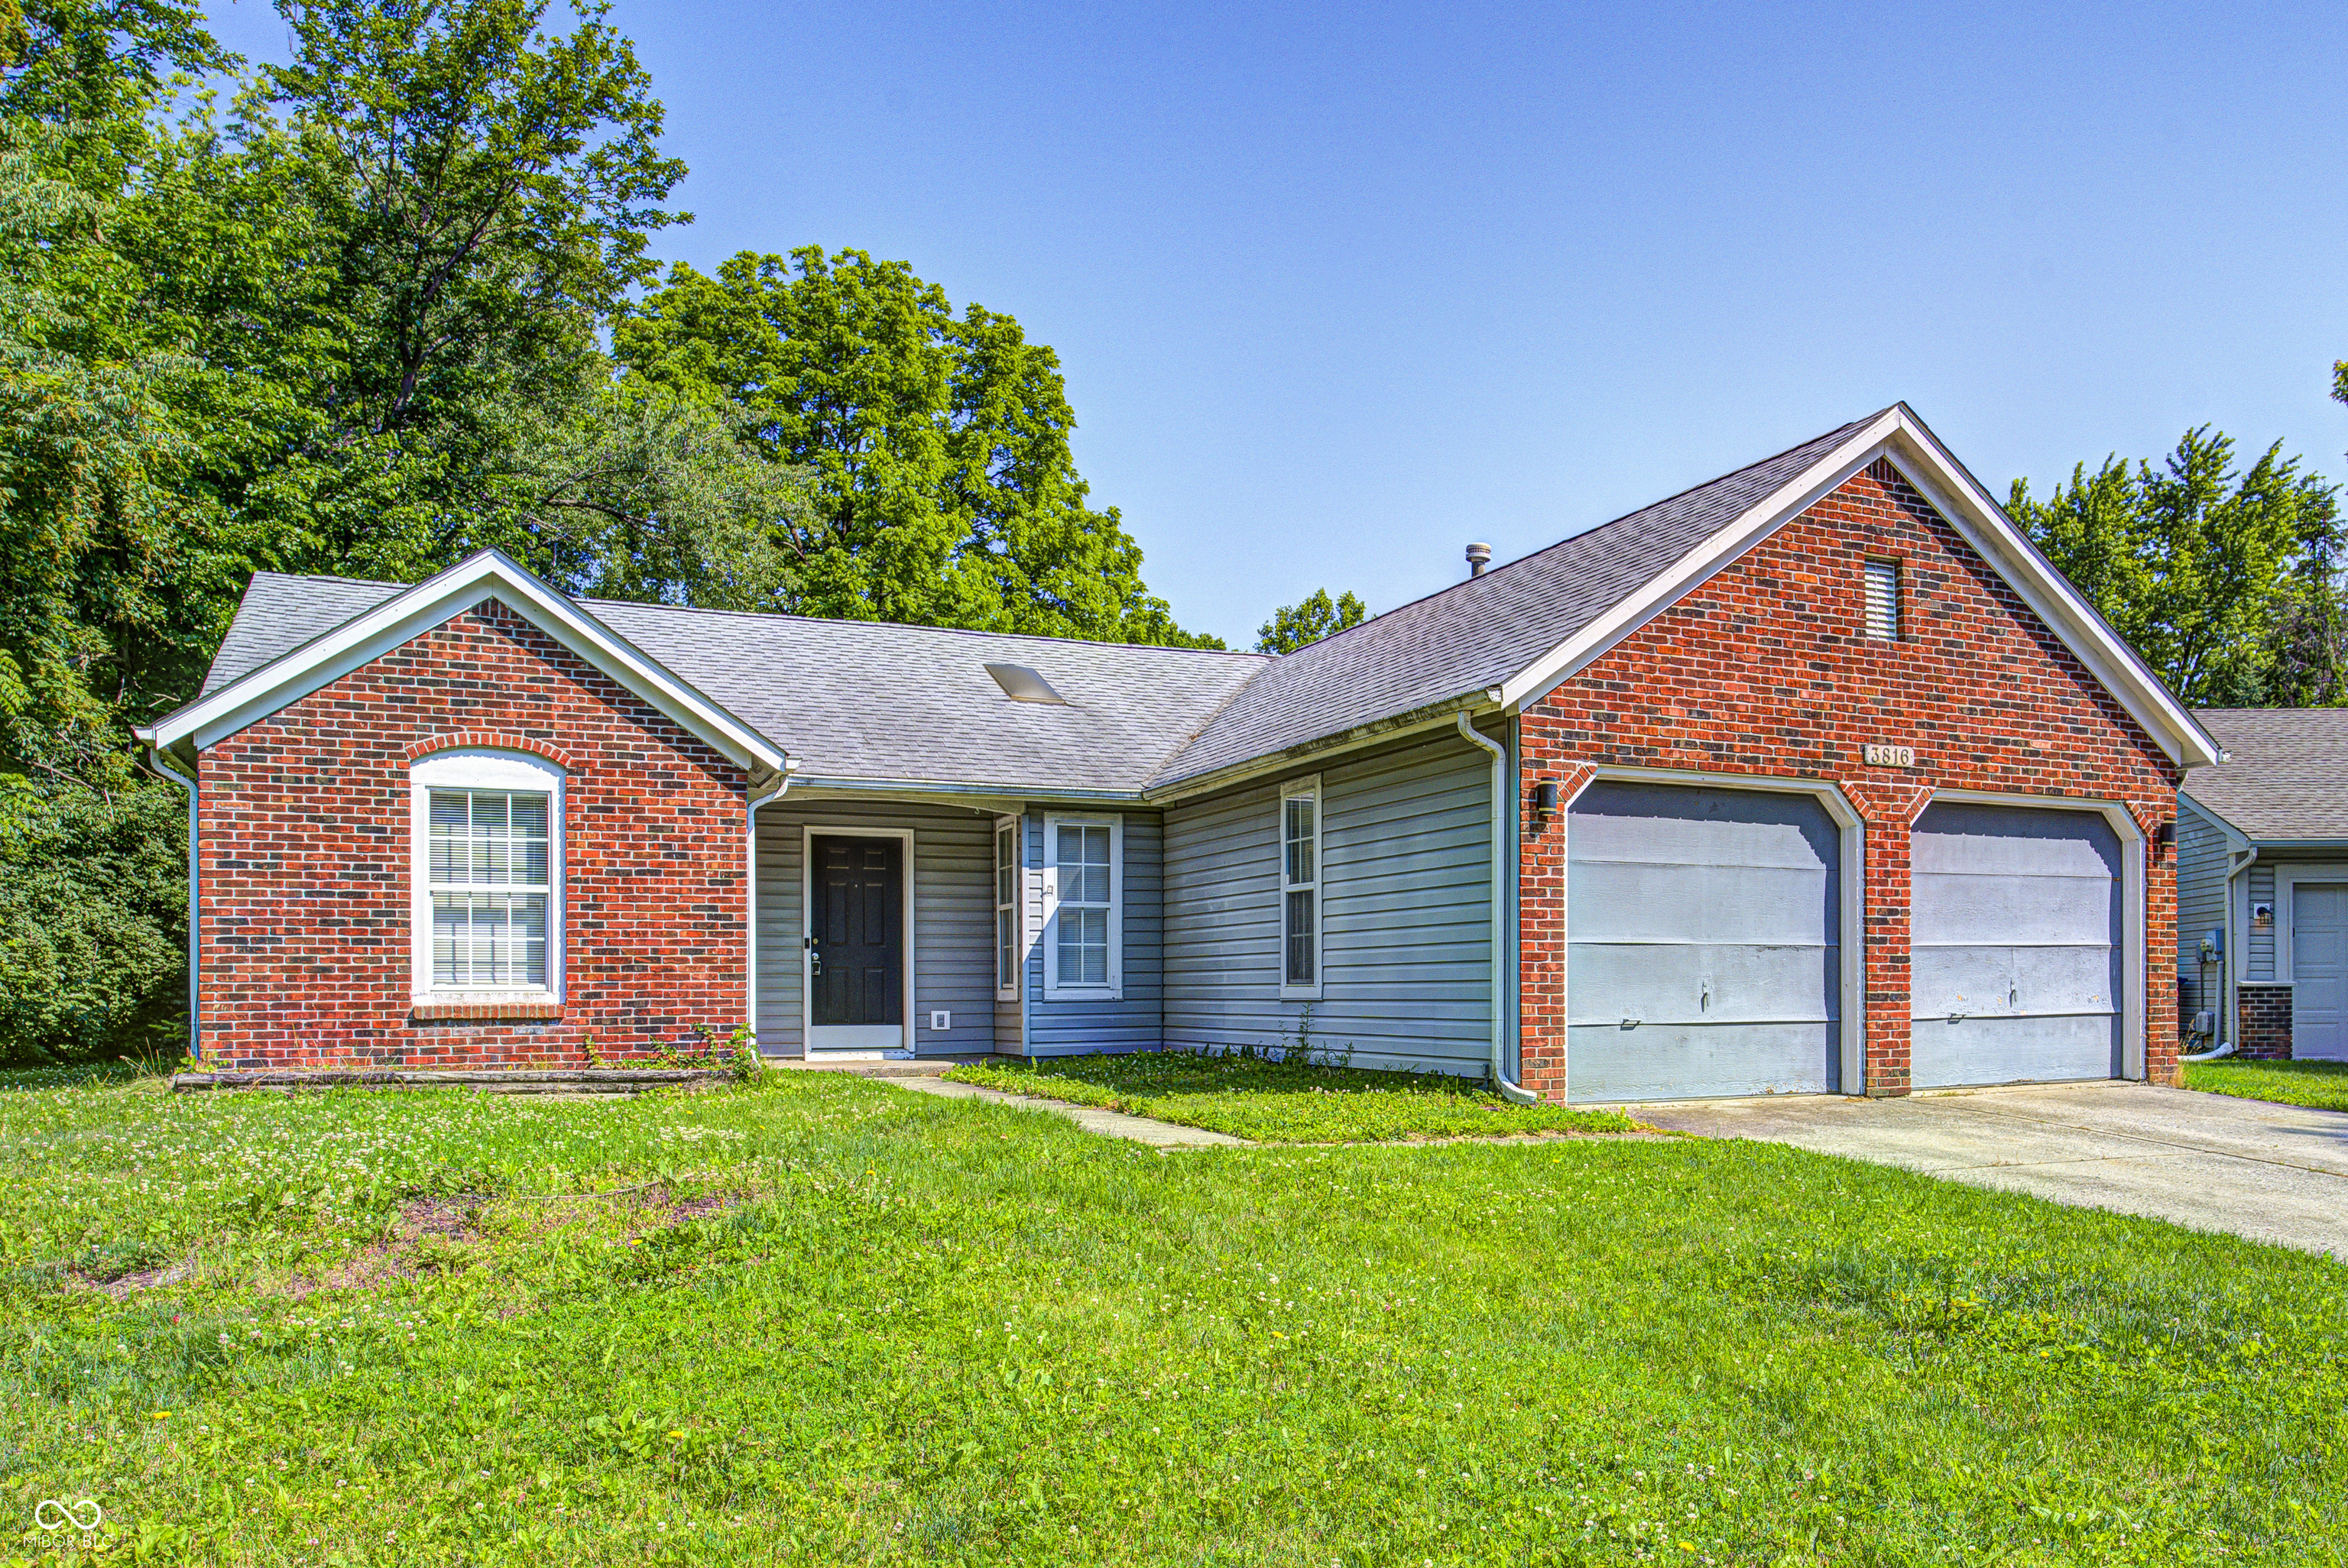
Pending
$215,000
3
bds
|
2
ba
|
1,339
sqft
|
built
1990
3816 Cologne Ct, Indianapolis, IN 46228
$135
Cash flow
3.3%
Cash-on-Cash Return
6.9%
Cap rate
0.8%
Rent to Value Ratio
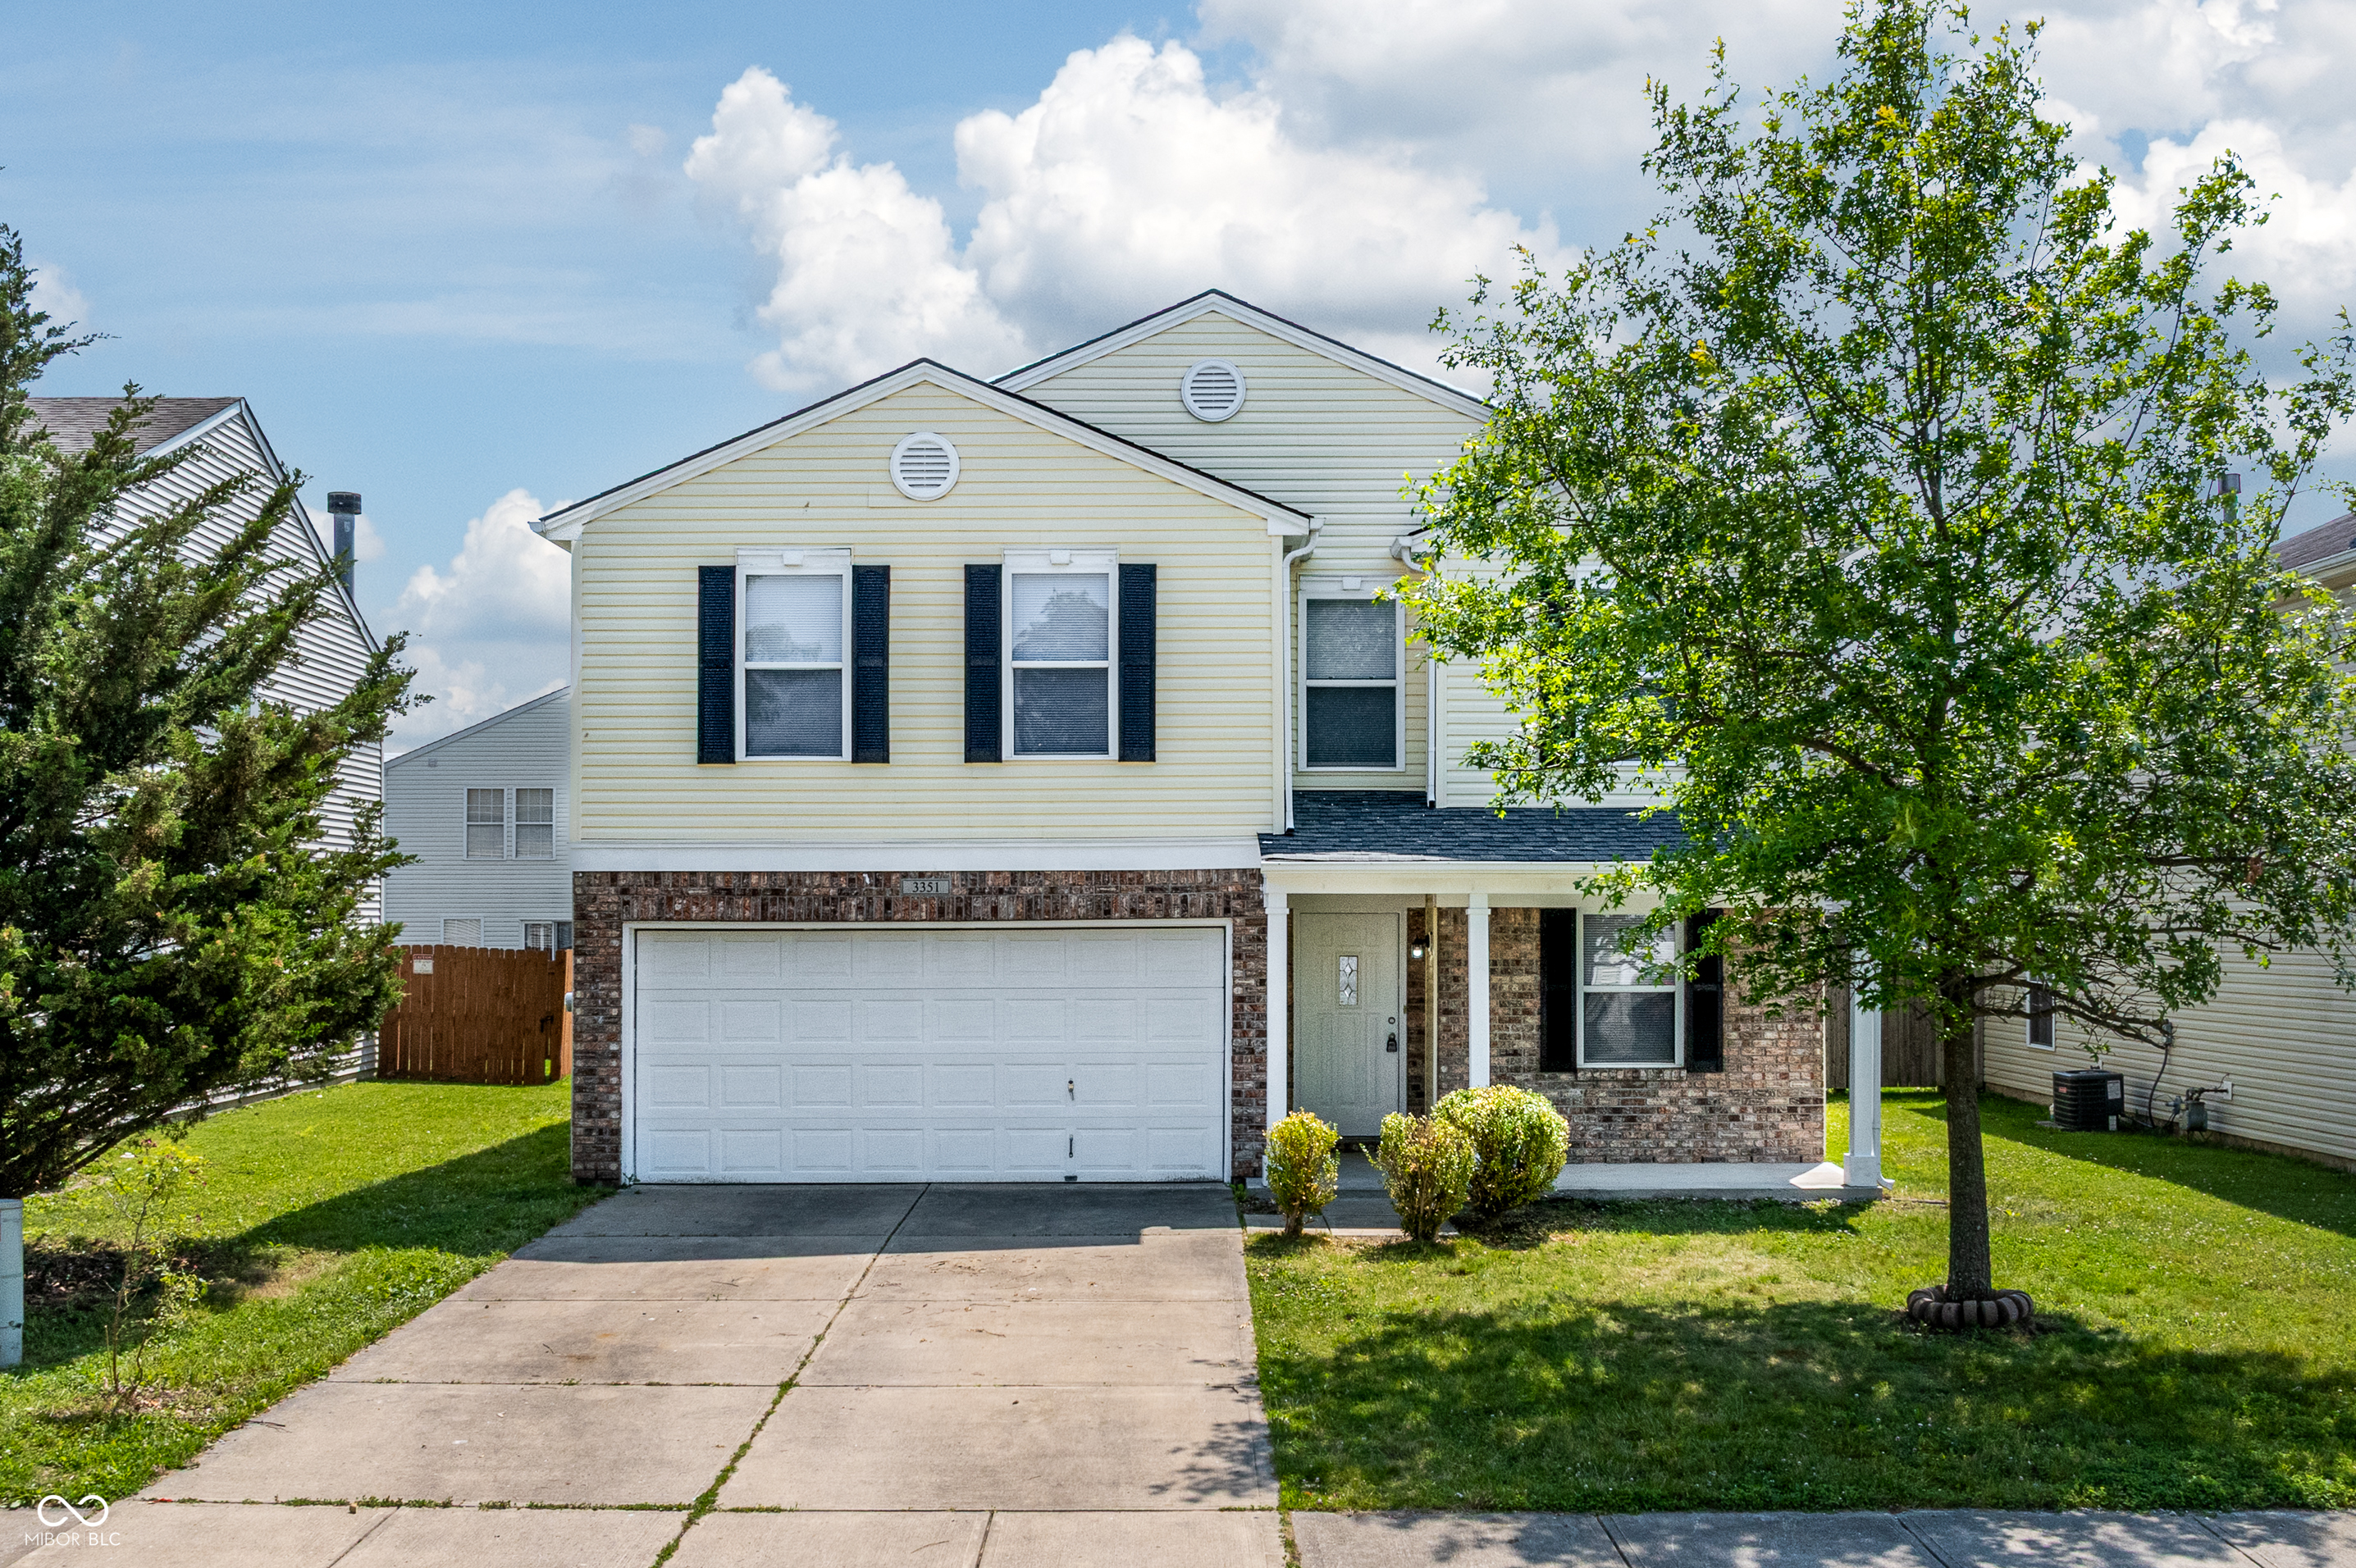
Active
$284,995
3
bds
|
3
ba
|
2,434
sqft
|
built
2003
3351 Summer Breeze Ln, Indianapolis, IN 46239
$-36
Cash flow
-0.7%
Cash-on-Cash Return
6.0%
Cap rate
0.7%
Rent to Value Ratio
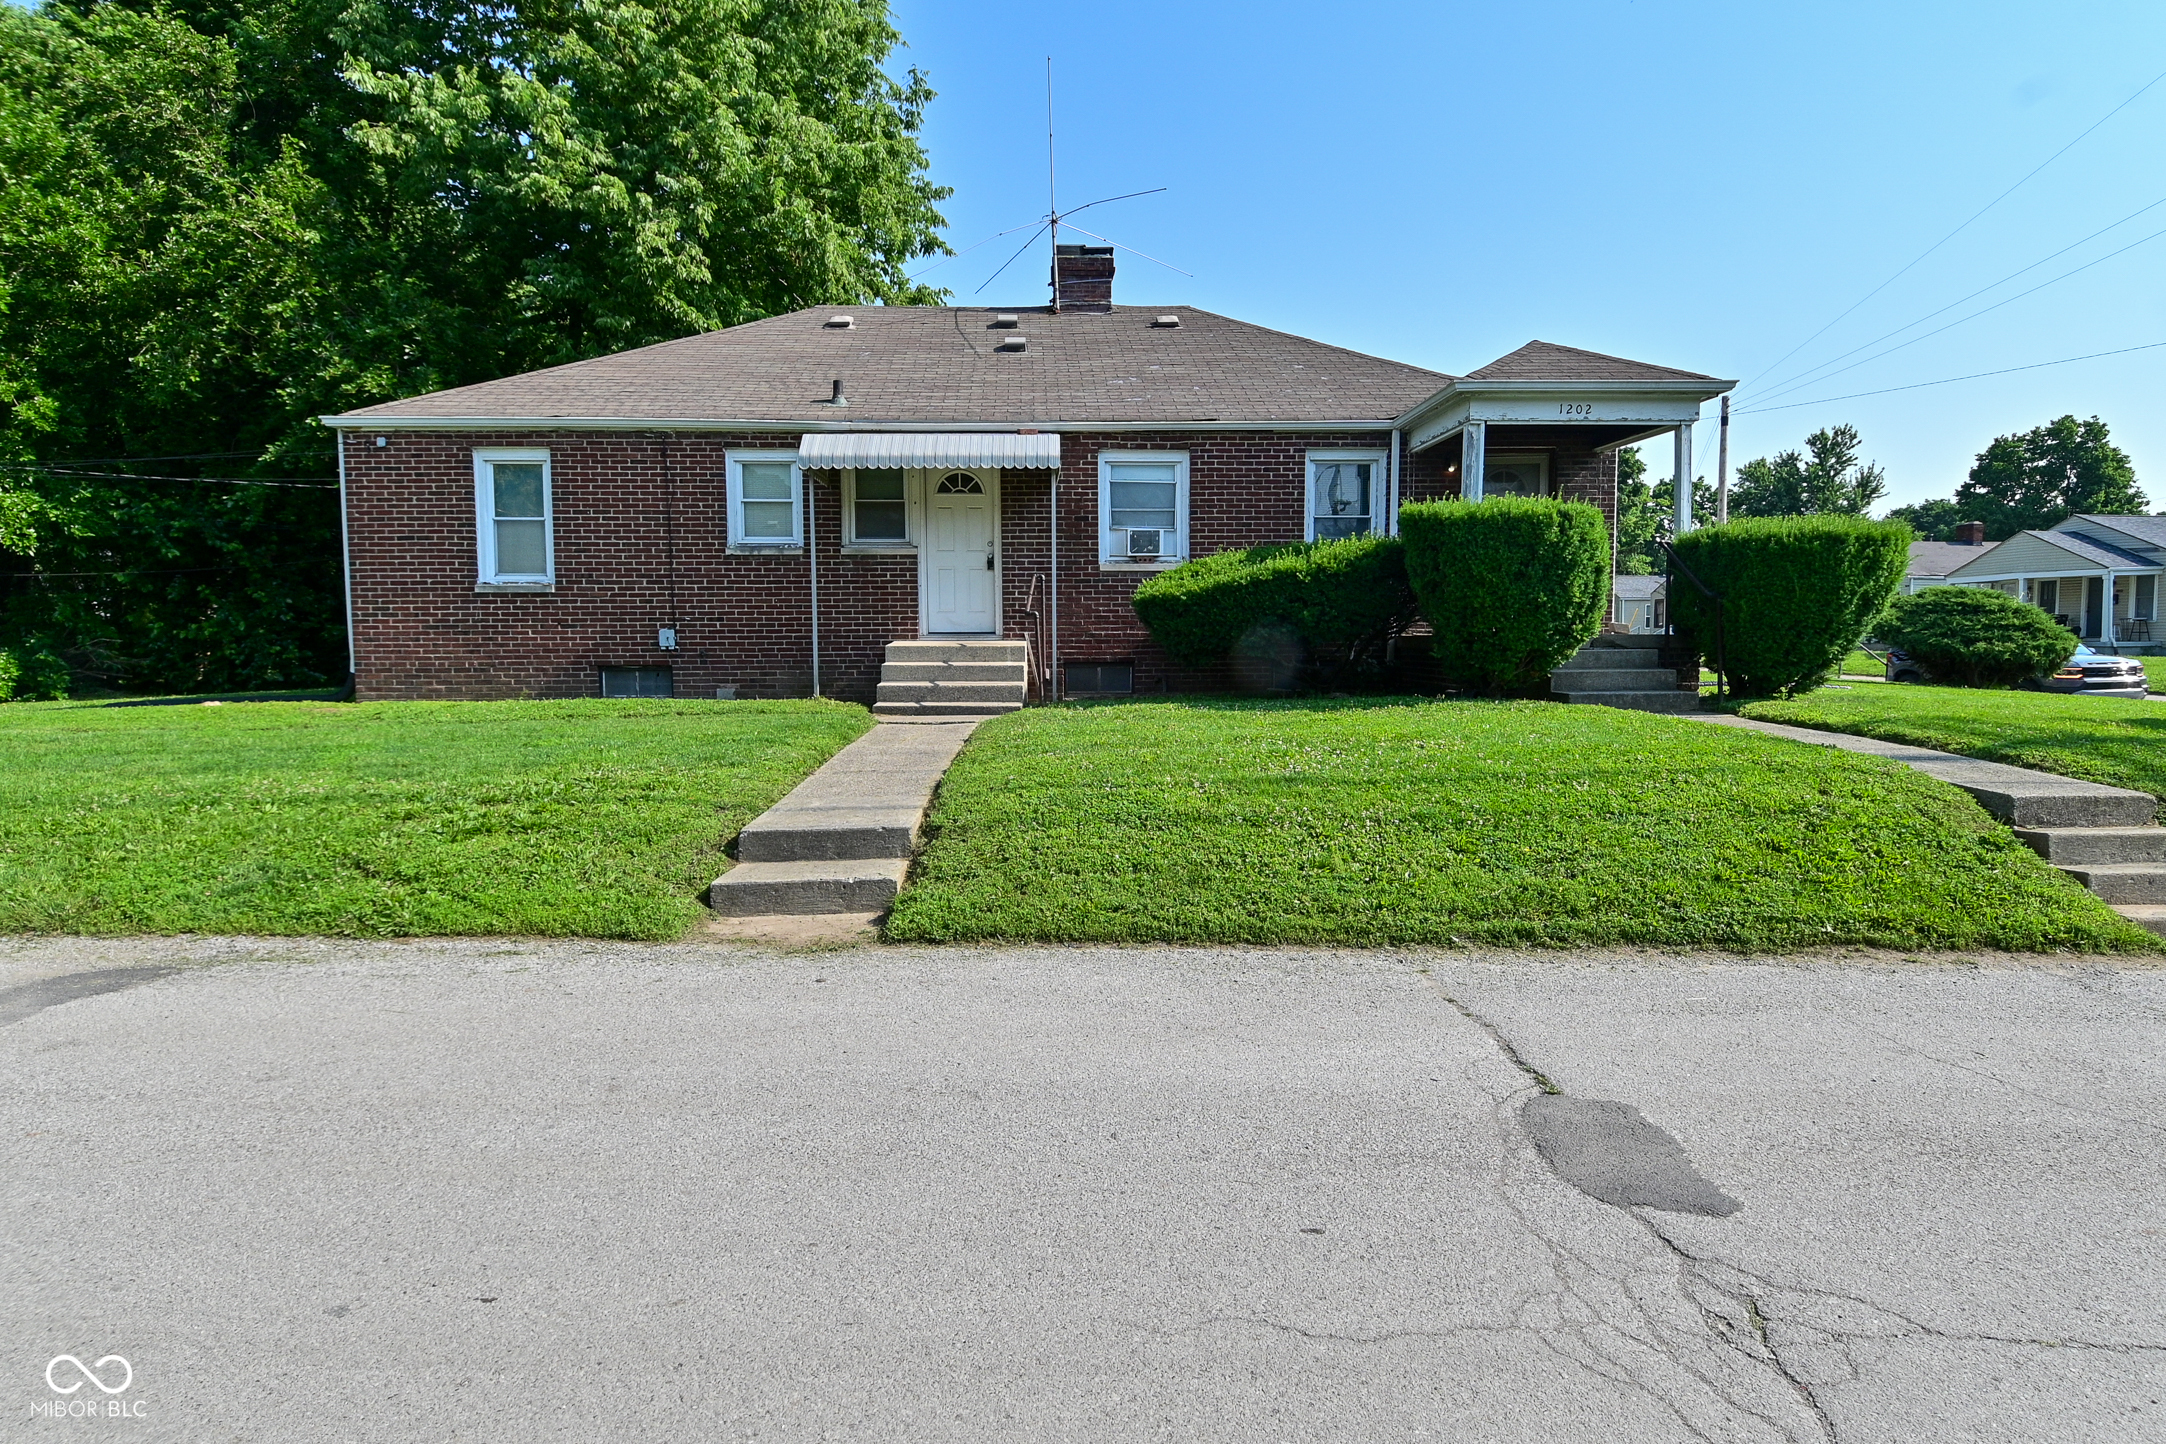
Pending
$150,000
2
bds
|
0
ba
|
0
sqft
|
built
1950
1202 N Concord St, Indianapolis, IN 46222
$-9
Cash flow
-0.3%
Cash-on-Cash Return
6.1%
Cap rate
0.7%
Rent to Value Ratio
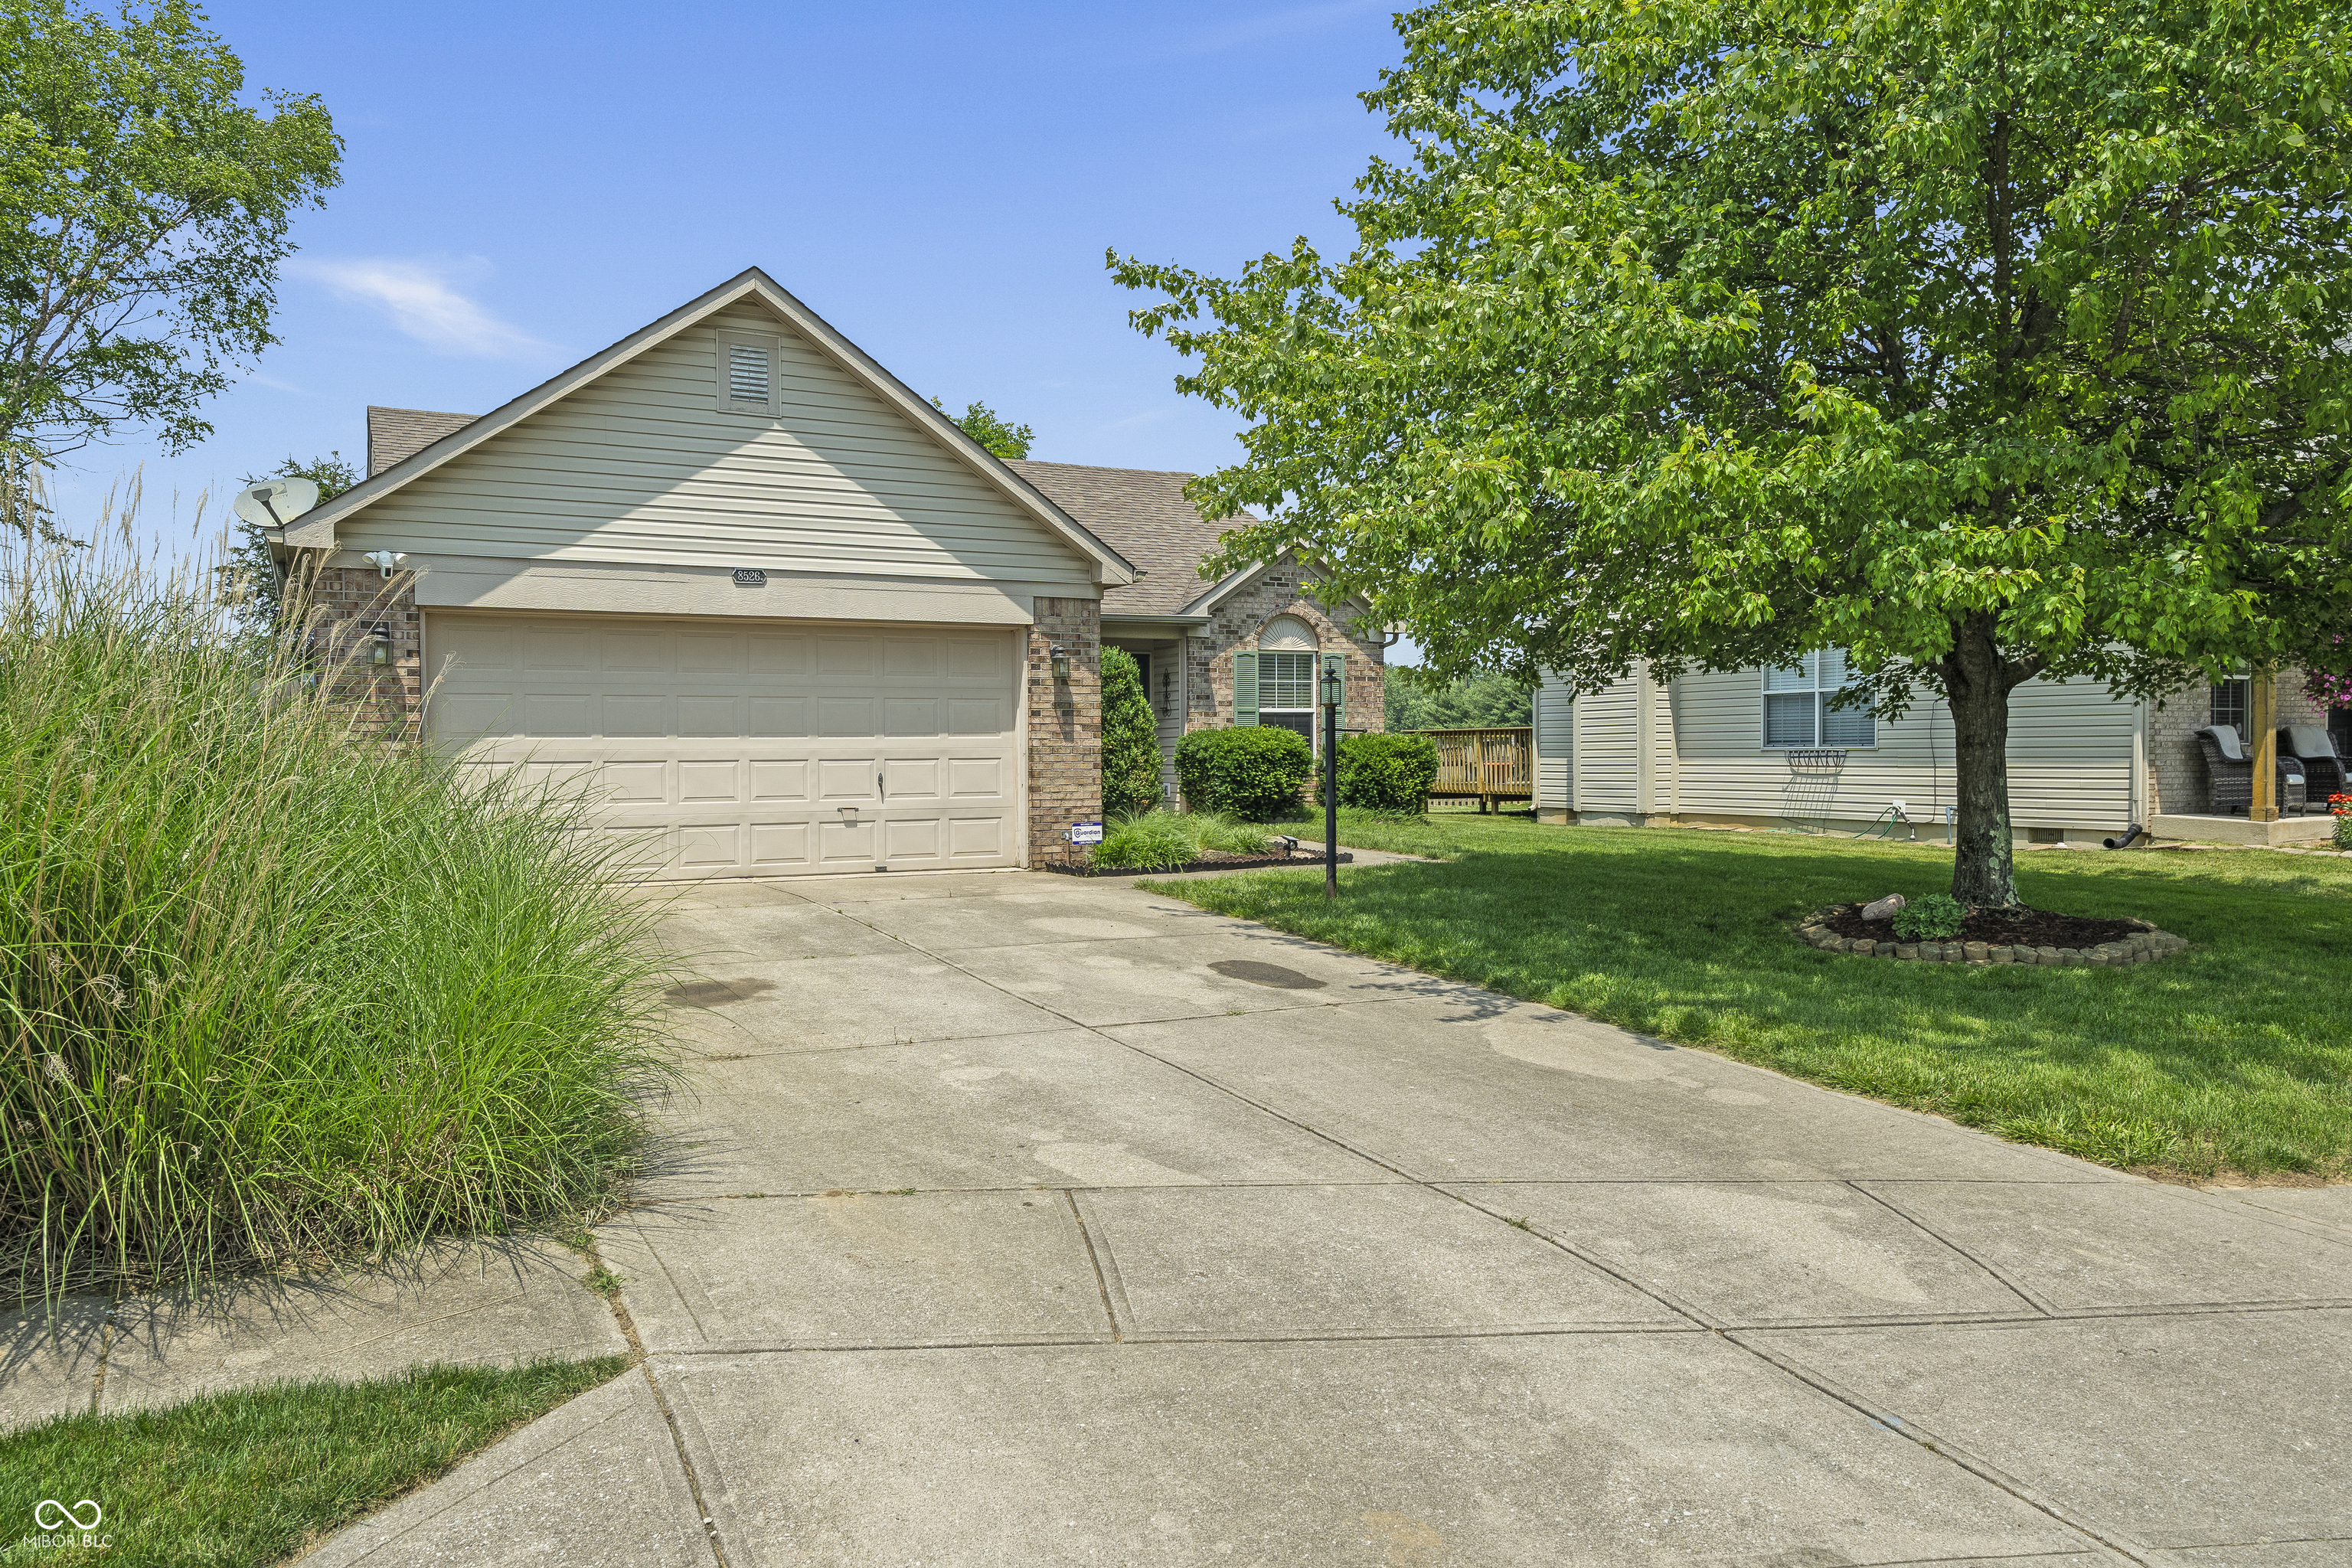
Pending
$219,900
3
bds
|
2
ba
|
1,172
sqft
|
built
1998
8526 Country Meadows Dr, Indianapolis, IN 46234
$-33
Cash flow
-0.8%
Cash-on-Cash Return
6.0%
Cap rate
0.7%
Rent to Value Ratio
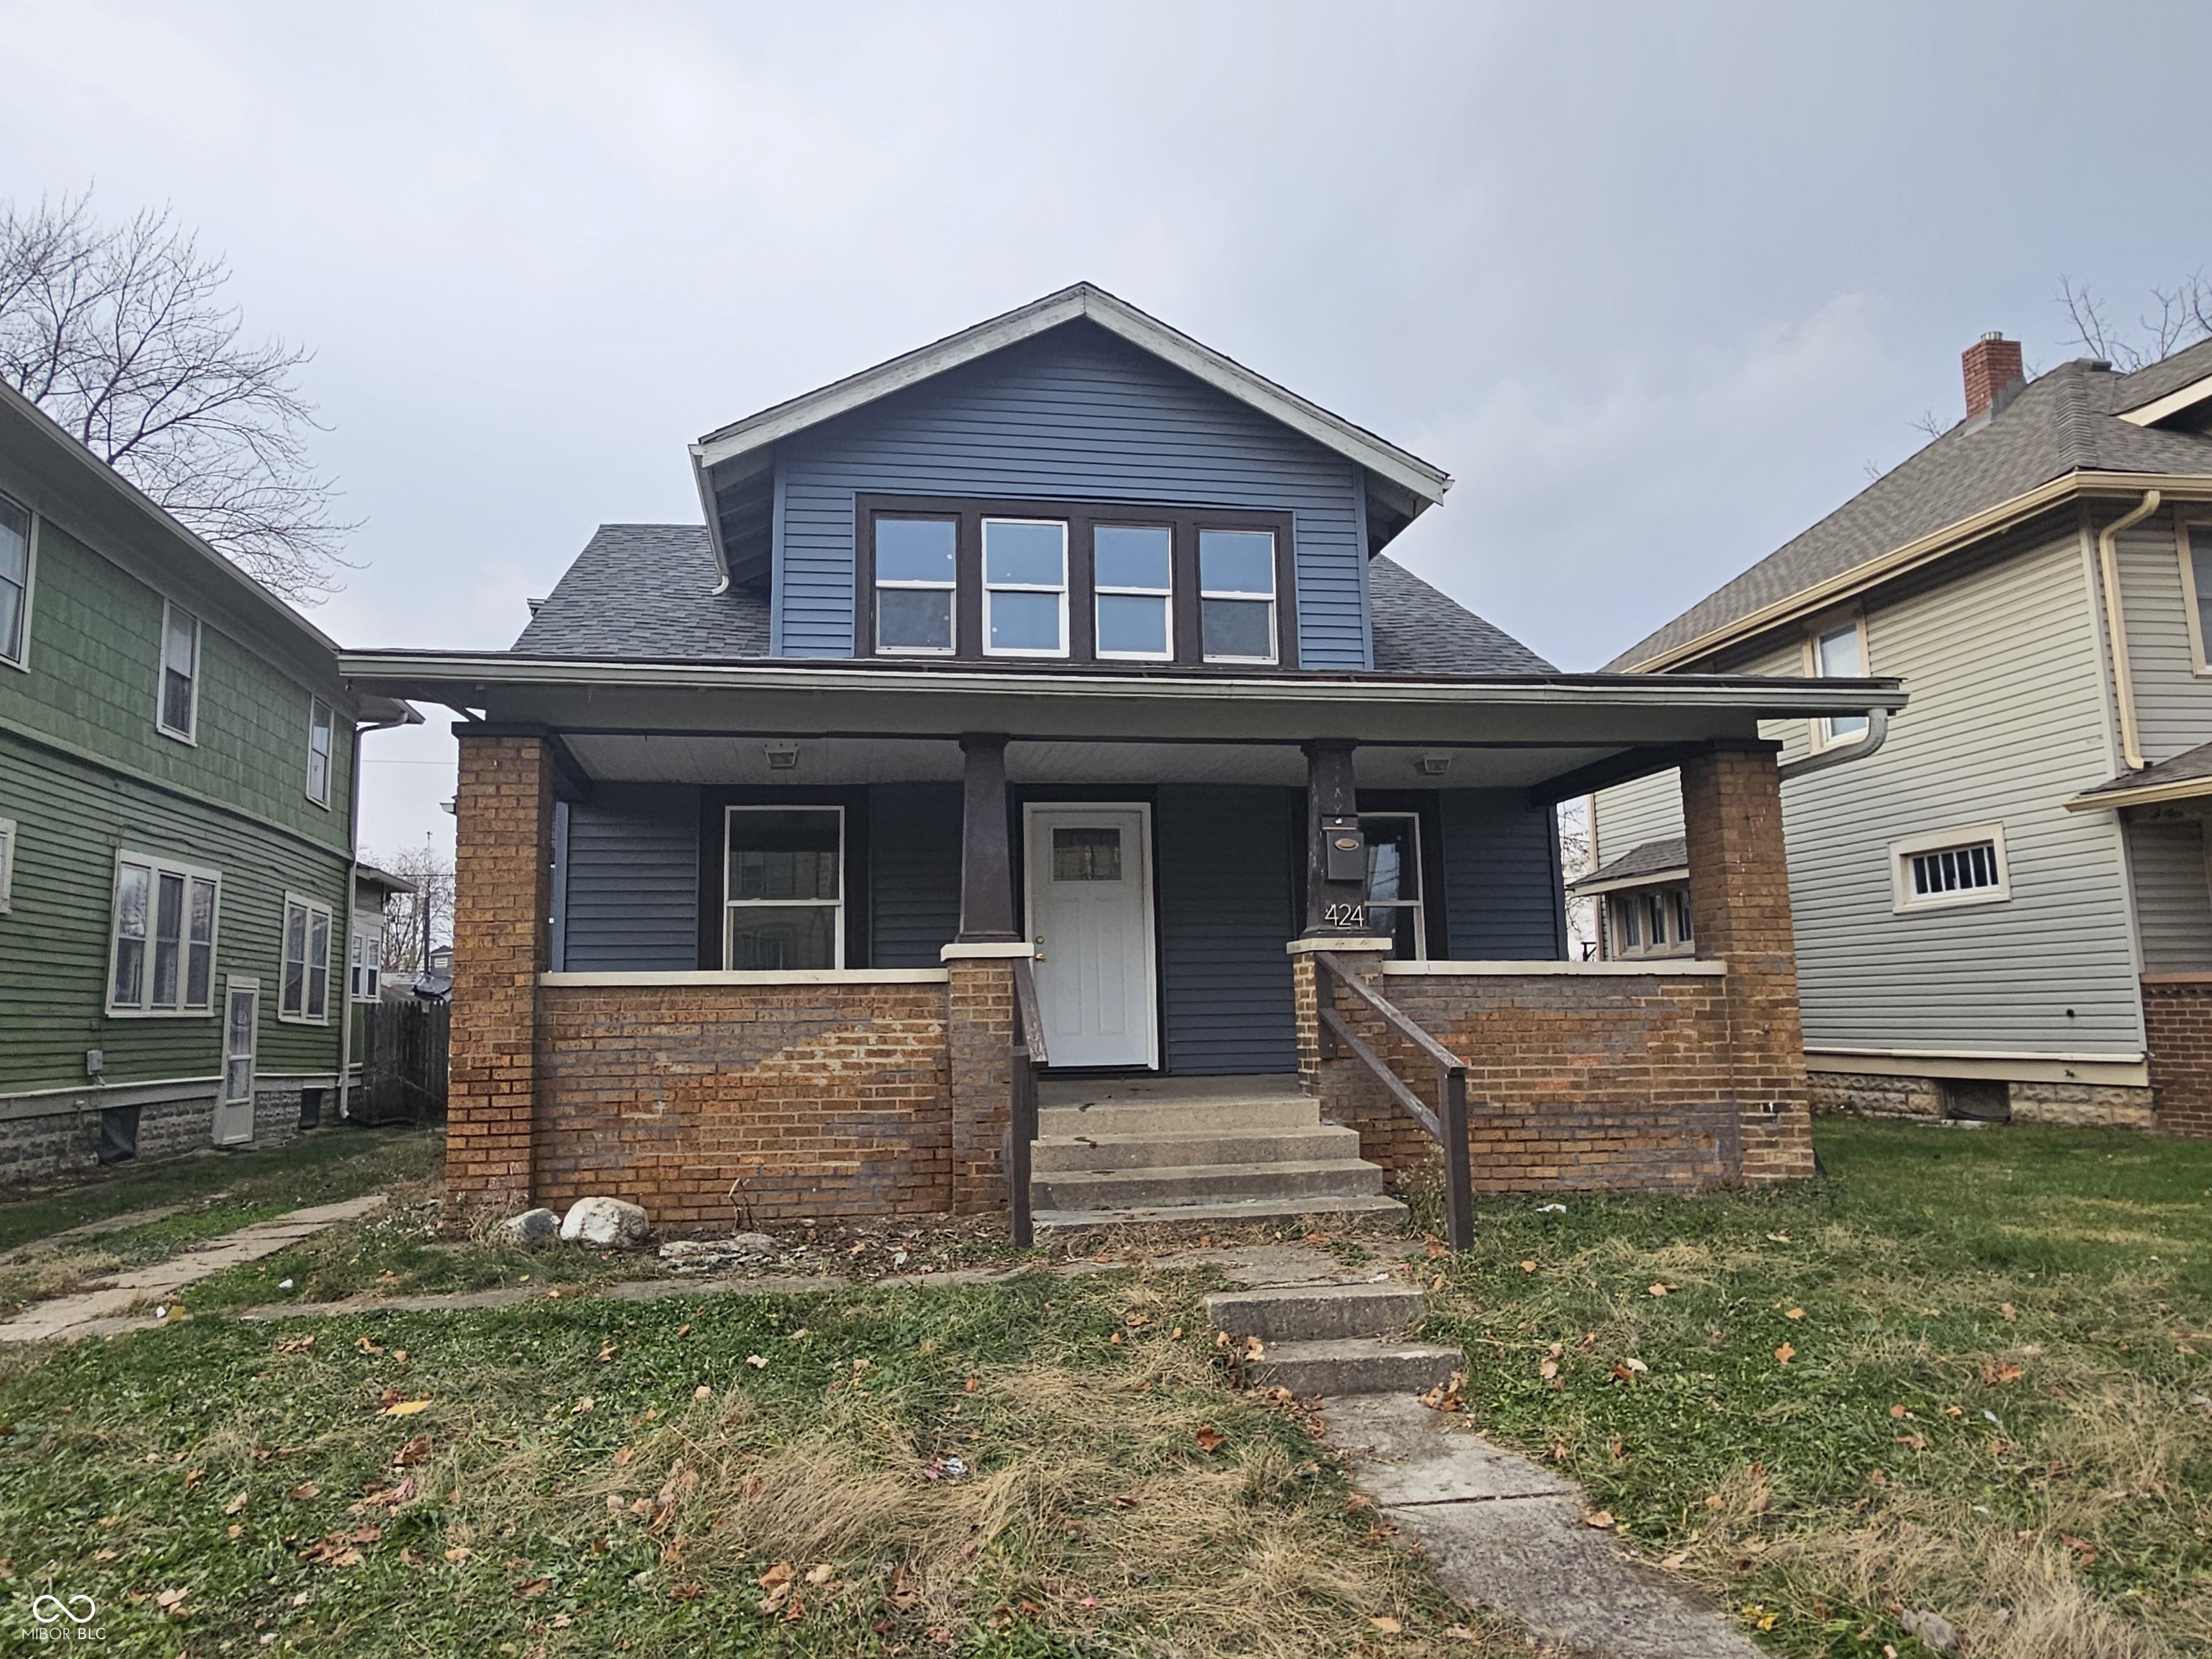
Active
$169,900
4
bds
|
2
ba
|
1,960
sqft
|
built
1920
424 N Kealing Ave, Indianapolis, IN 46201
$-42
Cash flow
-1.3%
Cash-on-Cash Return
5.8%
Cap rate
0.7%
Rent to Value Ratio
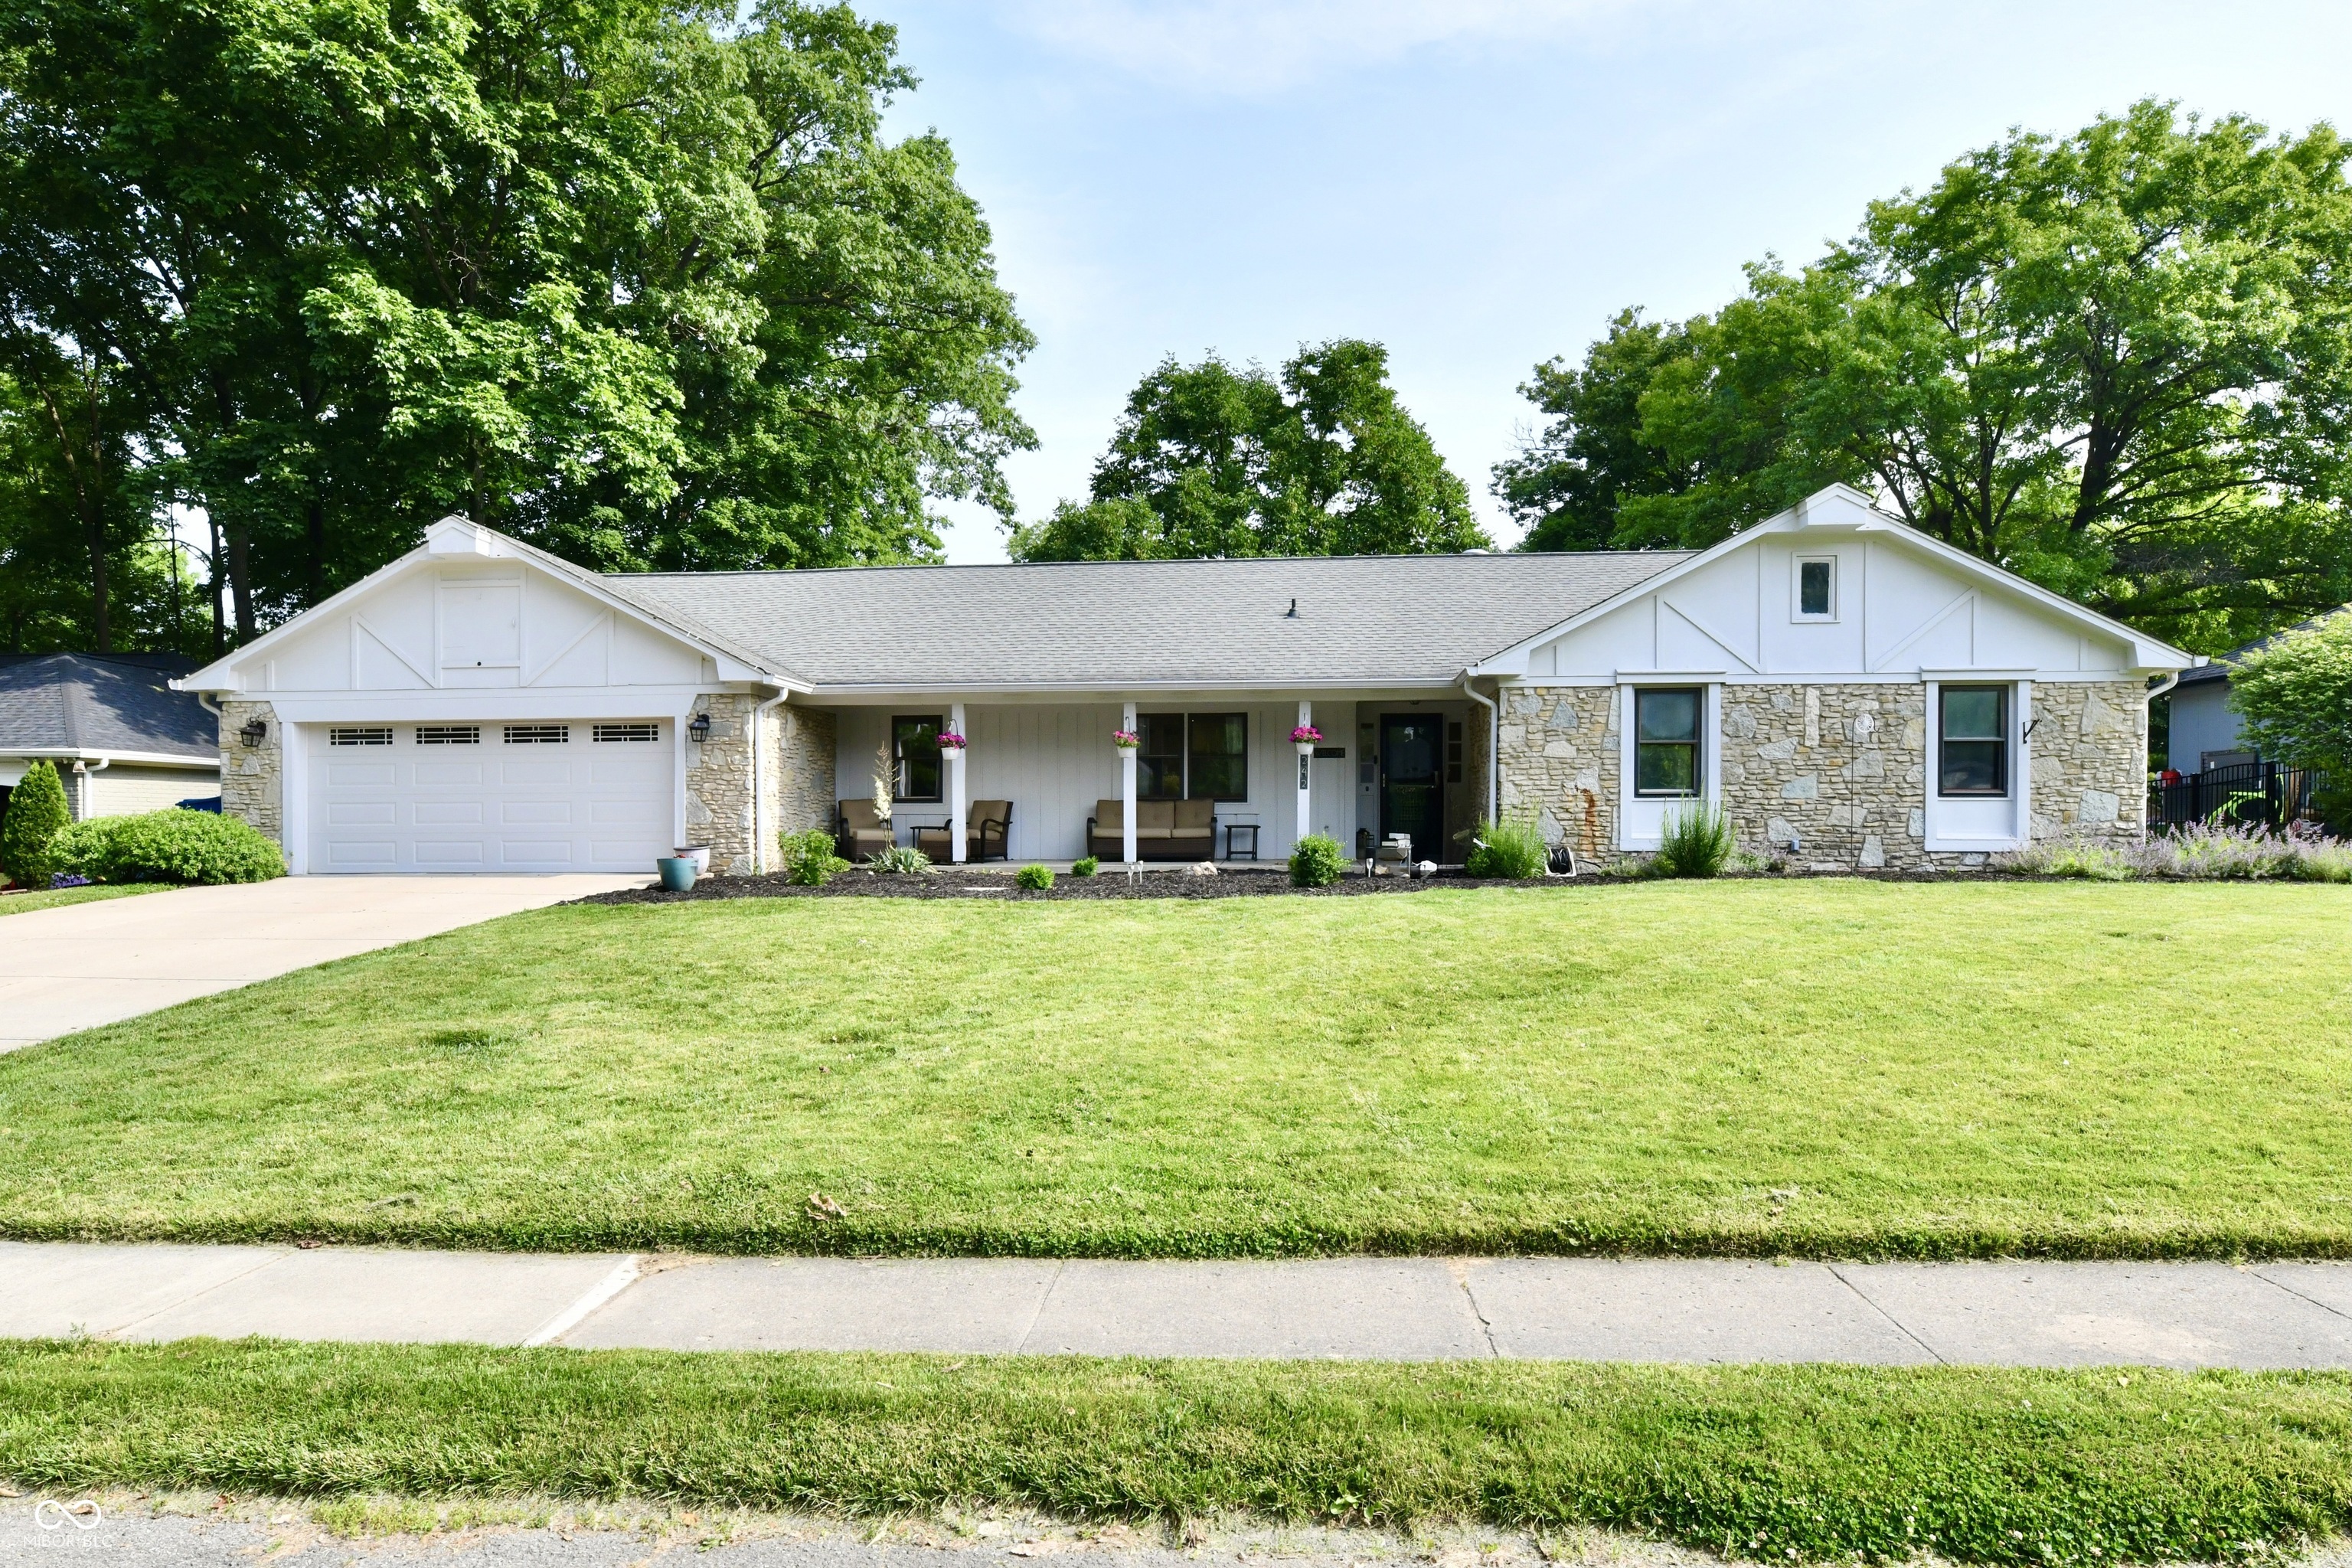
Active
$485,000
4
bds
|
4
ba
|
3,605
sqft
|
built
1974
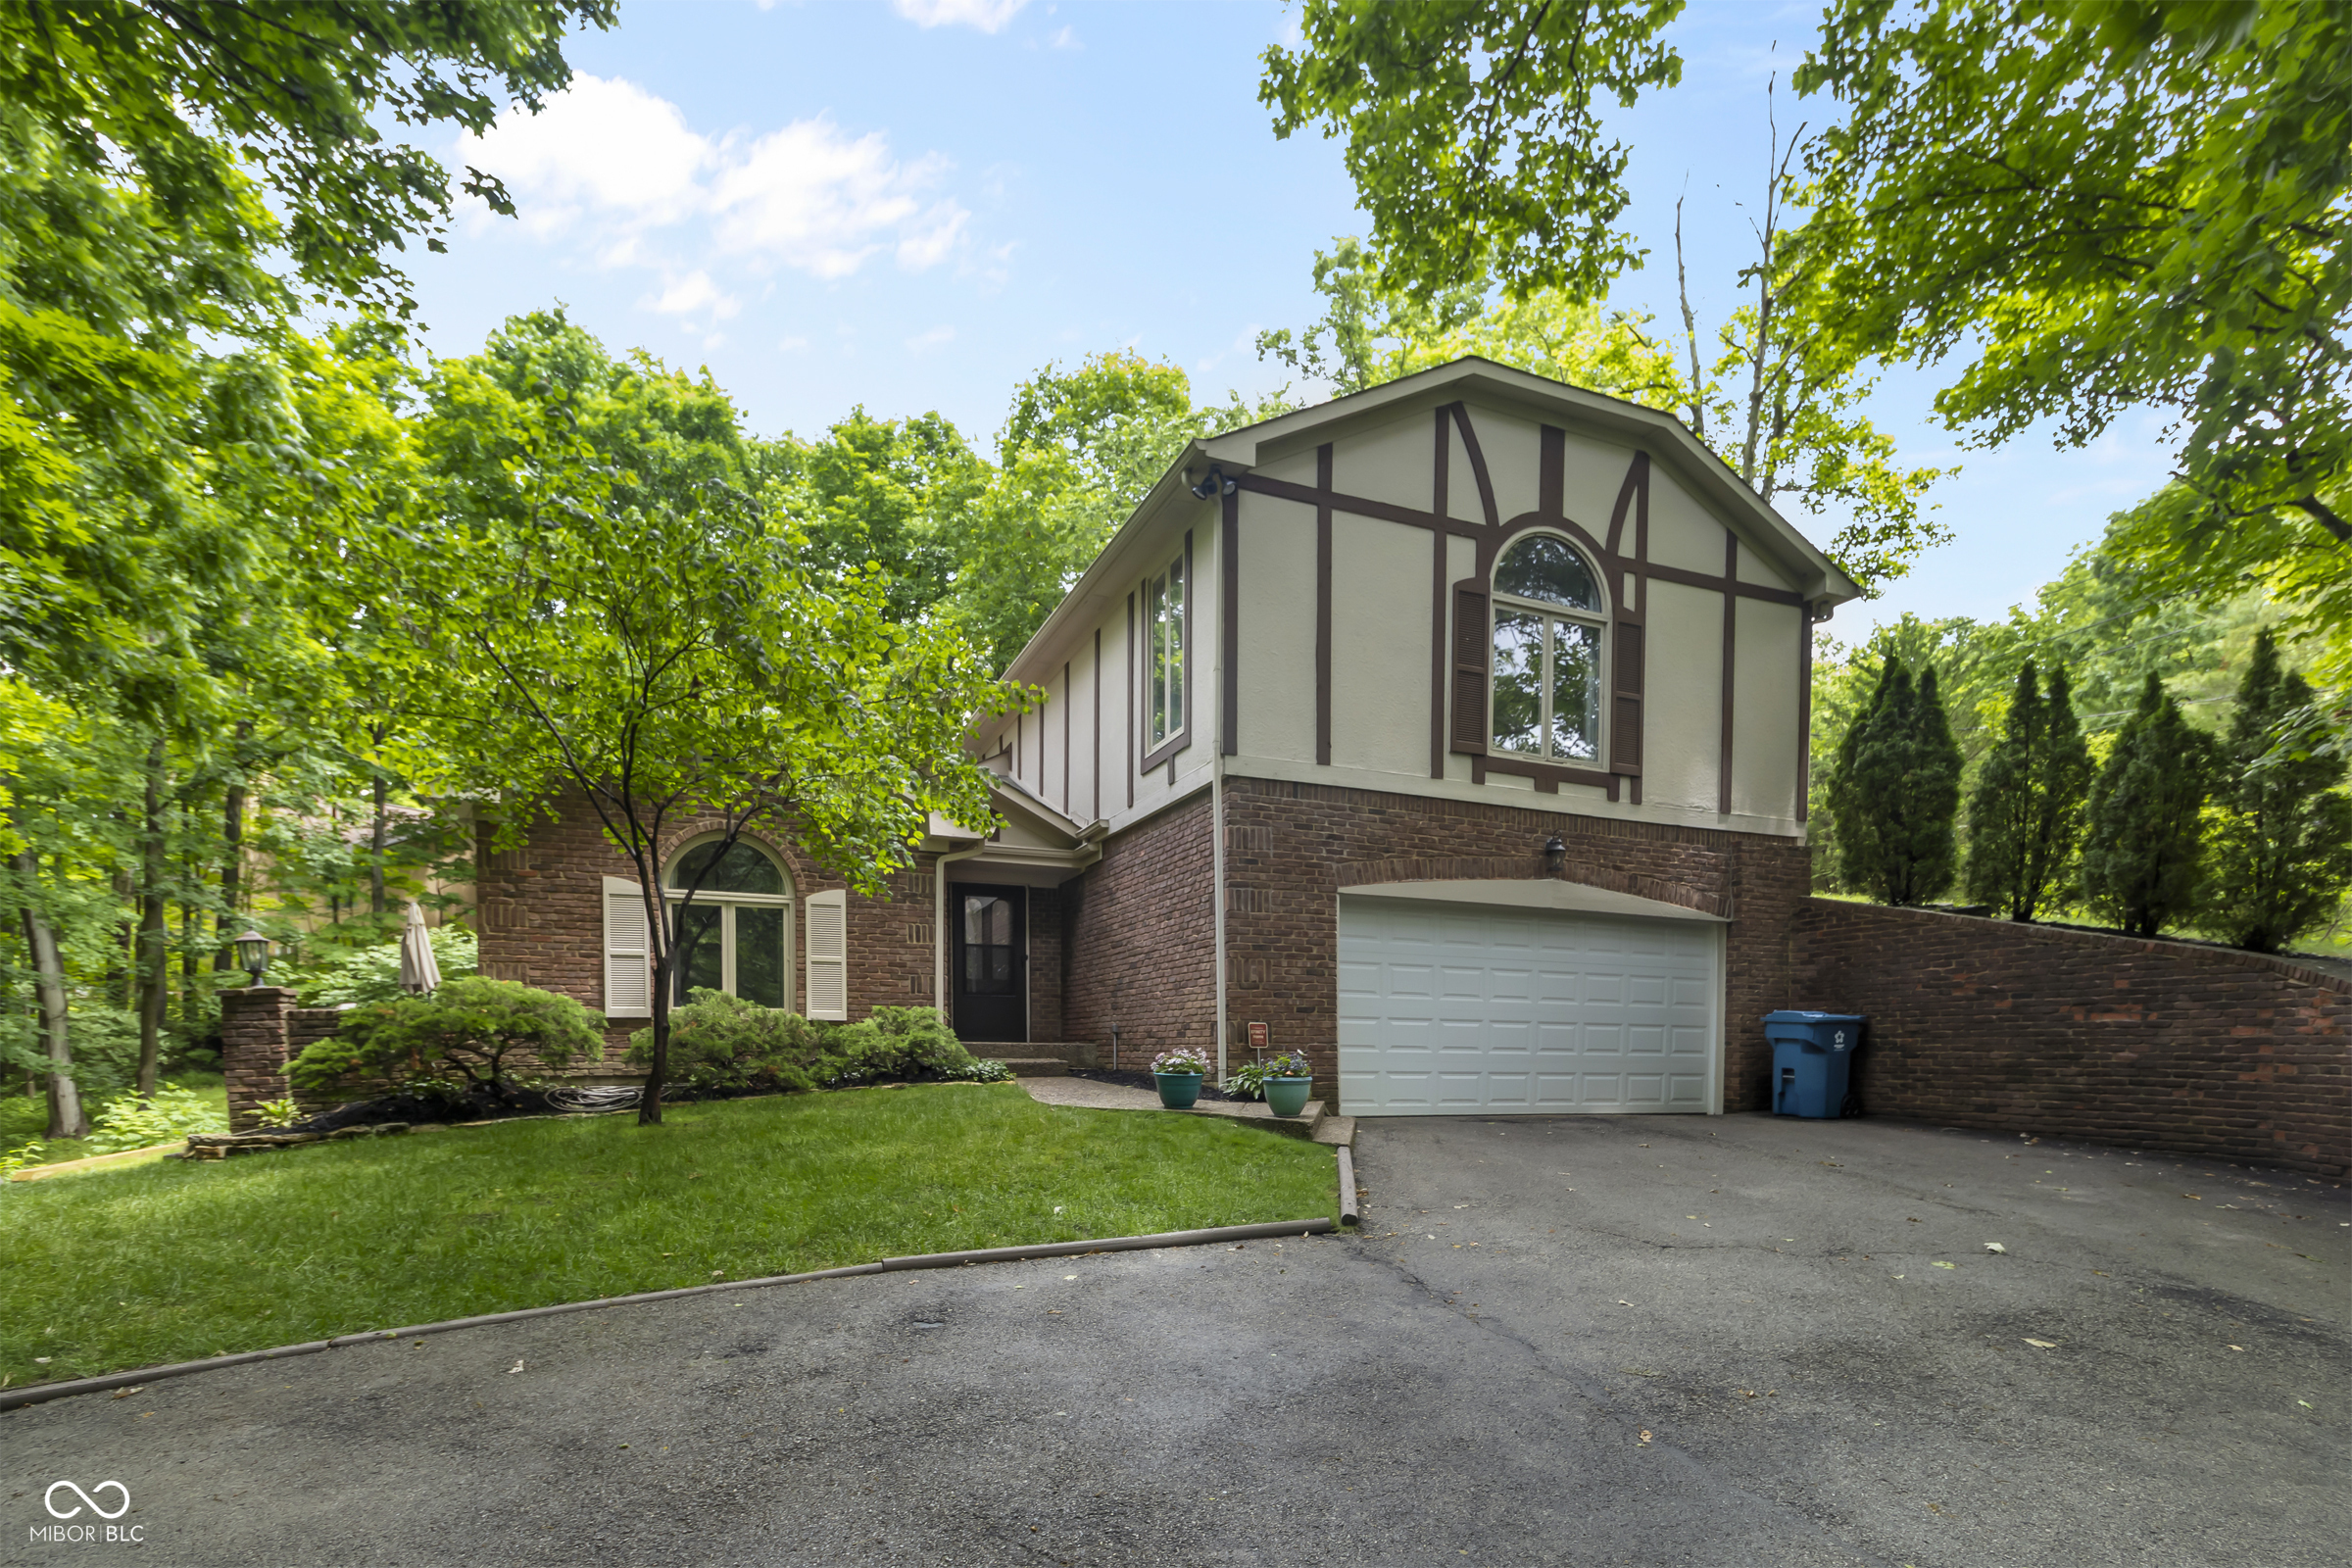
7242 Highburry Dr, Indianapolis, IN 46256
$-276
Cash flow
-3.0%
Cash-on-Cash Return
5.5%
Cap rate
0.7%
Rent to Value Ratio
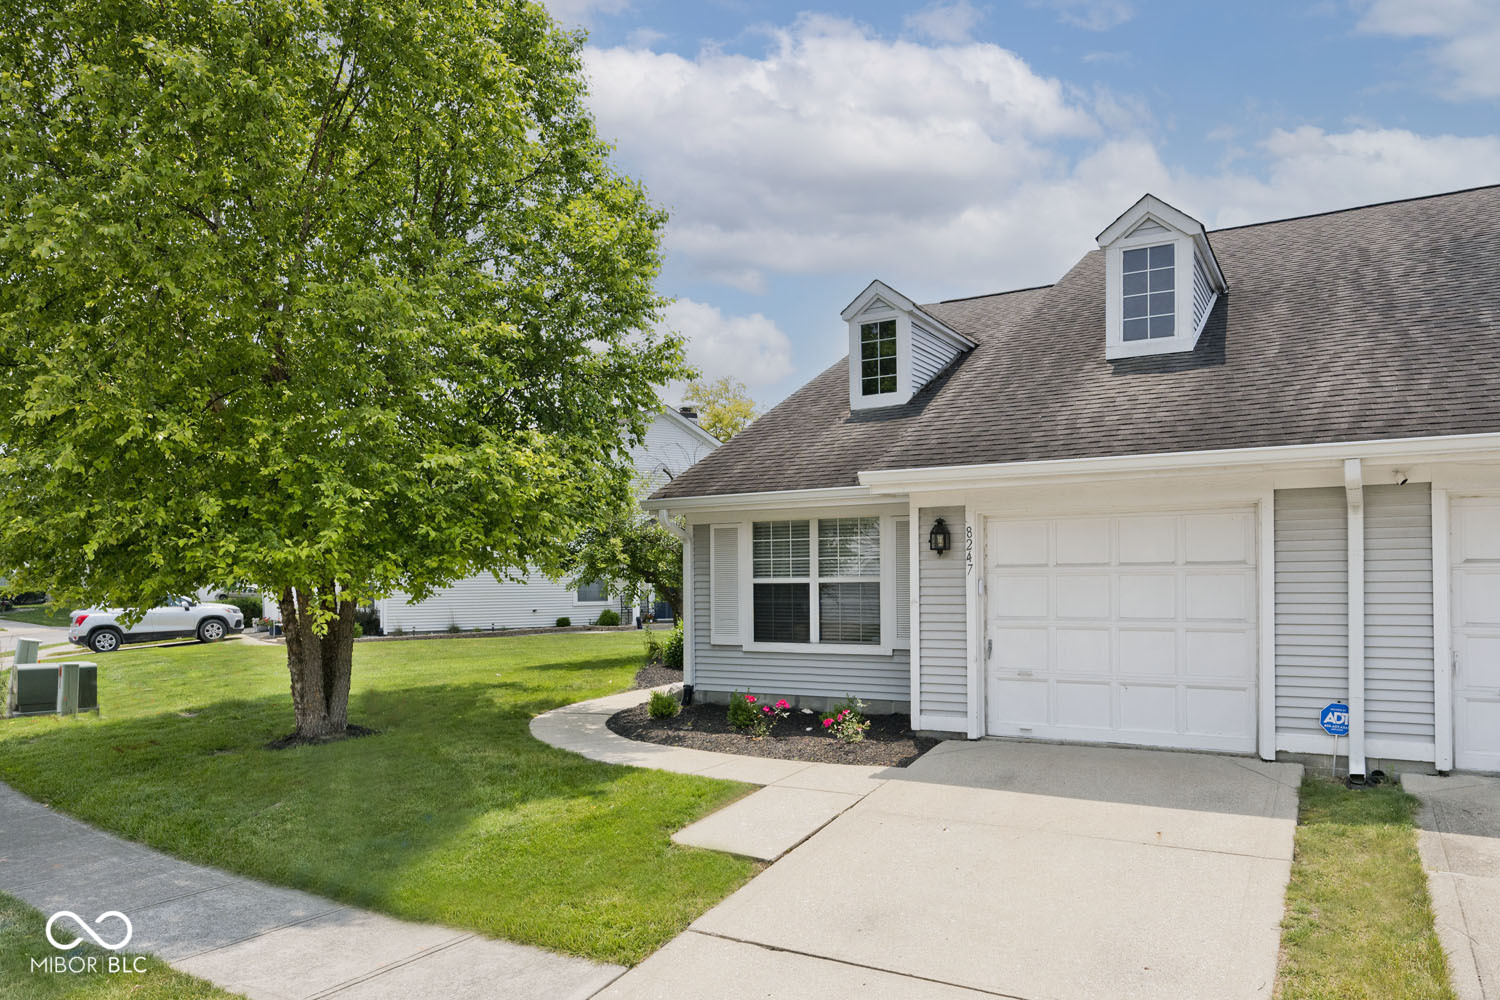
Pending
$259,900
3
bds
|
2
ba
|
1,206
sqft
|
built
1987
8247 Cape Dr N, Indianapolis, IN 46256
$-252
Cash flow
-5.1%
Cash-on-Cash Return
5.0%
Cap rate
0.7%
Rent to Value Ratio
Active
$43,000
bds
|
0
ba
|
576
sqft
|
built
1995
1254 S Leland Ave, Indianapolis, IN 46203
$759
Cash flow
20.6%
Cash-on-Cash Return
21.2%
Cap rate
2.6%
Rent to Value Ratio
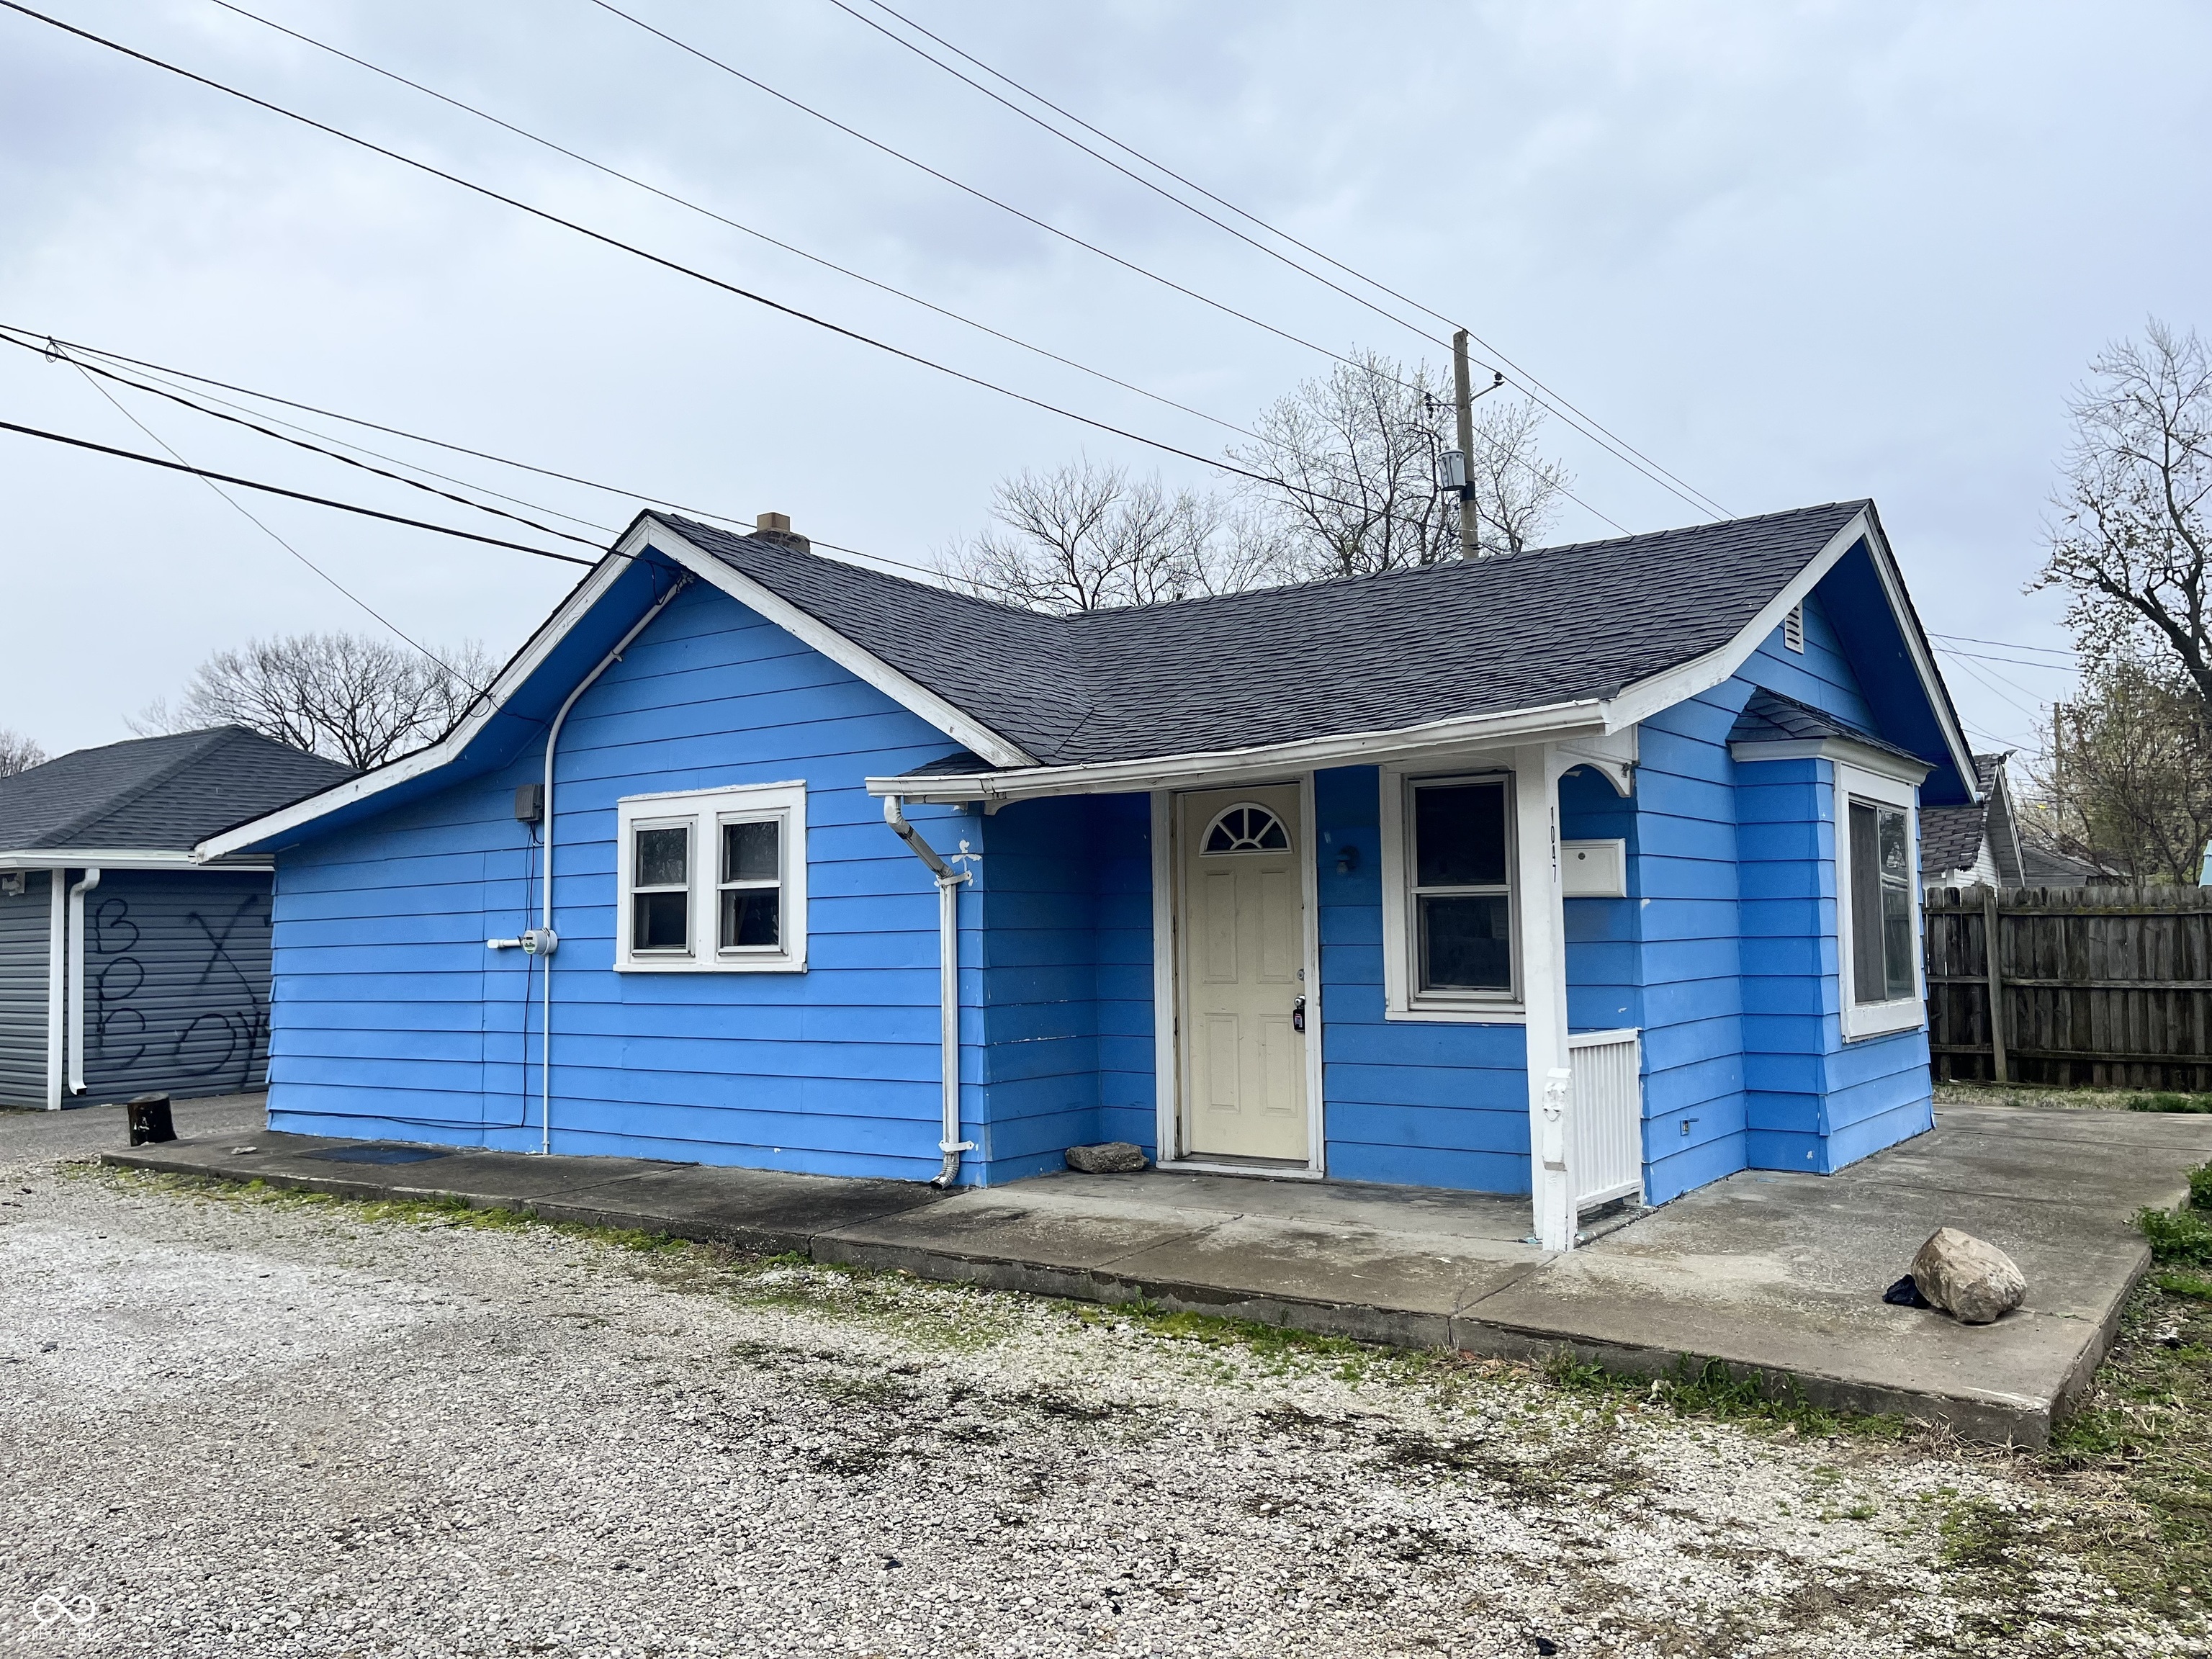
Active
$82,000
2
bds
|
1
ba
|
916
sqft
|
built
1954
1047 N Concord St, Indianapolis, IN 46222
$546
Cash flow
34.7%
Cash-on-Cash Return
14.1%
Cap rate
1.7%
Rent to Value Ratio
Pending
$78,000
2
bds
|
1
ba
|
778
sqft
|
built
1955
1929 Wilcox St, Indianapolis, IN 46222
$566
Cash flow
37.9%
Cash-on-Cash Return
14.9%
Cap rate
1.8%
Rent to Value Ratio
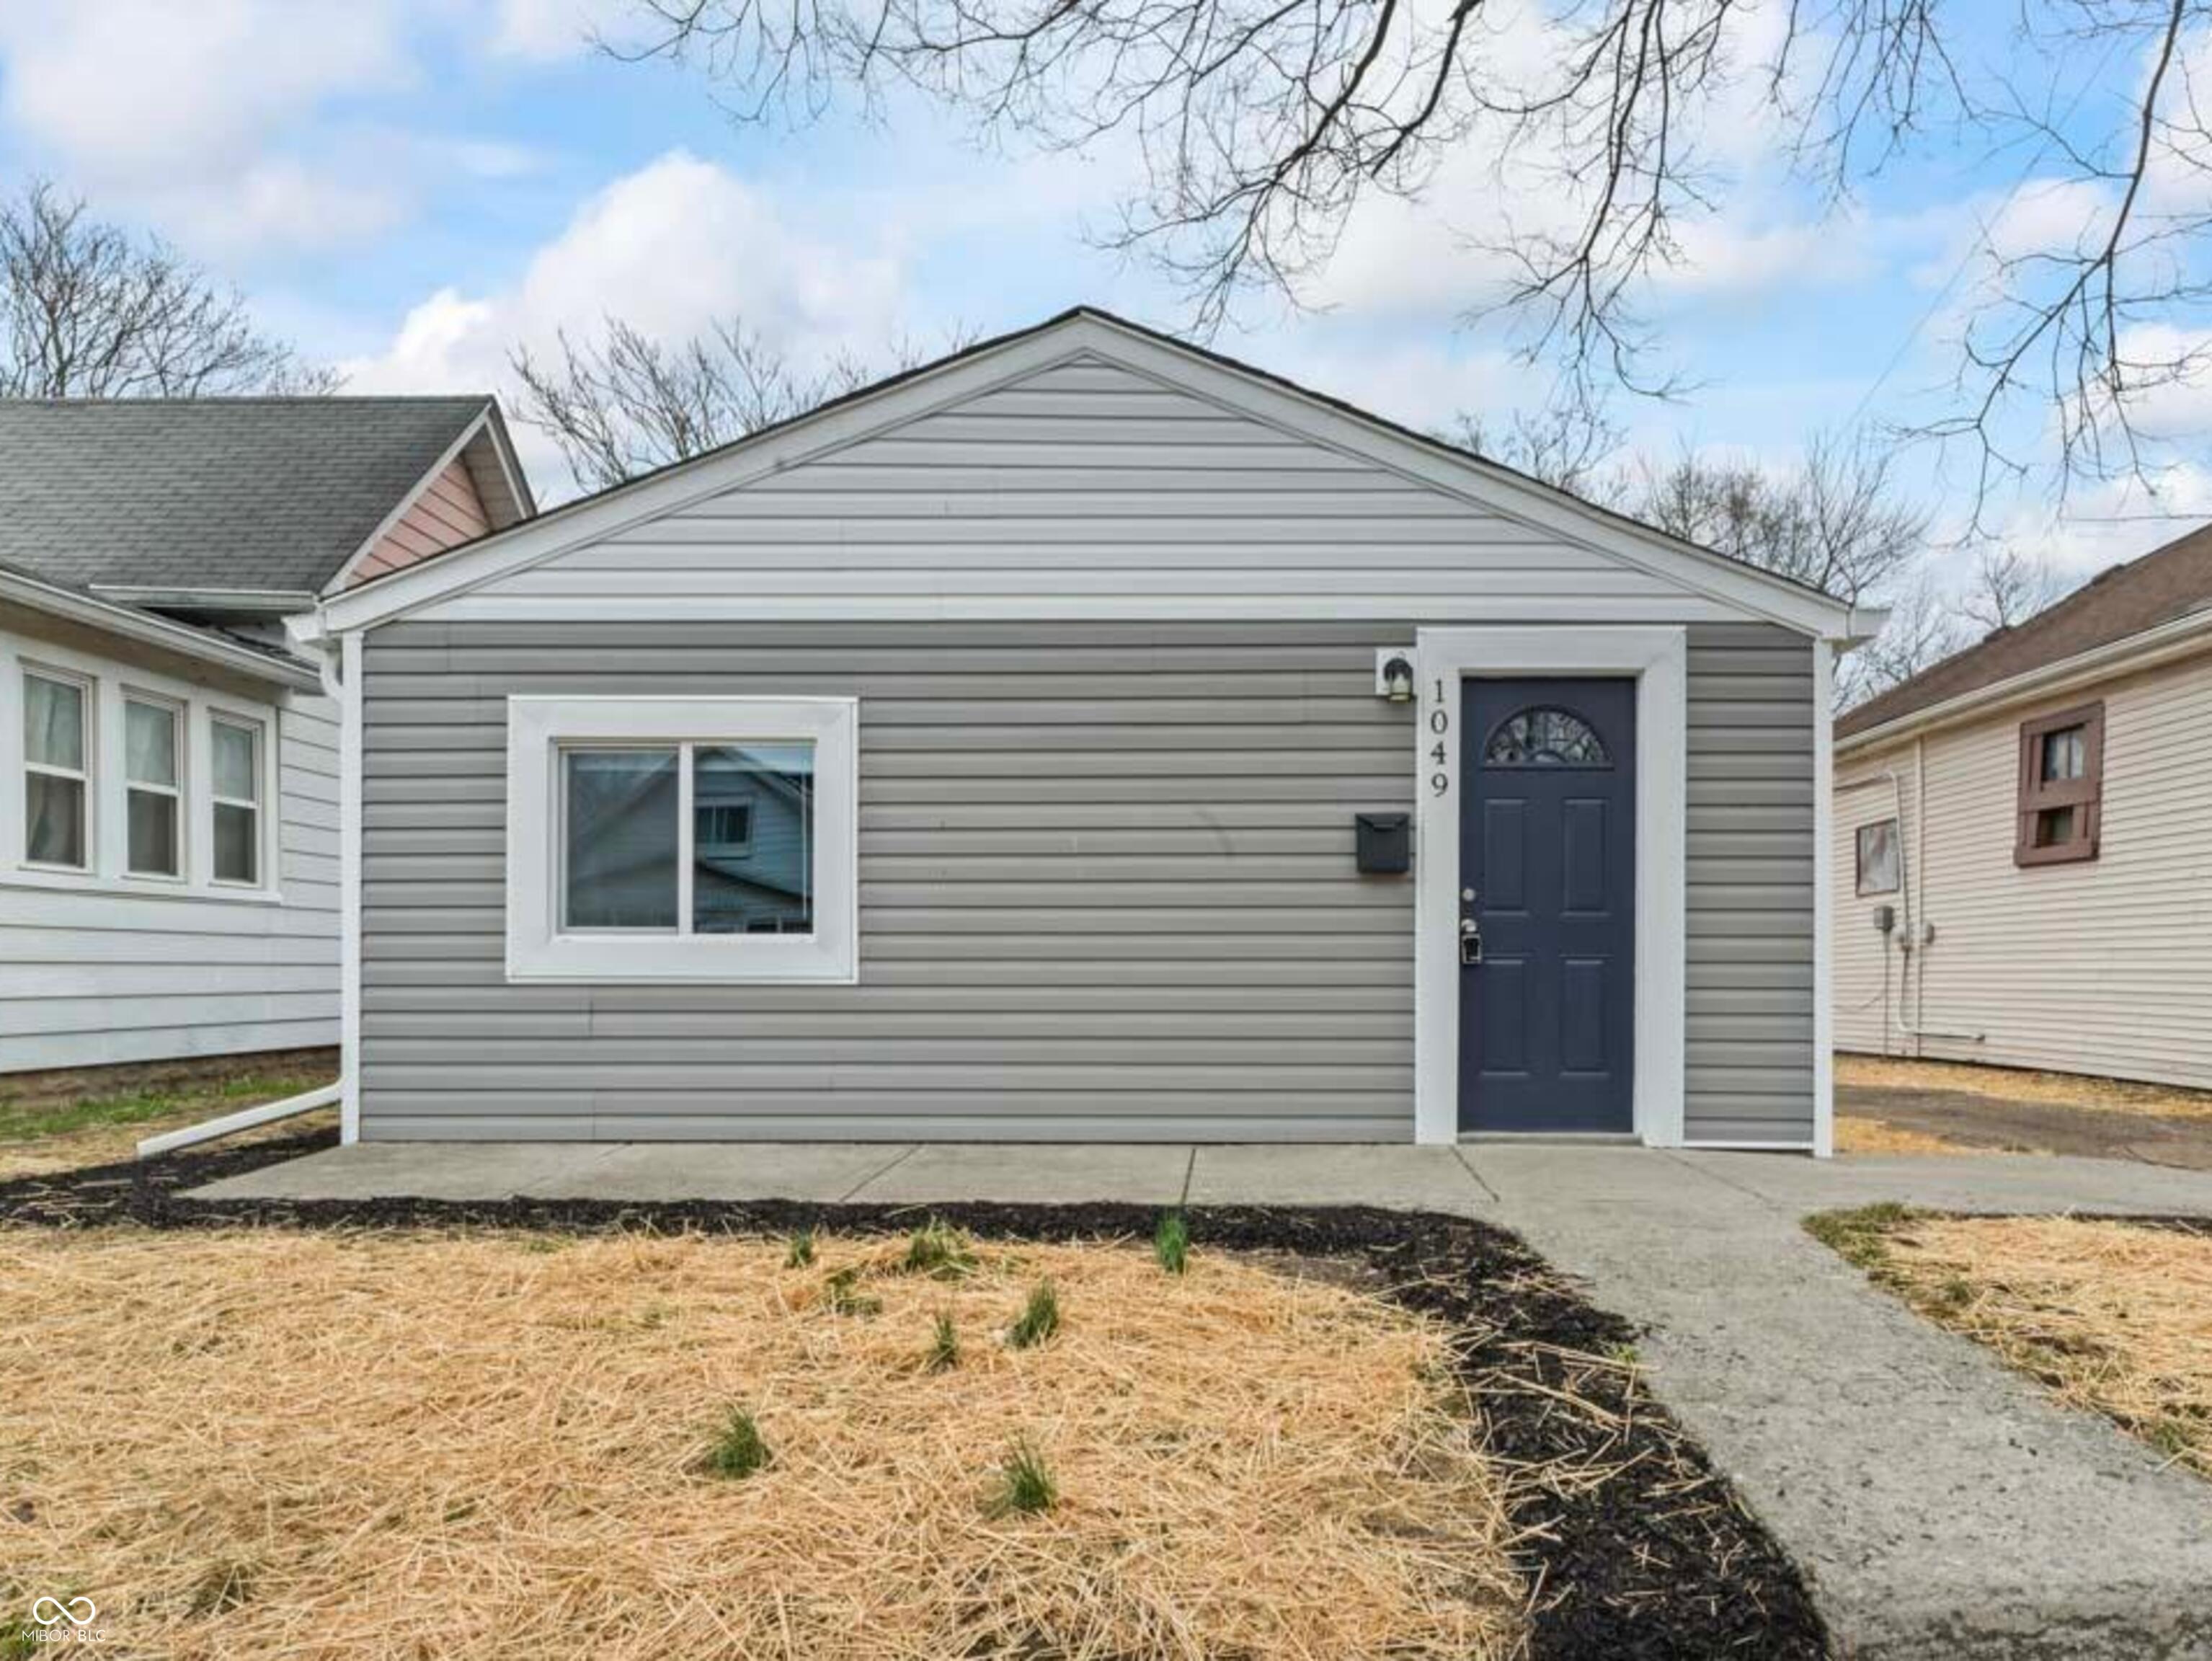
Active
$109,900
2
bds
|
1
ba
|
606
sqft
|
built
1955
1049 N Traub Ave, Indianapolis, IN 46222
$196
Cash flow
9.3%
Cash-on-Cash Return
8.3%
Cap rate
1.0%
Rent to Value Ratio
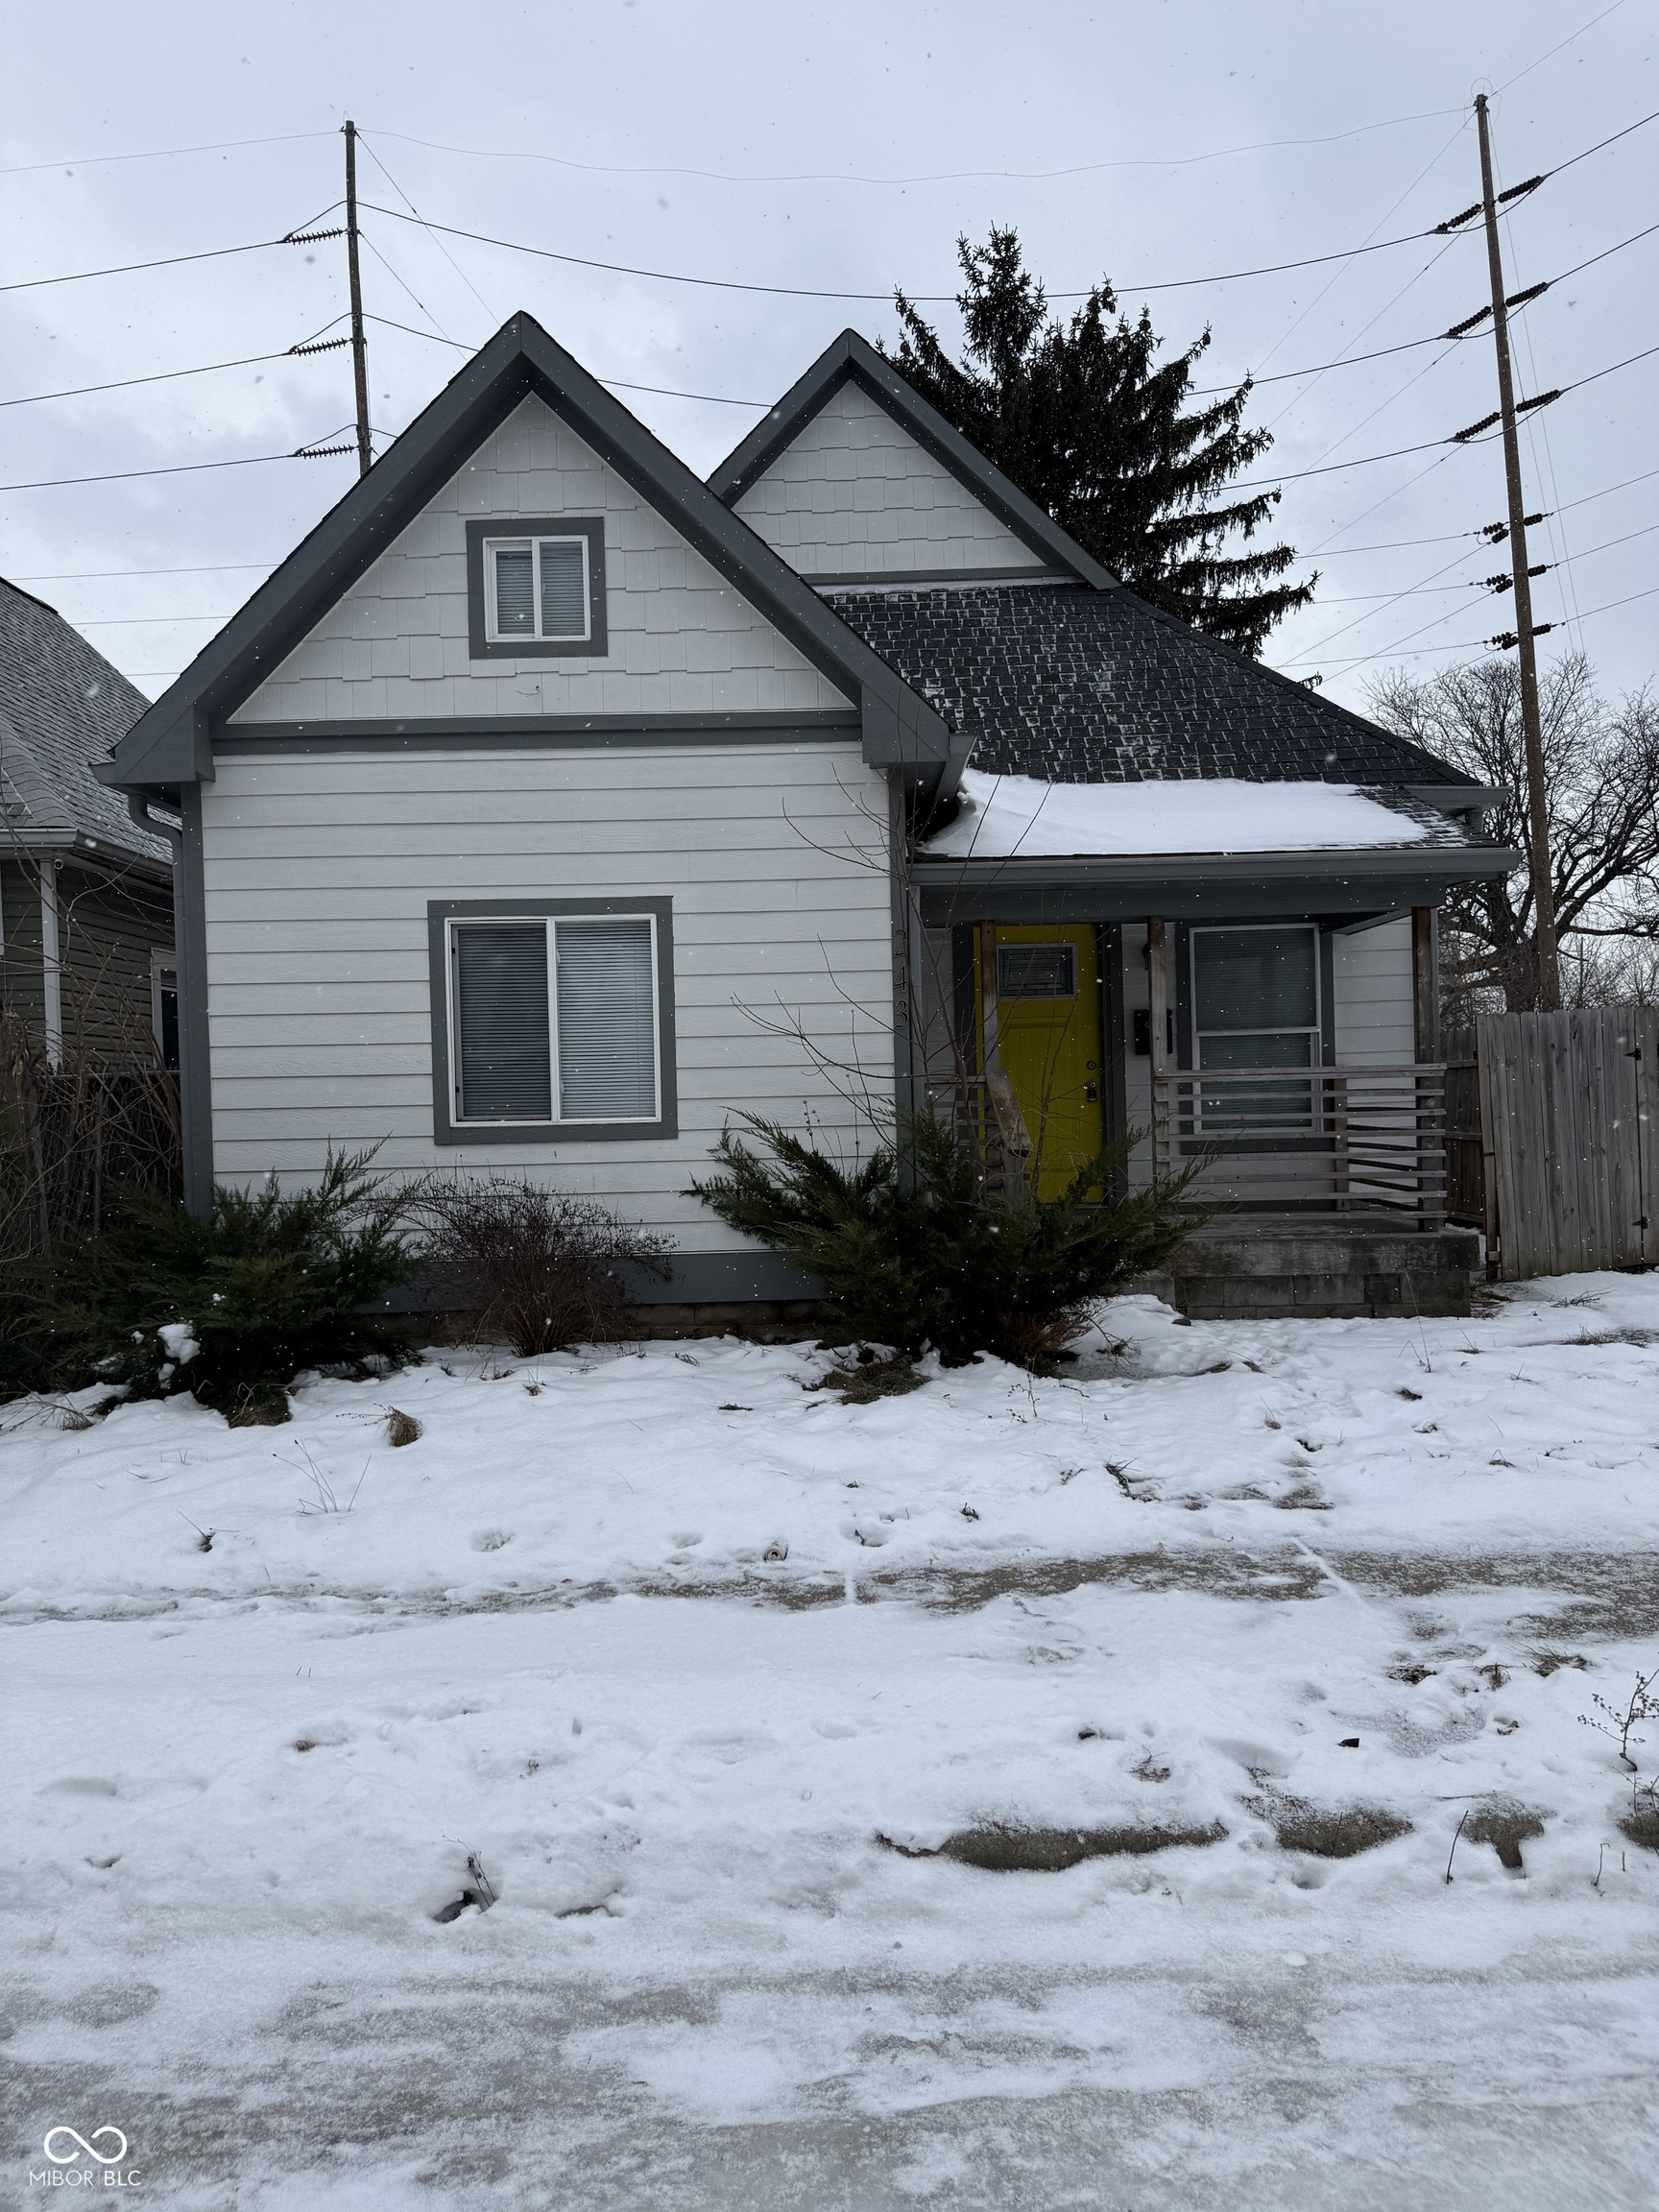
Active
$164,900
3
bds
|
1
ba
|
1,582
sqft
|
built
2014
243 E Caven St, Indianapolis, IN 46225
$121
Cash flow
3.8%
Cash-on-Cash Return
7.0%
Cap rate
0.8%
Rent to Value Ratio
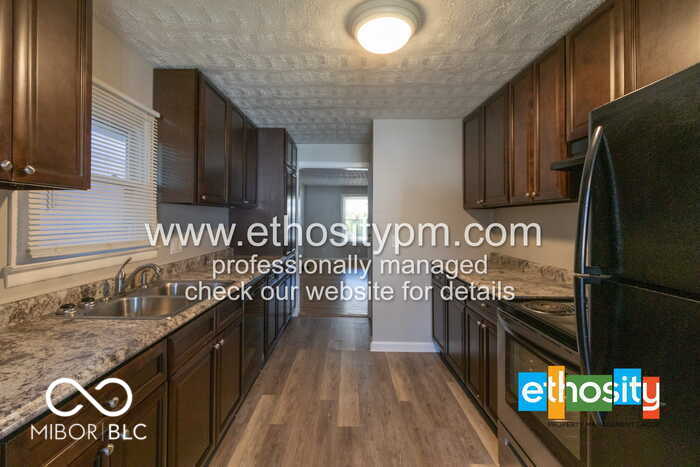
Active
$185,000
3
bds
|
1
ba
|
836
sqft
|
built
1927
531 N Alton Ave, Indianapolis, IN 46222
$18
Cash flow
0.5%
Cash-on-Cash Return
6.3%
Cap rate
0.8%
Rent to Value Ratio
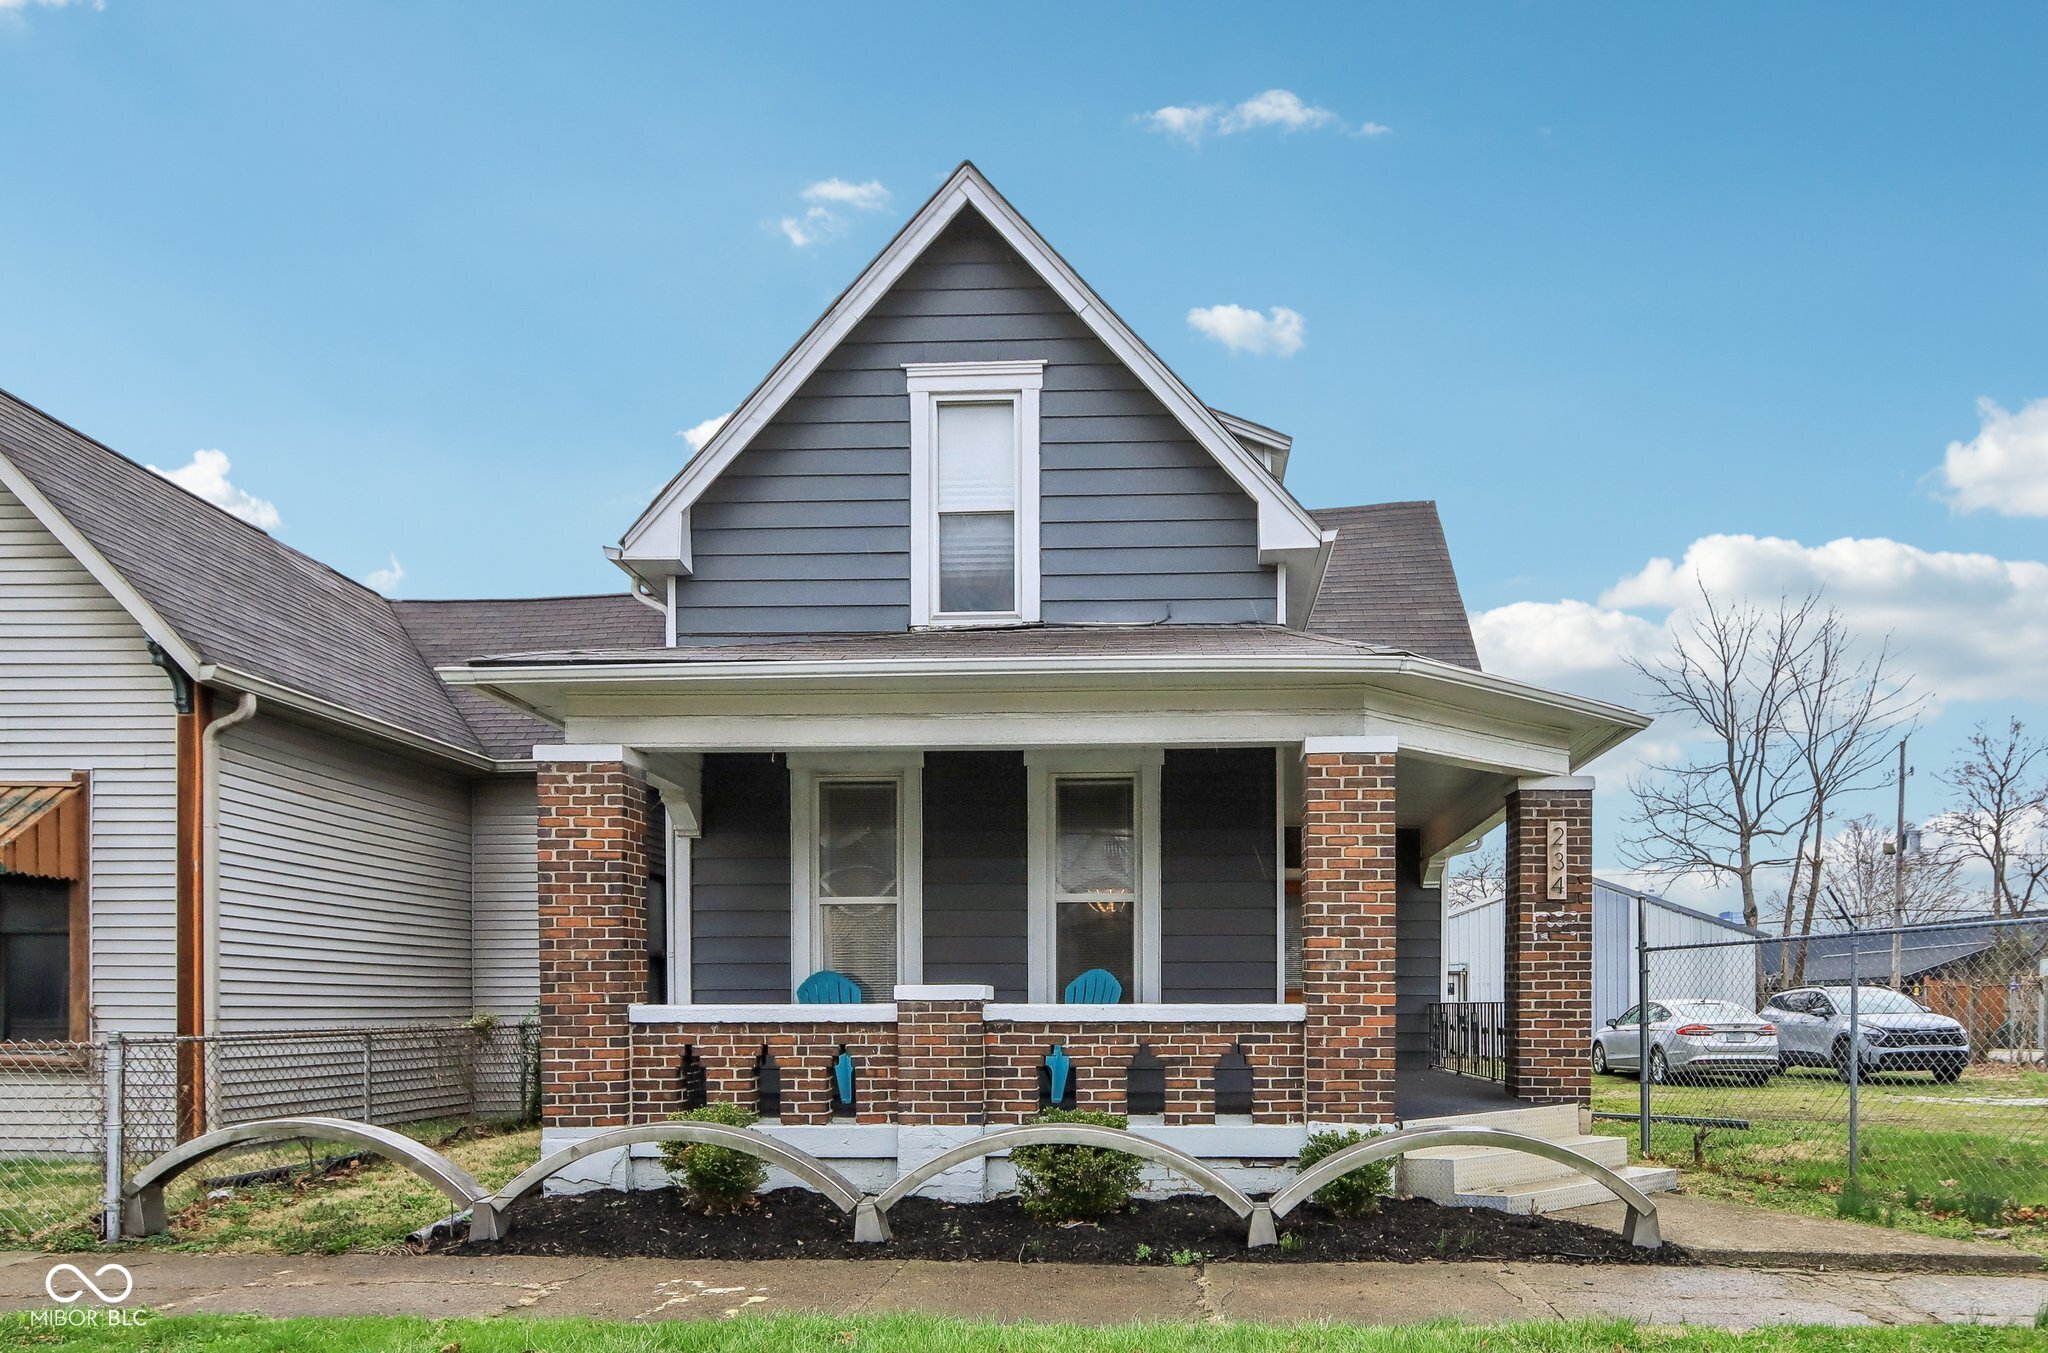
Active
$263,000
4
bds
|
2
ba
|
2,270
sqft
|
built
1920
234 S State Ave, Indianapolis, IN 46201
$240
Cash flow
4.8%
Cash-on-Cash Return
7.2%
Cap rate
0.9%
Rent to Value Ratio
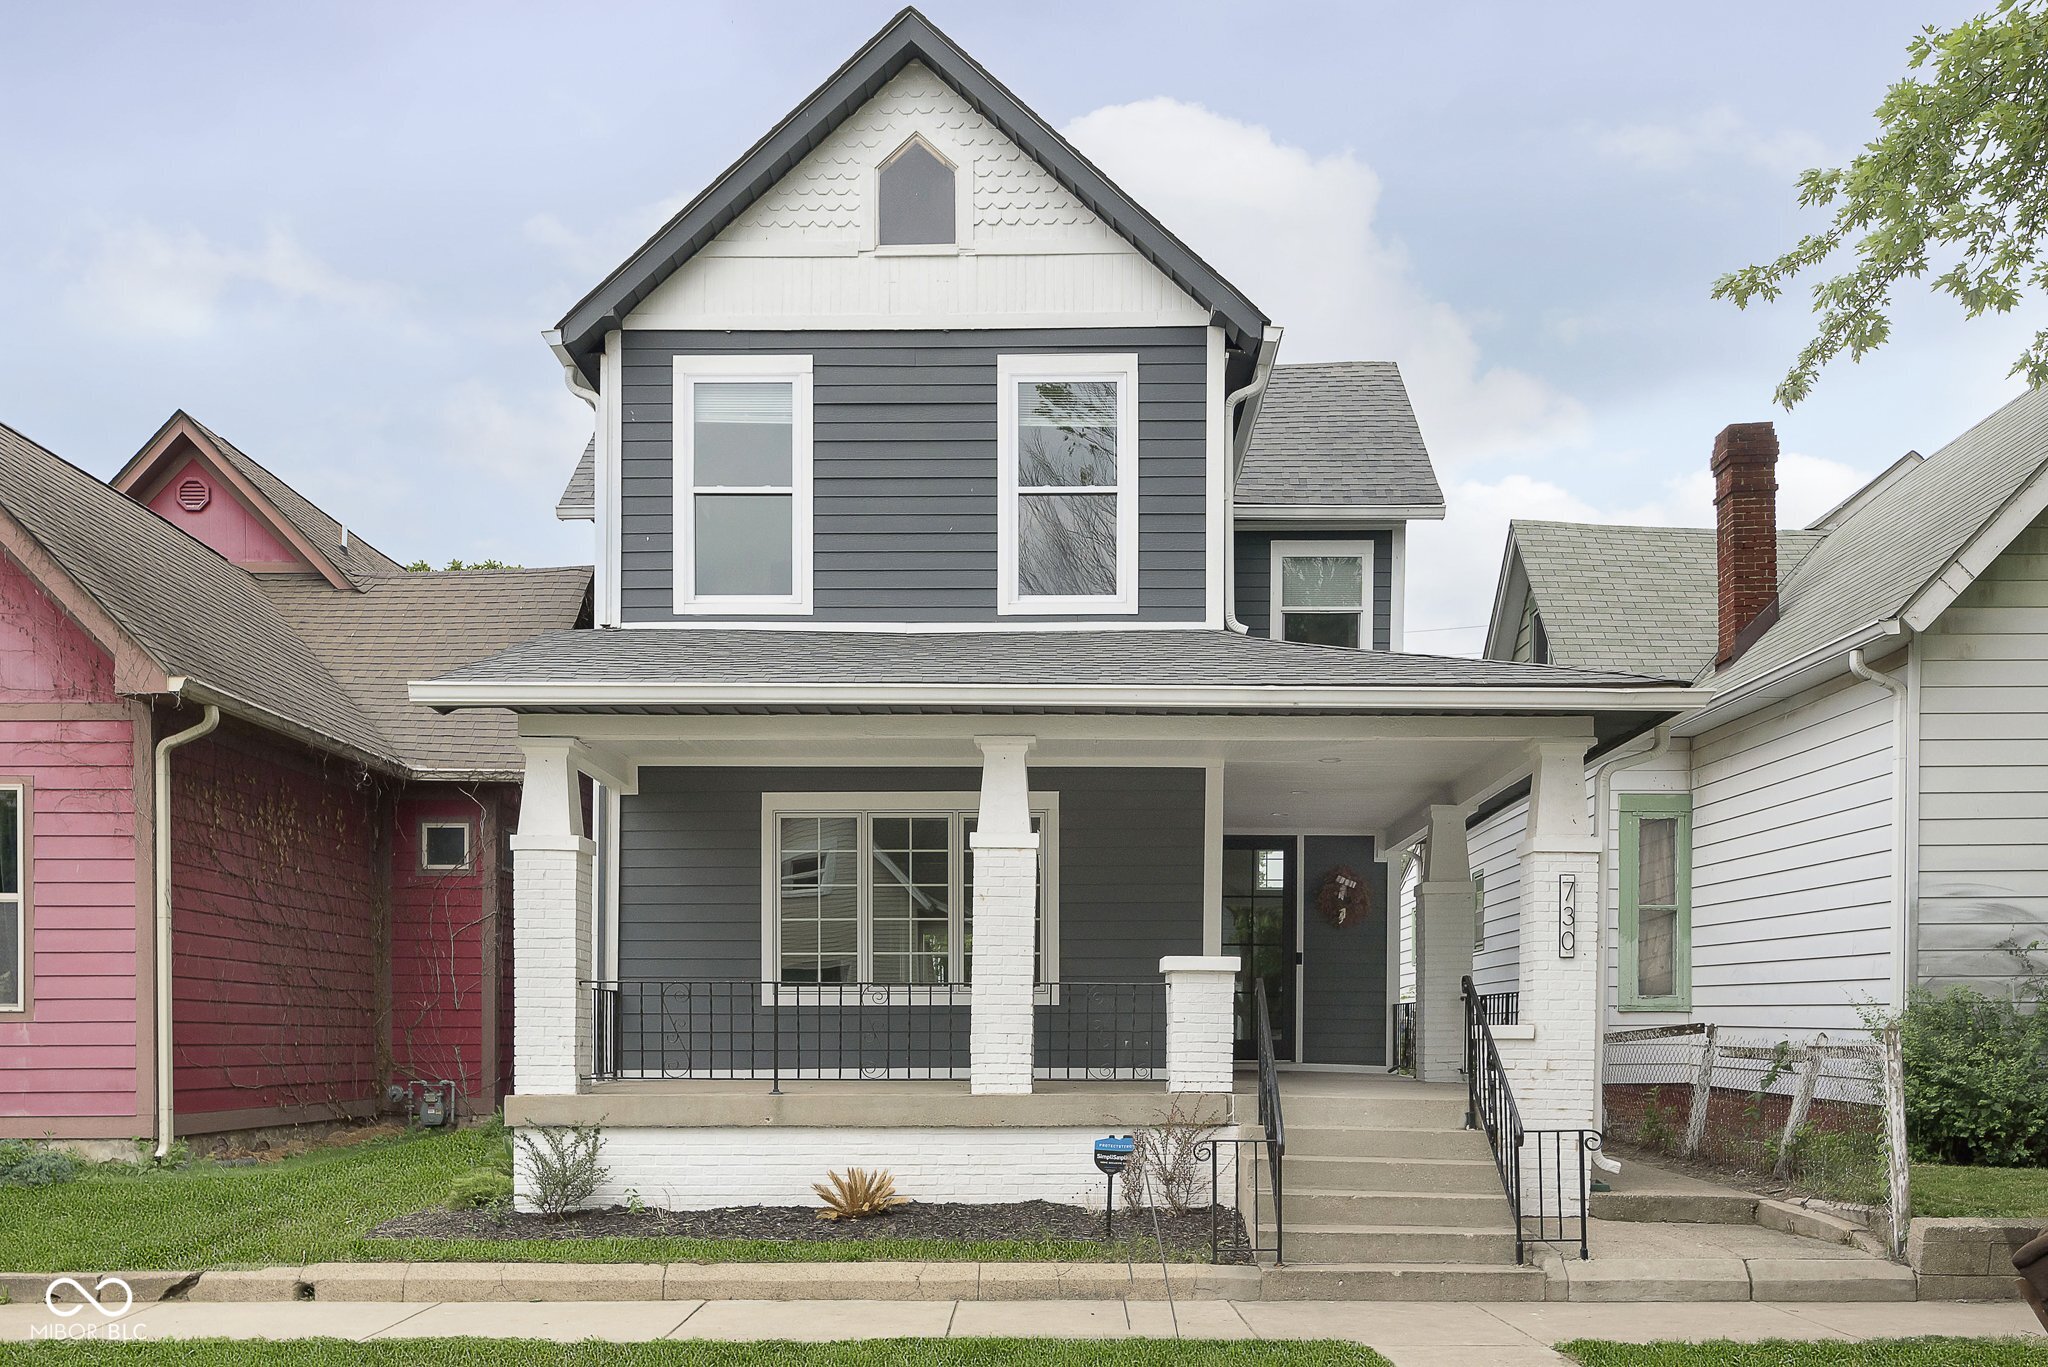
Active
$359,900
3
bds
|
3
ba
|
1,760
sqft
|
built
1880
730 Sanders St, Indianapolis, IN 46203
$88
Cash flow
1.3%
Cash-on-Cash Return
6.4%
Cap rate
0.8%
Rent to Value Ratio
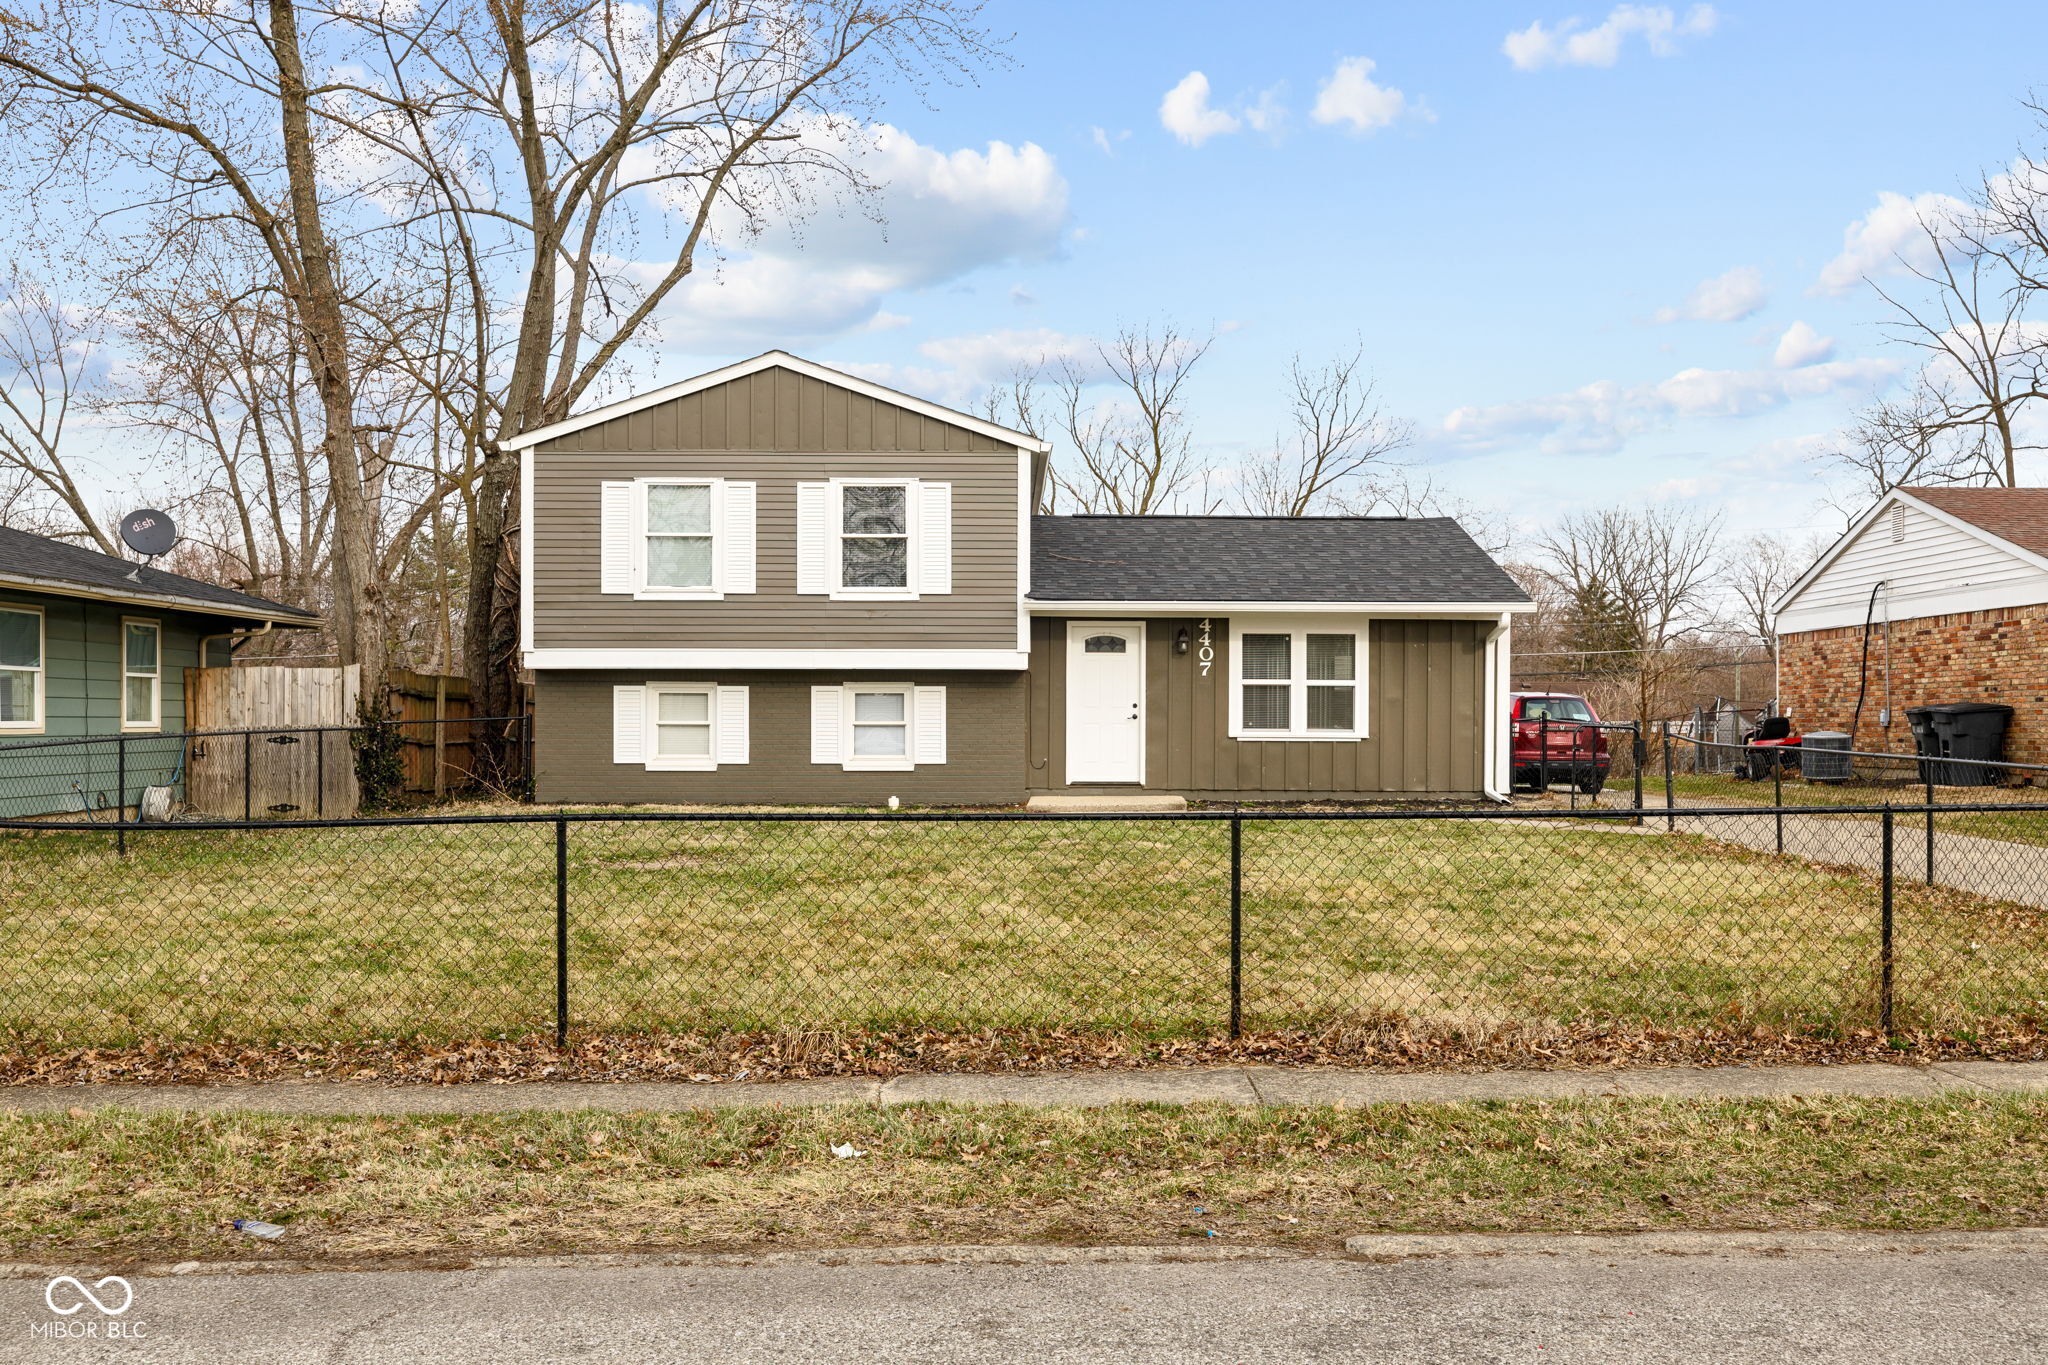
Active
$250,000
4
bds
|
2
ba
|
1,616
sqft
|
built
1960
4407 Barnor Dr, Indianapolis, IN 46226
$99
Cash flow
2.1%
Cash-on-Cash Return
6.6%
Cap rate
0.8%
Rent to Value Ratio
Active
$155,000
3
bds
|
1
ba
|
1,809
sqft
|
built
1949
3305 N Keystone Ave, Indianapolis, IN 46218
$103
Cash flow
3.5%
Cash-on-Cash Return
6.9%
Cap rate
0.8%
Rent to Value Ratio
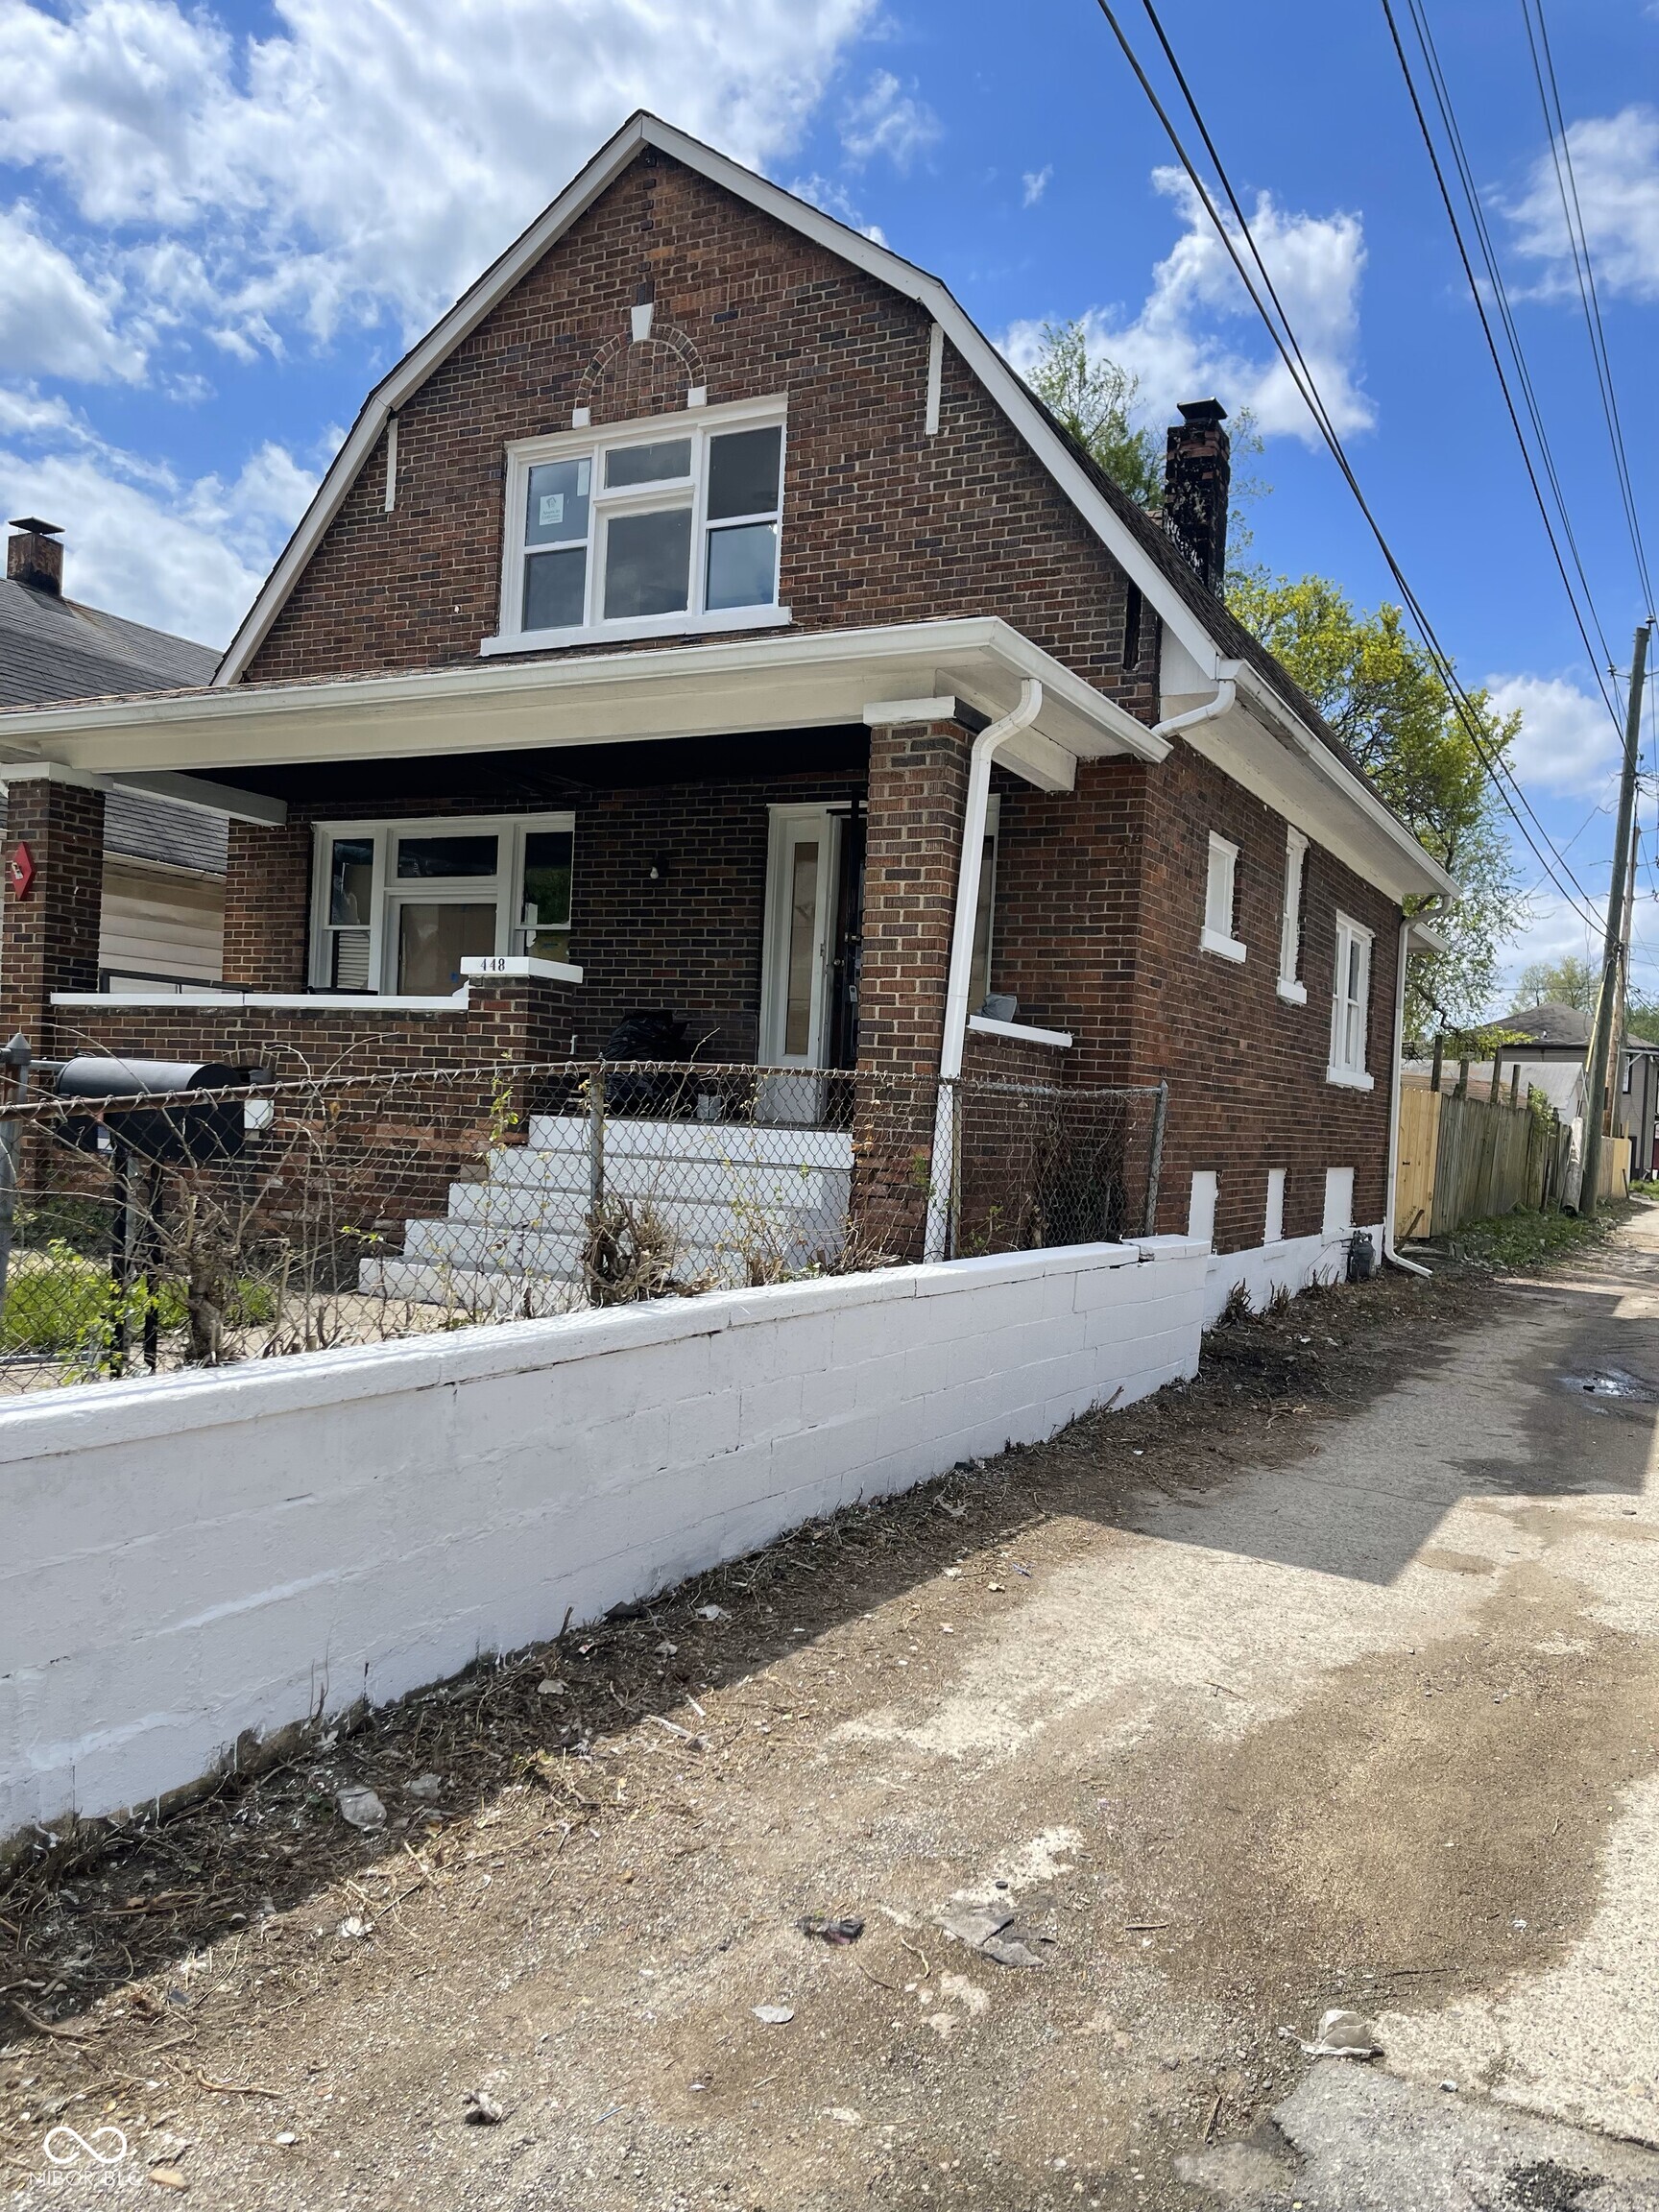
Active
$175,000
2
bds
|
1
ba
|
1,642
sqft
|
built
1920
448 N Gray St, Indianapolis, IN 46201
$208
Cash flow
6.2%
Cash-on-Cash Return
7.6%
Cap rate
0.9%
Rent to Value Ratio
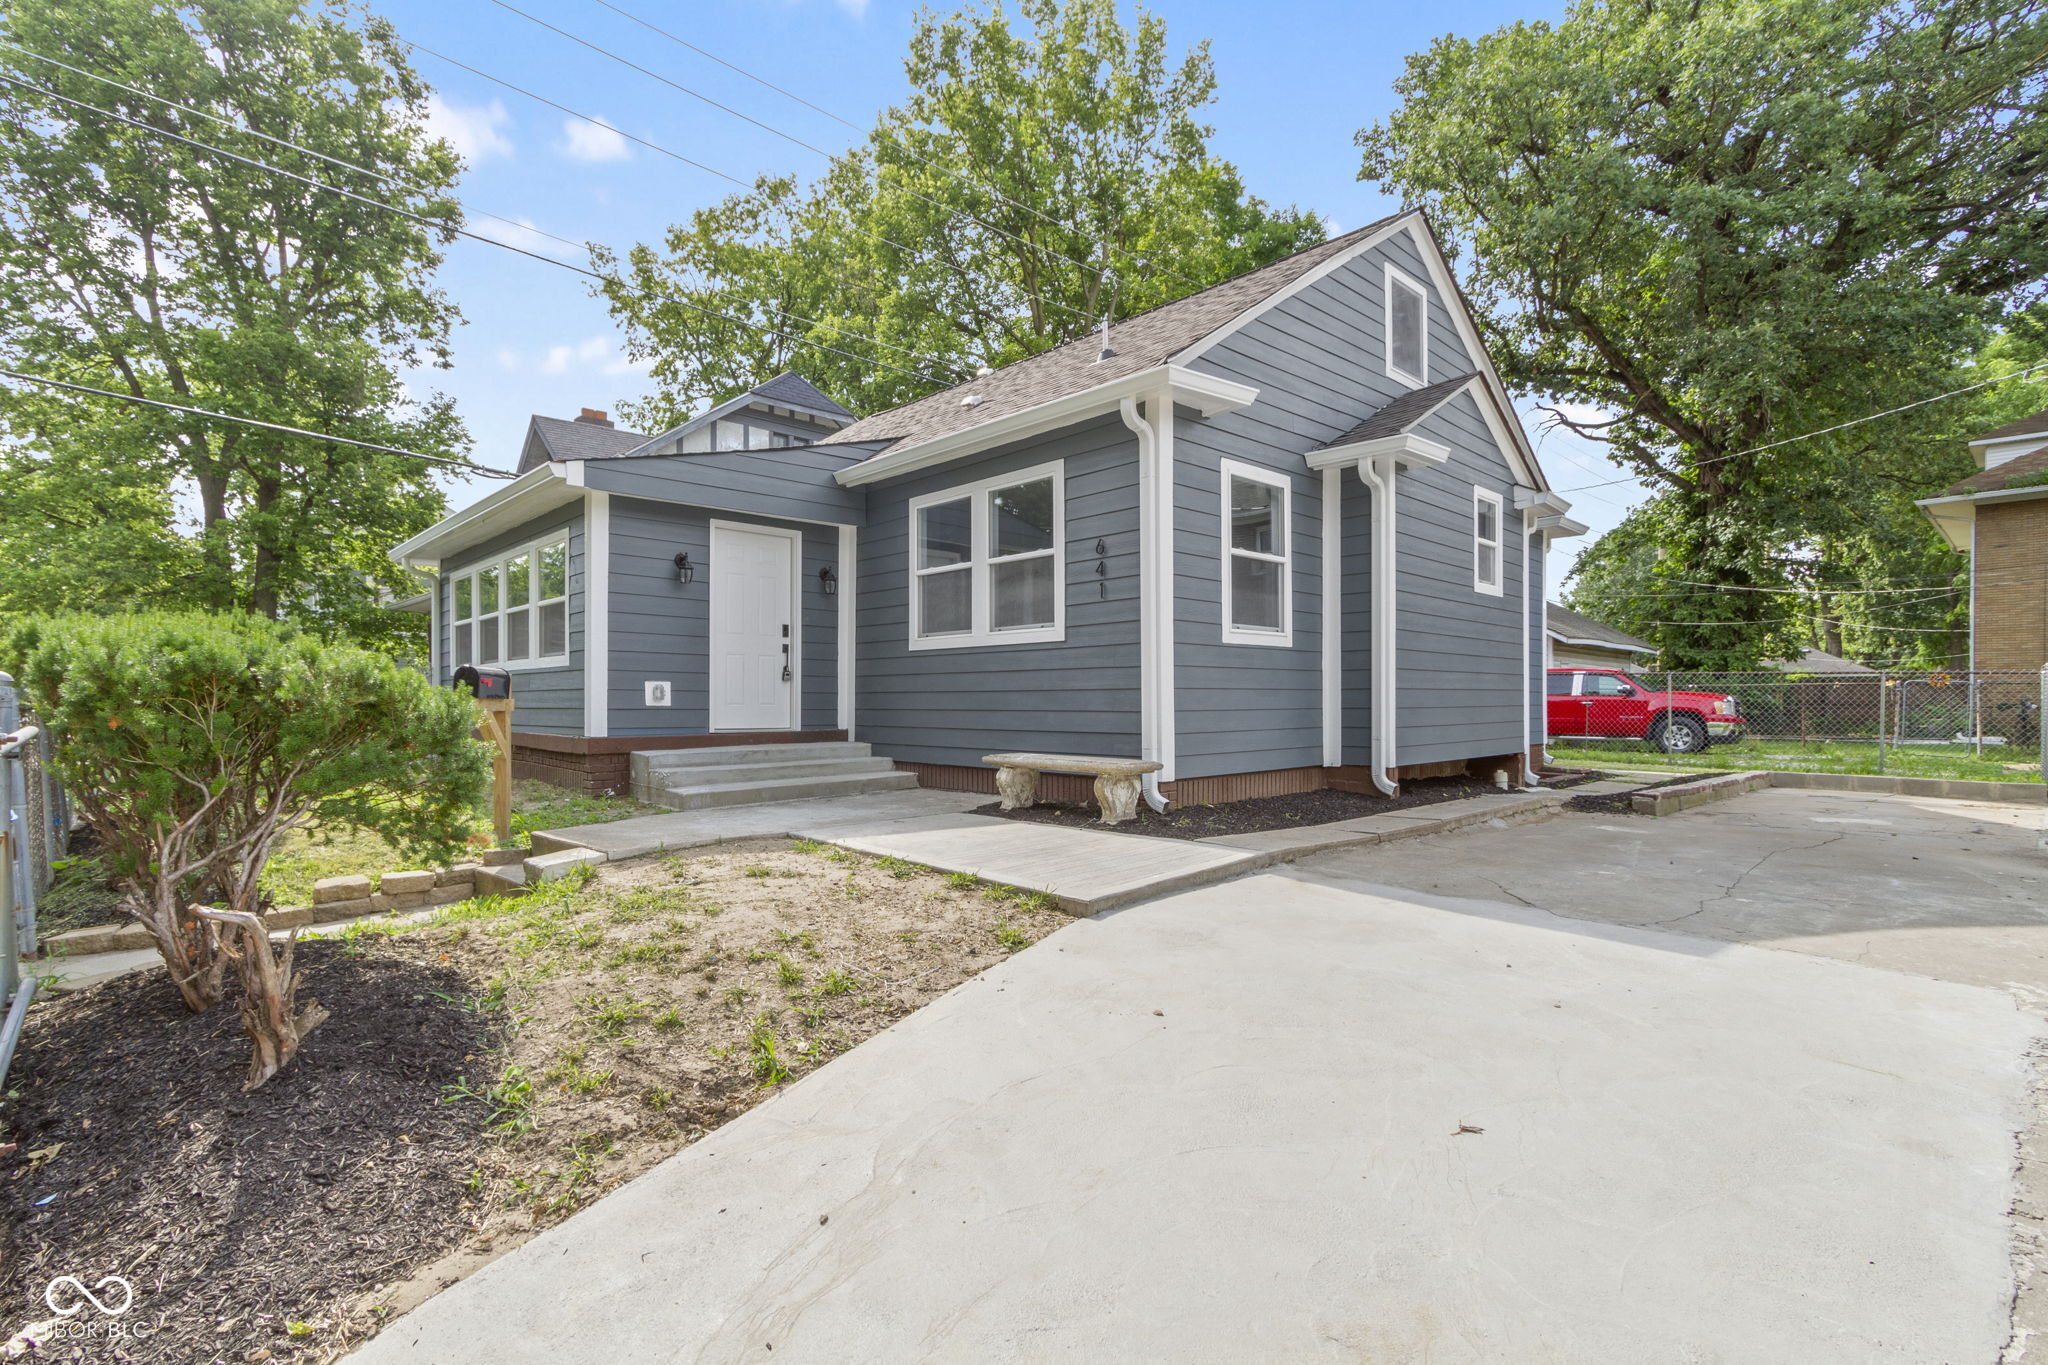
Active
$249,950
4
bds
|
3
ba
|
1,963
sqft
|
built
1923
641 E 33rd St, Indianapolis, IN 46205
$100
Cash flow
2.1%
Cash-on-Cash Return
6.6%
Cap rate
0.8%
Rent to Value Ratio
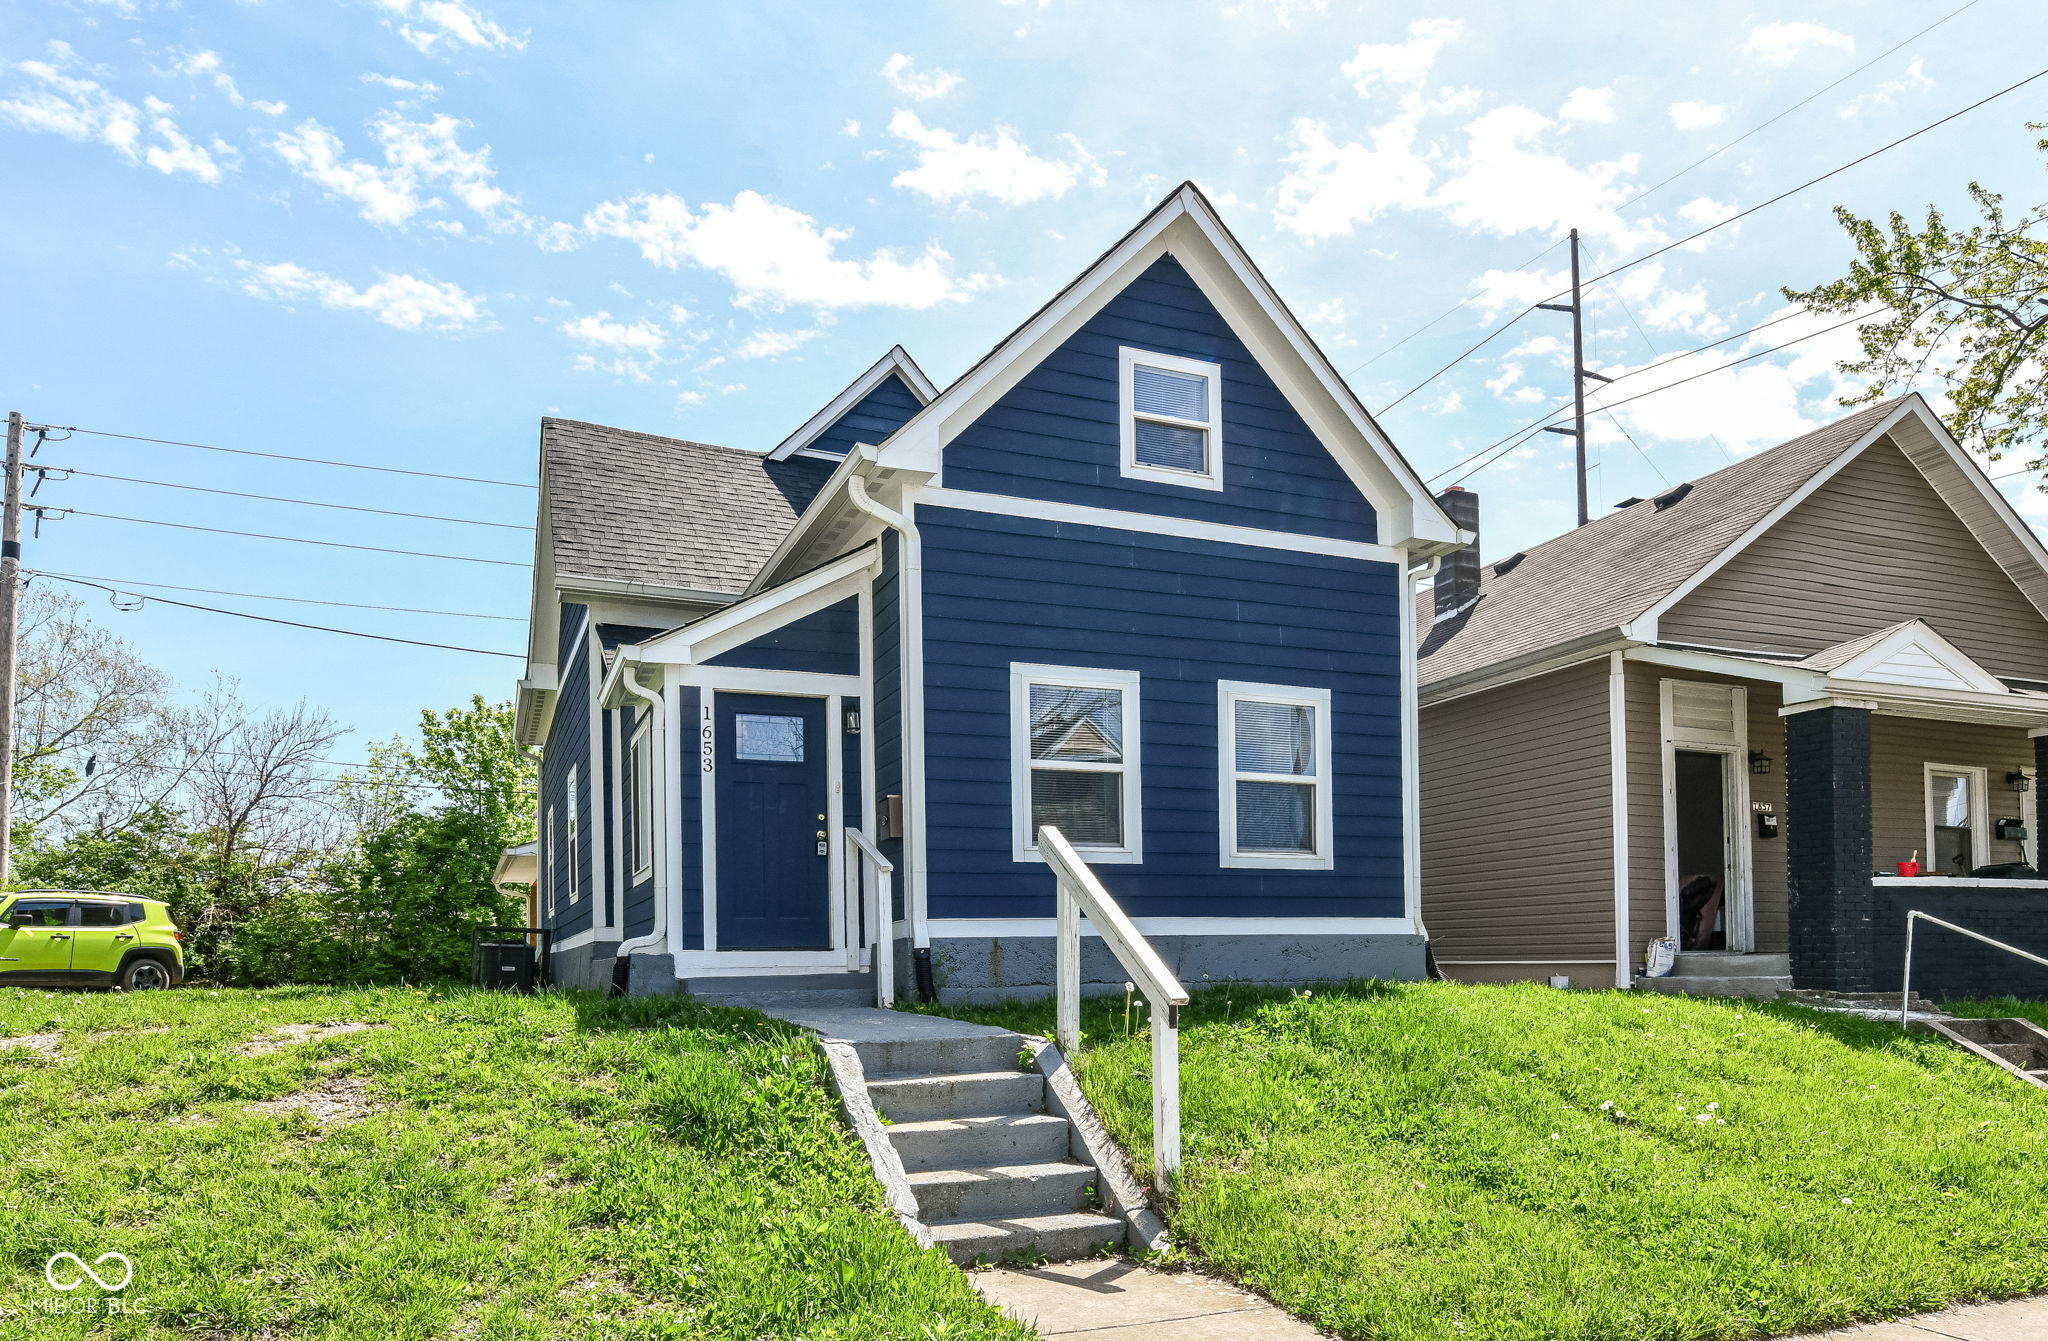
Active
$245,000
3
bds
|
3
ba
|
1,928
sqft
|
built
1885
1653 S Delaware St, Indianapolis, IN 46225
$263
Cash flow
5.6%
Cash-on-Cash Return
7.4%
Cap rate
0.9%
Rent to Value Ratio
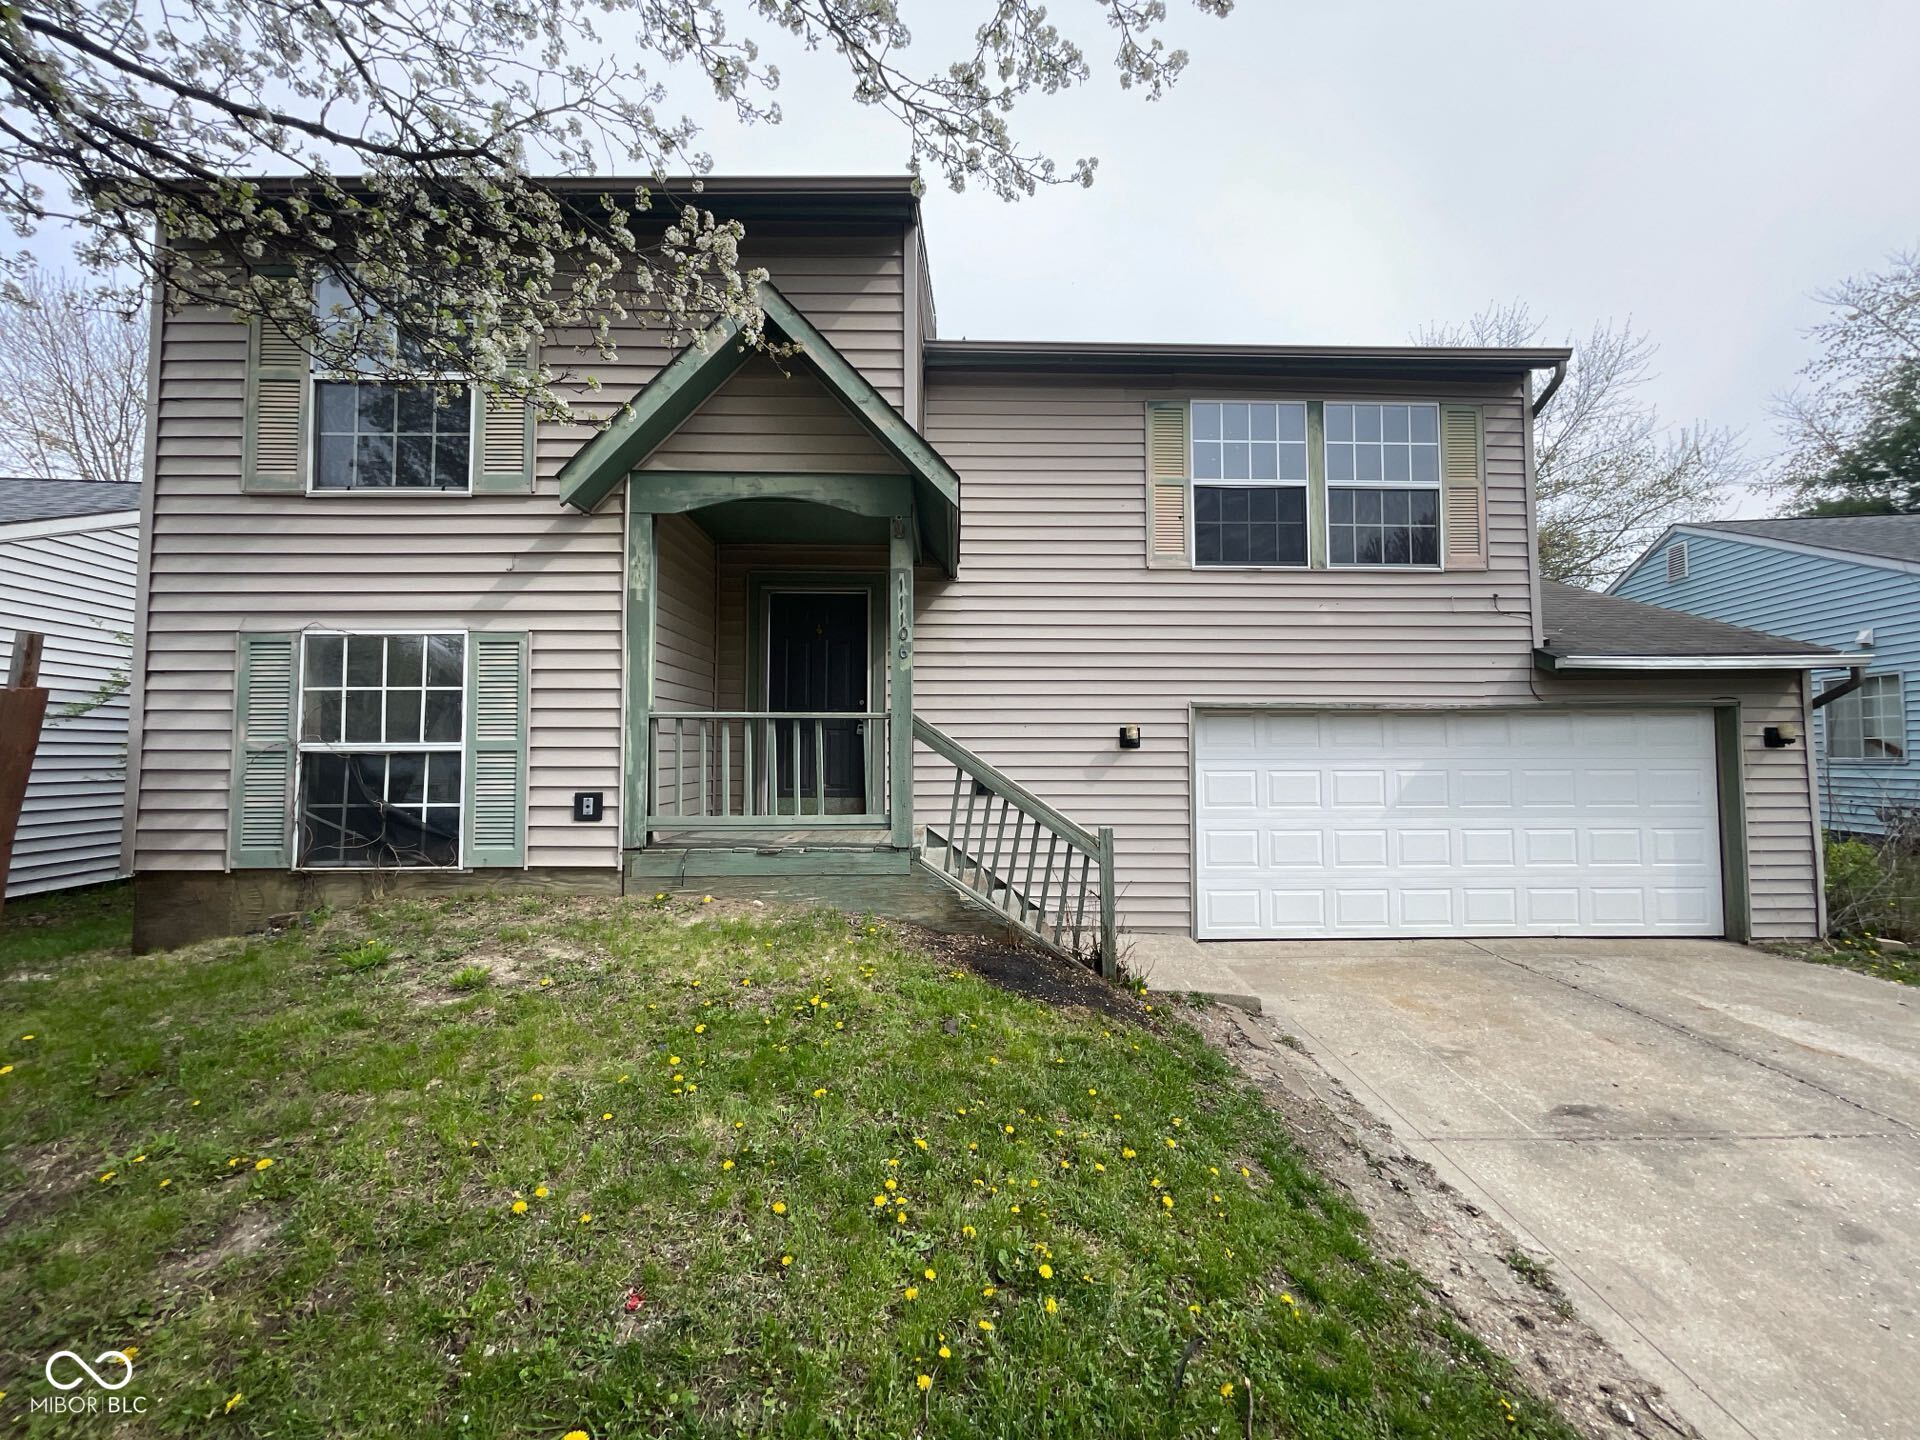
Active
$192,000
3
bds
|
2
ba
|
1,500
sqft
|
built
1991
11106 Wismar Dr, Indianapolis, IN 46235
$258
Cash flow
7.0%
Cash-on-Cash Return
7.8%
Cap rate
0.9%
Rent to Value Ratio
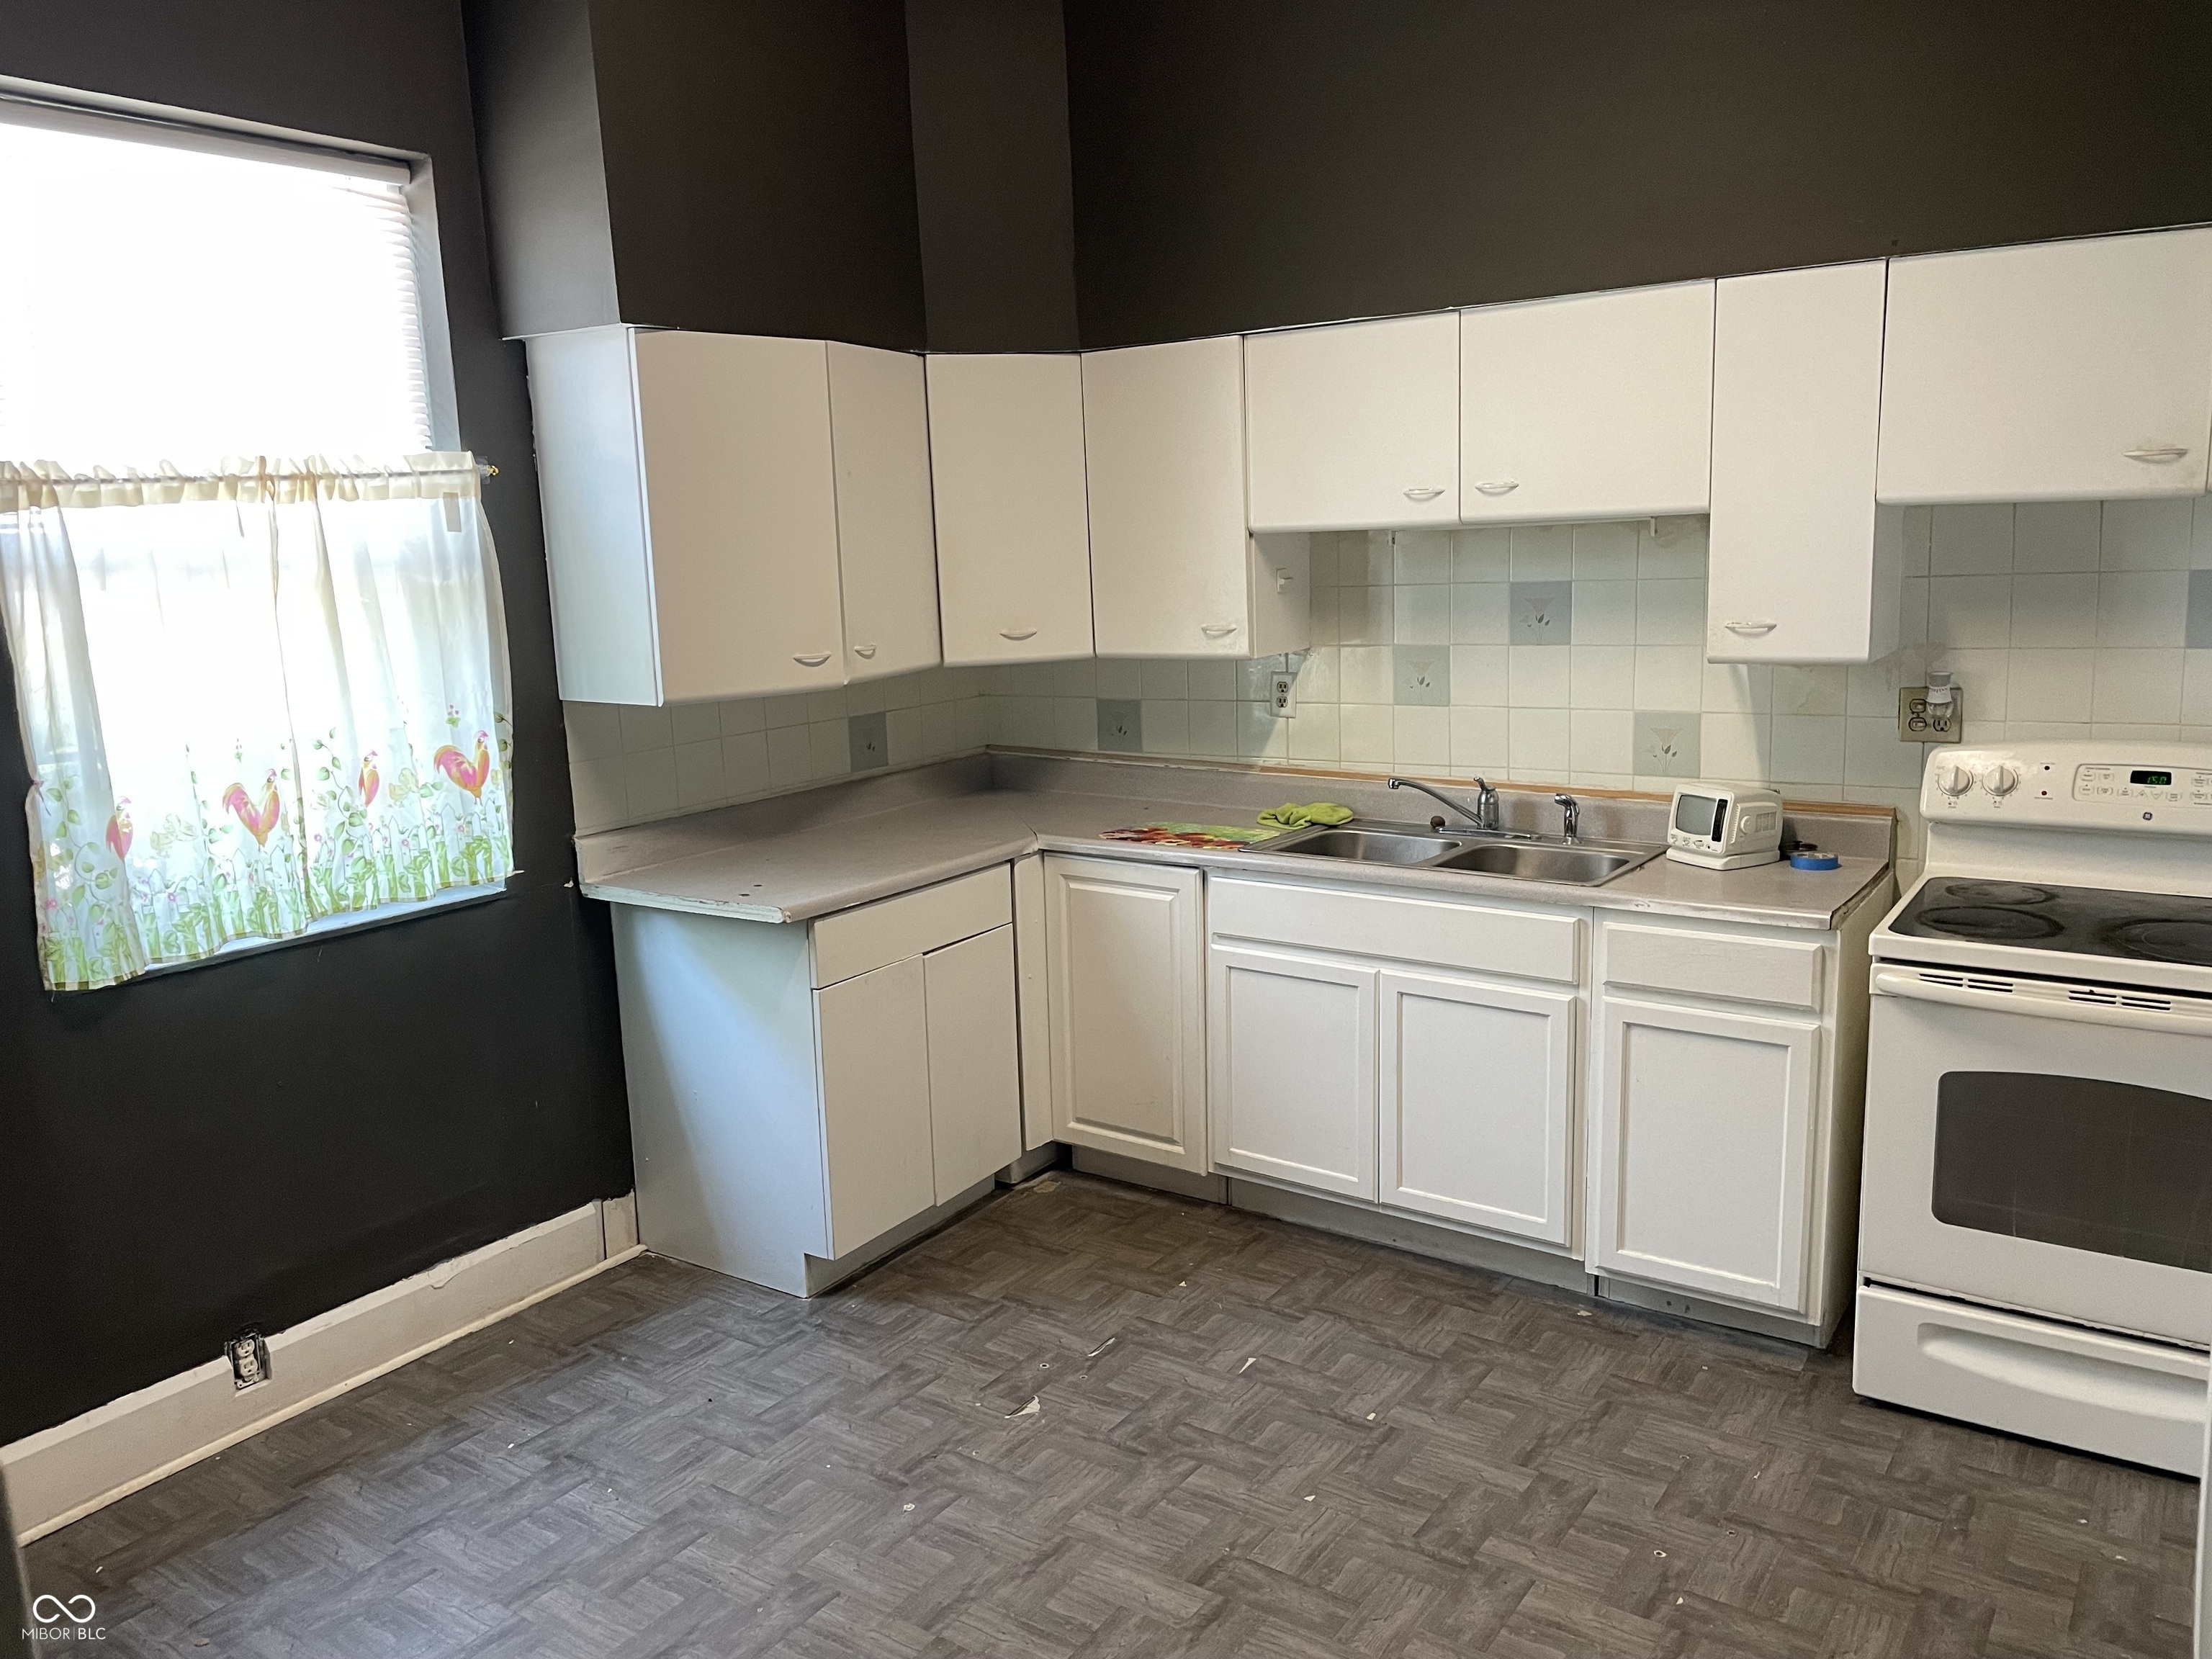
Pending
$124,900
3
bds
|
1
ba
|
1,568
sqft
|
built
1910
1164 Groff Ave, Indianapolis, IN 46222
$326
Cash flow
13.6%
Cash-on-Cash Return
9.3%
Cap rate
1.1%
Rent to Value Ratio
Active
$599,900
3
bds
|
7
ba
|
3,072
sqft
|
built
1868
902 Broadway St, Indianapolis, IN 46202
$308
Cash flow
2.7%
Cash-on-Cash Return
6.8%
Cap rate
0.8%
Rent to Value Ratio
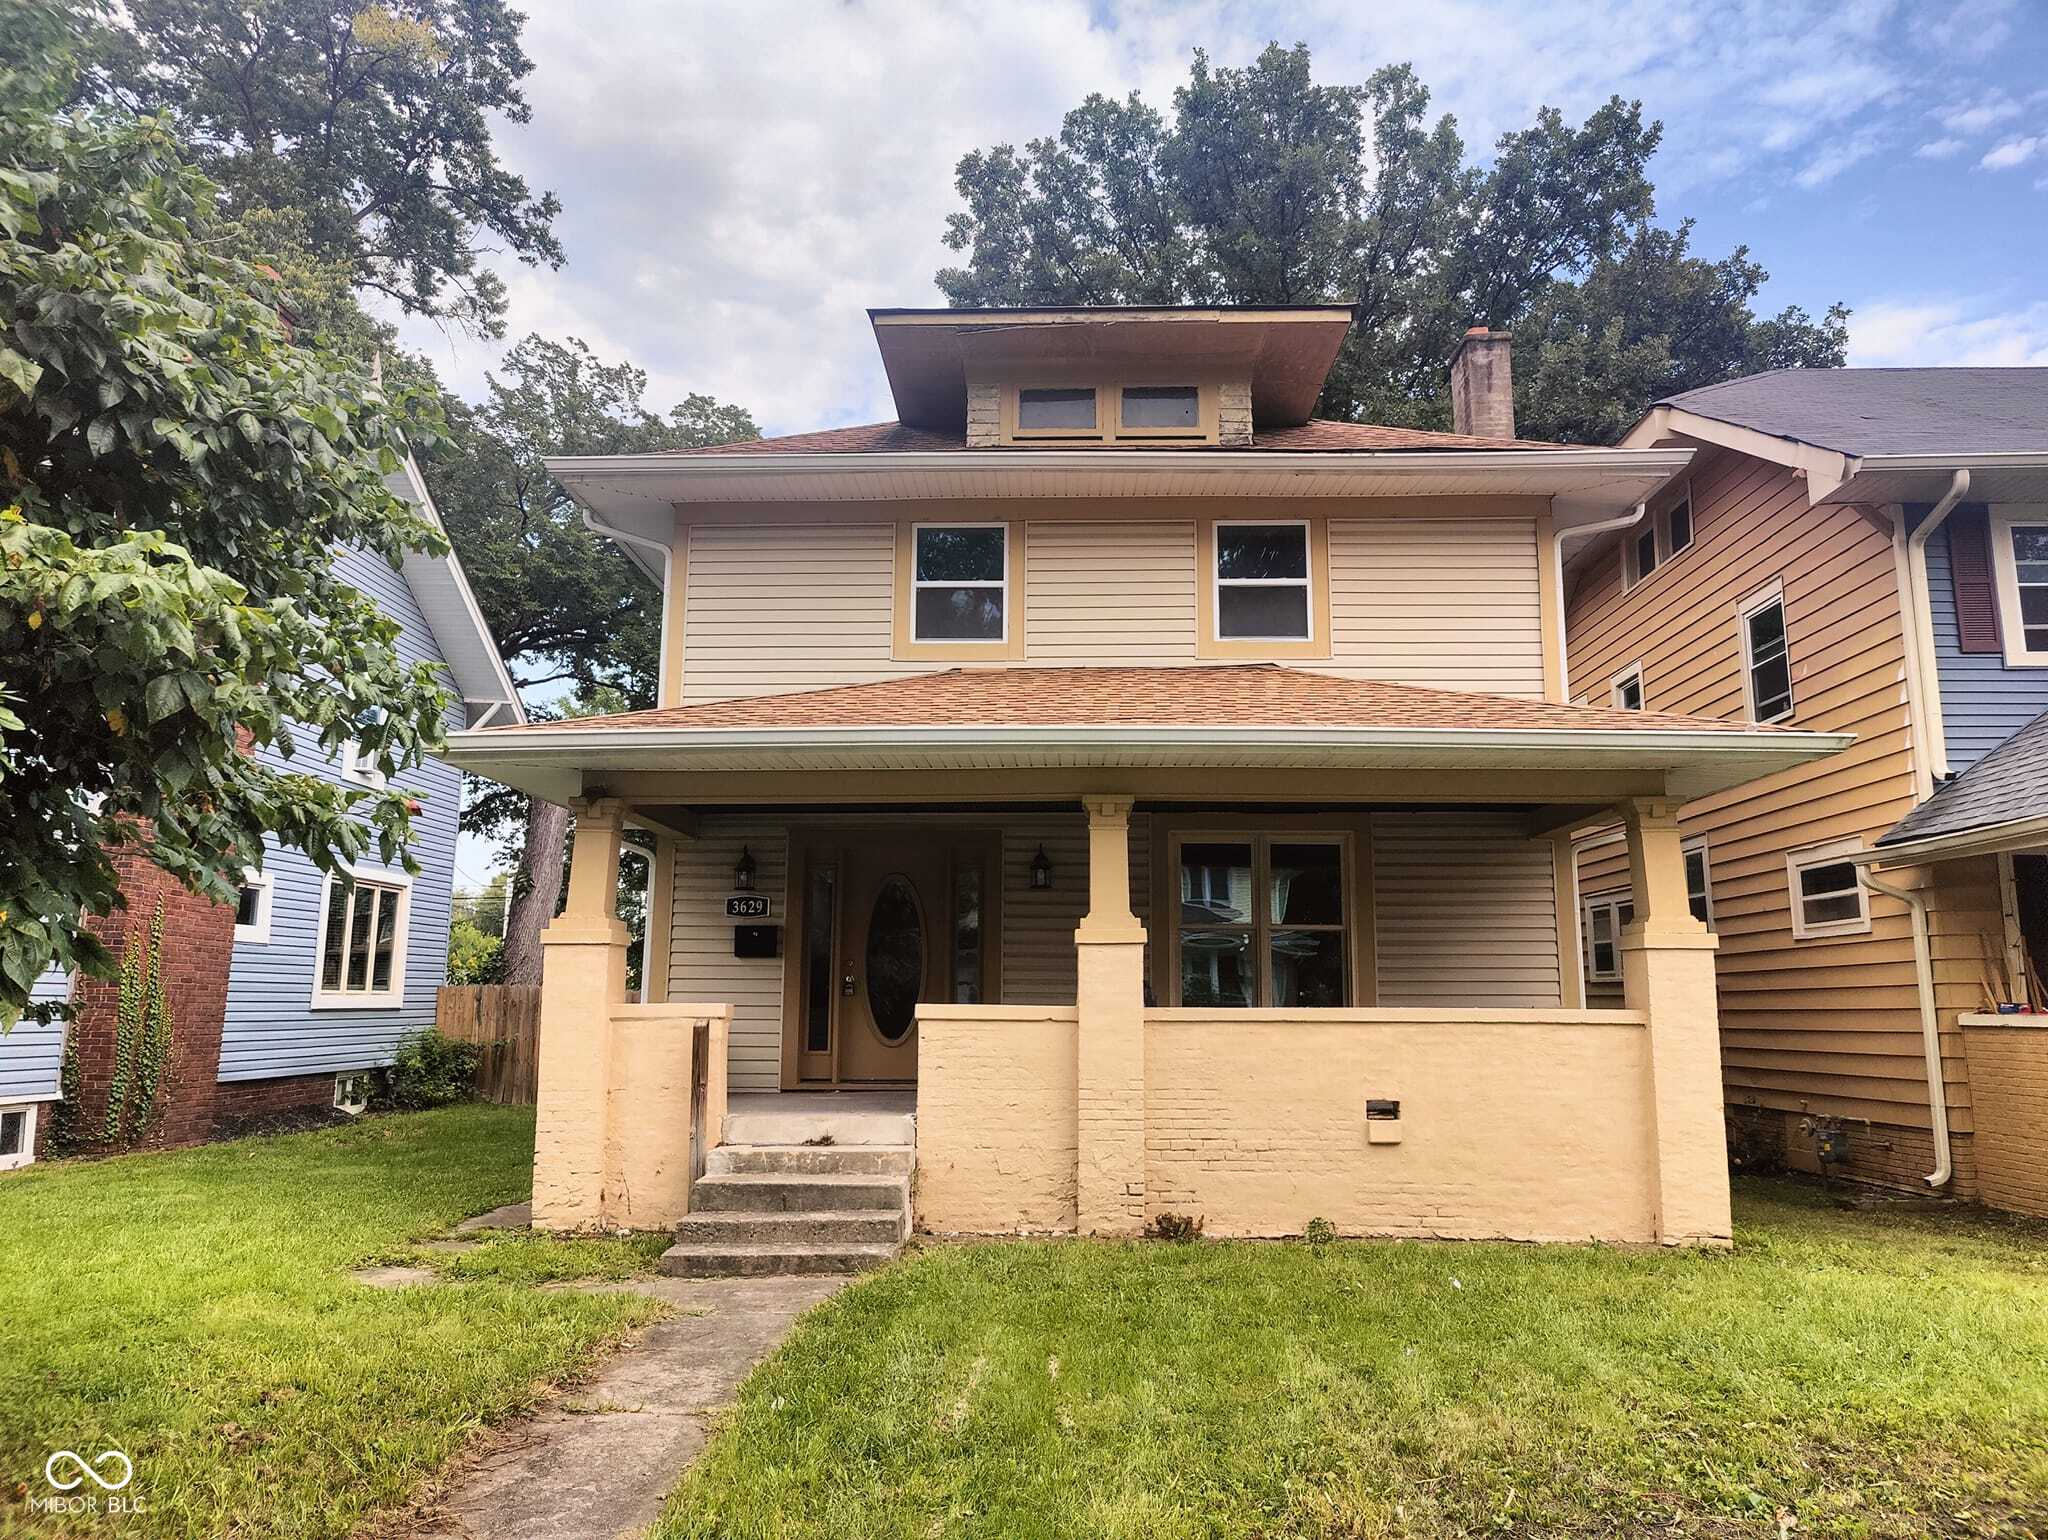
Active
$260,000
3
bds
|
3
ba
|
1,794
sqft
|
built
1921
3629 Birchwood Ave, Indianapolis, IN 46205
$48
Cash flow
1.0%
Cash-on-Cash Return
6.4%
Cap rate
0.8%
Rent to Value Ratio
Active
$190,000
3
bds
|
1
ba
|
1,128
sqft
|
built
1962
1601 Draper St, Indianapolis, IN 46203
$269
Cash flow
7.4%
Cash-on-Cash Return
7.8%
Cap rate
0.9%
Rent to Value Ratio
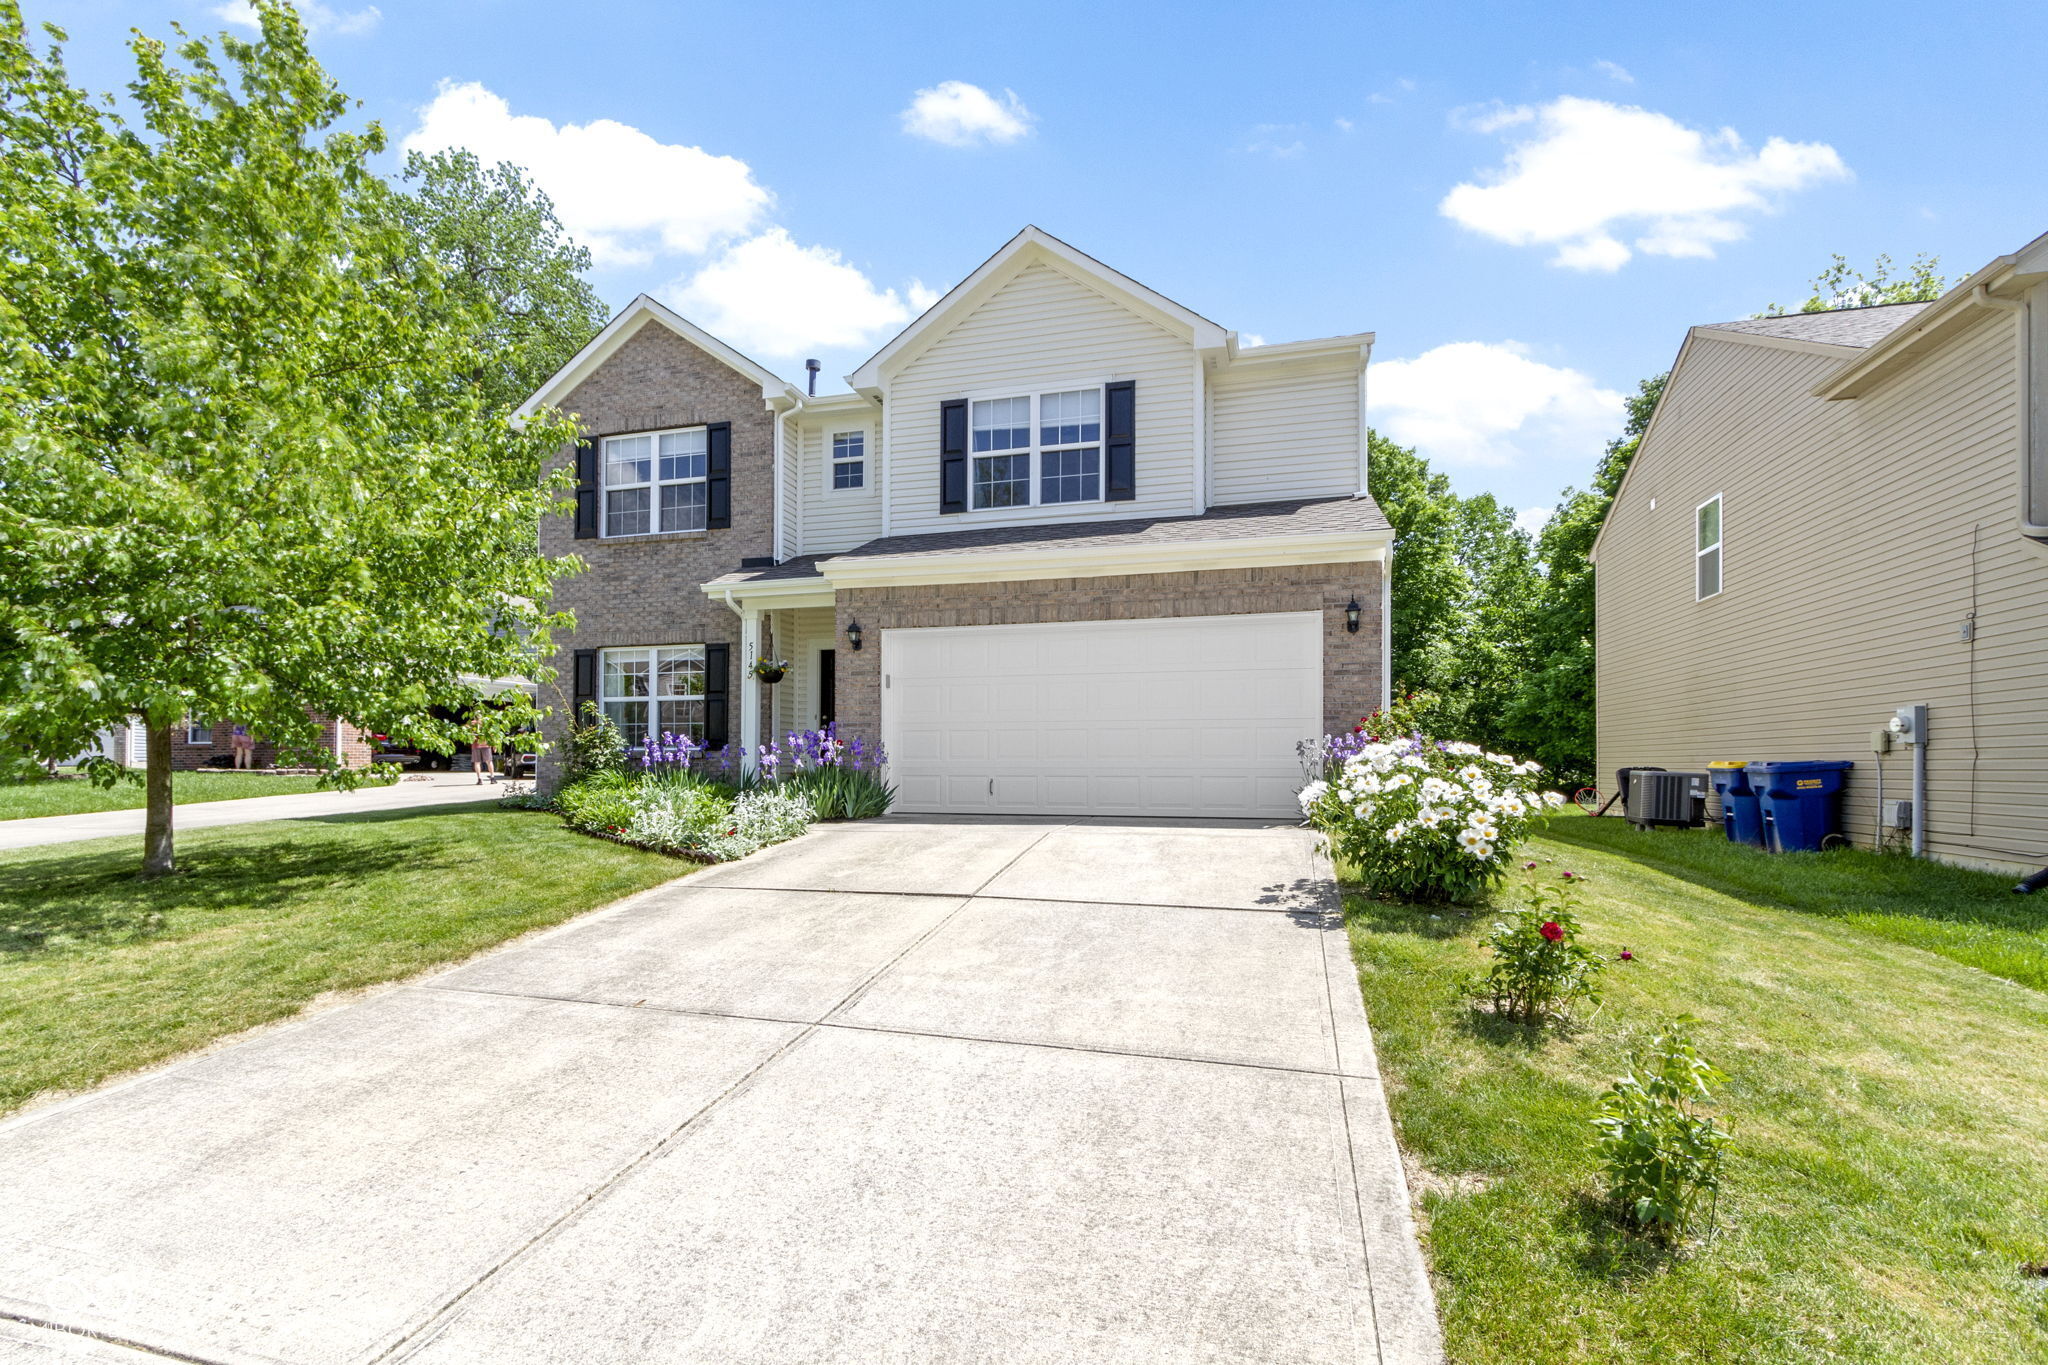
Active
$334,900
4
bds
|
3
ba
|
3,348
sqft
|
built
2011
5145 Greenside Dr, Indianapolis, IN 46235
$38
Cash flow
0.6%
Cash-on-Cash Return
6.3%
Cap rate
0.8%
Rent to Value Ratio
Active
$153,000
3
bds
|
1
ba
|
960
sqft
|
built
1950
1643 E Tabor St, Indianapolis, IN 46203
$113
Cash flow
3.9%
Cash-on-Cash Return
7.0%
Cap rate
0.8%
Rent to Value Ratio
Active
$160,000
3
bds
|
1
ba
|
1,311
sqft
|
built
1961
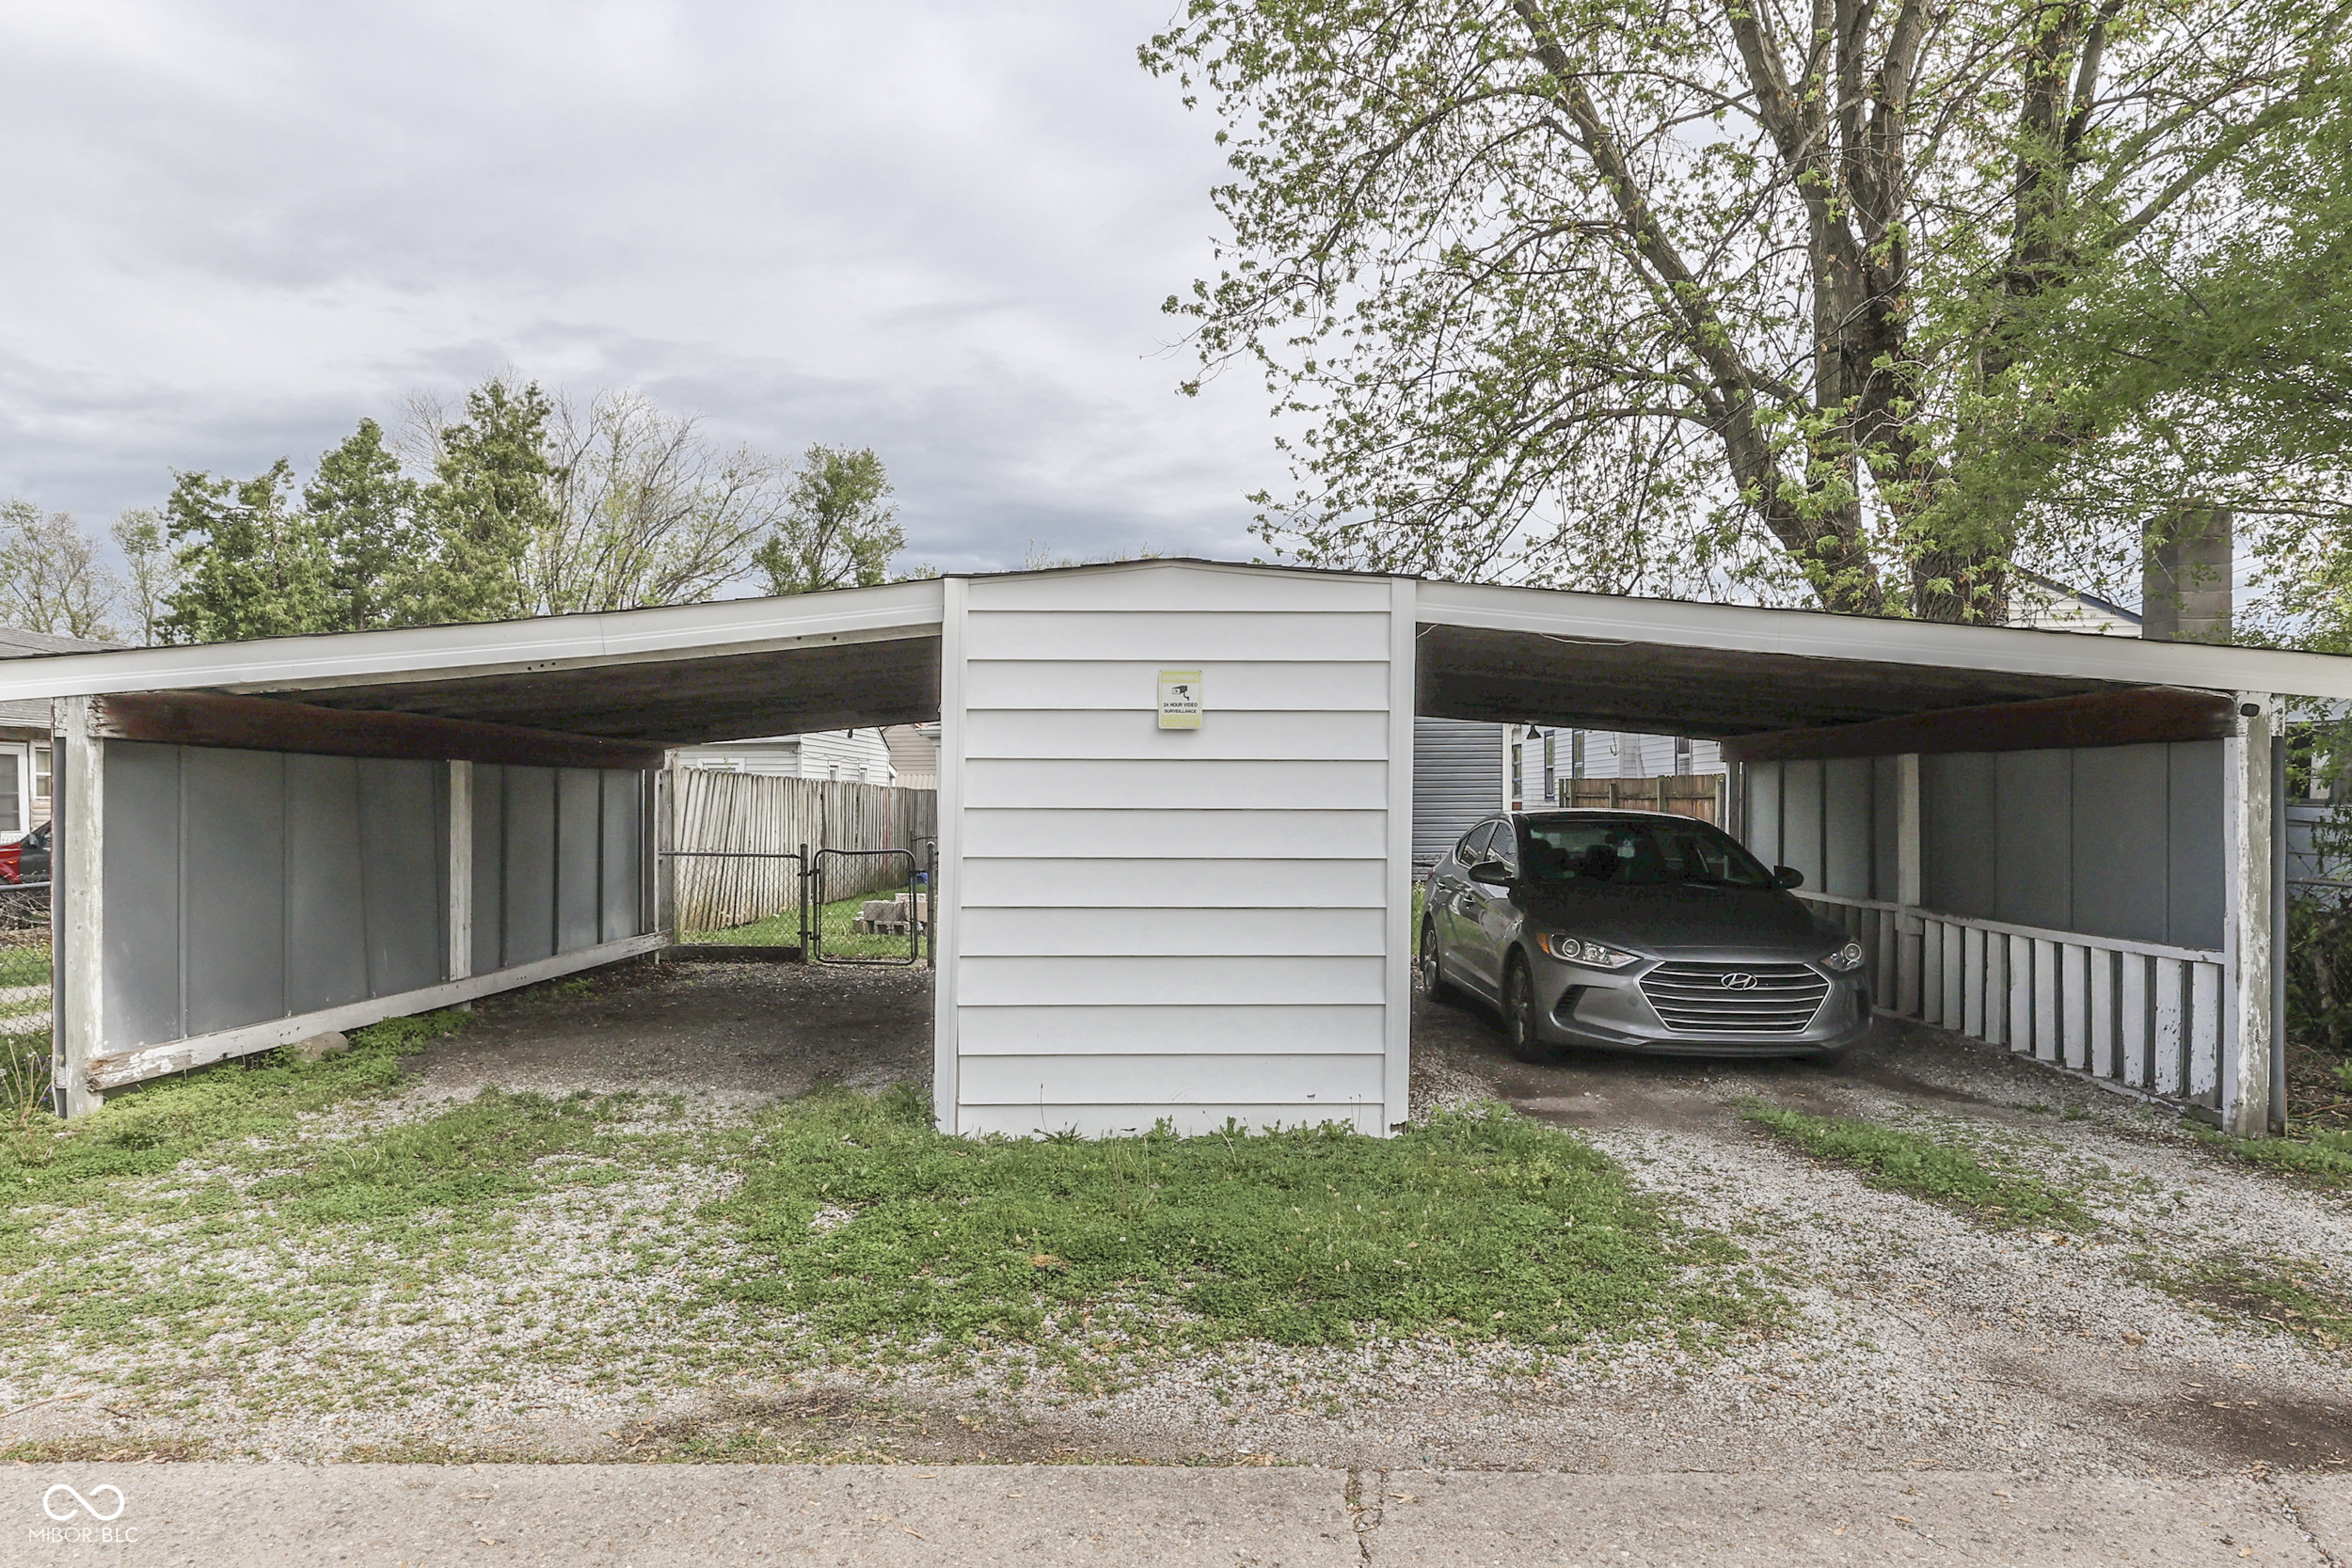
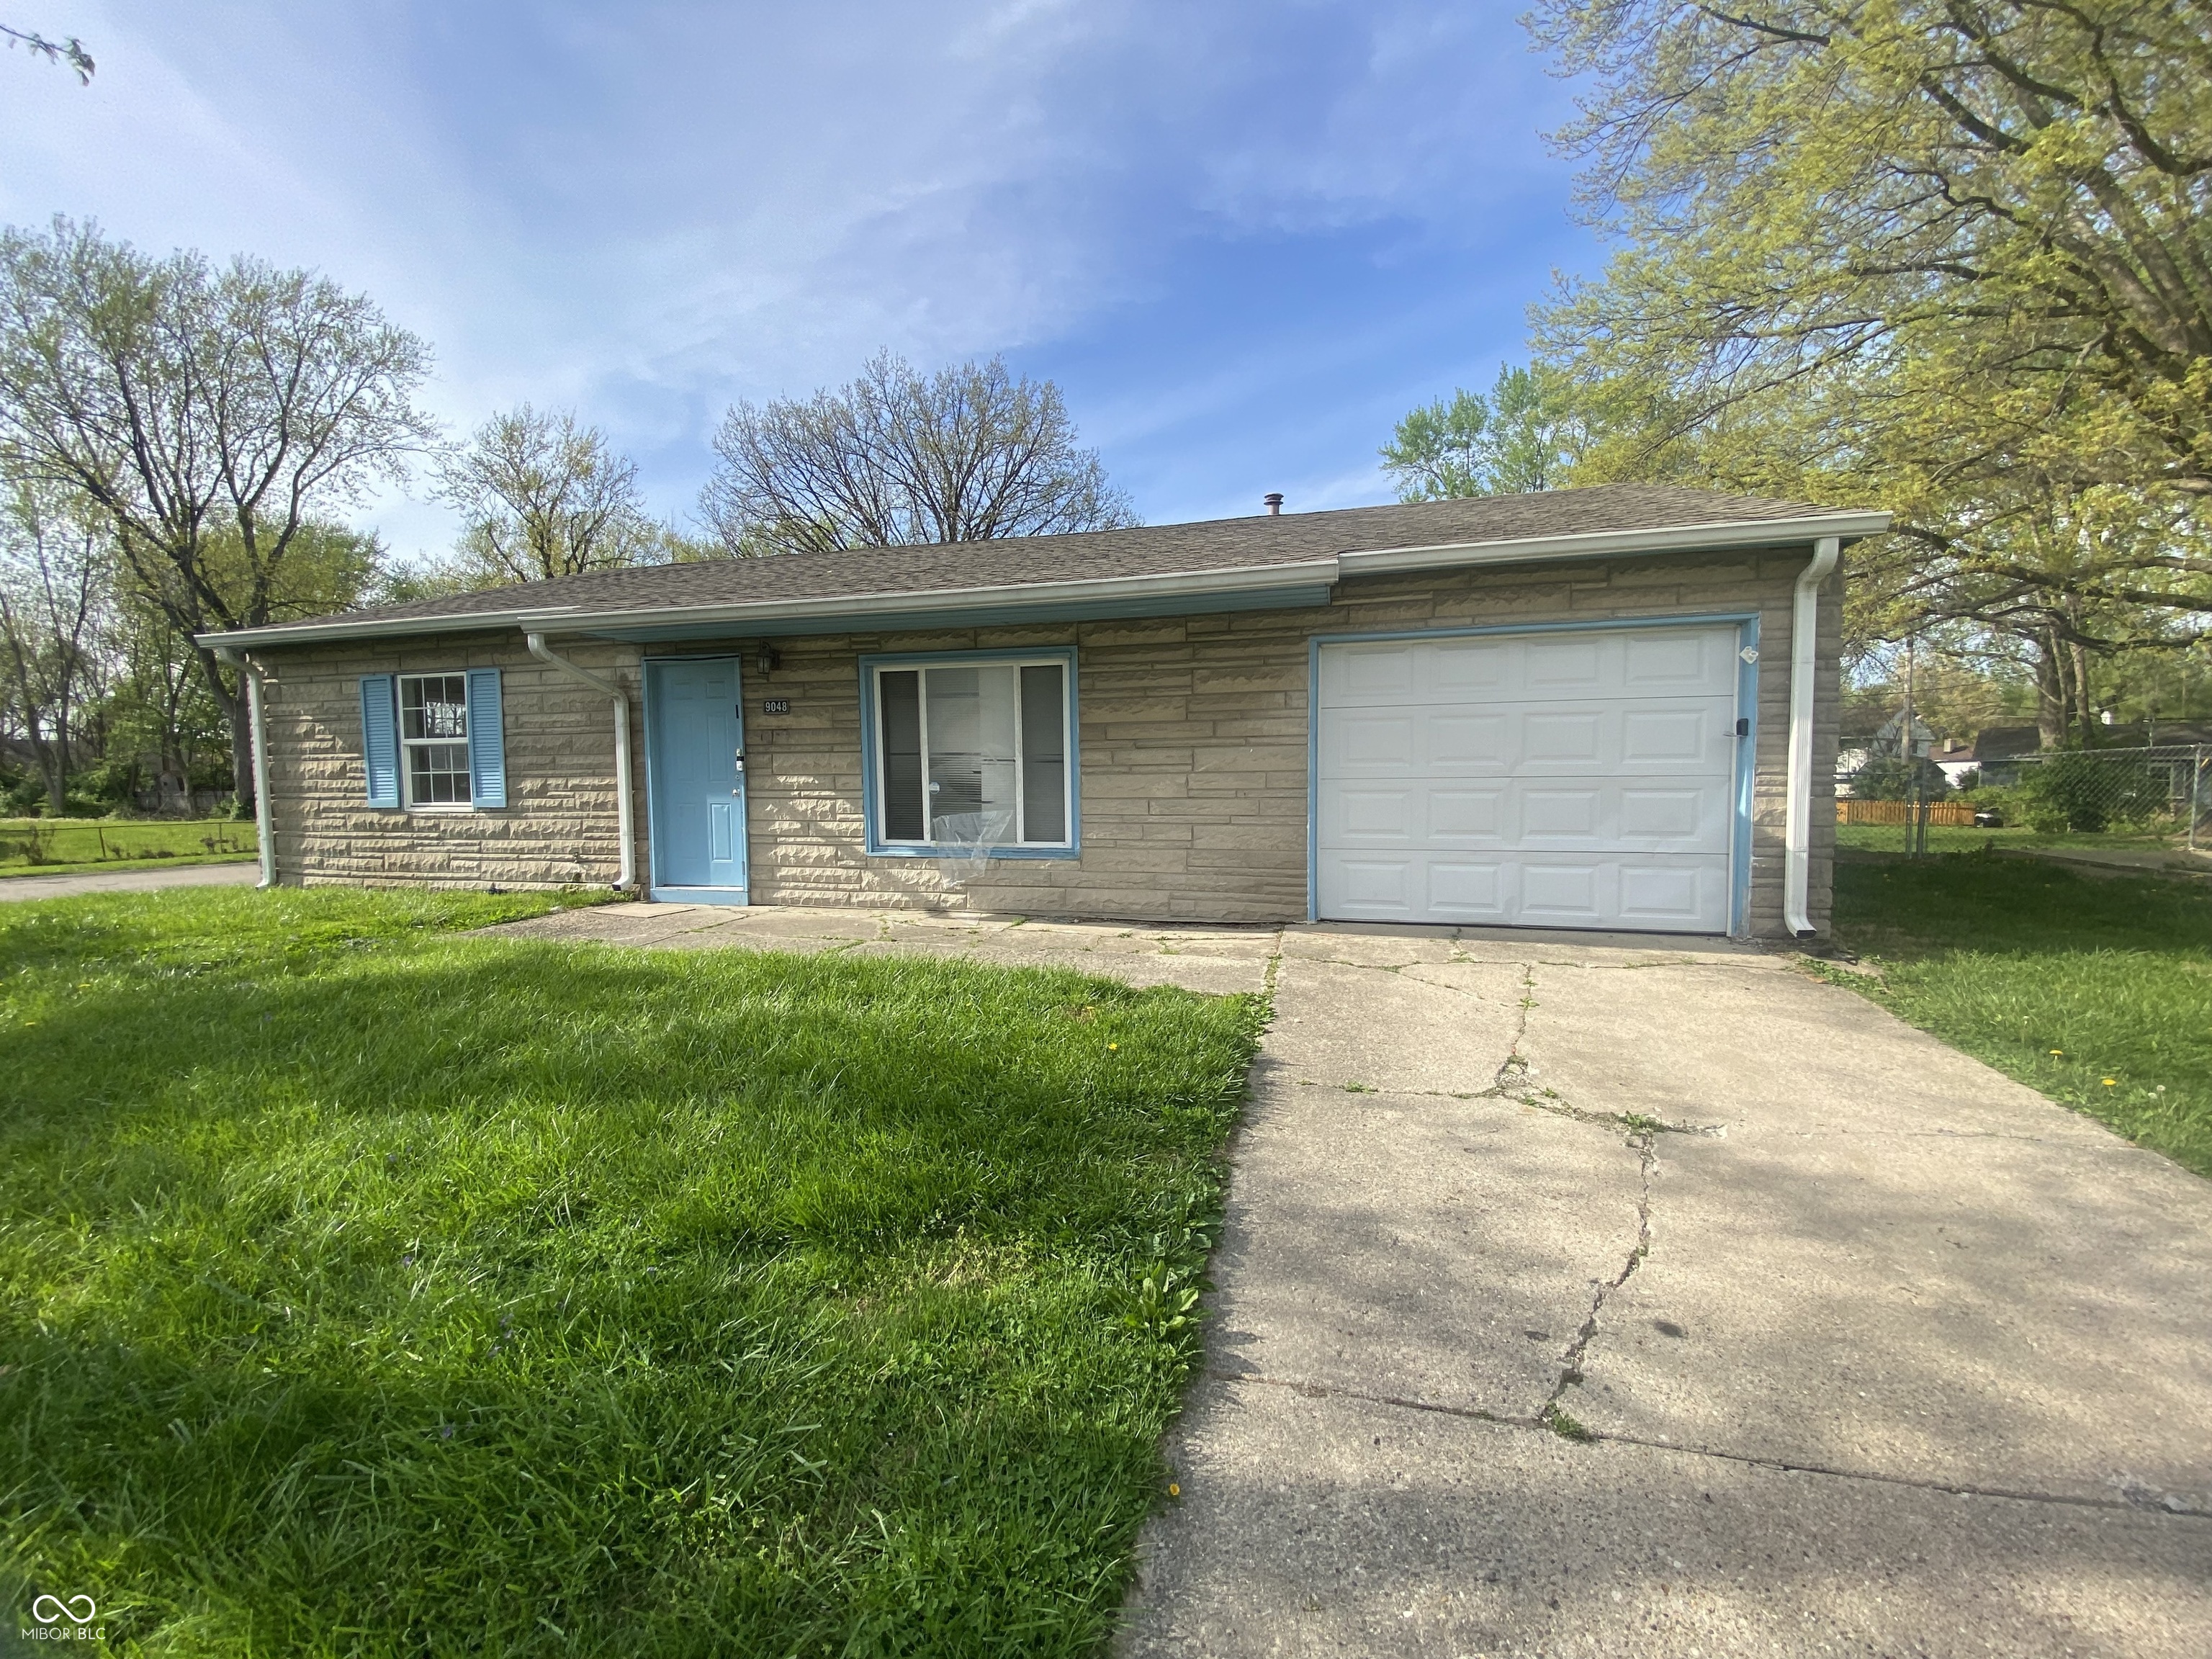
9048 E 36th St, Indianapolis, IN 46235
$146
Cash flow
4.8%
Cash-on-Cash Return
7.2%
Cap rate
0.9%
Rent to Value Ratio
Active
$359,900
3
bds
|
3
ba
|
1,638
sqft
|
built
1910
1665 N College Ave, Indianapolis, IN 46202
$88
Cash flow
1.3%
Cash-on-Cash Return
6.4%
Cap rate
0.8%
Rent to Value Ratio
Active
$849,000
4
bds
|
4
ba
|
3,316
sqft
|
built
1944
8020 N Meridian St, Indianapolis, IN 46260
$-416
Cash flow
-2.6%
Cash-on-Cash Return
5.6%
Cap rate
0.7%
Rent to Value Ratio
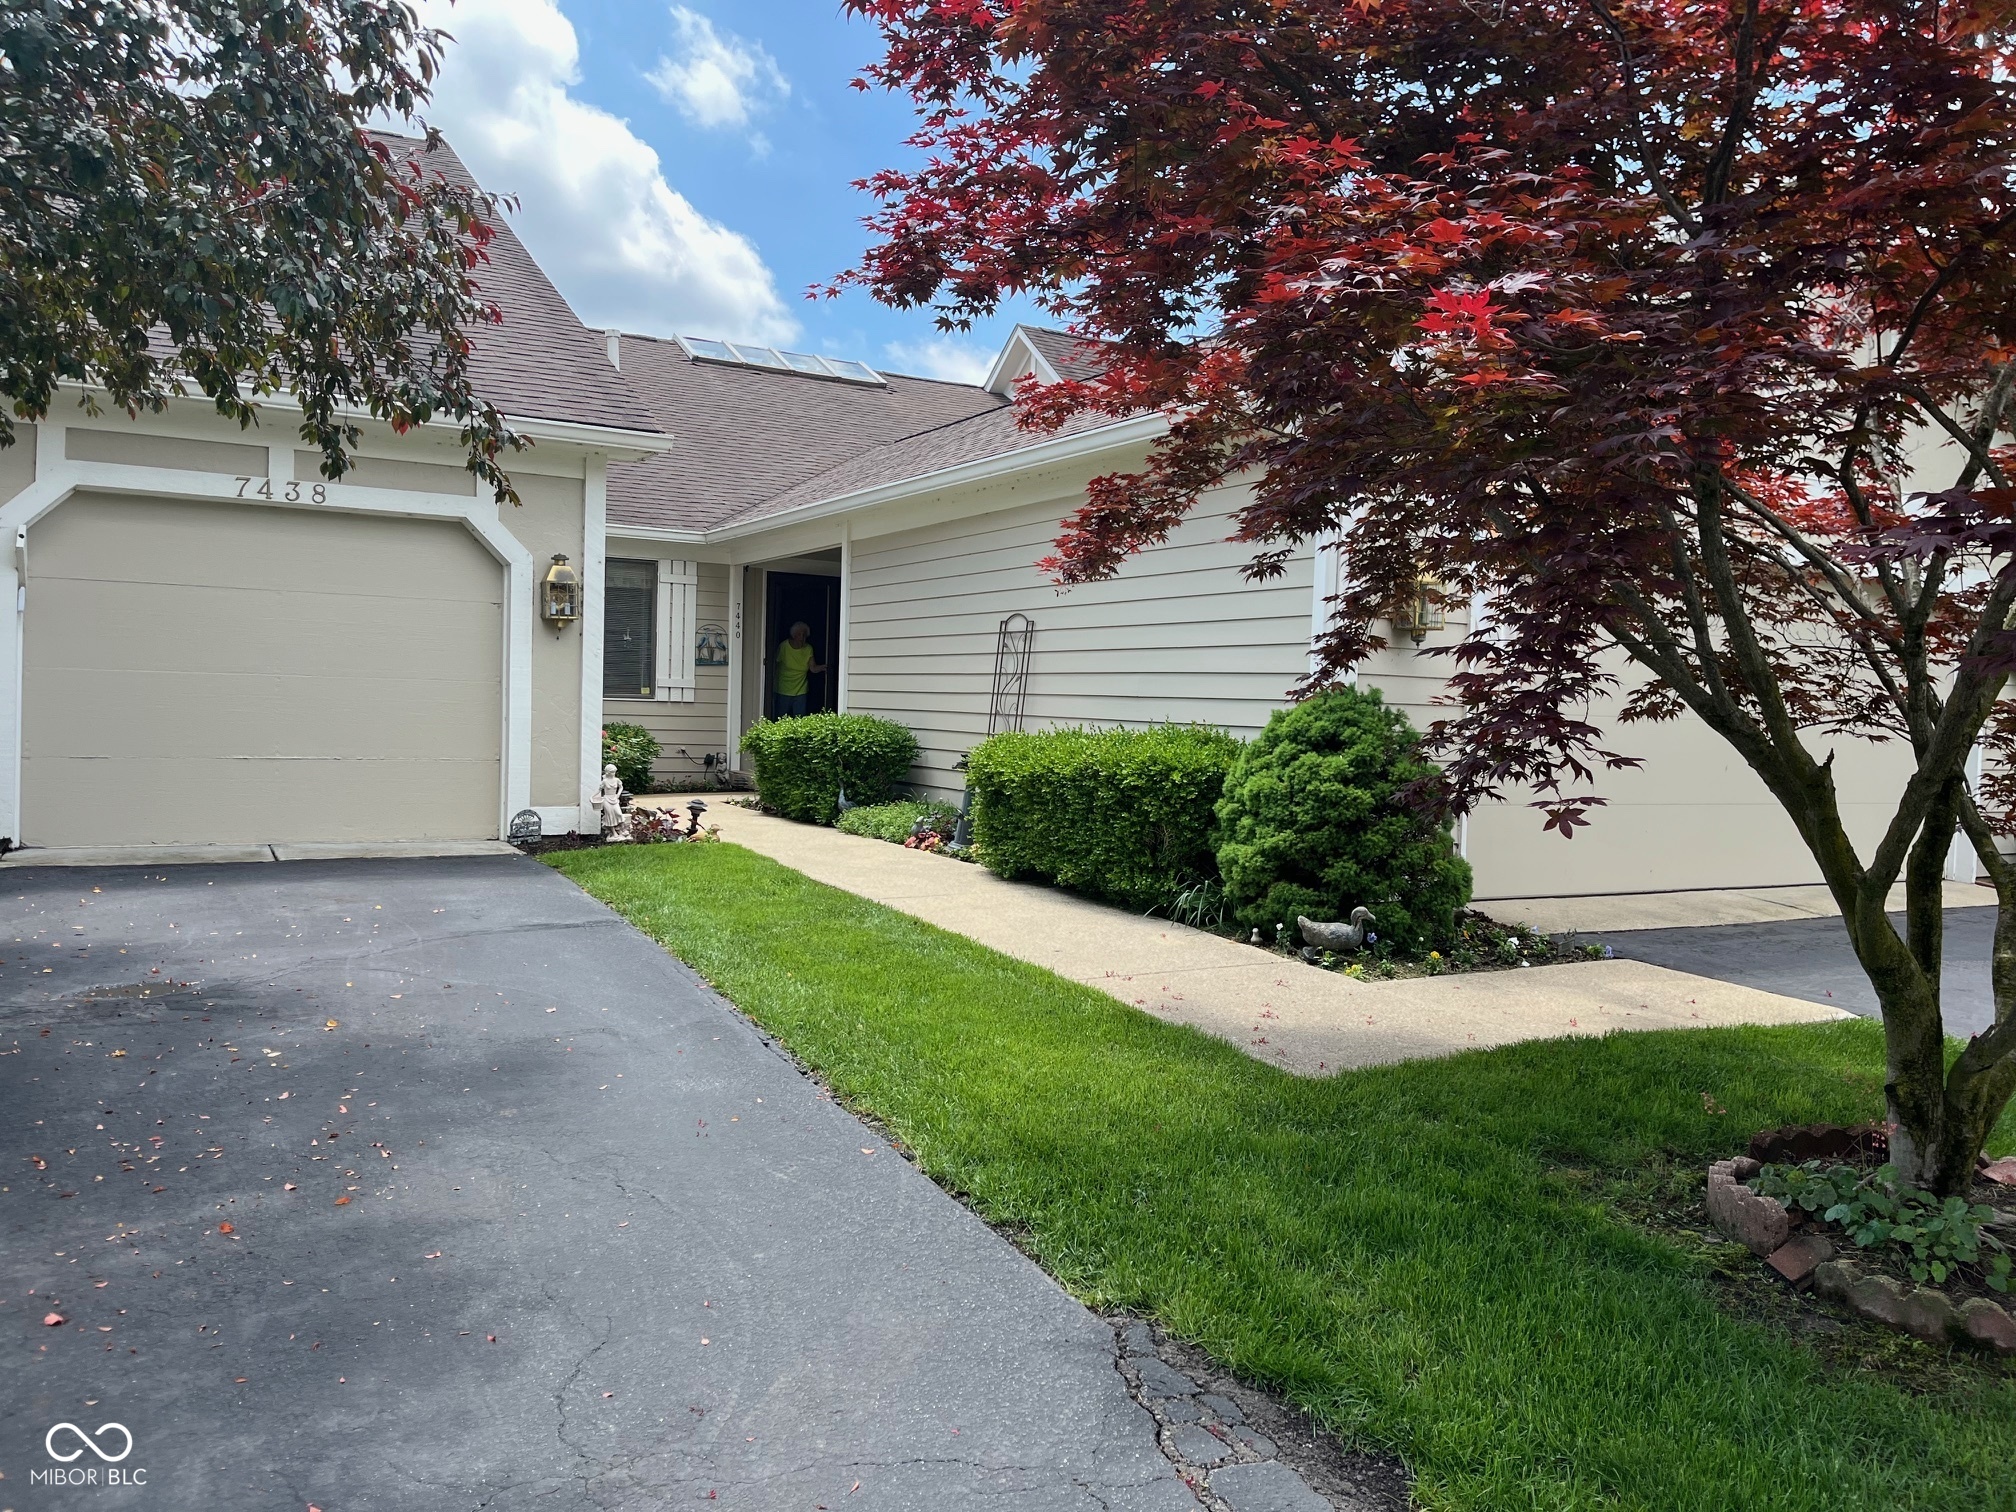
Active
$359,000
3
bds
|
3
ba
|
2,686
sqft
|
built
1980
7440 Sylvan Ridge Rd, Indianapolis, IN 46240
$-609
Cash flow
-8.9%
Cash-on-Cash Return
4.1%
Cap rate
0.7%
Rent to Value Ratio
Active
$479,999
4
bds
|
2
ba
|
2,959
sqft
|
built
1953
7205 Steven Ln, Indianapolis, IN 46260
$-734
Cash flow
-8.0%
Cash-on-Cash Return
4.3%
Cap rate
0.5%
Rent to Value Ratio
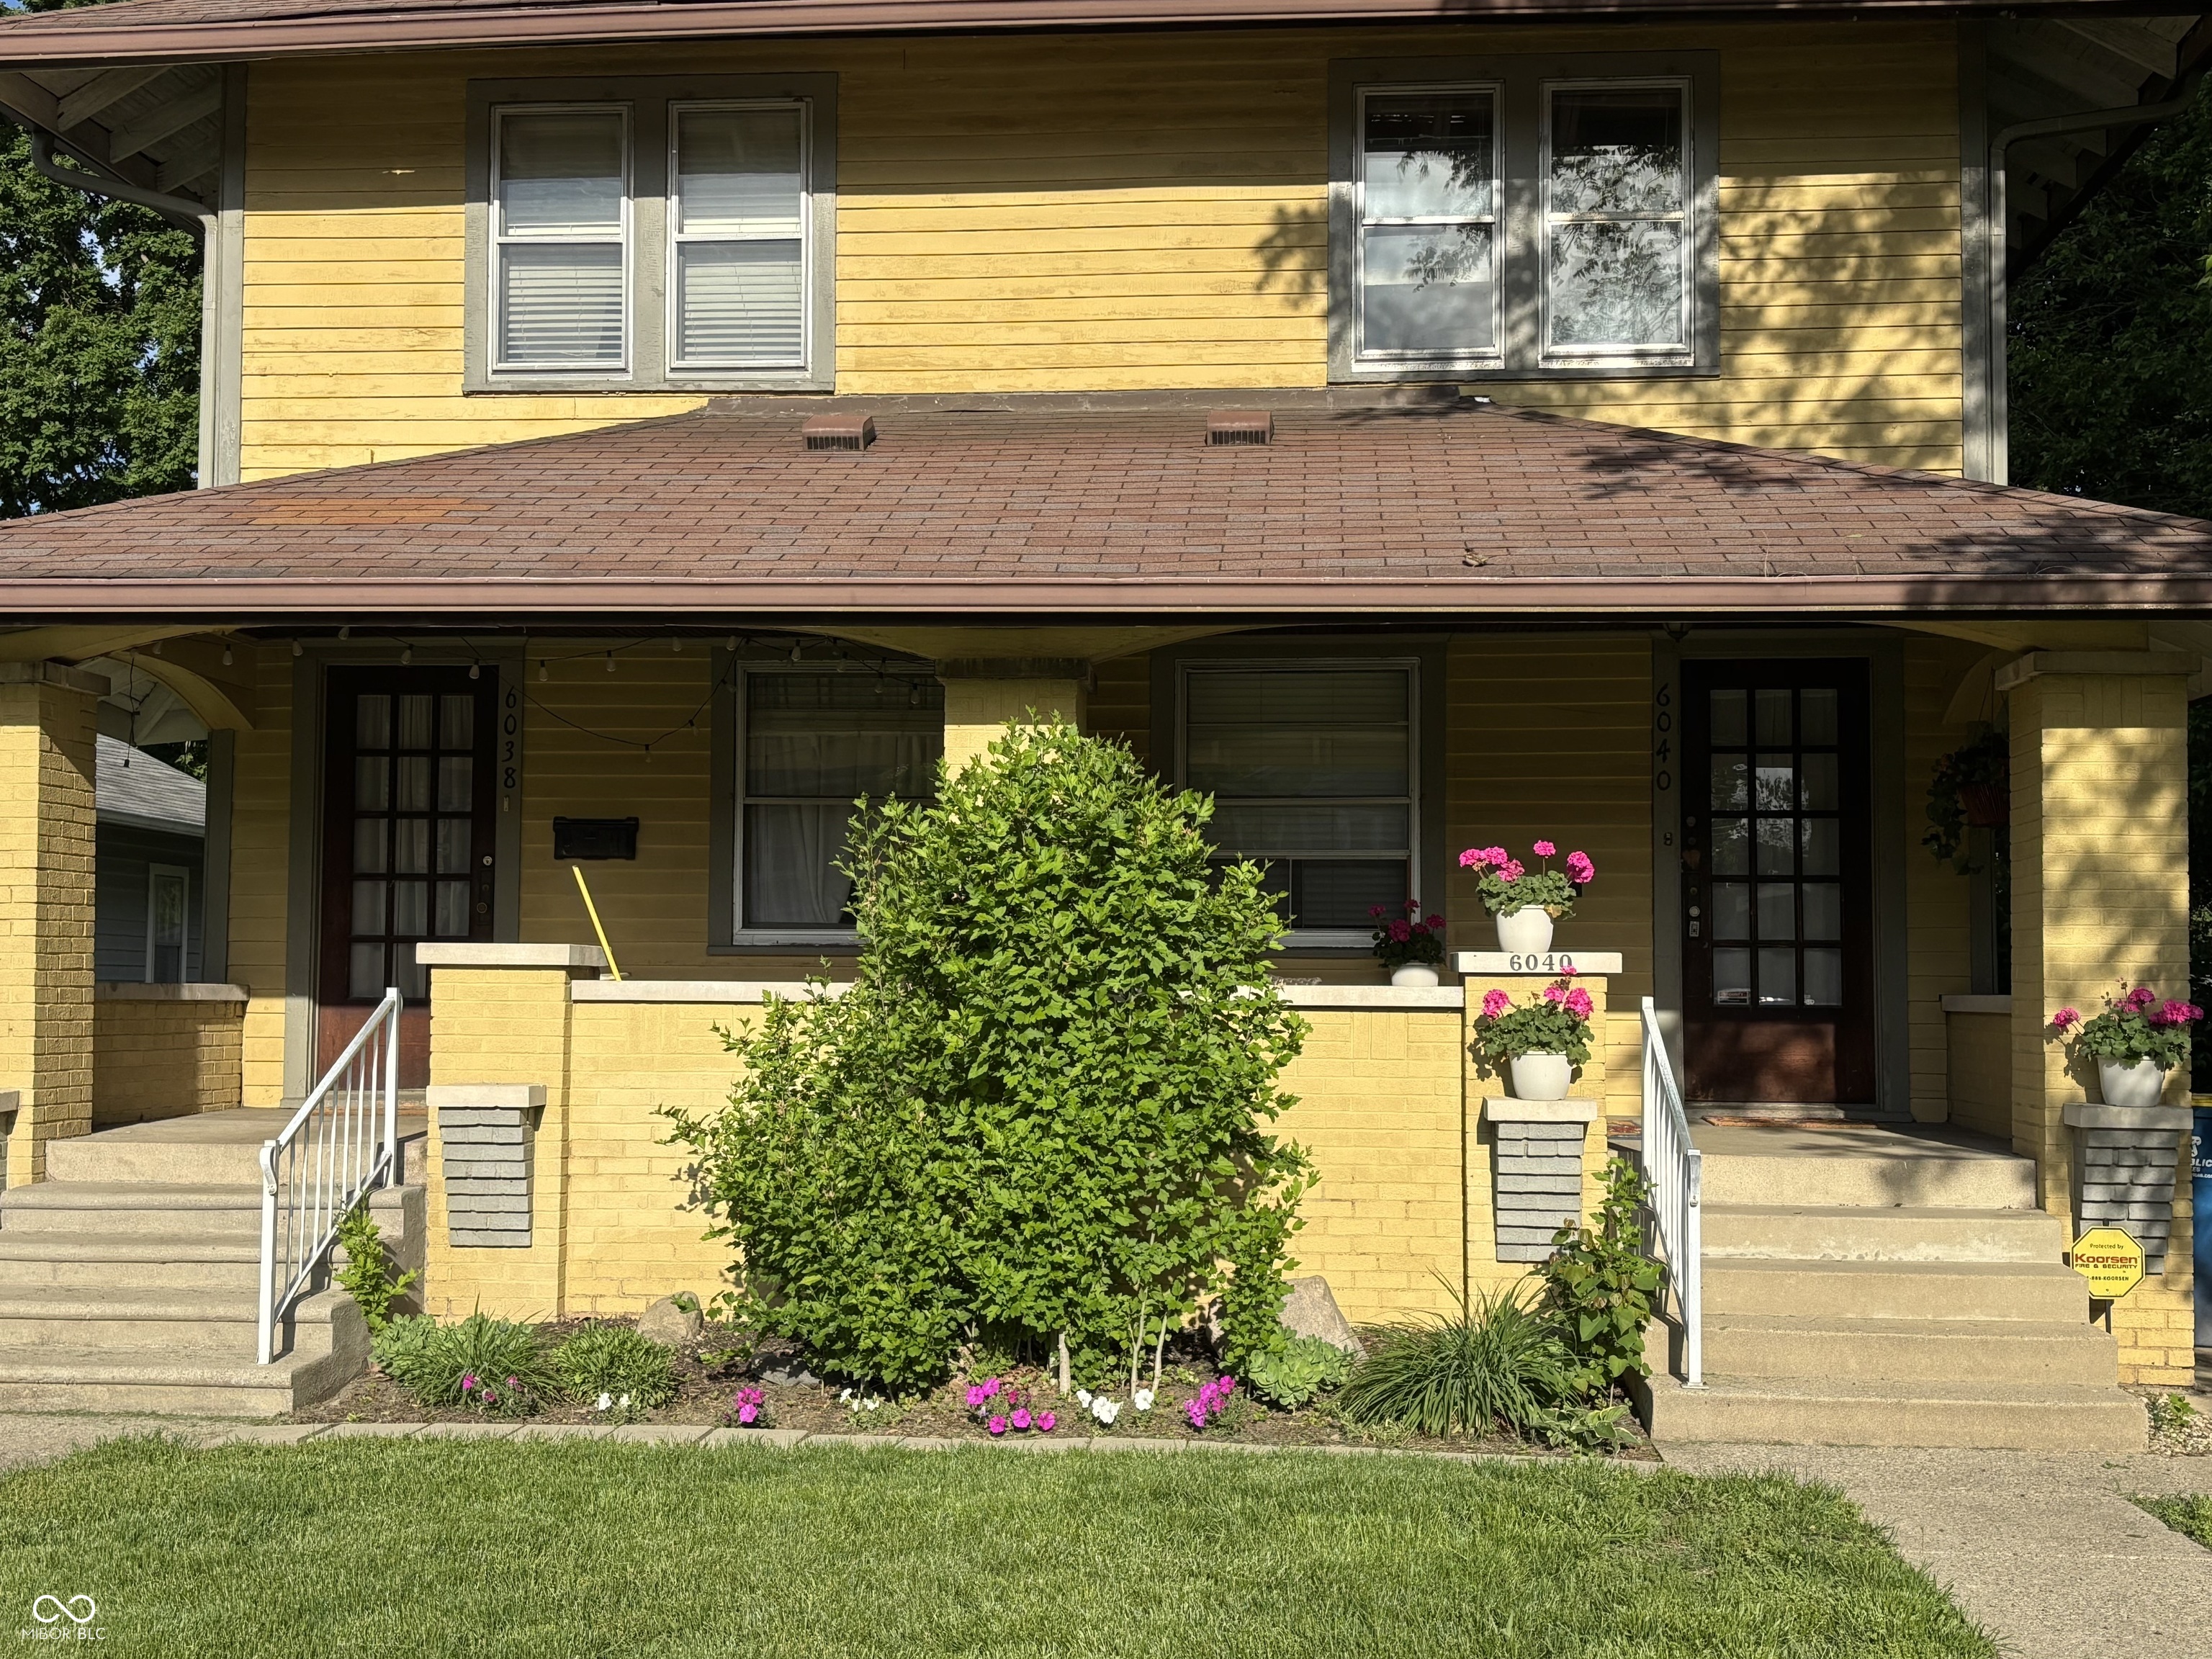
Active
$525,000
1
bds
|
0
ba
|
0
sqft
|
built
1922
6038 N College Ave, Indianapolis, IN 46220
$-1,516
Cash flow
-15.1%
Cash-on-Cash Return
2.7%
Cap rate
0.3%
Rent to Value Ratio
Active
$175,000
2
bds
|
0
ba
|
0
sqft
|
built
1925
1305 W 36th St, Indianapolis, IN 46208
$-206
Cash flow
-6.1%
Cash-on-Cash Return
4.7%
Cap rate
0.6%
Rent to Value Ratio