Indianapolis, IN Investment Properties for Sale
Browse homes for sale and investment properties in Indianapolis, IN. Refine your search by price, property type, or more.
Best cash flowing properties in Indianapolis, IN

Active
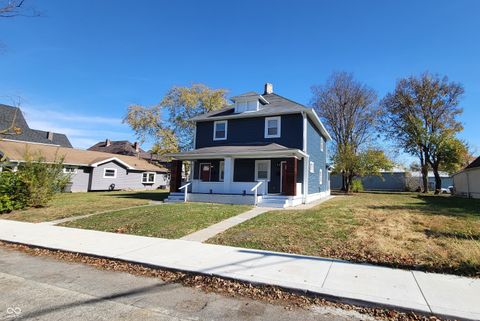
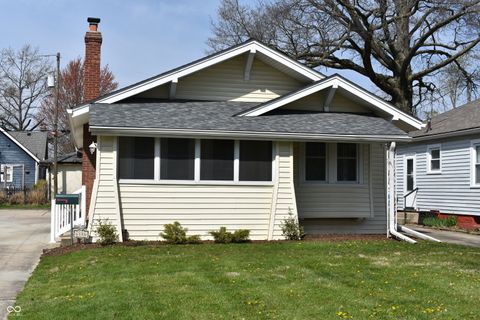
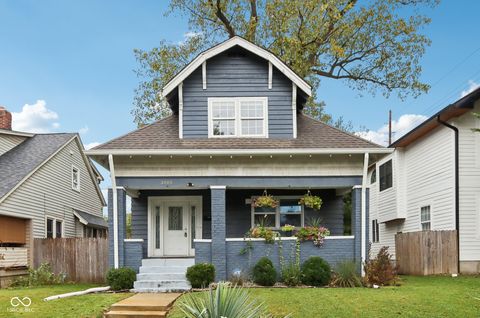
$254,900
4
bds
|
2
ba
|
1,944
sqft
|
built
1890
248 N Walcott St, Indianapolis, IN 46201
$419
Cash flow
8.6%
Cash-on-Cash Return
8.1%
Cap rate
1.0%
Rent to Value Ratio

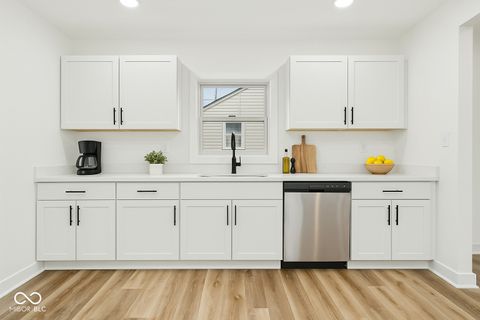
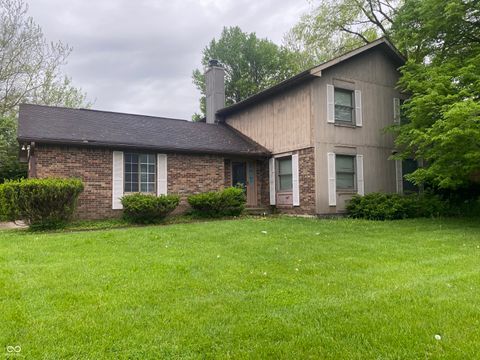
Active
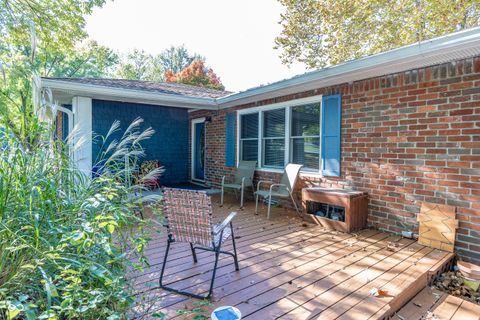
$115,000
3
bds
|
1
ba
|
925
sqft
|
built
1955
4715 E 33rd St, Indianapolis, IN 46218
$377
Cash flow
17.1%
Cash-on-Cash Return
10.1%
Cap rate
1.2%
Rent to Value Ratio
1,959 out of 2,099 properties for sale in Indianapolis, IN
Limited Results Shown
Create a free account, or log in to reveal all property listings and enjoy the complete experience.
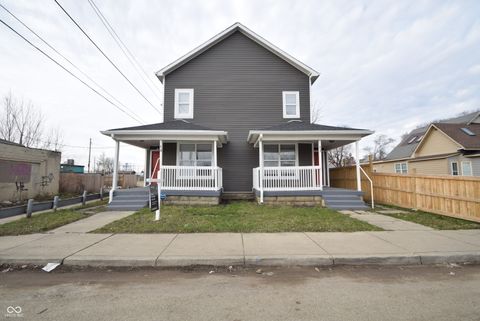
Active
$327,000
2
bds
|
0
ba
|
0
sqft
|
built
1928
2141 Bellefontaine St, Indianapolis, IN 46202
$-847
Cash flow
-13.5%
Cash-on-Cash Return
3.0%
Cap rate
0.4%
Rent to Value Ratio
Active
$149,900
2
bds
|
1
ba
|
696
sqft
|
built
1947
3105 N Tacoma Ave, Indianapolis, IN 46218
$-216
Cash flow
-7.5%
Cash-on-Cash Return
4.4%
Cap rate
0.5%
Rent to Value Ratio
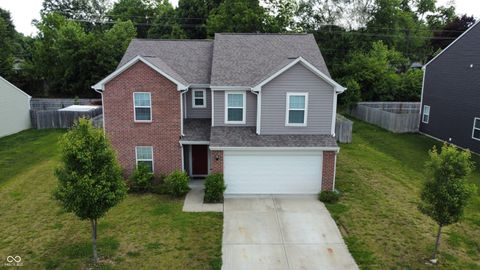
Active
$339,900
4
bds
|
3
ba
|
2,408
sqft
|
built
2019
7303 Beal Ln, Indianapolis, IN 46217
$-251
Cash flow
-3.9%
Cash-on-Cash Return
5.3%
Cap rate
0.6%
Rent to Value Ratio
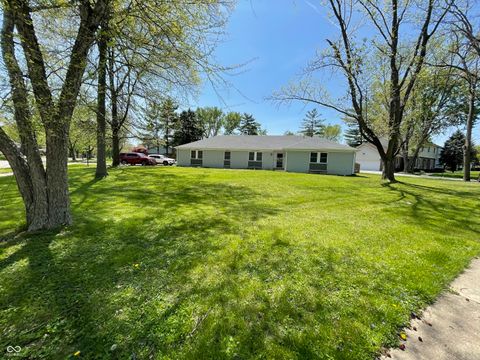
Active
$334,900
4
bds
|
3
ba
|
2,055
sqft
|
built
1969
7731 Scarborough Blvd South Dr, Indianapolis, IN 46256
$9
Cash flow
0.1%
Cash-on-Cash Return
6.2%
Cap rate
0.7%
Rent to Value Ratio
Active
$335,000
3
bds
|
2
ba
|
1,786
sqft
|
built
1910
555 N Hamilton Ave, Indianapolis, IN 46201
$-888
Cash flow
-13.8%
Cash-on-Cash Return
3.0%
Cap rate
0.4%
Rent to Value Ratio
Pending
$495,000
5
bds
|
4
ba
|
3,249
sqft
|
built
1904
2134 N Alabama St, Indianapolis, IN 46202
$-537
Cash flow
-5.7%
Cash-on-Cash Return
4.8%
Cap rate
0.6%
Rent to Value Ratio
Active
$357,800
3
bds
|
3
ba
|
2,101
sqft
|
built
1903
715 Cottage Ave, Indianapolis, IN 46203
$-246
Cash flow
-3.6%
Cash-on-Cash Return
5.3%
Cap rate
0.6%
Rent to Value Ratio
Active
$266,000
3
bds
|
2
ba
|
1,255
sqft
|
built
1987
7850 Park North Bnd, Indianapolis, IN 46260
$-12
Cash flow
-0.2%
Cash-on-Cash Return
6.1%
Cap rate
0.8%
Rent to Value Ratio
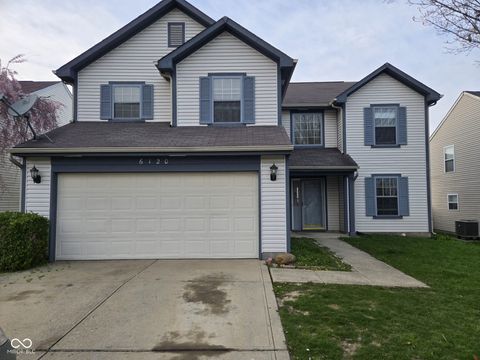
Active
$294,900
4
bds
|
3
ba
|
2,157
sqft
|
built
2000
6120 Salanie Pl, Indianapolis, IN 46254
$-16
Cash flow
-0.3%
Cash-on-Cash Return
6.1%
Cap rate
0.7%
Rent to Value Ratio
Active
$339,000
2
bds
|
0
ba
|
0
sqft
|
built
1900
10 N Keystone Ave, Indianapolis, IN 46201
$-978
Cash flow
-15.1%
Cash-on-Cash Return
2.7%
Cap rate
0.3%
Rent to Value Ratio
Active
$645,000
bds
|
0
ba
|
0
sqft
|
built
1924
539 E 53rd St, Indianapolis, IN 46220
$-1,303
Cash flow
-10.5%
Cash-on-Cash Return
3.7%
Cap rate
0.4%
Rent to Value Ratio
Active
$385,000
2
bds
|
0
ba
|
0
sqft
|
built
1924
734 N Bradley Ave, Indianapolis, IN 46201
$-1,420
Cash flow
-19.2%
Cash-on-Cash Return
1.7%
Cap rate
0.2%
Rent to Value Ratio
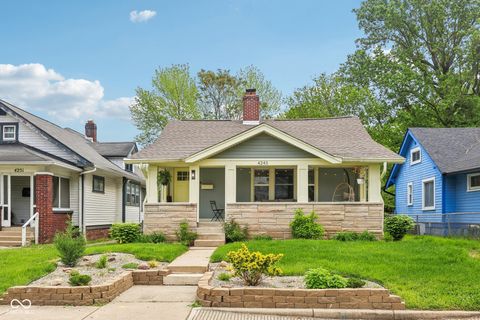
Active
$355,000
3
bds
|
3
ba
|
2,465
sqft
|
built
1925
4245 Guilford Ave, Indianapolis, IN 46205
$-24
Cash flow
-0.4%
Cash-on-Cash Return
6.1%
Cap rate
0.7%
Rent to Value Ratio
Active
$339,500
4
bds
|
3
ba
|
2,316
sqft
|
built
1968
839 Fernwood Ct, Indianapolis, IN 46234
$-67
Cash flow
-1.0%
Cash-on-Cash Return
5.9%
Cap rate
0.7%
Rent to Value Ratio
Active
$304,900
3
bds
|
2
ba
|
1,894
sqft
|
built
2018
4323 Stubbington Ln, Indianapolis, IN 46239
$-98
Cash flow
-1.7%
Cash-on-Cash Return
5.8%
Cap rate
0.7%
Rent to Value Ratio
Pending
$499,000
3
bds
|
3
ba
|
2,388
sqft
|
built
2020
1825 N New Jersey St, Indianapolis, IN 46202
$-276
Cash flow
-2.9%
Cash-on-Cash Return
5.5%
Cap rate
0.7%
Rent to Value Ratio
Active
$312,500
2
bds
|
1
ba
|
1,691
sqft
|
built
1924
6186 Ralston Ave, Indianapolis, IN 46220
$-359
Cash flow
-6.0%
Cash-on-Cash Return
4.8%
Cap rate
0.6%
Rent to Value Ratio
Active
$269,900
3
bds
|
2
ba
|
1,372
sqft
|
built
1977
7060 S Meridian St, Indianapolis, IN 46217
$-3
Cash flow
-0.1%
Cash-on-Cash Return
6.1%
Cap rate
0.7%
Rent to Value Ratio
Pending
$385,000
2
bds
|
3
ba
|
1,914
sqft
|
built
2021
1014 Sterling St, Indianapolis, IN 46201
$-111
Cash flow
-1.5%
Cash-on-Cash Return
5.8%
Cap rate
0.8%
Rent to Value Ratio
Active
$254,900
4
bds
|
2
ba
|
1,944
sqft
|
built
1890
248 N Walcott St, Indianapolis, IN 46201
$419
Cash flow
8.6%
Cash-on-Cash Return
8.1%
Cap rate
1.0%
Rent to Value Ratio

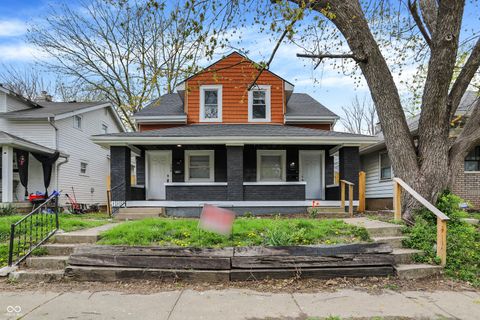
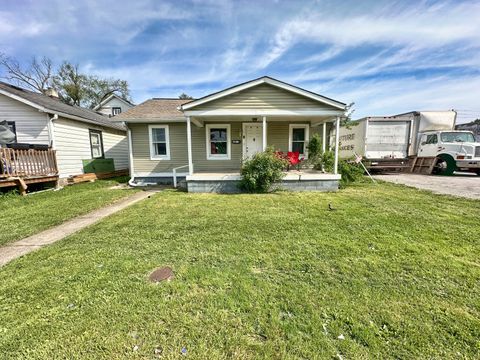
Active
$139,000
3
bds
|
1
ba
|
960
sqft
|
built
1958
2632 Walker Ave, Indianapolis, IN 46203
$47
Cash flow
1.8%
Cash-on-Cash Return
6.6%
Cap rate
0.8%
Rent to Value Ratio
Active
$115,000
3
bds
|
1
ba
|
925
sqft
|
built
1955
4715 E 33rd St, Indianapolis, IN 46218
$377
Cash flow
17.1%
Cash-on-Cash Return
10.1%
Cap rate
1.2%
Rent to Value Ratio
Active
$115,000
2
bds
|
0
ba
|
0
sqft
|
built
1955
1916 E Maryland St, Indianapolis, IN 46201
$308
Cash flow
14.0%
Cash-on-Cash Return
9.4%
Cap rate
1.1%
Rent to Value Ratio

Active
$140,000
2
bds
|
1
ba
|
902
sqft
|
built
1908
1035 S Tremont St, Indianapolis, IN 46221
$111
Cash flow
4.1%
Cash-on-Cash Return
7.1%
Cap rate
0.9%
Rent to Value Ratio
Active
$245,000
3
bds
|
2
ba
|
1,831
sqft
|
built
1925
3005 Broadway St, Indianapolis, IN 46205
$263
Cash flow
5.6%
Cash-on-Cash Return
7.4%
Cap rate
0.9%
Rent to Value Ratio
Active
$234,000
3
bds
|
3
ba
|
1,740
sqft
|
built
1977
3202 Acacia Dr, Indianapolis, IN 46214
$181
Cash flow
4.0%
Cash-on-Cash Return
7.1%
Cap rate
0.9%
Rent to Value Ratio

Active
$174,900
3
bds
|
1
ba
|
1,073
sqft
|
built
1959
1716 Arlene Dr, Indianapolis, IN 46219
$70
Cash flow
2.1%
Cash-on-Cash Return
6.6%
Cap rate
0.8%
Rent to Value Ratio

Pending
$193,900
3
bds
|
2
ba
|
1,035
sqft
|
built
1949
2035 N Tibbs Ave, Indianapolis, IN 46222
$249
Cash flow
6.7%
Cash-on-Cash Return
7.7%
Cap rate
0.9%
Rent to Value Ratio

Active
$159,900
3
bds
|
1
ba
|
928
sqft
|
built
1910
428 N Alton Ave, Indianapolis, IN 46222
$147
Cash flow
4.8%
Cash-on-Cash Return
7.2%
Cap rate
0.9%
Rent to Value Ratio

Active
$185,000
4
bds
|
2
ba
|
1,440
sqft
|
built
1930
3308 Schofield Ave, Indianapolis, IN 46218
$156
Cash flow
4.4%
Cash-on-Cash Return
7.2%
Cap rate
0.9%
Rent to Value Ratio
Active
$150,000
2
bds
|
1
ba
|
1,152
sqft
|
built
1924
4014 E 10th St, Indianapolis, IN 46201
$129
Cash flow
4.5%
Cash-on-Cash Return
7.2%
Cap rate
0.9%
Rent to Value Ratio

Active
$124,900
2
bds
|
2
ba
|
720
sqft
|
built
1925
2814 Brookside Ave, Indianapolis, IN 46218
$257
Cash flow
10.7%
Cash-on-Cash Return
8.6%
Cap rate
1.0%
Rent to Value Ratio

Pending
$180,000
3
bds
|
1
ba
|
1,875
sqft
|
built
1959
2442 N Franklin Rd, Indianapolis, IN 46219
$320
Cash flow
9.3%
Cash-on-Cash Return
8.3%
Cap rate
1.0%
Rent to Value Ratio

Active
$200,450
2
bds
|
2
ba
|
1,147
sqft
|
built
2002
3908 Roundwood Dr, Indianapolis, IN 46235
$77
Cash flow
2.0%
Cash-on-Cash Return
6.6%
Cap rate
0.8%
Rent to Value Ratio
Active
$237,000
2
bds
|
2
ba
|
1,219
sqft
|
built
1922
2320 Spann Ave, Indianapolis, IN 46203
$166
Cash flow
3.7%
Cash-on-Cash Return
7.0%
Cap rate
0.8%
Rent to Value Ratio

Active
$150,000
3
bds
|
1
ba
|
1,176
sqft
|
built
1910
57 N Tremont St, Indianapolis, IN 46222
$198
Cash flow
6.9%
Cash-on-Cash Return
7.7%
Cap rate
0.9%
Rent to Value Ratio

Active
$189,900
2
bds
|
1
ba
|
832
sqft
|
built
1920
5206 E Saint Clair St, Indianapolis, IN 46219
$131
Cash flow
3.6%
Cash-on-Cash Return
7.0%
Cap rate
0.8%
Rent to Value Ratio

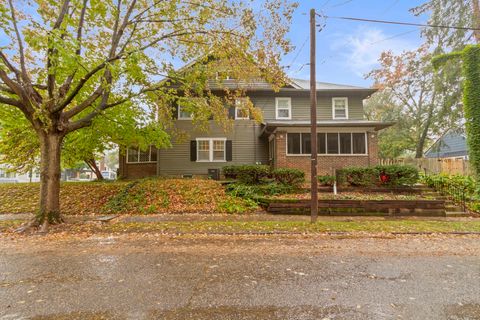
Active
$389,999
3
bds
|
2
ba
|
2,150
sqft
|
built
1900
1818 Cornell Ave, Indianapolis, IN 46202
$210
Cash flow
2.8%
Cash-on-Cash Return
6.8%
Cap rate
0.8%
Rent to Value Ratio

Active
$479,000
5
bds
|
3
ba
|
3,214
sqft
|
built
2022
7414 Glen Park Ln, Indianapolis, IN 46259
$177
Cash flow
1.9%
Cash-on-Cash Return
6.6%
Cap rate
0.8%
Rent to Value Ratio

Active
$89,900
2
bds
|
1
ba
|
1,120
sqft
|
built
1920
2821 E 13th St, Indianapolis, IN 46201
$298
Cash flow
17.3%
Cash-on-Cash Return
10.1%
Cap rate
1.2%
Rent to Value Ratio