Indianapolis, IN Investment Properties for Sale
Browse homes for sale and investment properties in Indianapolis, IN. Refine your search by price, property type, or more.
Best cash flowing properties in Indianapolis, IN

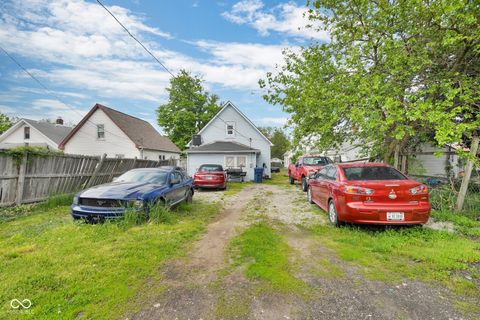
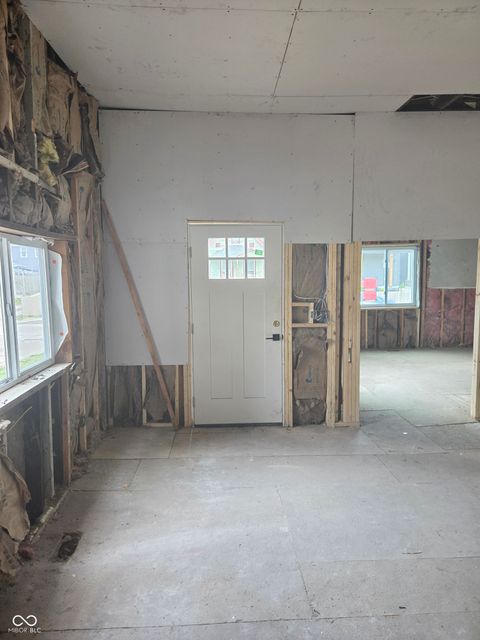
Active
$112,900
2
bds
|
1
ba
|
720
sqft
|
built
1951
3305 E 30th St, Indianapolis, IN 46218
$457
Cash flow
21.1%
Cash-on-Cash Return
11.0%
Cap rate
1.3%
Rent to Value Ratio
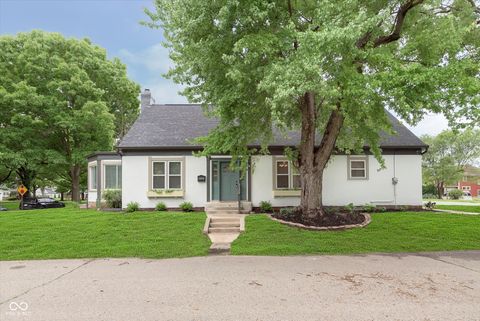
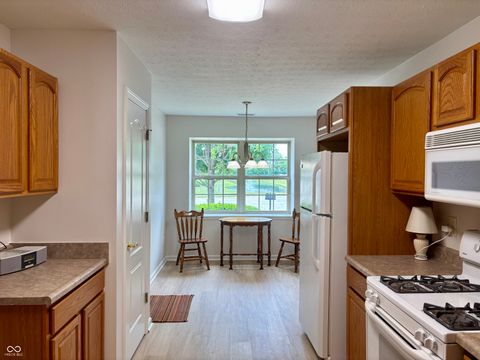
Active
$120,000
3
bds
|
1
ba
|
816
sqft
|
built
1955
1617 E Kelly St, Indianapolis, IN 46203
$351
Cash flow
15.3%
Cash-on-Cash Return
9.7%
Cap rate
1.2%
Rent to Value Ratio
1,959 out of 2,099 properties for sale in Indianapolis, IN
Limited Results Shown
Create a free account, or log in to reveal all property listings and enjoy the complete experience.

Active
$95,000
1
bds
|
0
ba
|
1,344
sqft
|
built
1939
3321 S Rybolt Ave, Indianapolis, IN 46221
$272
Cash flow
14.9%
Cash-on-Cash Return
9.6%
Cap rate
1.2%
Rent to Value Ratio

Active
$235,000
3
bds
|
1
ba
|
1,640
sqft
|
built
2009
2114 N Dexter St, Indianapolis, IN 46202
$176
Cash flow
3.9%
Cash-on-Cash Return
7.0%
Cap rate
0.9%
Rent to Value Ratio

Pending
$174,900
3
bds
|
1
ba
|
888
sqft
|
built
1956
4120 Breton St, Indianapolis, IN 46222
$70
Cash flow
2.1%
Cash-on-Cash Return
6.6%
Cap rate
0.8%
Rent to Value Ratio

Active
$235,000
3
bds
|
1
ba
|
1,488
sqft
|
built
1900
902 Villa Ave, Indianapolis, IN 46203
$176
Cash flow
3.9%
Cash-on-Cash Return
7.0%
Cap rate
0.9%
Rent to Value Ratio

Active
$140,000
0
bds
|
0
ba
|
0
sqft
|
built
1941
4920 E 34th St, Indianapolis, IN 46218
$249
Cash flow
9.3%
Cash-on-Cash Return
8.3%
Cap rate
1.0%
Rent to Value Ratio

Active
$230,000
3
bds
|
3
ba
|
1,494
sqft
|
built
2002
120 White Lick Dr, Indianapolis, IN 46227
$43
Cash flow
1.0%
Cash-on-Cash Return
6.4%
Cap rate
0.8%
Rent to Value Ratio

Active
$159,900
3
bds
|
2
ba
|
1,102
sqft
|
built
1931
2146 Gent Ave, Indianapolis, IN 46202
$147
Cash flow
4.8%
Cash-on-Cash Return
7.2%
Cap rate
0.9%
Rent to Value Ratio

Active
$115,000
2
bds
|
1
ba
|
968
sqft
|
built
1973
2721 Del Prado Dr, Indianapolis, IN 46227
$21
Cash flow
1.0%
Cash-on-Cash Return
6.4%
Cap rate
1.1%
Rent to Value Ratio

Active
$325,000
4
bds
|
3
ba
|
1,600
sqft
|
built
2018
3047 N New Jersey St, Indianapolis, IN 46205
$-147
Cash flow
-2.4%
Cash-on-Cash Return
5.6%
Cap rate
0.7%
Rent to Value Ratio

Active
$275,000
2
bds
|
2
ba
|
1,507
sqft
|
built
2018
6026 Rockdell Dr, Indianapolis, IN 46237
$-70
Cash flow
-1.3%
Cash-on-Cash Return
5.8%
Cap rate
0.7%
Rent to Value Ratio

Active
$200,000
3
bds
|
2
ba
|
1,984
sqft
|
built
1930
1467 W 33rd St, Indianapolis, IN 46208
$-58
Cash flow
-1.5%
Cash-on-Cash Return
5.8%
Cap rate
0.7%
Rent to Value Ratio

Active
$539,500
3
bds
|
3
ba
|
3,294
sqft
|
built
2006
2037 Ruckle St, Indianapolis, IN 46202
$-349
Cash flow
-3.4%
Cash-on-Cash Return
5.4%
Cap rate
0.6%
Rent to Value Ratio

Active
$449,900
2
bds
|
2
ba
|
1,629
sqft
|
built
2006
355 E Ohio St, Indianapolis, IN 46204
$-725
Cash flow
-8.4%
Cash-on-Cash Return
4.2%
Cap rate
0.7%
Rent to Value Ratio

Active
$220,000
4
bds
|
3
ba
|
1,760
sqft
|
built
1910
59 E Troy Ave, Indianapolis, IN 46225
$-437
Cash flow
-10.4%
Cash-on-Cash Return
3.8%
Cap rate
0.5%
Rent to Value Ratio

Active
$284,950
2
bds
|
3
ba
|
1,585
sqft
|
built
1924
350 N Meridian St, Indianapolis, IN 46204
$-455
Cash flow
-8.3%
Cash-on-Cash Return
4.2%
Cap rate
0.9%
Rent to Value Ratio
Active
$112,900
2
bds
|
1
ba
|
720
sqft
|
built
1951
3305 E 30th St, Indianapolis, IN 46218
$457
Cash flow
21.1%
Cash-on-Cash Return
11.0%
Cap rate
1.3%
Rent to Value Ratio

Pending
$325,000
3
bds
|
2
ba
|
2,000
sqft
|
built
1964
7734 Hoover Rd, Indianapolis, IN 46260
$-78
Cash flow
-1.3%
Cash-on-Cash Return
5.9%
Cap rate
0.7%
Rent to Value Ratio

Pending
$695,000
5
bds
|
0
ba
|
0
sqft
|
built
1900
975 Hosbrook St, Indianapolis, IN 46203
$-1,766
Cash flow
-13.3%
Cash-on-Cash Return
3.1%
Cap rate
0.4%
Rent to Value Ratio

Active
$290,000
3
bds
|
3
ba
|
1,728
sqft
|
built
1901
360 S Spencer Ave, Indianapolis, IN 46219
$-796
Cash flow
-14.3%
Cash-on-Cash Return
2.9%
Cap rate
0.3%
Rent to Value Ratio

Active
$600,000
5
bds
|
3
ba
|
2,454
sqft
|
built
1929
4302 Kessler Boulevard North Dr, Indianapolis, IN 46228
$-1,486
Cash flow
-12.9%
Cash-on-Cash Return
3.2%
Cap rate
0.4%
Rent to Value Ratio

Active
$499,900
4
bds
|
4
ba
|
4,055
sqft
|
built
1993
7341 Campfire Run, Indianapolis, IN 46236
$-428
Cash flow
-4.5%
Cash-on-Cash Return
5.1%
Cap rate
0.6%
Rent to Value Ratio

Active
$549,900
3
bds
|
3
ba
|
2,672
sqft
|
built
2016
1409 Spann Ave, Indianapolis, IN 46203
$-333
Cash flow
-3.2%
Cash-on-Cash Return
5.4%
Cap rate
0.7%
Rent to Value Ratio

Active
$419,900
3
bds
|
0
ba
|
0
sqft
|
built
1909
4055 N College Ave, Indianapolis, IN 46205
$-1,185
Cash flow
-14.7%
Cash-on-Cash Return
2.8%
Cap rate
0.3%
Rent to Value Ratio
Pending
$375,000
3
bds
|
2
ba
|
1,730
sqft
|
built
1920
1502 Burdsal Pkwy, Indianapolis, IN 46208
$-1,093
Cash flow
-15.2%
Cash-on-Cash Return
2.6%
Cap rate
0.3%
Rent to Value Ratio
Active
$1,200,000
4
bds
|
6
ba
|
7,186
sqft
|
built
2013
7610 Monte Carlo Way, Indianapolis, IN 46278
$-2,691
Cash flow
-11.7%
Cash-on-Cash Return
3.5%
Cap rate
0.4%
Rent to Value Ratio
Active
$120,000
3
bds
|
1
ba
|
816
sqft
|
built
1955
1617 E Kelly St, Indianapolis, IN 46203
$351
Cash flow
15.3%
Cash-on-Cash Return
9.7%
Cap rate
1.2%
Rent to Value Ratio
Active
$345,000
4
bds
|
3
ba
|
2,842
sqft
|
built
2003
5236 Skipping Stone Dr, Indianapolis, IN 46237
$-278
Cash flow
-4.2%
Cash-on-Cash Return
5.2%
Cap rate
0.6%
Rent to Value Ratio

Active
$359,000
3
bds
|
3
ba
|
1,672
sqft
|
built
1890
424 N Randolph St, Indianapolis, IN 46201
$-252
Cash flow
-3.7%
Cash-on-Cash Return
5.3%
Cap rate
0.6%
Rent to Value Ratio

Active
$359,000
4
bds
|
2
ba
|
1,600
sqft
|
built
1920
2230 E 75th St, Indianapolis, IN 46240
$93
Cash flow
1.4%
Cash-on-Cash Return
6.5%
Cap rate
0.8%
Rent to Value Ratio
Active
$194,900
3
bds
|
2
ba
|
1,156
sqft
|
built
1900
1016 Dawson St, Indianapolis, IN 46203
$-308
Cash flow
-8.2%
Cash-on-Cash Return
4.2%
Cap rate
0.5%
Rent to Value Ratio

Active
$184,900
0
bds
|
0
ba
|
0
sqft
|
built
1920
2161 Ransdell St, Indianapolis, IN 46225
$-257
Cash flow
-7.3%
Cash-on-Cash Return
4.5%
Cap rate
0.5%
Rent to Value Ratio
Active
$239,900
3
bds
|
2
ba
|
1,701
sqft
|
built
2000
10949 Harness Way, Indianapolis, IN 46239
$-46
Cash flow
-1.0%
Cash-on-Cash Return
5.9%
Cap rate
0.8%
Rent to Value Ratio

Active
$127,500
1
bds
|
1
ba
|
422
sqft
|
built
1907
230 E 9th St, Indianapolis, IN 46204
$-159
Cash flow
-6.5%
Cash-on-Cash Return
4.6%
Cap rate
0.9%
Rent to Value Ratio

Pending
$210,000
3
bds
|
2
ba
|
1,147
sqft
|
built
1971
10225 Bayton Ct, Indianapolis, IN 46229
$-41
Cash flow
-1.0%
Cash-on-Cash Return
5.9%
Cap rate
0.7%
Rent to Value Ratio

Active
$230,000
2
bds
|
2
ba
|
1,113
sqft
|
built
1999
7259 Registry Dr, Indianapolis, IN 46217
$-192
Cash flow
-4.4%
Cash-on-Cash Return
5.1%
Cap rate
0.7%
Rent to Value Ratio

Pending
$350,000
4
bds
|
3
ba
|
2,650
sqft
|
built
1930
40 N Ritter Ave, Indianapolis, IN 46219
$-68
Cash flow
-1.0%
Cash-on-Cash Return
5.9%
Cap rate
0.7%
Rent to Value Ratio
Active
$464,000
3
bds
|
4
ba
|
2,304
sqft
|
built
1928
825 Iowa St, Indianapolis, IN 46203
$107
Cash flow
1.2%
Cash-on-Cash Return
6.4%
Cap rate
0.8%
Rent to Value Ratio
Active
$289,500
3
bds
|
2
ba
|
1,263
sqft
|
built
1910
621 W 10th St, Indianapolis, IN 46202
$-103
Cash flow
-1.9%
Cash-on-Cash Return
5.7%
Cap rate
0.7%
Rent to Value Ratio
Active
$305,000
4
bds
|
3
ba
|
2,370
sqft
|
built
1974
1612 Westbay Ct, Indianapolis, IN 46260
$-44
Cash flow
-0.8%
Cash-on-Cash Return
6.0%
Cap rate
0.7%
Rent to Value Ratio

Active
$299,990
4
bds
|
3
ba
|
2,084
sqft
|
built
1967
8140 Valley Estates Dr, Indianapolis, IN 46227
$-157
Cash flow
-2.7%
Cash-on-Cash Return
5.5%
Cap rate
0.7%
Rent to Value Ratio