Indianapolis, IN Investment Properties for Sale
Browse homes for sale and investment properties in Indianapolis, IN. Refine your search by price, property type, or more.
Best cash flowing properties in Indianapolis, IN

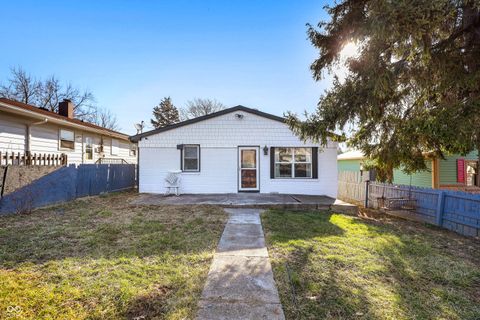
Active
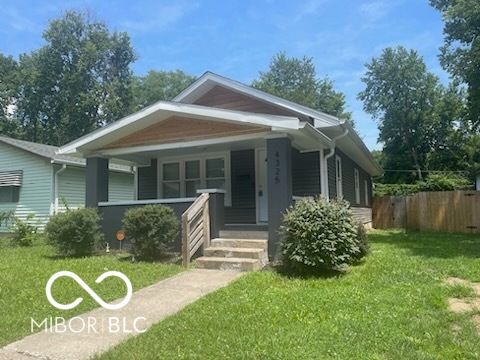
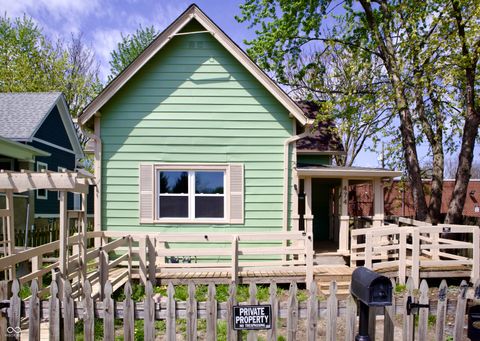
$112,900
2
bds
|
1
ba
|
720
sqft
|
built
1951
3305 E 30th St, Indianapolis, IN 46218
$457
Cash flow
21.1%
Cash-on-Cash Return
11.0%
Cap rate
1.3%
Rent to Value Ratio
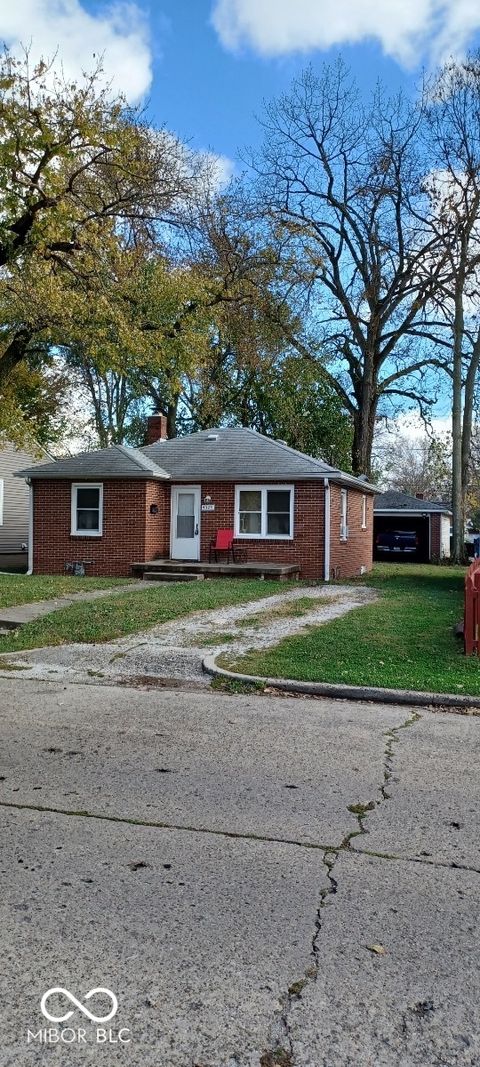
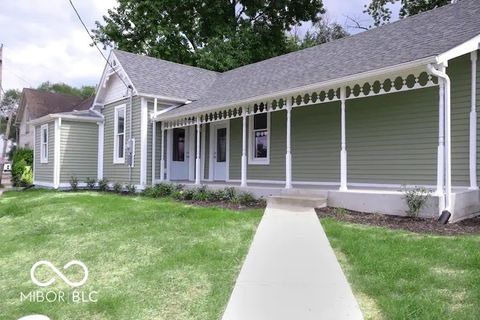
Active
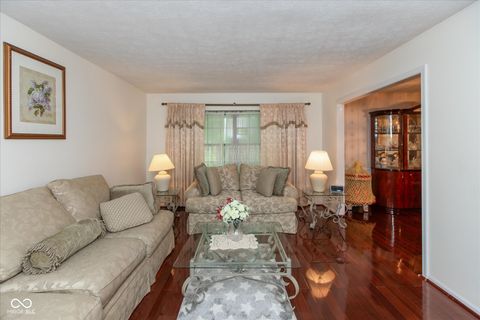
$170,000
3
bds
|
1
ba
|
824
sqft
|
built
1926
4325 Norwaldo Ave, Indianapolis, IN 46205
$233
Cash flow
7.2%
Cash-on-Cash Return
7.8%
Cap rate
0.9%
Rent to Value Ratio
1,959 out of 2,099 properties for sale in Indianapolis, IN
Limited Results Shown
Create a free account, or log in to reveal all property listings and enjoy the complete experience.
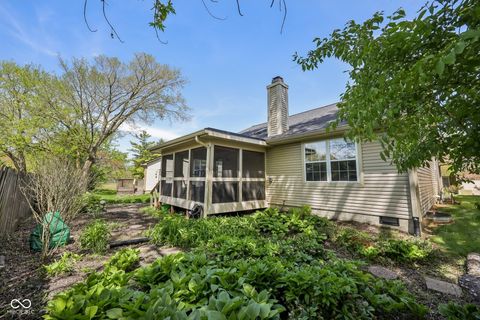
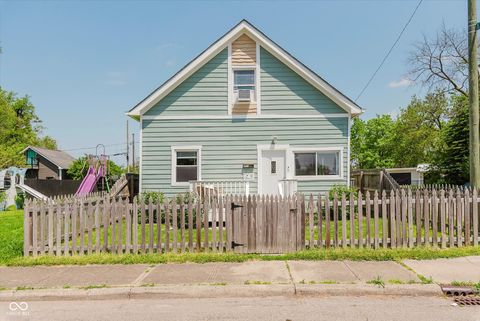
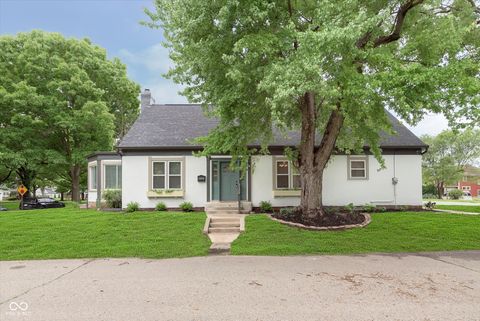
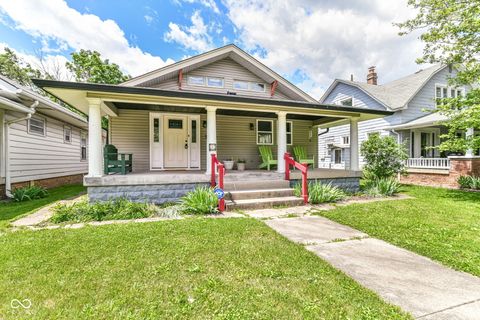
Active
$159,900
2
bds
|
1
ba
|
720
sqft
|
built
1949
4529 Crittenden Ave, Indianapolis, IN 46205
$9
Cash flow
0.3%
Cash-on-Cash Return
6.2%
Cap rate
0.8%
Rent to Value Ratio
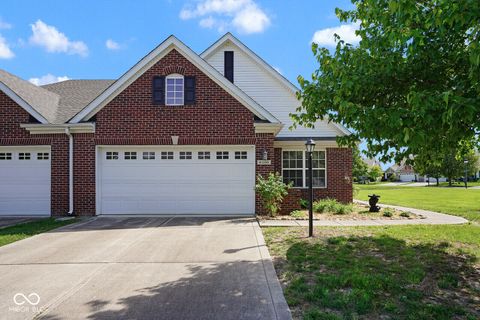
Active
$287,500
3
bds
|
2
ba
|
1,524
sqft
|
built
1994
7450 Deville Ct, Indianapolis, IN 46256
$-103
Cash flow
-1.9%
Cash-on-Cash Return
5.7%
Cap rate
0.7%
Rent to Value Ratio

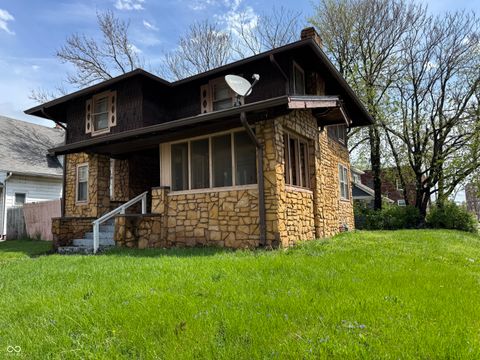
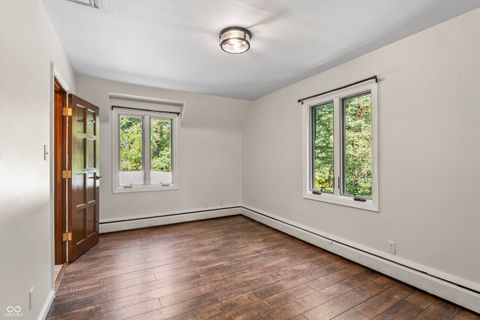
Active
$127,500
1
bds
|
1
ba
|
422
sqft
|
built
1907
230 E 9th St, Indianapolis, IN 46204
$-159
Cash flow
-6.5%
Cash-on-Cash Return
4.6%
Cap rate
0.9%
Rent to Value Ratio
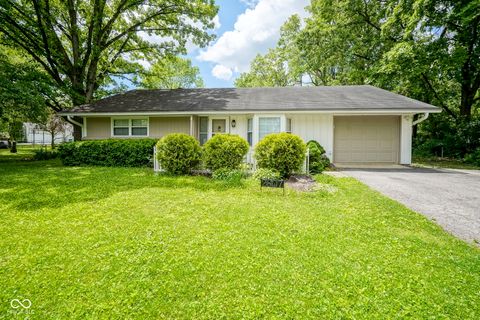
Active
$189,000
4
bds
|
2
ba
|
1,800
sqft
|
built
1920
3601 N Kenwood Ave, Indianapolis, IN 46208
$-2
Cash flow
-0.1%
Cash-on-Cash Return
6.1%
Cap rate
0.7%
Rent to Value Ratio
Active
$359,900
5
bds
|
3
ba
|
2,510
sqft
|
built
2022
10125 Caprock Canyon Dr, Indianapolis, IN 46229
$-148
Cash flow
-2.1%
Cash-on-Cash Return
5.7%
Cap rate
0.7%
Rent to Value Ratio
Active
$289,500
3
bds
|
2
ba
|
1,263
sqft
|
built
1910
621 W 10th St, Indianapolis, IN 46202
$-103
Cash flow
-1.9%
Cash-on-Cash Return
5.7%
Cap rate
0.7%
Rent to Value Ratio
Active
$195,000
3
bds
|
1
ba
|
1,230
sqft
|
built
1967
821 S Worth Ave, Indianapolis, IN 46241
$-102
Cash flow
-2.7%
Cash-on-Cash Return
5.5%
Cap rate
0.7%
Rent to Value Ratio
Active
$244,000
3
bds
|
2
ba
|
1,542
sqft
|
built
1910
2230 Pleasant St, Indianapolis, IN 46203
$61
Cash flow
1.3%
Cash-on-Cash Return
6.4%
Cap rate
0.8%
Rent to Value Ratio
Active
$235,000
3
bds
|
2
ba
|
1,192
sqft
|
built
1955
474 N Randolph St, Indianapolis, IN 46201
$-238
Cash flow
-5.3%
Cash-on-Cash Return
4.9%
Cap rate
0.6%
Rent to Value Ratio
Active
$194,900
3
bds
|
2
ba
|
1,156
sqft
|
built
1900
1016 Dawson St, Indianapolis, IN 46203
$-308
Cash flow
-8.2%
Cash-on-Cash Return
4.2%
Cap rate
0.5%
Rent to Value Ratio
Active
$305,000
4
bds
|
3
ba
|
2,370
sqft
|
built
1974
1612 Westbay Ct, Indianapolis, IN 46260
$-44
Cash flow
-0.8%
Cash-on-Cash Return
6.0%
Cap rate
0.7%
Rent to Value Ratio
Active
$225,000
3
bds
|
1
ba
|
1,290
sqft
|
built
1965
5017 E 14th St, Indianapolis, IN 46201
$-118
Cash flow
-2.7%
Cash-on-Cash Return
5.5%
Cap rate
0.7%
Rent to Value Ratio

Active
$549,900
3
bds
|
3
ba
|
2,672
sqft
|
built
2016
1409 Spann Ave, Indianapolis, IN 46203
$-333
Cash flow
-3.2%
Cash-on-Cash Return
5.4%
Cap rate
0.7%
Rent to Value Ratio

Pending
$695,000
5
bds
|
0
ba
|
0
sqft
|
built
1900
975 Hosbrook St, Indianapolis, IN 46203
$-1,766
Cash flow
-13.3%
Cash-on-Cash Return
3.1%
Cap rate
0.4%
Rent to Value Ratio
Pending
$375,000
3
bds
|
2
ba
|
1,730
sqft
|
built
1920
1502 Burdsal Pkwy, Indianapolis, IN 46208
$-1,093
Cash flow
-15.2%
Cash-on-Cash Return
2.6%
Cap rate
0.3%
Rent to Value Ratio

Active
$220,000
4
bds
|
3
ba
|
1,760
sqft
|
built
1910
59 E Troy Ave, Indianapolis, IN 46225
$-437
Cash flow
-10.4%
Cash-on-Cash Return
3.8%
Cap rate
0.5%
Rent to Value Ratio

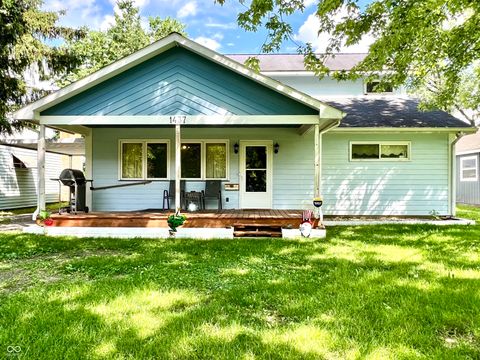
Active
$200,000
3
bds
|
2
ba
|
1,984
sqft
|
built
1930
1467 W 33rd St, Indianapolis, IN 46208
$-58
Cash flow
-1.5%
Cash-on-Cash Return
5.8%
Cap rate
0.7%
Rent to Value Ratio
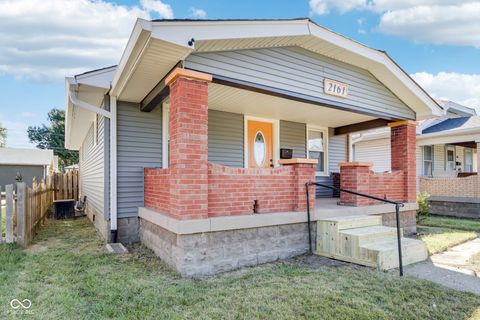
Pending
$210,000
2
bds
|
1
ba
|
816
sqft
|
built
1925
2161 Napoleon St, Indianapolis, IN 46203
$-110
Cash flow
-2.7%
Cash-on-Cash Return
5.5%
Cap rate
0.7%
Rent to Value Ratio
Active
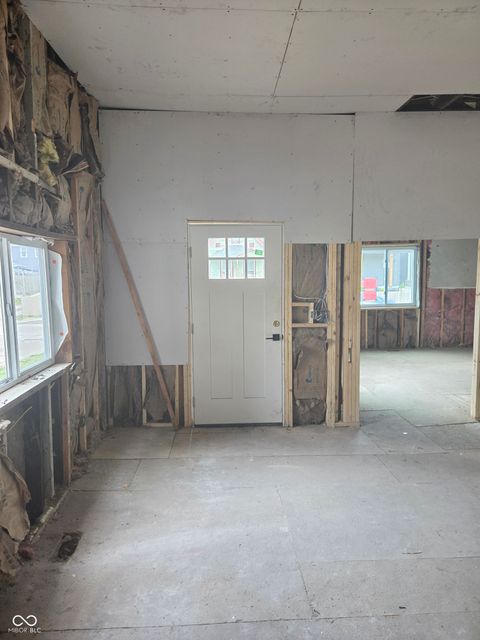
$112,900
2
bds
|
1
ba
|
720
sqft
|
built
1951
3305 E 30th St, Indianapolis, IN 46218
$457
Cash flow
21.1%
Cash-on-Cash Return
11.0%
Cap rate
1.3%
Rent to Value Ratio

Active
$290,000
3
bds
|
3
ba
|
1,728
sqft
|
built
1901
360 S Spencer Ave, Indianapolis, IN 46219
$-796
Cash flow
-14.3%
Cash-on-Cash Return
2.9%
Cap rate
0.3%
Rent to Value Ratio

Active
$449,900
2
bds
|
2
ba
|
1,629
sqft
|
built
2006
355 E Ohio St, Indianapolis, IN 46204
$-725
Cash flow
-8.4%
Cash-on-Cash Return
4.2%
Cap rate
0.7%
Rent to Value Ratio
Active
$1,200,000
4
bds
|
6
ba
|
7,186
sqft
|
built
2013
7610 Monte Carlo Way, Indianapolis, IN 46278
$-2,691
Cash flow
-11.7%
Cash-on-Cash Return
3.5%
Cap rate
0.4%
Rent to Value Ratio

Active
$600,000
5
bds
|
3
ba
|
2,454
sqft
|
built
1929
4302 Kessler Boulevard North Dr, Indianapolis, IN 46228
$-1,486
Cash flow
-12.9%
Cash-on-Cash Return
3.2%
Cap rate
0.4%
Rent to Value Ratio
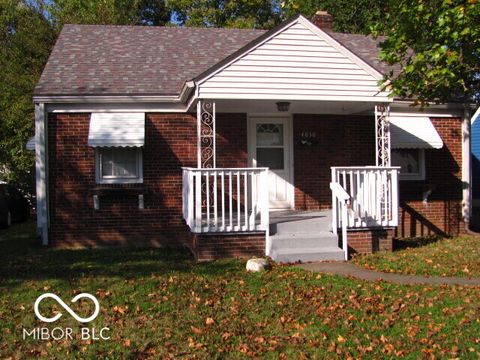
Active
$149,900
2
bds
|
1
ba
|
768
sqft
|
built
1940
4830 Wentworth Blvd, Indianapolis, IN 46201
$-9
Cash flow
-0.3%
Cash-on-Cash Return
6.1%
Cap rate
0.7%
Rent to Value Ratio
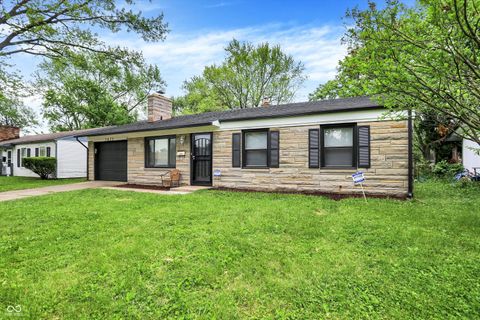
Active
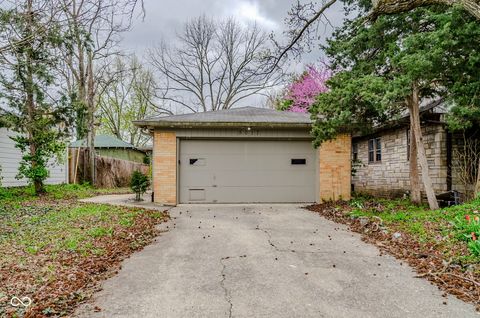
$170,000
3
bds
|
1
ba
|
824
sqft
|
built
1926
4325 Norwaldo Ave, Indianapolis, IN 46205
$233
Cash flow
7.2%
Cash-on-Cash Return
7.8%
Cap rate
0.9%
Rent to Value Ratio

Active
$950,000
4
bds
|
0
ba
|
0
sqft
|
built
1967
6795 W 21st St, Indianapolis, IN 46214
$-1,830
Cash flow
-10.1%
Cash-on-Cash Return
3.8%
Cap rate
0.5%
Rent to Value Ratio
Active
$235,000
3
bds
|
2
ba
|
1,611
sqft
|
built
1924
518 N Emerson Ave, Indianapolis, IN 46219
$-307
Cash flow
-6.8%
Cash-on-Cash Return
4.6%
Cap rate
0.6%
Rent to Value Ratio
Active
$259,900
3
bds
|
2
ba
|
1,634
sqft
|
built
2005
6105 Franklin Villas Way, Indianapolis, IN 46237
$-189
Cash flow
-3.8%
Cash-on-Cash Return
5.3%
Cap rate
0.7%
Rent to Value Ratio

Active
$679,000
4
bds
|
4
ba
|
4,569
sqft
|
built
2003
7957 Preservation Dr, Indianapolis, IN 46278
$-477
Cash flow
-3.7%
Cash-on-Cash Return
5.3%
Cap rate
0.7%
Rent to Value Ratio
Active
$979,000
4
bds
|
5
ba
|
5,104
sqft
|
built
1940
6470 Around The Hills Rd, Indianapolis, IN 46226
$-942
Cash flow
-5.0%
Cash-on-Cash Return
5.0%
Cap rate
0.7%
Rent to Value Ratio
Active
$266,000
3
bds
|
2
ba
|
1,617
sqft
|
built
1960
2807 Westleigh Dr, Indianapolis, IN 46268
$17
Cash flow
0.3%
Cash-on-Cash Return
6.2%
Cap rate
0.8%
Rent to Value Ratio
Active
$549,900
4
bds
|
3
ba
|
2,734
sqft
|
built
2020
7046 Allegiance Ct, Indianapolis, IN 46259
$-373
Cash flow
-3.5%
Cash-on-Cash Return
5.3%
Cap rate
0.7%
Rent to Value Ratio
Active
$620,000
5
bds
|
5
ba
|
5,212
sqft
|
built
1999
6610 Royal Oakland Dr, Indianapolis, IN 46236
$-209
Cash flow
-1.8%
Cash-on-Cash Return
5.7%
Cap rate
0.7%
Rent to Value Ratio
Pending
$244,900
3
bds
|
2
ba
|
2,173
sqft
|
built
1996
3223 Keystone Lakes Way, Indianapolis, IN 46237
$-151
Cash flow
-3.2%
Cash-on-Cash Return
5.4%
Cap rate
0.7%
Rent to Value Ratio
Active
$255,000
4
bds
|
2
ba
|
1,717
sqft
|
built
1910
106 Walnut St, Indianapolis, IN 46227
$-340
Cash flow
-7.0%
Cash-on-Cash Return
4.5%
Cap rate
0.5%
Rent to Value Ratio
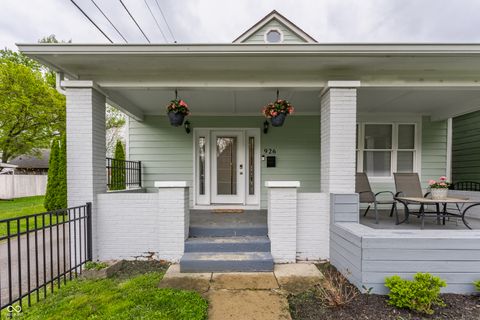
Pending
$435,000
3
bds
|
3
ba
|
2,408
sqft
|
built
1880
926 Olive St, Indianapolis, IN 46203
$-20
Cash flow
-0.2%
Cash-on-Cash Return
6.1%
Cap rate
0.7%
Rent to Value Ratio
Pending
$184,900
3
bds
|
1
ba
|
1,104
sqft
|
built
1959
7625 E 35th St, Indianapolis, IN 46226
$19
Cash flow
0.5%
Cash-on-Cash Return
6.3%
Cap rate
0.8%
Rent to Value Ratio
Pending
$239,900
3
bds
|
2
ba
|
1,080
sqft
|
built
1958
6303 Bertha St, Indianapolis, IN 46241
$-125
Cash flow
-2.7%
Cash-on-Cash Return
5.5%
Cap rate
0.7%
Rent to Value Ratio
Active
$1,050,000
3
bds
|
3
ba
|
3,293
sqft
|
built
1907
749 N Park Ave, Indianapolis, IN 46202
$-2,215
Cash flow
-11.0%
Cash-on-Cash Return
3.6%
Cap rate
0.5%
Rent to Value Ratio
Active
$240,000
3
bds
|
2
ba
|
2,300
sqft
|
built
1955
1437 E Pleasant Run Parkway South Dr, Indianapolis, IN 46203
$-125
Cash flow
-2.7%
Cash-on-Cash Return
5.5%
Cap rate
0.7%
Rent to Value Ratio