Indianapolis, IN Investment Properties for Sale
Browse homes for sale and investment properties in Indianapolis, IN. Refine your search by price, property type, or more.
Best cash flowing properties in Indianapolis, IN

Active
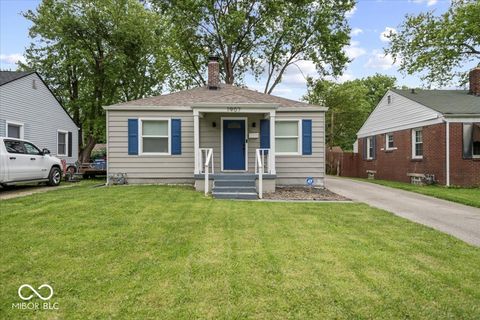
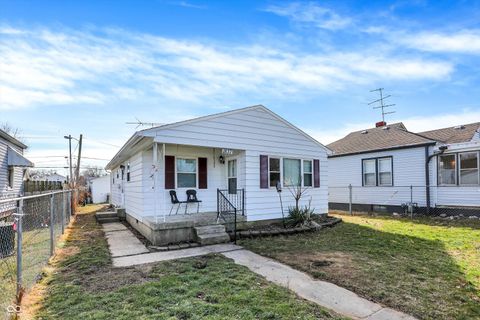
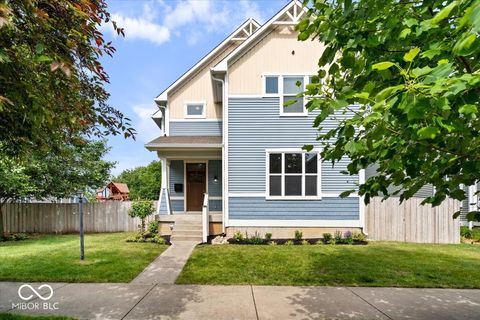
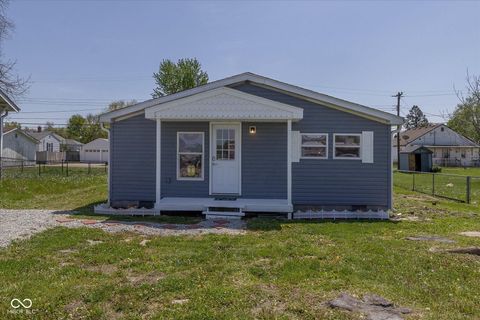
$112,000
4
bds
|
2
ba
|
1,680
sqft
|
built
1927
2006 N Olney St, Indianapolis, IN 46218
$530
Cash flow
24.7%
Cash-on-Cash Return
11.8%
Cap rate
1.4%
Rent to Value Ratio
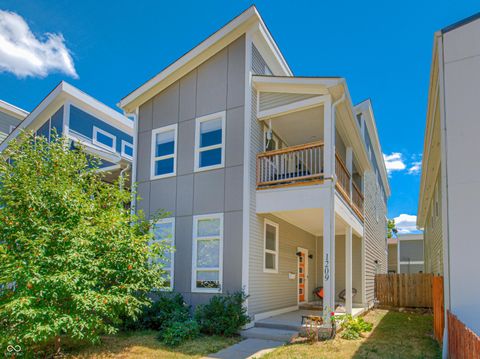
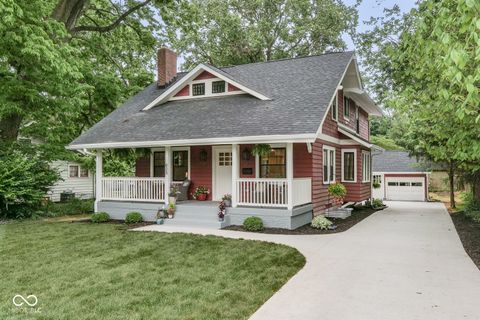
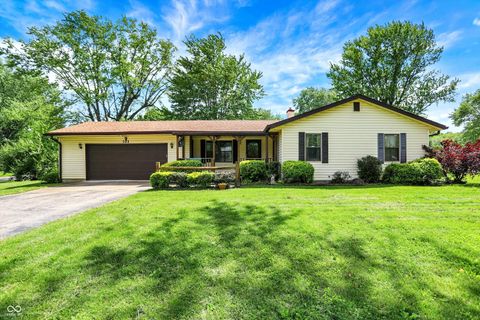
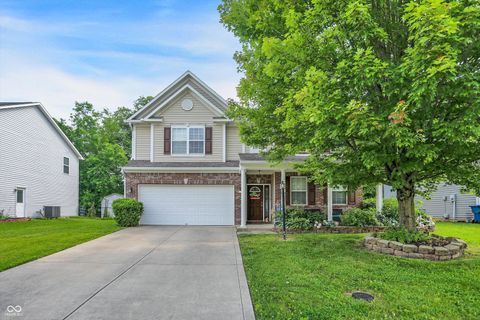
Active
$420,000
4
bds
|
3
ba
|
2,332
sqft
|
built
2017
1209 Cottage Ave, Indianapolis, IN 46203
$264
Cash flow
3.3%
Cash-on-Cash Return
6.9%
Cap rate
0.8%
Rent to Value Ratio
1,953 out of 2,093 properties for sale in Indianapolis, IN
Limited Results Shown
Create a free account, or log in to reveal all property listings and enjoy the complete experience.
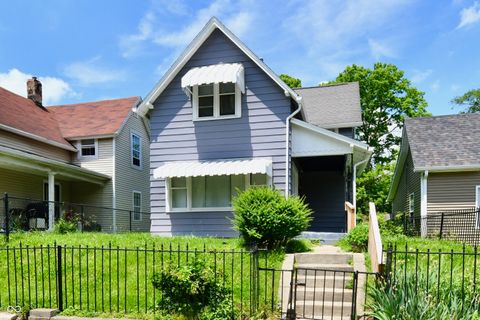
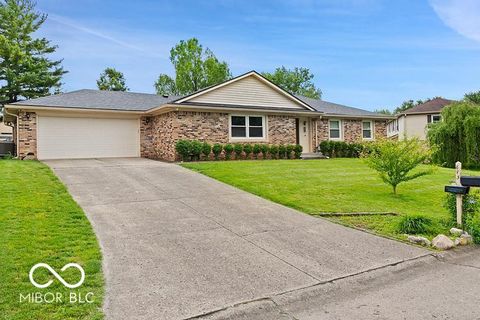
Active
$290,000
2
bds
|
2
ba
|
1,599
sqft
|
built
2022
7184 Lillian Pl, Indianapolis, IN 46229
$-441
Cash flow
-7.9%
Cash-on-Cash Return
4.3%
Cap rate
0.6%
Rent to Value Ratio
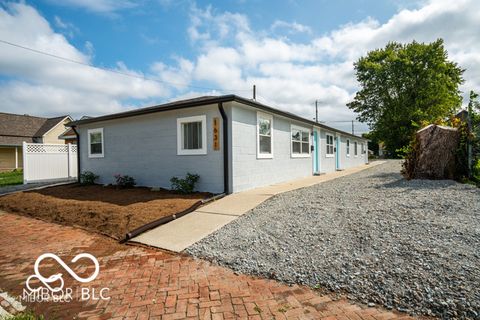
Active
$420,000
4
bds
|
3
ba
|
2,332
sqft
|
built
2017
1209 Cottage Ave, Indianapolis, IN 46203
$264
Cash flow
3.3%
Cash-on-Cash Return
6.9%
Cap rate
0.8%
Rent to Value Ratio

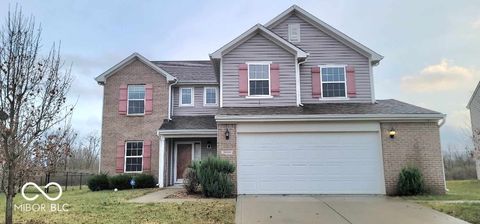
Active
$299,900
4
bds
|
3
ba
|
2,357
sqft
|
built
1972
1641 Whistler Ter, Indianapolis, IN 46229
$-294
Cash flow
-5.1%
Cash-on-Cash Return
5.0%
Cap rate
0.6%
Rent to Value Ratio
Active
$239,000
3
bds
|
2
ba
|
1,788
sqft
|
built
1920
839 N Oxford St, Indianapolis, IN 46201
$-327
Cash flow
-7.1%
Cash-on-Cash Return
4.5%
Cap rate
0.5%
Rent to Value Ratio
Active
$209,900
3
bds
|
2
ba
|
1,216
sqft
|
built
1951
450 N Fenton Ave, Indianapolis, IN 46219
$-109
Cash flow
-2.7%
Cash-on-Cash Return
5.5%
Cap rate
0.7%
Rent to Value Ratio
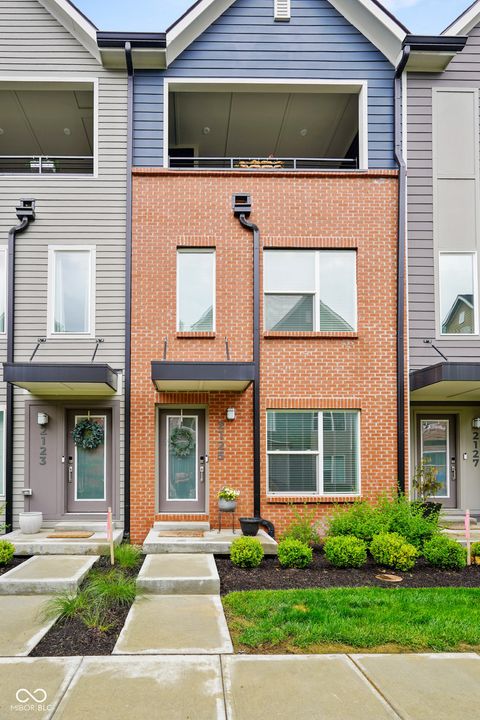
Active
$349,900
2
bds
|
3
ba
|
1,281
sqft
|
built
2022
2125 Coretta Way, Indianapolis, IN 46202
$30
Cash flow
0.4%
Cash-on-Cash Return
6.2%
Cap rate
0.8%
Rent to Value Ratio
Active
$185,000
2
bds
|
1
ba
|
1,296
sqft
|
built
1913
802 N Oakland Ave, Indianapolis, IN 46201
$-258
Cash flow
-7.3%
Cash-on-Cash Return
4.5%
Cap rate
0.5%
Rent to Value Ratio
Active
$129,900
3
bds
|
2
ba
|
1,188
sqft
|
built
1930
3619 N Hawthorne Ln, Indianapolis, IN 46218
$232
Cash flow
9.3%
Cash-on-Cash Return
8.3%
Cap rate
1.0%
Rent to Value Ratio
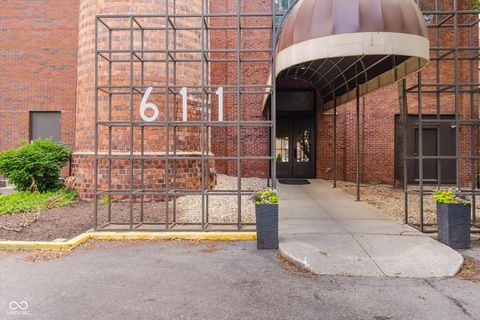
Active
$400,000
2
bds
|
2
ba
|
1,230
sqft
|
built
1926
611 N Park Ave, Indianapolis, IN 46204
$-997
Cash flow
-13.0%
Cash-on-Cash Return
3.2%
Cap rate
0.6%
Rent to Value Ratio
Active
$198,000
3
bds
|
2
ba
|
1,471
sqft
|
built
1945
1907 N Drexel Ave, Indianapolis, IN 46218
$-48
Cash flow
-1.3%
Cash-on-Cash Return
5.9%
Cap rate
0.7%
Rent to Value Ratio
Active
$995,000
5
bds
|
4
ba
|
3,383
sqft
|
built
1924
625 E 57th St, Indianapolis, IN 46220
$-3,303
Cash flow
-17.3%
Cash-on-Cash Return
2.2%
Cap rate
0.3%
Rent to Value Ratio
Active
$765,000
3
bds
|
3
ba
|
2,080
sqft
|
built
2006
435 Virginia Ave, Indianapolis, IN 46203
$-2,388
Cash flow
-16.3%
Cash-on-Cash Return
2.4%
Cap rate
0.5%
Rent to Value Ratio
Active
$315,000
3
bds
|
3
ba
|
2,270
sqft
|
built
1919
317 E 37th St, Indianapolis, IN 46205
$111
Cash flow
1.8%
Cash-on-Cash Return
6.6%
Cap rate
0.8%
Rent to Value Ratio
Active
$439,000
3
bds
|
3
ba
|
2,152
sqft
|
built
1885
1627 Pleasant St, Indianapolis, IN 46203
$-110
Cash flow
-1.3%
Cash-on-Cash Return
5.8%
Cap rate
0.7%
Rent to Value Ratio
Active
$325,000
4
bds
|
3
ba
|
2,178
sqft
|
built
2001
2623 Senators Way, Indianapolis, IN 46217
$-447
Cash flow
-7.2%
Cash-on-Cash Return
4.5%
Cap rate
0.6%
Rent to Value Ratio
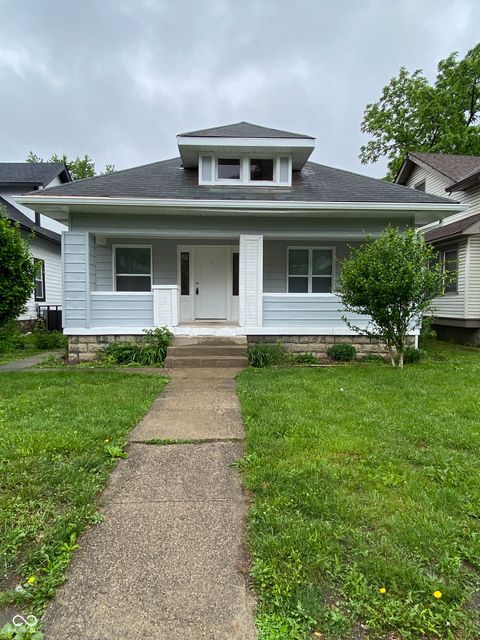
Active
$174,999
4
bds
|
3
ba
|
2,478
sqft
|
built
1955
1337 N Olney St, Indianapolis, IN 46201
$70
Cash flow
2.1%
Cash-on-Cash Return
6.6%
Cap rate
0.8%
Rent to Value Ratio
Active
$475,000
4
bds
|
4
ba
|
3,500
sqft
|
built
1890
19 E Regent St, Indianapolis, IN 46225
$-1,467
Cash flow
-16.1%
Cash-on-Cash Return
2.4%
Cap rate
0.3%
Rent to Value Ratio
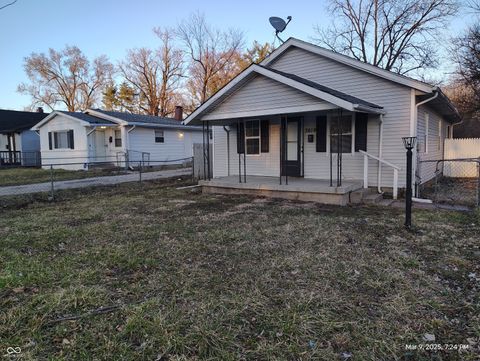
Active
$169,990
3
bds
|
1
ba
|
1,060
sqft
|
built
1962
1837 E Legrande Ave, Indianapolis, IN 46203
$95
Cash flow
2.9%
Cash-on-Cash Return
6.8%
Cap rate
0.8%
Rent to Value Ratio
Active
$220,000
3
bds
|
1
ba
|
1,168
sqft
|
built
1955
101 Heiny Rd, Indianapolis, IN 46217
$-92
Cash flow
-2.2%
Cash-on-Cash Return
5.6%
Cap rate
0.7%
Rent to Value Ratio
Active
$199,999
3
bds
|
2
ba
|
1,494
sqft
|
built
1895
1346 W 27th St, Indianapolis, IN 46208
$-58
Cash flow
-1.5%
Cash-on-Cash Return
5.8%
Cap rate
0.7%
Rent to Value Ratio
Active
$649,000
2
bds
|
0
ba
|
0
sqft
|
built
1960
1631 Columbia Ave, Indianapolis, IN 46202
$-2,428
Cash flow
-19.5%
Cash-on-Cash Return
1.7%
Cap rate
0.2%
Rent to Value Ratio
Pending
$335,000
3
bds
|
3
ba
|
2,544
sqft
|
built
2004
5891 Mimosa Dr, Indianapolis, IN 46234
$-165
Cash flow
-2.6%
Cash-on-Cash Return
5.6%
Cap rate
0.7%
Rent to Value Ratio
Active
$400,000
4
bds
|
3
ba
|
2,865
sqft
|
built
1974
8205 Picadilly Ln, Indianapolis, IN 46256
$-356
Cash flow
-4.6%
Cash-on-Cash Return
5.1%
Cap rate
0.6%
Rent to Value Ratio
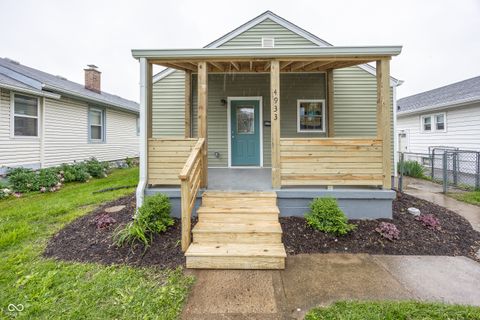
Pending
$299,900
2
bds
|
3
ba
|
1,237
sqft
|
built
1930
4933 W 13th St, Indianapolis, IN 46224
$-639
Cash flow
-11.1%
Cash-on-Cash Return
3.6%
Cap rate
0.4%
Rent to Value Ratio
Active
$329,900
3
bds
|
3
ba
|
1,586
sqft
|
built
1988
11612 E 75th St, Indianapolis, IN 46236
$-172
Cash flow
-2.7%
Cash-on-Cash Return
5.5%
Cap rate
0.7%
Rent to Value Ratio
Active
$875,000
5
bds
|
4
ba
|
4,147
sqft
|
built
2013
2448 Broadway St, Indianapolis, IN 46205
$-1,735
Cash flow
-10.3%
Cash-on-Cash Return
3.8%
Cap rate
0.5%
Rent to Value Ratio
Active
$310,000
3
bds
|
2
ba
|
1,806
sqft
|
built
1974
813 Boulder Rd, Indianapolis, IN 46217
$-304
Cash flow
-5.1%
Cash-on-Cash Return
5.0%
Cap rate
0.6%
Rent to Value Ratio
Active
$112,000
4
bds
|
2
ba
|
1,680
sqft
|
built
1927
2006 N Olney St, Indianapolis, IN 46218
$530
Cash flow
24.7%
Cash-on-Cash Return
11.8%
Cap rate
1.4%
Rent to Value Ratio
Active
$169,500
2
bds
|
1
ba
|
789
sqft
|
built
1941
330 S Butler Ave, Indianapolis, IN 46219
$98
Cash flow
3.0%
Cash-on-Cash Return
6.8%
Cap rate
0.8%
Rent to Value Ratio
Active
$320,000
4
bds
|
3
ba
|
2,099
sqft
|
built
2016
3801 Boundary Bay Dr, Indianapolis, IN 46217
$-297
Cash flow
-4.8%
Cash-on-Cash Return
5.0%
Cap rate
0.6%
Rent to Value Ratio
Pending
$699,900
5
bds
|
3
ba
|
3,611
sqft
|
built
1946
4415 N Illinois St, Indianapolis, IN 46208
$-825
Cash flow
-6.1%
Cash-on-Cash Return
4.7%
Cap rate
0.6%
Rent to Value Ratio
Pending
$179,000
3
bds
|
2
ba
|
1,144
sqft
|
built
2006
5515 W Morris St, Indianapolis, IN 46241
$49
Cash flow
1.4%
Cash-on-Cash Return
6.5%
Cap rate
0.8%
Rent to Value Ratio
Active
$179,900
3
bds
|
1
ba
|
1,327
sqft
|
built
1930
548 S Vine St, Indianapolis, IN 46241
$44
Cash flow
1.3%
Cash-on-Cash Return
6.4%
Cap rate
0.8%
Rent to Value Ratio
Active
$350,000
4
bds
|
3
ba
|
3,030
sqft
|
built
2006
9605 Treyburn Green Way, Indianapolis, IN 46239
$-94
Cash flow
-1.4%
Cash-on-Cash Return
5.8%
Cap rate
0.7%
Rent to Value Ratio
Active
$767,500
4
bds
|
4
ba
|
3,747
sqft
|
built
2018
1622 Cornell Ave, Indianapolis, IN 46202
$-413
Cash flow
-2.8%
Cash-on-Cash Return
5.5%
Cap rate
0.7%
Rent to Value Ratio
Active
$750,000
5
bds
|
5
ba
|
4,762
sqft
|
built
1998
20 Forrests Edge Ct, Indianapolis, IN 46227
$-1,013
Cash flow
-7.0%
Cash-on-Cash Return
4.5%
Cap rate
0.5%
Rent to Value Ratio
Active
$1,175,000
4
bds
|
4
ba
|
4,523
sqft
|
built
1929
5805 Forest Ln, Indianapolis, IN 46220
$-3,604
Cash flow
-16.0%
Cash-on-Cash Return
2.5%
Cap rate
0.3%
Rent to Value Ratio
Active
$166,000
3
bds
|
1
ba
|
975
sqft
|
built
1959
1820 Martin St, Indianapolis, IN 46237
$116
Cash flow
3.6%
Cash-on-Cash Return
7.0%
Cap rate
0.8%
Rent to Value Ratio
Active
$280,000
3
bds
|
2
ba
|
1,301
sqft
|
built
1956
1325 Alimingo Dr, Indianapolis, IN 46260
$-54
Cash flow
-1.0%
Cash-on-Cash Return
5.9%
Cap rate
0.7%
Rent to Value Ratio
Active
$360,000
5
bds
|
3
ba
|
3,502
sqft
|
built
2002
5637 Woodland Trace Blvd, Indianapolis, IN 46237
$-154
Cash flow
-2.2%
Cash-on-Cash Return
5.6%
Cap rate
0.7%
Rent to Value Ratio