Indianapolis, IN Investment Properties for Sale
Browse homes for sale and investment properties in Indianapolis, IN. Refine your search by price, property type, or more.
Best cash flowing properties in Indianapolis, IN
Active
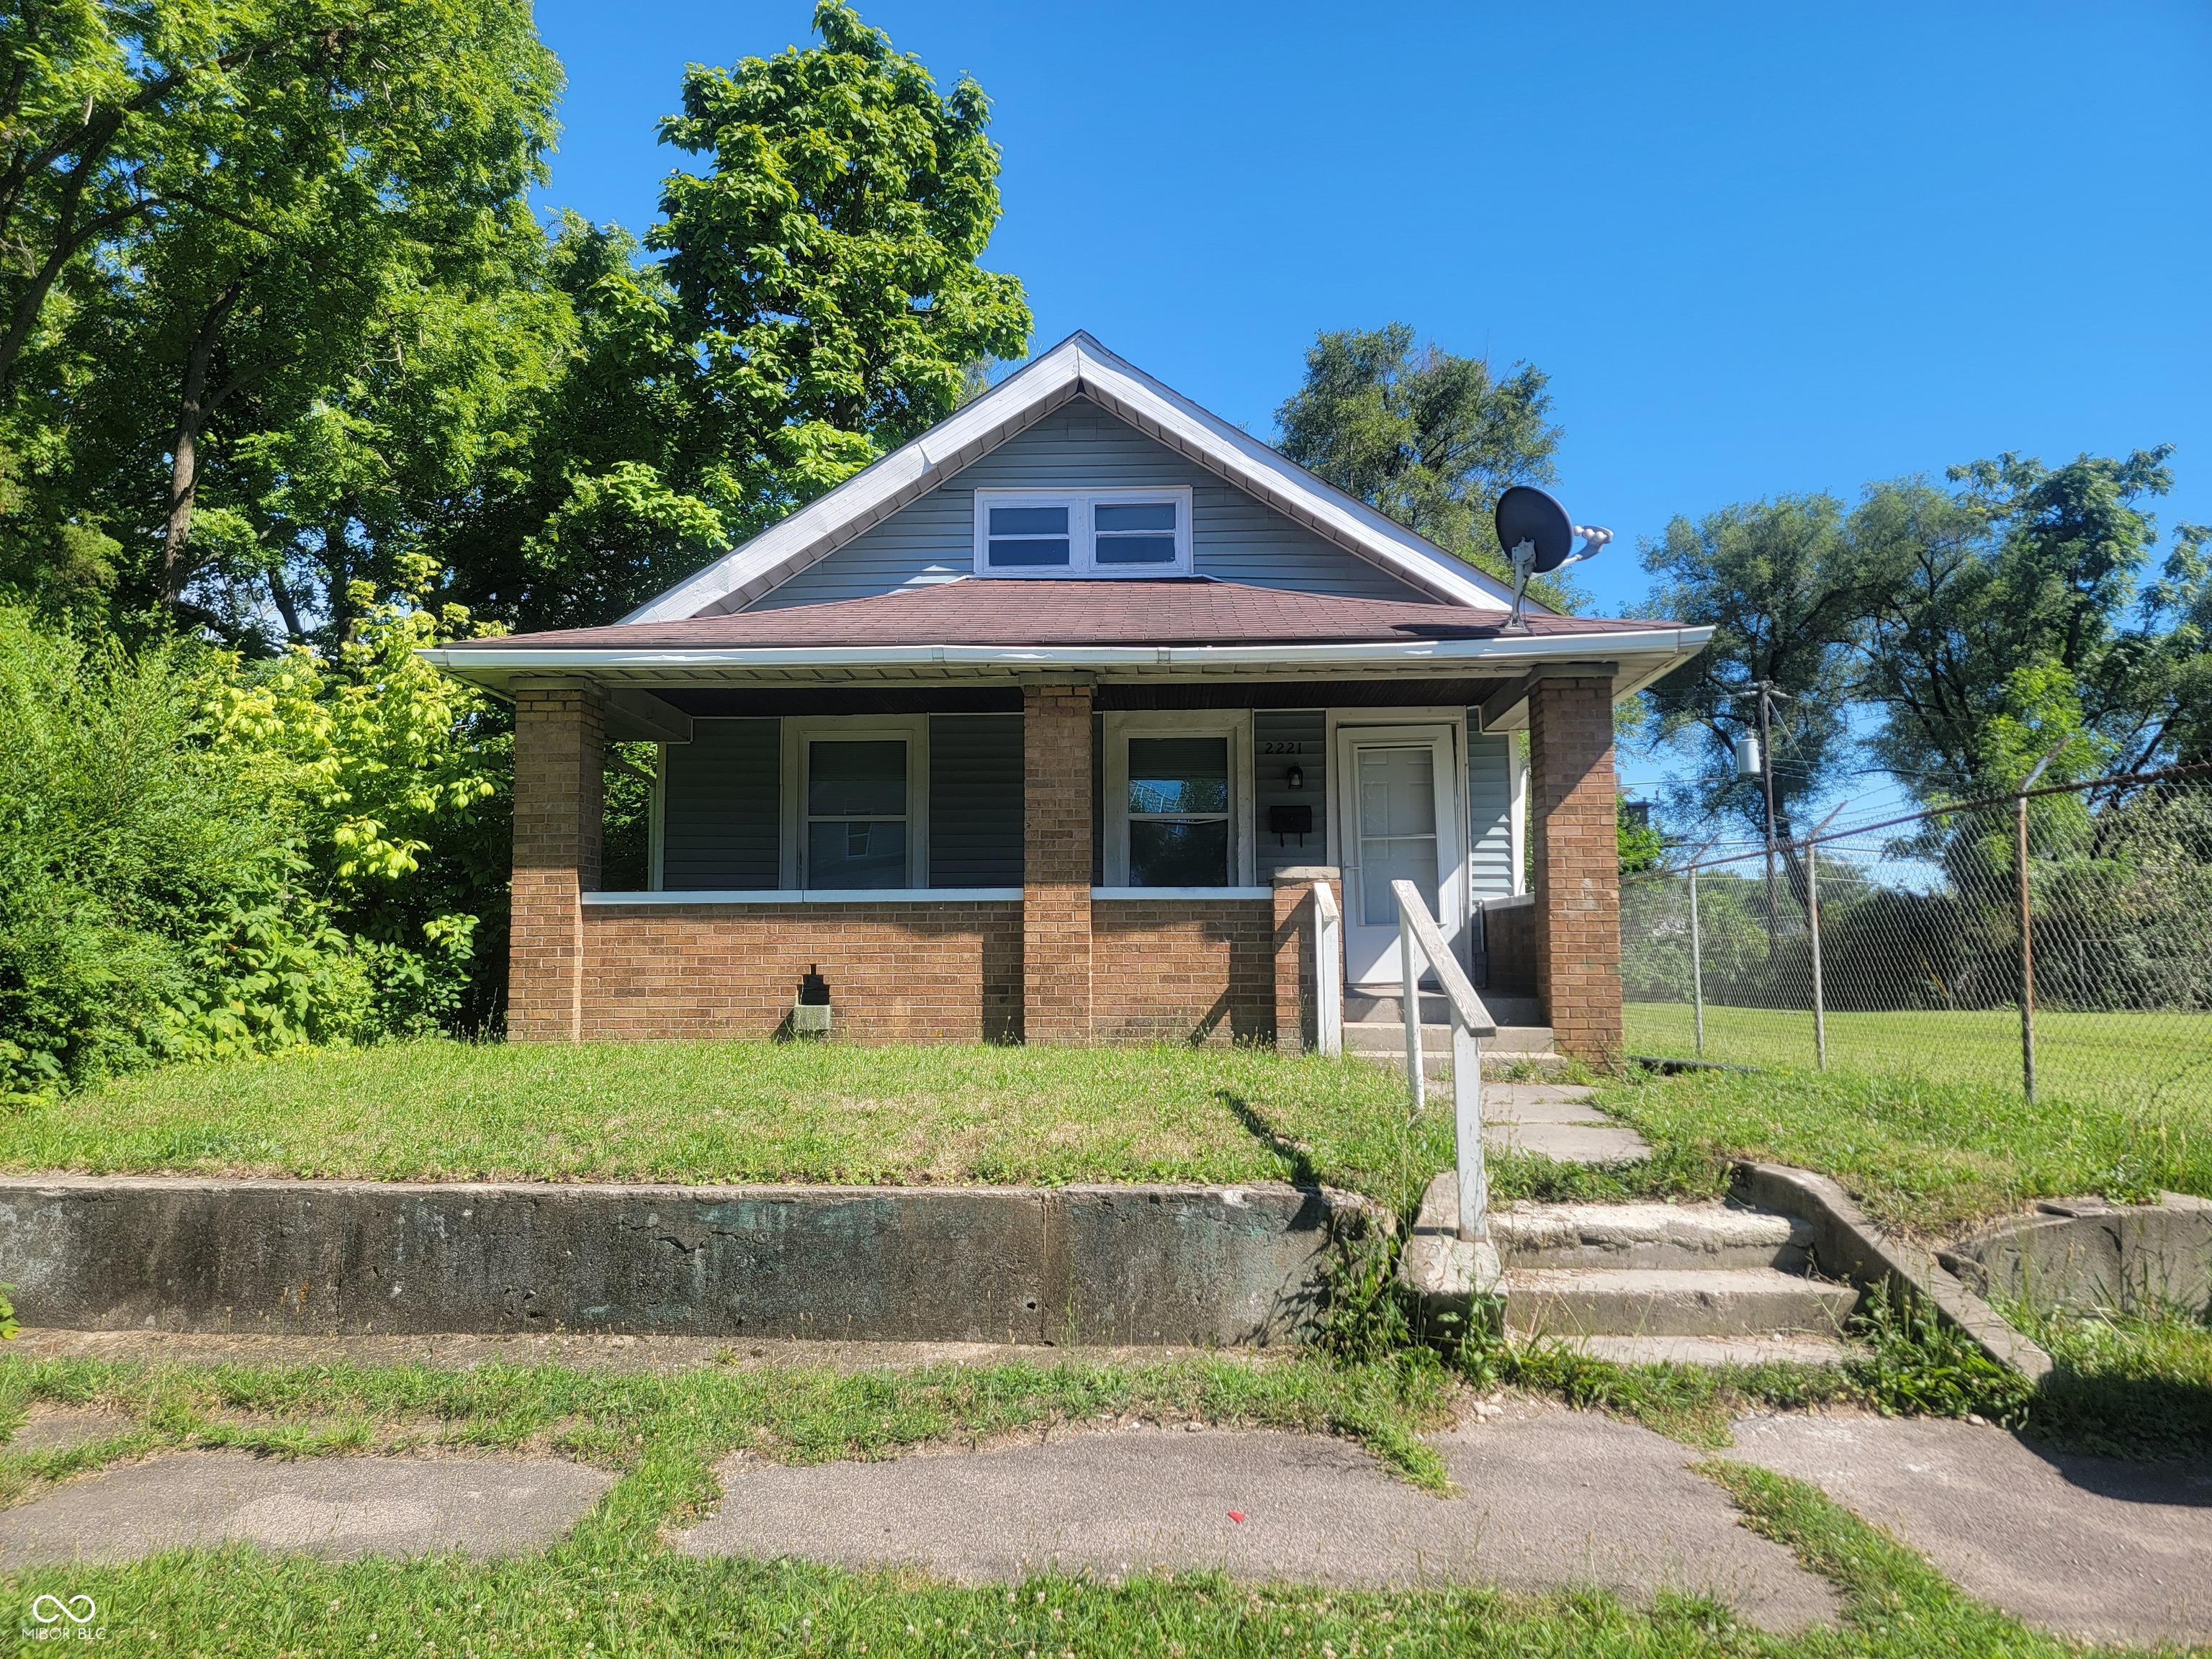
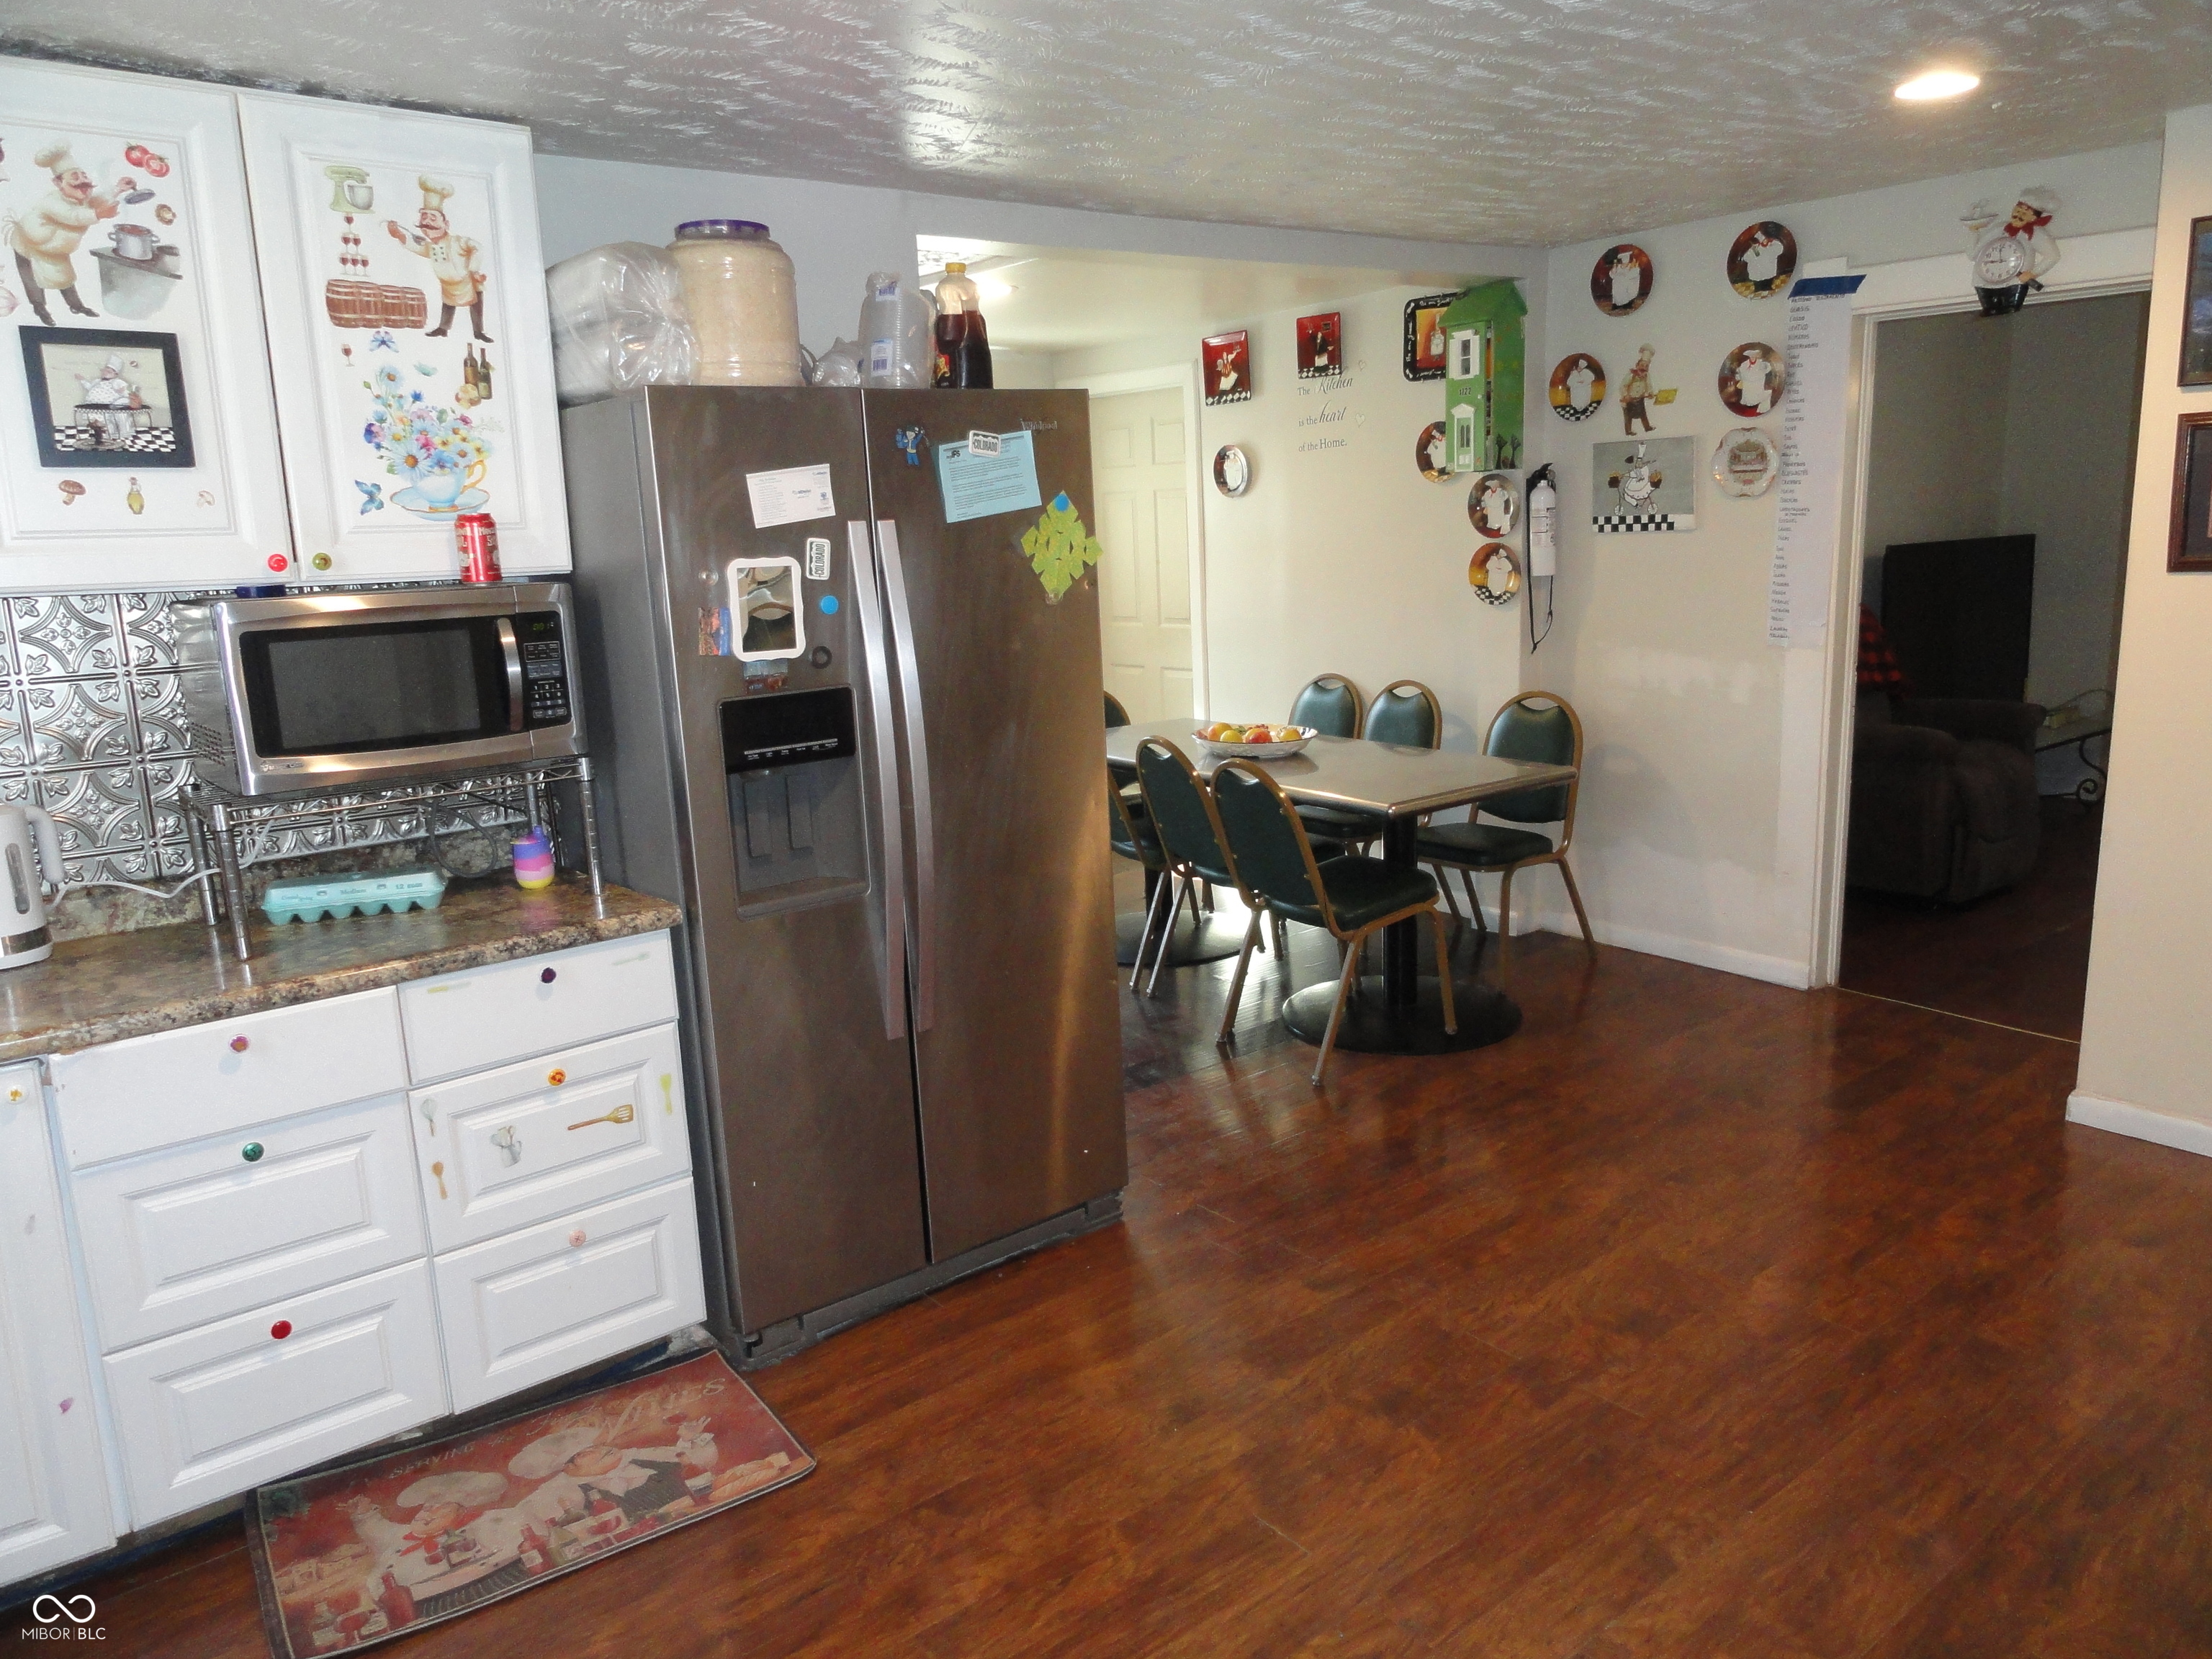
$110,000
3
bds
|
1
ba
|
836
sqft
|
built
1910
2221 Langley Ave, Indianapolis, IN 46218
$265
Cash flow
12.6%
Cash-on-Cash Return
9.0%
Cap rate
1.1%
Rent to Value Ratio
Active
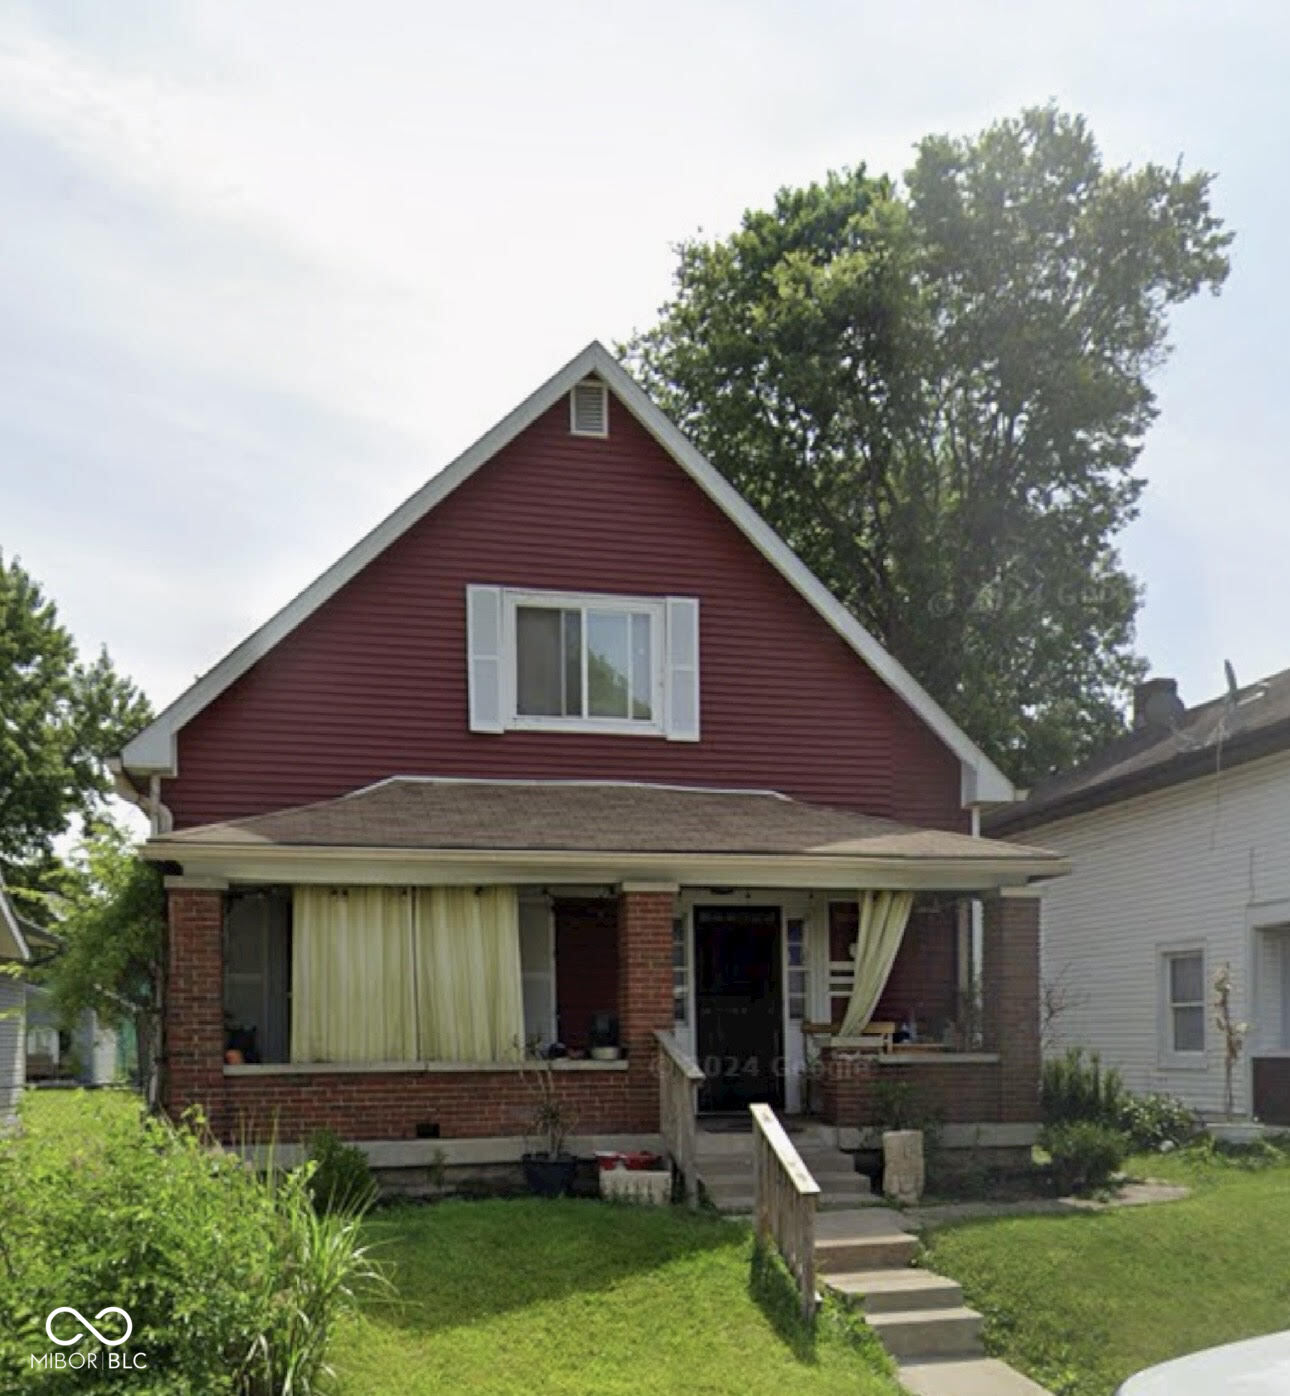
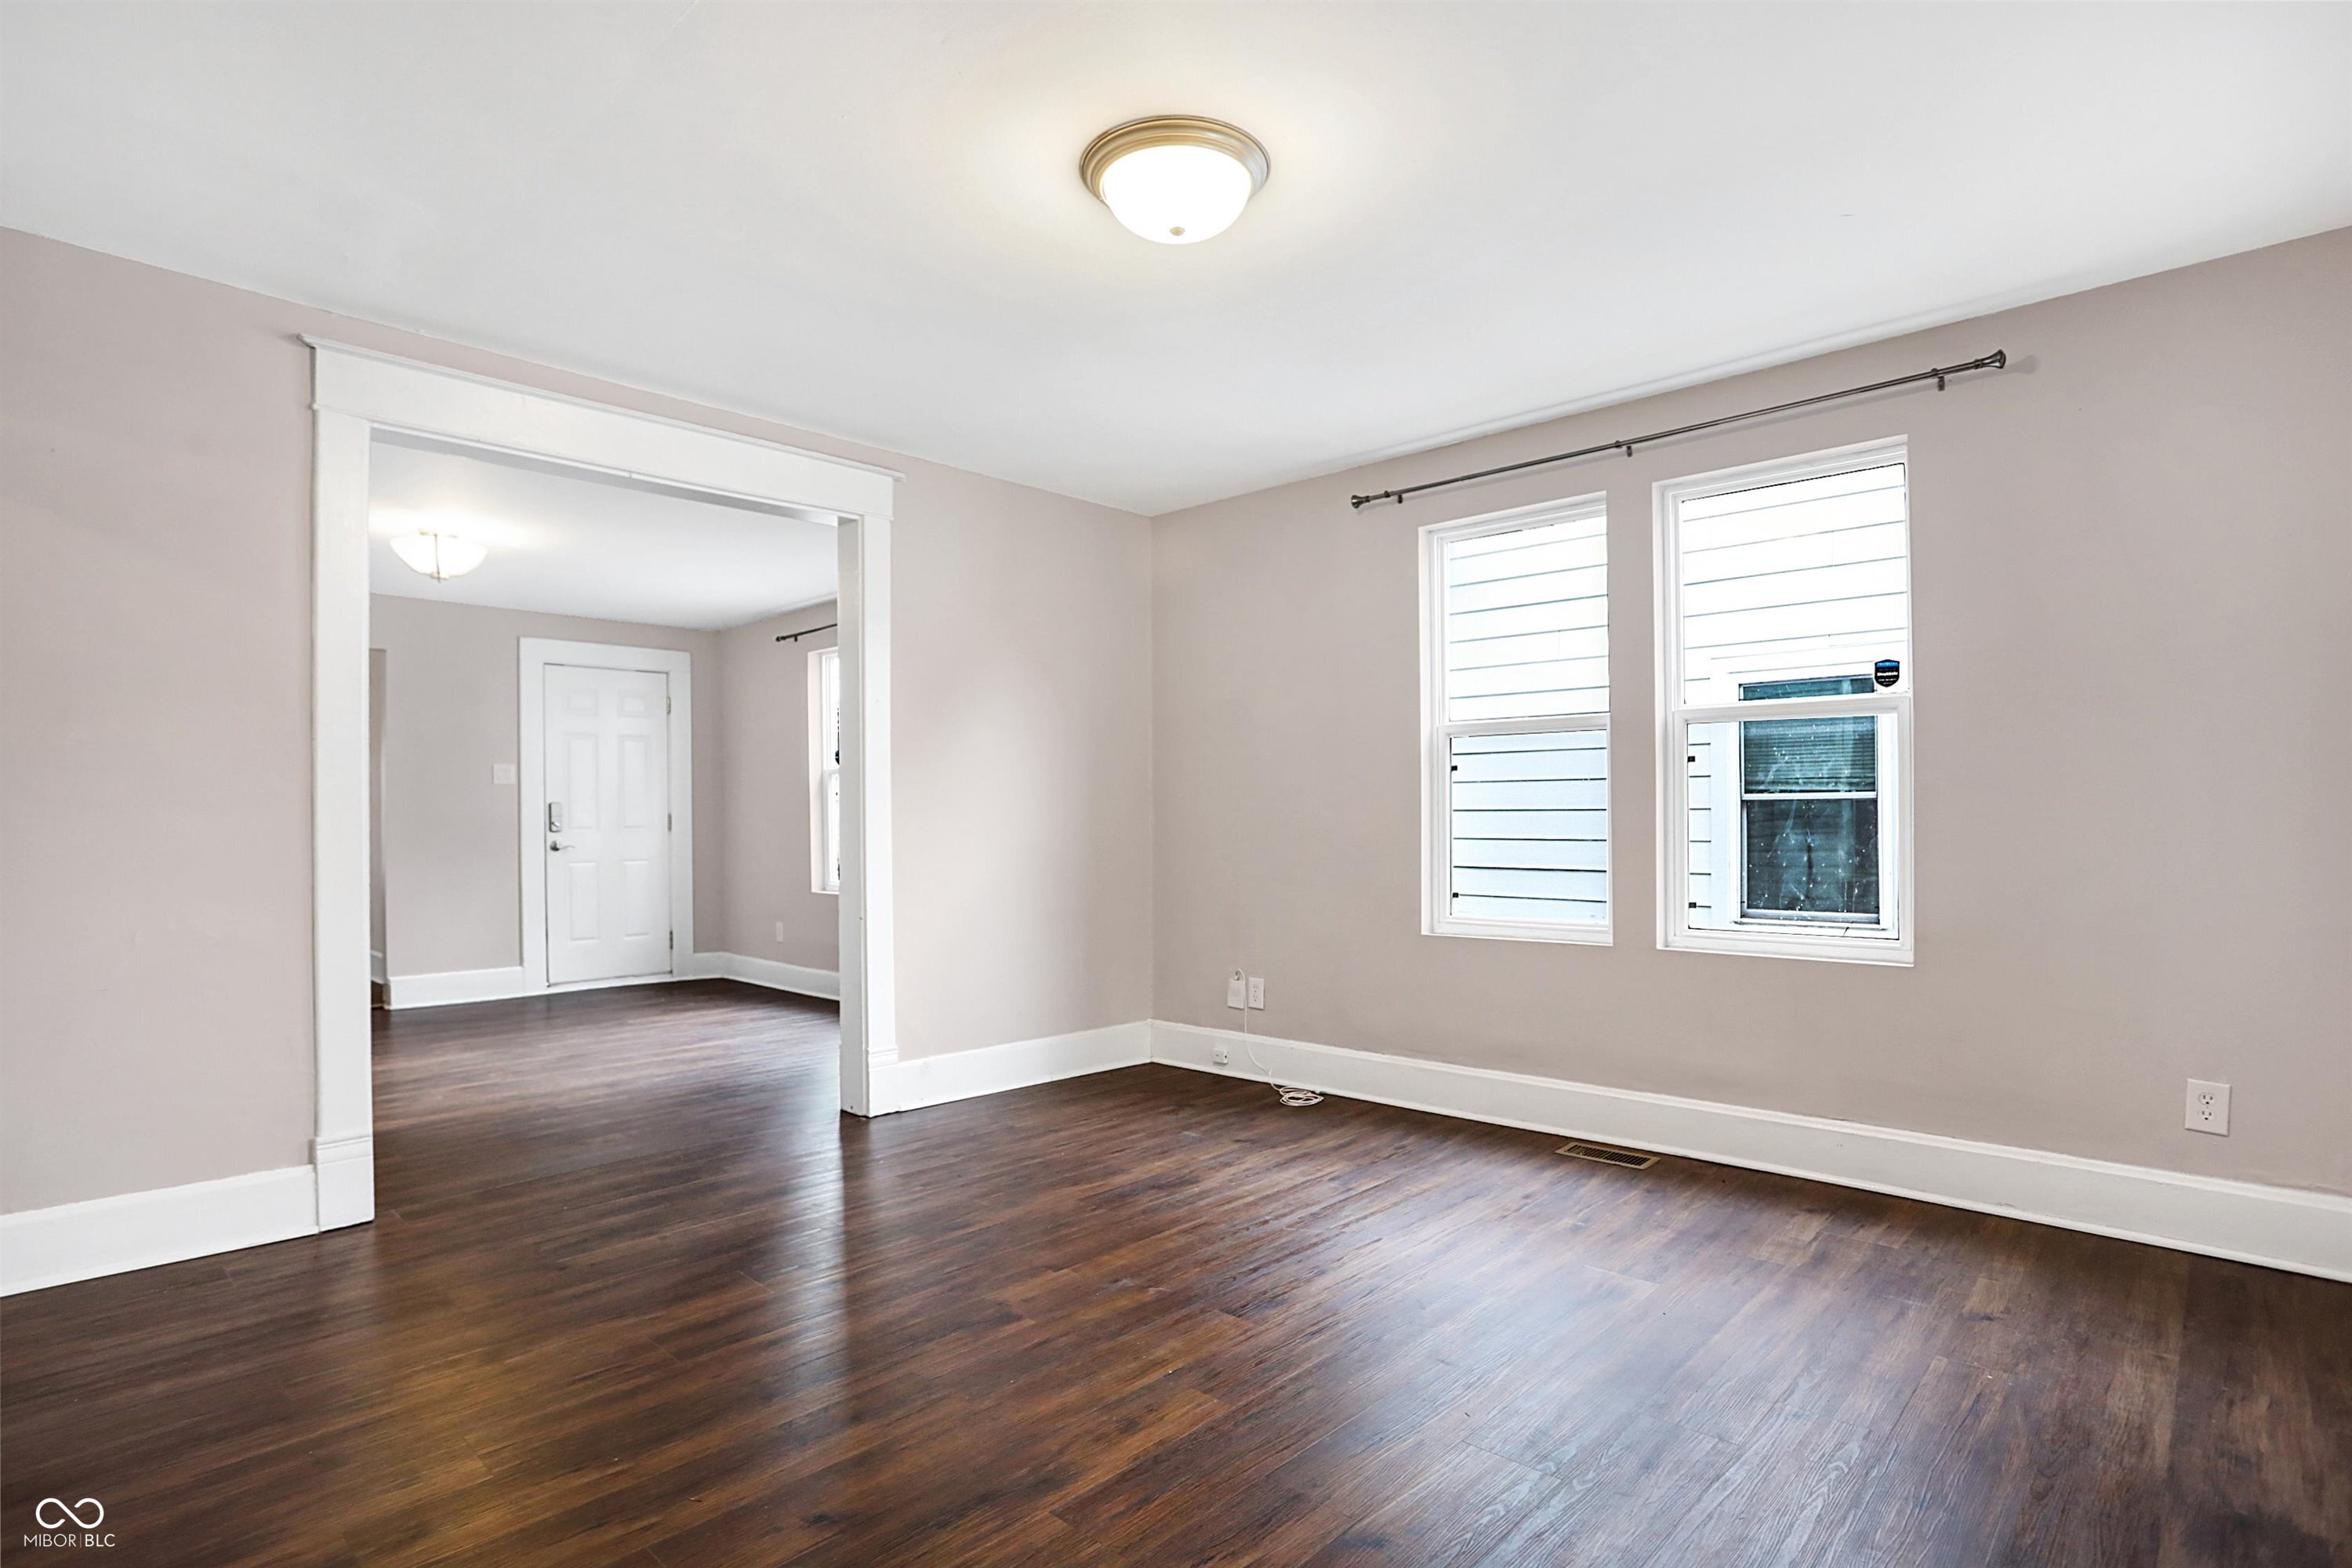
$205,000
4
bds
|
2
ba
|
1,752
sqft
|
built
1930
1722 N Parker Ave, Indianapolis, IN 46218
$54
Cash flow
1.4%
Cash-on-Cash Return
6.5%
Cap rate
0.8%
Rent to Value Ratio
1,993 out of 2,135 properties for sale in Indianapolis, IN
Limited Results Shown
Create a free account, or log in to reveal all property listings and enjoy the complete experience.
Active
$225,000
3
bds
|
2
ba
|
2,245
sqft
|
built
1910
1341 N Dearborn St, Indianapolis, IN 46201
$-256
Cash flow
-5.9%
Cash-on-Cash Return
4.8%
Cap rate
0.6%
Rent to Value Ratio
Active
$110,000
3
bds
|
1
ba
|
836
sqft
|
built
1910
2221 Langley Ave, Indianapolis, IN 46218
$265
Cash flow
12.6%
Cash-on-Cash Return
9.0%
Cap rate
1.1%
Rent to Value Ratio
Active
$260,000
2
bds
|
2
ba
|
868
sqft
|
built
2016
1337 Linden St, Indianapolis, IN 46203
$-90
Cash flow
-1.8%
Cash-on-Cash Return
5.7%
Cap rate
0.7%
Rent to Value Ratio
Active
$256,750
3
bds
|
2
ba
|
1,368
sqft
|
built
2016
914 Baden Manor Dr, Indianapolis, IN 46217
$-172
Cash flow
-3.5%
Cash-on-Cash Return
5.3%
Cap rate
0.7%
Rent to Value Ratio
Active
$240,000
3
bds
|
2
ba
|
1,260
sqft
|
built
1962
1116 Heatherwood Dr, Indianapolis, IN 46241
$-125
Cash flow
-2.7%
Cash-on-Cash Return
5.5%
Cap rate
0.7%
Rent to Value Ratio
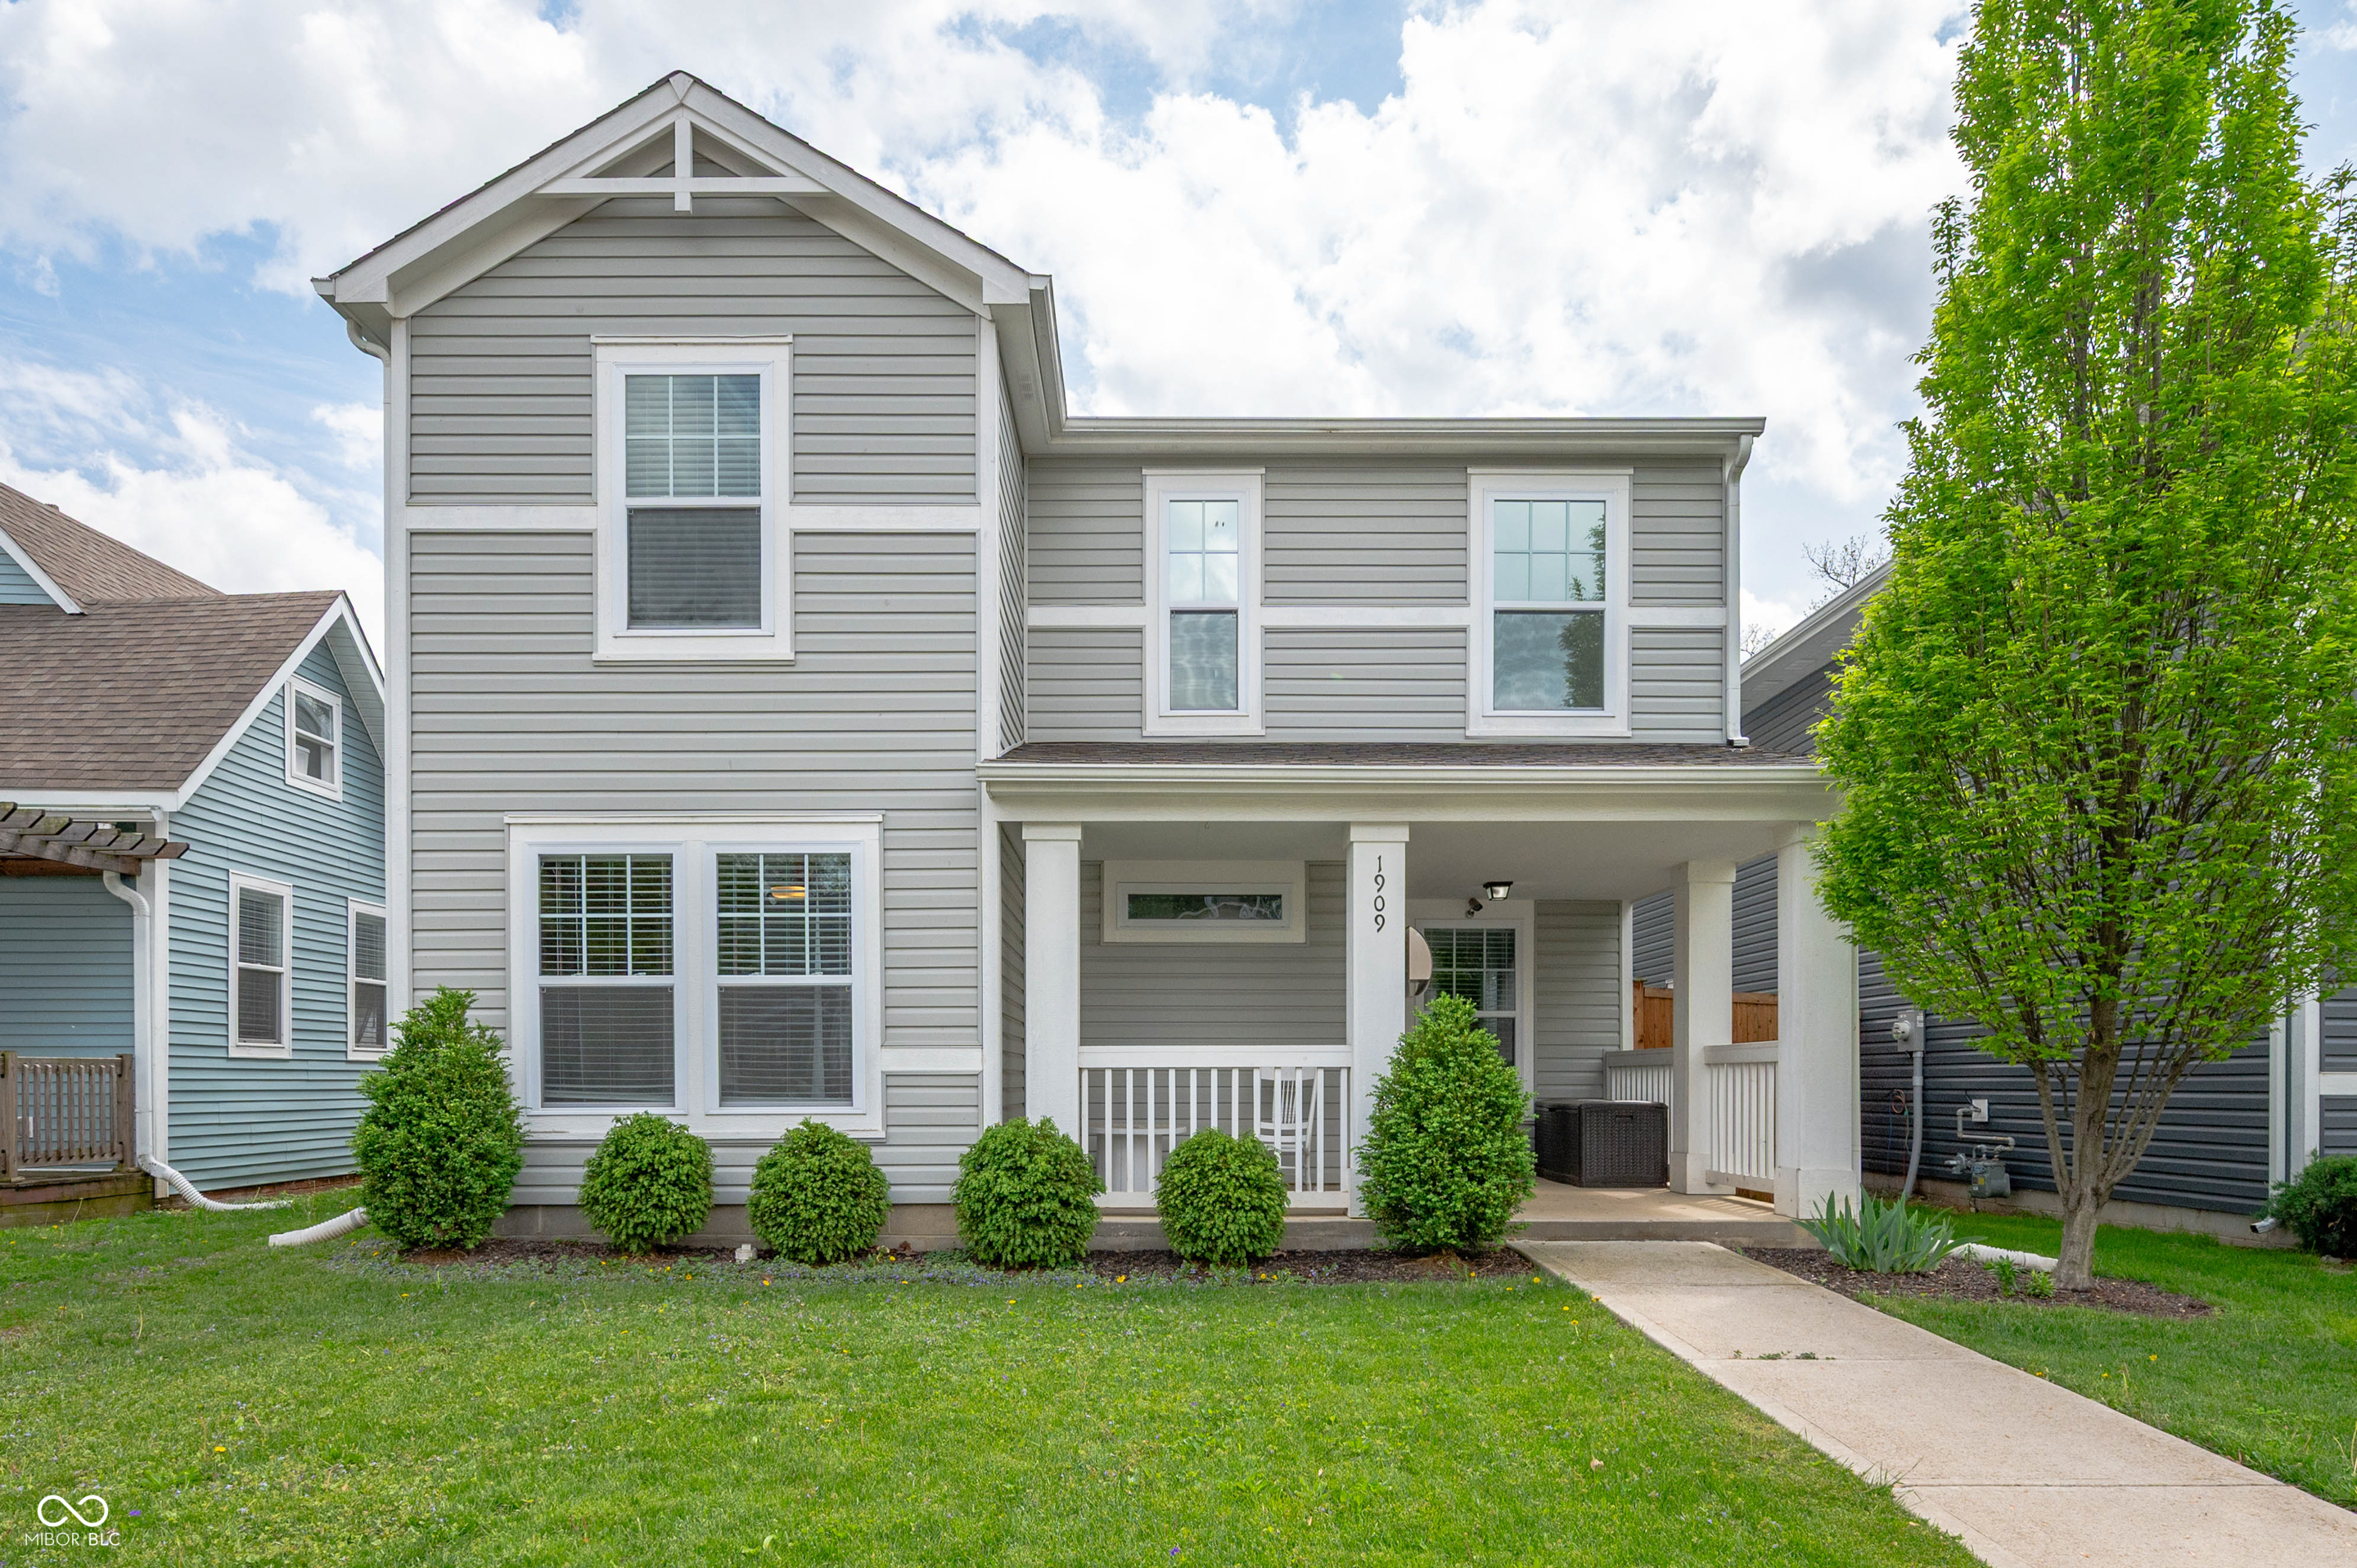
Active
$375,000
4
bds
|
3
ba
|
2,589
sqft
|
built
2018
1909 Orange St, Indianapolis, IN 46203
$-58
Cash flow
-0.8%
Cash-on-Cash Return
6.0%
Cap rate
0.7%
Rent to Value Ratio
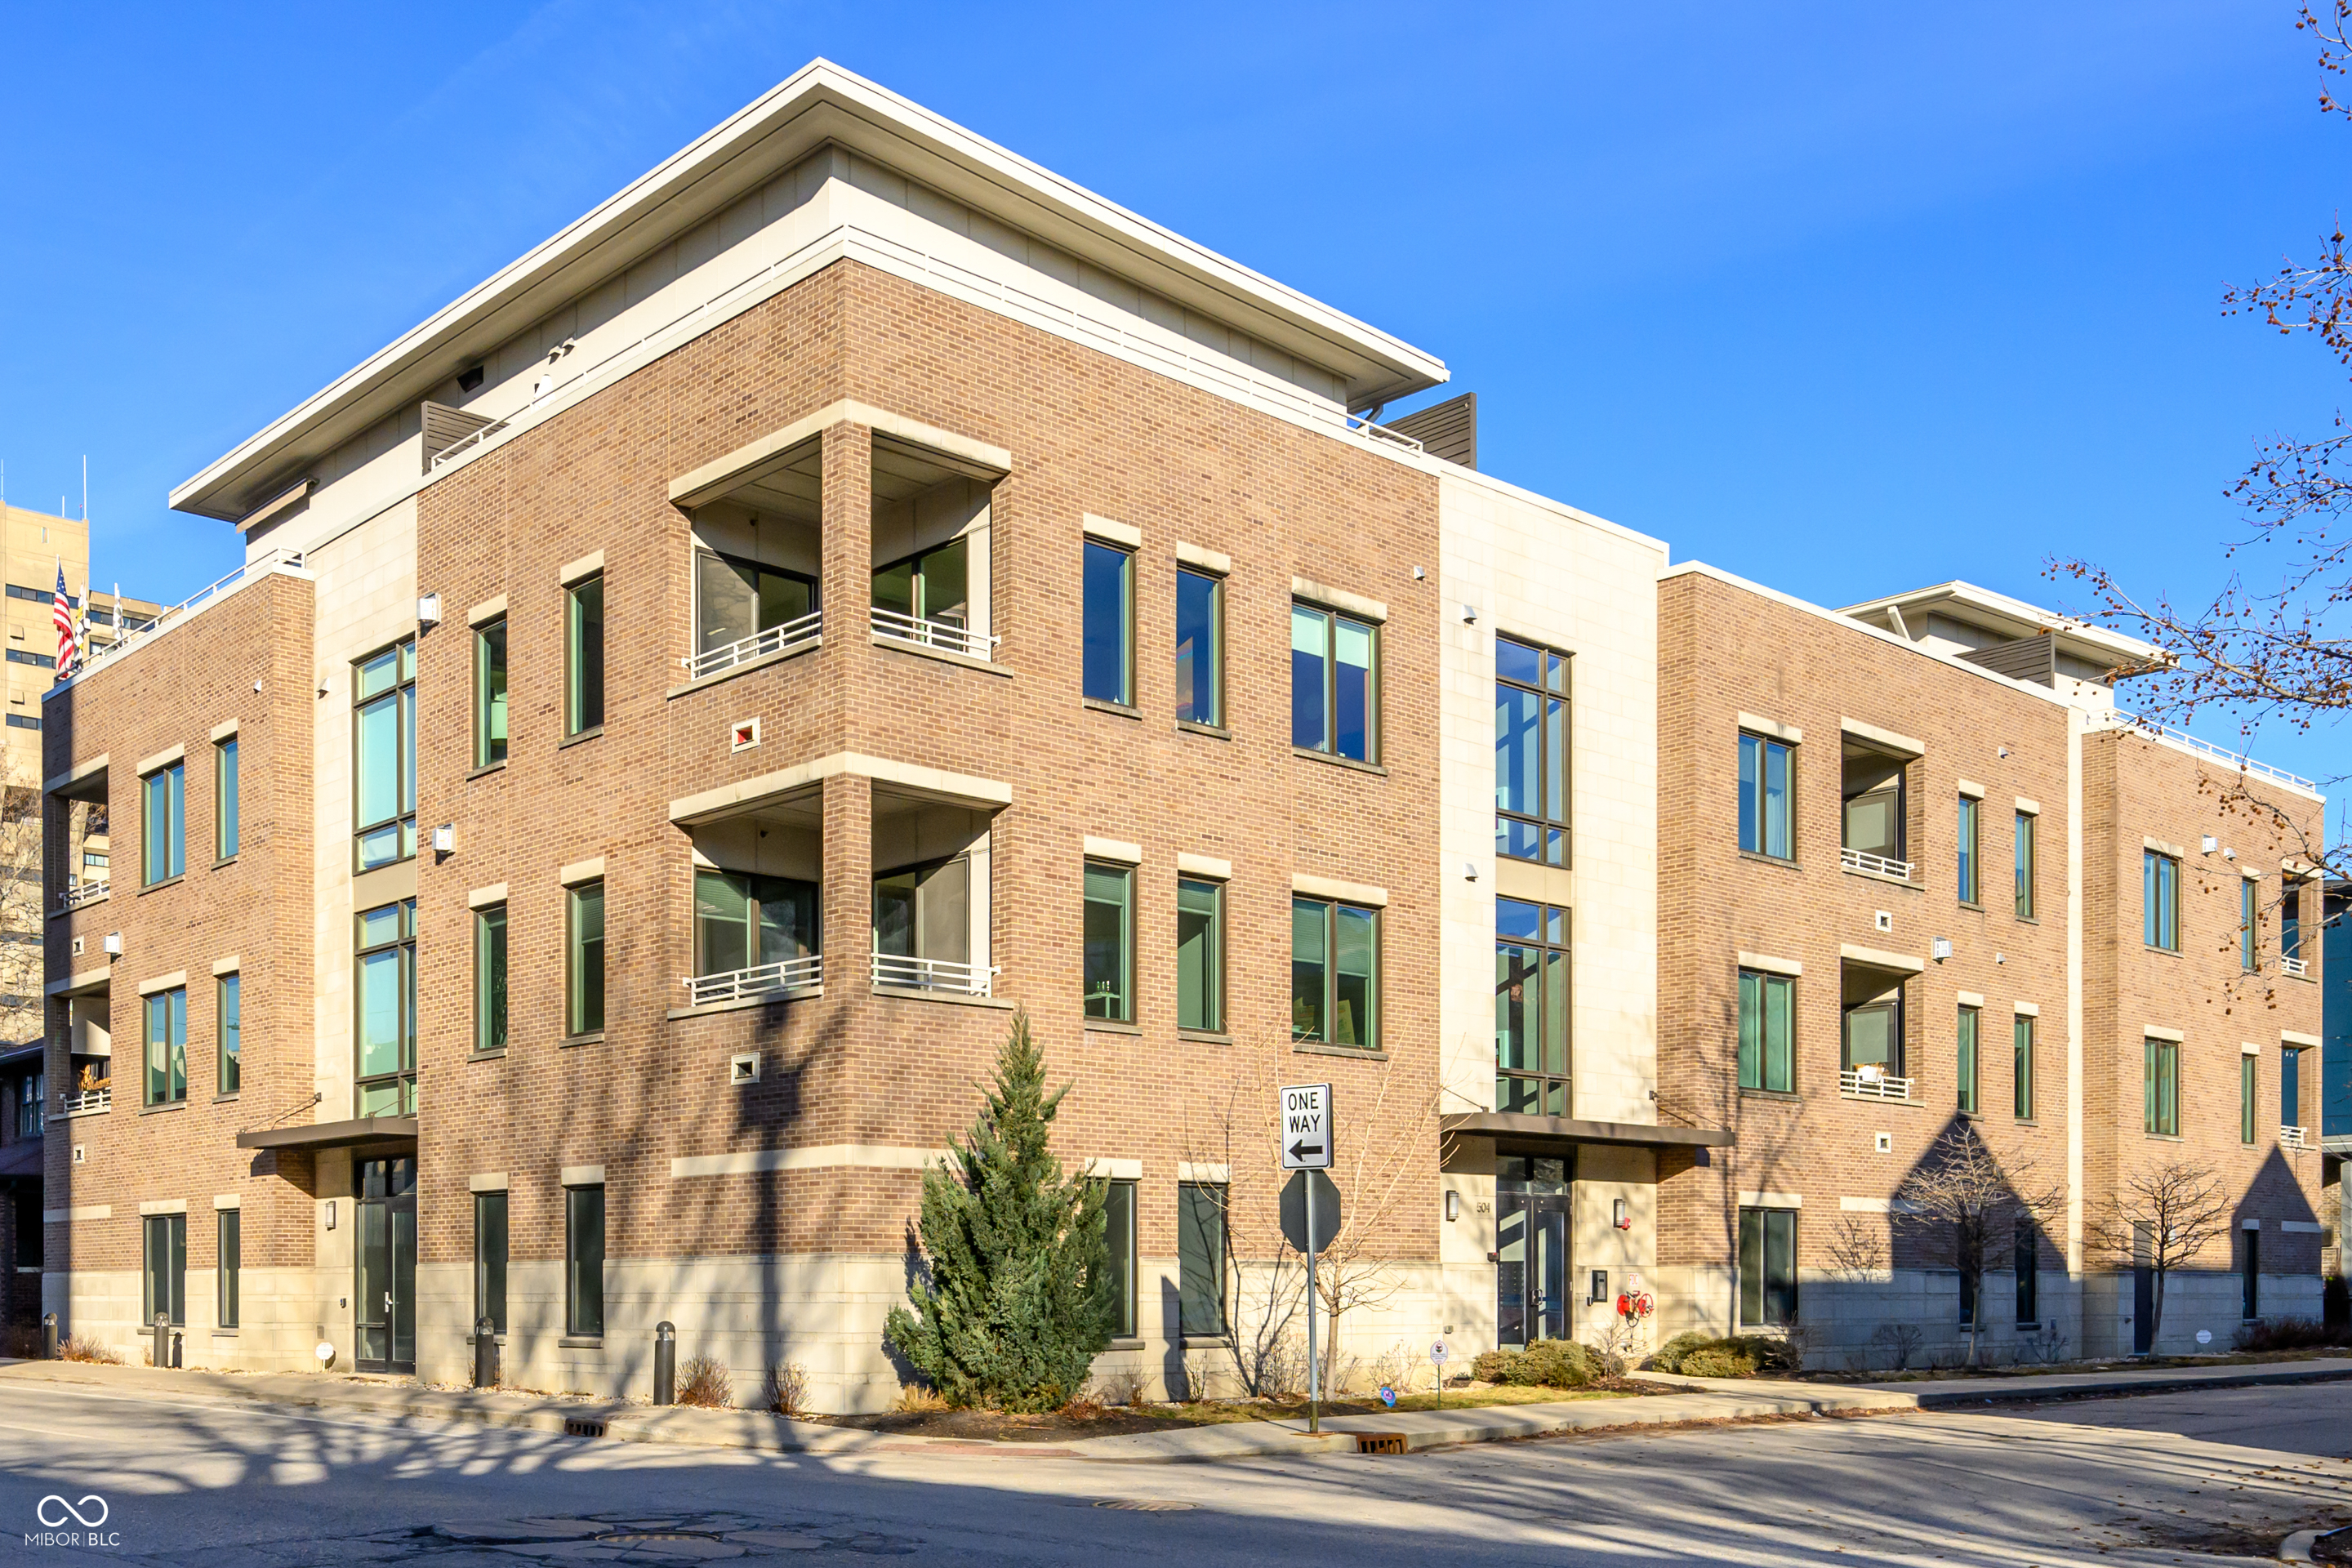
Pending
$424,900
2
bds
|
2
ba
|
1,244
sqft
|
built
2016
504 N Park Ave, Indianapolis, IN 46202
$-338
Cash flow
-4.2%
Cash-on-Cash Return
5.2%
Cap rate
0.7%
Rent to Value Ratio
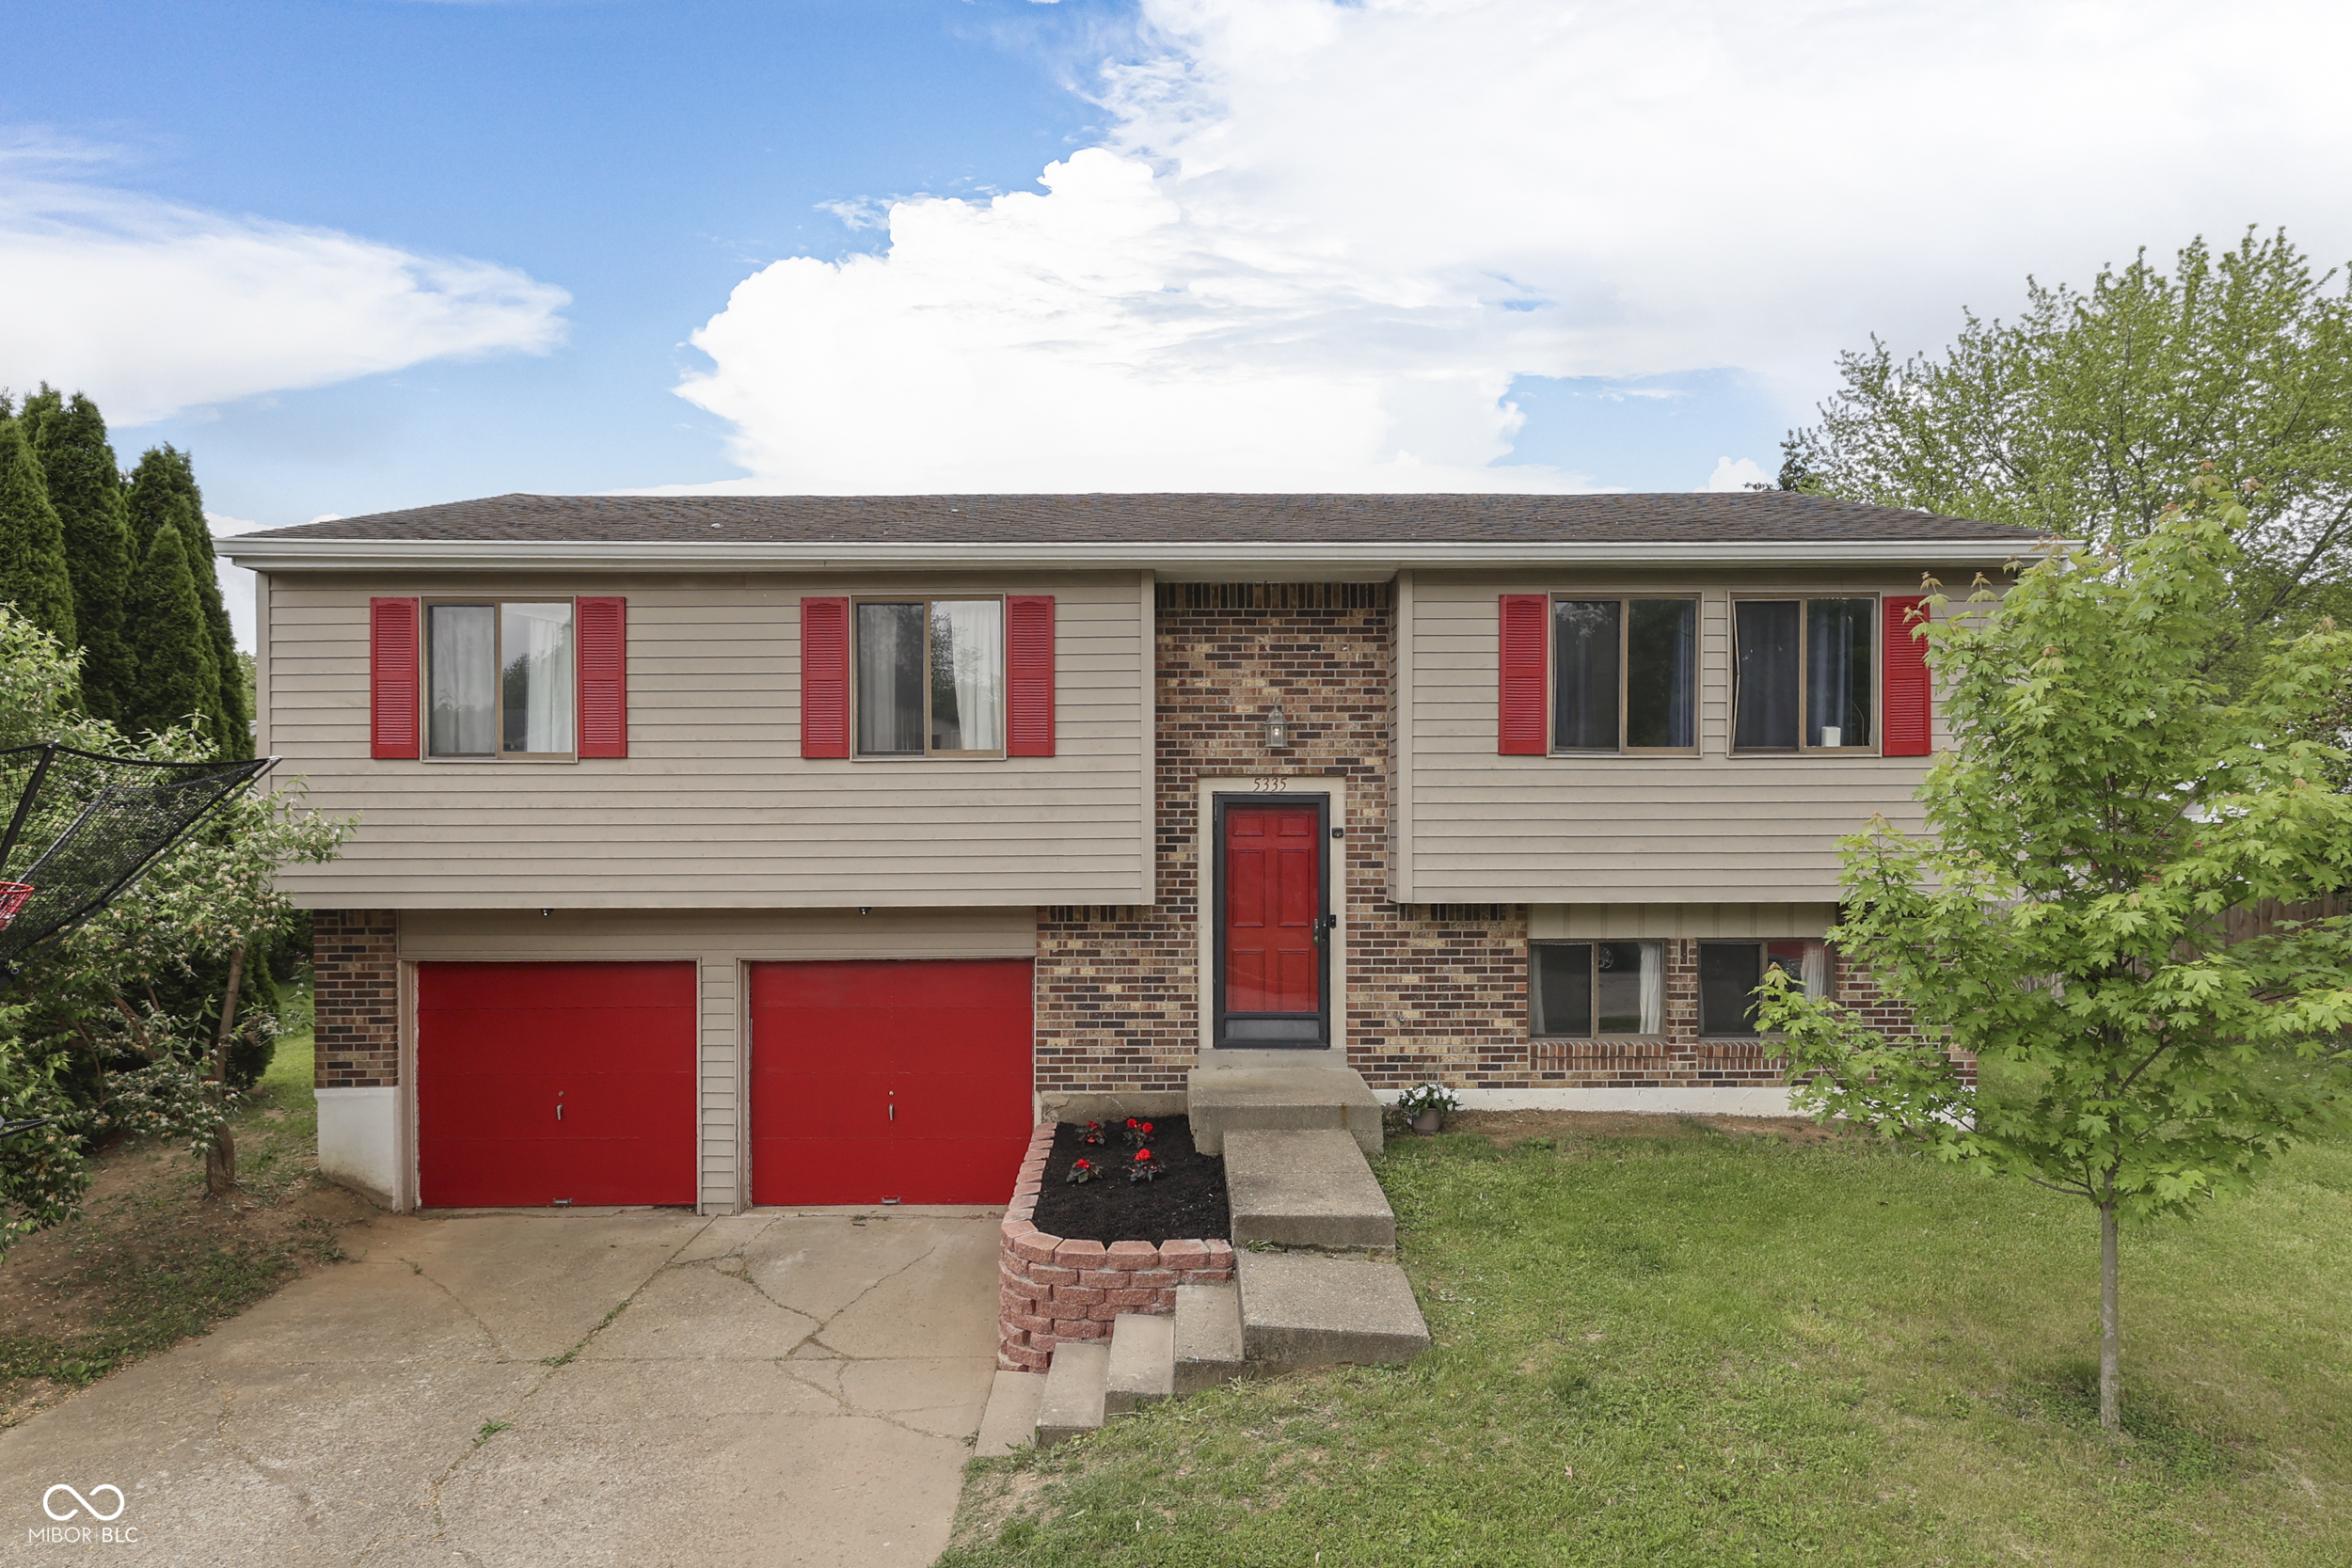
Pending
$239,900
3
bds
|
3
ba
|
1,682
sqft
|
built
1976
5335 Honey Comb Ln, Indianapolis, IN 46221
$13
Cash flow
0.3%
Cash-on-Cash Return
6.2%
Cap rate
0.8%
Rent to Value Ratio
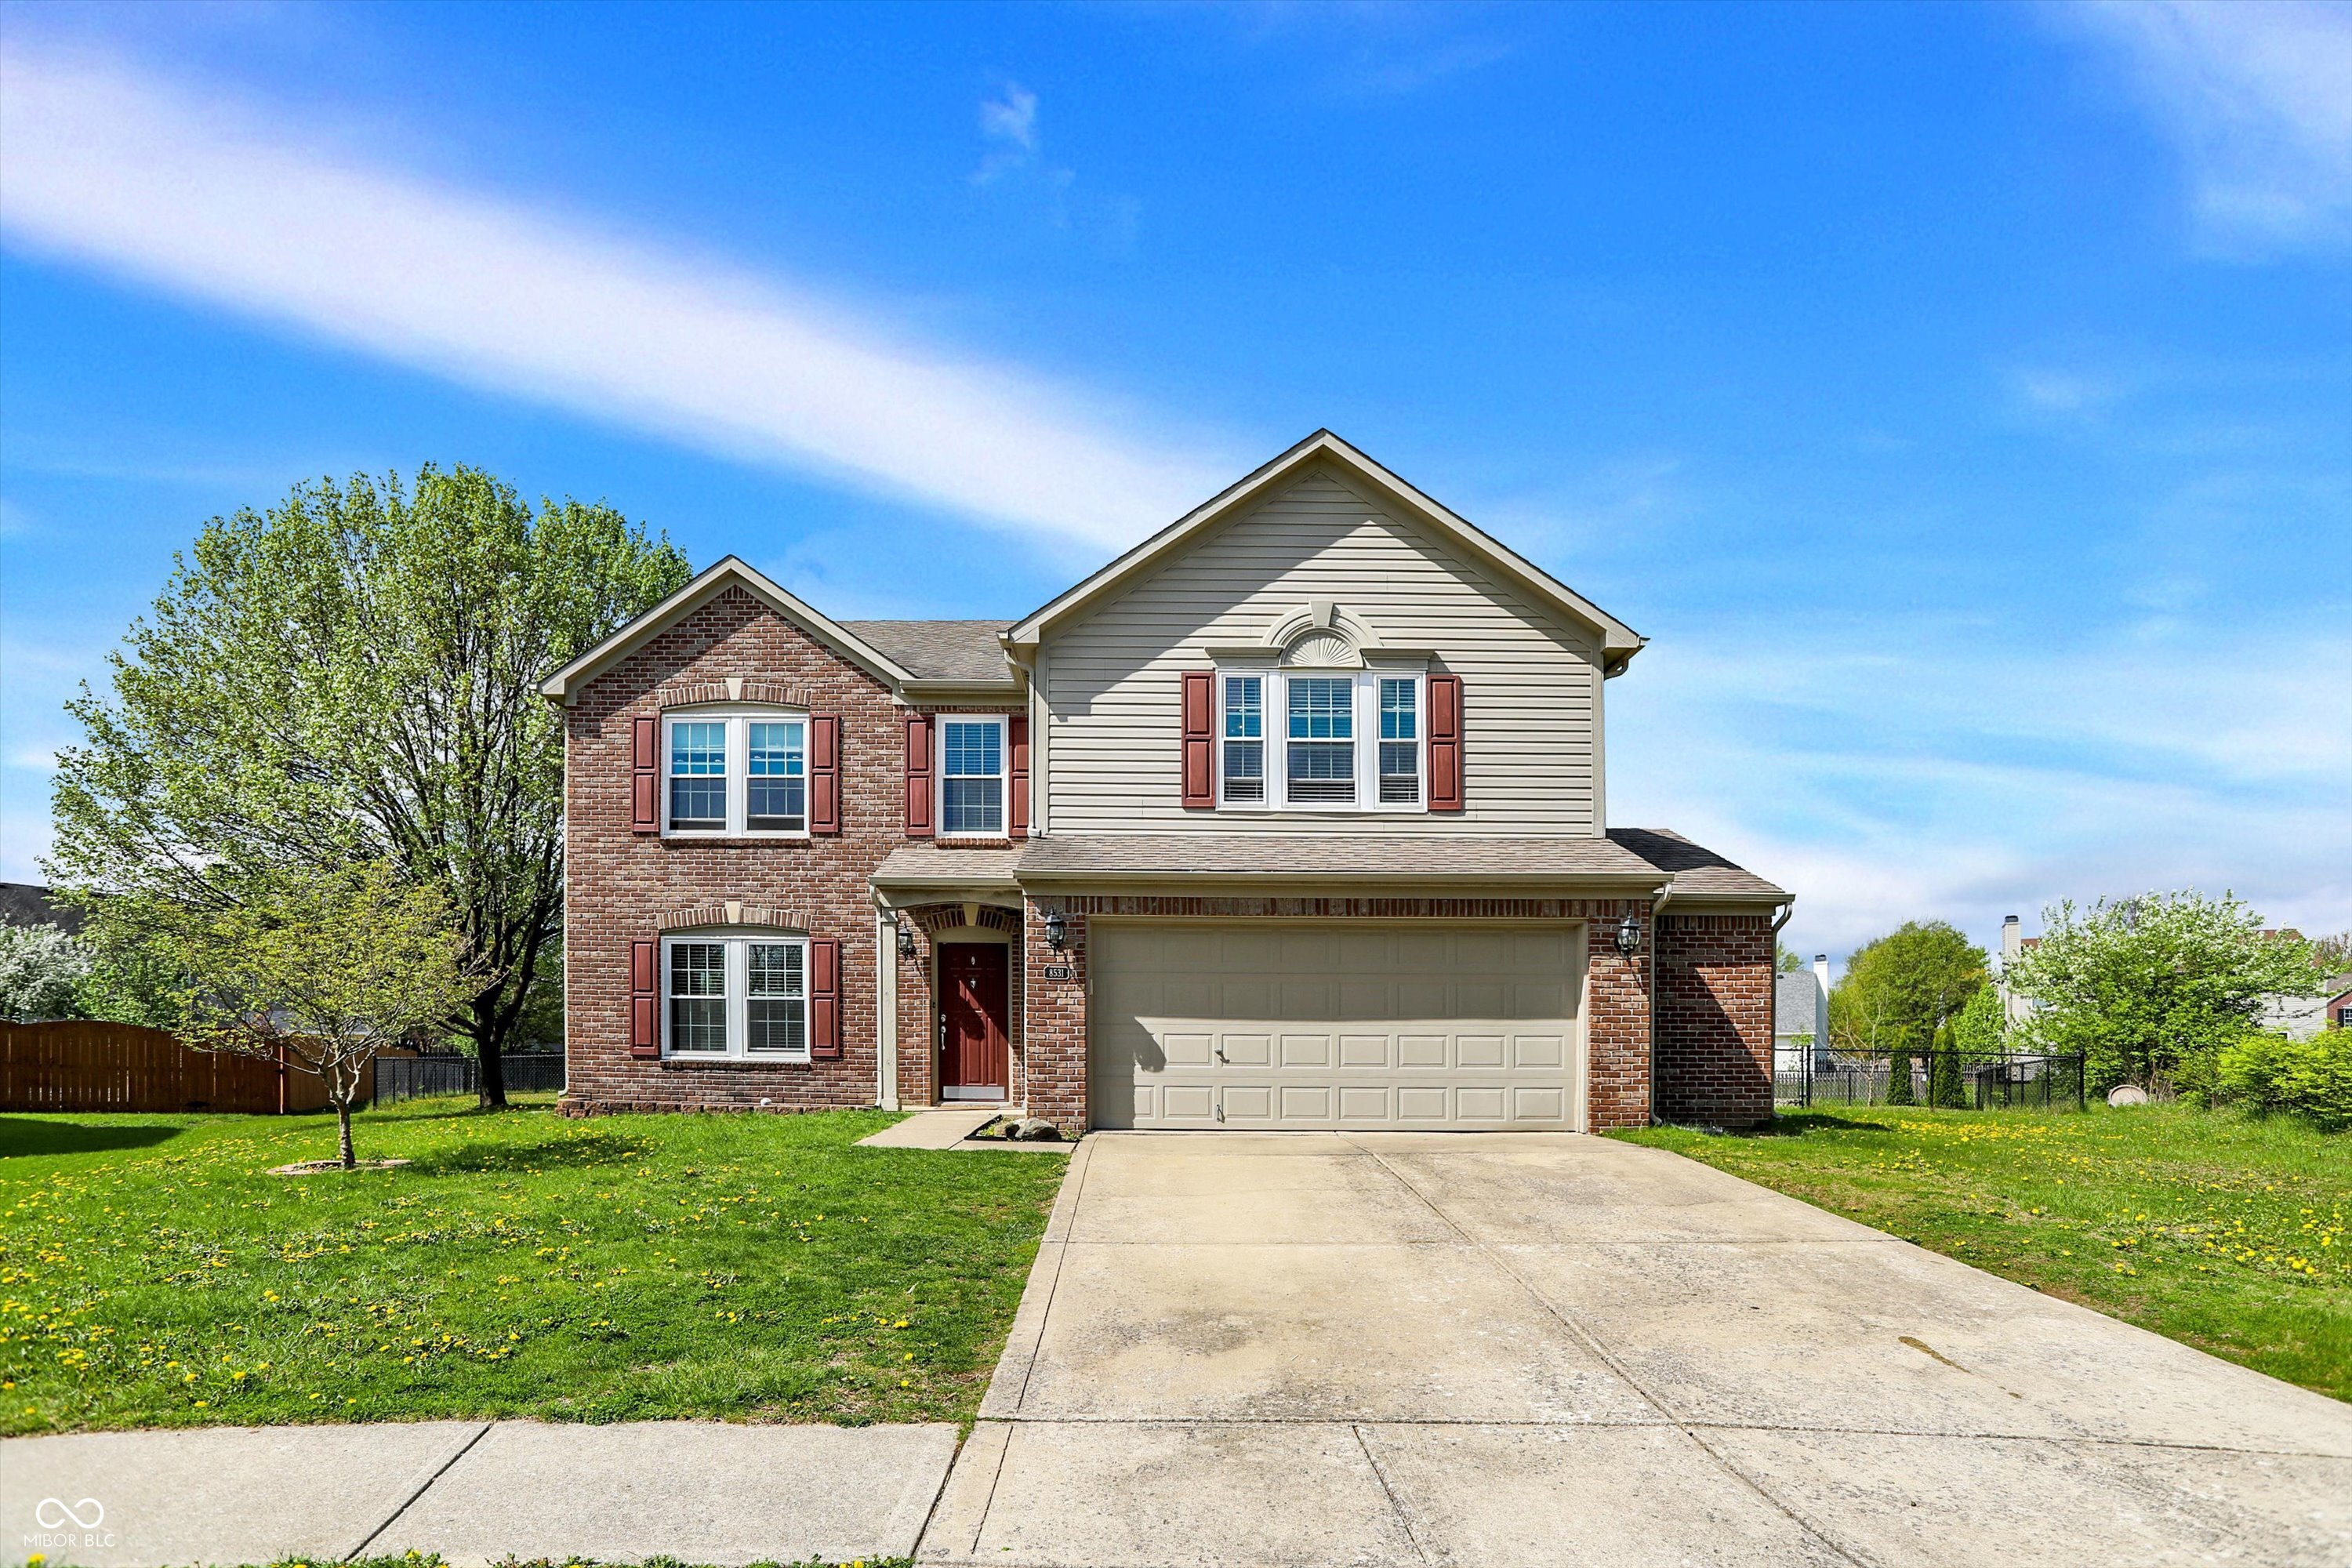
Active
$385,000
4
bds
|
3
ba
|
2,980
sqft
|
built
2004
8531 Aberdeenshire Ct, Indianapolis, IN 46259
$-70
Cash flow
-0.9%
Cash-on-Cash Return
5.9%
Cap rate
0.7%
Rent to Value Ratio
Active
$119,900
2
bds
|
2
ba
|
1,274
sqft
|
built
1970
5525 Roxbury Ter, Indianapolis, IN 46226
$-274
Cash flow
-11.9%
Cash-on-Cash Return
3.4%
Cap rate
1.2%
Rent to Value Ratio
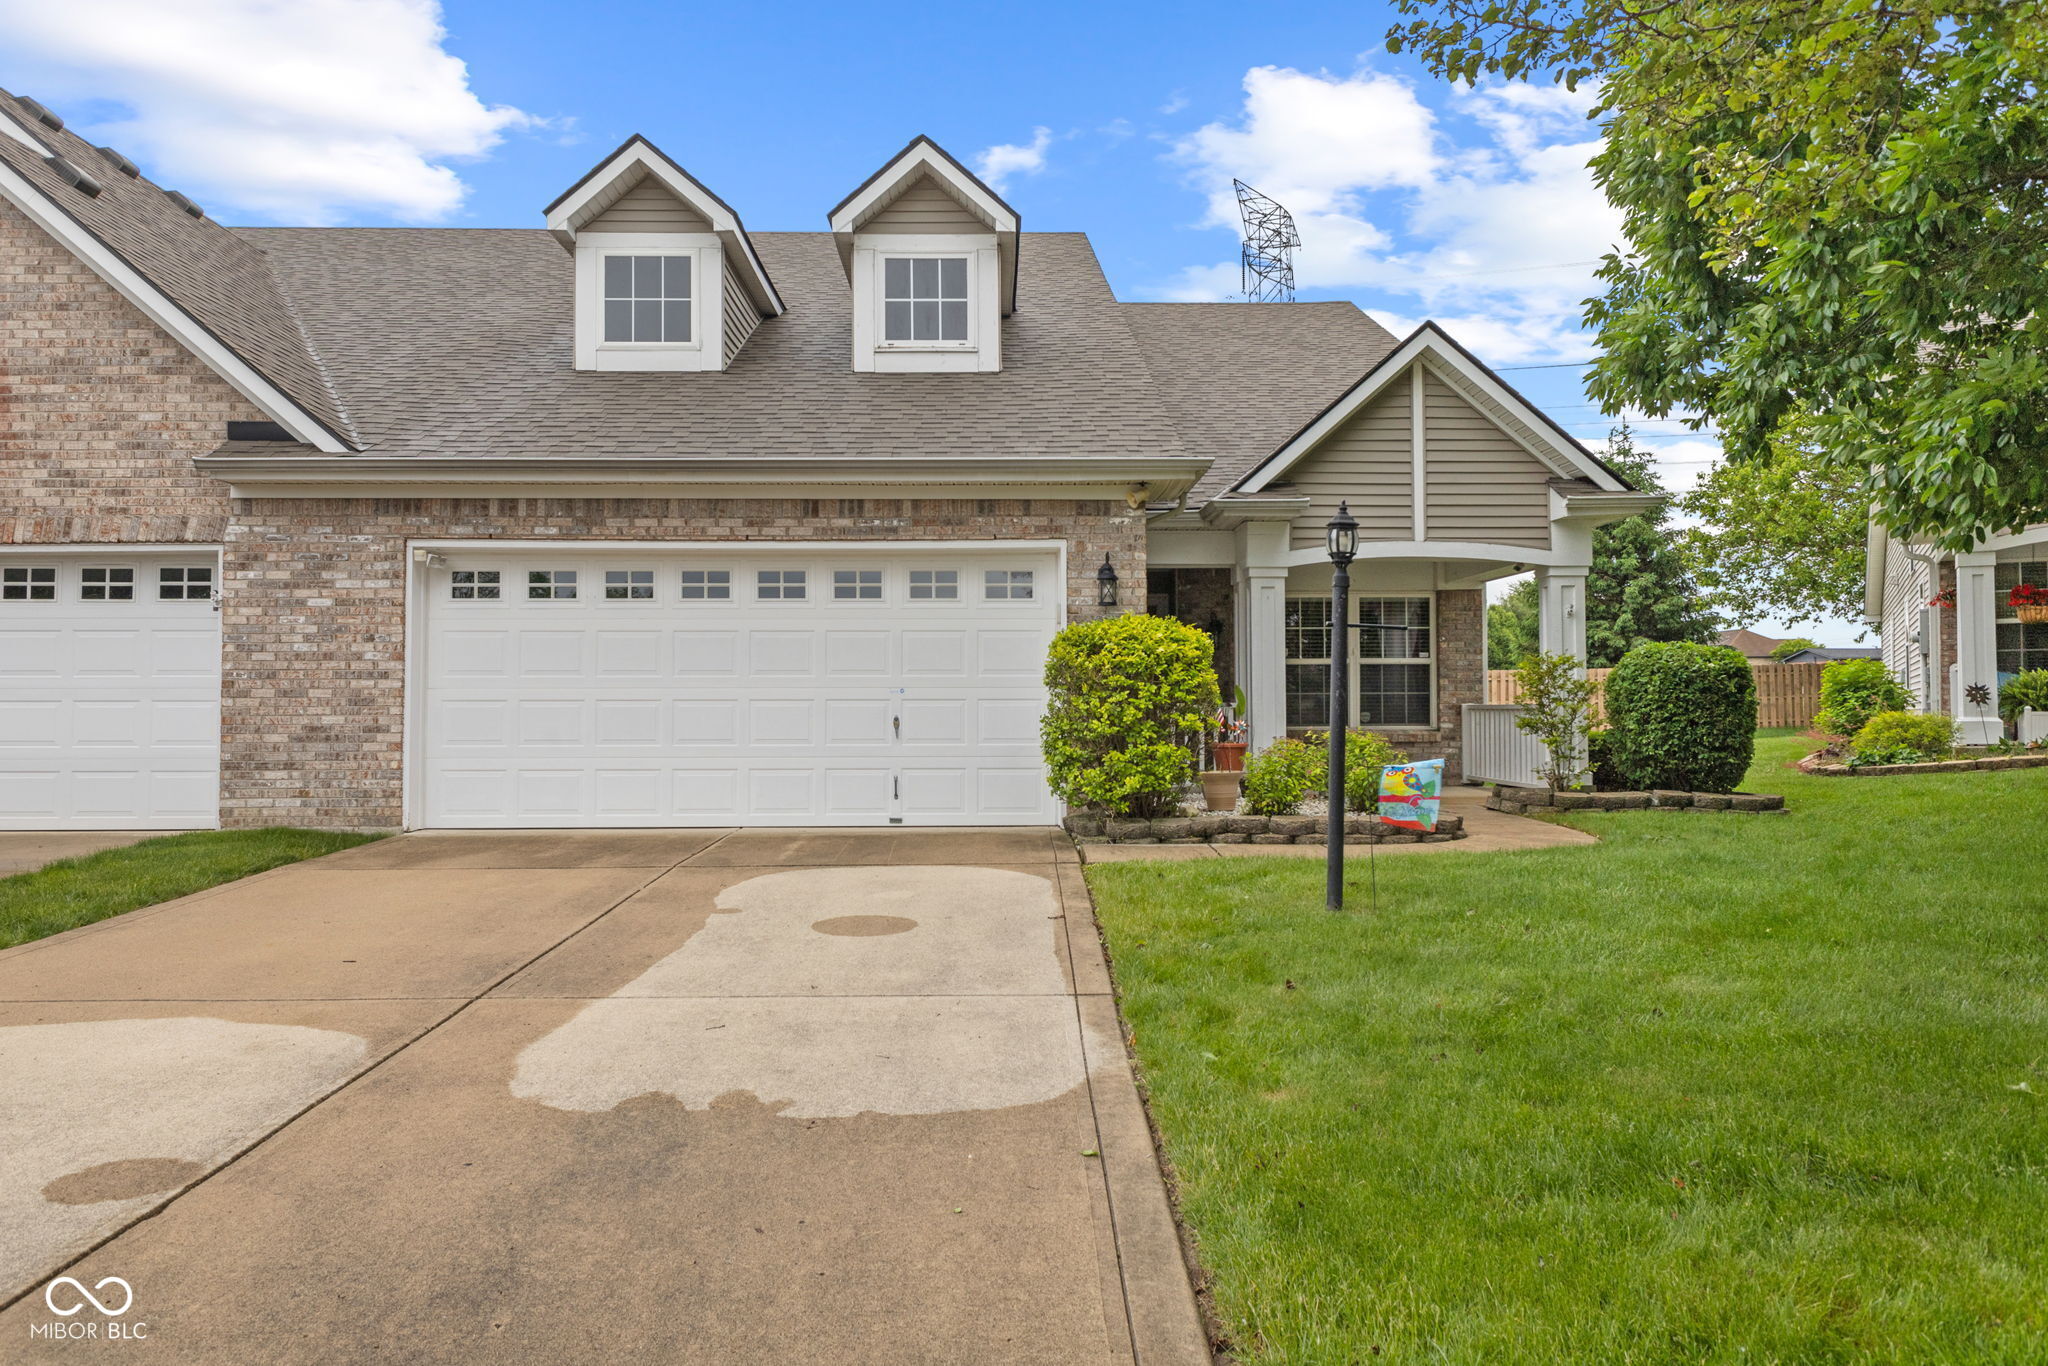
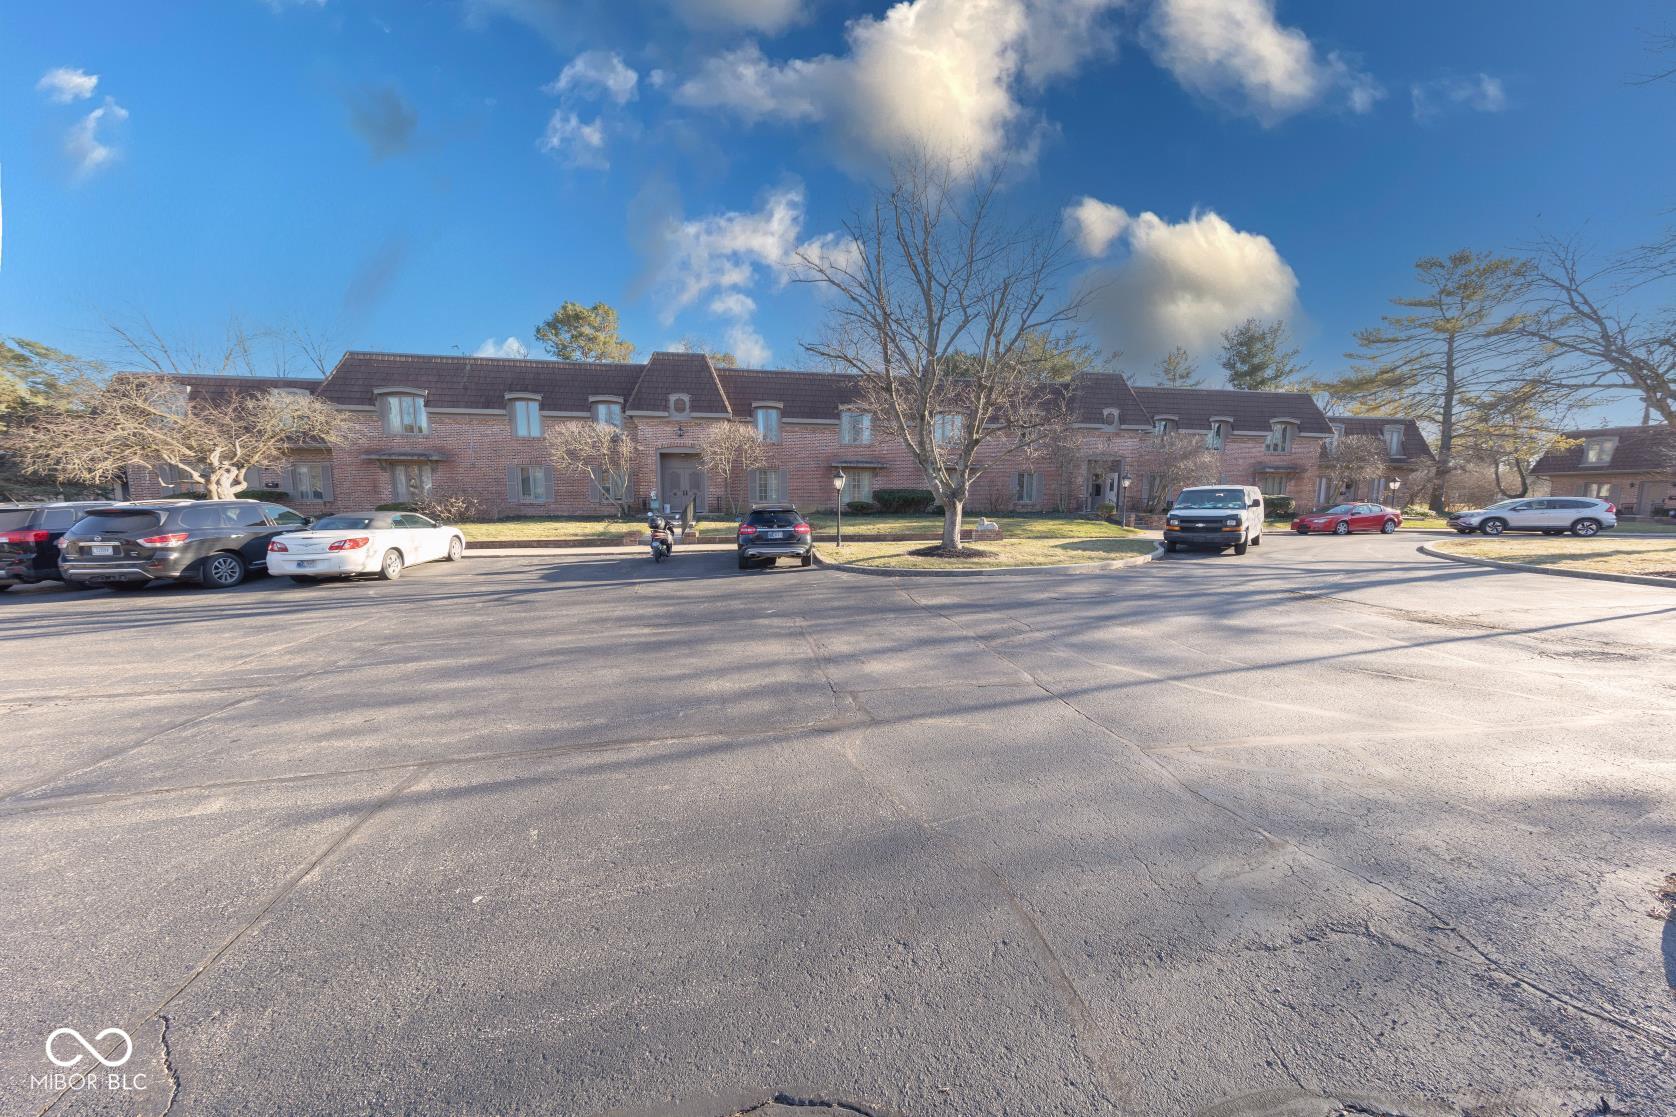
Active
$265,000
3
bds
|
2
ba
|
2,216
sqft
|
built
2004
4907 Franklin Villas Pl, Indianapolis, IN 46237
$-146
Cash flow
-2.9%
Cash-on-Cash Return
5.5%
Cap rate
0.7%
Rent to Value Ratio
Active
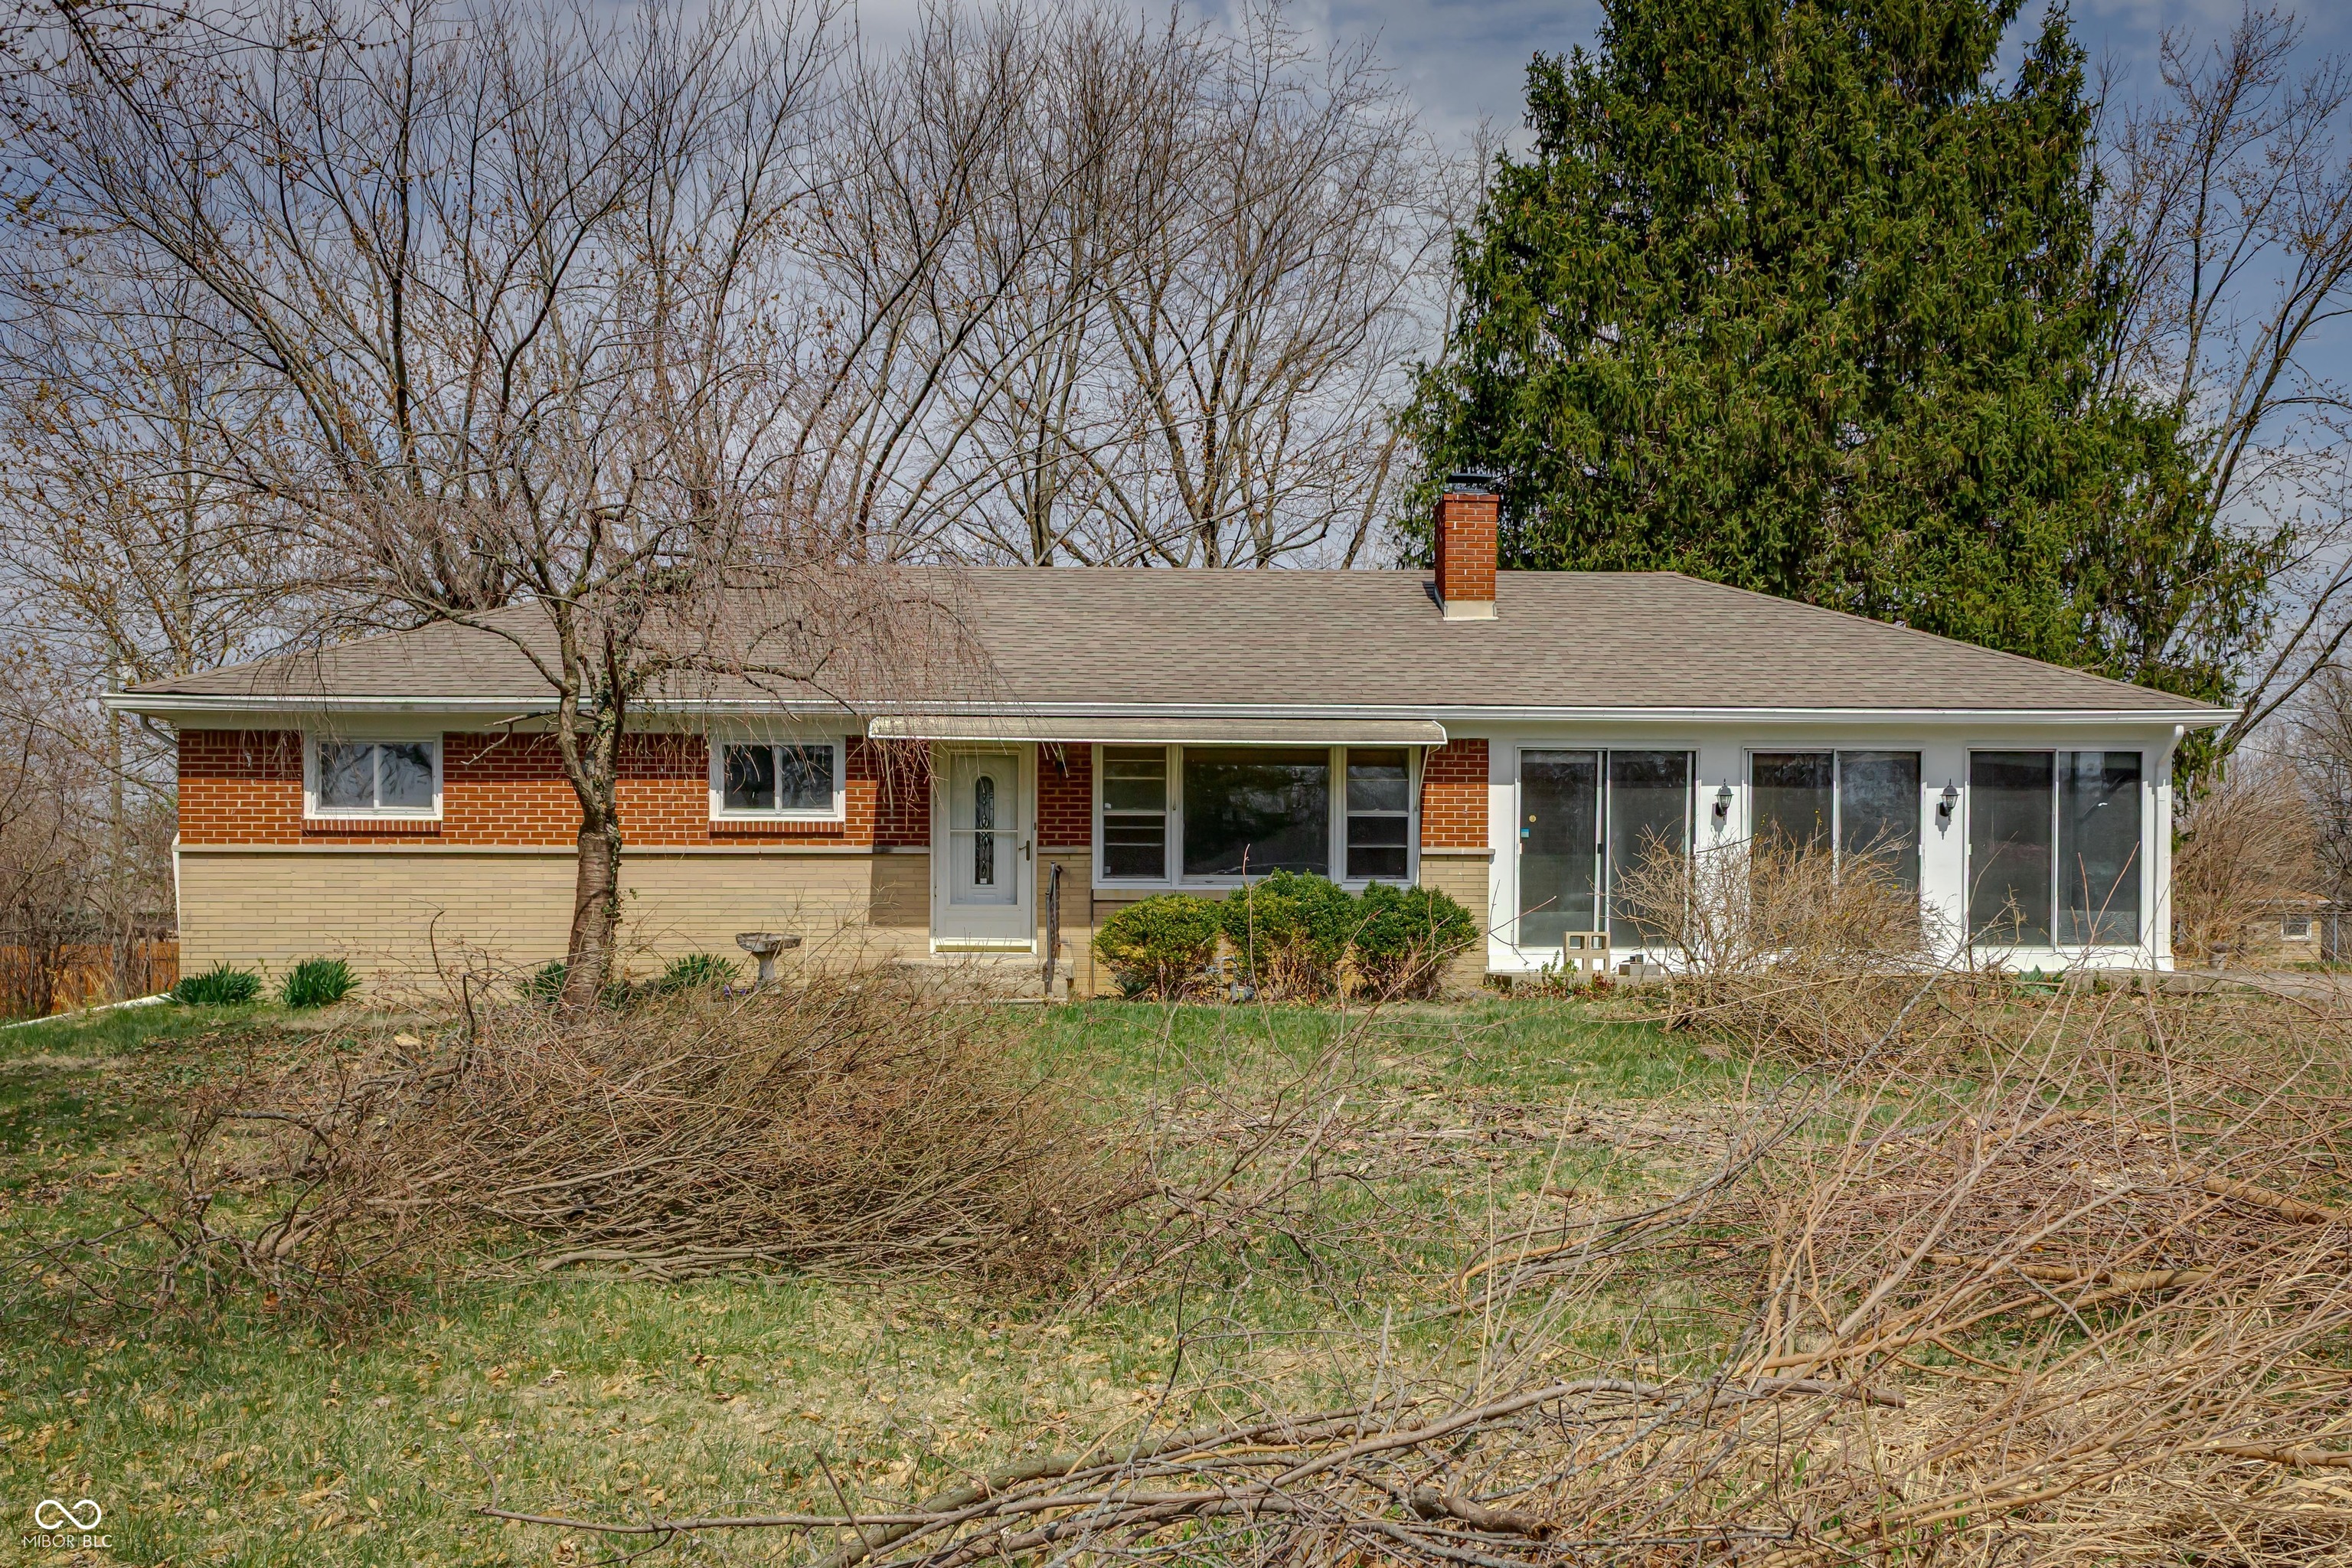
$250,000
3
bds
|
1
ba
|
1,040
sqft
|
built
1956
3510 Chamberlin Dr, Indianapolis, IN 46237
$-108
Cash flow
-2.3%
Cash-on-Cash Return
5.6%
Cap rate
0.7%
Rent to Value Ratio
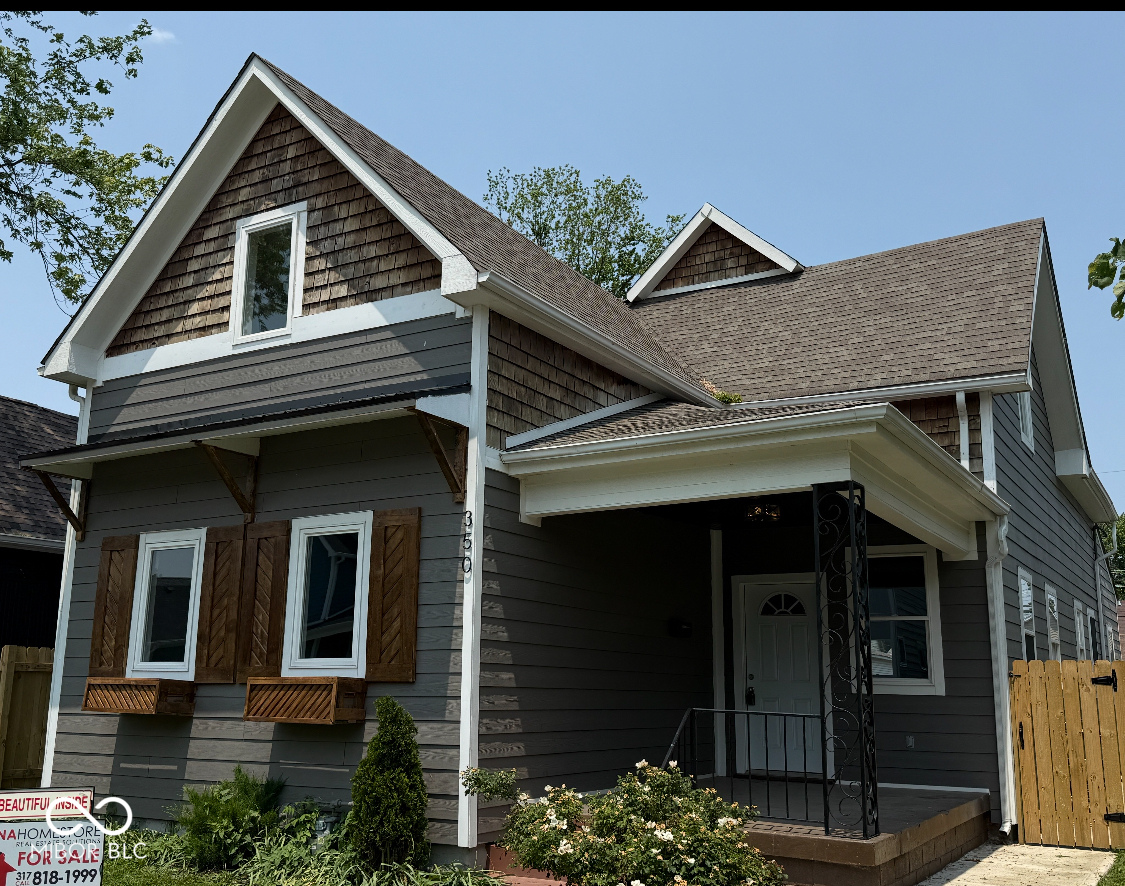
Active
$370,000
4
bds
|
3
ba
|
2,306
sqft
|
built
1890
350 E Minnesota St, Indianapolis, IN 46225
$37
Cash flow
0.5%
Cash-on-Cash Return
6.3%
Cap rate
0.8%
Rent to Value Ratio
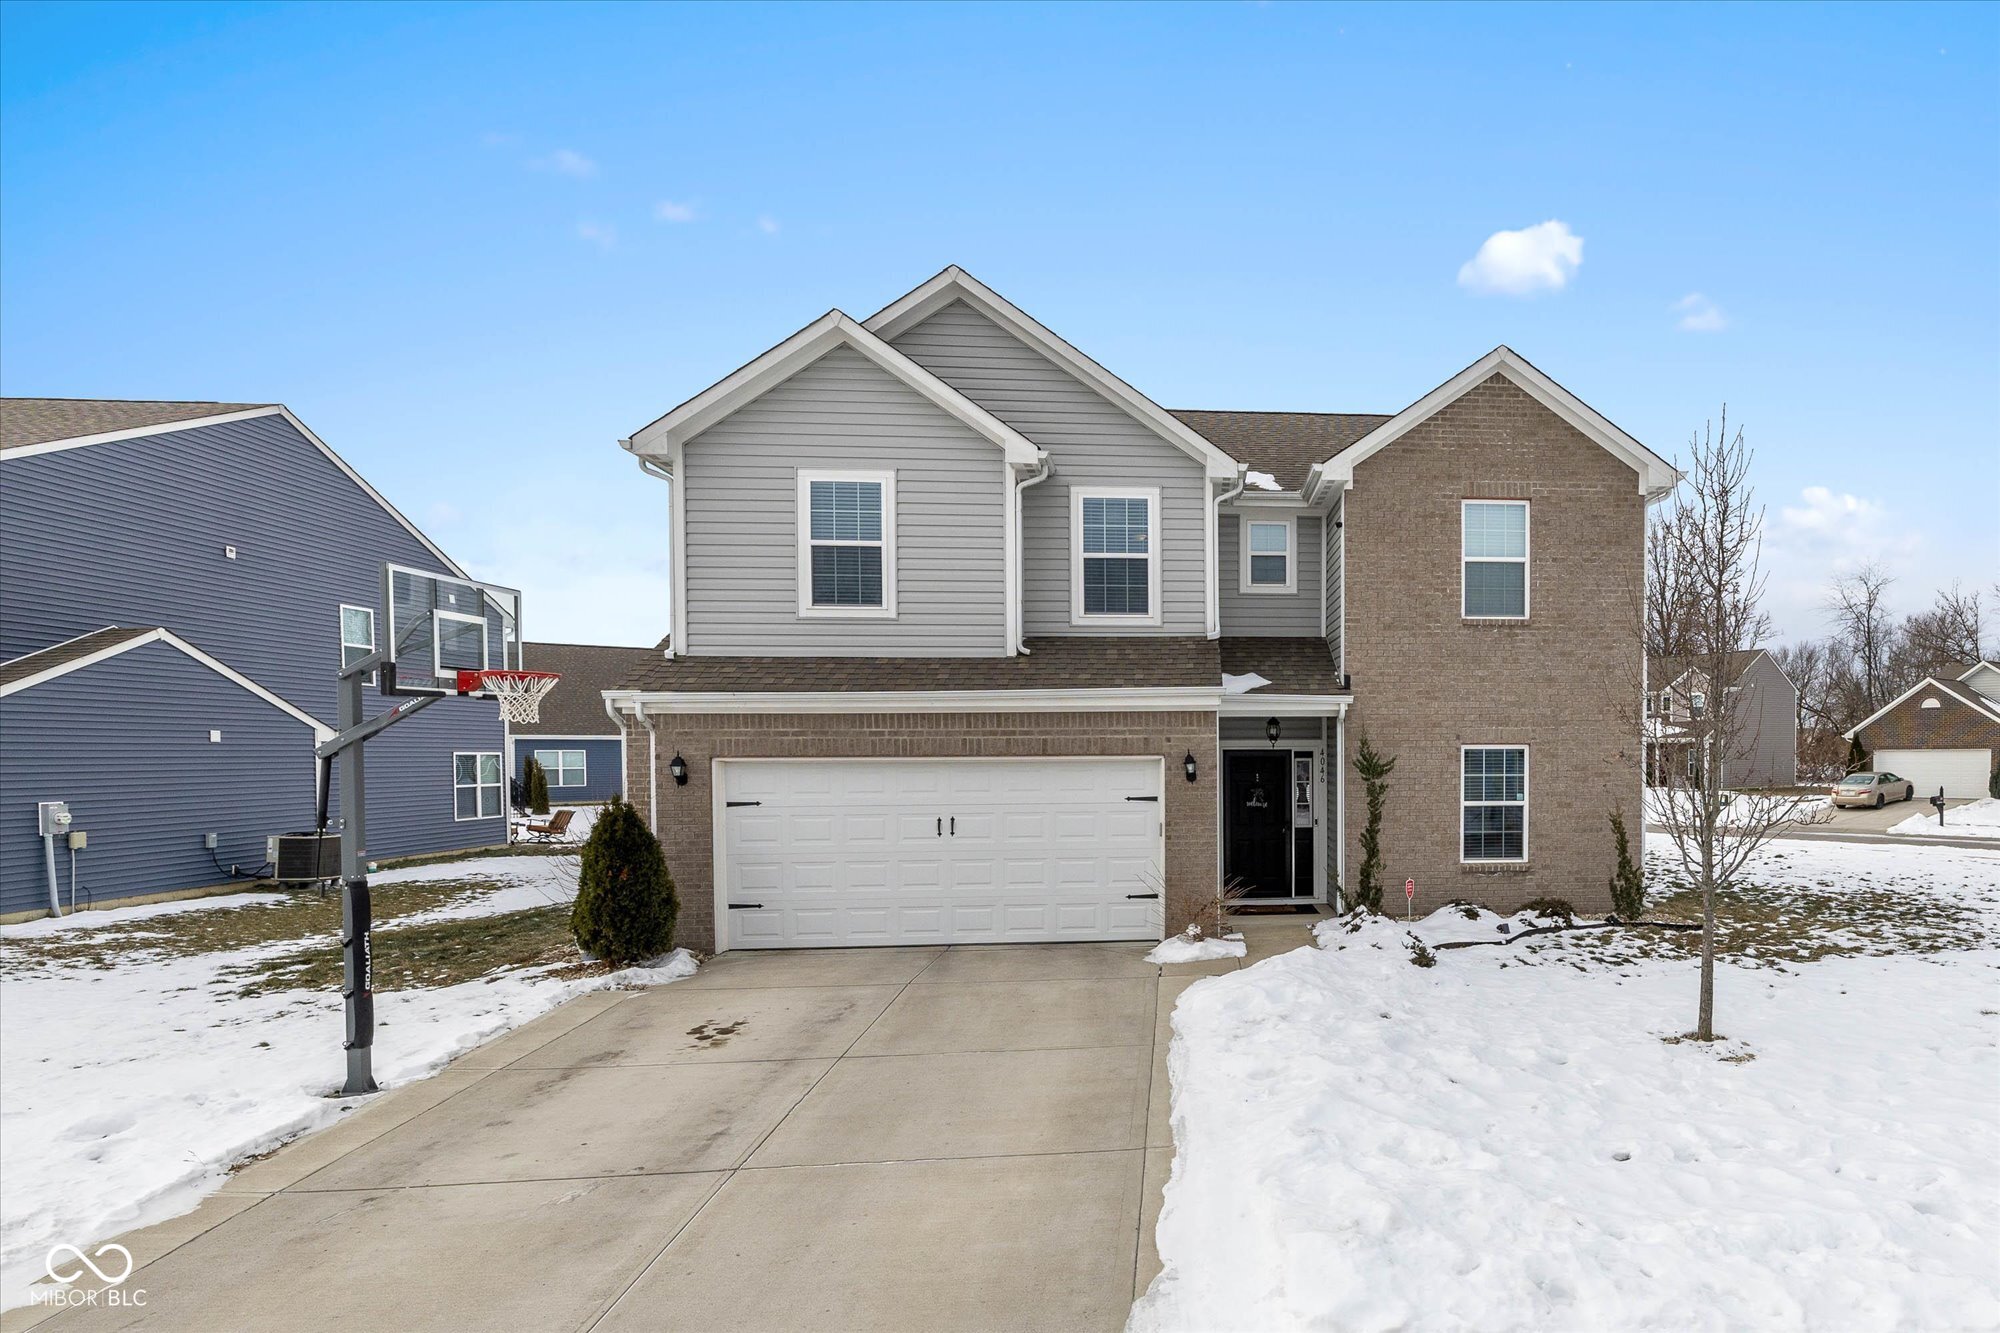
Active
$318,000
4
bds
|
3
ba
|
2,390
sqft
|
built
2019
4046 Stubbington Ln, Indianapolis, IN 46239
$42
Cash flow
0.7%
Cash-on-Cash Return
6.3%
Cap rate
0.8%
Rent to Value Ratio
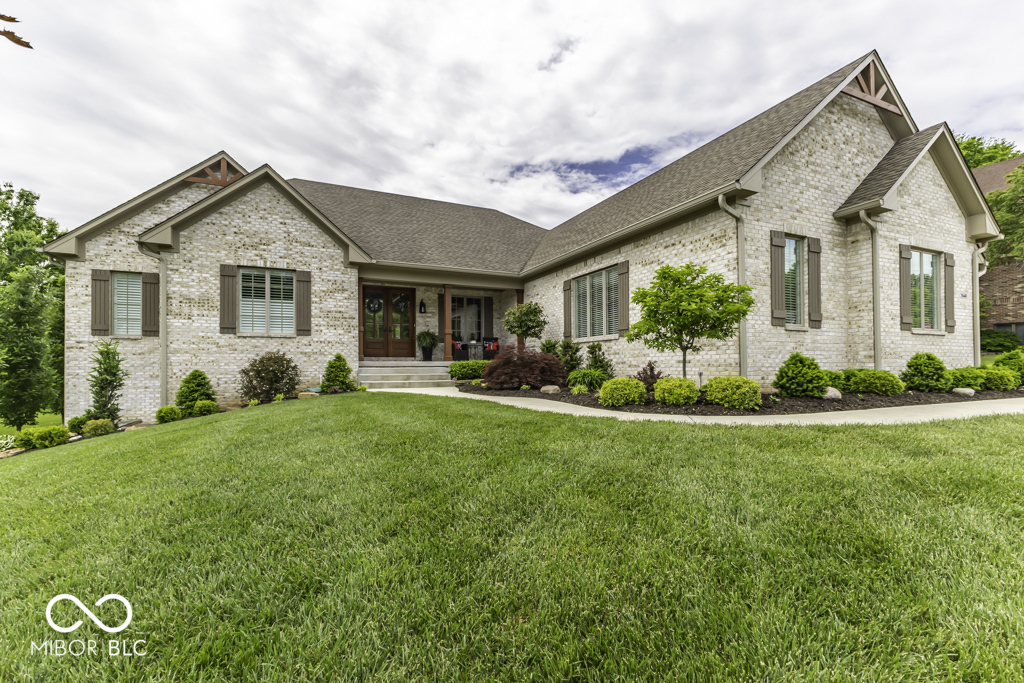
Active
$899,900
4
bds
|
5
ba
|
5,292
sqft
|
built
2018
7648 Killarney Dr, Indianapolis, IN 46217
$-2,707
Cash flow
-15.7%
Cash-on-Cash Return
2.5%
Cap rate
0.3%
Rent to Value Ratio
Active
$299,900
3
bds
|
2
ba
|
3,190
sqft
|
built
1905
3136 E Edgewood Ave, Indianapolis, IN 46227
$-87
Cash flow
-1.5%
Cash-on-Cash Return
5.8%
Cap rate
0.7%
Rent to Value Ratio
Active
$229,900
3
bds
|
2
ba
|
1,260
sqft
|
built
1975
7824 Hearthstone Way, Indianapolis, IN 46227
$-5
Cash flow
-0.1%
Cash-on-Cash Return
6.1%
Cap rate
0.7%
Rent to Value Ratio
Active
$485,000
6
bds
|
5
ba
|
3,608
sqft
|
built
1973
660 Sun Valley Ct, Indianapolis, IN 46217
$-1,104
Cash flow
-11.9%
Cash-on-Cash Return
3.4%
Cap rate
0.4%
Rent to Value Ratio
Pending
$239,900
3
bds
|
3
ba
|
1,548
sqft
|
built
1999
621 Meadows Edge Ln, Indianapolis, IN 46217
$-143
Cash flow
-3.1%
Cash-on-Cash Return
5.4%
Cap rate
0.7%
Rent to Value Ratio
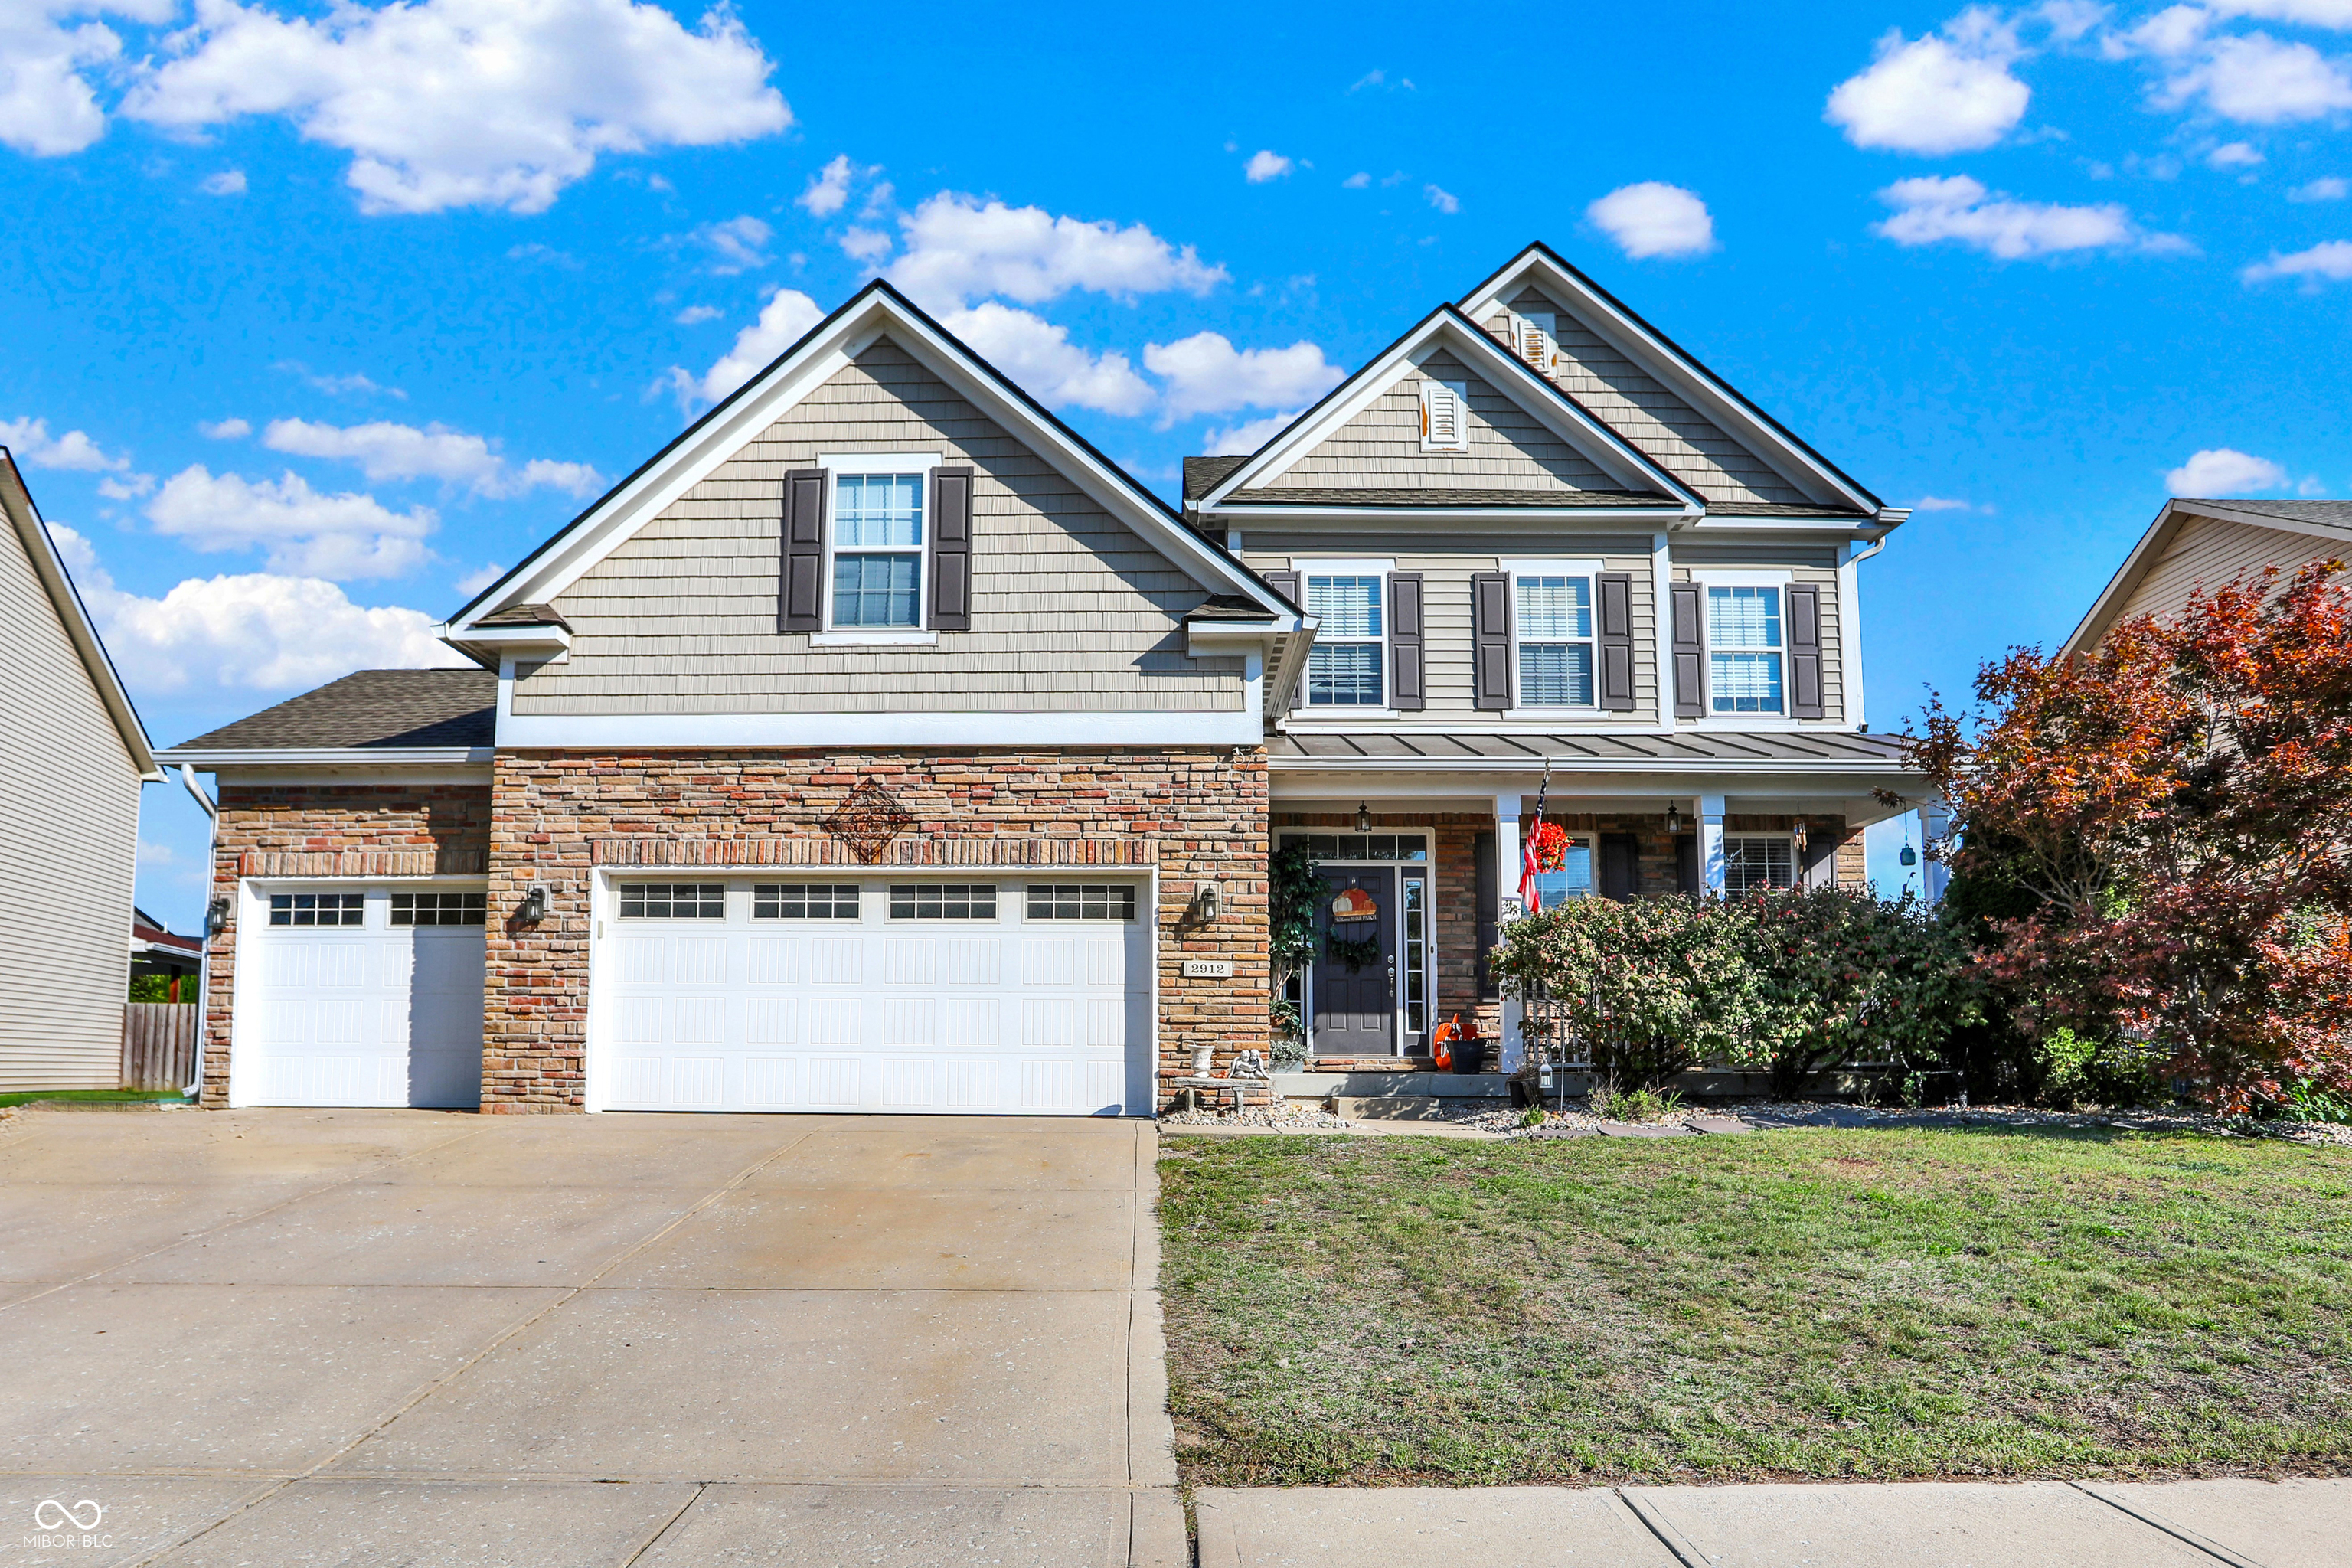
Active
$535,000
6
bds
|
5
ba
|
5,621
sqft
|
built
2008
2912 Tuscarora Ln, Indianapolis, IN 46217
$-83
Cash flow
-0.8%
Cash-on-Cash Return
6.0%
Cap rate
0.7%
Rent to Value Ratio
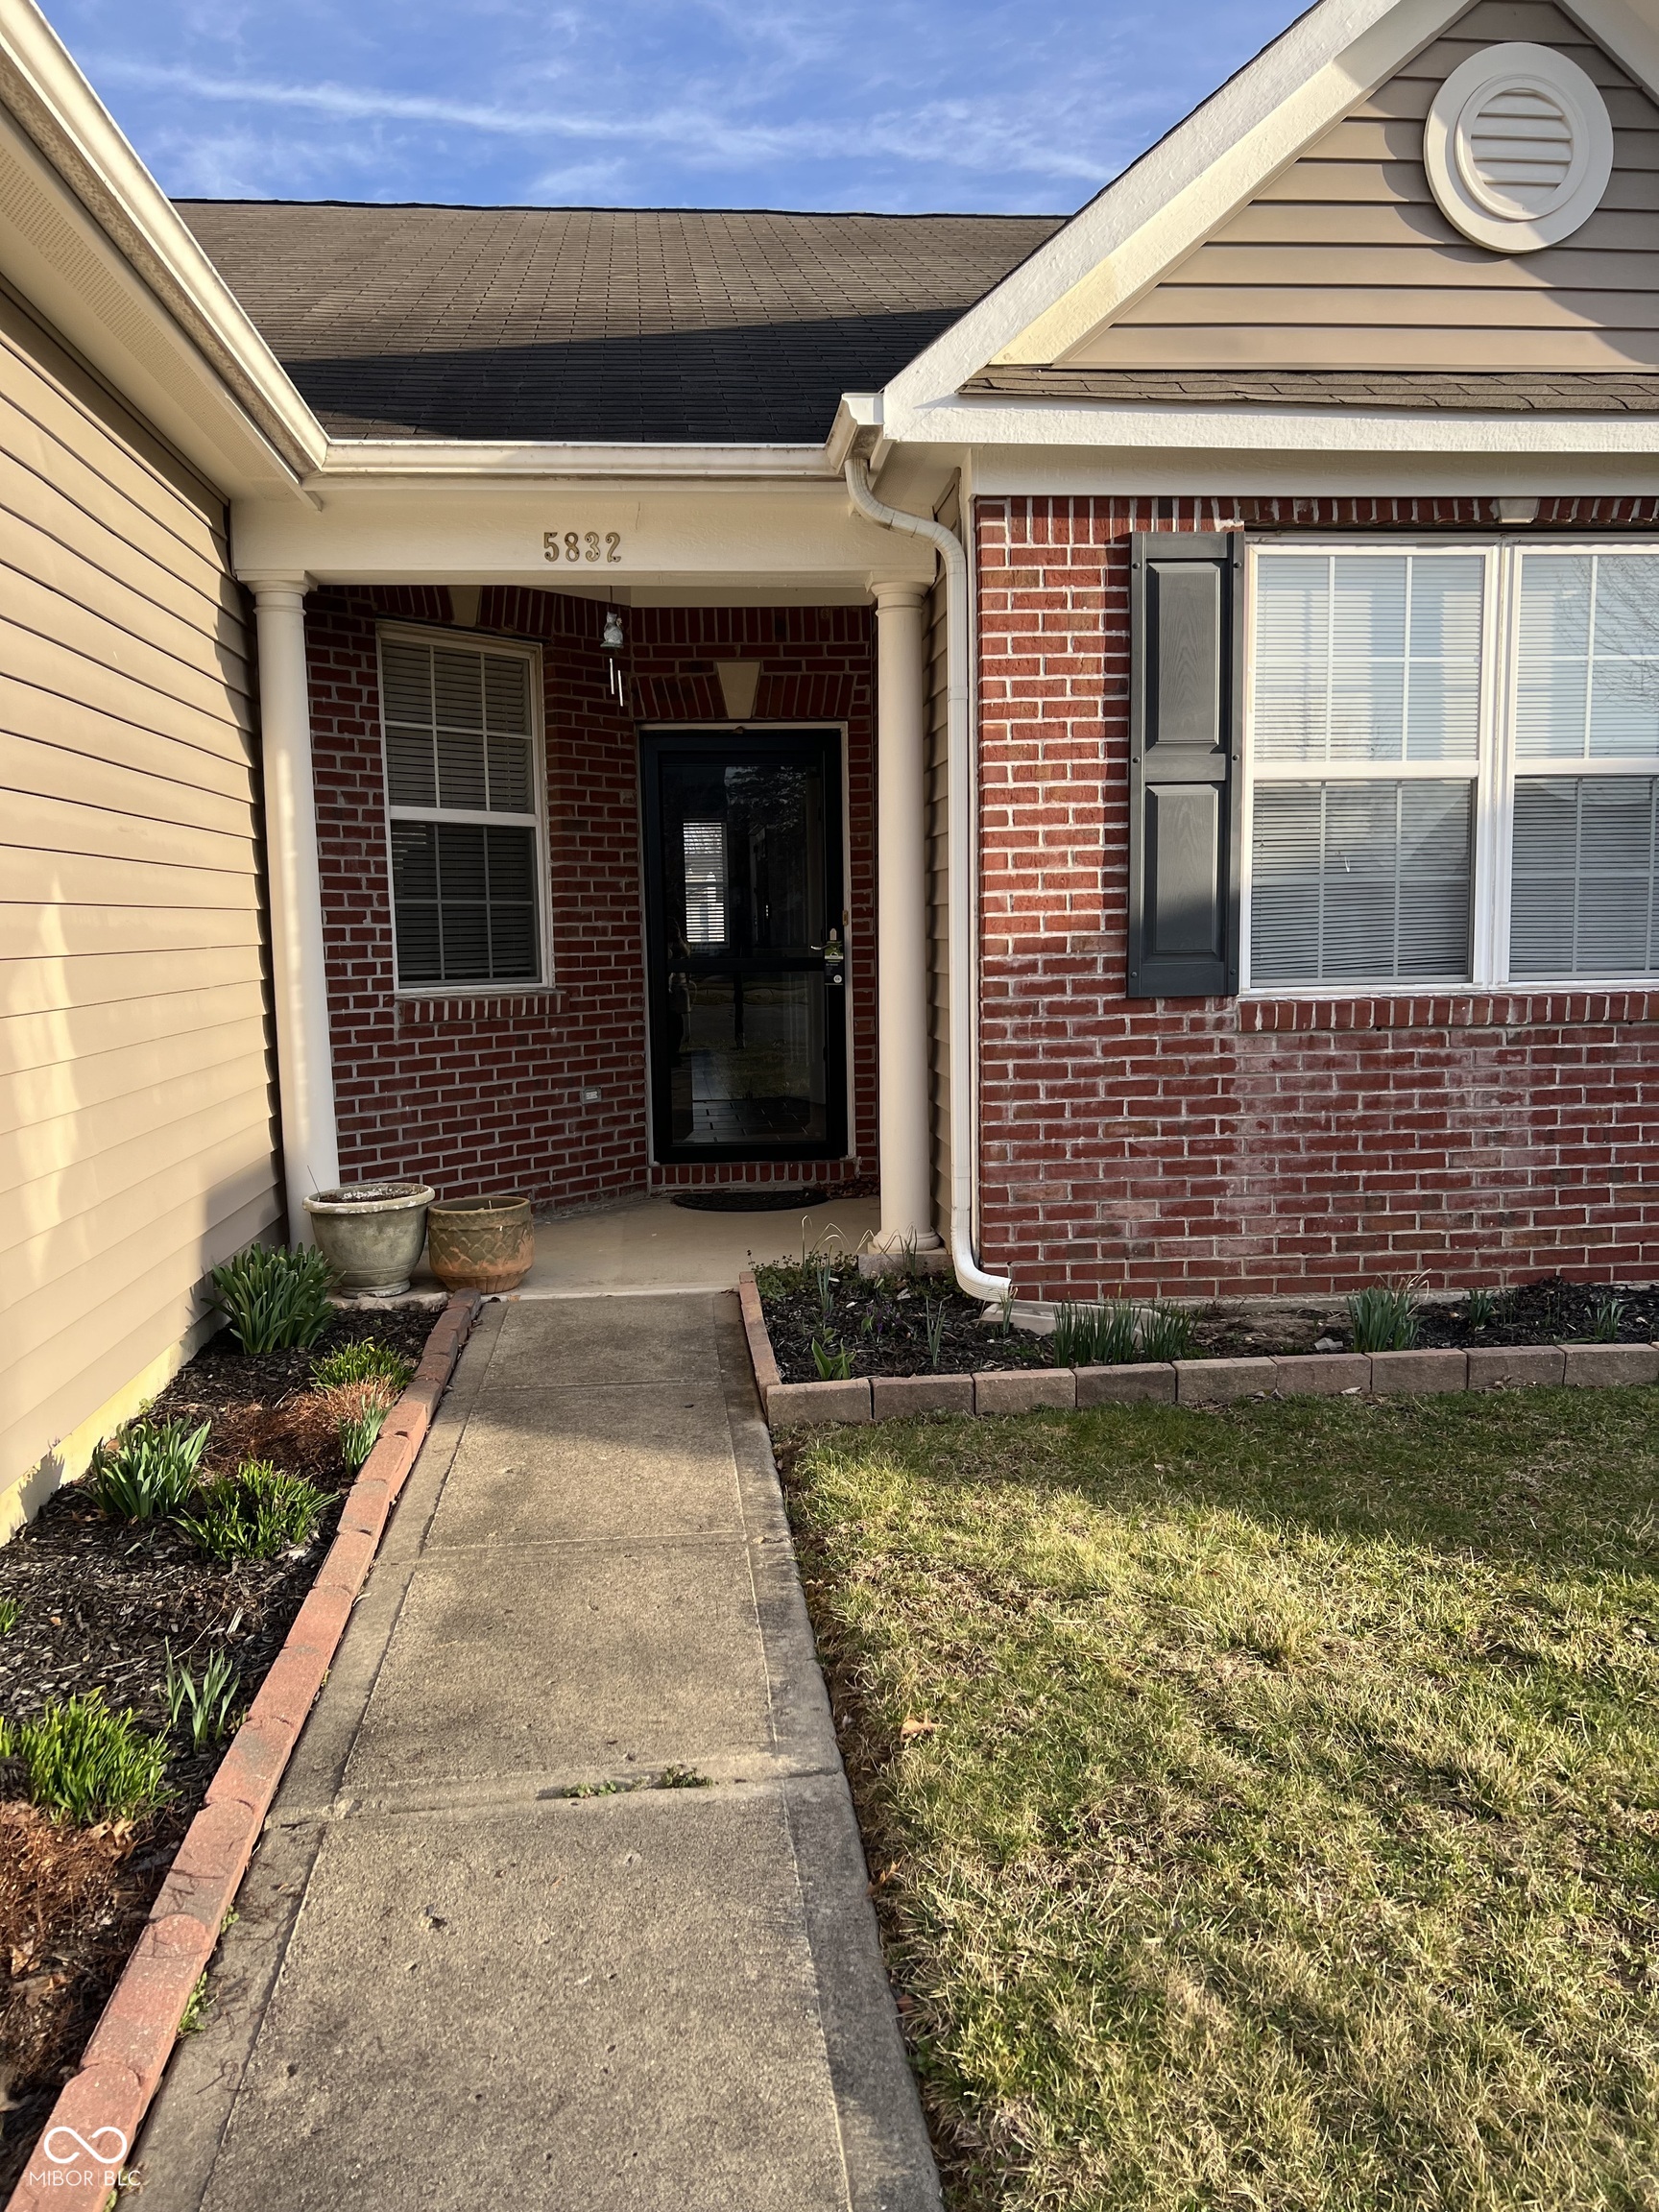
Active
$265,000
3
bds
|
2
ba
|
1,578
sqft
|
built
2006
5832 Cabot Dr, Indianapolis, IN 46221
$-138
Cash flow
-2.7%
Cash-on-Cash Return
5.5%
Cap rate
0.7%
Rent to Value Ratio
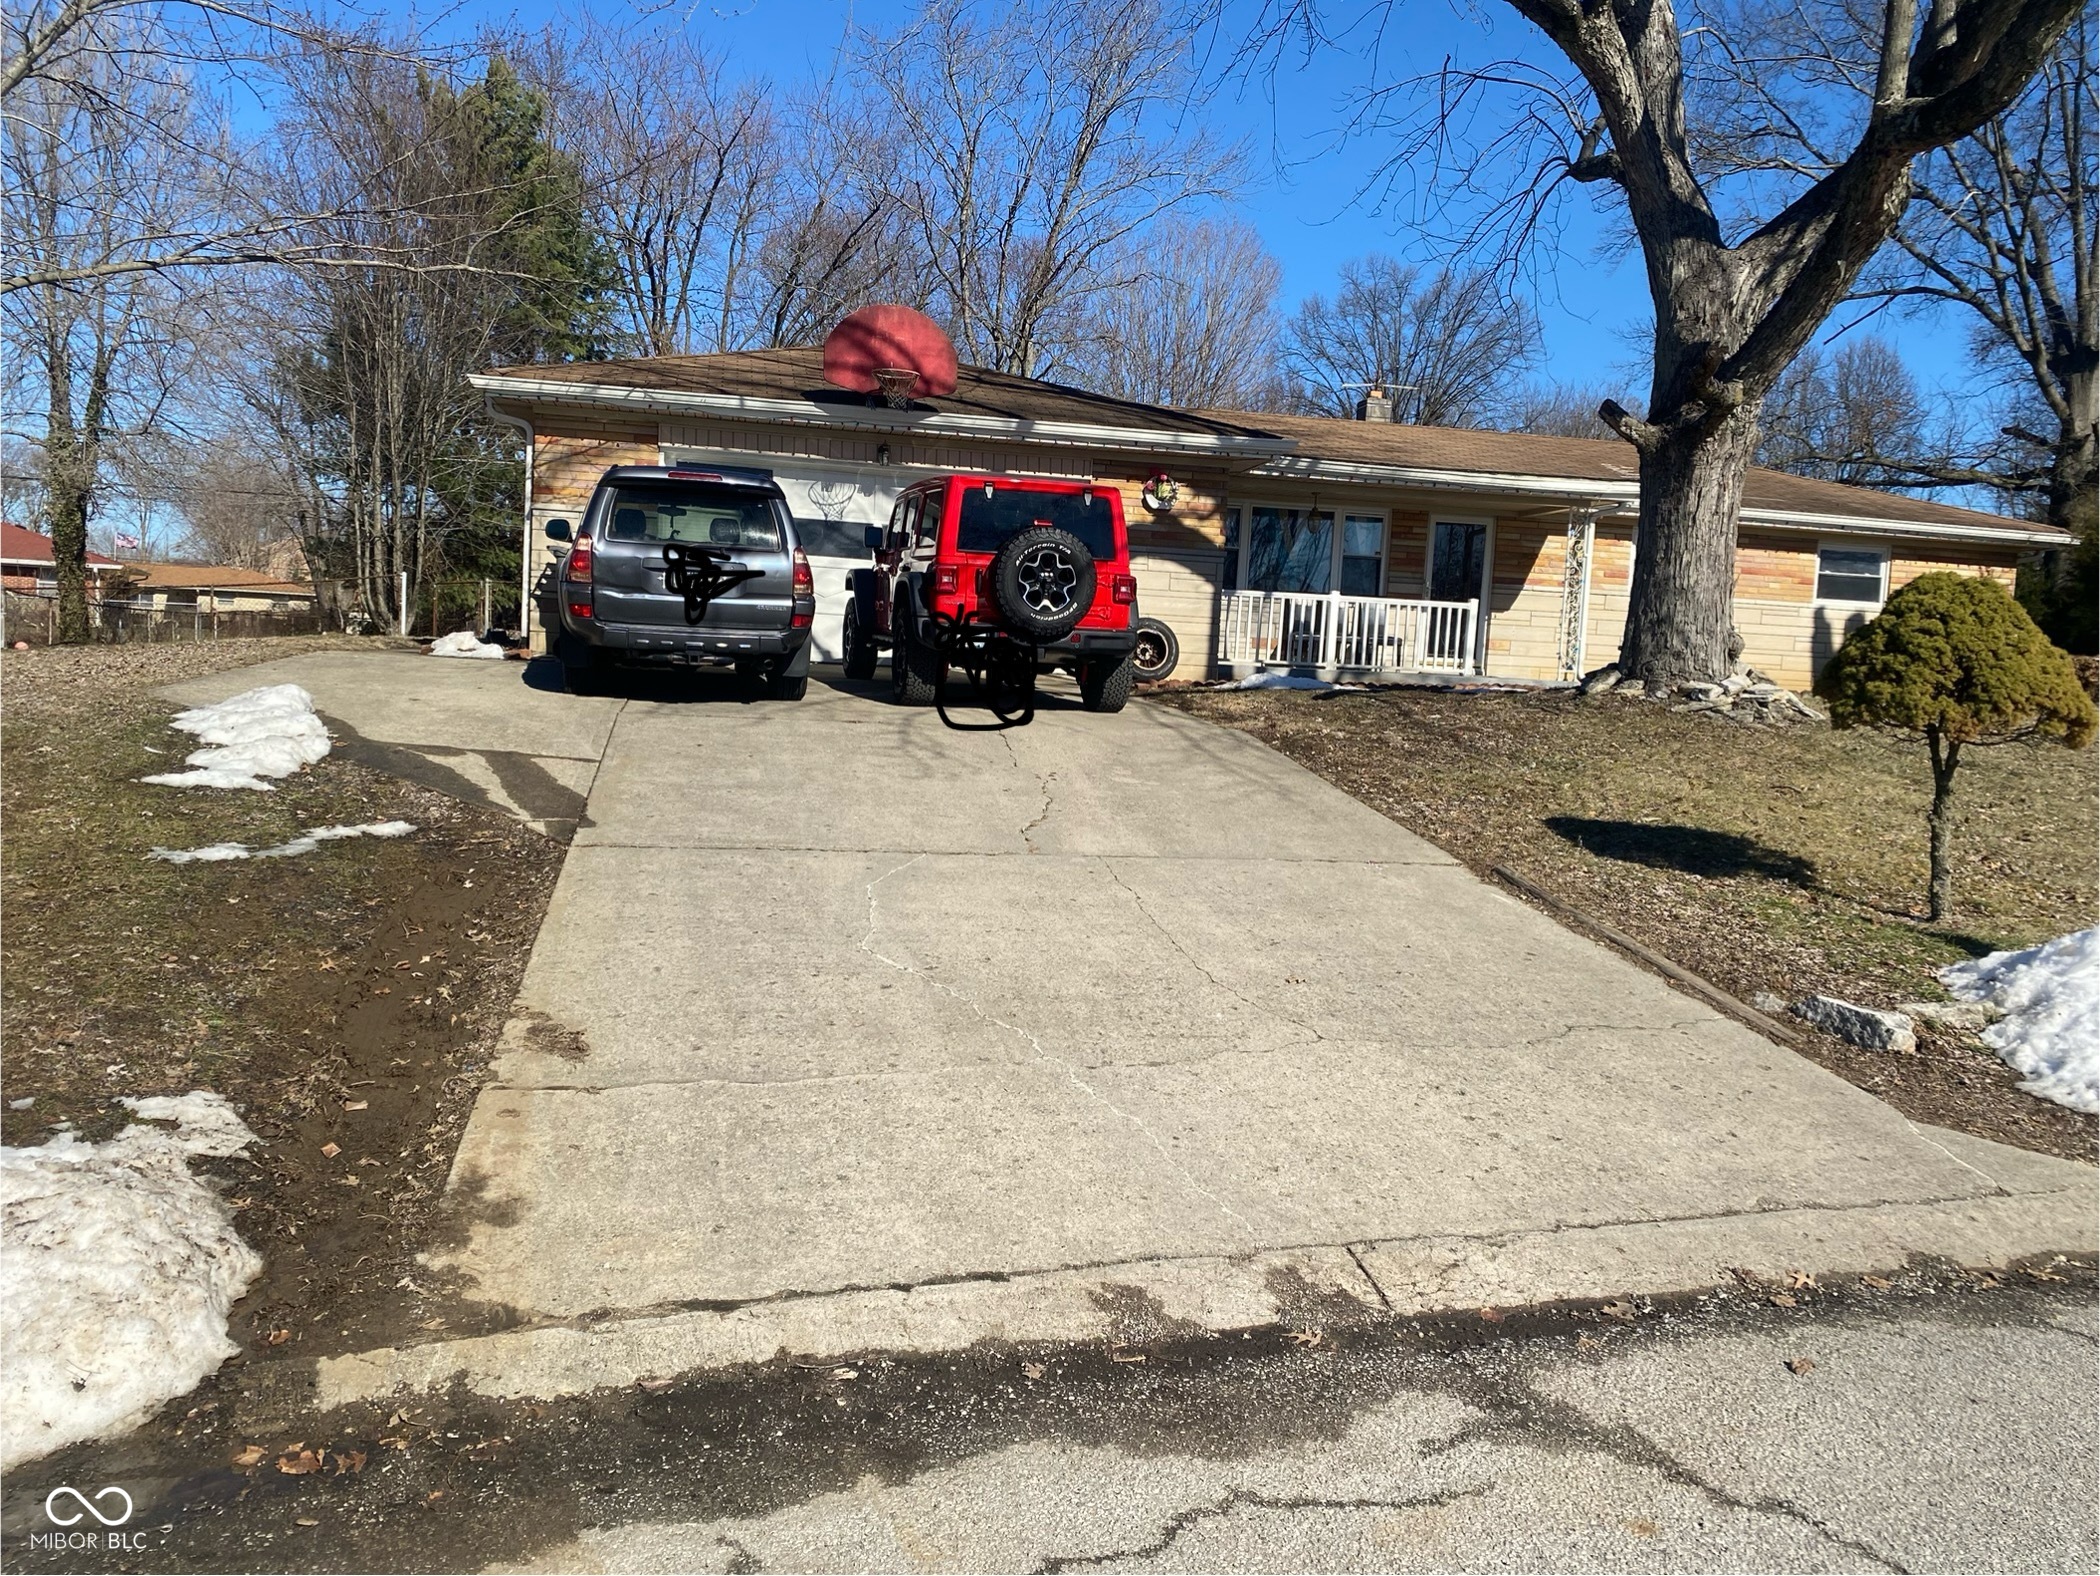
Active
$274,900
4
bds
|
3
ba
|
1,783
sqft
|
built
1961
116 Kenova Dr, Indianapolis, IN 46227
$-28
Cash flow
-0.5%
Cash-on-Cash Return
6.0%
Cap rate
0.7%
Rent to Value Ratio
Pending
$374,900
4
bds
|
3
ba
|
2,820
sqft
|
built
2004
8327 Andrusia Ln, Indianapolis, IN 46237
$-438
Cash flow
-6.1%
Cash-on-Cash Return
4.7%
Cap rate
0.6%
Rent to Value Ratio
Active
$259,999
4
bds
|
0
ba
|
0
sqft
|
built
1919
429 N Colorado Ave, Indianapolis, IN 46201
$-918
Cash flow
-18.4%
Cash-on-Cash Return
1.9%
Cap rate
0.2%
Rent to Value Ratio
Active
$250,000
3
bds
|
1
ba
|
1,328
sqft
|
built
1950
80 S Mickley Ave, Indianapolis, IN 46241
$-39
Cash flow
-0.8%
Cash-on-Cash Return
6.0%
Cap rate
0.7%
Rent to Value Ratio
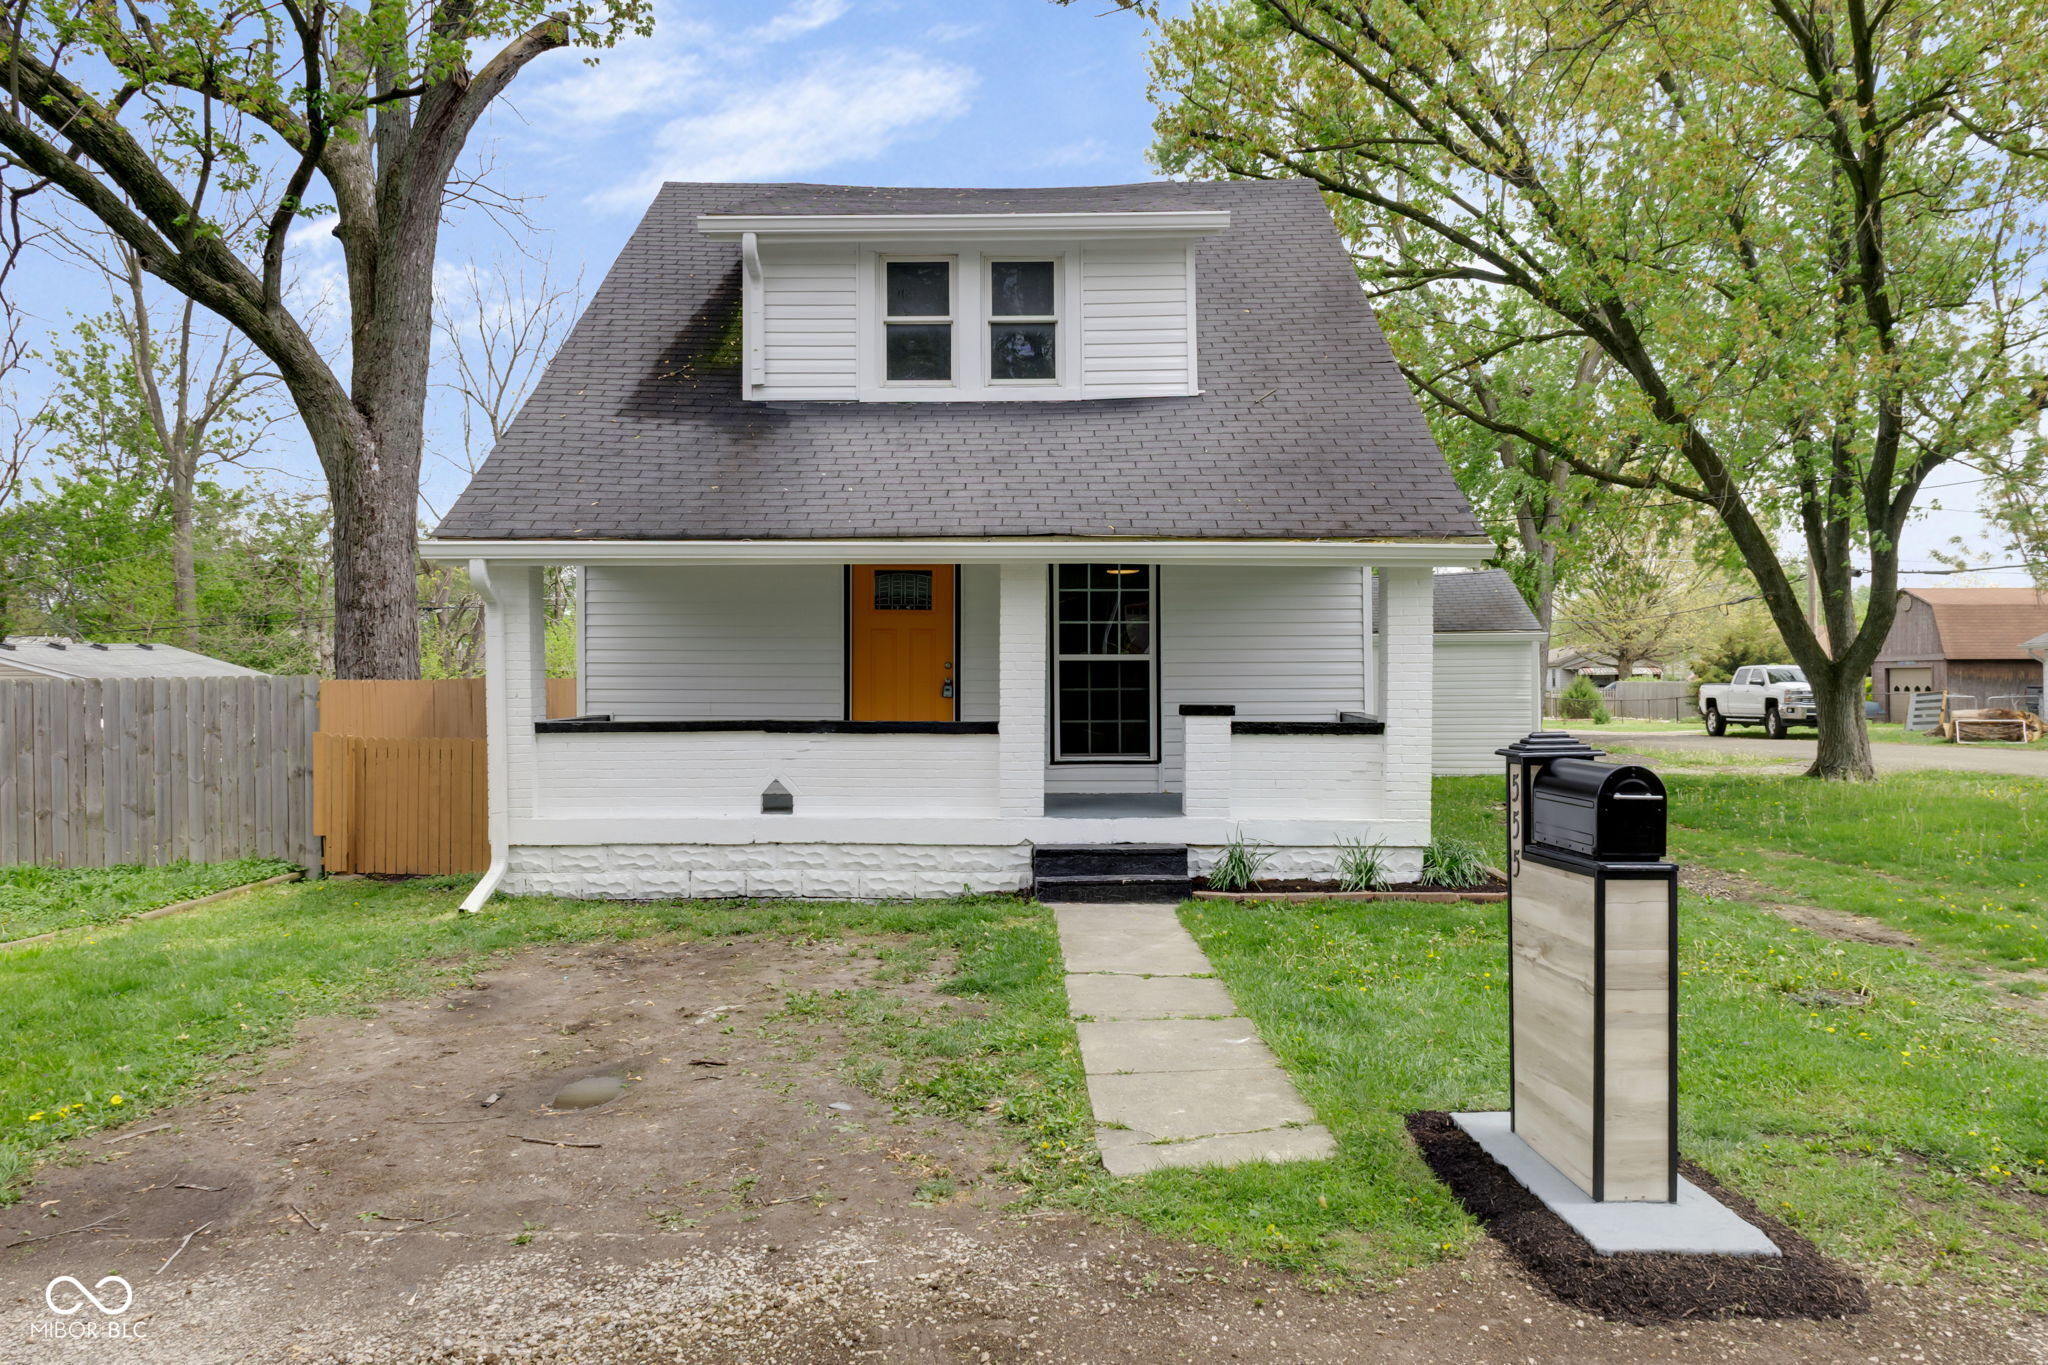
Active
$230,000
4
bds
|
2
ba
|
1,408
sqft
|
built
1928
555 S Auburn St, Indianapolis, IN 46241
$-350
Cash flow
-7.9%
Cash-on-Cash Return
4.3%
Cap rate
0.5%
Rent to Value Ratio
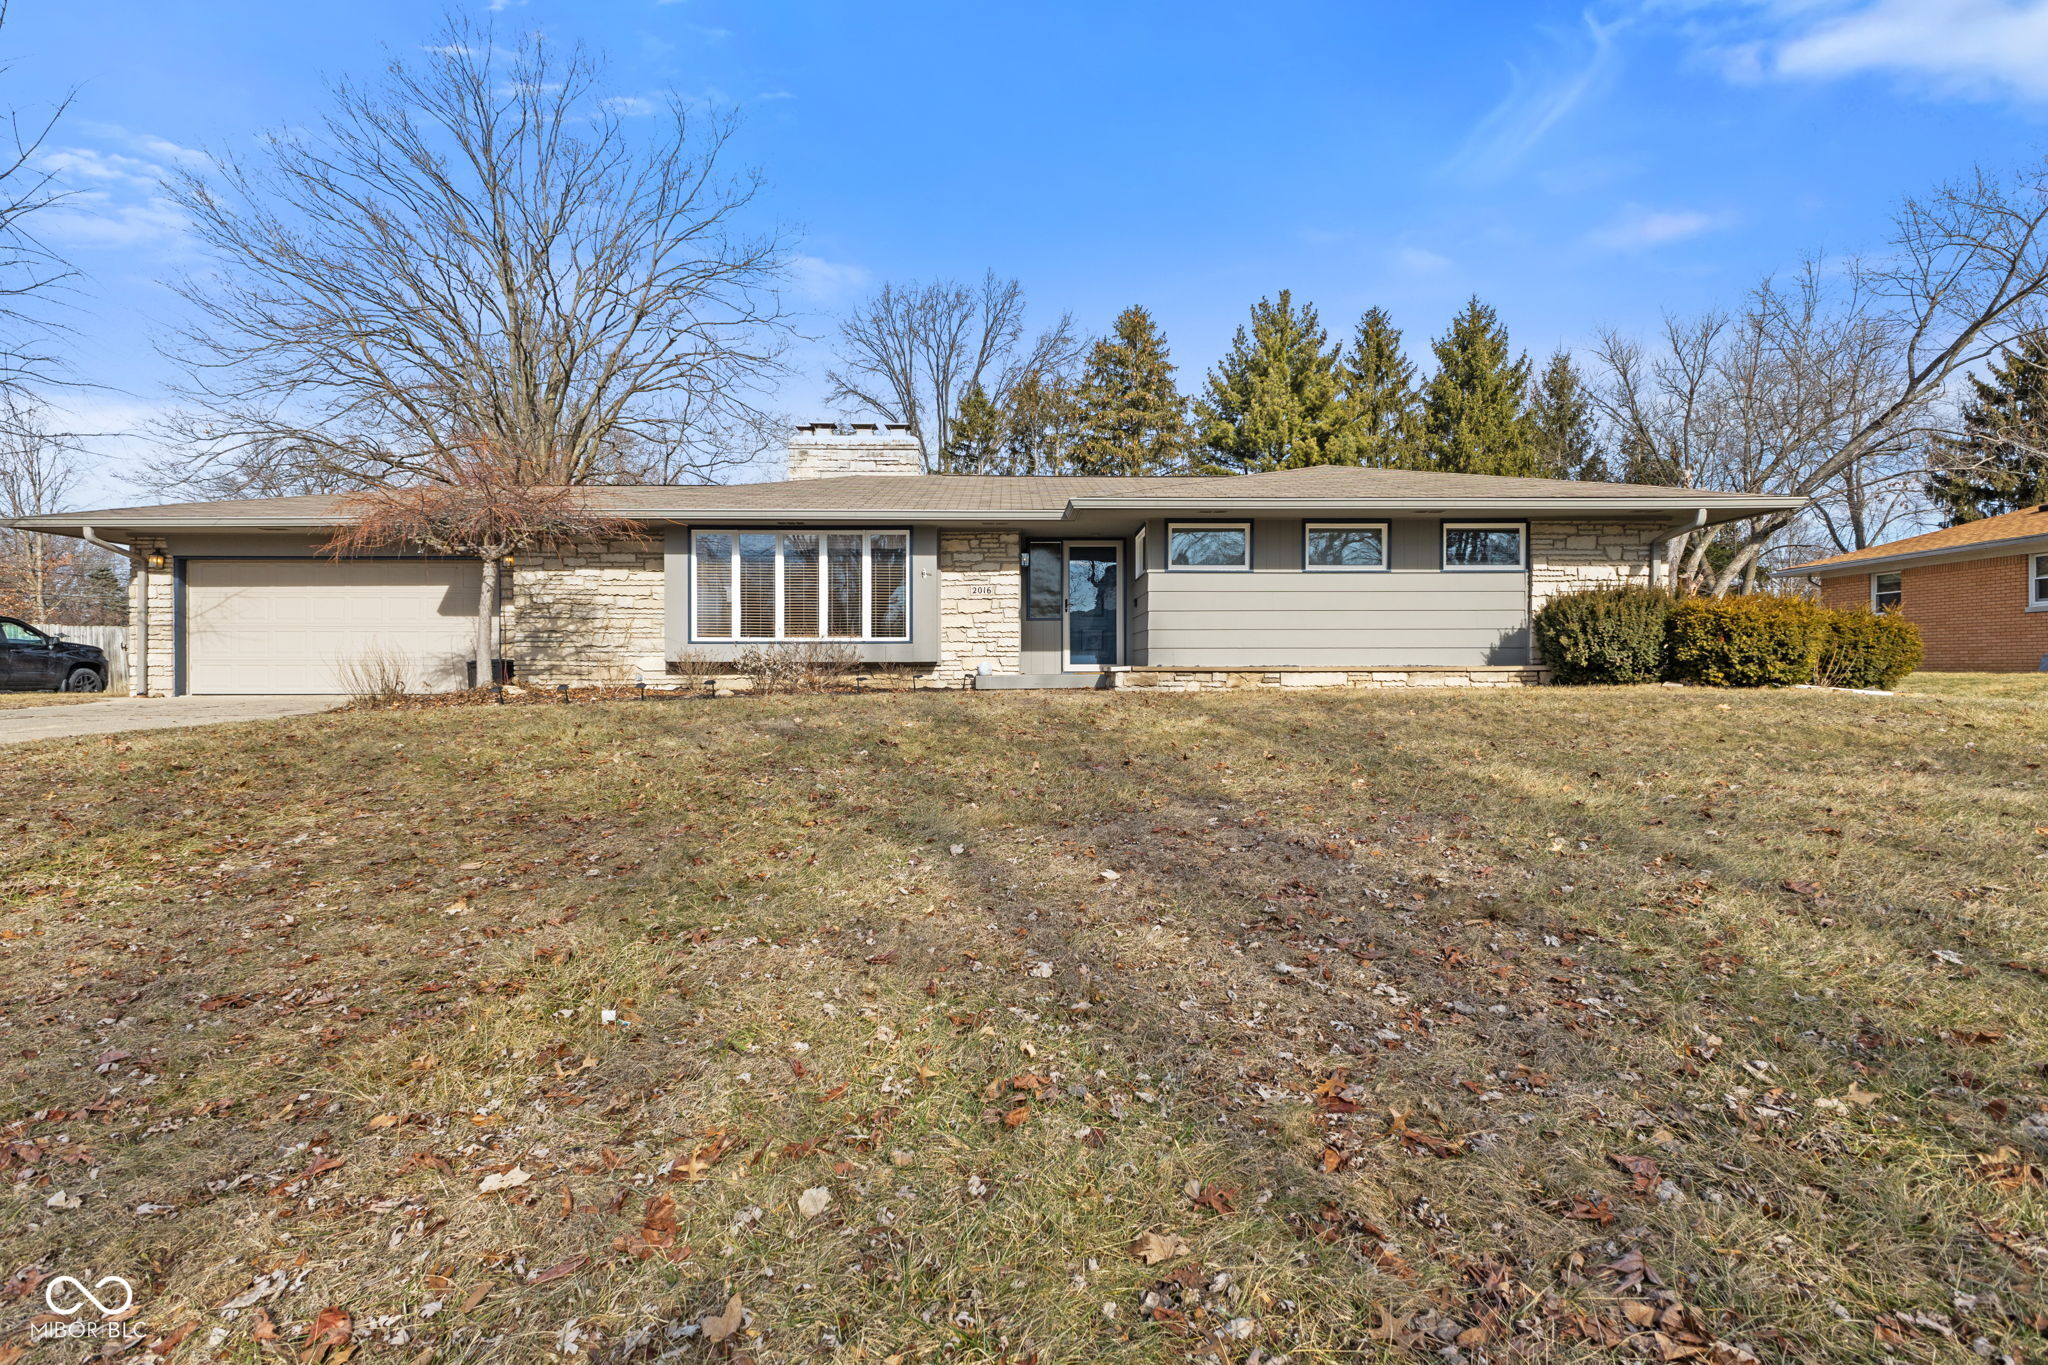
Active
$330,000
3
bds
|
3
ba
|
2,689
sqft
|
built
1966
2016 Colt Rd, Indianapolis, IN 46227
$35
Cash flow
0.6%
Cash-on-Cash Return
6.3%
Cap rate
0.8%
Rent to Value Ratio
Pending
$129,900
2
bds
|
2
ba
|
1,088
sqft
|
built
1973
2634 Country Estates Dr, Indianapolis, IN 46227
$-26
Cash flow
-1.0%
Cash-on-Cash Return
5.9%
Cap rate
1.1%
Rent to Value Ratio
Active
$322,500
2
bds
|
3
ba
|
1,403
sqft
|
built
2017
64 Central Greens Blvd, Indianapolis, IN 46222
$-97
Cash flow
-1.6%
Cash-on-Cash Return
5.8%
Cap rate
0.7%
Rent to Value Ratio
Active
$460,000
4
bds
|
4
ba
|
2,748
sqft
|
built
1900
234 N State Ave, Indianapolis, IN 46201
$-838
Cash flow
-9.5%
Cash-on-Cash Return
4.0%
Cap rate
0.5%
Rent to Value Ratio
Active
$450,000
4
bds
|
4
ba
|
2,120
sqft
|
built
1955
257 N Tacoma Ave, Indianapolis, IN 46201
$-1,546
Cash flow
-17.9%
Cash-on-Cash Return
2.0%
Cap rate
0.2%
Rent to Value Ratio
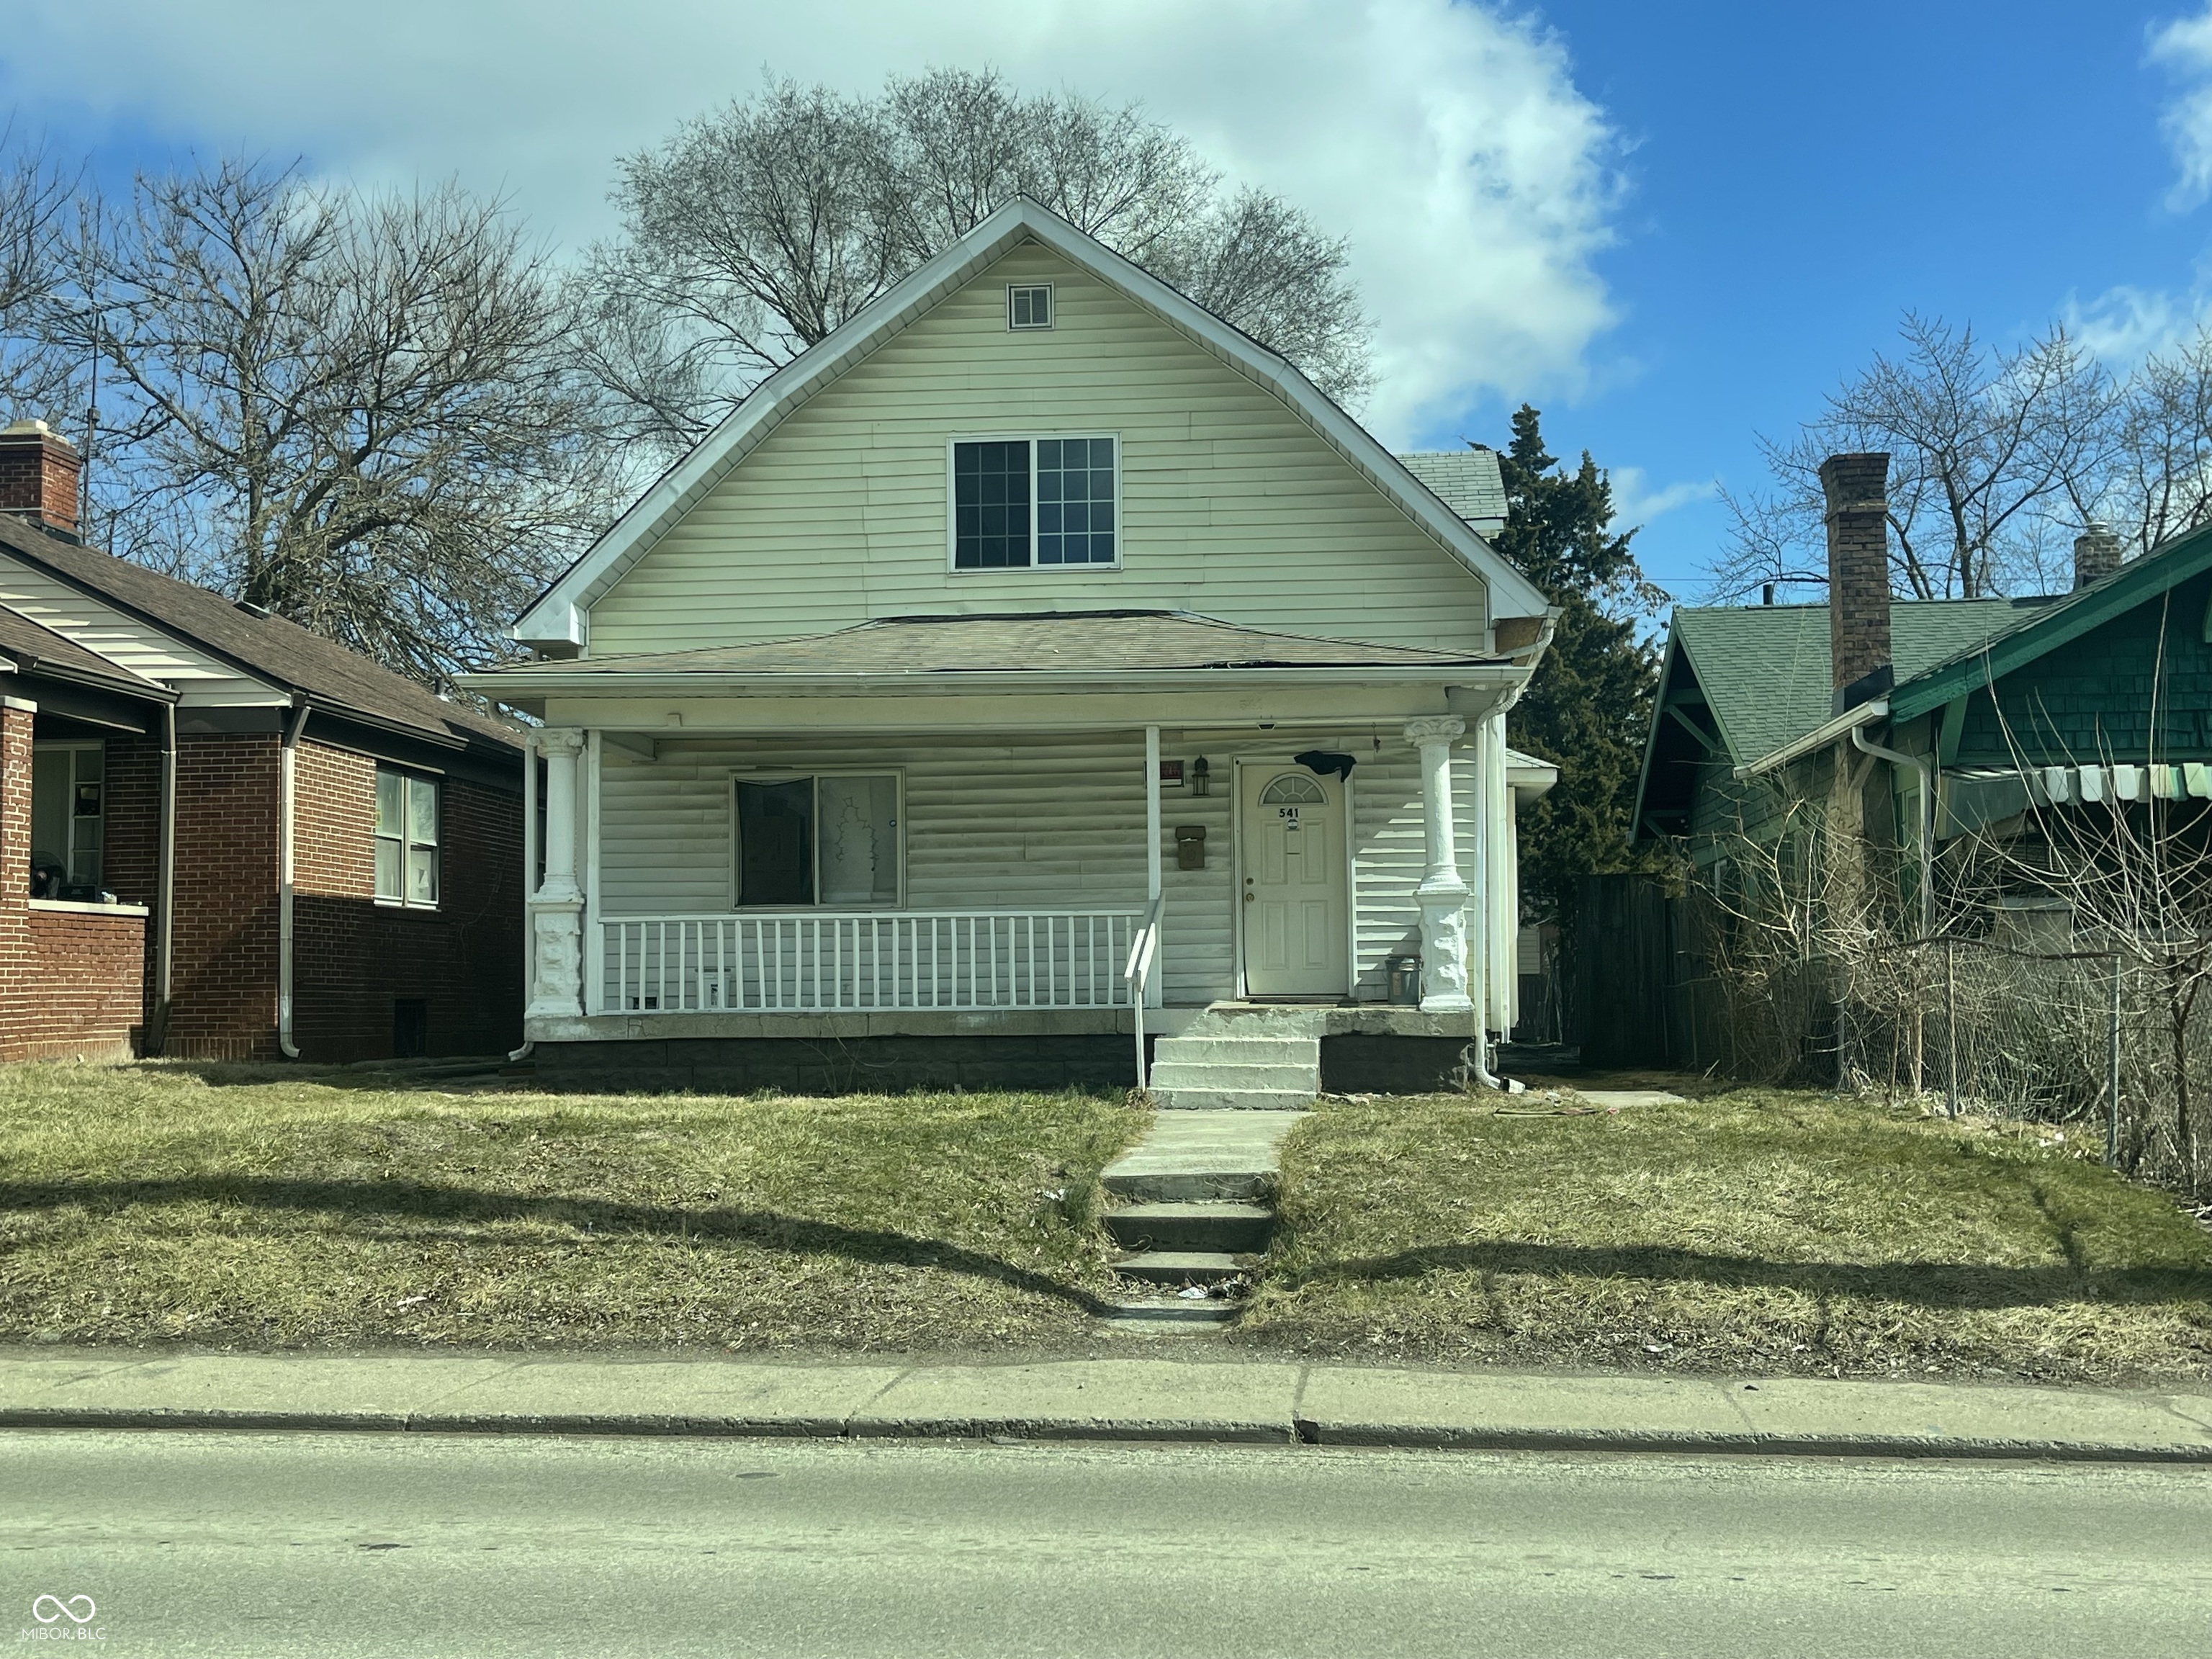
Active
$500,000
3
bds
|
1
ba
|
1,288
sqft
|
built
1921
537 N Rural St, Indianapolis, IN 46201
$-1,802
Cash flow
-18.8%
Cash-on-Cash Return
1.8%
Cap rate
0.2%
Rent to Value Ratio
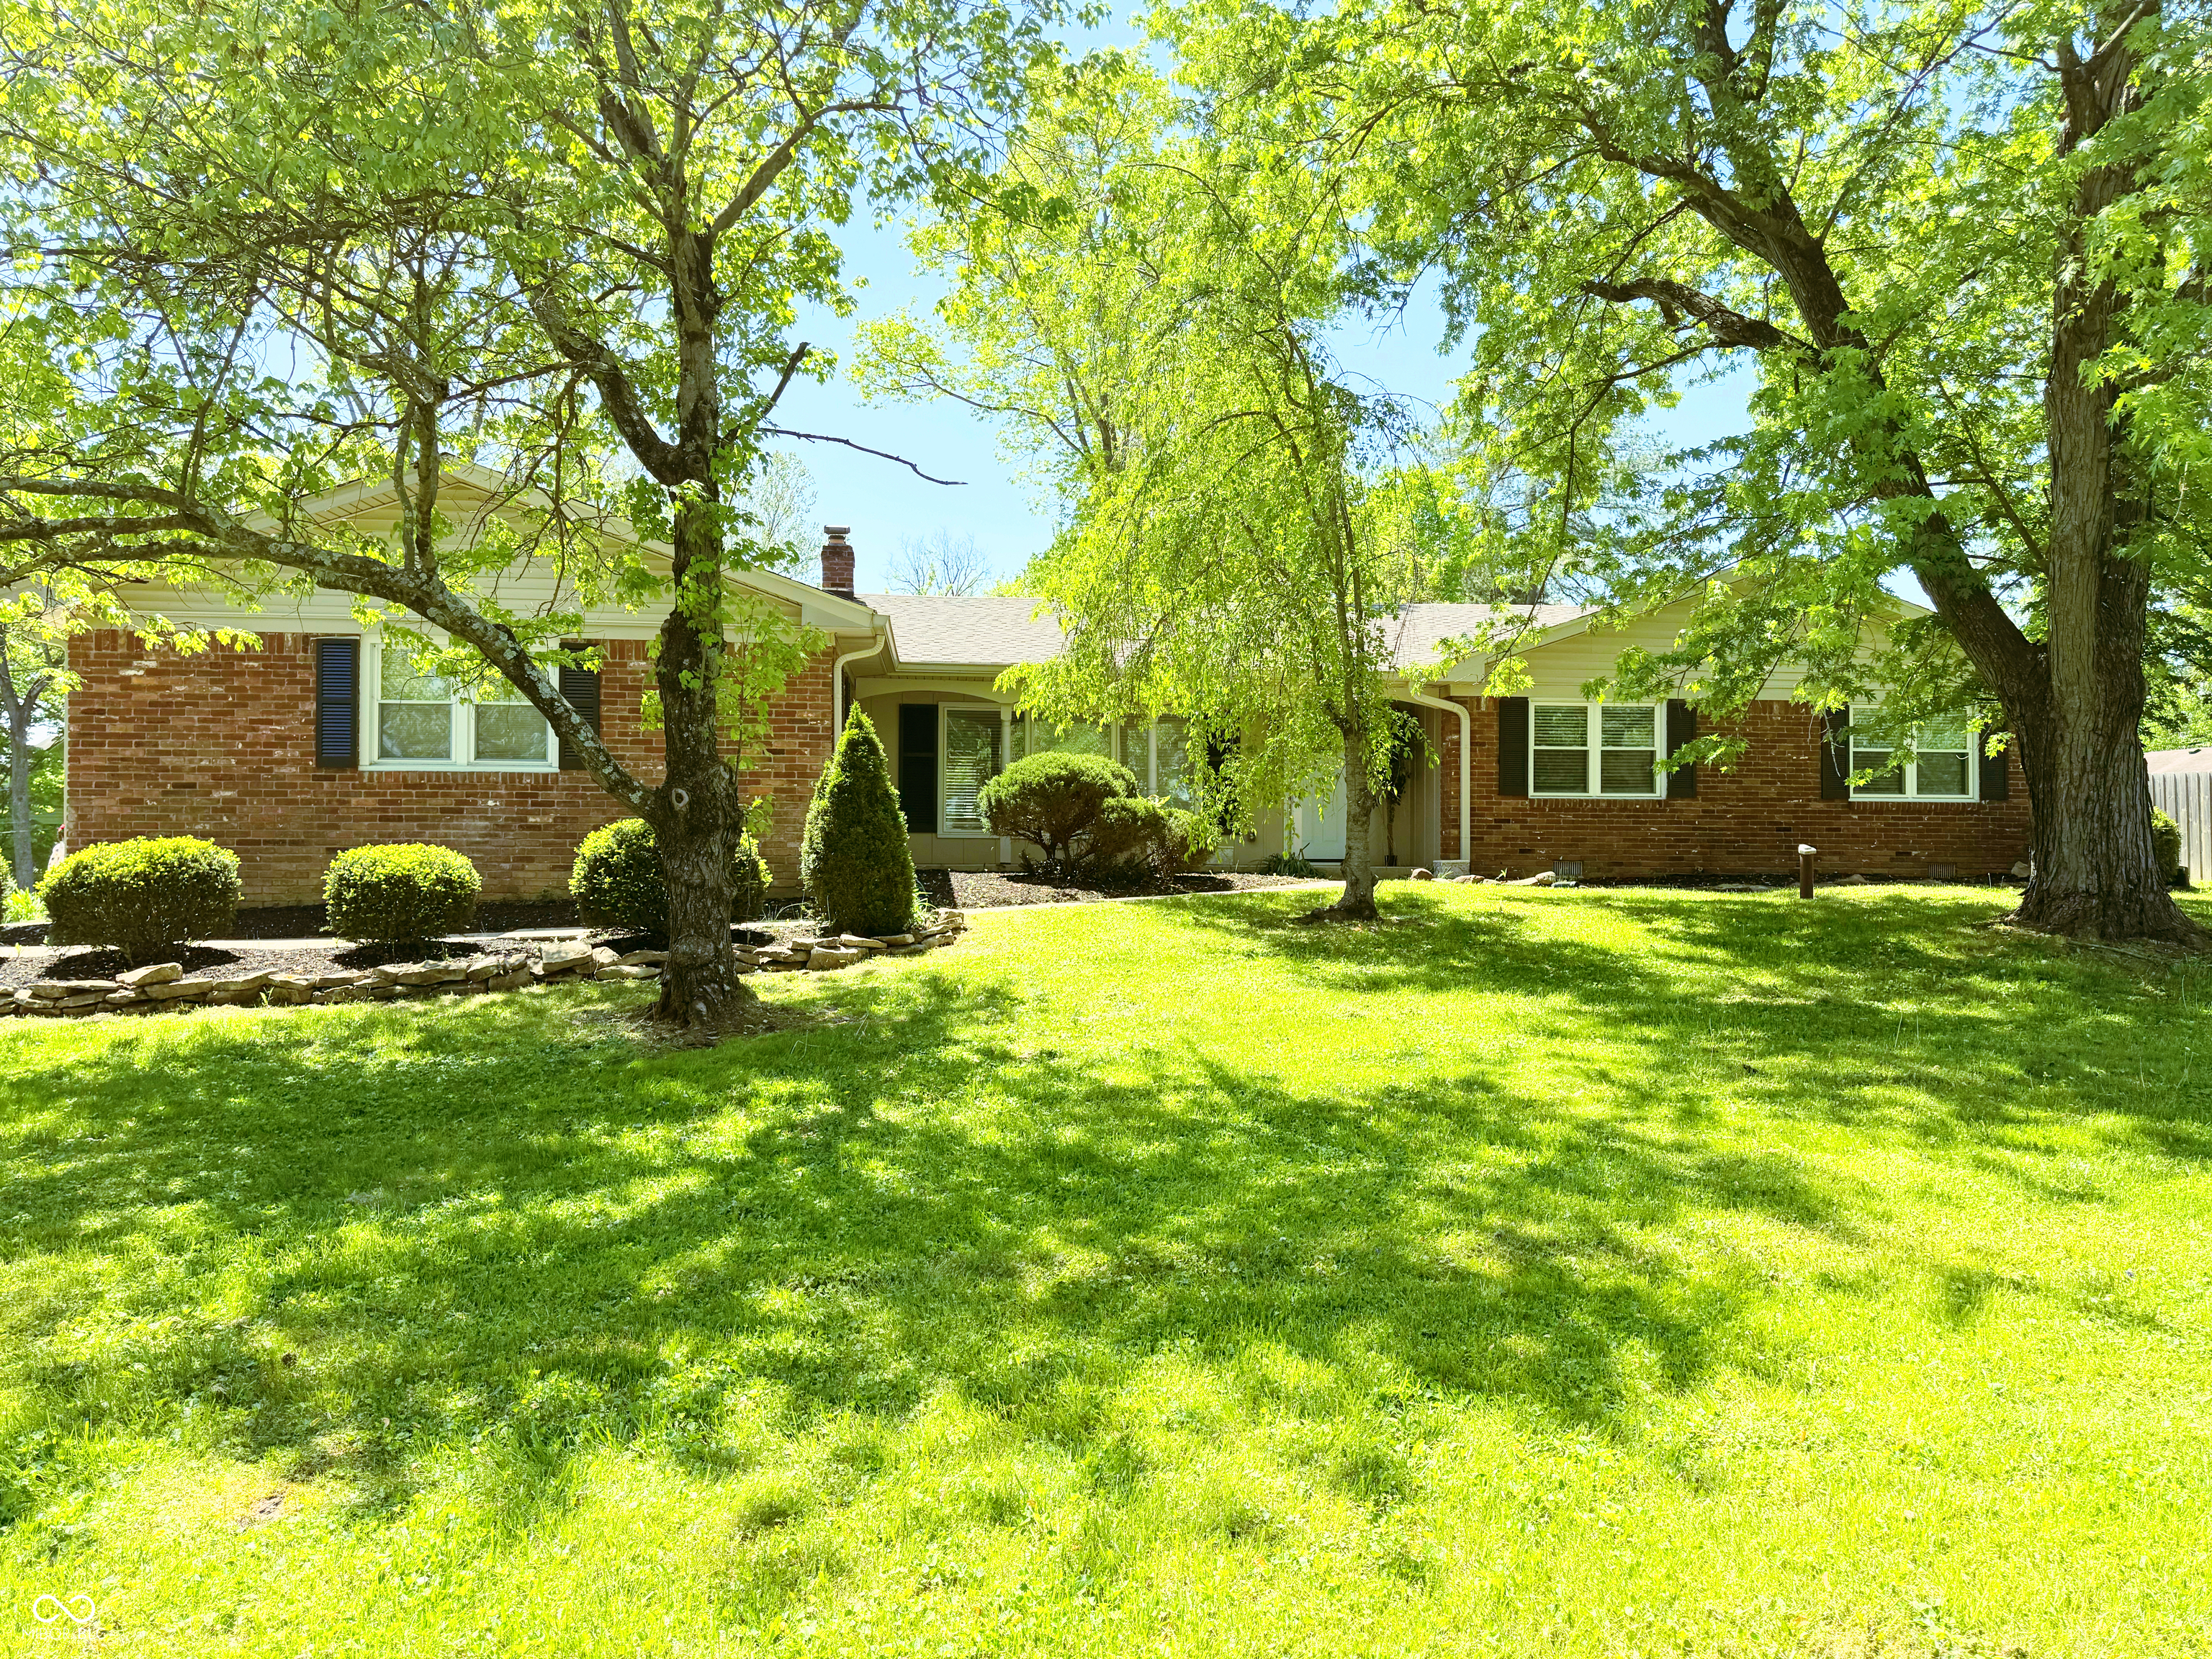
Active
$359,000
3
bds
|
3
ba
|
1,934
sqft
|
built
1962
8835 Briarclift Rd, Indianapolis, IN 46256
$-321
Cash flow
-4.7%
Cash-on-Cash Return
5.1%
Cap rate
0.6%
Rent to Value Ratio
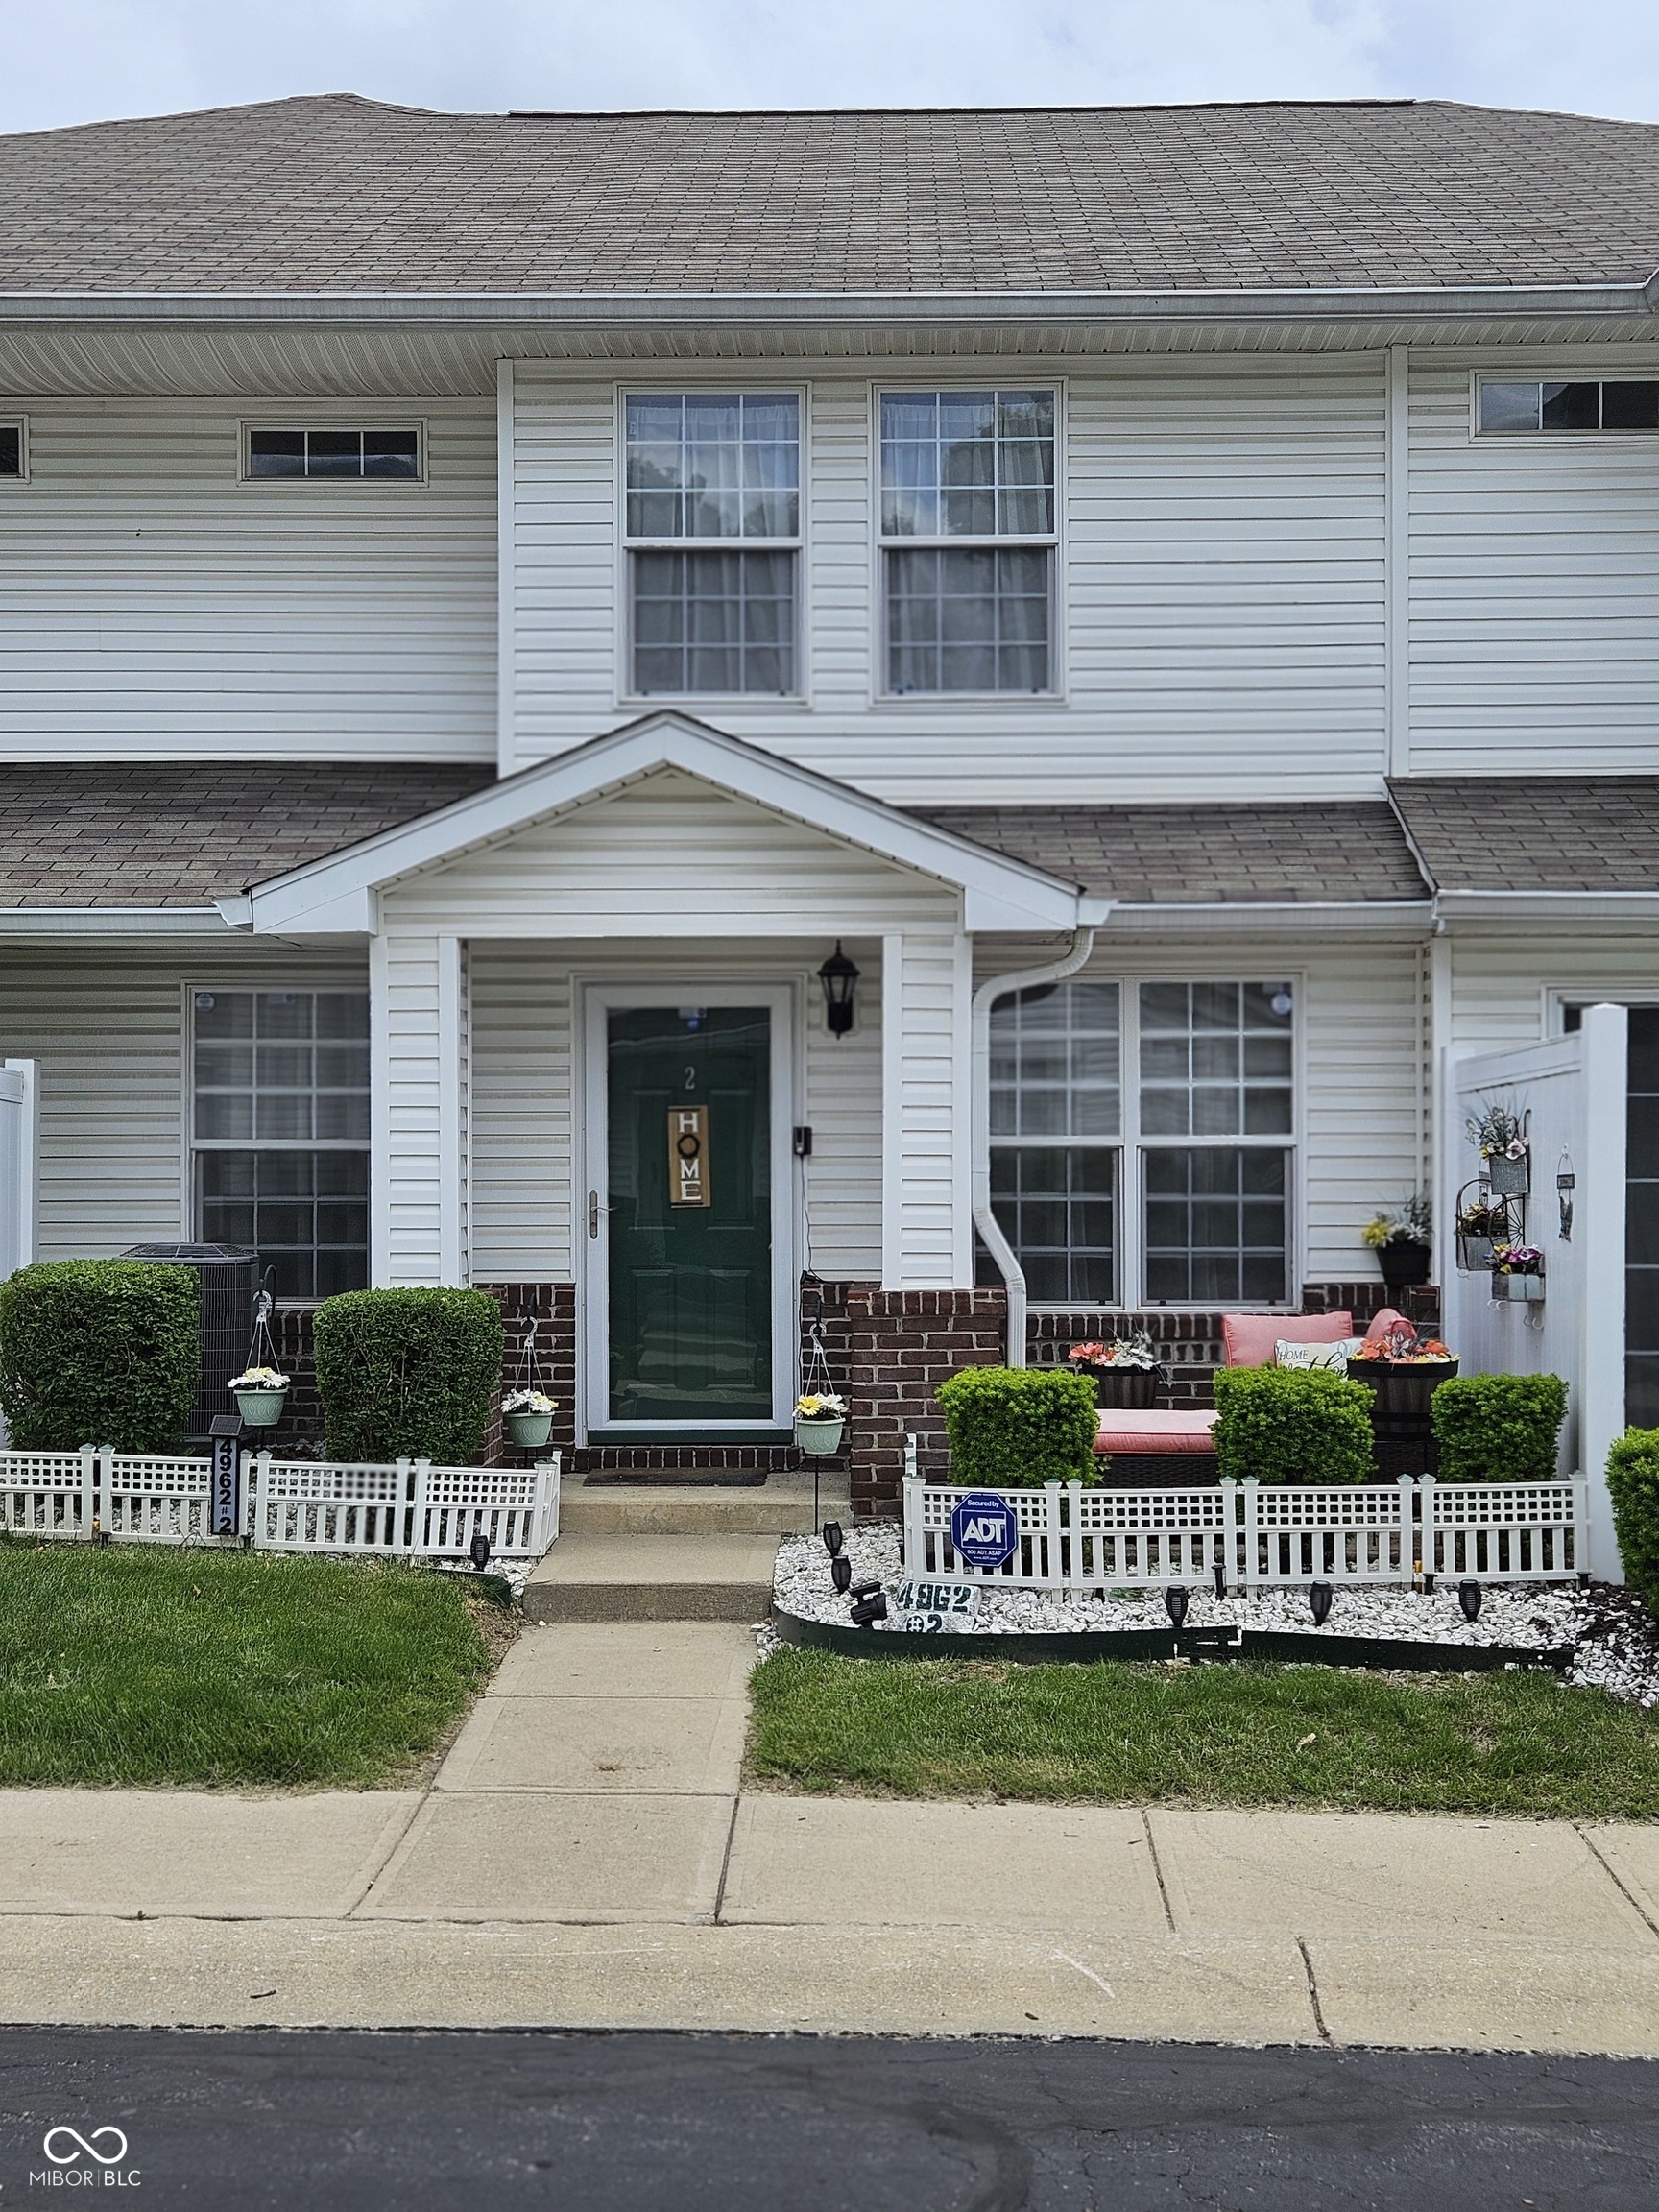
Active
$205,000
2
bds
|
3
ba
|
1,148
sqft
|
built
2003
4962 Potomac Square Pl, Indianapolis, IN 46268
$-155
Cash flow
-3.9%
Cash-on-Cash Return
5.2%
Cap rate
0.8%
Rent to Value Ratio
Active
$205,000
4
bds
|
2
ba
|
1,752
sqft
|
built
1930
1722 N Parker Ave, Indianapolis, IN 46218
$54
Cash flow
1.4%
Cash-on-Cash Return
6.5%
Cap rate
0.8%
Rent to Value Ratio
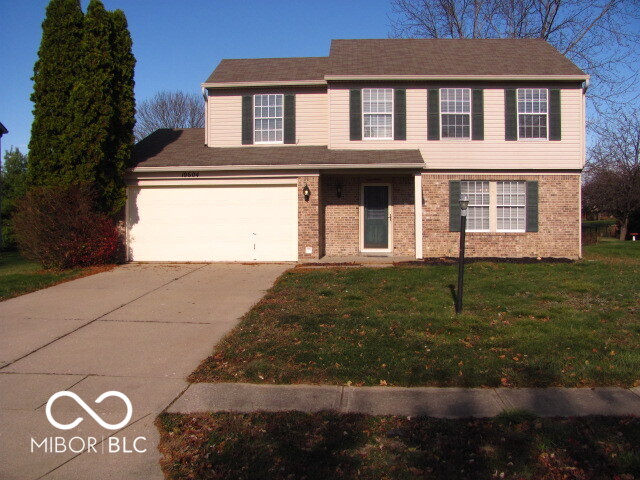
Active
$274,900
4
bds
|
3
ba
|
1,692
sqft
|
built
1991
10604 Creekside Woods Dr, Indianapolis, IN 46239
$-392
Cash flow
-7.4%
Cash-on-Cash Return
4.4%
Cap rate
0.5%
Rent to Value Ratio
Active
$359,900
4
bds
|
2
ba
|
2,544
sqft
|
built
2014
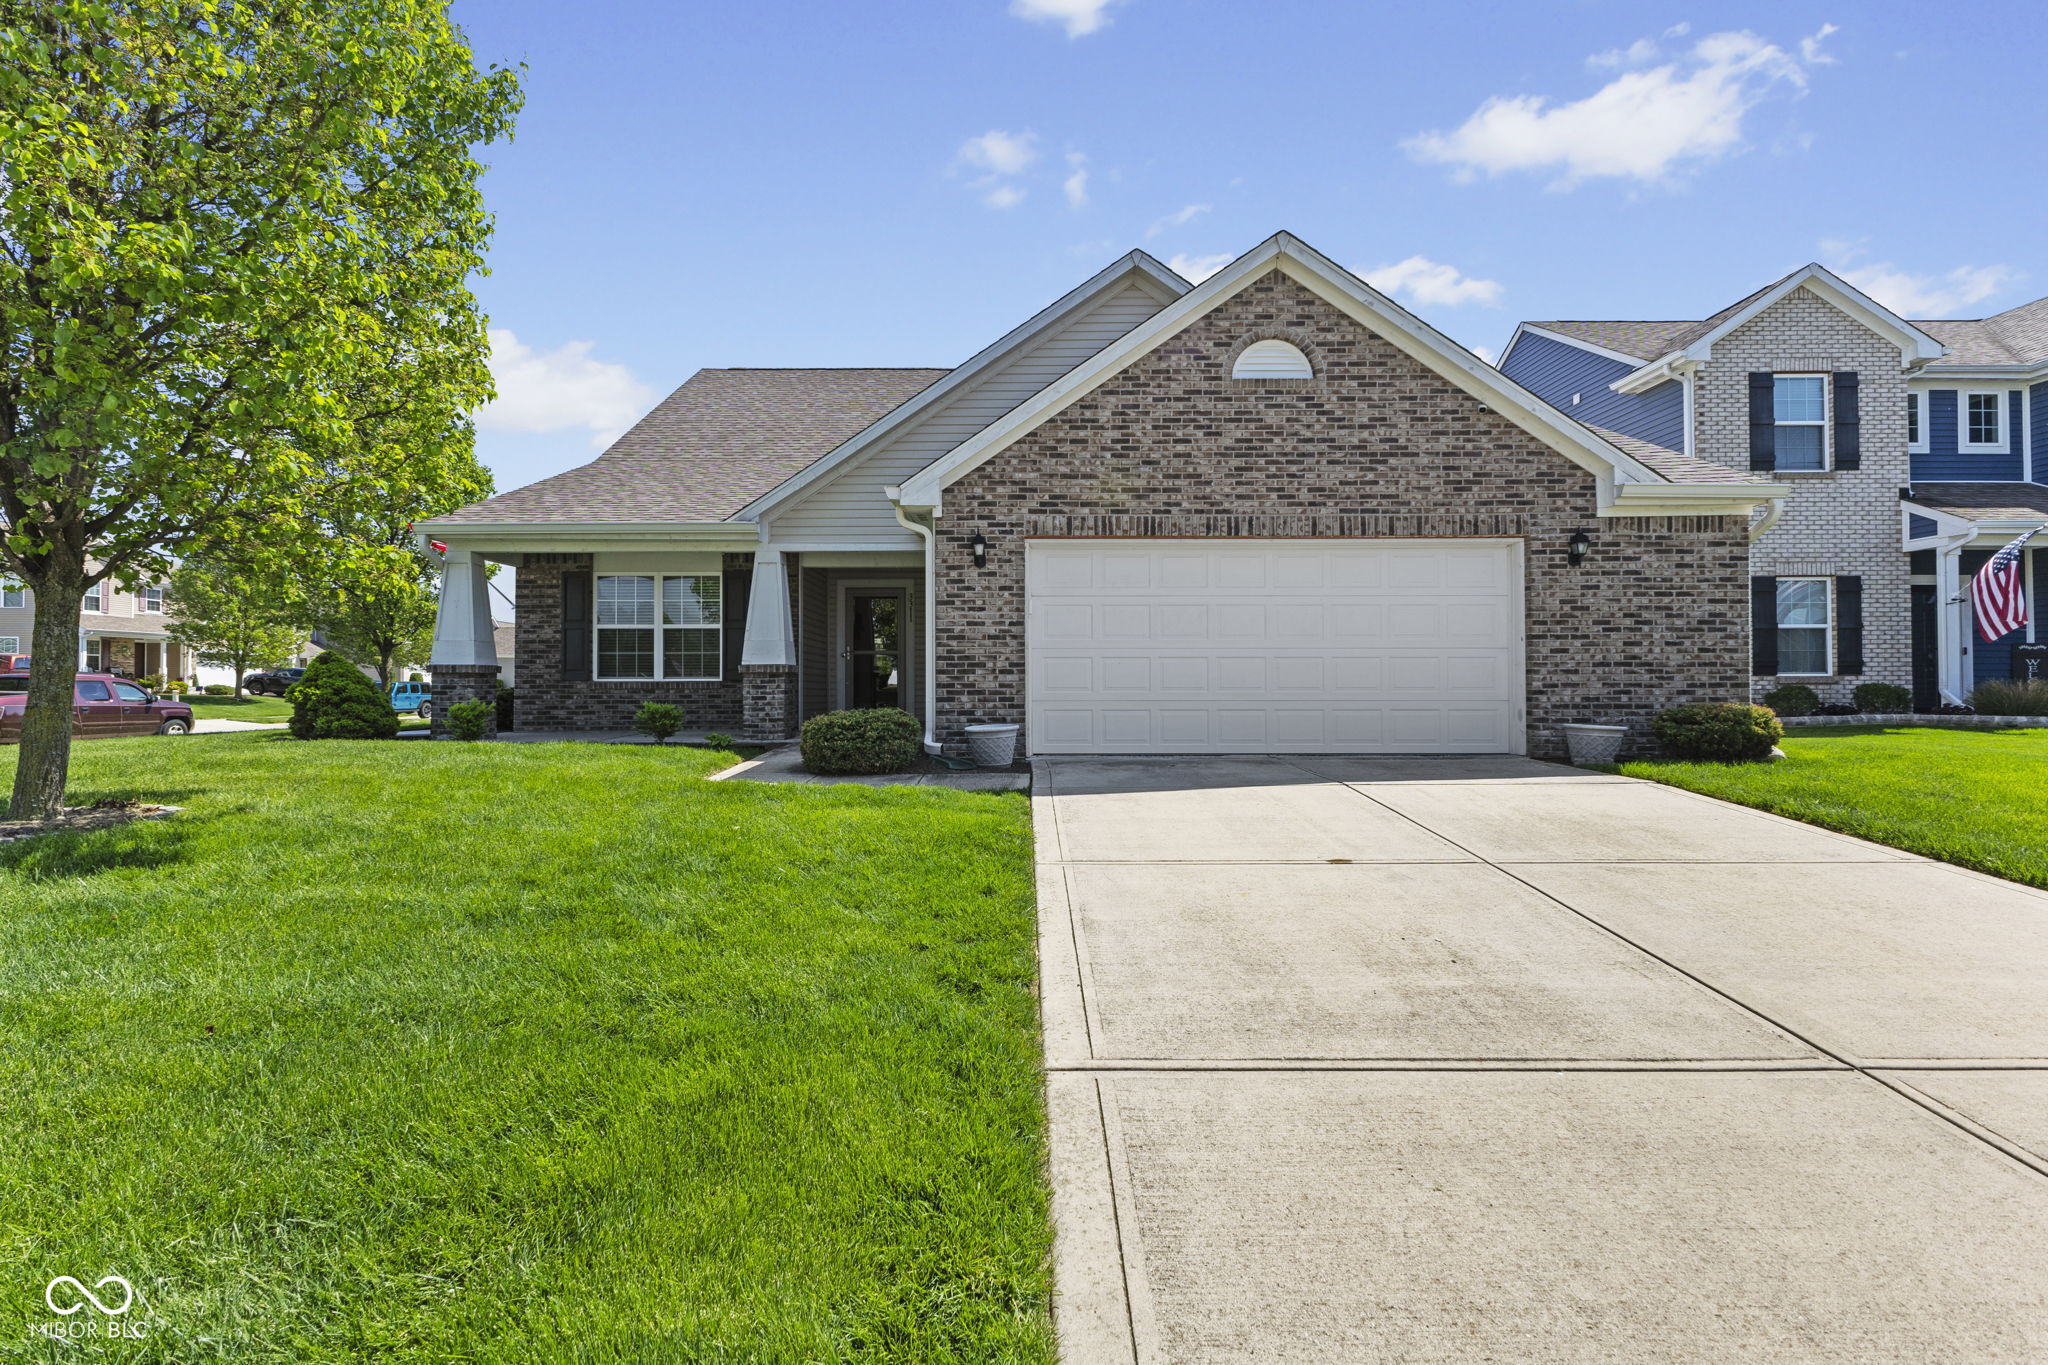
3311 Stoddard Pl, Indianapolis, IN 46217
$-374
Cash flow
-5.4%
Cash-on-Cash Return
4.9%
Cap rate
0.6%
Rent to Value Ratio
Active
$219,900
3
bds
|
2
ba
|
1,368
sqft
|
built
1959
8230 E 11th St, Indianapolis, IN 46219
$-22
Cash flow
-0.5%
Cash-on-Cash Return
6.0%
Cap rate
0.7%
Rent to Value Ratio
Active
$212,000
2
bds
|
2
ba
|
838
sqft
|
built
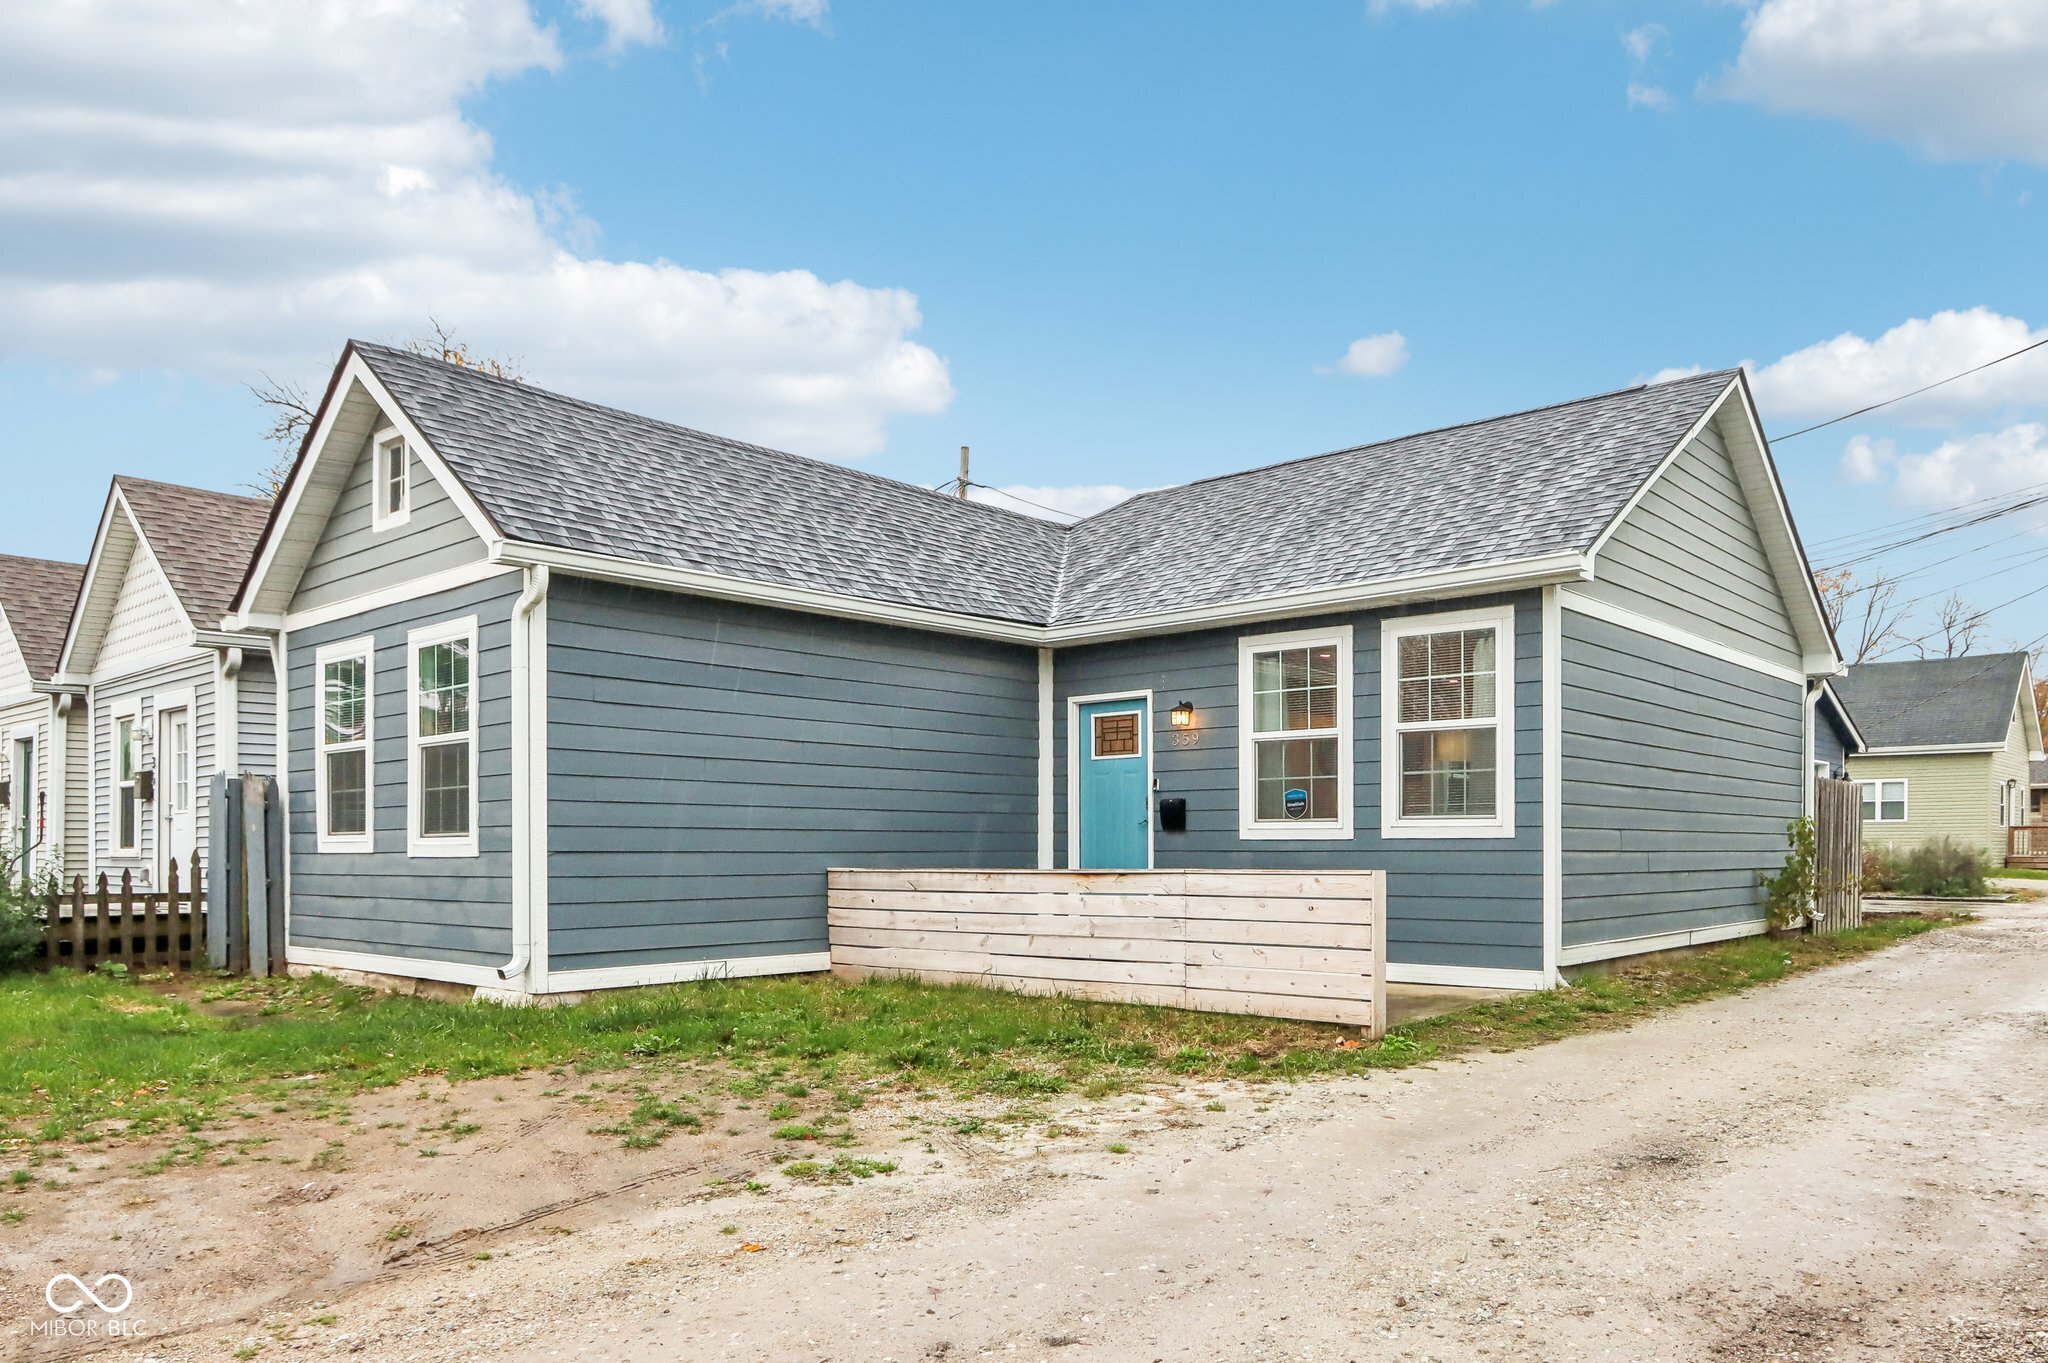
2019
359 Terrace Ave, Indianapolis, IN 46225
$18
Cash flow
0.4%
Cash-on-Cash Return
6.2%
Cap rate
0.8%
Rent to Value Ratio
Active
$375,000
4
bds
|
3
ba
|
2,980
sqft
|
built
2020
5303 Rum Cherry Way, Indianapolis, IN 46237
$-168
Cash flow
-2.3%
Cash-on-Cash Return
5.6%
Cap rate
0.7%
Rent to Value Ratio