Indianapolis, IN Investment Properties for Sale
Browse homes for sale and investment properties in Indianapolis, IN. Refine your search by price, property type, or more.
Best cash flowing properties in Indianapolis, IN
Active
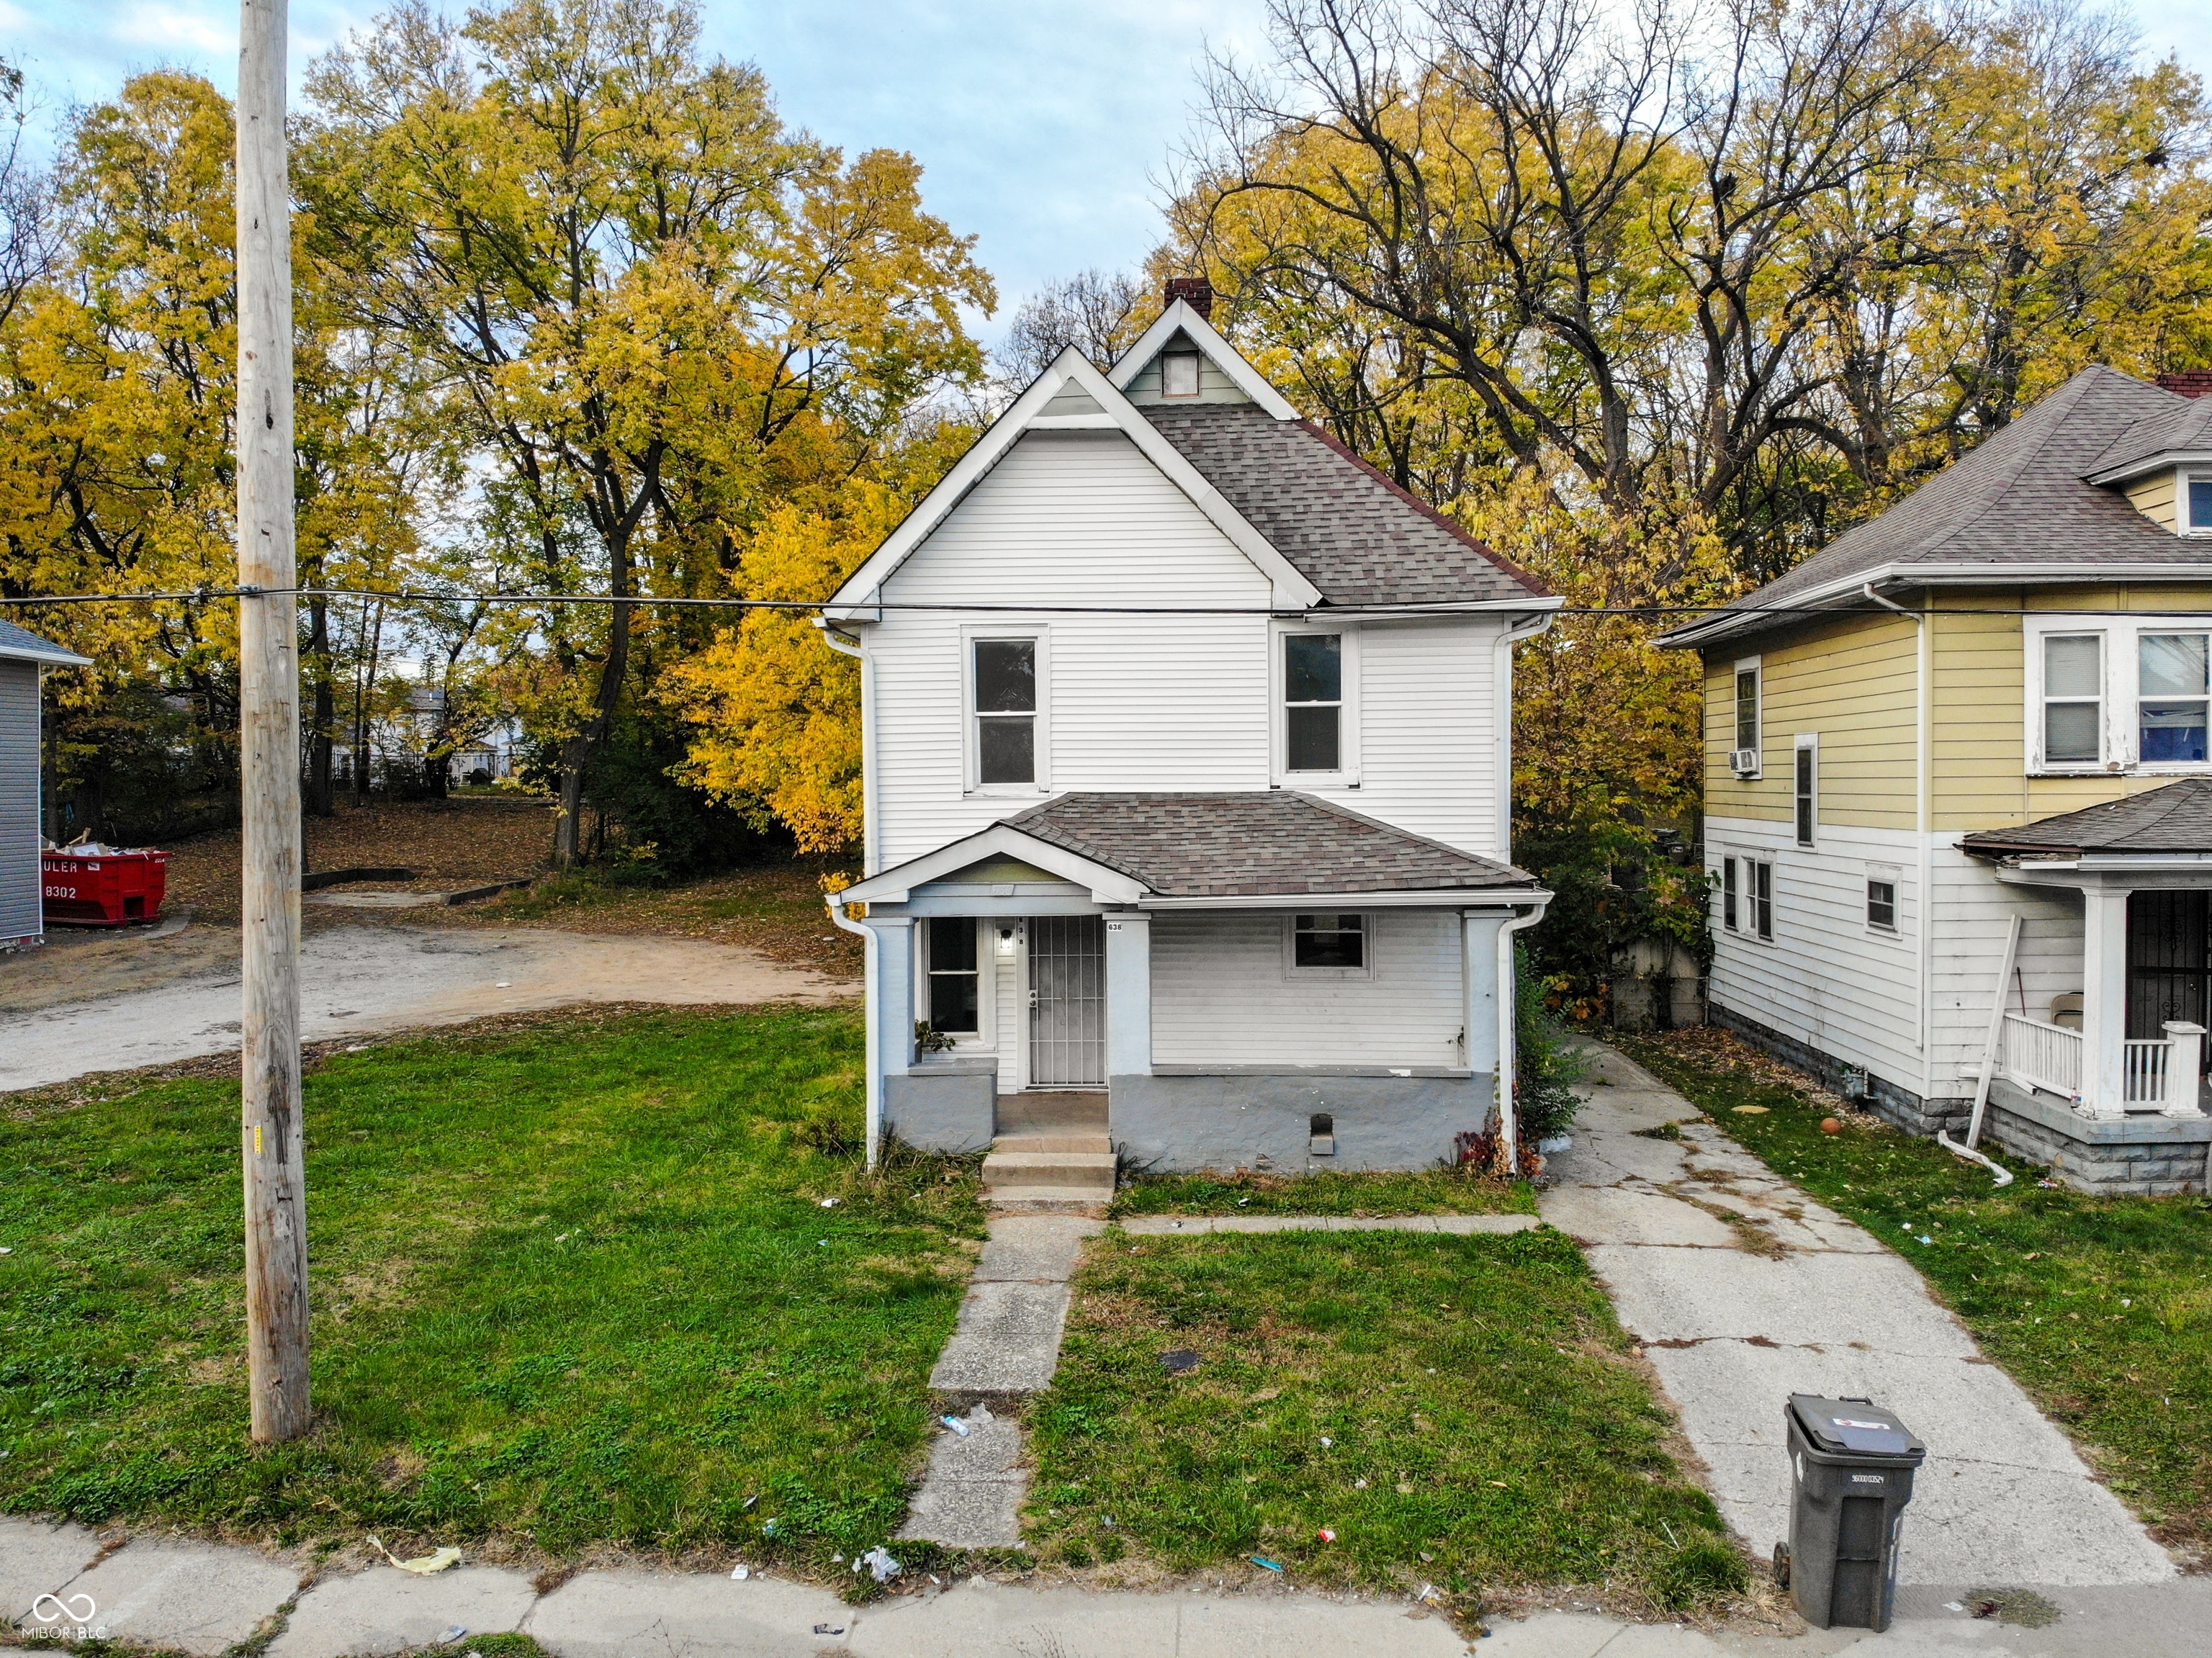
$165,000
3
bds
|
1
ba
|
1,344
sqft
|
built
1920
638 W 30th St, Indianapolis, IN 46208
$259
Cash flow
8.2%
Cash-on-Cash Return
8.0%
Cap rate
1.0%
Rent to Value Ratio
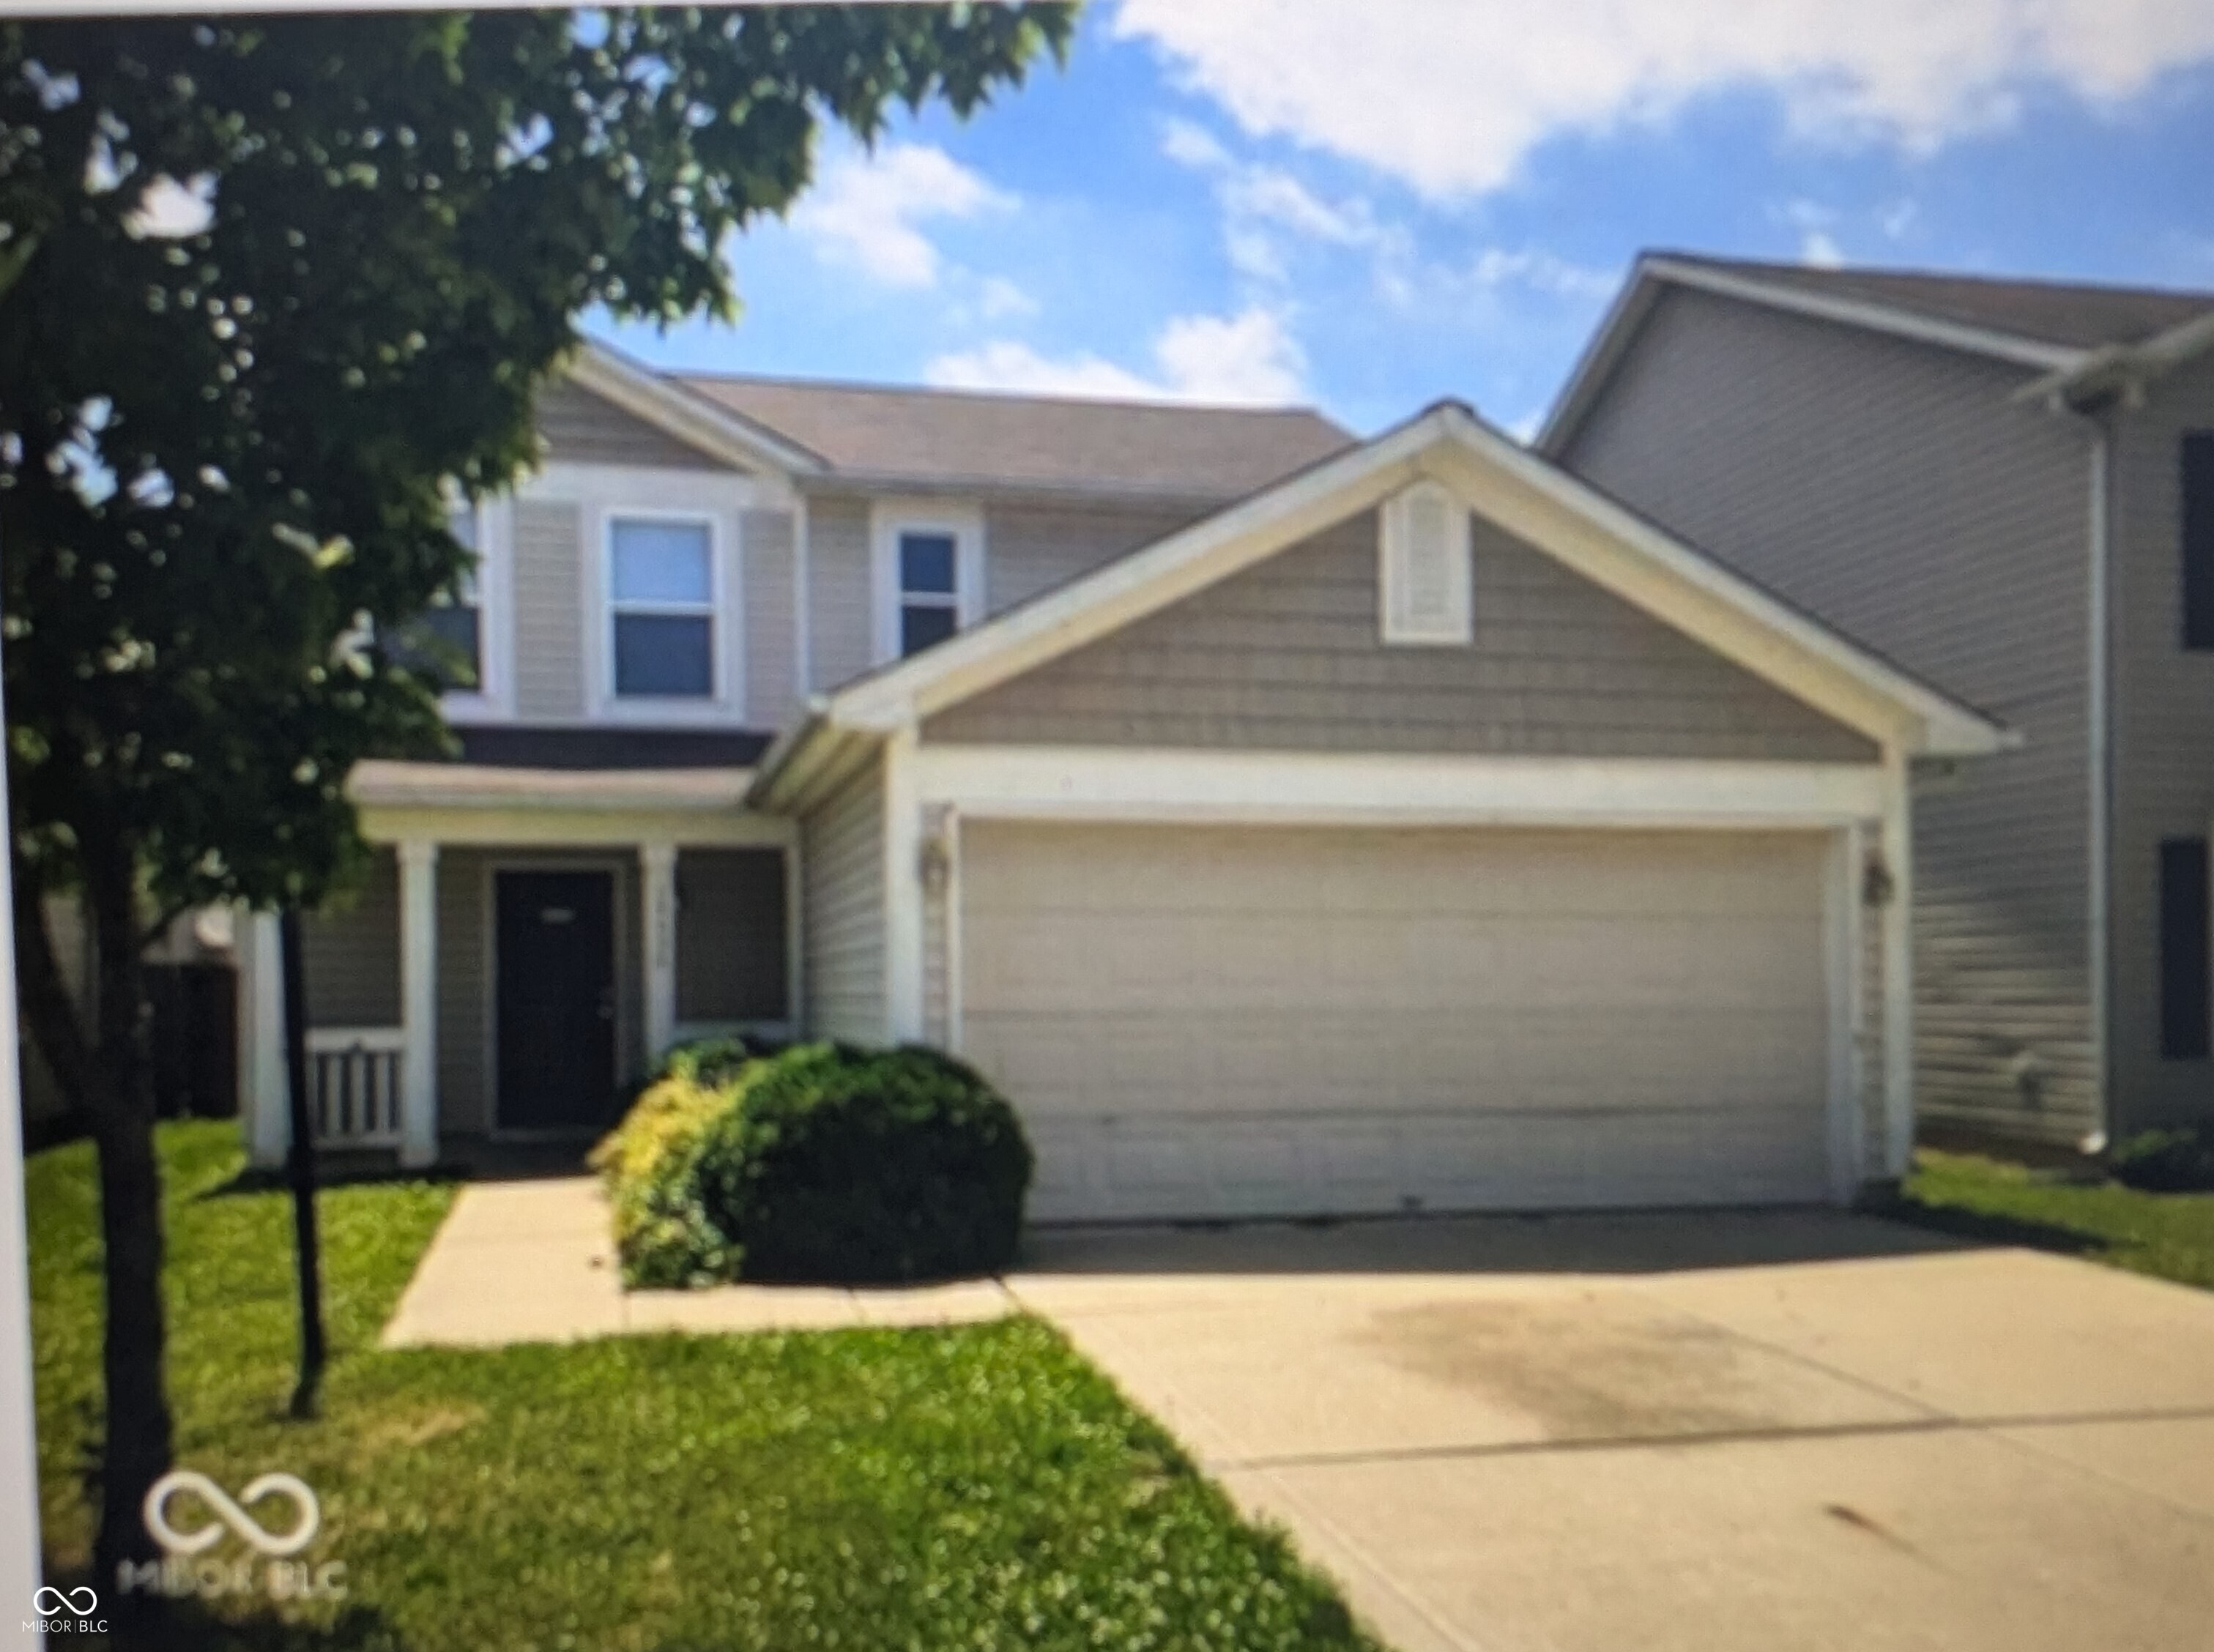
Active
$219,000
3
bds
|
3
ba
|
1,440
sqft
|
built
2006
10425 Candy Apple Ln, Indianapolis, IN 46235
$258
Cash flow
6.1%
Cash-on-Cash Return
7.6%
Cap rate
0.9%
Rent to Value Ratio
2,003 out of 2,145 properties for sale in Indianapolis, IN
Limited Results Shown
Create a free account, or log in to reveal all property listings and enjoy the complete experience.
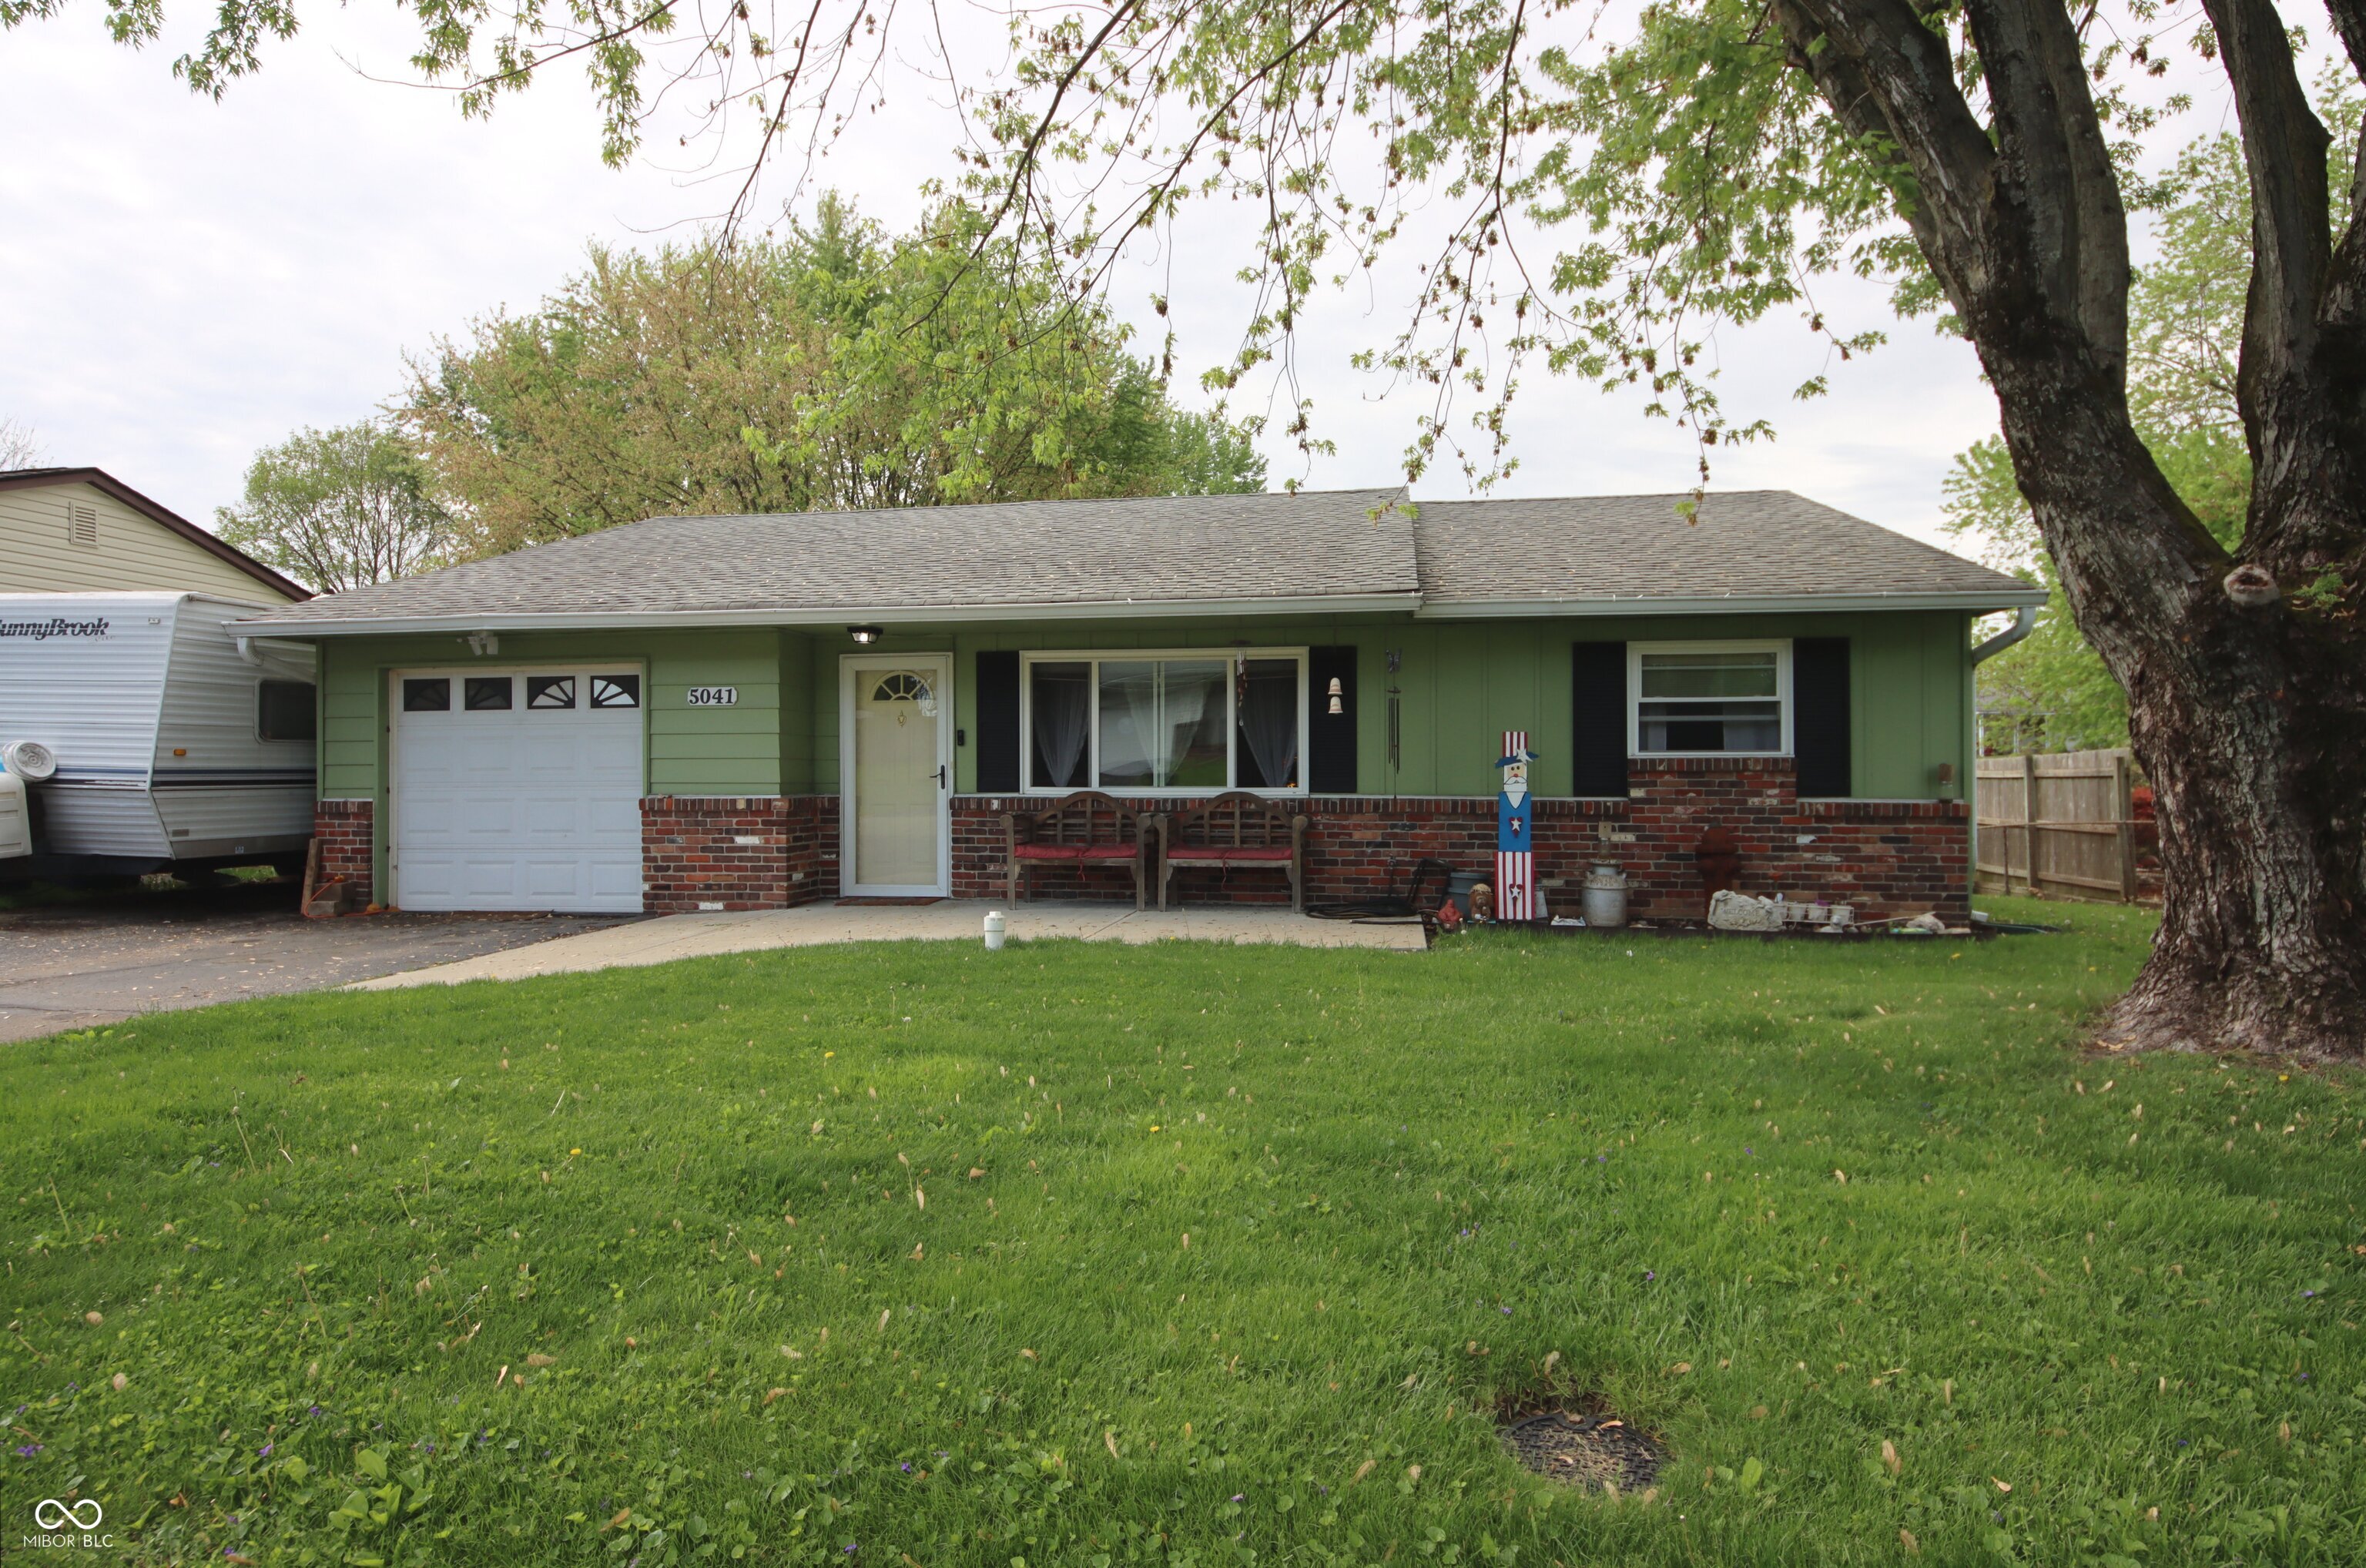
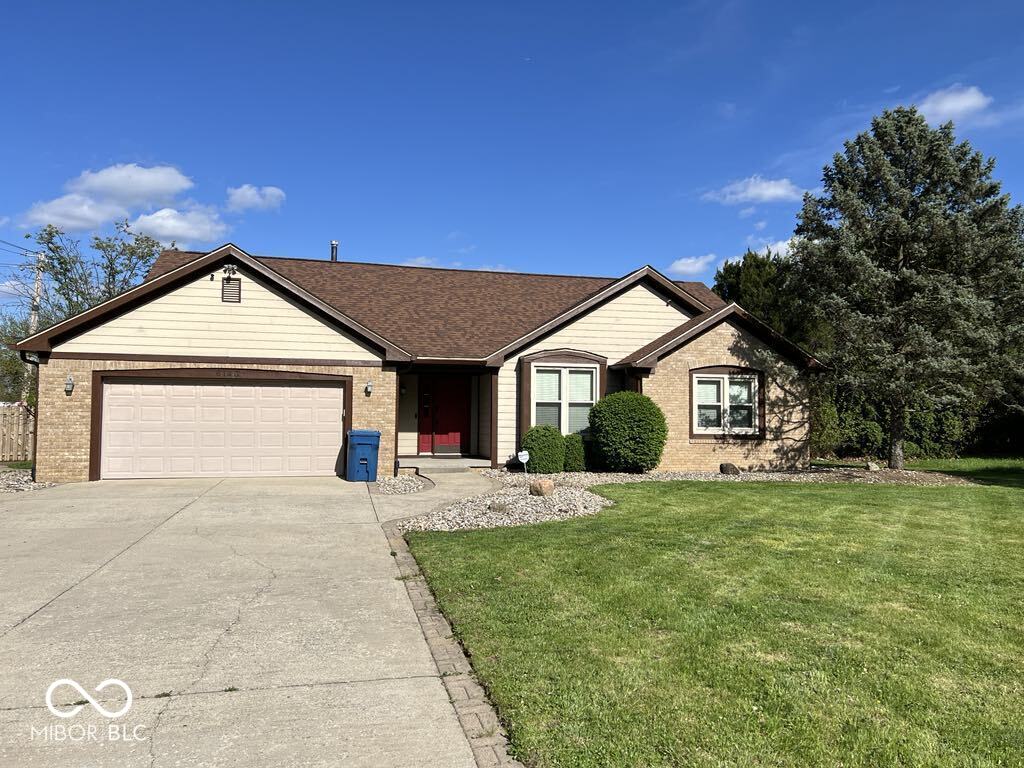
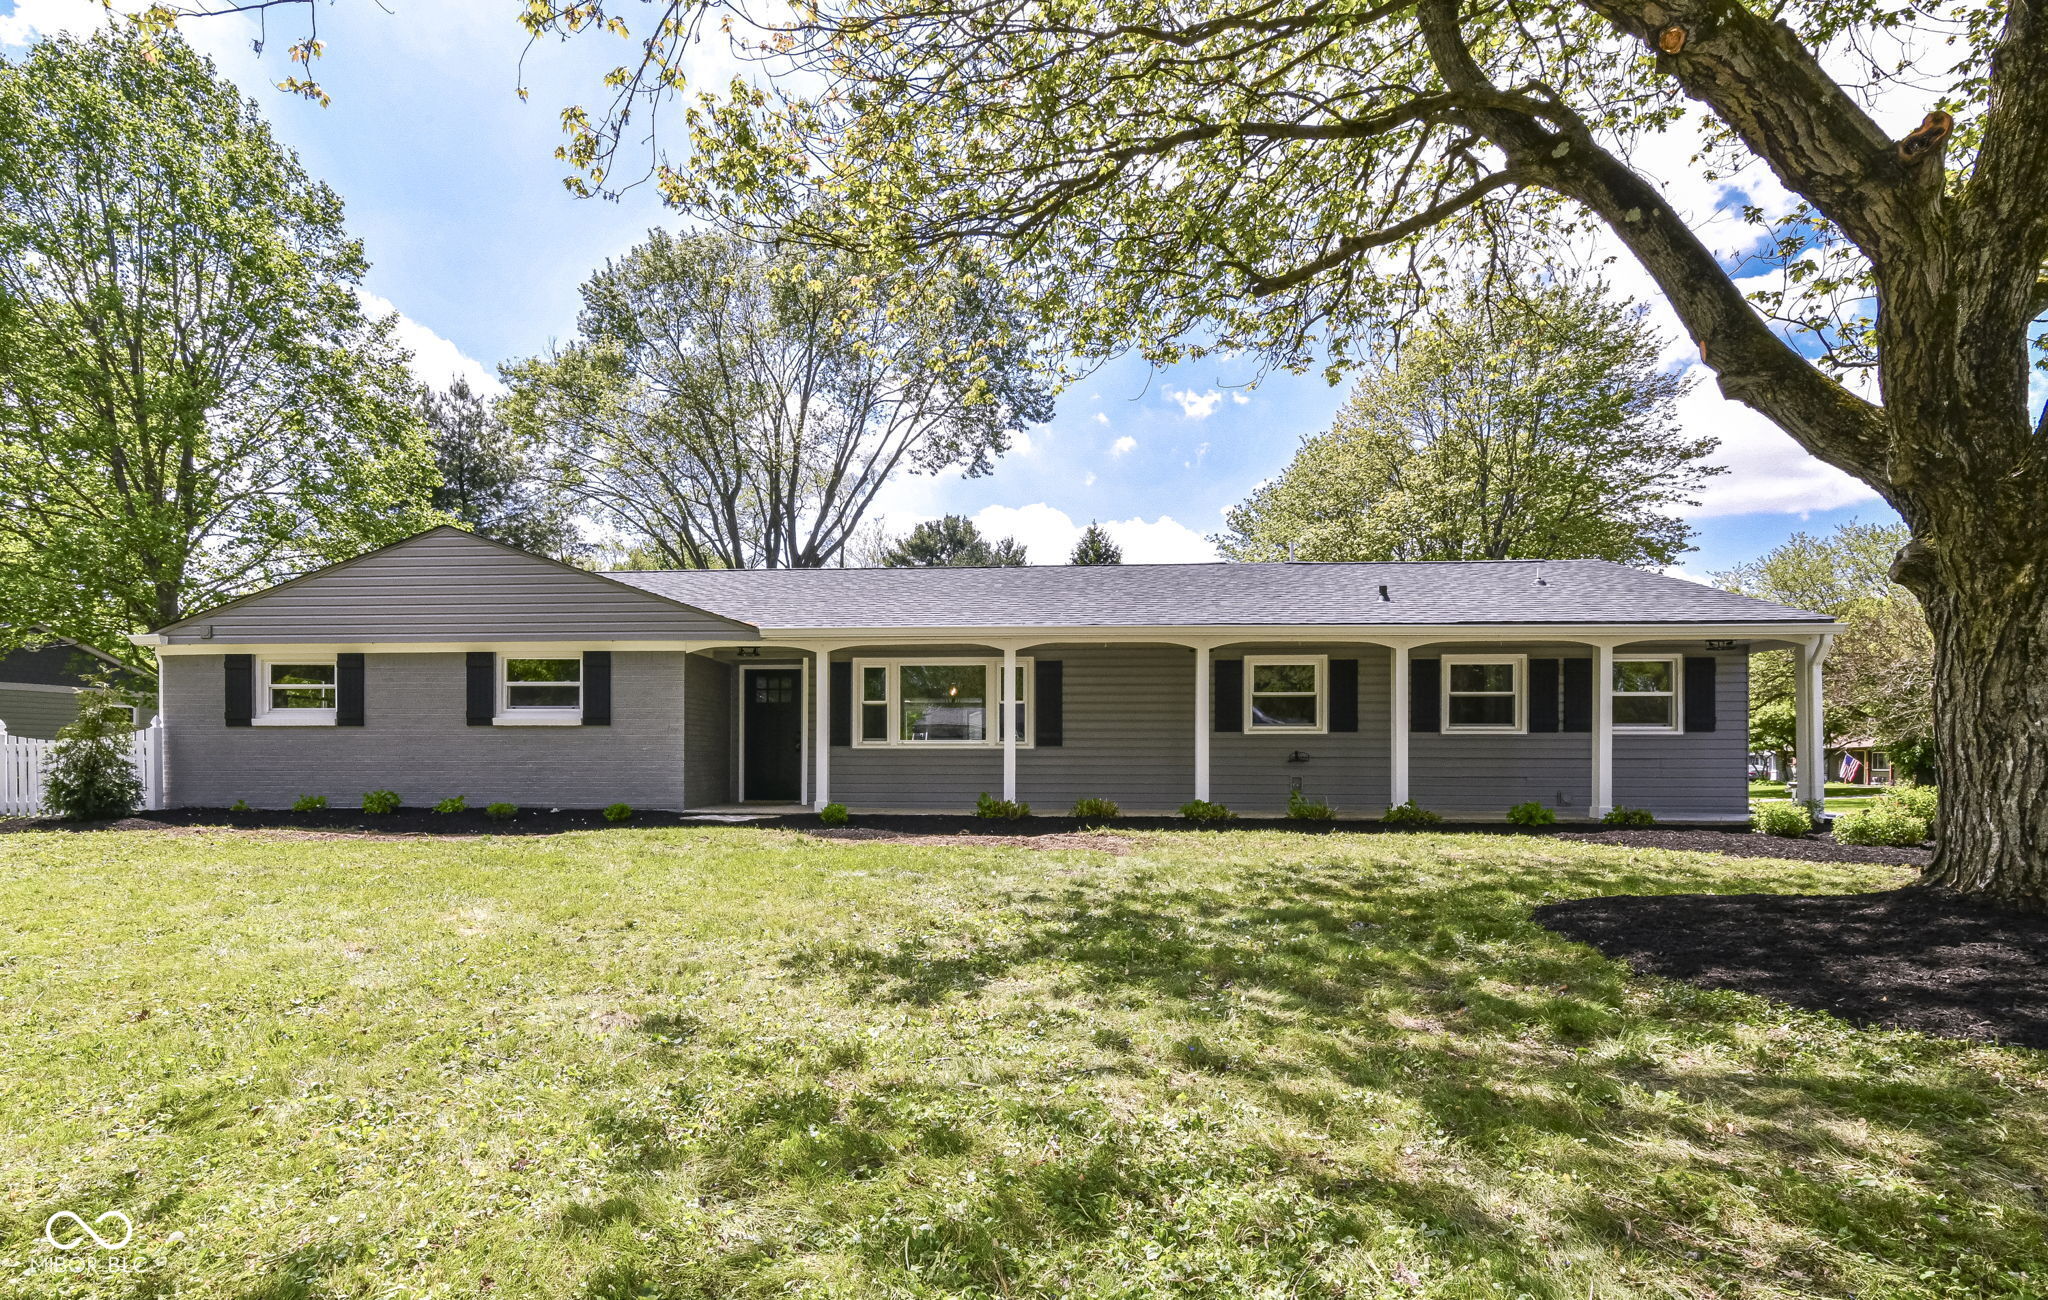
Active
$232,000
4
bds
|
1
ba
|
1,424
sqft
|
built
1973
5041 Norcroft Dr, Indianapolis, IN 46221
$-84
Cash flow
-1.9%
Cash-on-Cash Return
5.7%
Cap rate
0.7%
Rent to Value Ratio
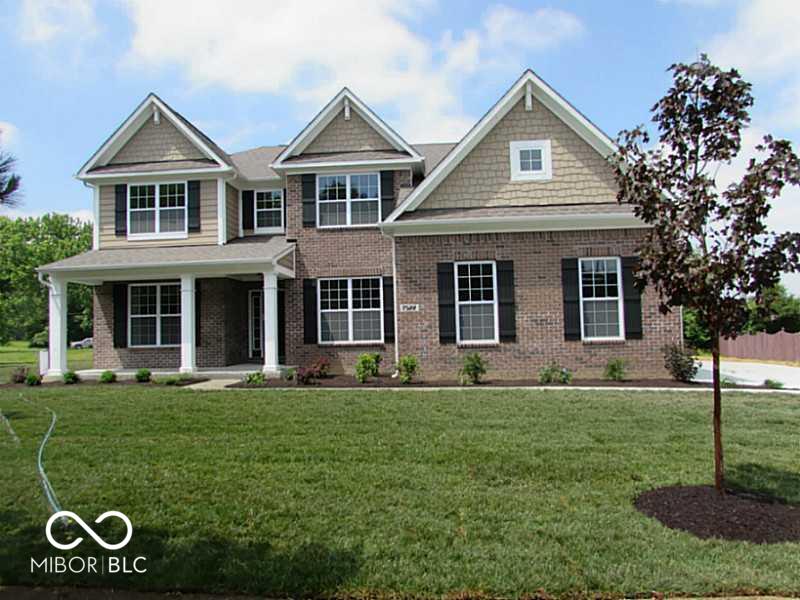
Active
$680,000
6
bds
|
5
ba
|
4,828
sqft
|
built
2014
7522 Timberfield Ln, Indianapolis, IN 46259
$-1,024
Cash flow
-7.9%
Cash-on-Cash Return
4.3%
Cap rate
0.5%
Rent to Value Ratio
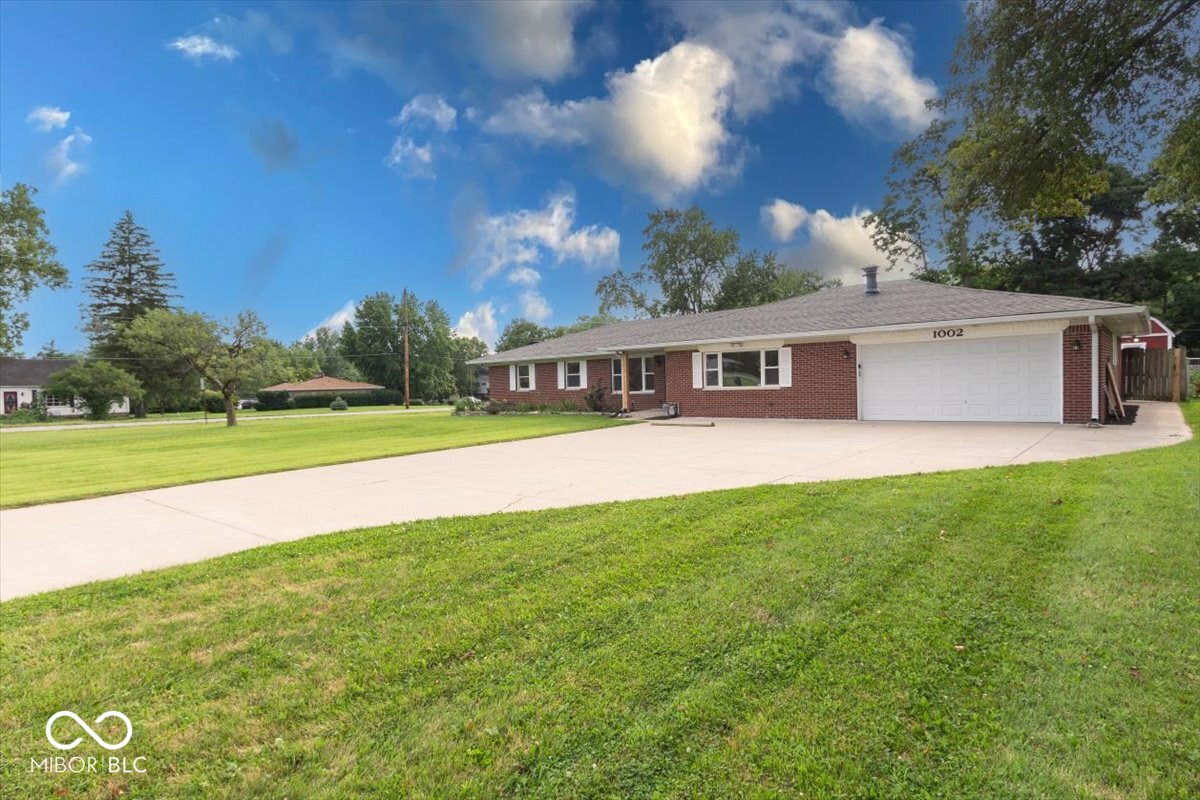
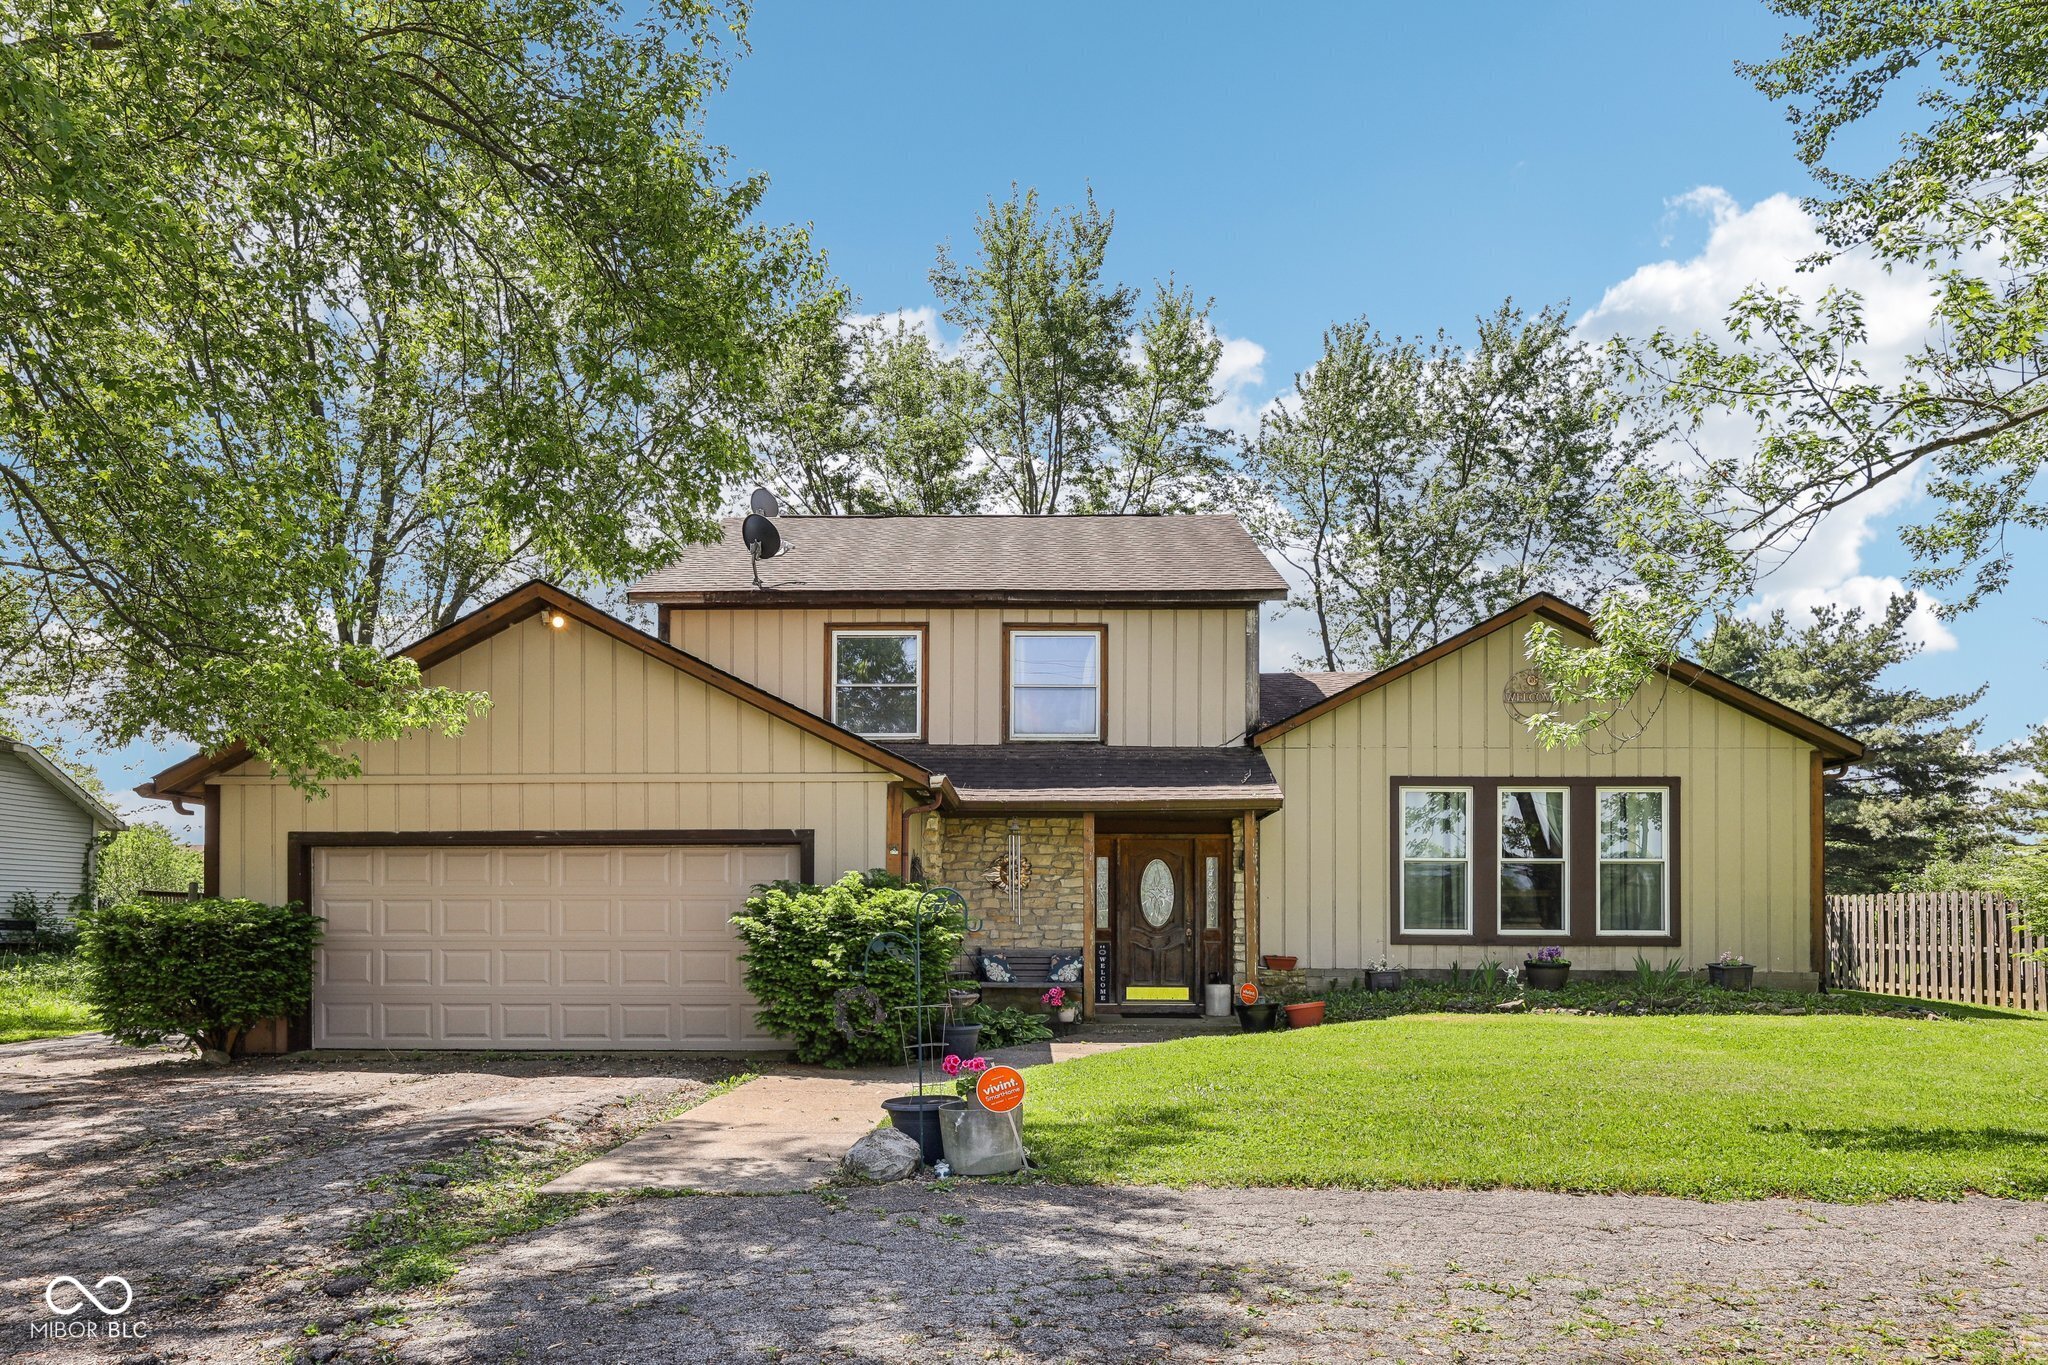
Active
$329,900
3
bds
|
3
ba
|
2,079
sqft
|
built
1956
1002 Payton Ave, Indianapolis, IN 46219
$-172
Cash flow
-2.7%
Cash-on-Cash Return
5.5%
Cap rate
0.7%
Rent to Value Ratio
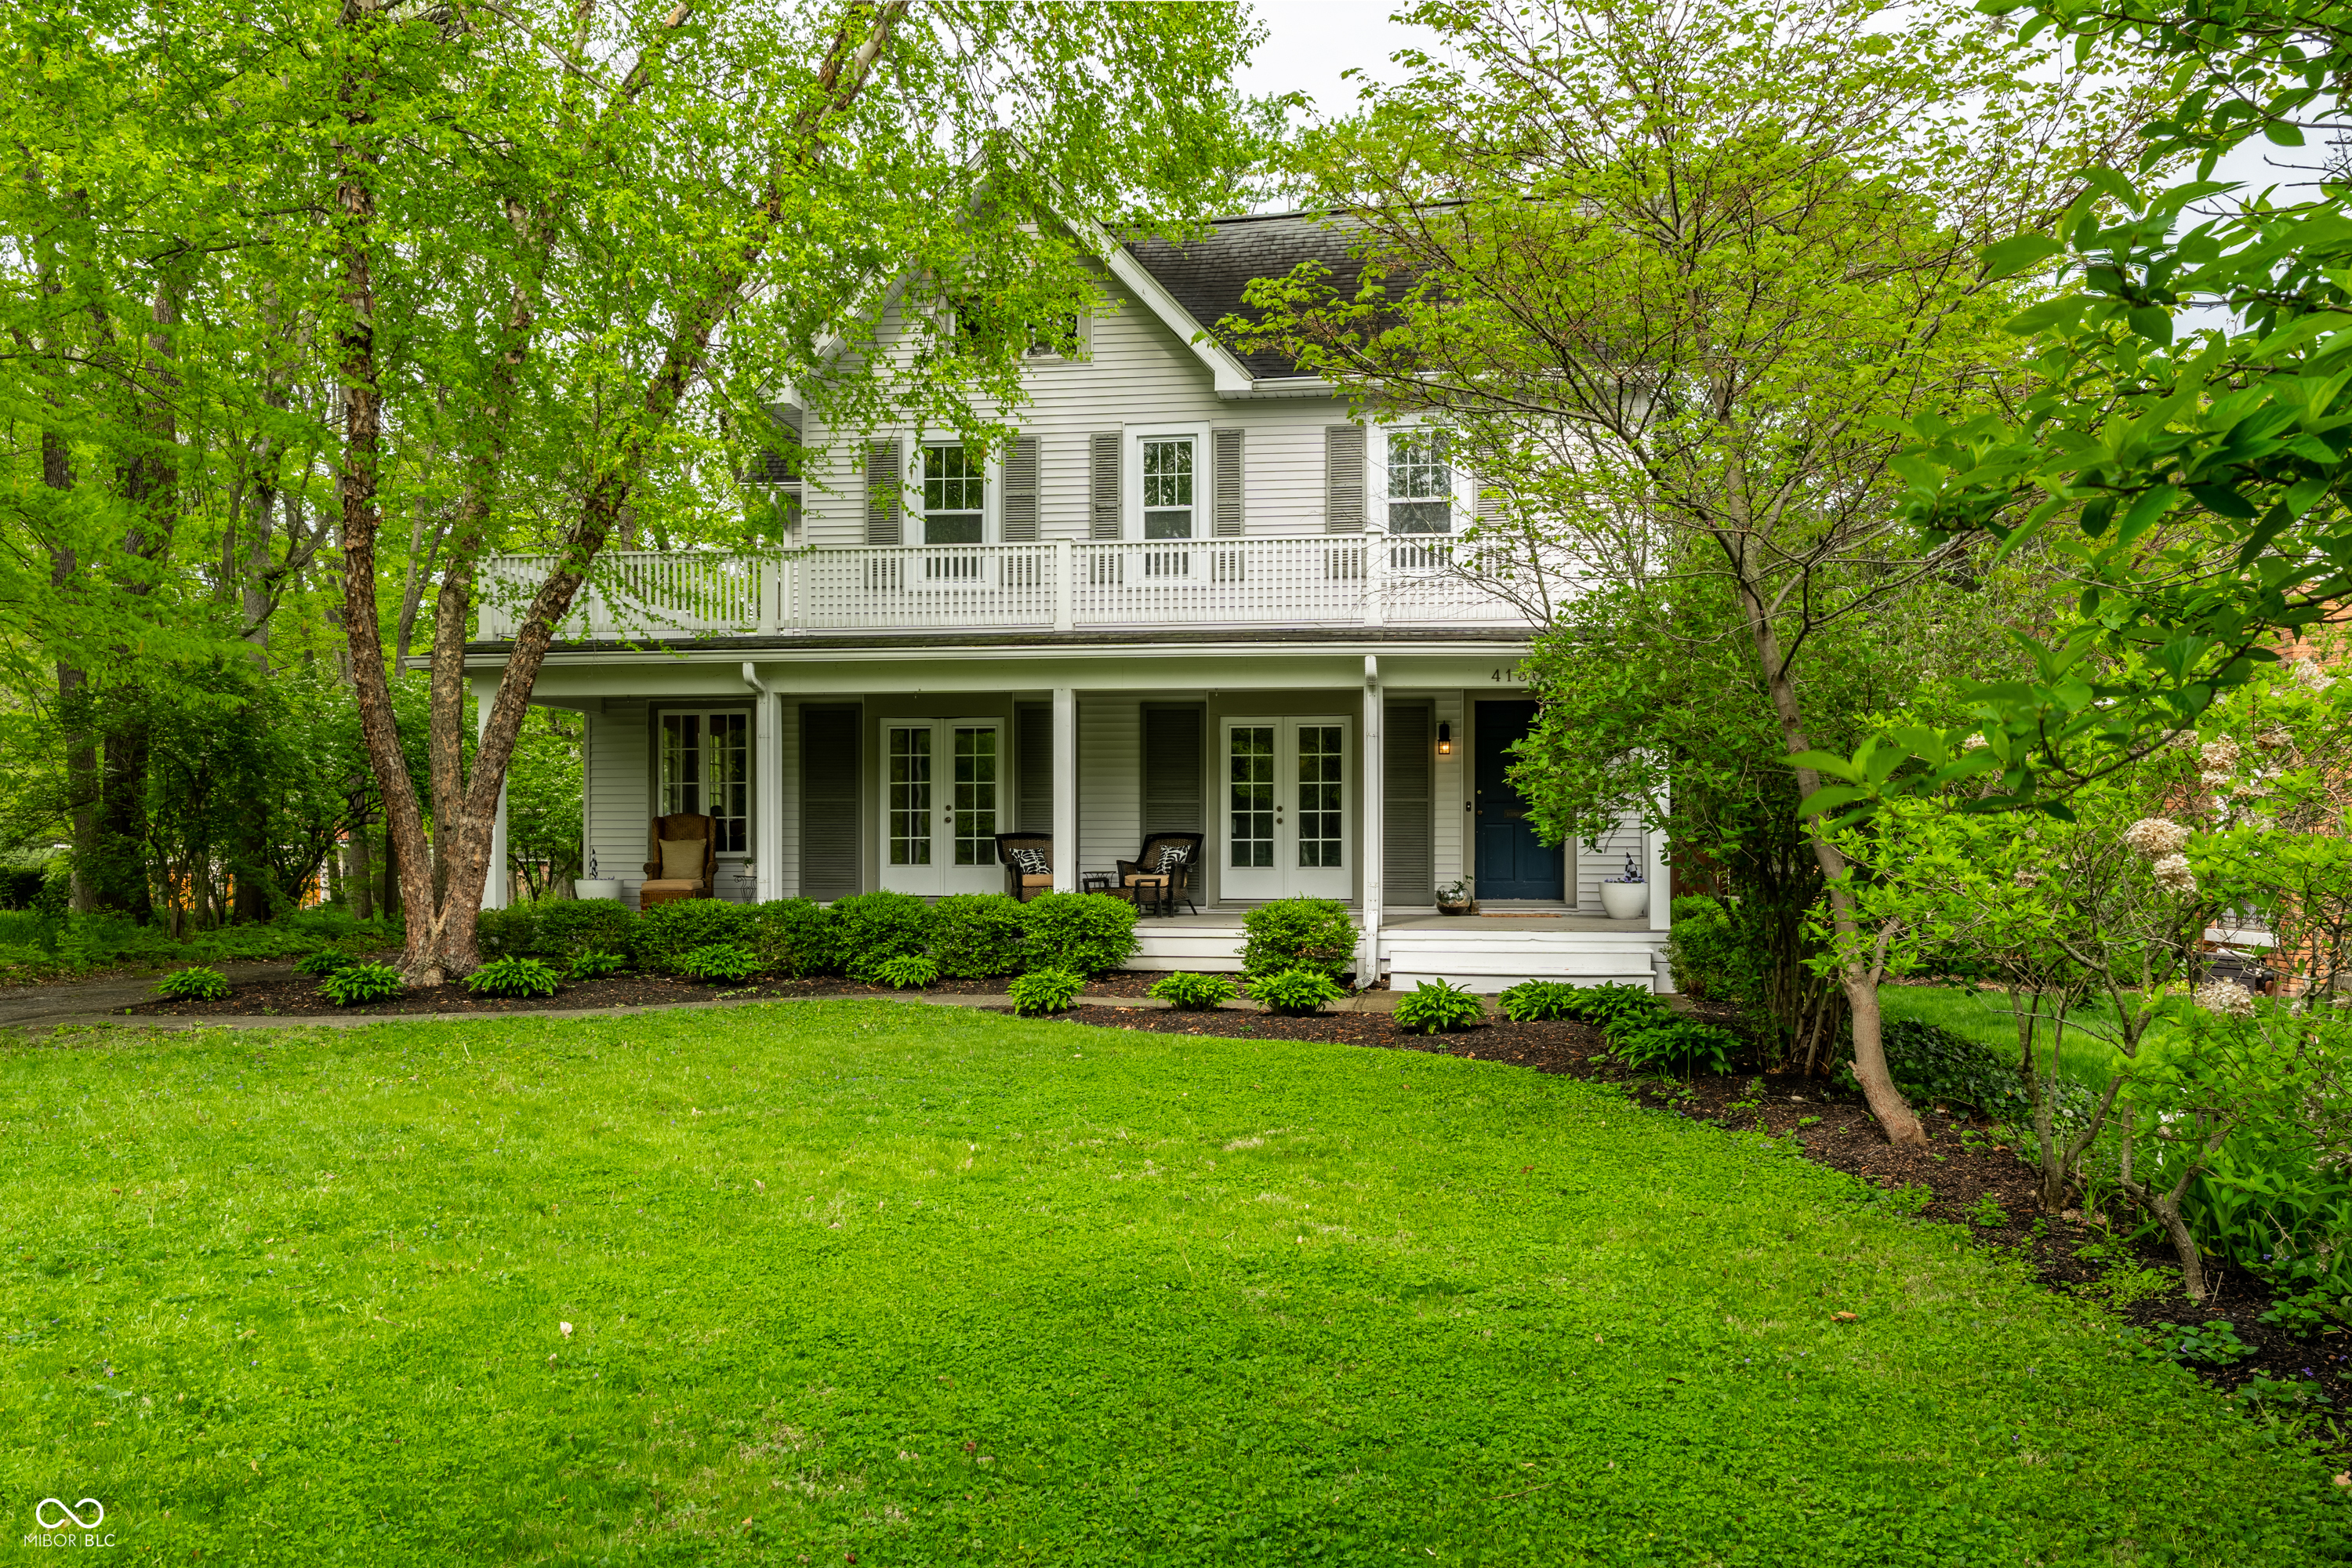
Active
$825,000
4
bds
|
4
ba
|
3,198
sqft
|
built
1890
4130 N Meridian St, Indianapolis, IN 46208
$-1,535
Cash flow
-9.7%
Cash-on-Cash Return
3.9%
Cap rate
0.5%
Rent to Value Ratio
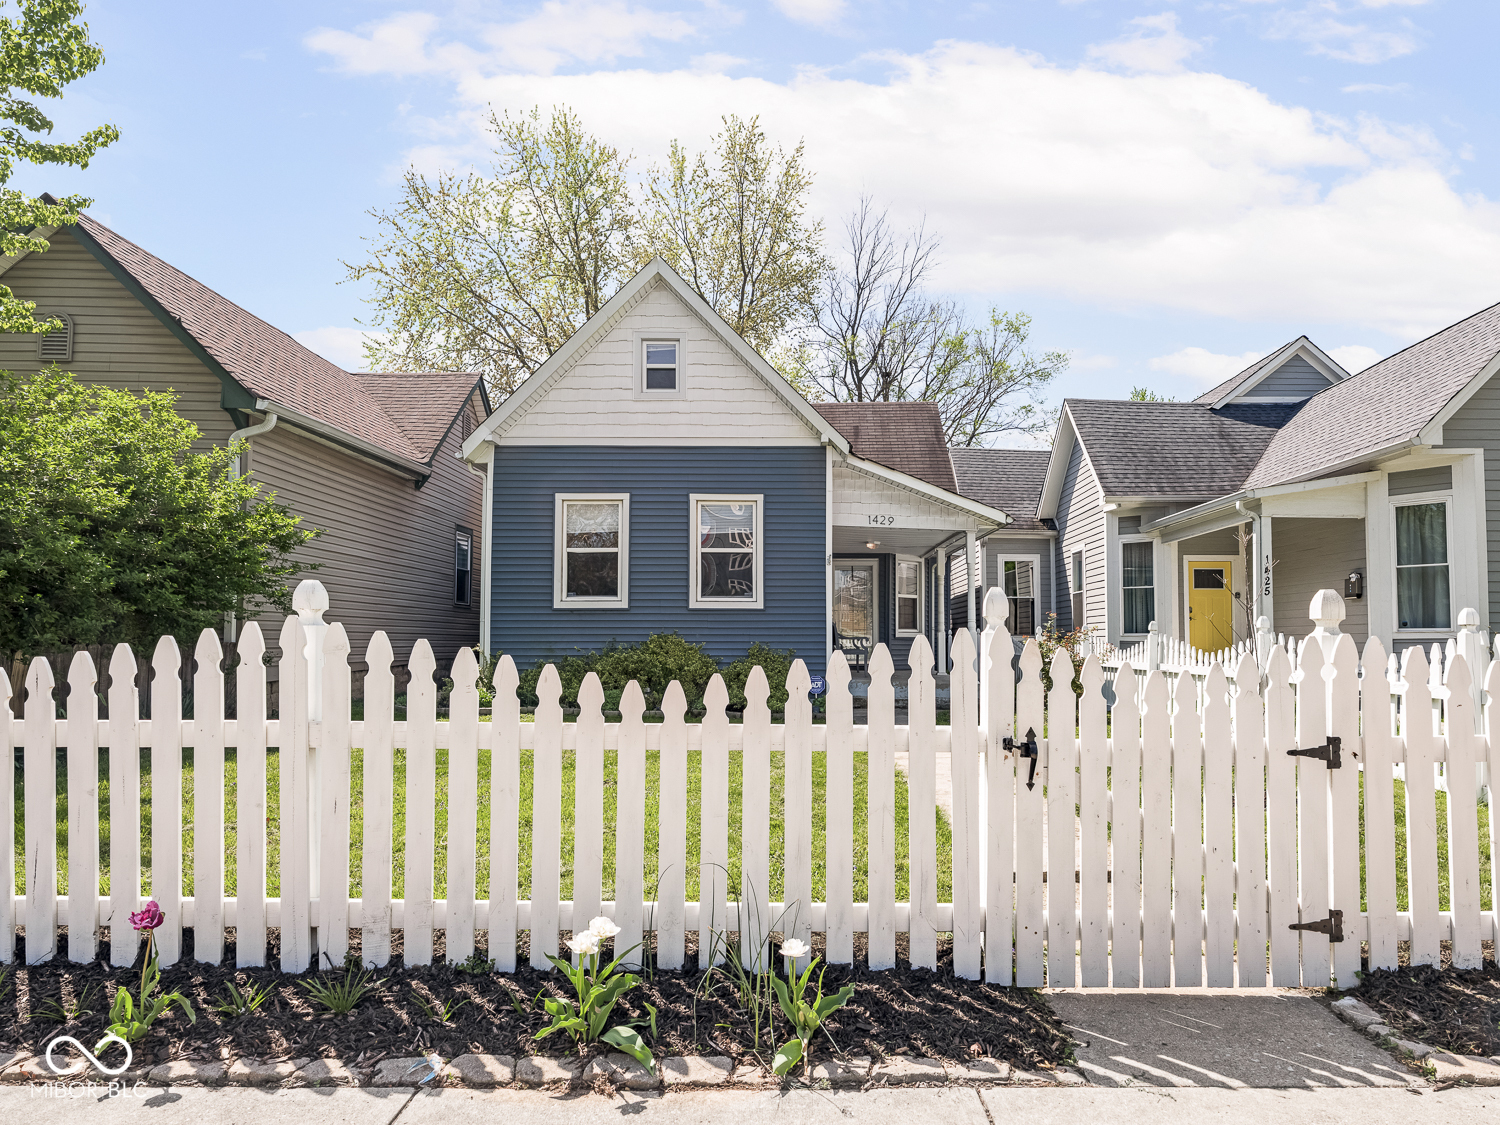
Active
$380,000
2
bds
|
3
ba
|
2,032
sqft
|
built
1900
1429 Fletcher Ave, Indianapolis, IN 46203
$-222
Cash flow
-3.0%
Cash-on-Cash Return
5.4%
Cap rate
0.7%
Rent to Value Ratio
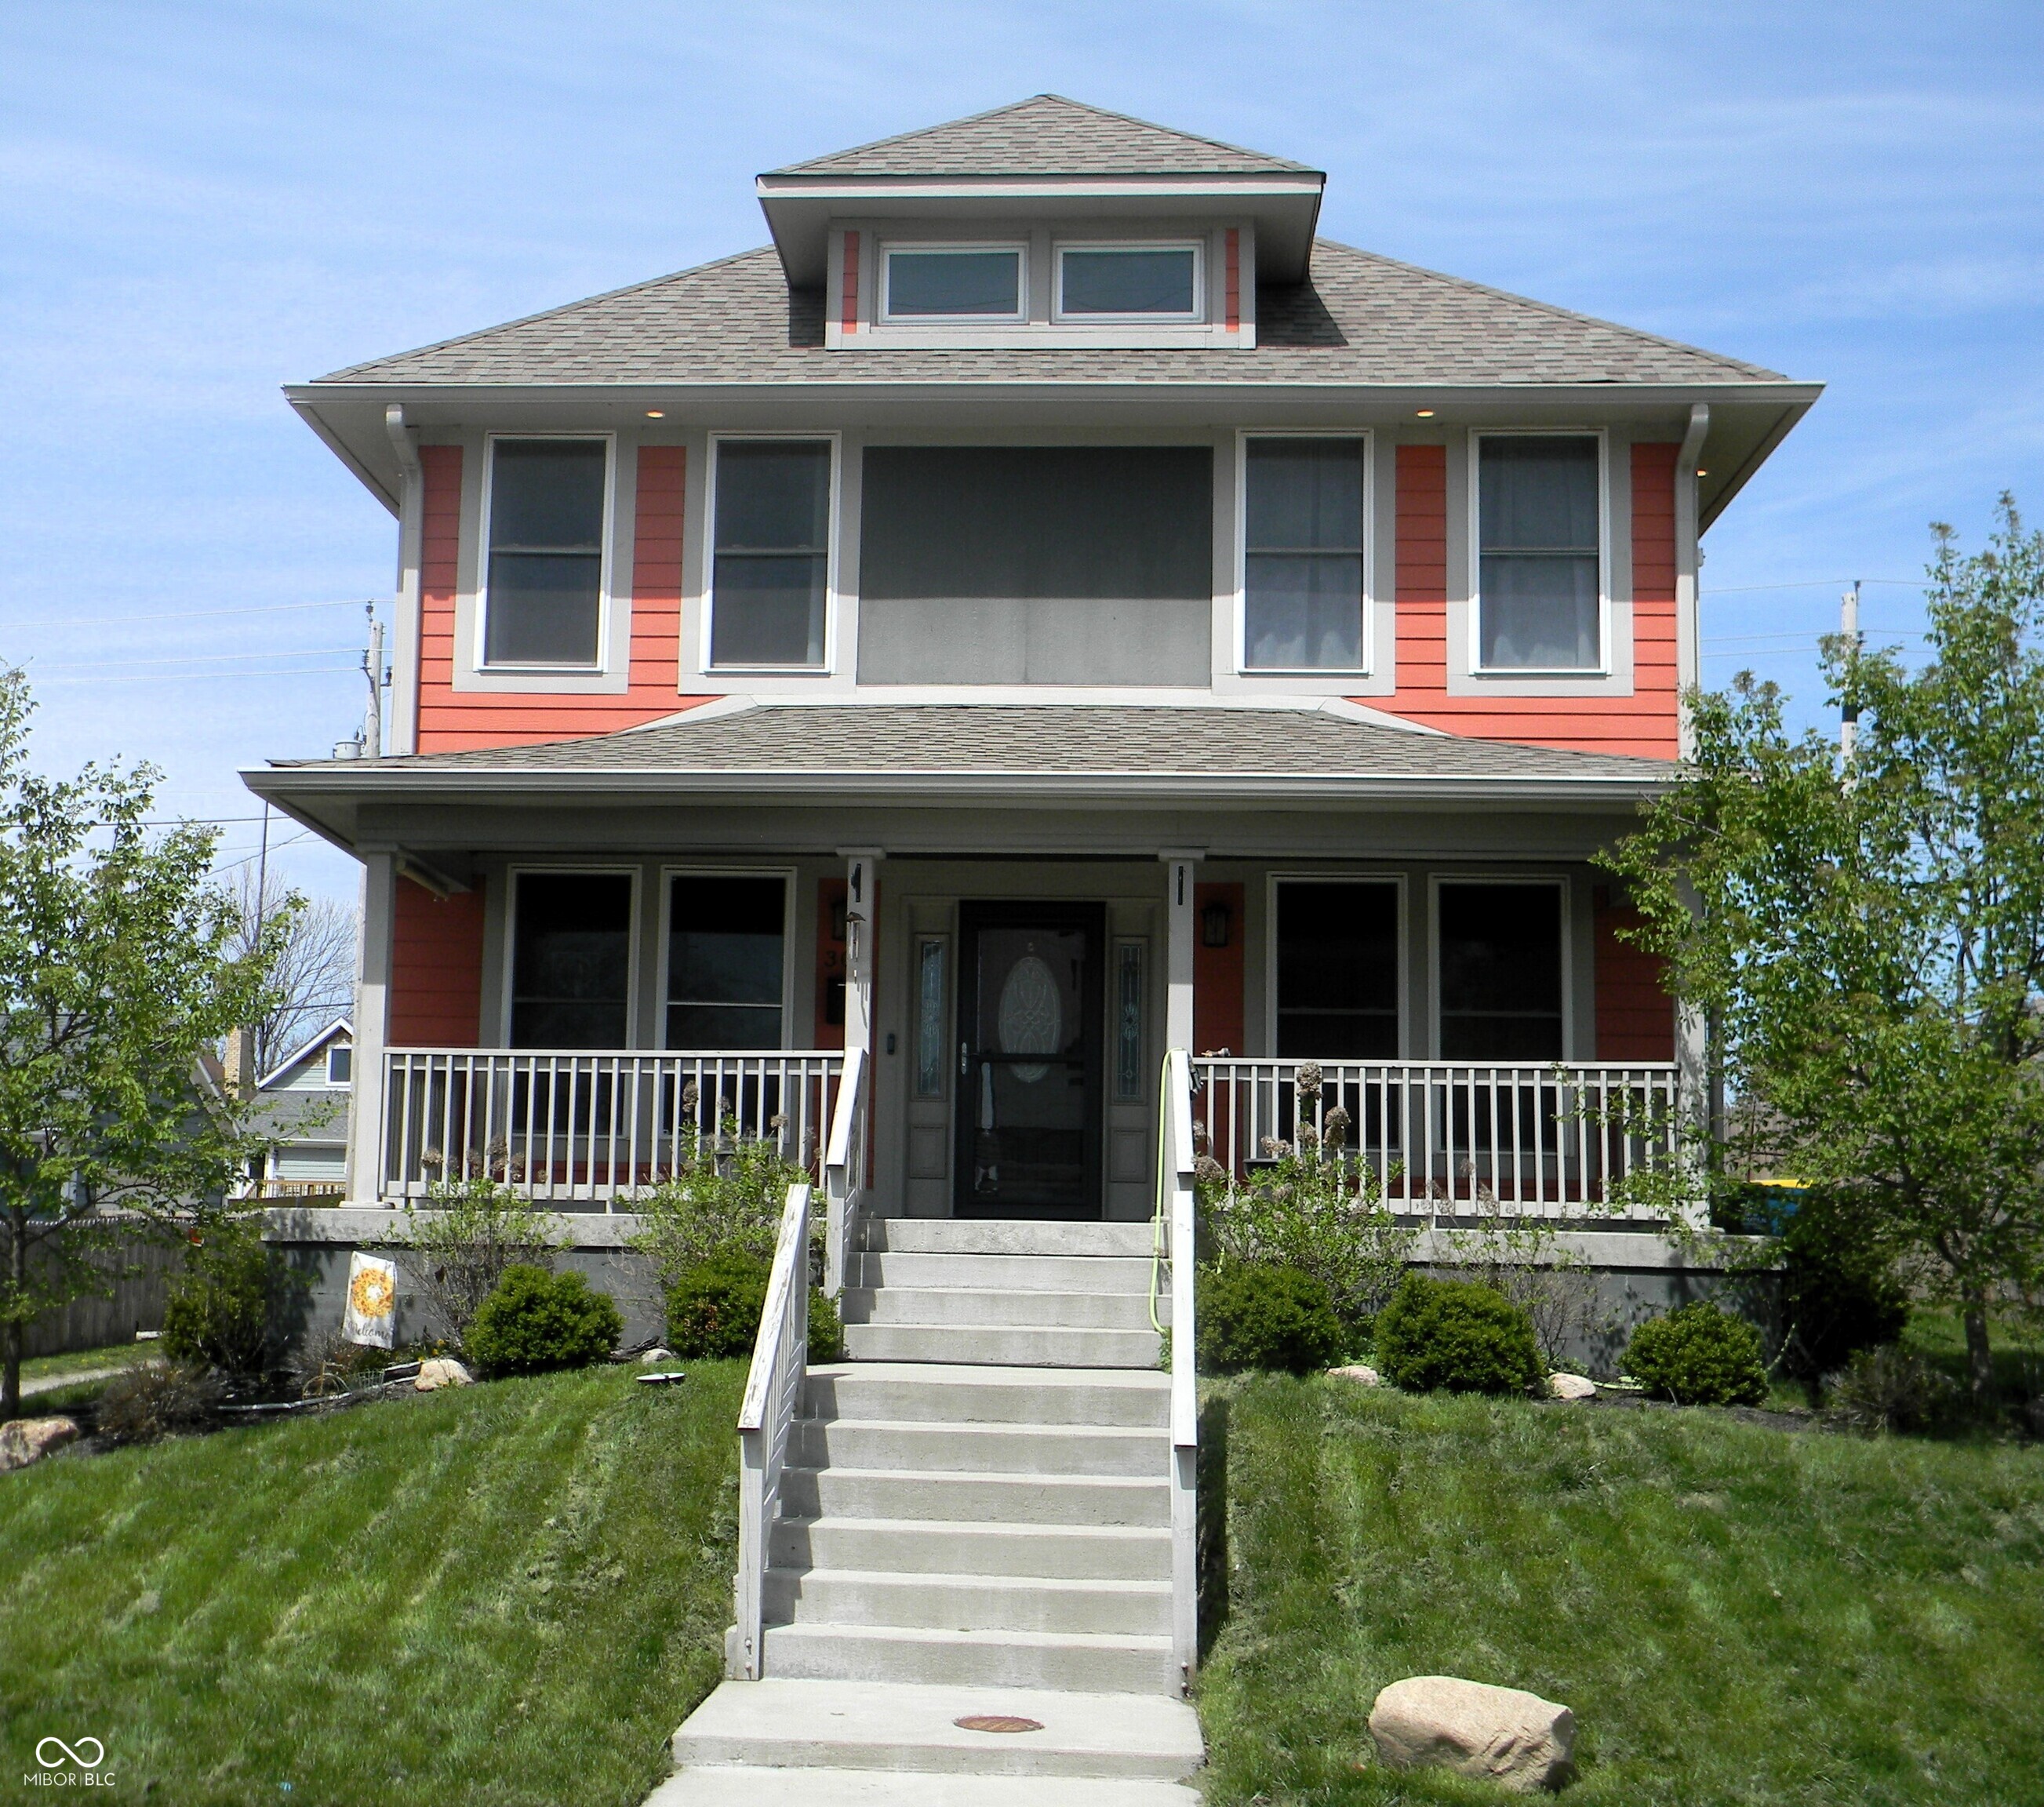
Active
$165,000
3
bds
|
1
ba
|
1,344
sqft
|
built
1920
638 W 30th St, Indianapolis, IN 46208
$259
Cash flow
8.2%
Cash-on-Cash Return
8.0%
Cap rate
1.0%
Rent to Value Ratio
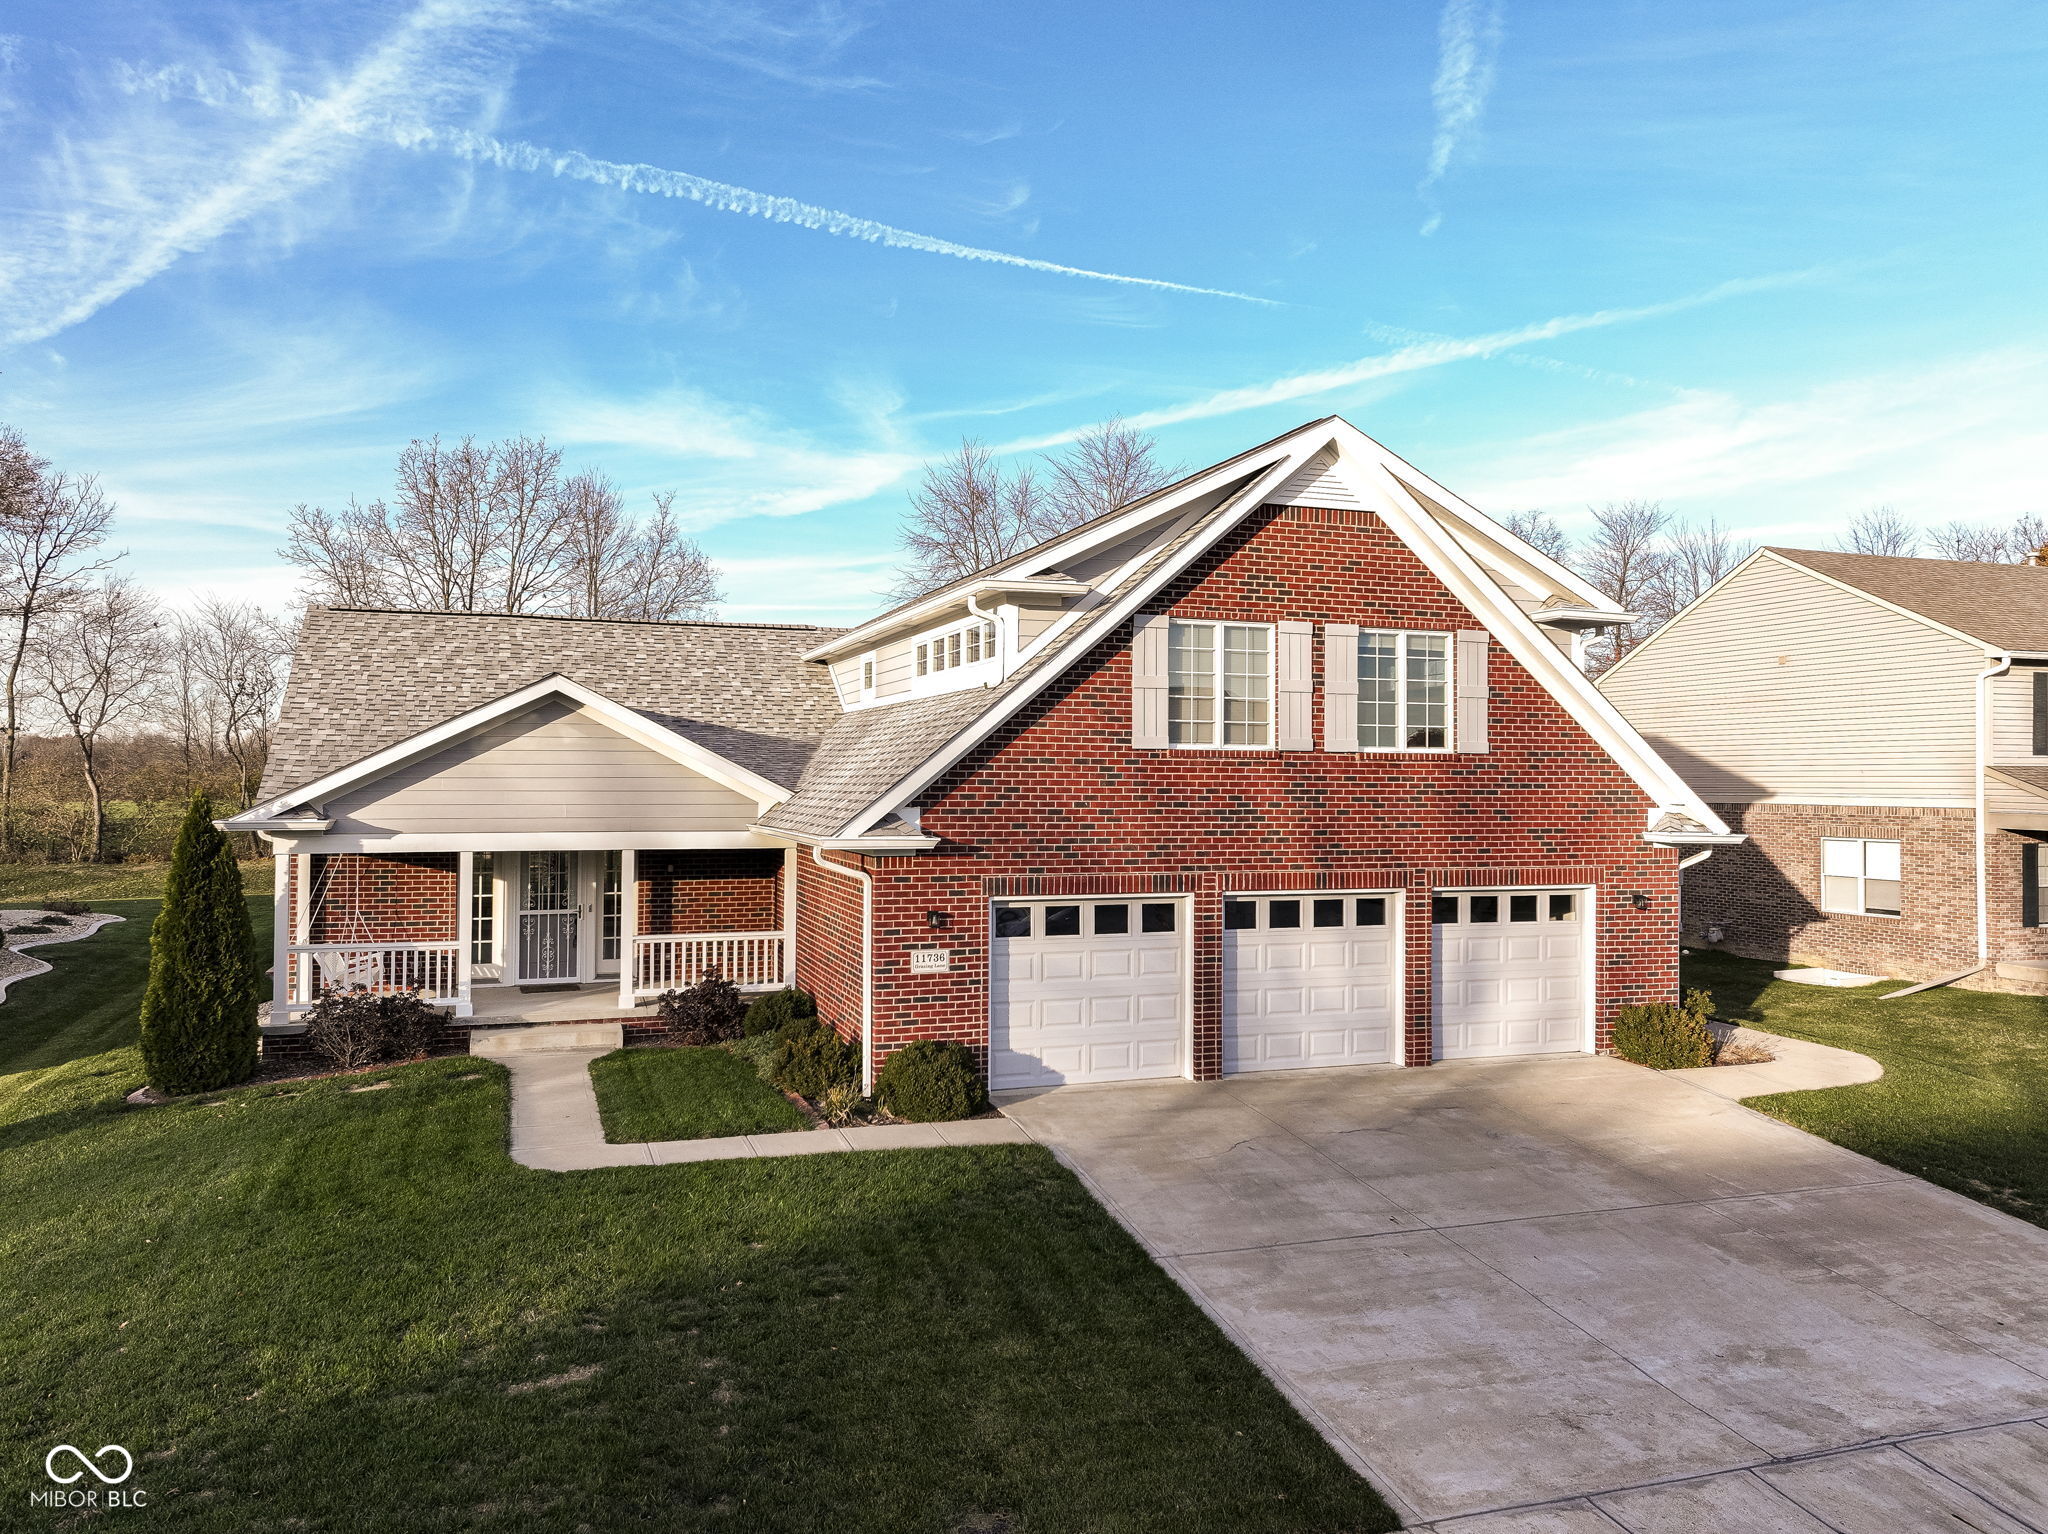
Active
$495,000
5
bds
|
5
ba
|
3,887
sqft
|
built
2018
11736 Grazing Ln, Indianapolis, IN 46239
$-139
Cash flow
-1.5%
Cash-on-Cash Return
5.8%
Cap rate
0.7%
Rent to Value Ratio
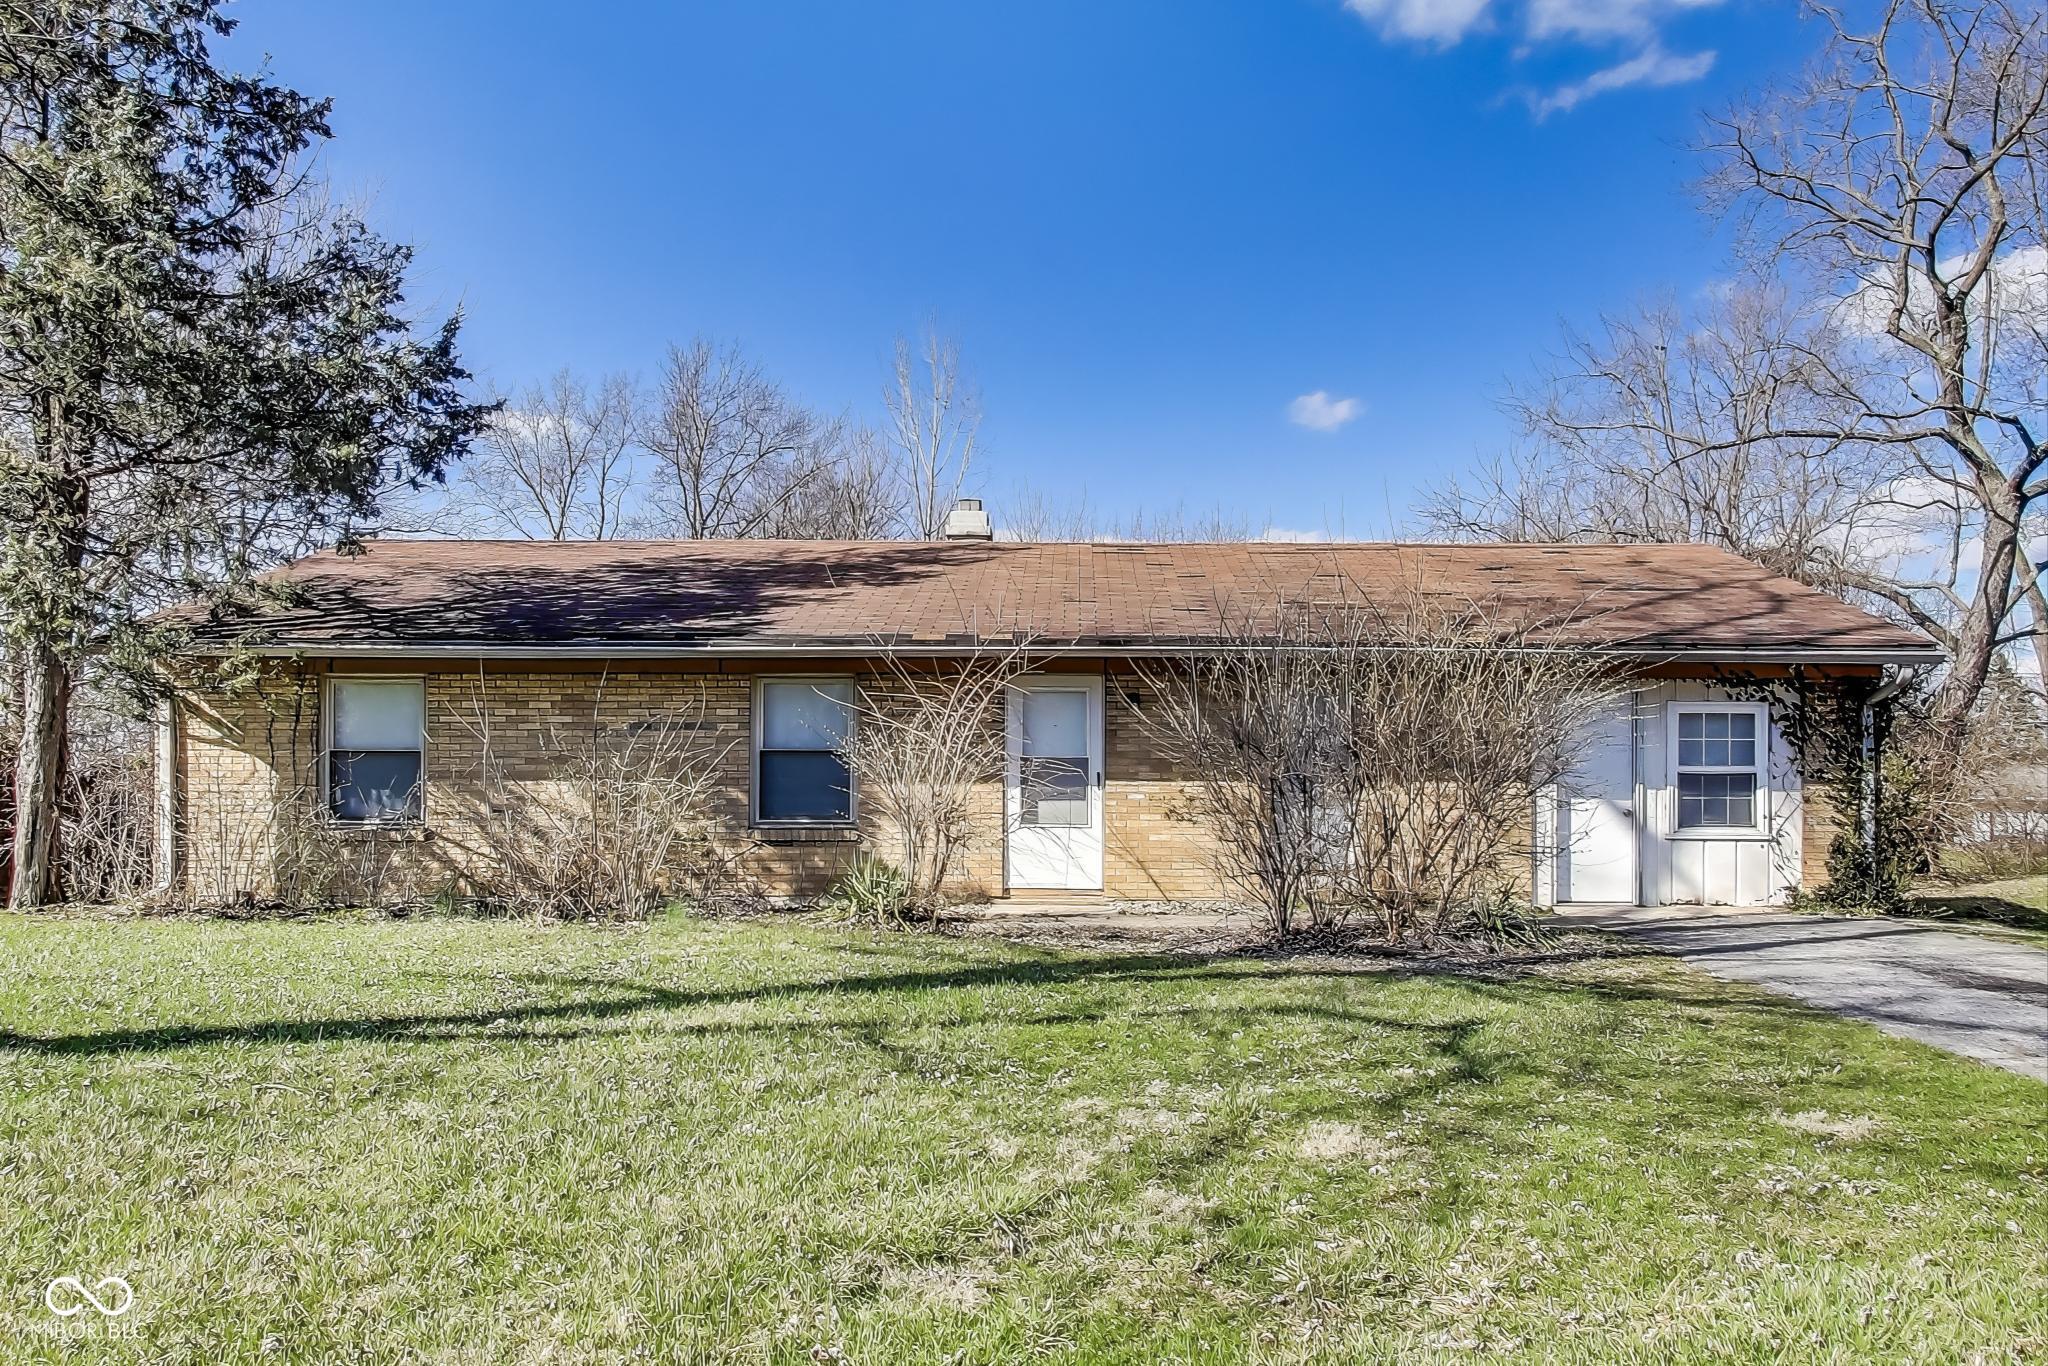
Active
$174,900
2
bds
|
1
ba
|
1,295
sqft
|
built
1946
3153 N Layman Ave, Indianapolis, IN 46218
$208
Cash flow
6.2%
Cash-on-Cash Return
7.6%
Cap rate
0.9%
Rent to Value Ratio

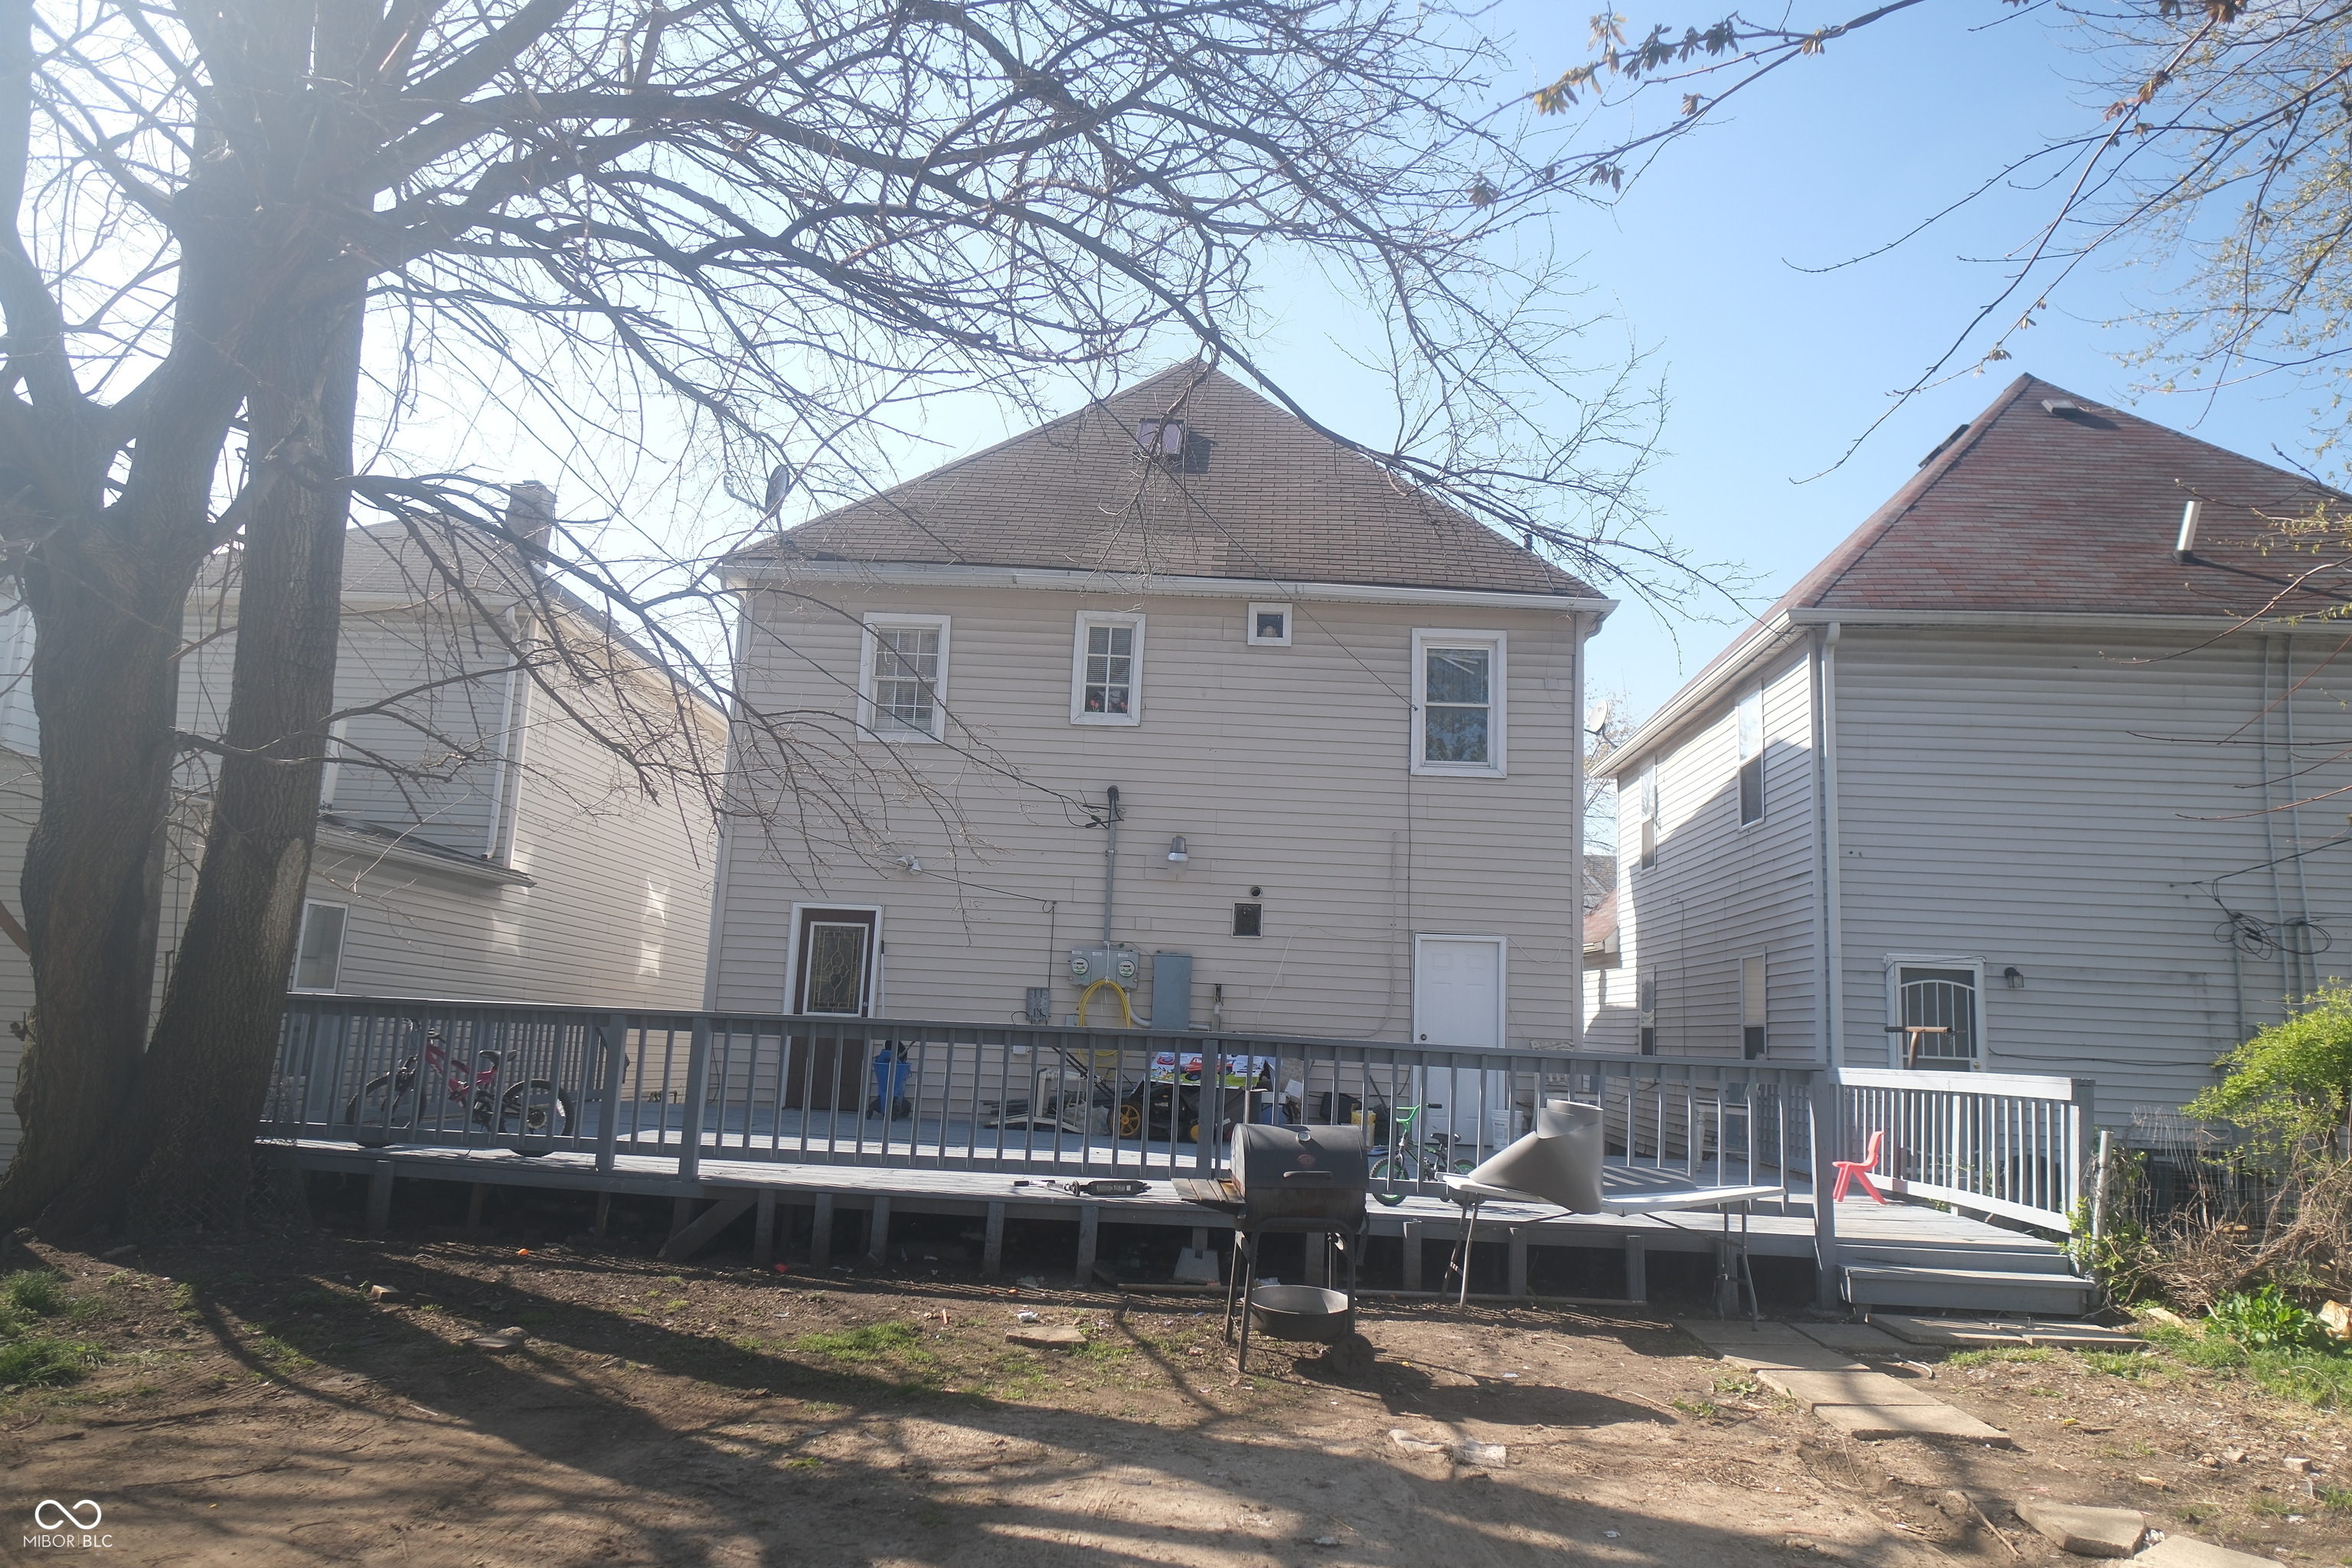
Active
$169,000
0
bds
|
0
ba
|
0
sqft
|
built
1902
28 S Hawthorne Ln, Indianapolis, IN 46219
$-245
Cash flow
-7.6%
Cash-on-Cash Return
4.4%
Cap rate
0.5%
Rent to Value Ratio
Active
$144,900
2
bds
|
1
ba
|
948
sqft
|
built
1959
1725 Medford Ave, Indianapolis, IN 46222
$224
Cash flow
8.1%
Cash-on-Cash Return
8.0%
Cap rate
1.0%
Rent to Value Ratio
Pending
$240,000
2
bds
|
2
ba
|
1,541
sqft
|
built
2011
6350 Emerald Springs Dr, Indianapolis, IN 46221
$-81
Cash flow
-1.8%
Cash-on-Cash Return
5.7%
Cap rate
0.7%
Rent to Value Ratio
Active
$649,000
3
bds
|
4
ba
|
1,626
sqft
|
built
1926
10270 E County Road 450 N, Indianapolis, IN 46234
$-1,324
Cash flow
-10.6%
Cash-on-Cash Return
3.7%
Cap rate
0.4%
Rent to Value Ratio
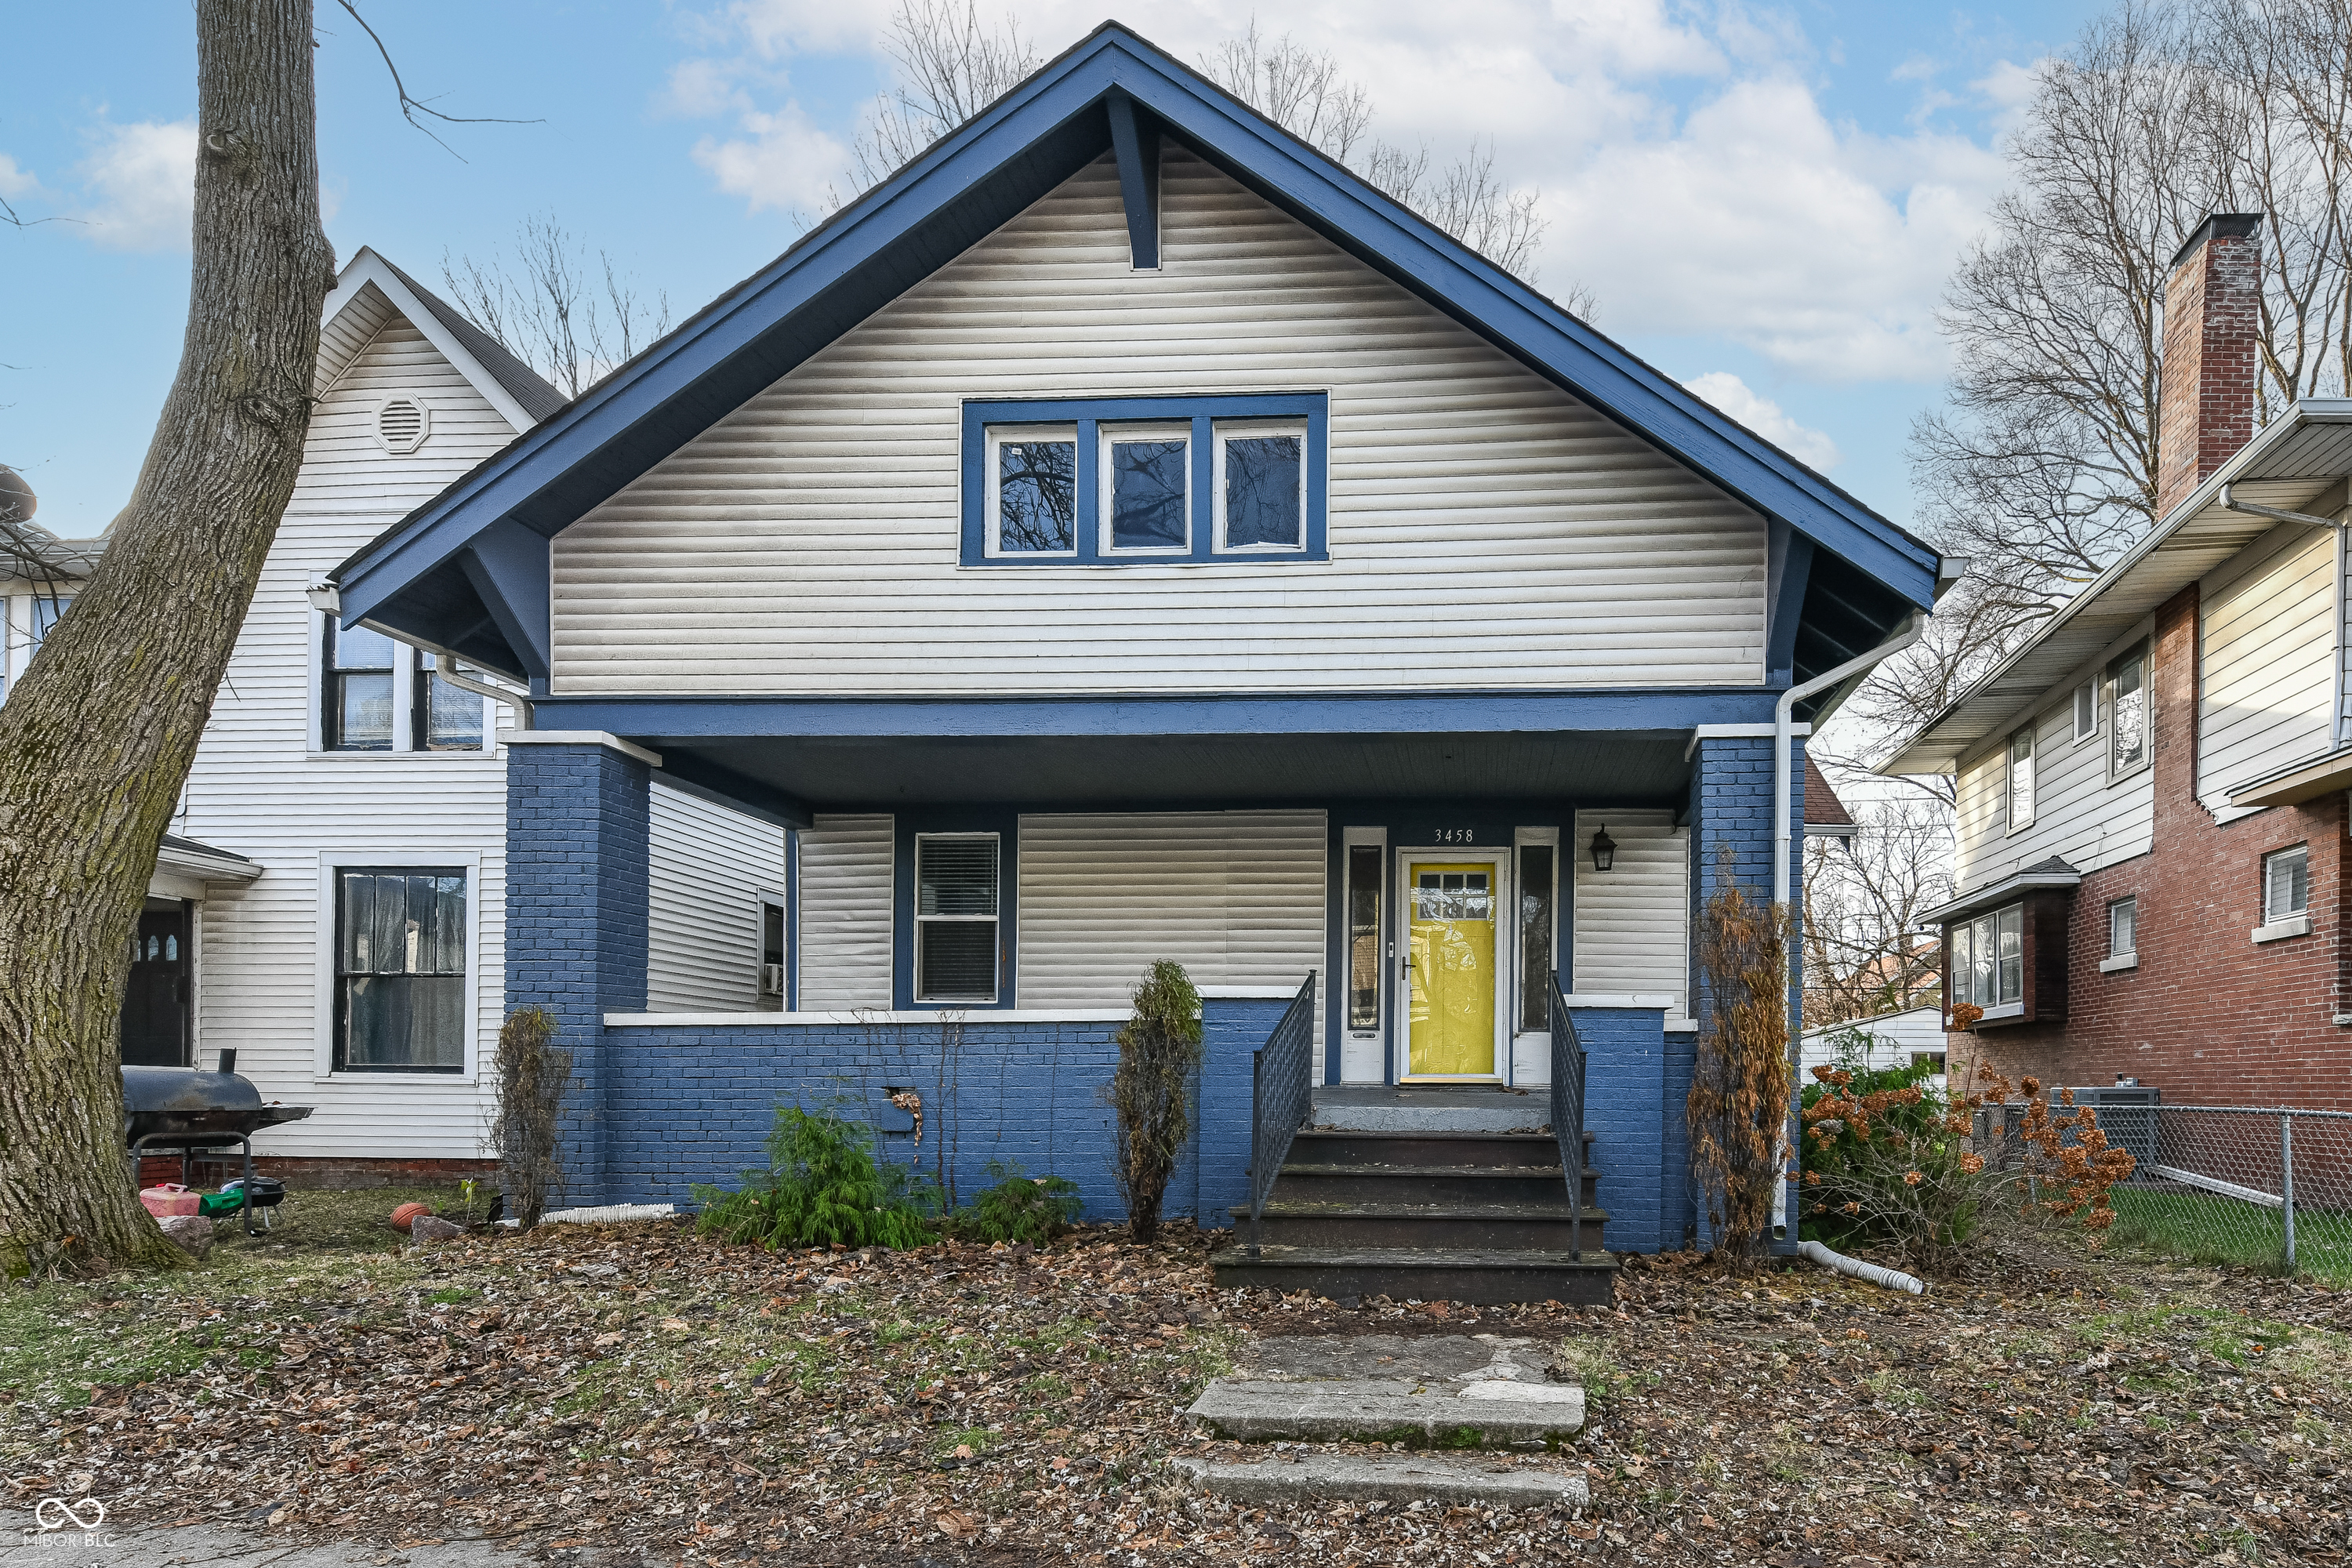
Active
$212,000
3
bds
|
2
ba
|
1,556
sqft
|
built
1920
3458 N Kenwood Ave, Indianapolis, IN 46208
$87
Cash flow
2.1%
Cash-on-Cash Return
6.6%
Cap rate
0.8%
Rent to Value Ratio
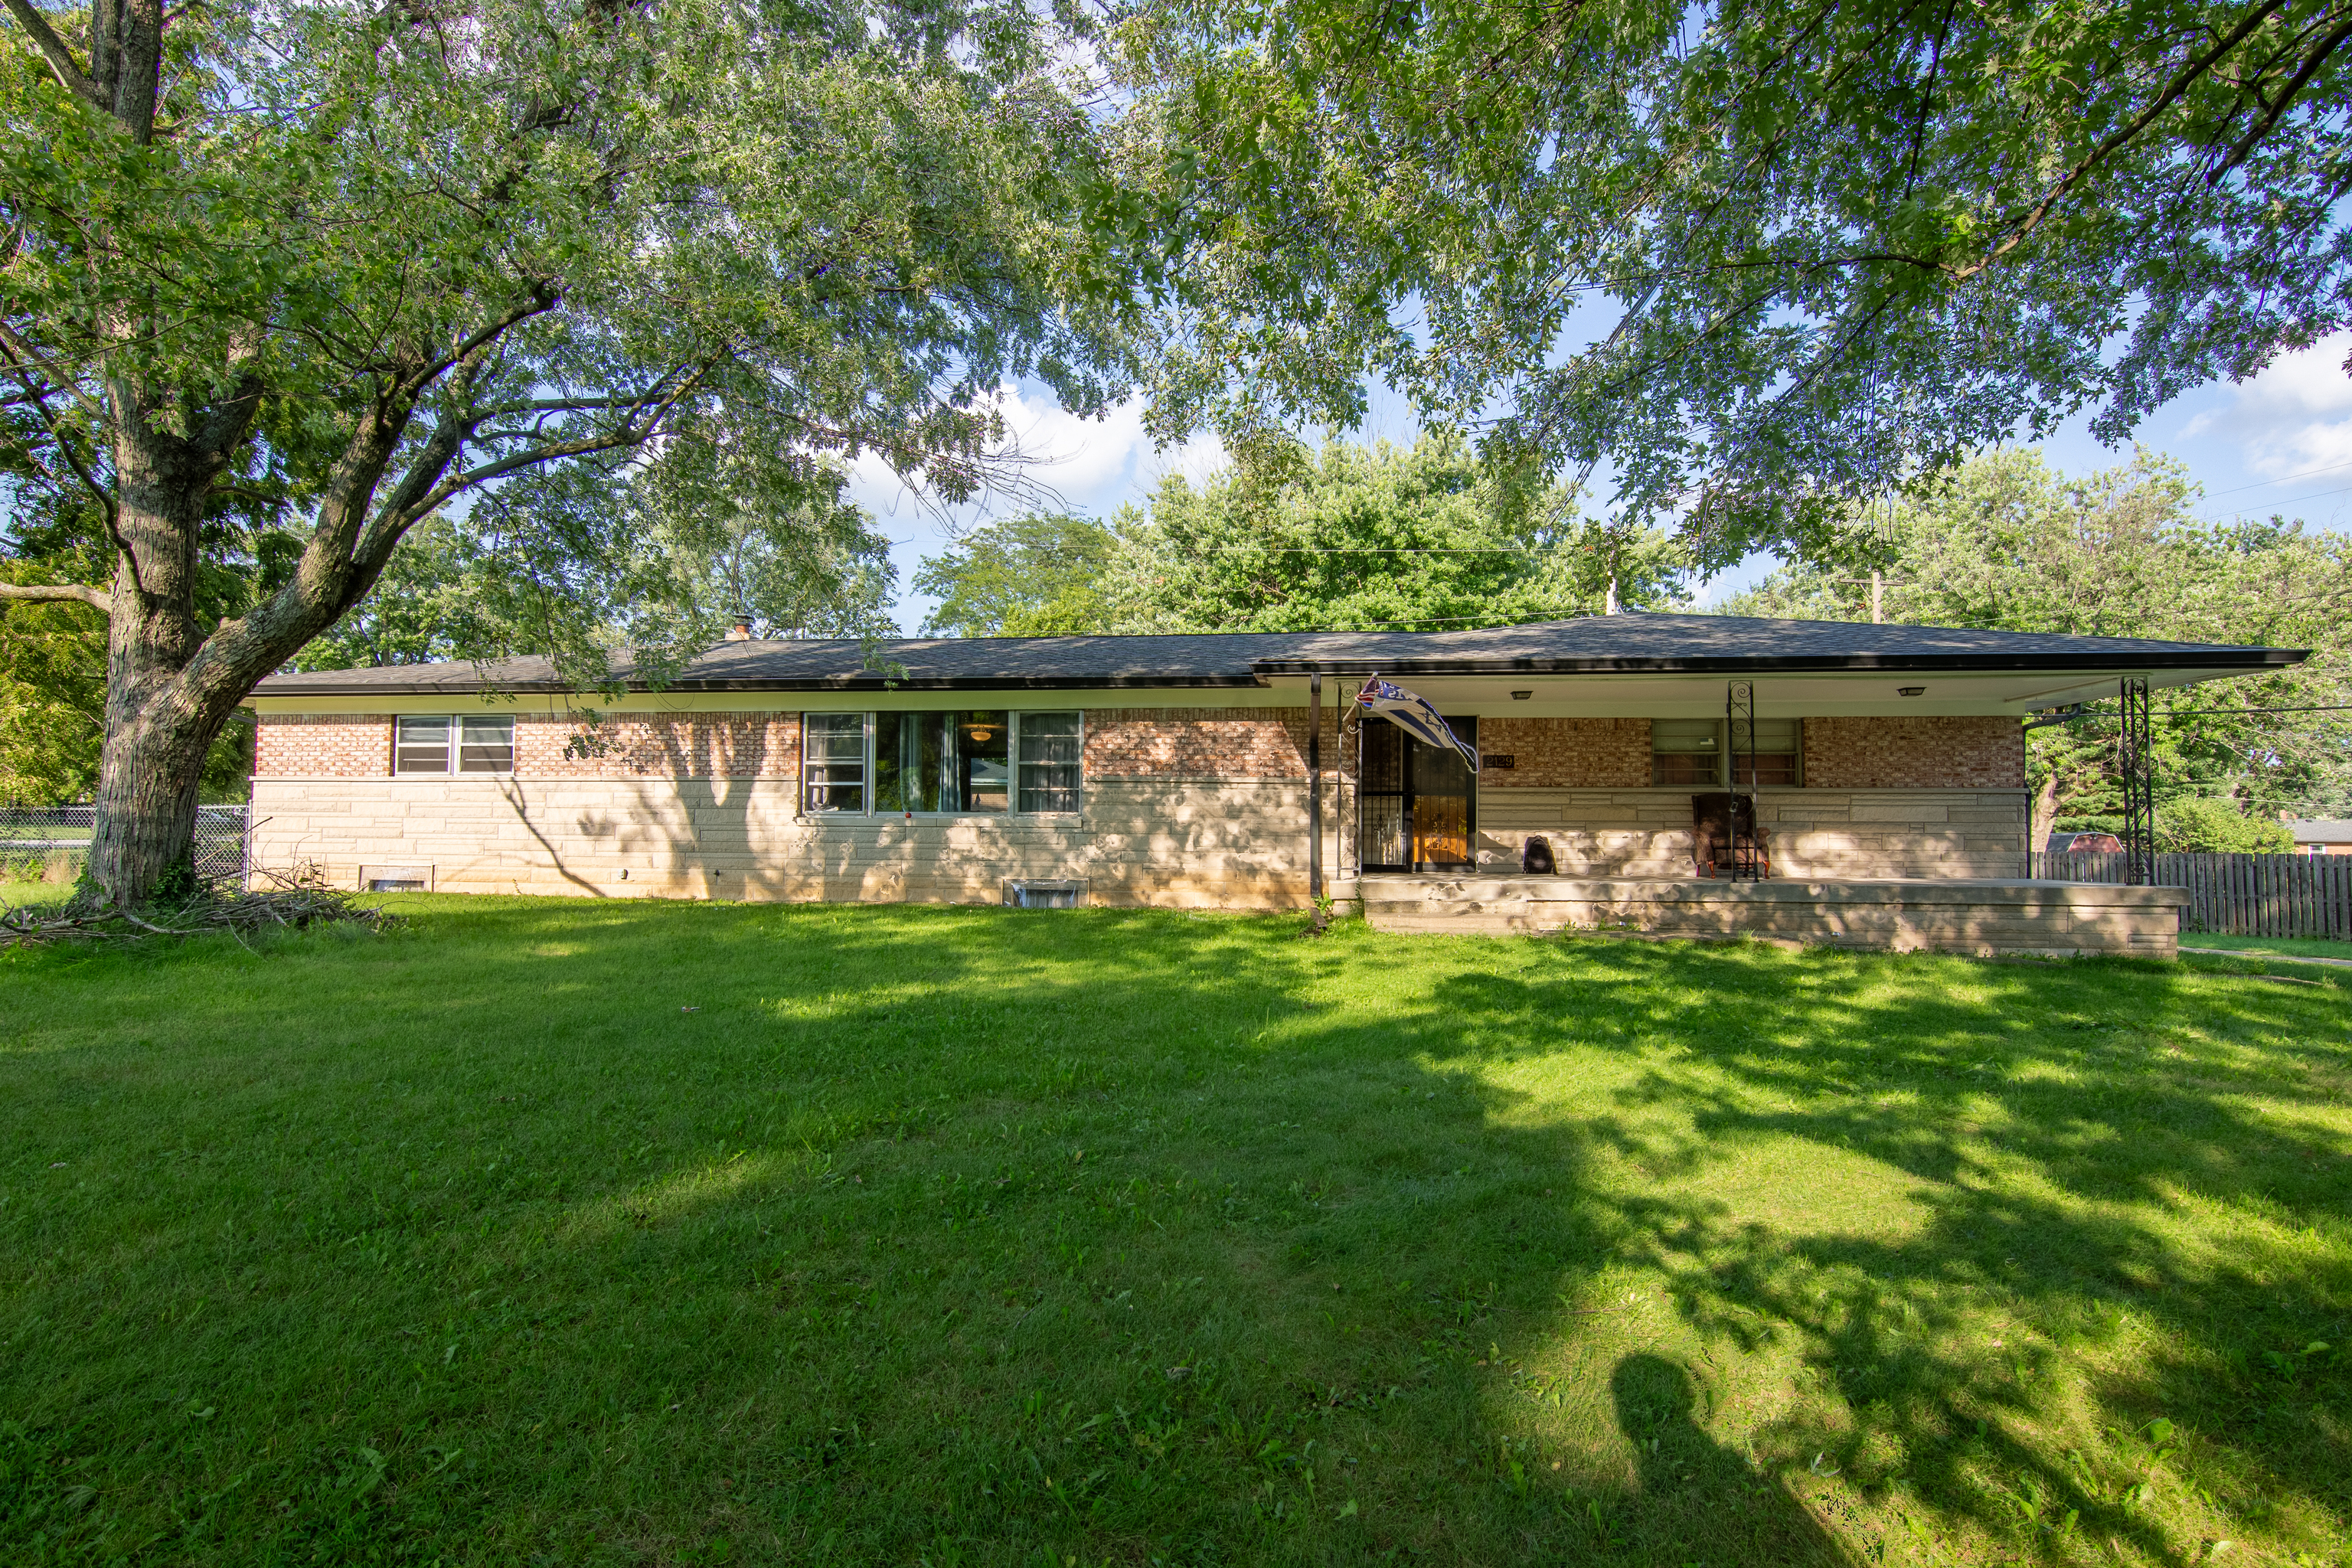
Active
$260,000
2
bds
|
2
ba
|
1,597
sqft
|
built
1958
2129 Woodcrest Rd, Indianapolis, IN 46227
$-90
Cash flow
-1.8%
Cash-on-Cash Return
5.7%
Cap rate
0.7%
Rent to Value Ratio
Active
$340,000
4
bds
|
4
ba
|
1,680
sqft
|
built
1960
2421 E 11th St, Indianapolis, IN 46201
$-17
Cash flow
-0.3%
Cash-on-Cash Return
6.1%
Cap rate
0.7%
Rent to Value Ratio
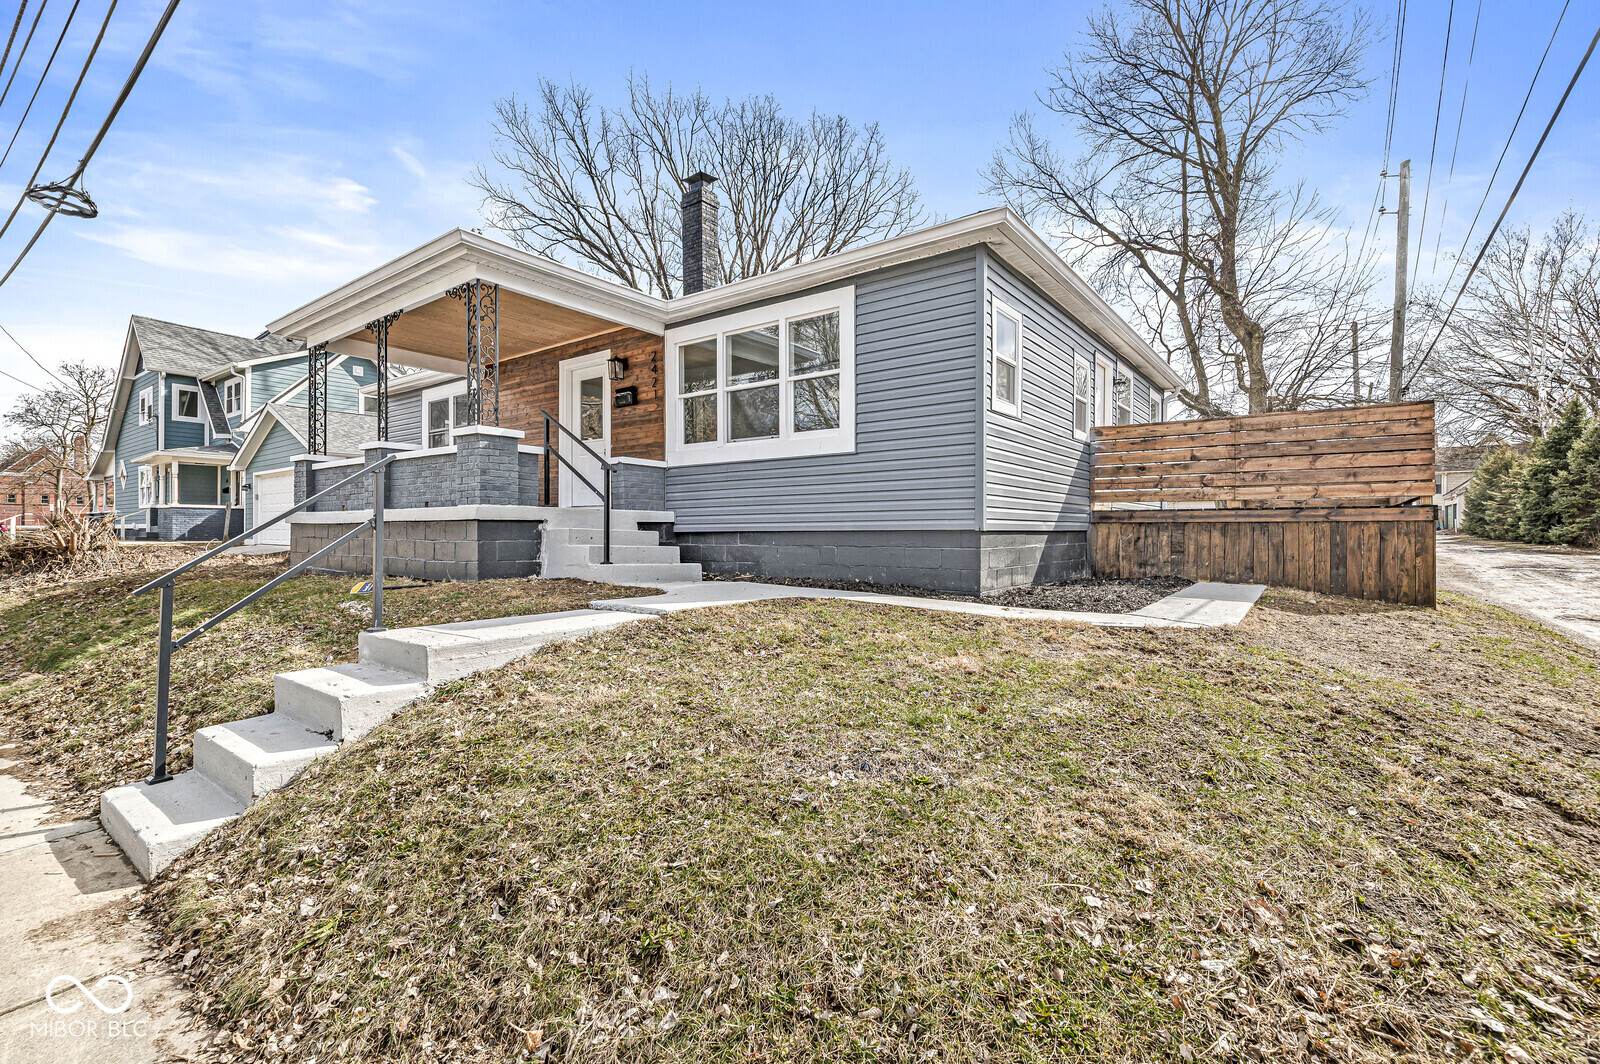
Active
$349,000
3
bds
|
3
ba
|
2,111
sqft
|
built
2019
214 Handley St, Indianapolis, IN 46222
$107
Cash flow
1.6%
Cash-on-Cash Return
6.5%
Cap rate
0.8%
Rent to Value Ratio
Active
$305,000
4
bds
|
3
ba
|
2,036
sqft
|
built
1987
7670 Lippincott Way, Indianapolis, IN 46268
$-47
Cash flow
-0.8%
Cash-on-Cash Return
6.0%
Cap rate
0.7%
Rent to Value Ratio
Active
$230,000
2
bds
|
1
ba
|
1,324
sqft
|
built
1928
1330 N Bosart Ave, Indianapolis, IN 46201
$-74
Cash flow
-1.7%
Cash-on-Cash Return
5.8%
Cap rate
0.7%
Rent to Value Ratio
Active
$309,900
4
bds
|
3
ba
|
2,307
sqft
|
built
2003
8531 Friendship Ln, Indianapolis, IN 46217
$-207
Cash flow
-3.5%
Cash-on-Cash Return
5.3%
Cap rate
0.6%
Rent to Value Ratio
Active
$360,000
2
bds
|
2
ba
|
1,856
sqft
|
built
1960
475 Golf Ln, Indianapolis, IN 46260
$-257
Cash flow
-3.7%
Cash-on-Cash Return
5.3%
Cap rate
0.6%
Rent to Value Ratio
Active
$245,000
3
bds
|
2
ba
|
2,080
sqft
|
built
1962
3720 E Southern Ave, Indianapolis, IN 46203
$-13
Cash flow
-0.3%
Cash-on-Cash Return
6.1%
Cap rate
0.7%
Rent to Value Ratio
Active
$374,500
4
bds
|
4
ba
|
2,074
sqft
|
built
1910
1938 E 11th St, Indianapolis, IN 46201
$14
Cash flow
0.2%
Cash-on-Cash Return
6.2%
Cap rate
0.7%
Rent to Value Ratio
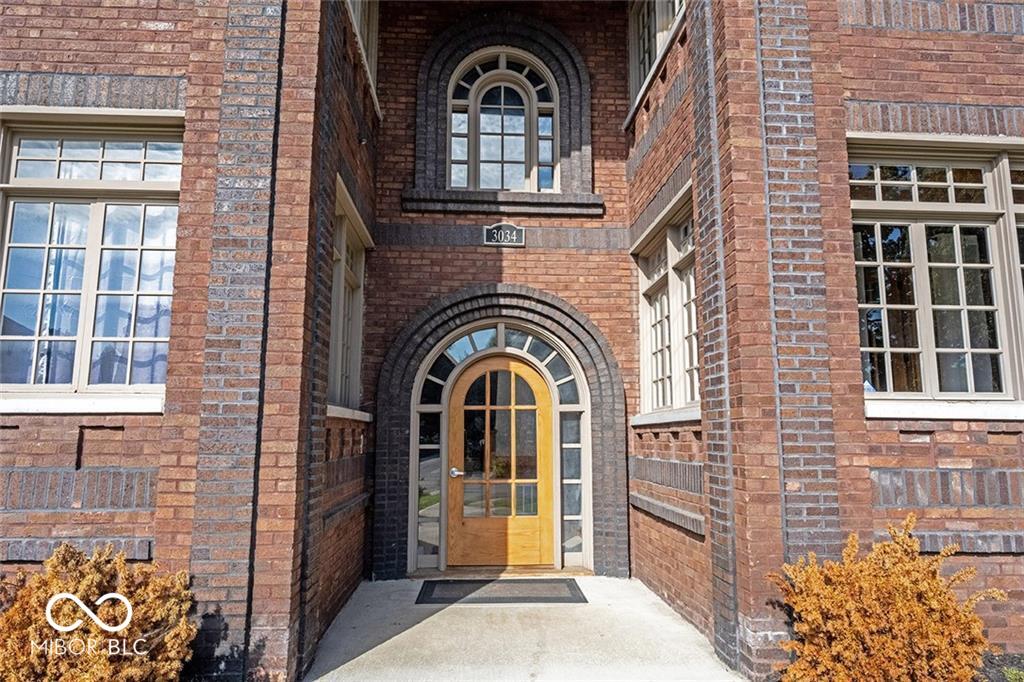
Pending
$320,000
2
bds
|
3
ba
|
1,484
sqft
|
built
1913
3034 N Pennsylvania St, Indianapolis, IN 46205
$-249
Cash flow
-4.1%
Cash-on-Cash Return
5.2%
Cap rate
0.8%
Rent to Value Ratio
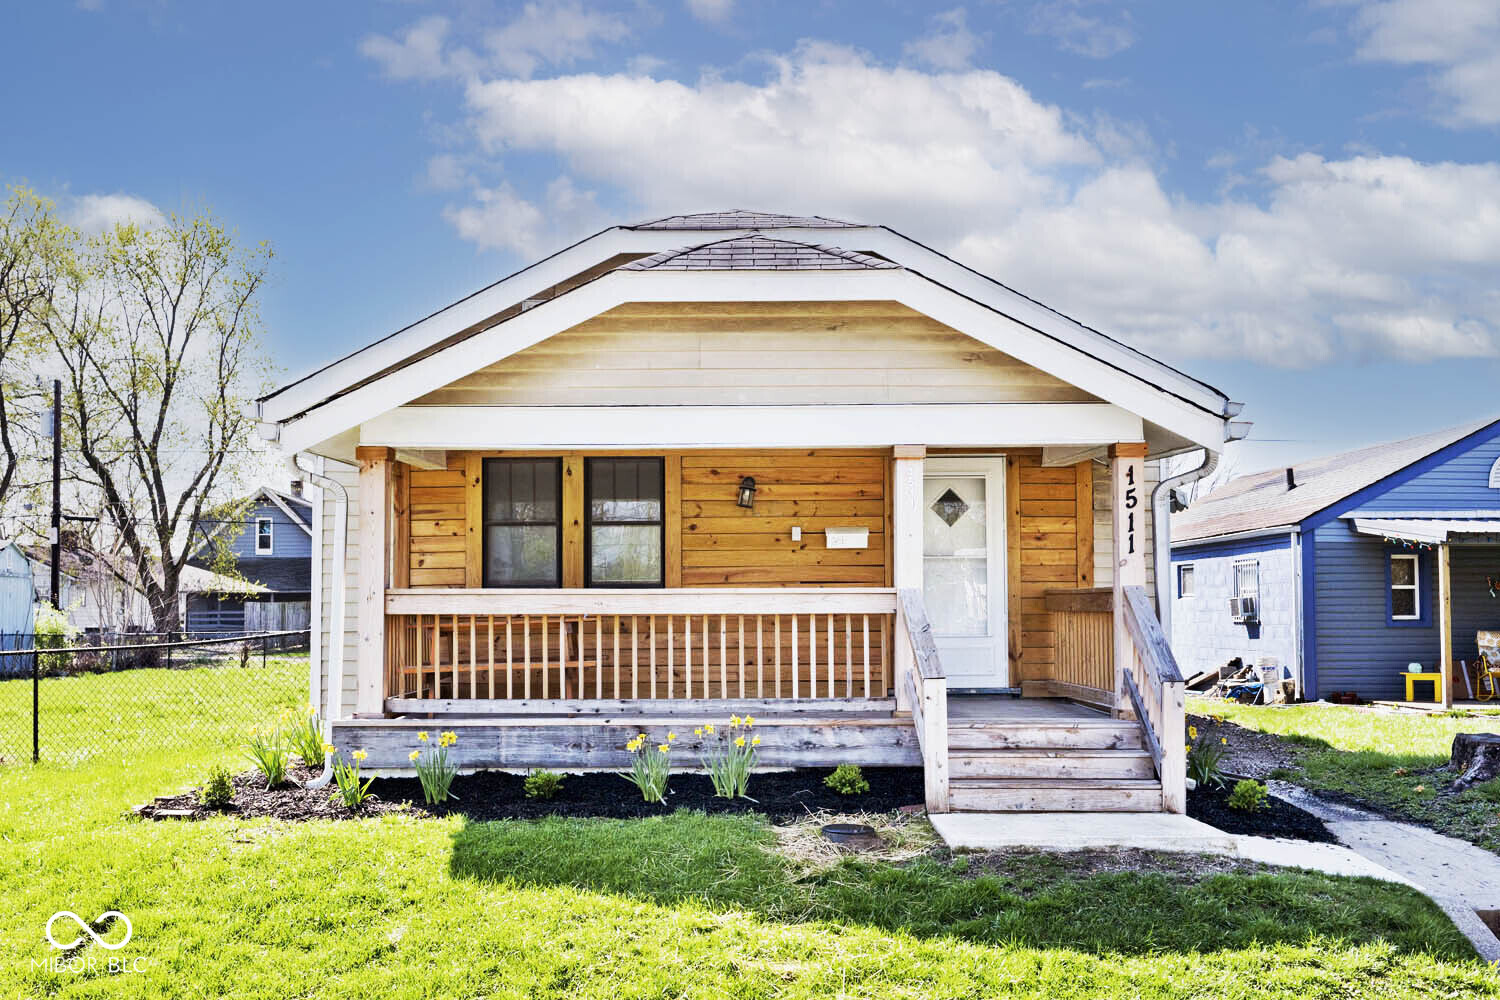
Active
$199,900
4
bds
|
2
ba
|
1,737
sqft
|
built
1920
1511 E Tabor St, Indianapolis, IN 46203
$-127
Cash flow
-3.3%
Cash-on-Cash Return
5.4%
Cap rate
0.7%
Rent to Value Ratio
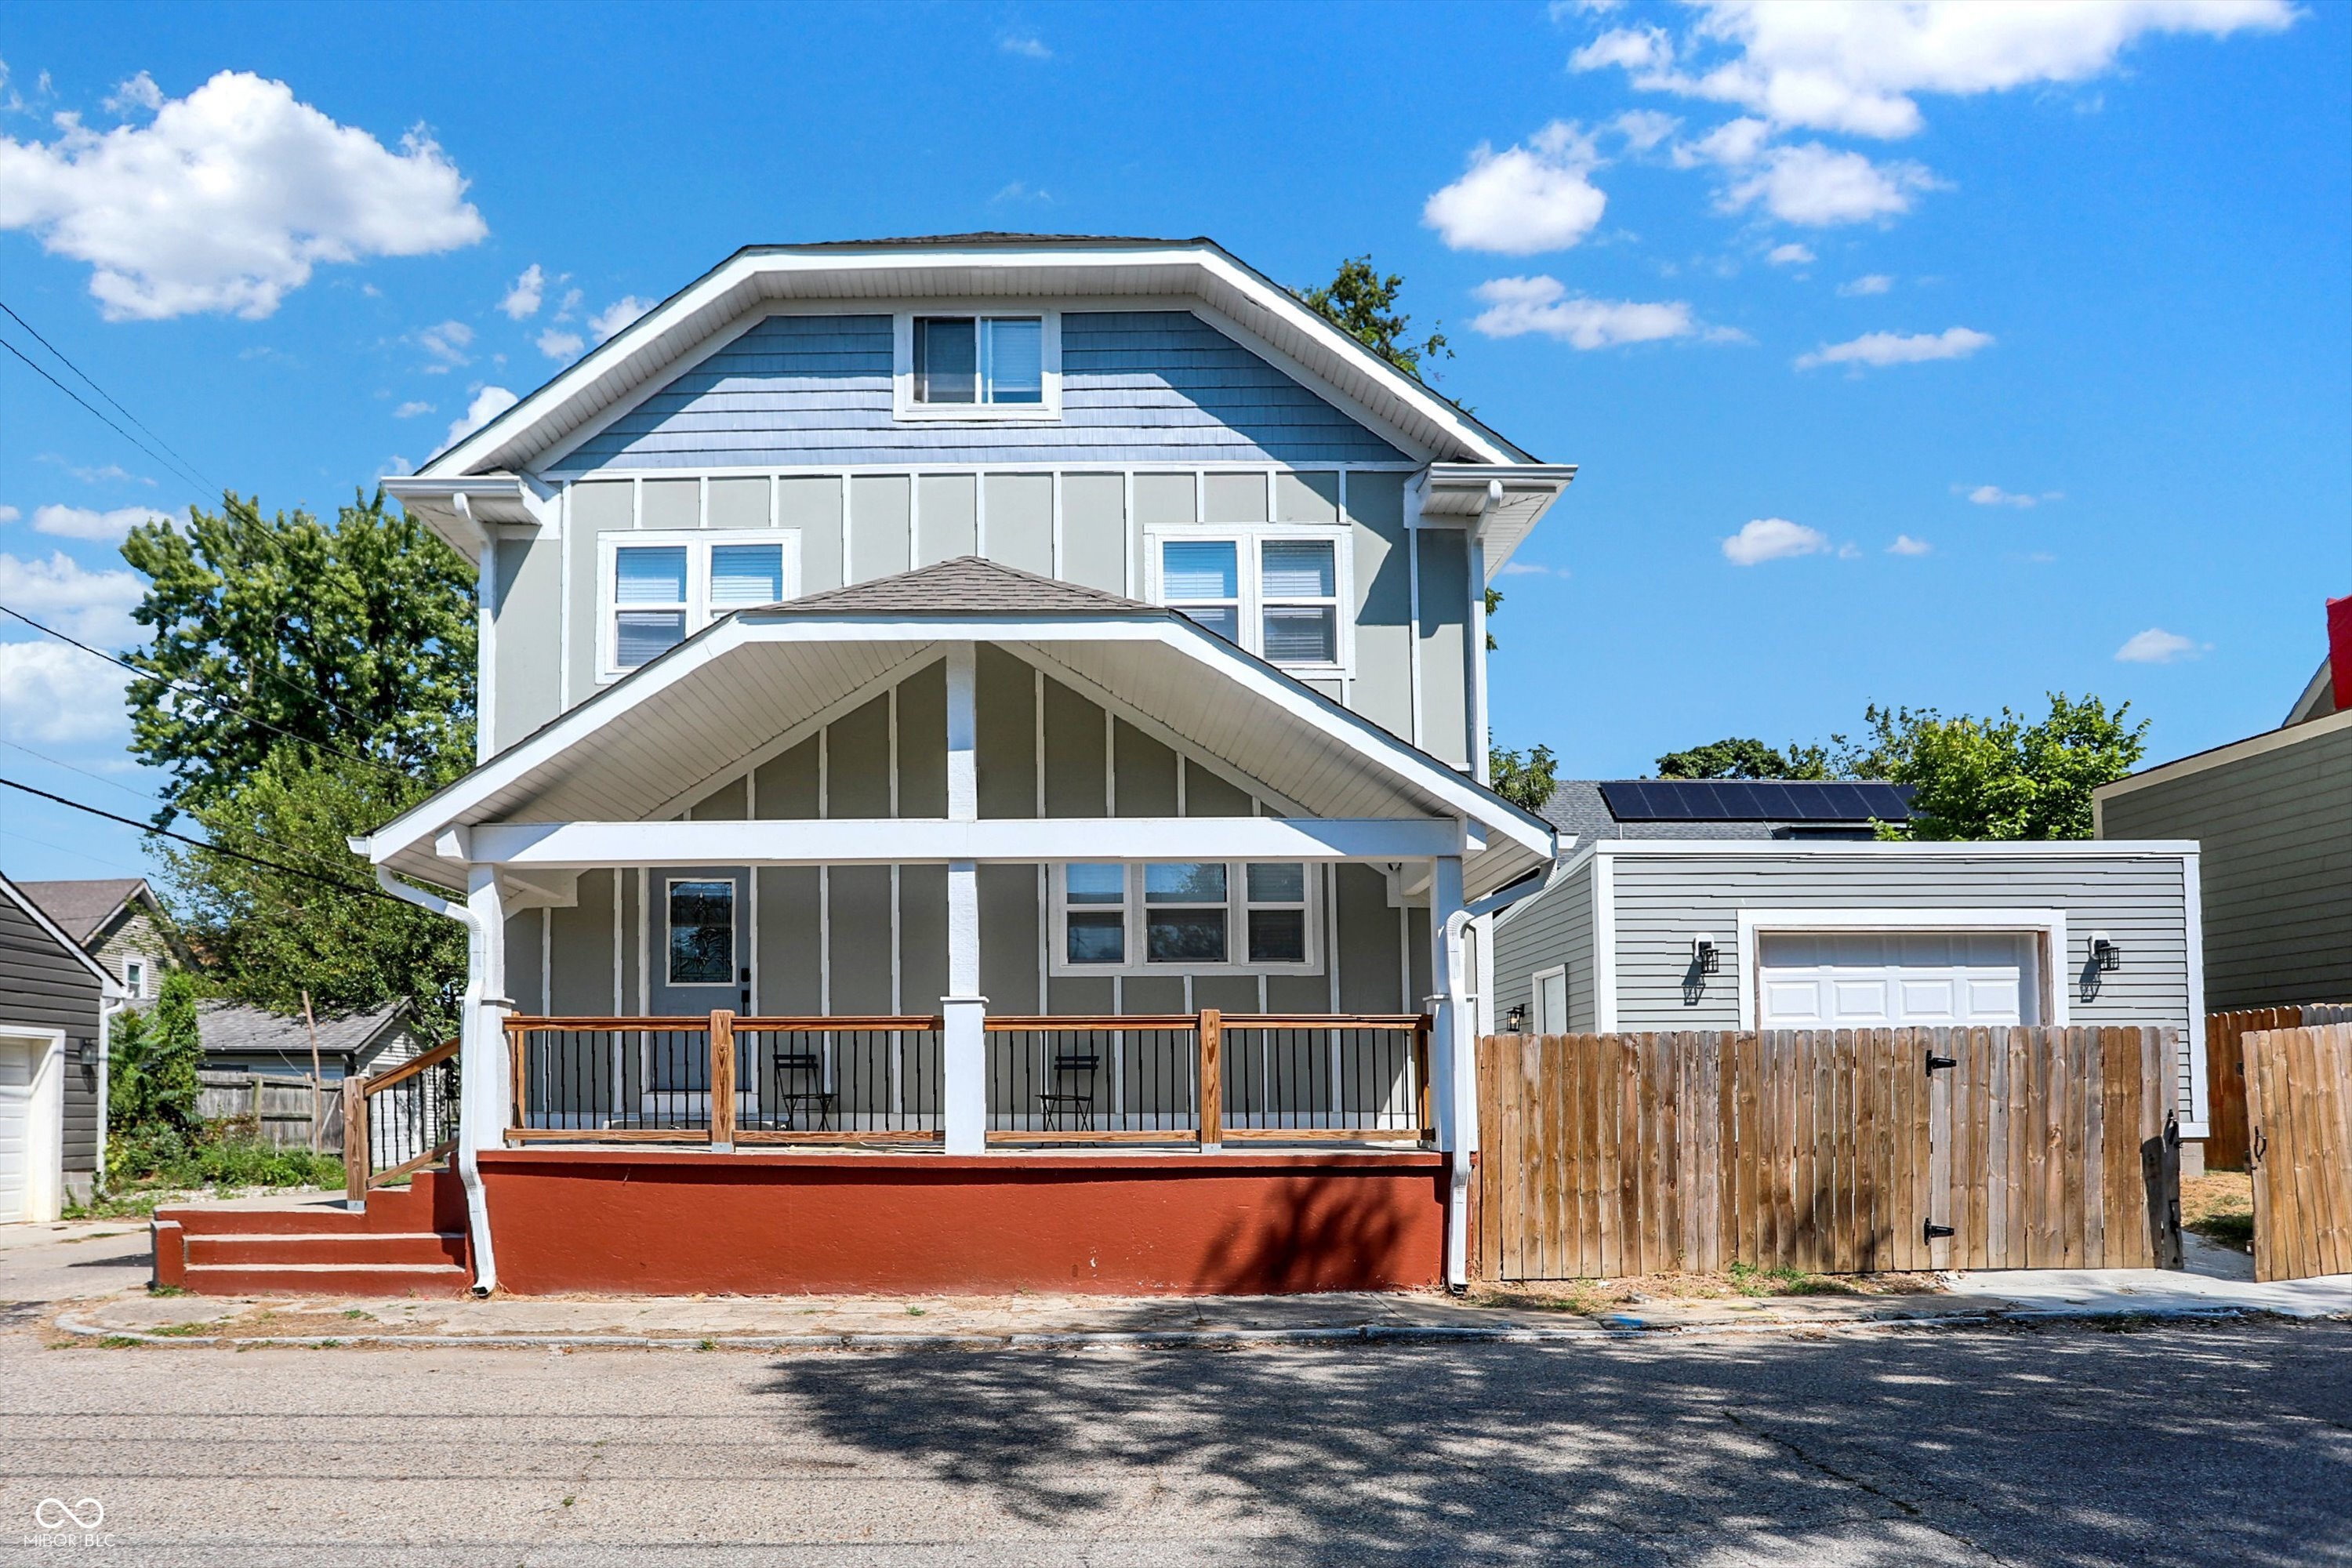
Pending
$319,900
3
bds
|
2
ba
|
1,548
sqft
|
built
1990
6143 Roberts Pl, Indianapolis, IN 46220
$-121
Cash flow
-2.0%
Cash-on-Cash Return
5.7%
Cap rate
0.7%
Rent to Value Ratio

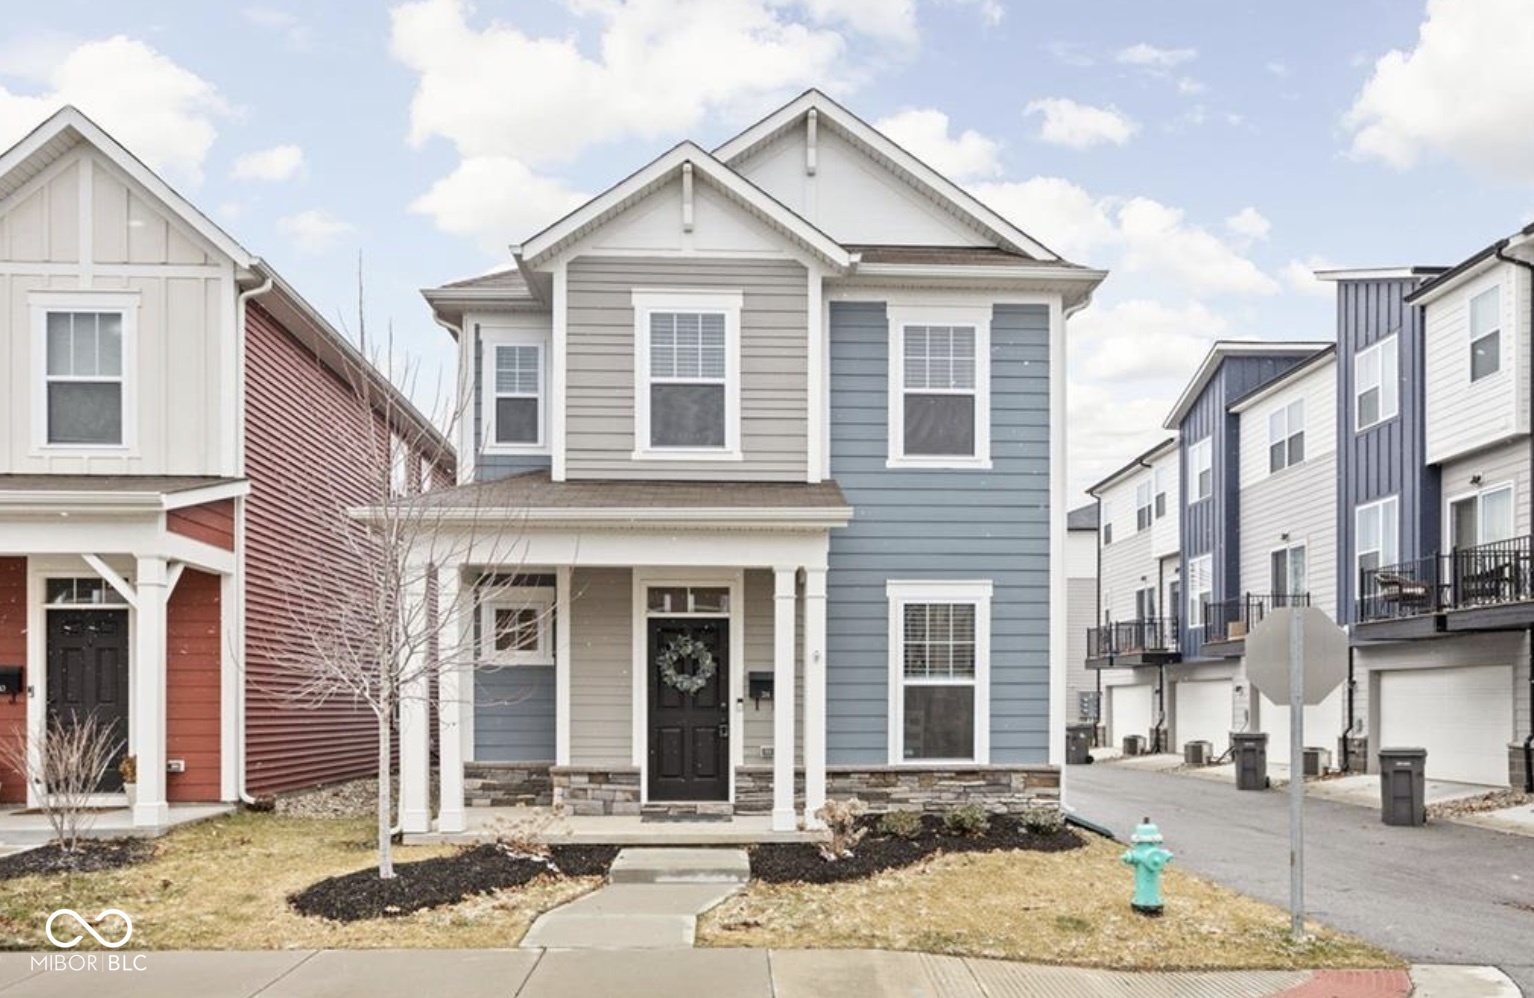
Active
$394,000
4
bds
|
3
ba
|
2,001
sqft
|
built
2015
305 Parkway Ave, Indianapolis, IN 46225
$-17
Cash flow
-0.2%
Cash-on-Cash Return
6.1%
Cap rate
0.7%
Rent to Value Ratio
Active
$265,000
3
bds
|
3
ba
|
1,857
sqft
|
built
1980
11733 E 21st St, Indianapolis, IN 46229
$23
Cash flow
0.5%
Cash-on-Cash Return
6.2%
Cap rate
0.8%
Rent to Value Ratio
Active
$174,999
4
bds
|
2
ba
|
1,537
sqft
|
built
1957
7906 E 21st St, Indianapolis, IN 46219
$1
Cash flow
0.0%
Cash-on-Cash Return
6.2%
Cap rate
0.7%
Rent to Value Ratio
Active
$175,000
3
bds
|
1
ba
|
1,008
sqft
|
built
1900
657 Birch Ave, Indianapolis, IN 46221
$1
Cash flow
0.0%
Cash-on-Cash Return
6.2%
Cap rate
0.7%
Rent to Value Ratio
Active
$219,000
3
bds
|
3
ba
|
1,440
sqft
|
built
2006
10425 Candy Apple Ln, Indianapolis, IN 46235
$258
Cash flow
6.1%
Cash-on-Cash Return
7.6%
Cap rate
0.9%
Rent to Value Ratio
Active
$459,000
4
bds
|
3
ba
|
3,351
sqft
|
built
2011
302 Sanders St, Indianapolis, IN 46225
$-212
Cash flow
-2.4%
Cash-on-Cash Return
5.6%
Cap rate
0.7%
Rent to Value Ratio
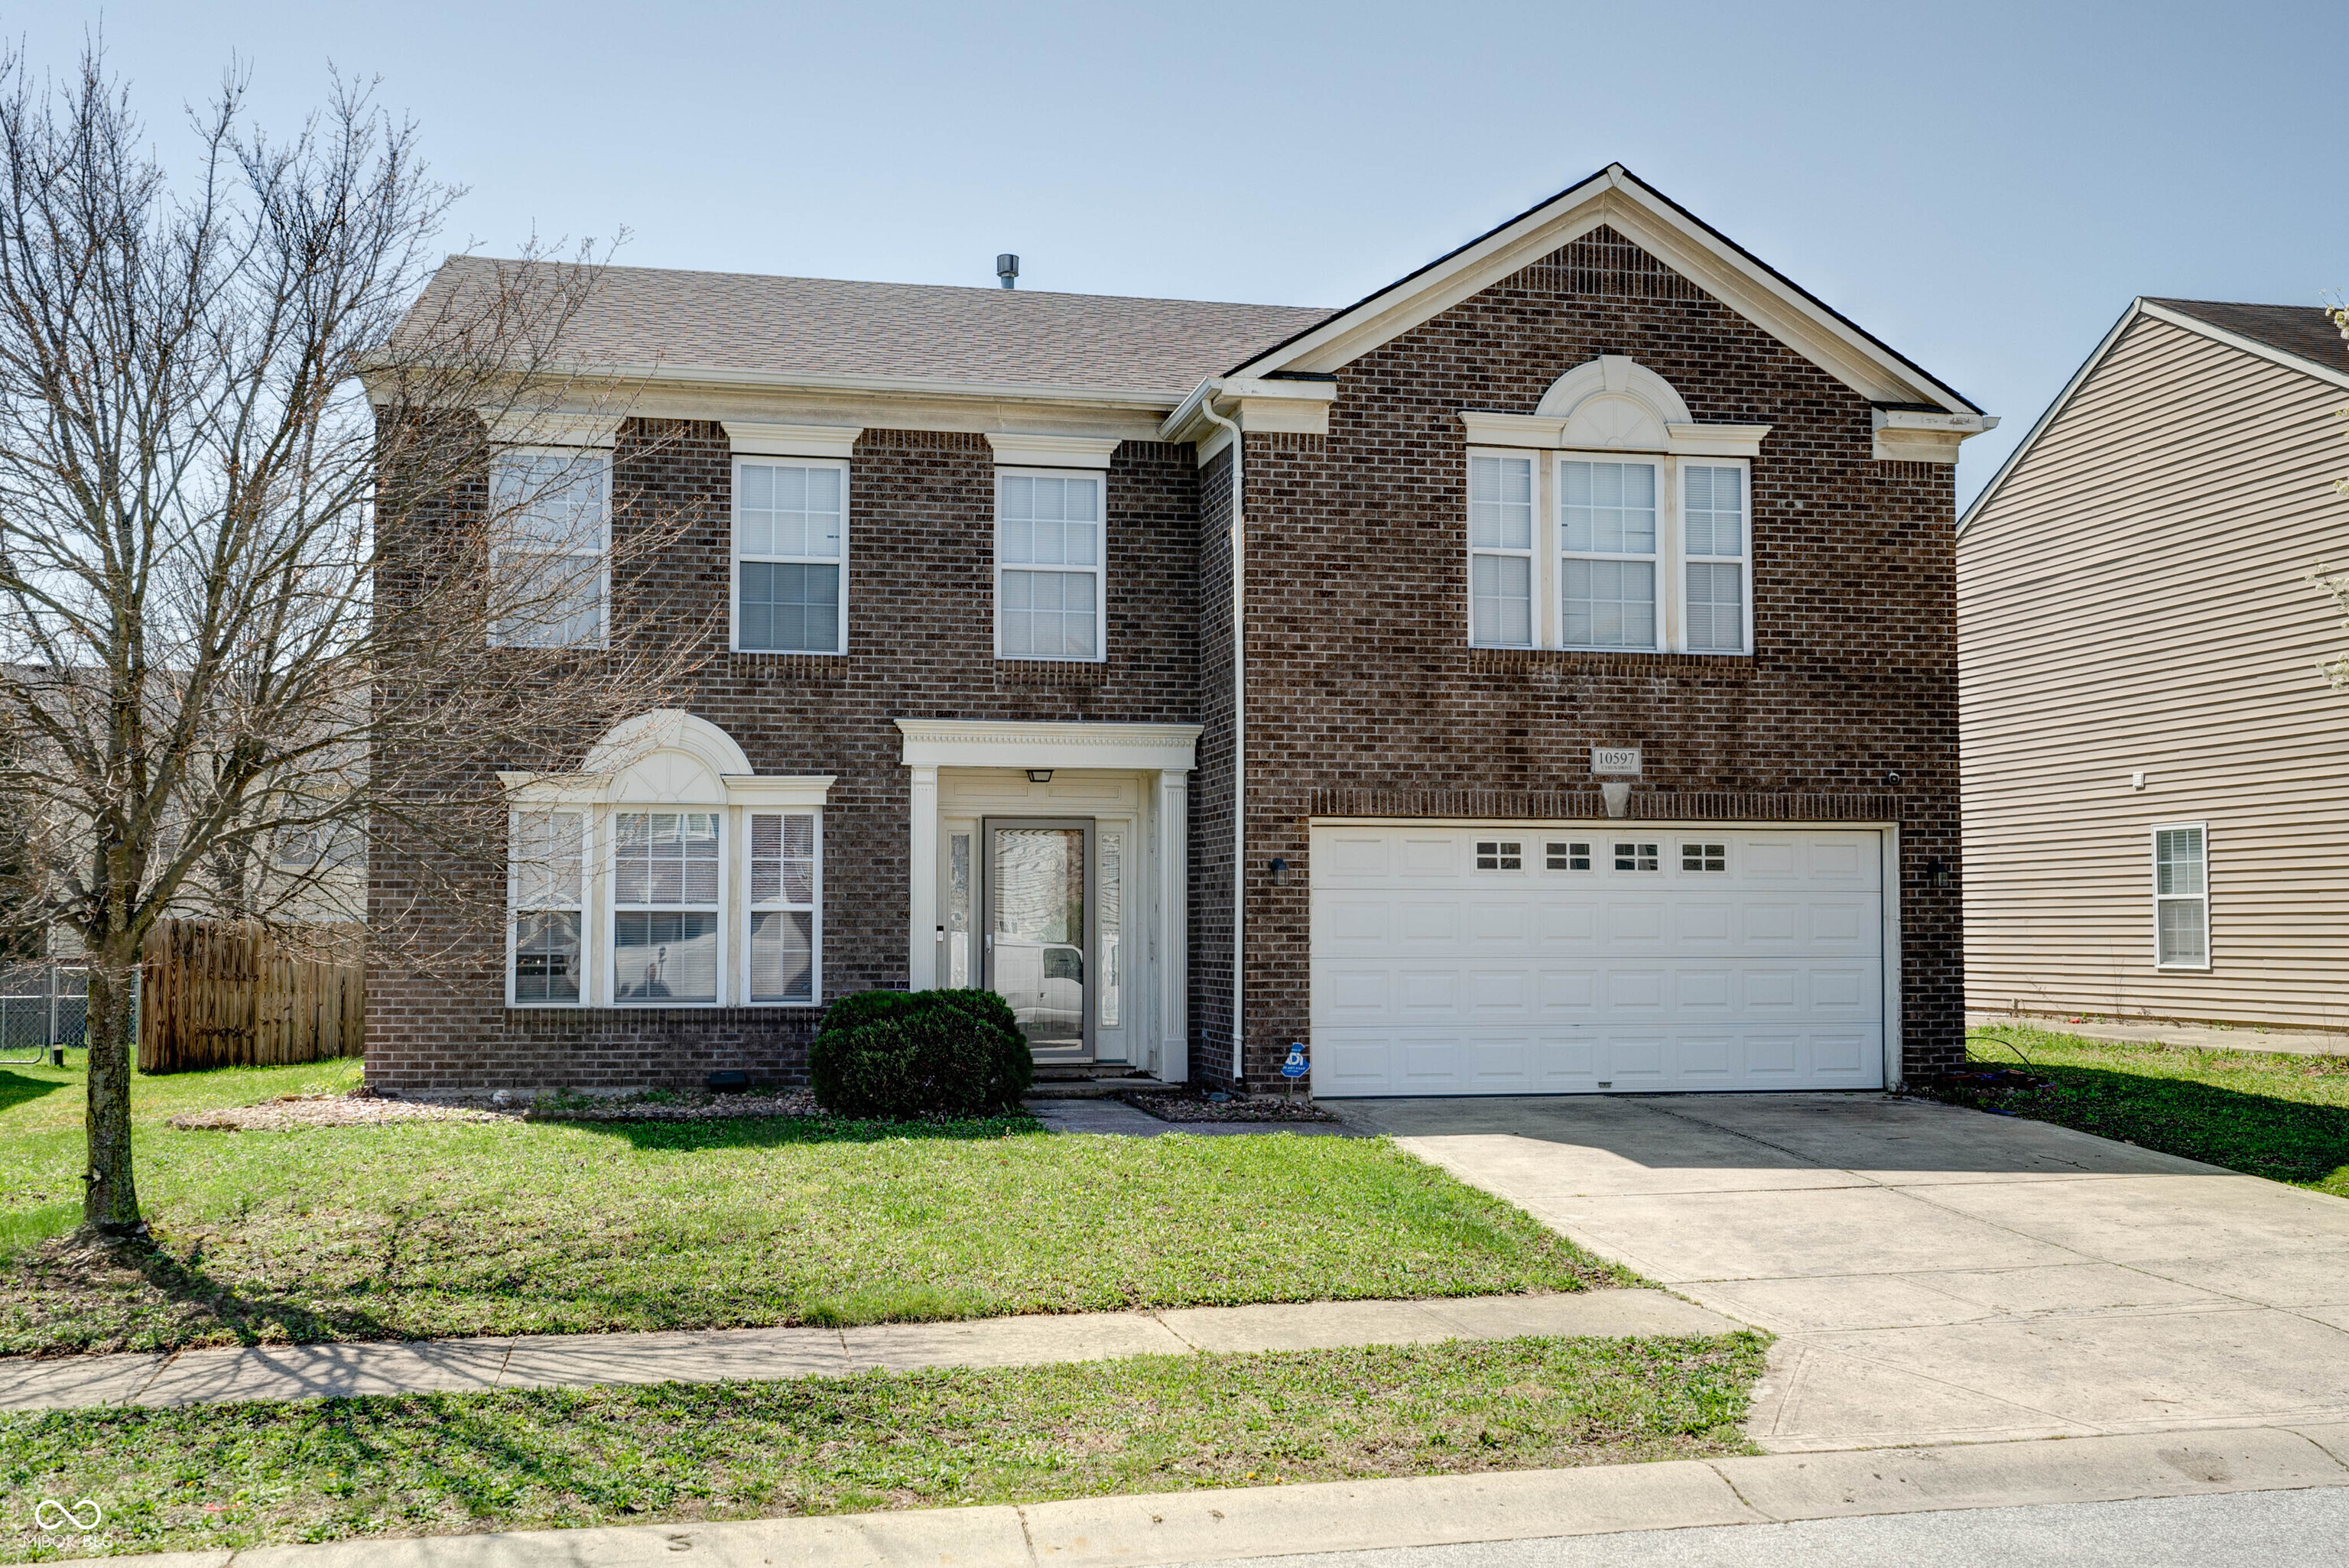
Active
$345,000
3
bds
|
3
ba
|
2,664
sqft
|
built
2004
10597 Cyrus Dr, Indianapolis, IN 46231
$-404
Cash flow
-6.1%
Cash-on-Cash Return
4.7%
Cap rate
0.6%
Rent to Value Ratio
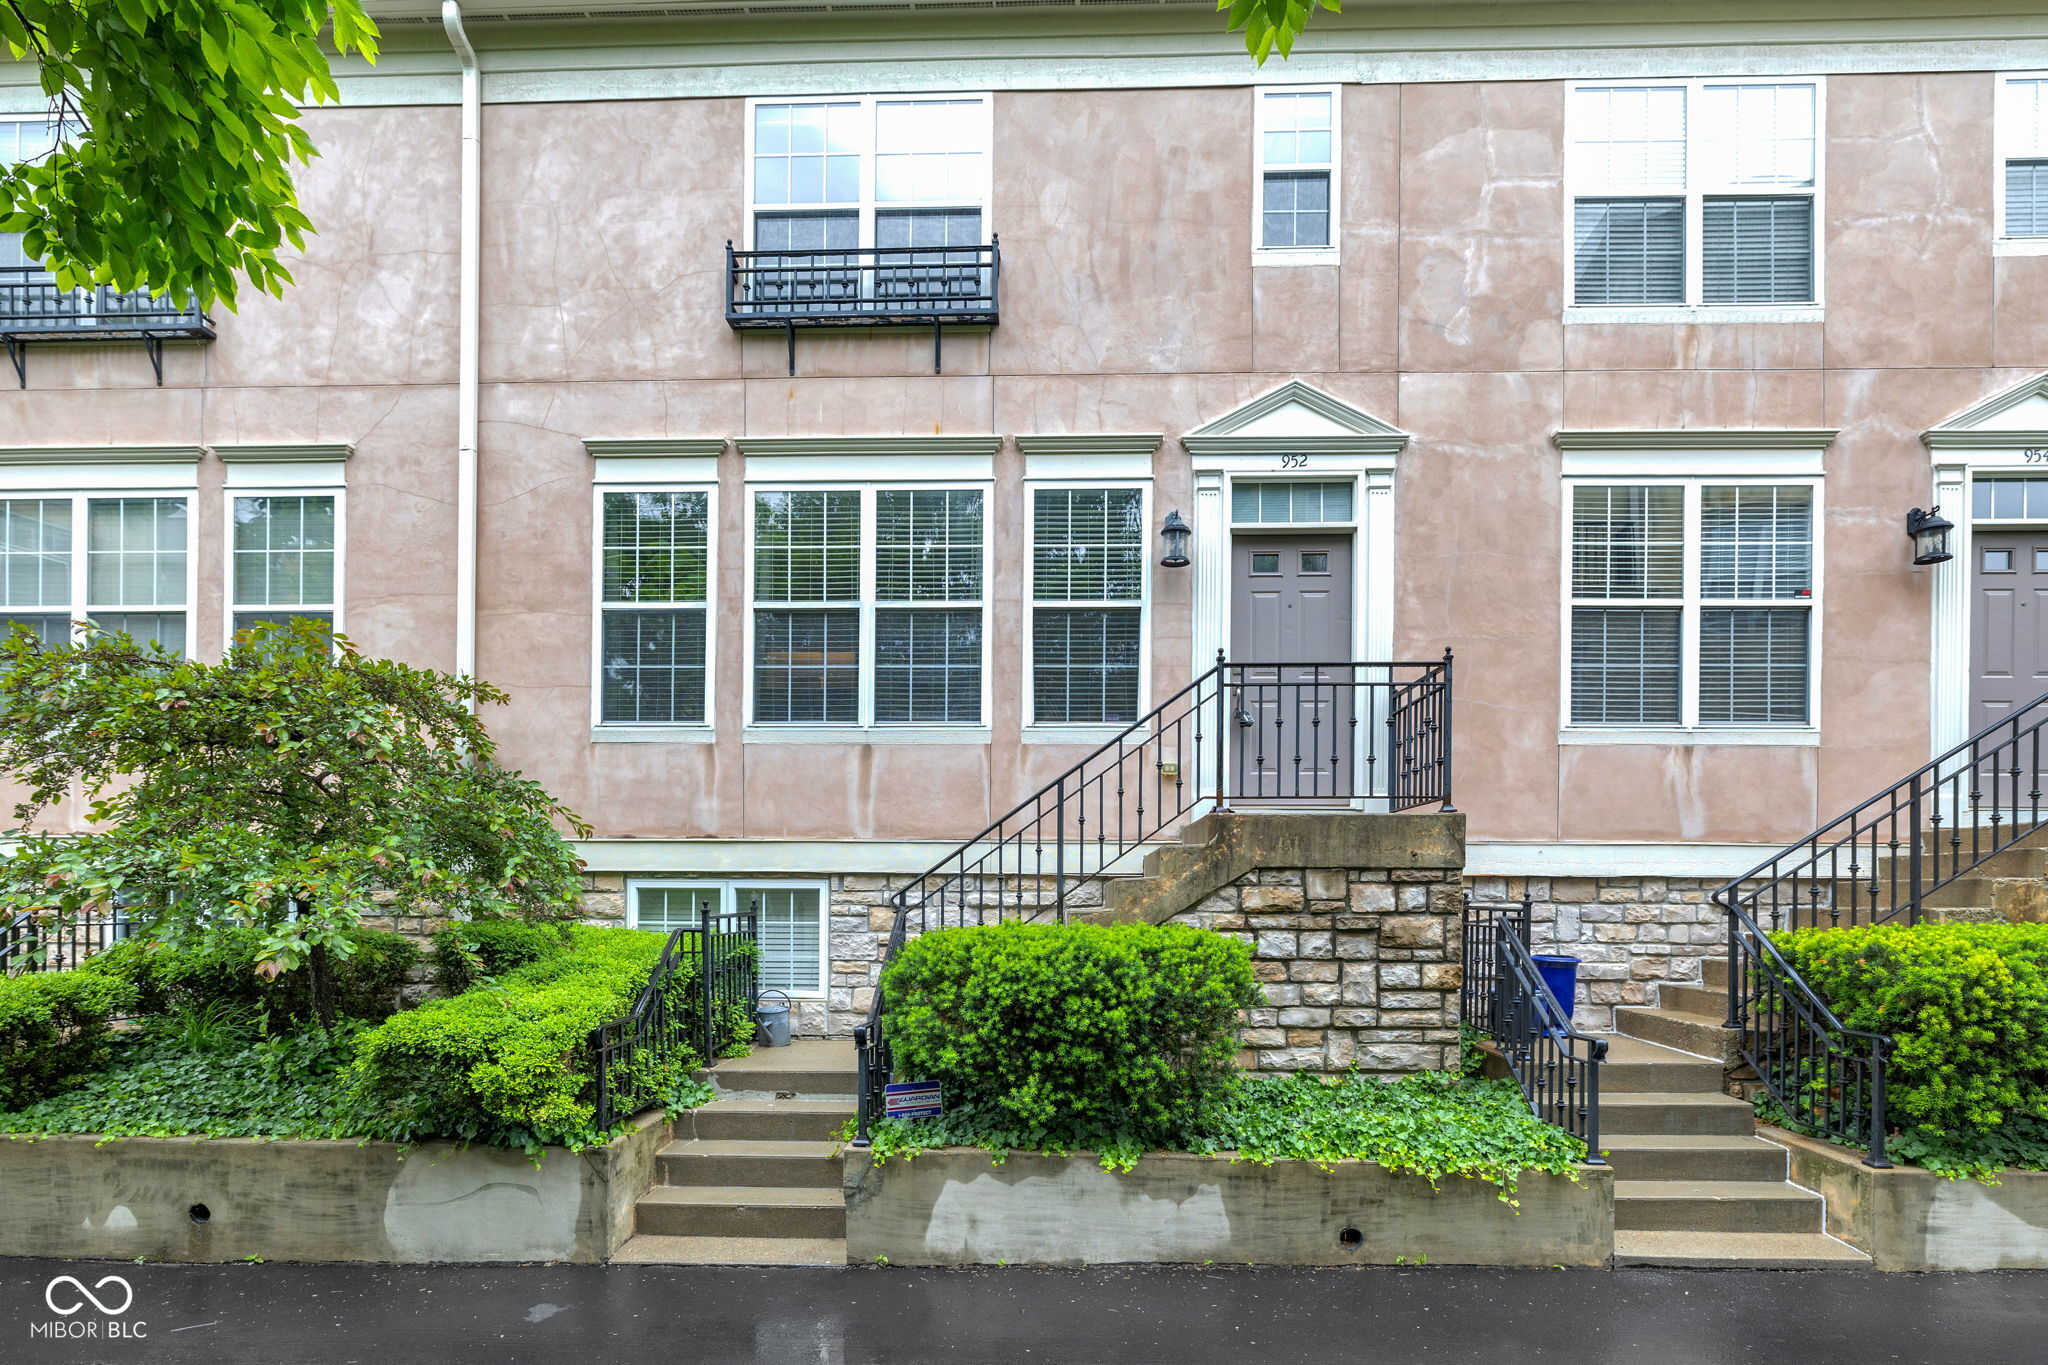
Active
$325,000
2
bds
|
3
ba
|
1,270
sqft
|
built
2003
952 Junction Pl, Indianapolis, IN 46220
$-414
Cash flow
-6.6%
Cash-on-Cash Return
4.6%
Cap rate
0.7%
Rent to Value Ratio
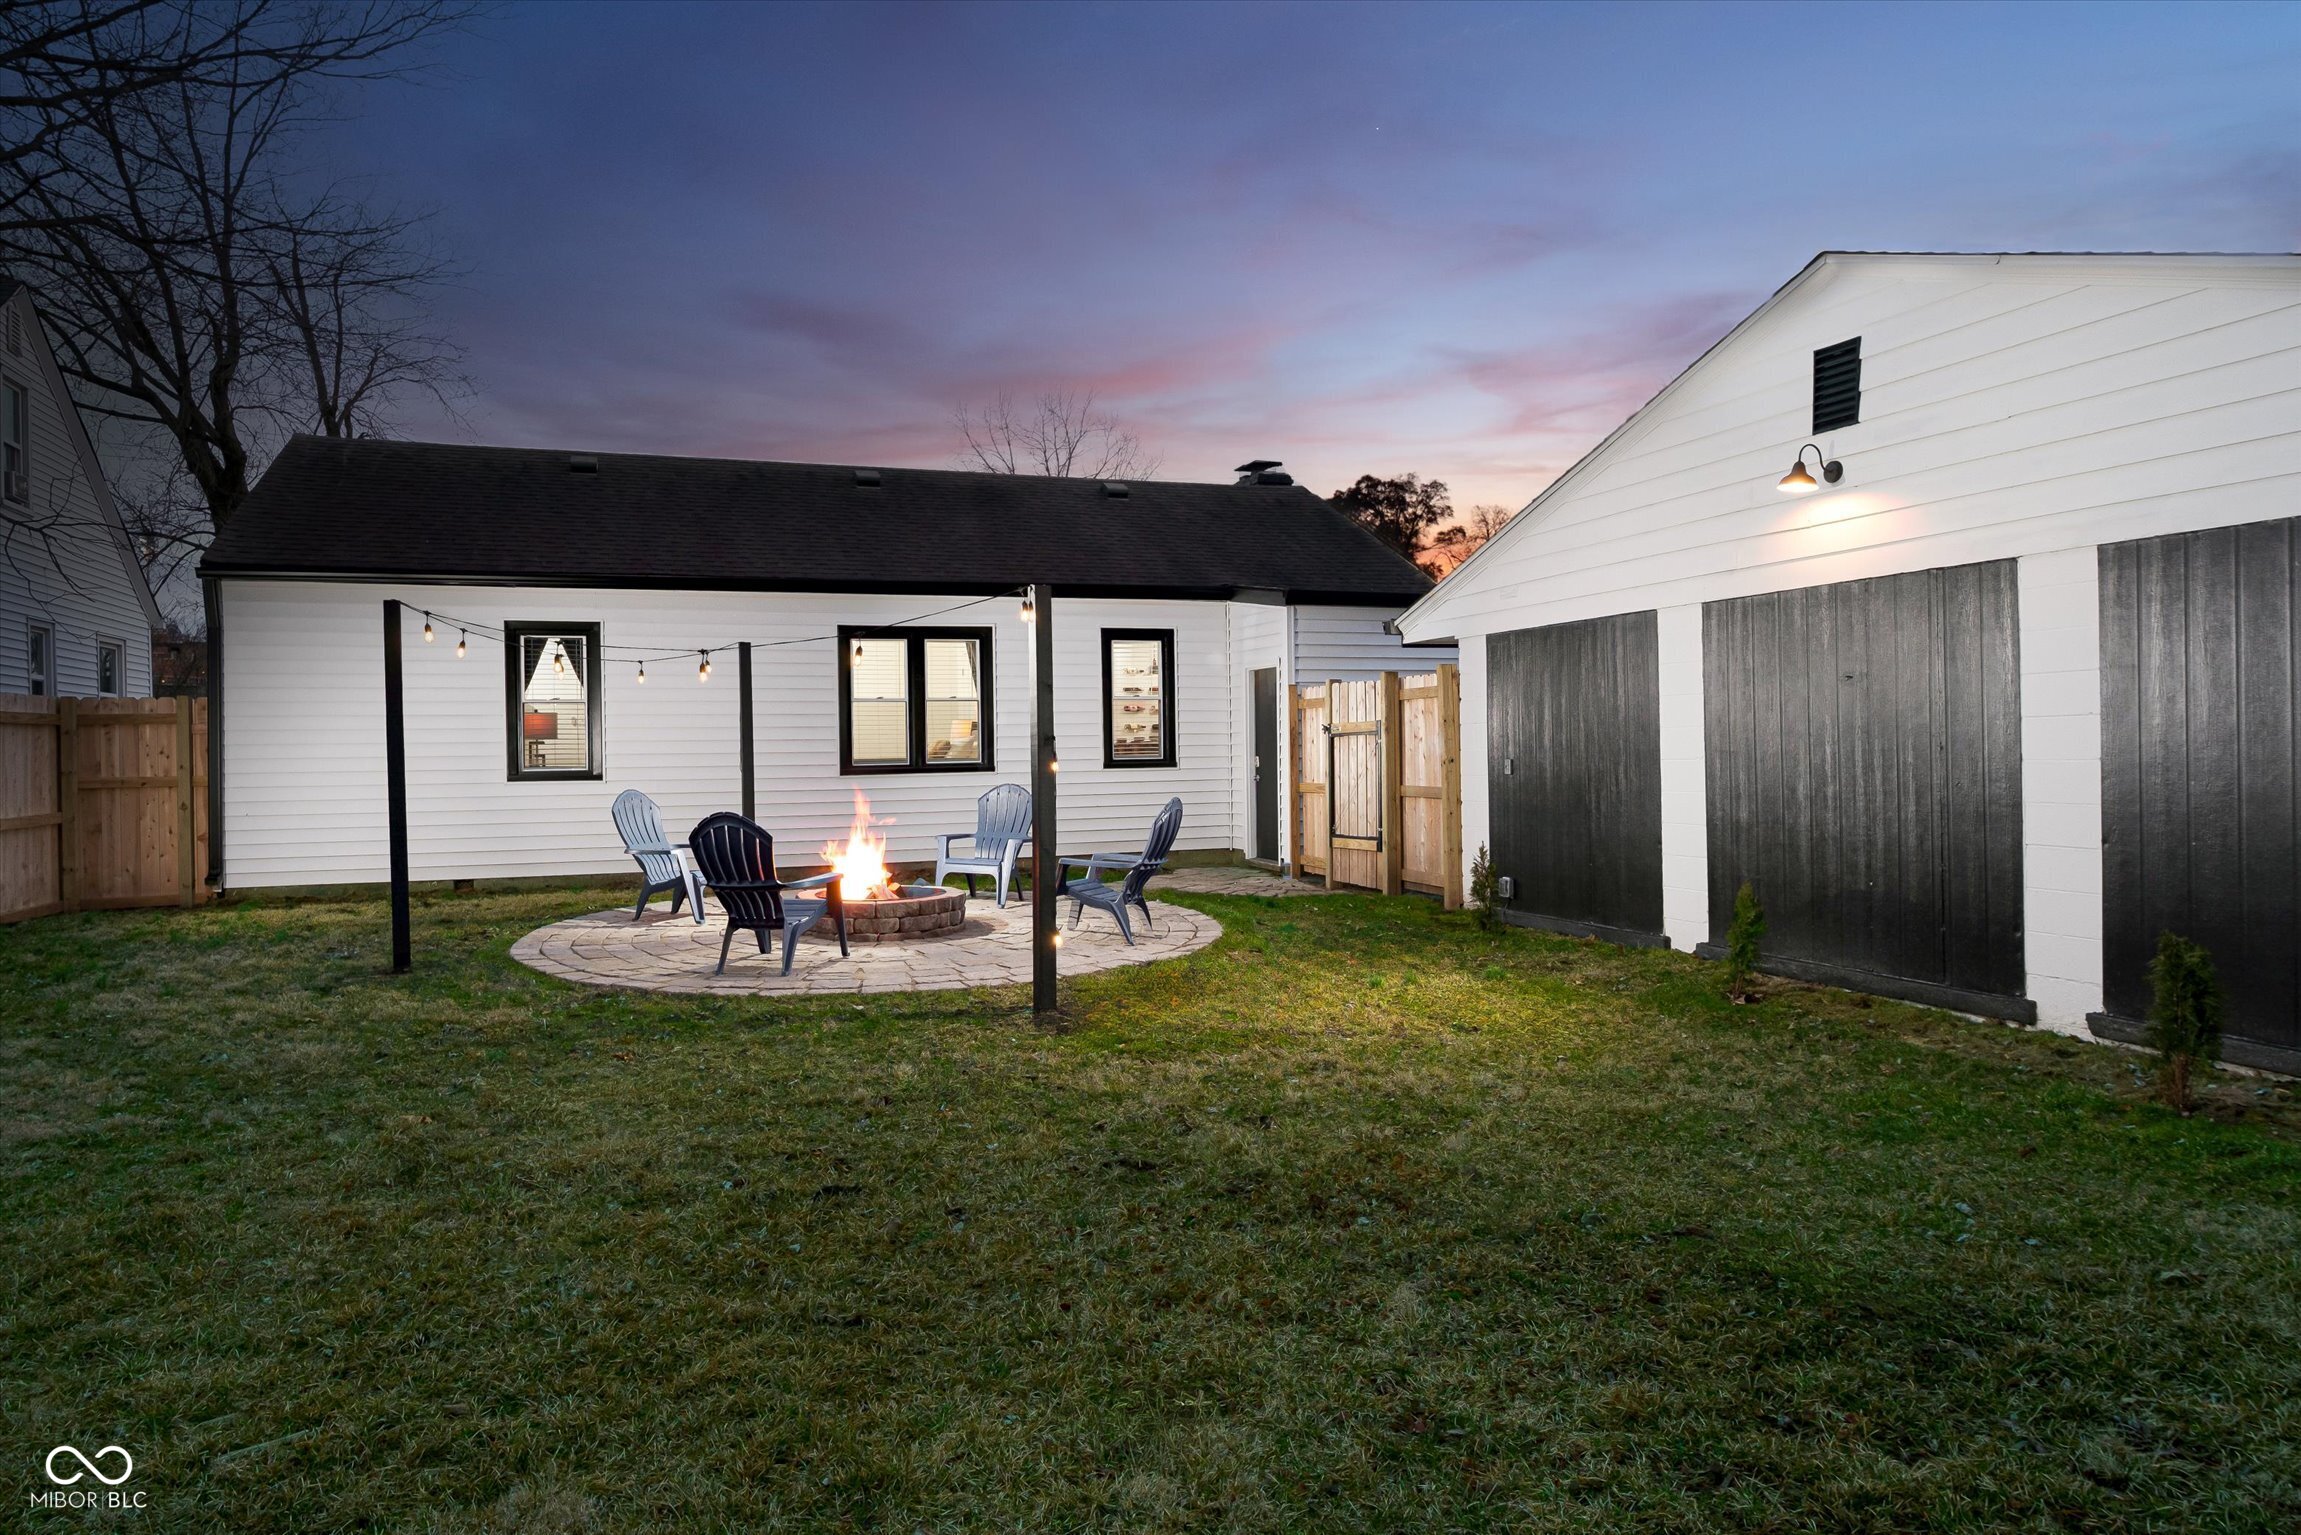
Active
$324,900
3
bds
|
1
ba
|
1,010
sqft
|
built
1938
536 W 52nd St, Indianapolis, IN 46208
$-422
Cash flow
-6.8%
Cash-on-Cash Return
4.6%
Cap rate
0.6%
Rent to Value Ratio
Active
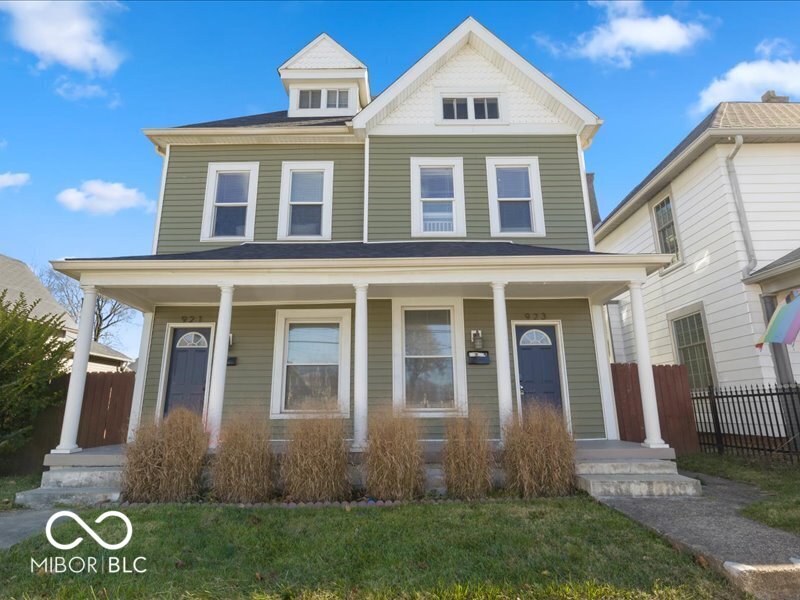
$300,000
3
bds
|
2
ba
|
1,638
sqft
|
built
2016
923 S State Ave, Indianapolis, IN 46203
$-295
Cash flow
-5.1%
Cash-on-Cash Return
5.0%
Cap rate
0.6%
Rent to Value Ratio
Active
$190,000
2
bds
|
1
ba
|
1,140
sqft
|
built
1918
2957 Winthrop Ave, Indianapolis, IN 46205
$-7
Cash flow
-0.2%
Cash-on-Cash Return
6.1%
Cap rate
0.7%
Rent to Value Ratio
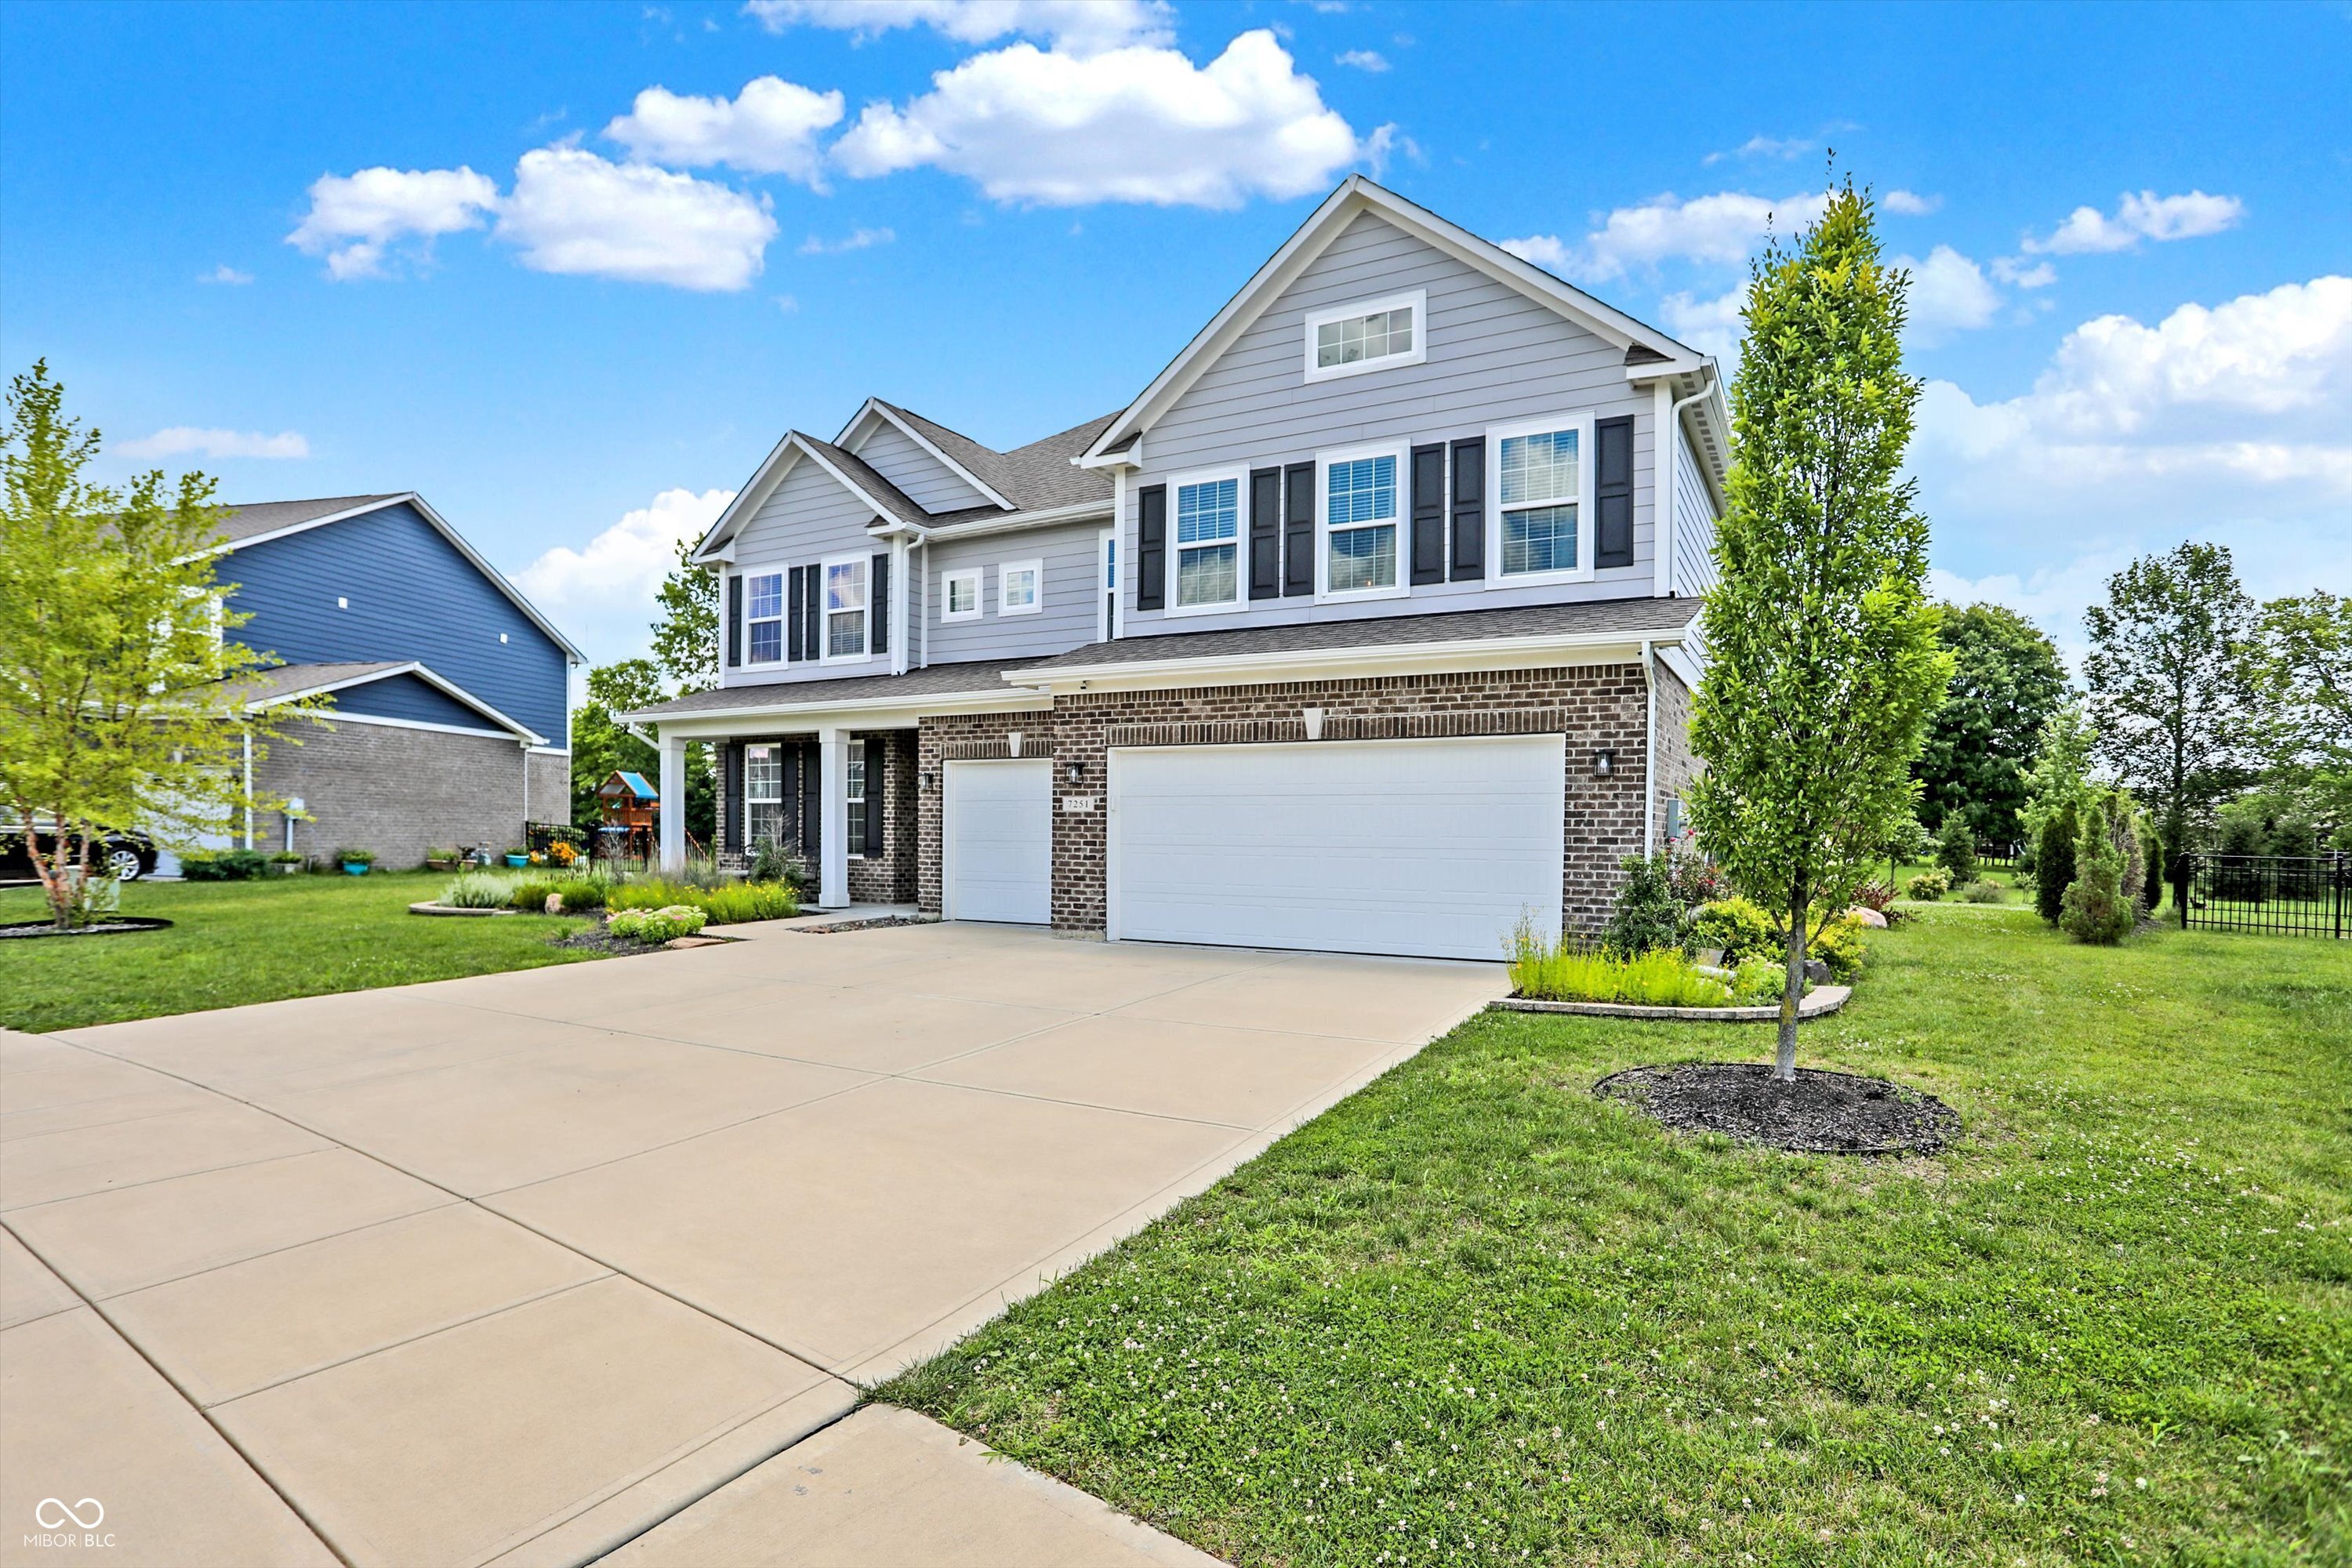
Active
$500,000
5
bds
|
3
ba
|
2,992
sqft
|
built
2019
7251 Birch Leaf Dr, Indianapolis, IN 46259
$-408
Cash flow
-4.3%
Cash-on-Cash Return
5.2%
Cap rate
0.6%
Rent to Value Ratio
Active
$725,000
4
bds
|
5
ba
|
4,882
sqft
|
built
1999
7093 Republic Ln, Indianapolis, IN 46259
$24
Cash flow
0.2%
Cash-on-Cash Return
6.2%
Cap rate
0.8%
Rent to Value Ratio
Active
$395,000
3
bds
|
3
ba
|
2,070
sqft
|
built
1960
7118 Mikesell Dr, Indianapolis, IN 46260
$-643
Cash flow
-8.5%
Cash-on-Cash Return
4.2%
Cap rate
0.5%
Rent to Value Ratio
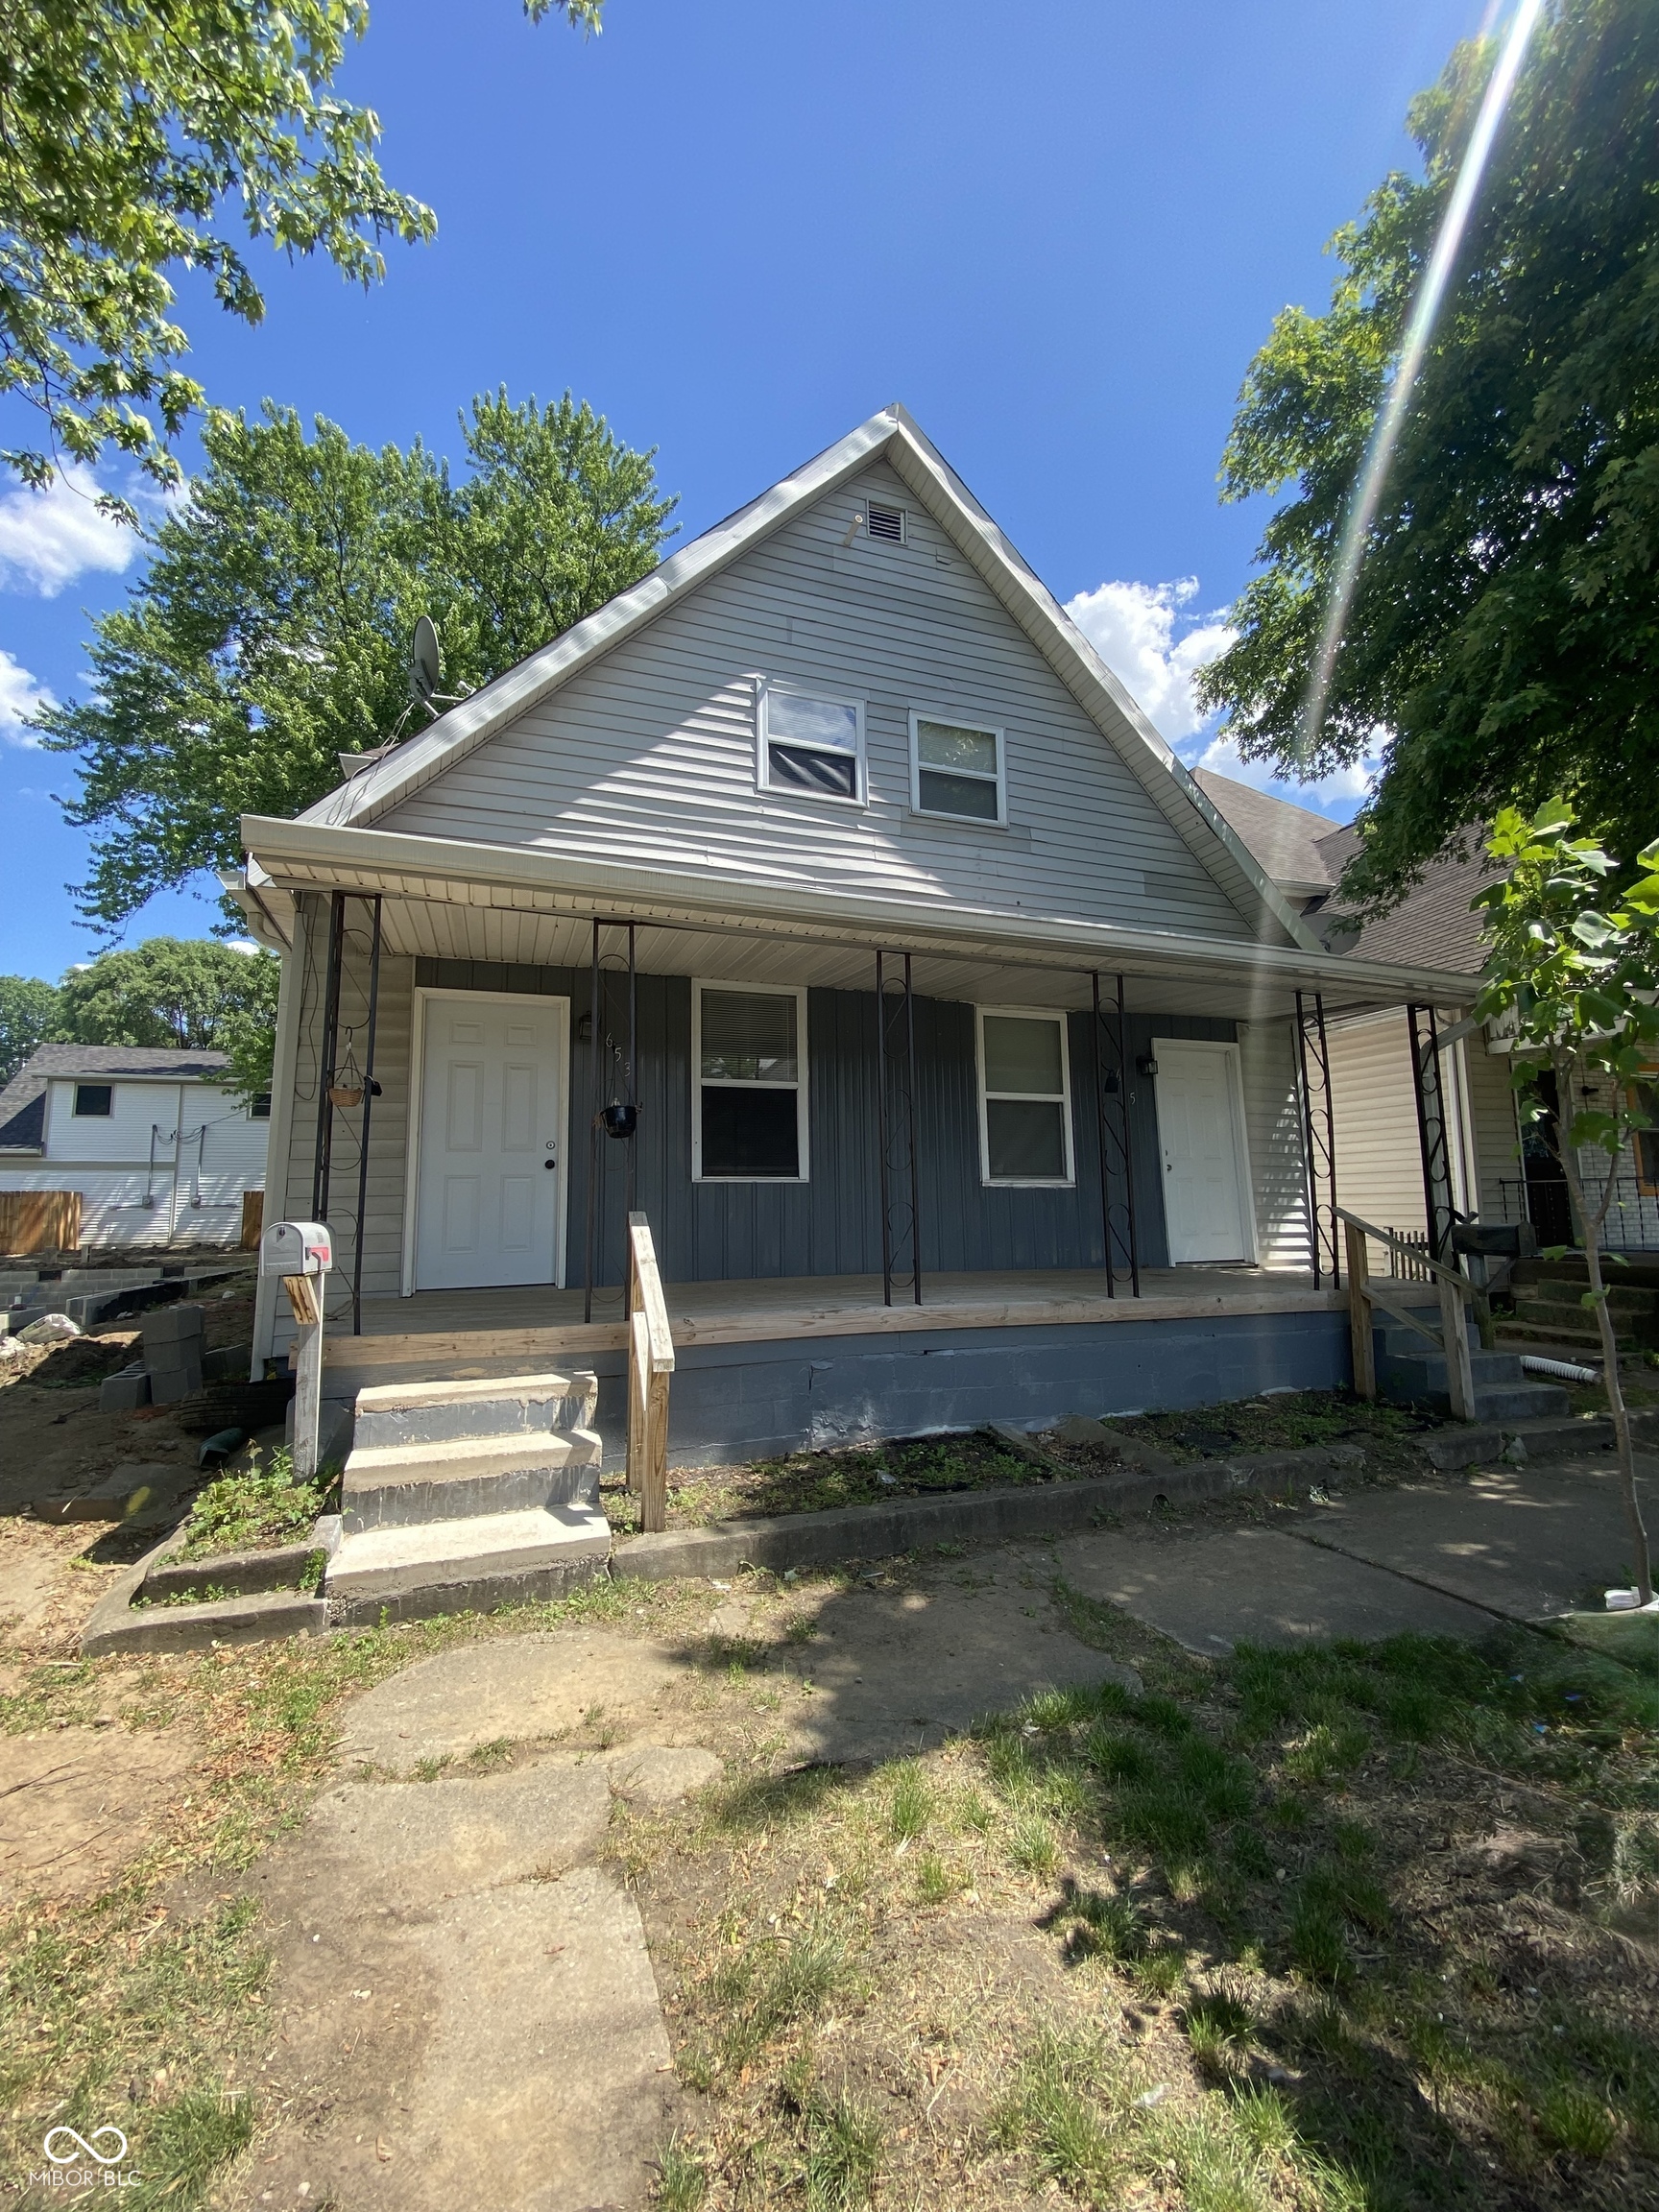
Active
$245,000
3
bds
|
0
ba
|
0
sqft
|
built
1990
653 Birch Ave, Indianapolis, IN 46221
$-565
Cash flow
-12.0%
Cash-on-Cash Return
3.4%
Cap rate
0.4%
Rent to Value Ratio