Indianapolis, IN Investment Properties for Sale
Browse homes for sale and investment properties in Indianapolis, IN. Refine your search by price, property type, or more.
Best cash flowing properties in Indianapolis, IN
Pending
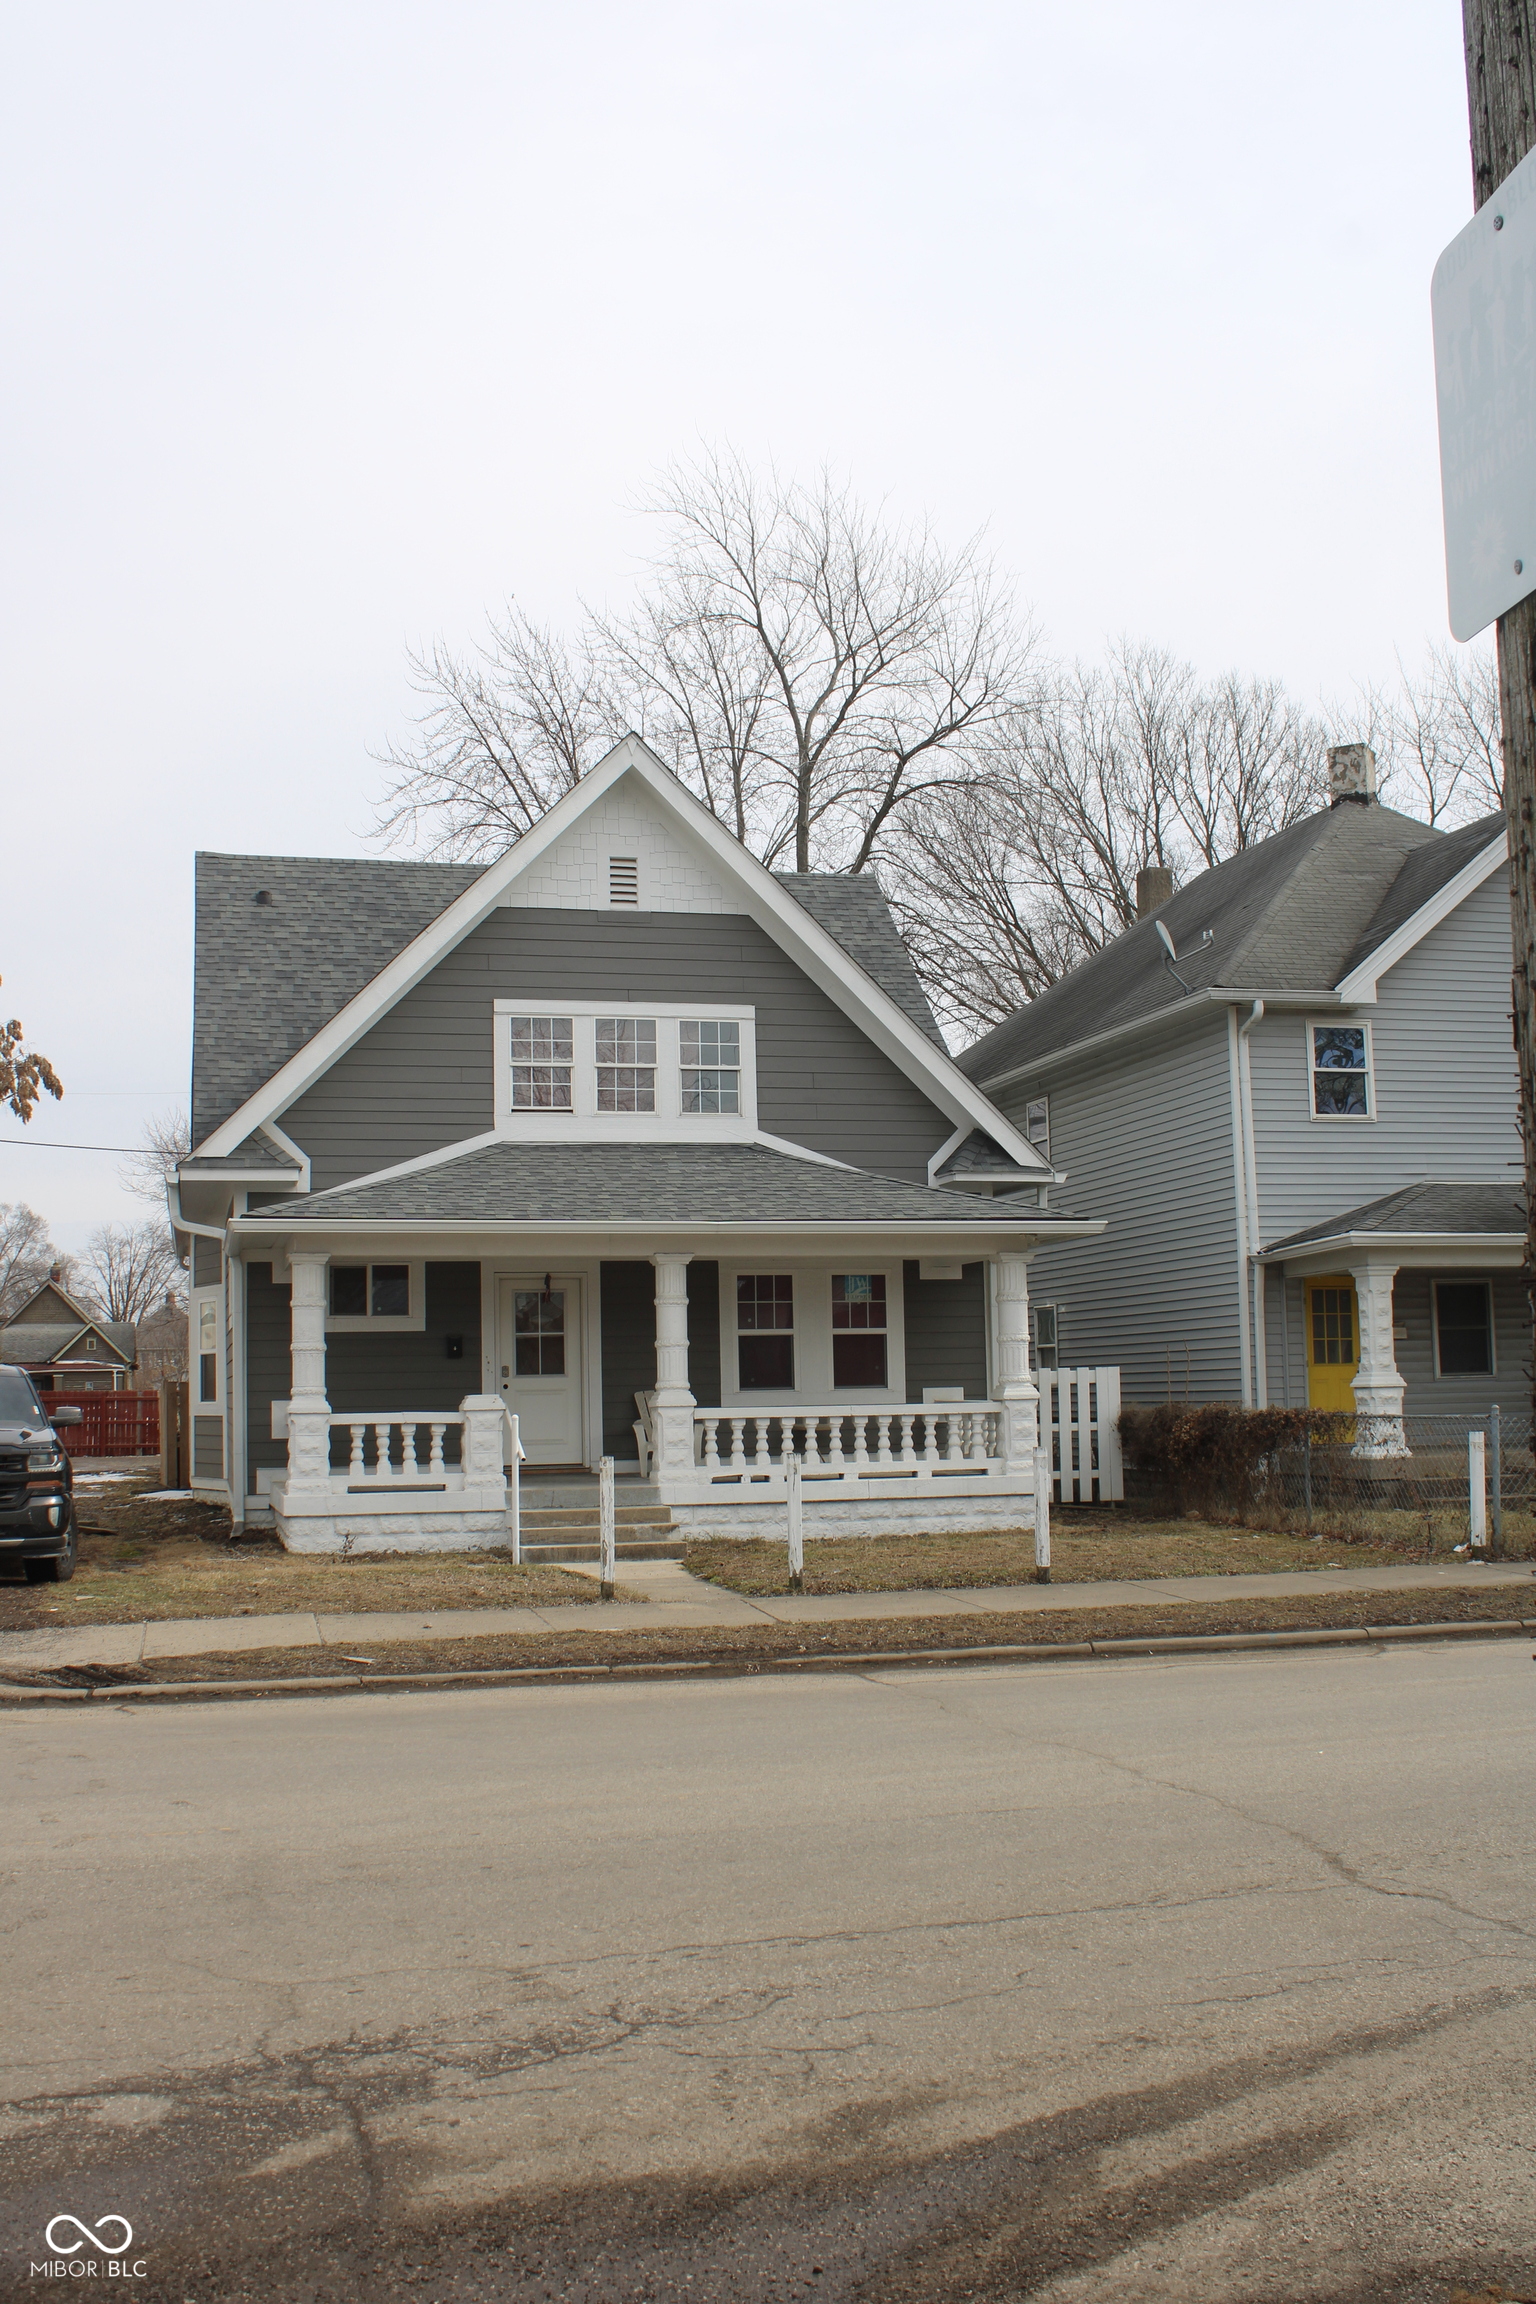
$100,000
2
bds
|
0
ba
|
1,032
sqft
|
built
1900
21 S Warman Ave, Indianapolis, IN 46222
$580
Cash flow
30.3%
Cash-on-Cash Return
13.2%
Cap rate
1.6%
Rent to Value Ratio
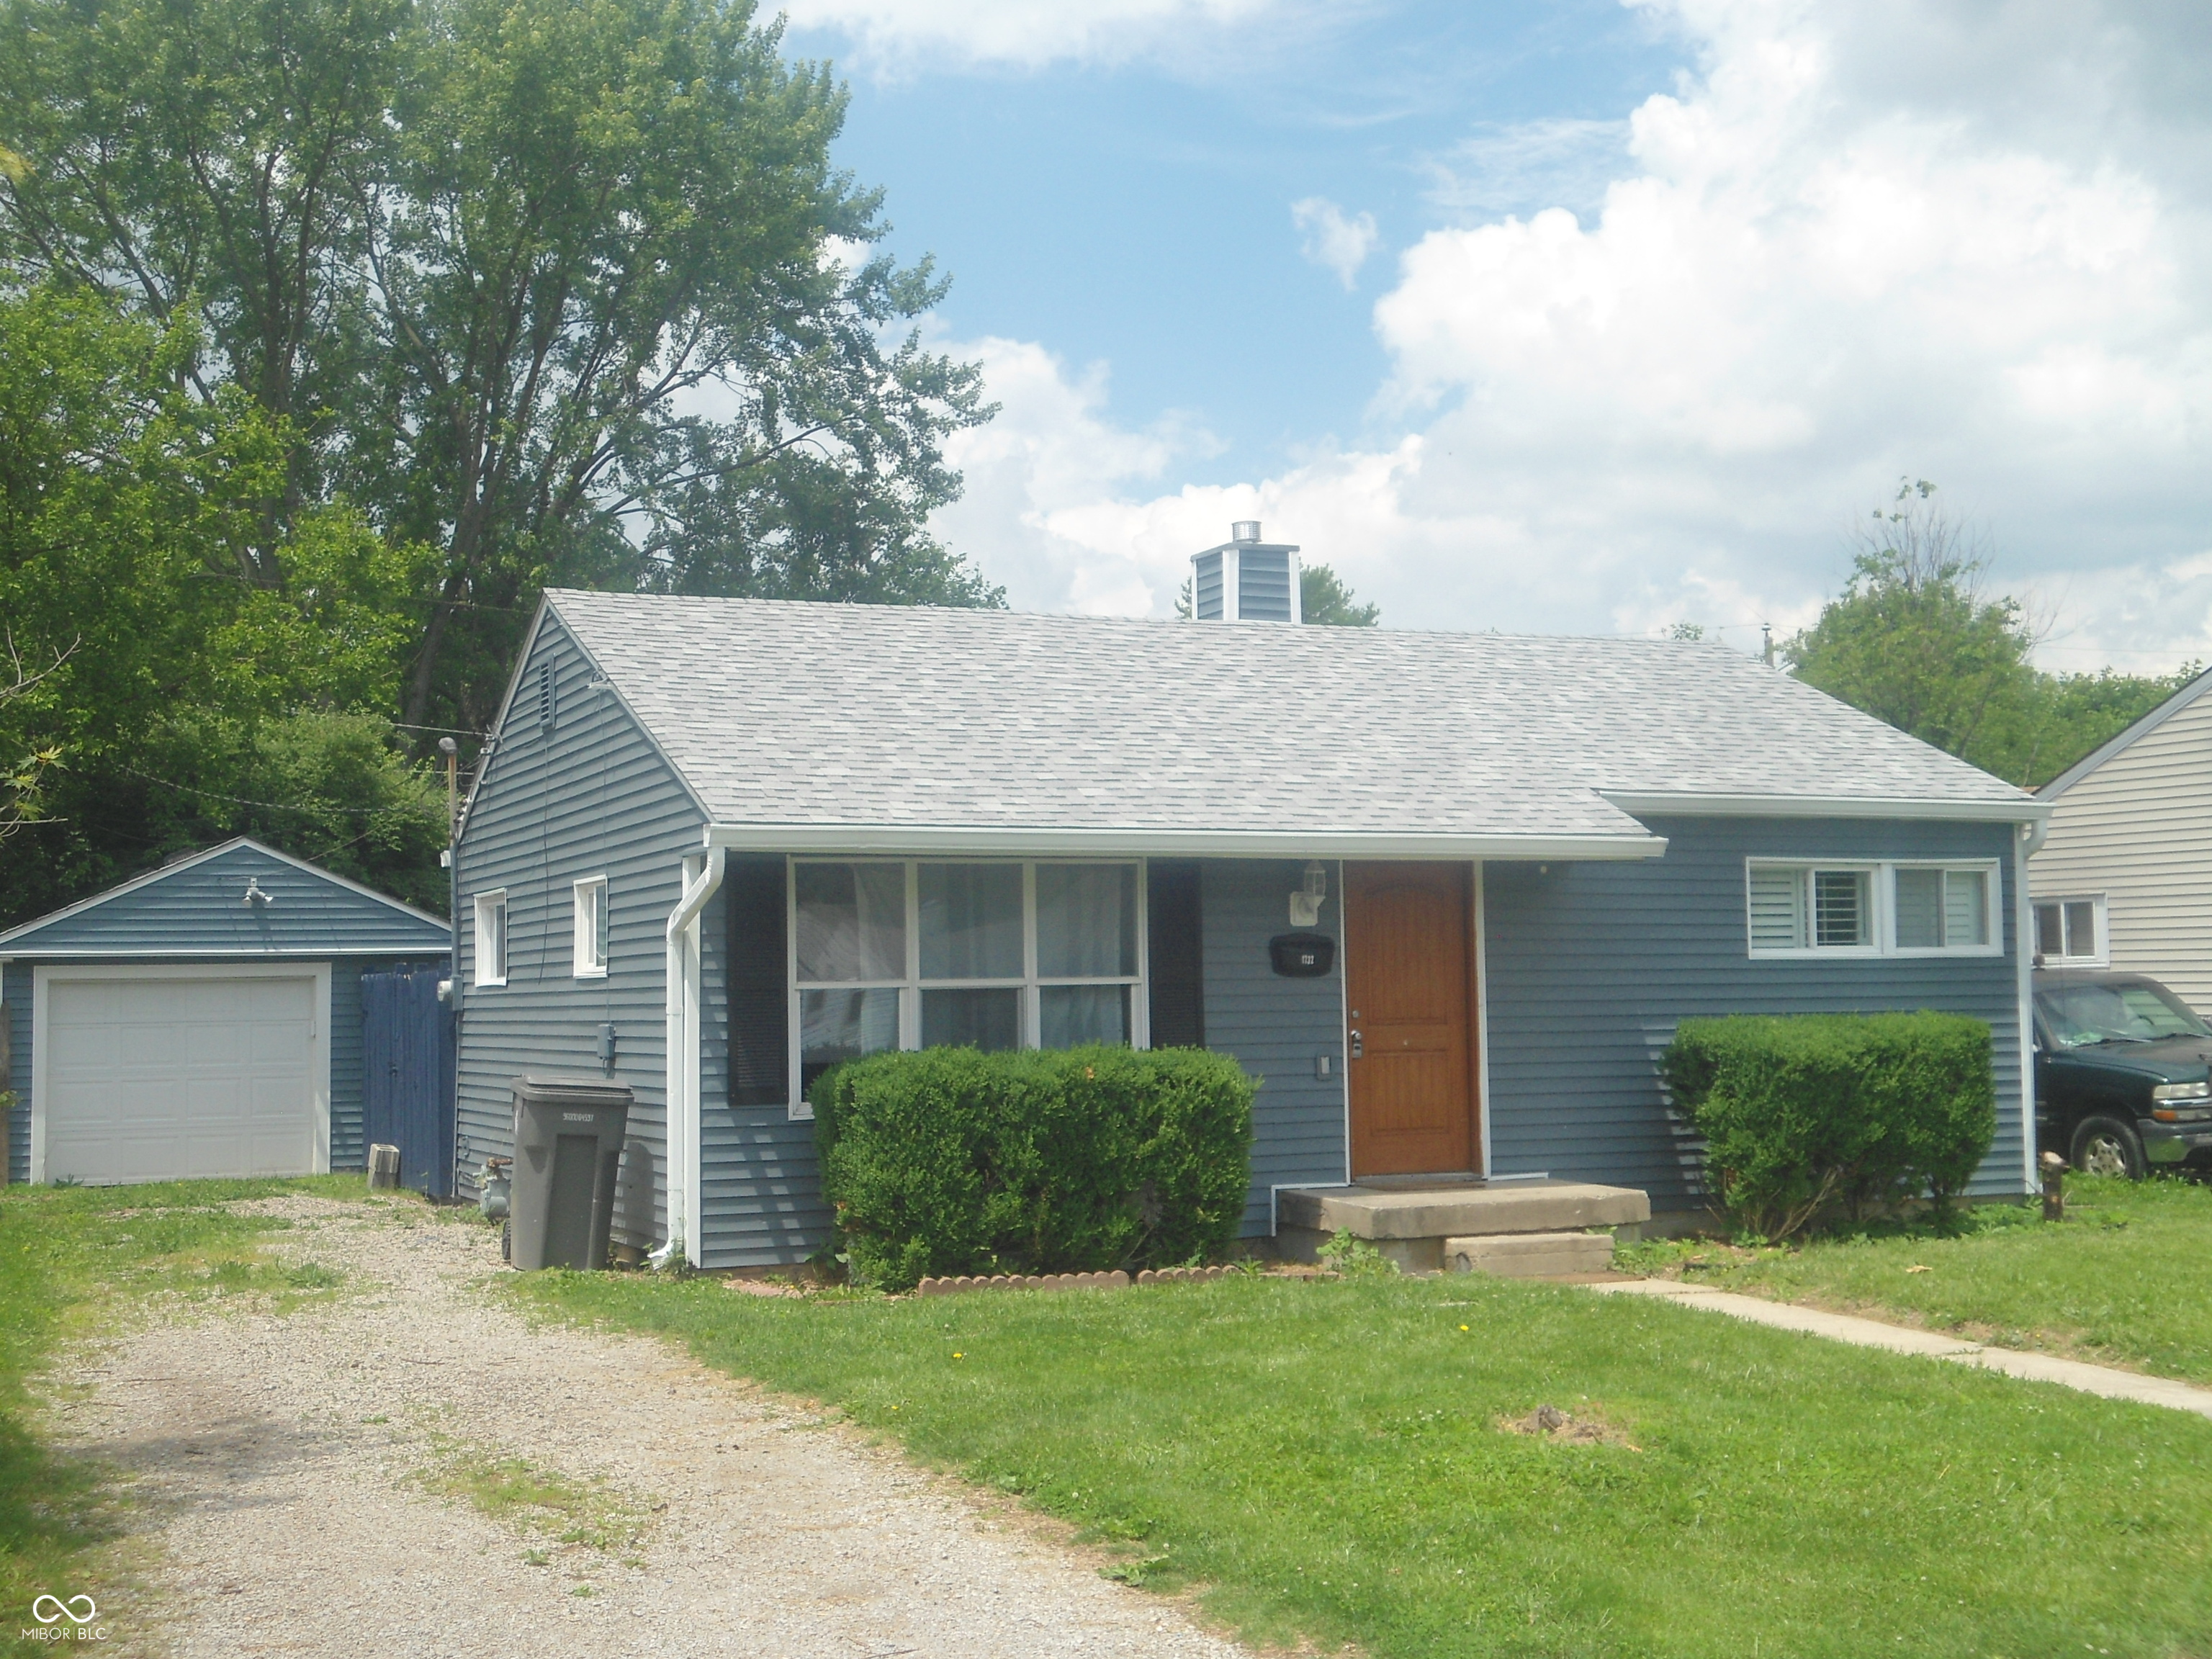
Active
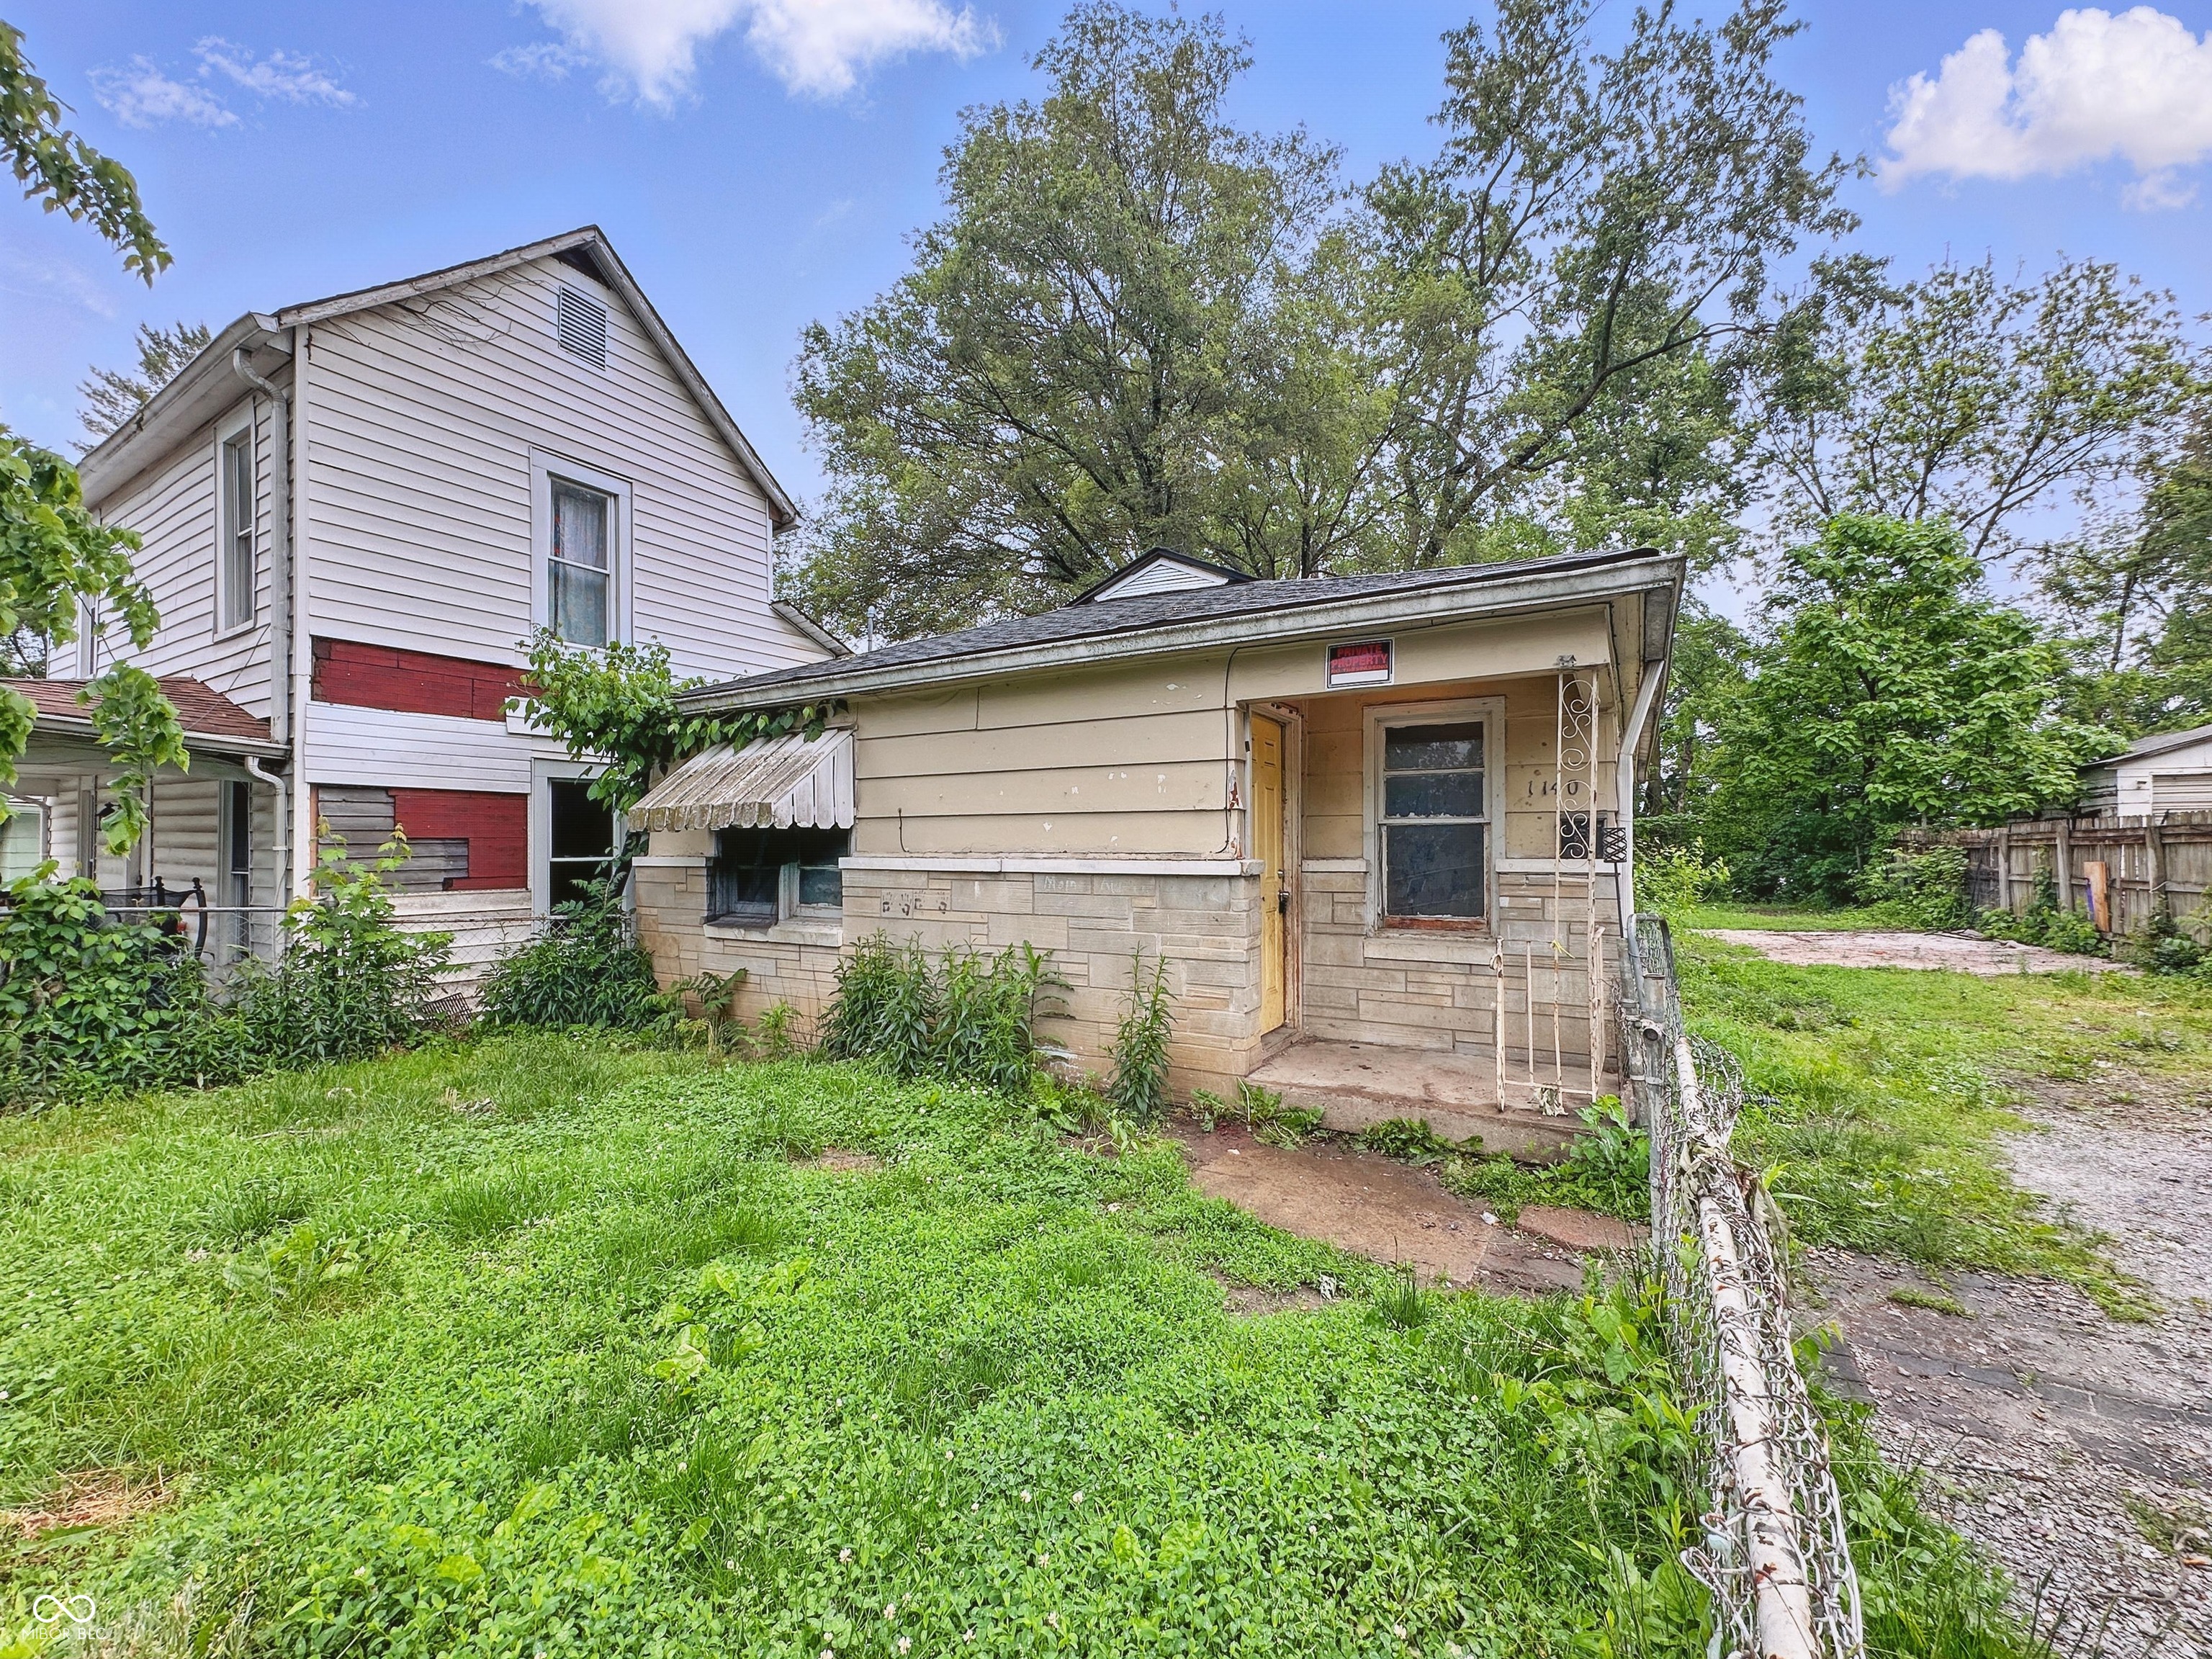
$109,900
2
bds
|
1
ba
|
840
sqft
|
built
1958
1140 Mc Dougal St, Indianapolis, IN 46203
$183
Cash flow
8.7%
Cash-on-Cash Return
8.3%
Cap rate
1.0%
Rent to Value Ratio
2,000 out of 2,142 properties for sale in Indianapolis, IN
Limited Results Shown
Create a free account, or log in to reveal all property listings and enjoy the complete experience.
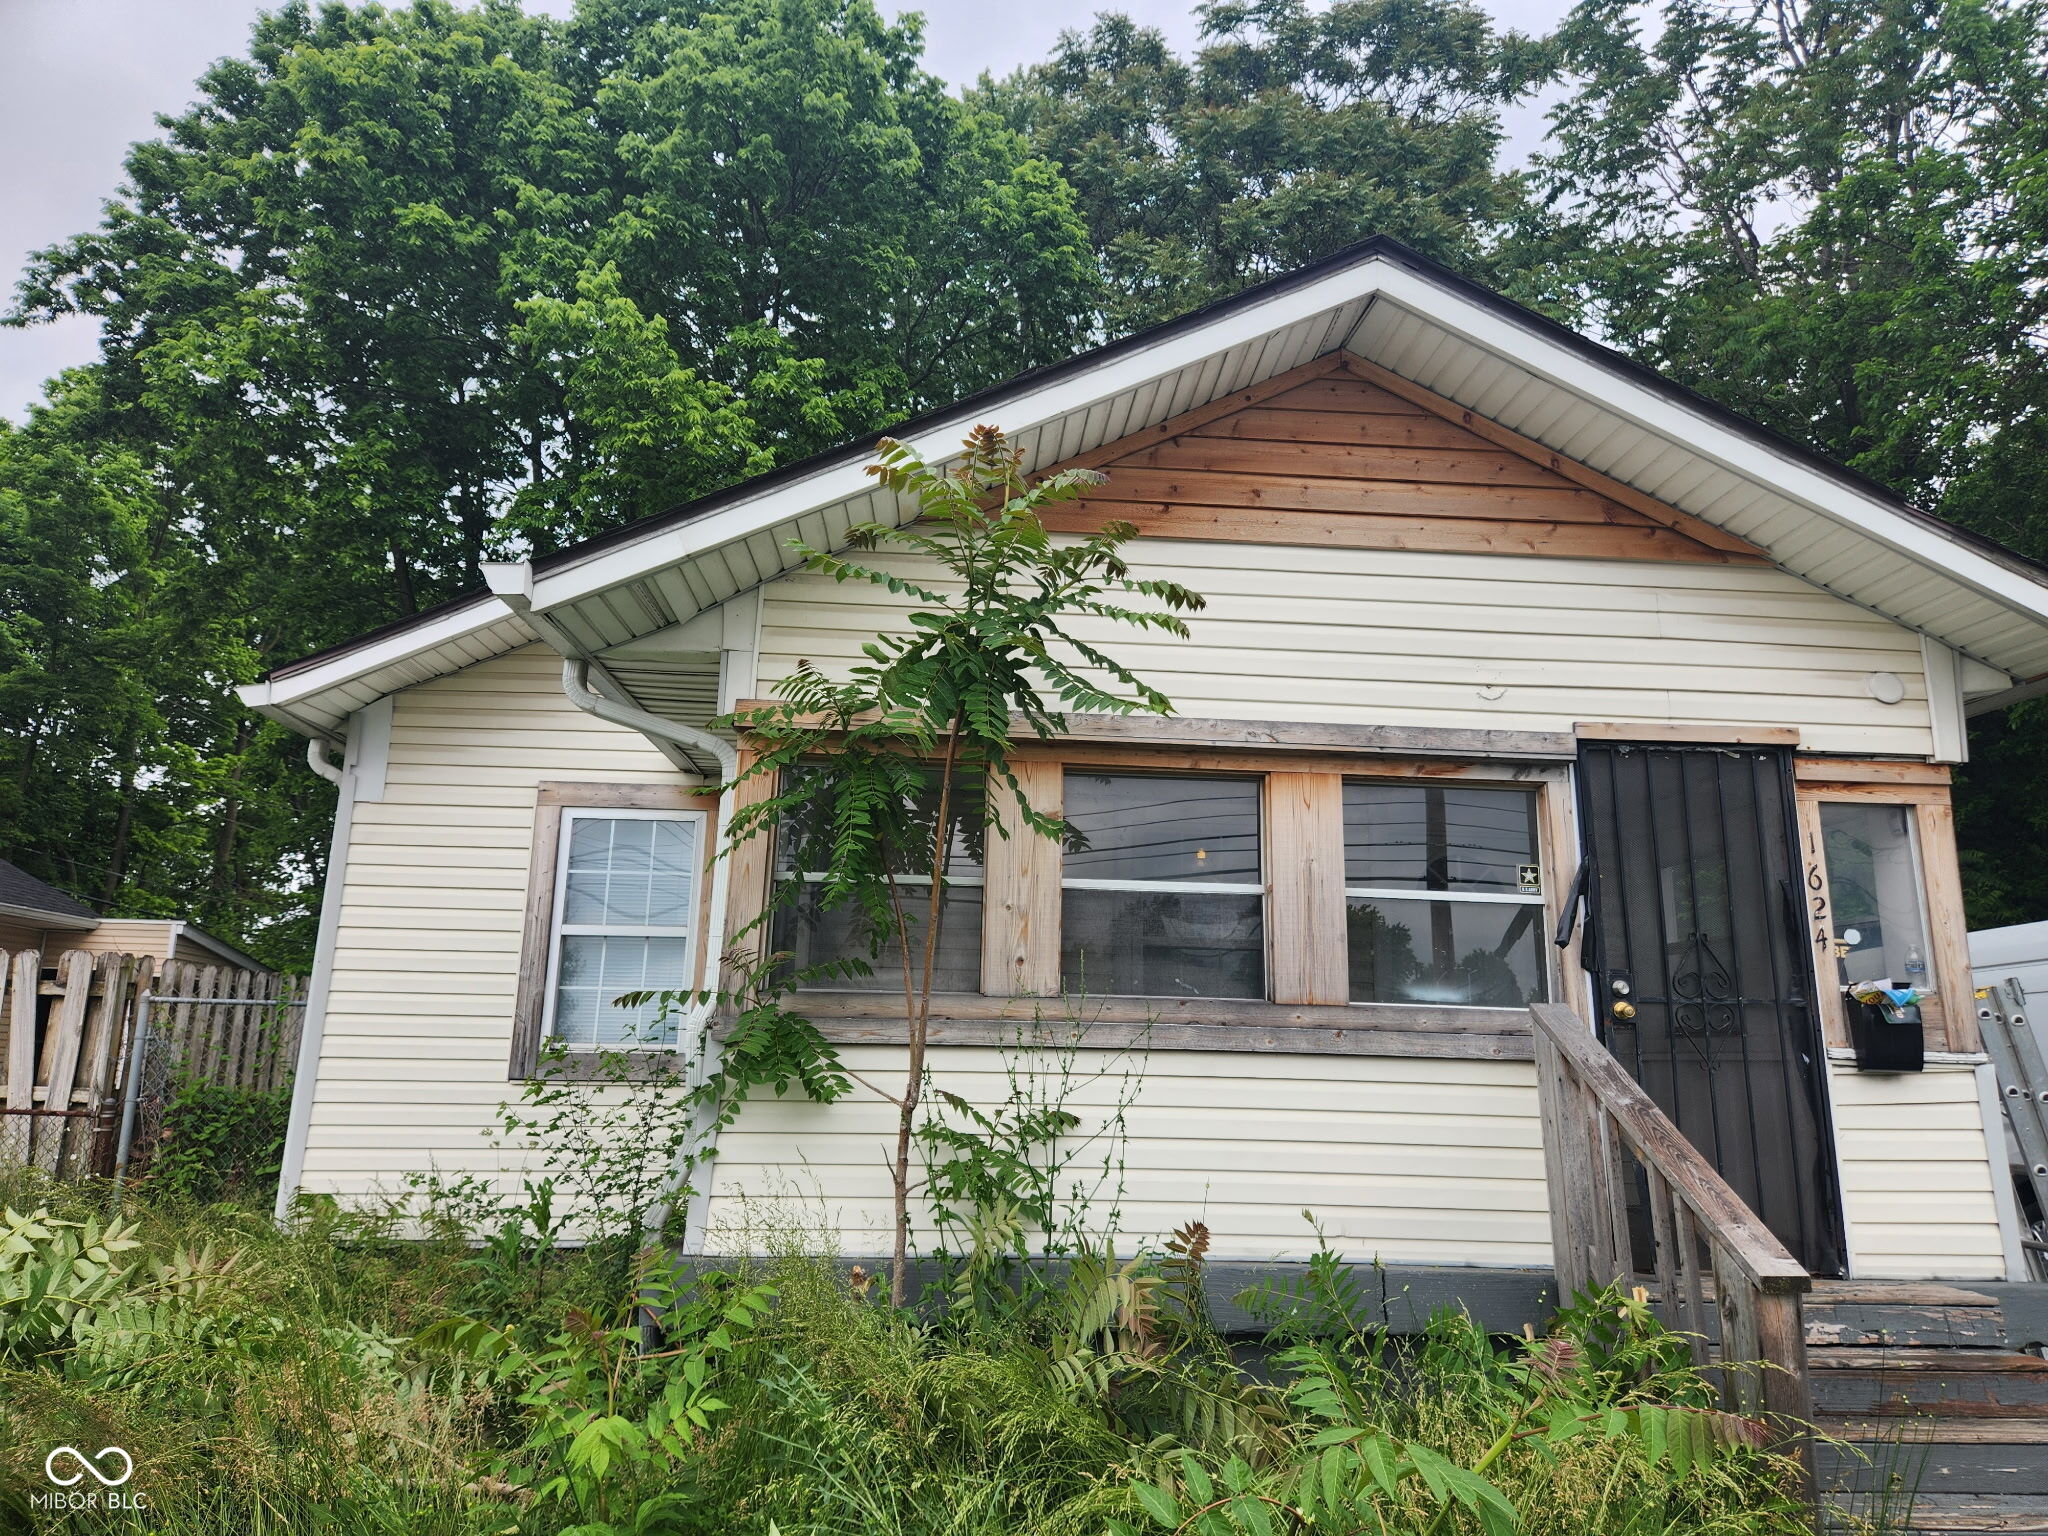
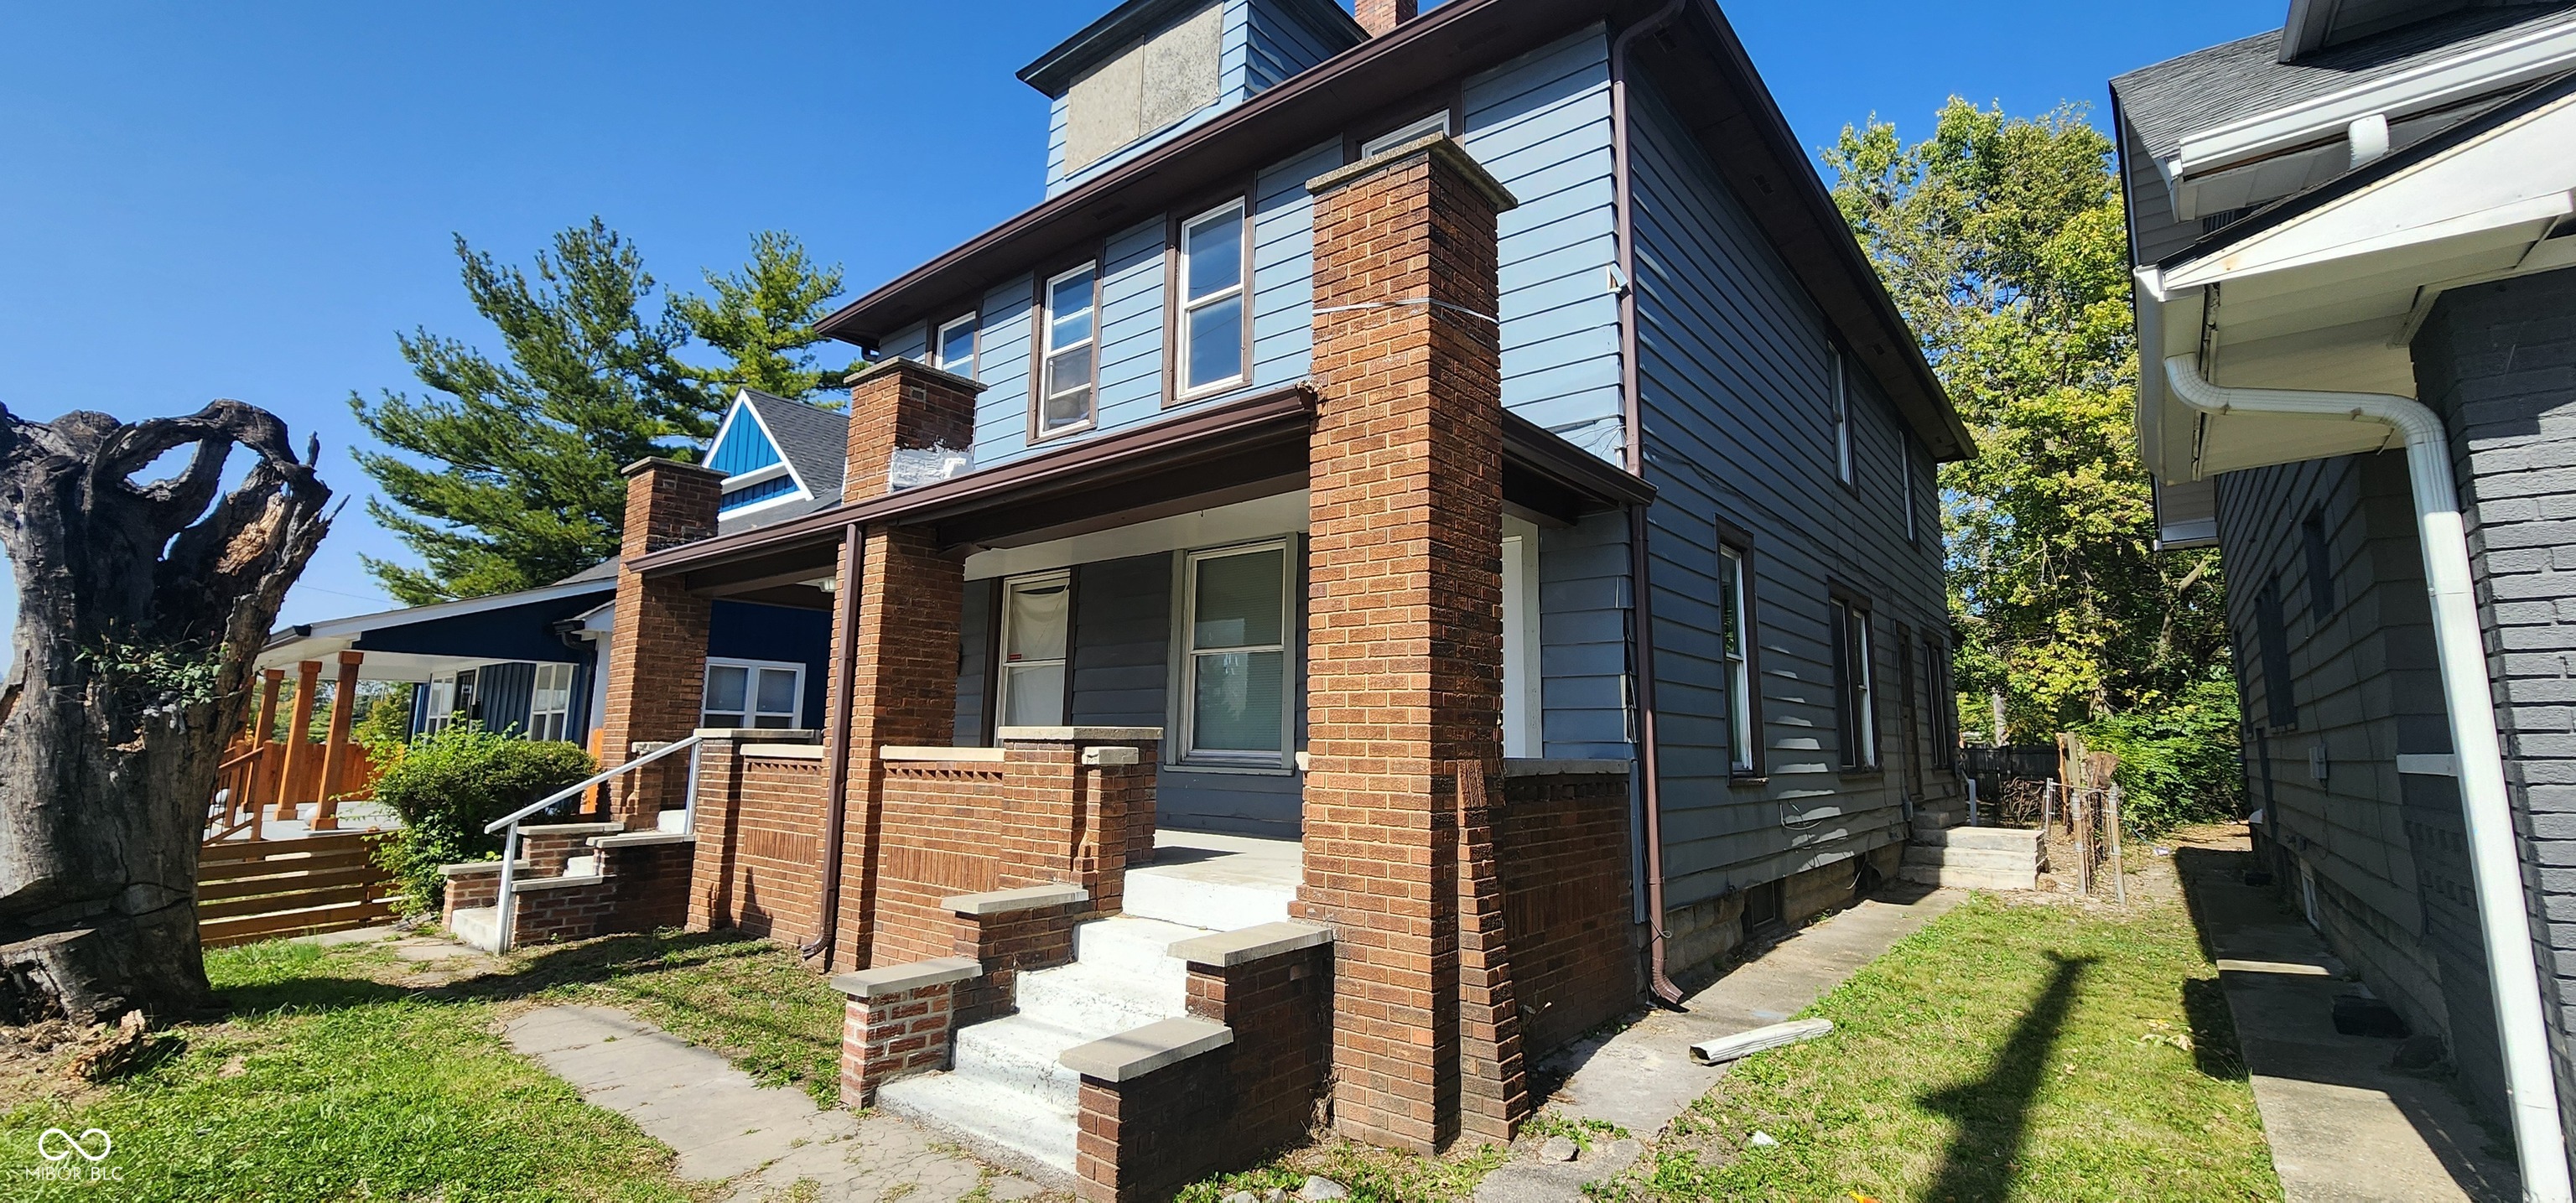
Active
$150,000
2
bds
|
1
ba
|
720
sqft
|
built
1910
1624 E 30th St, Indianapolis, IN 46218
$111
Cash flow
3.9%
Cash-on-Cash Return
7.2%
Cap rate
0.9%
Rent to Value Ratio
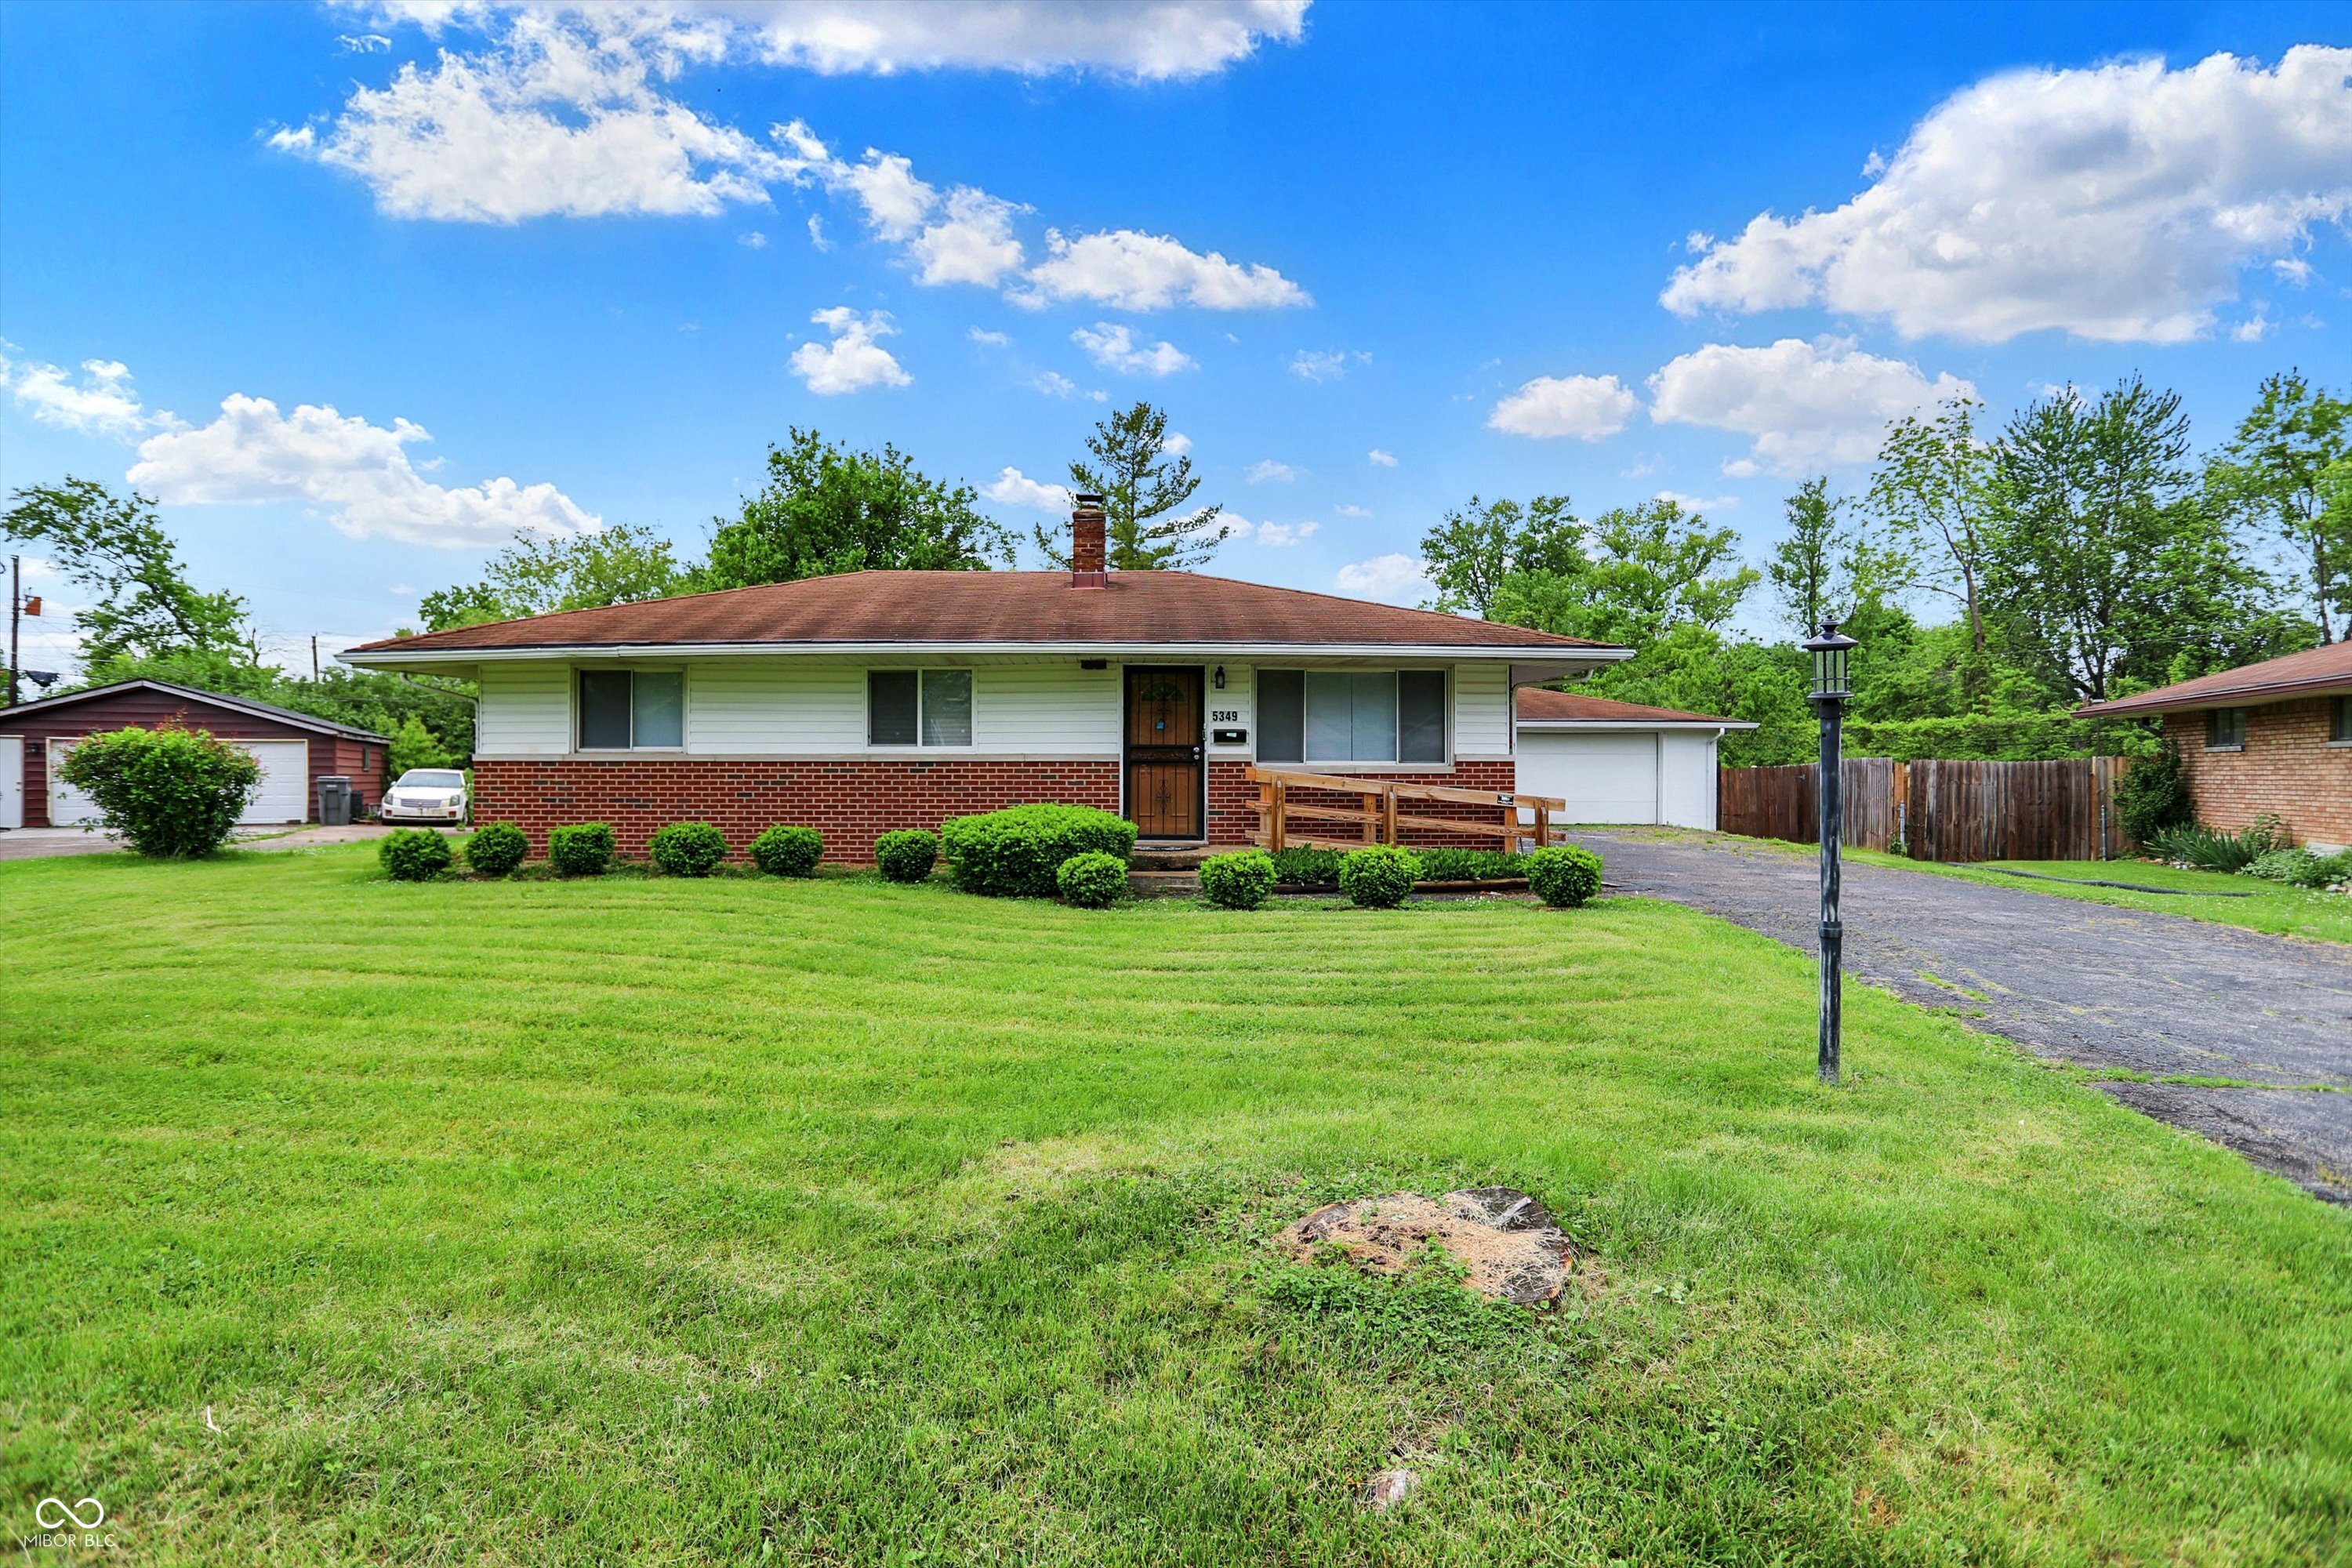
Active
$180,500
3
bds
|
2
ba
|
2,009
sqft
|
built
1957
5349 Culver St, Indianapolis, IN 46226
$-48
Cash flow
-1.4%
Cash-on-Cash Return
6.0%
Cap rate
0.7%
Rent to Value Ratio
Active
$186,000
3
bds
|
2
ba
|
1,418
sqft
|
built
1920
1216 N Holmes Ave, Indianapolis, IN 46222
$-8
Cash flow
-0.2%
Cash-on-Cash Return
6.2%
Cap rate
0.8%
Rent to Value Ratio
Active
$188,999
2
bds
|
2
ba
|
1,034
sqft
|
built
1936
3041 S Rybolt Ave, Indianapolis, IN 46241
$-300
Cash flow
-8.3%
Cash-on-Cash Return
4.4%
Cap rate
0.5%
Rent to Value Ratio
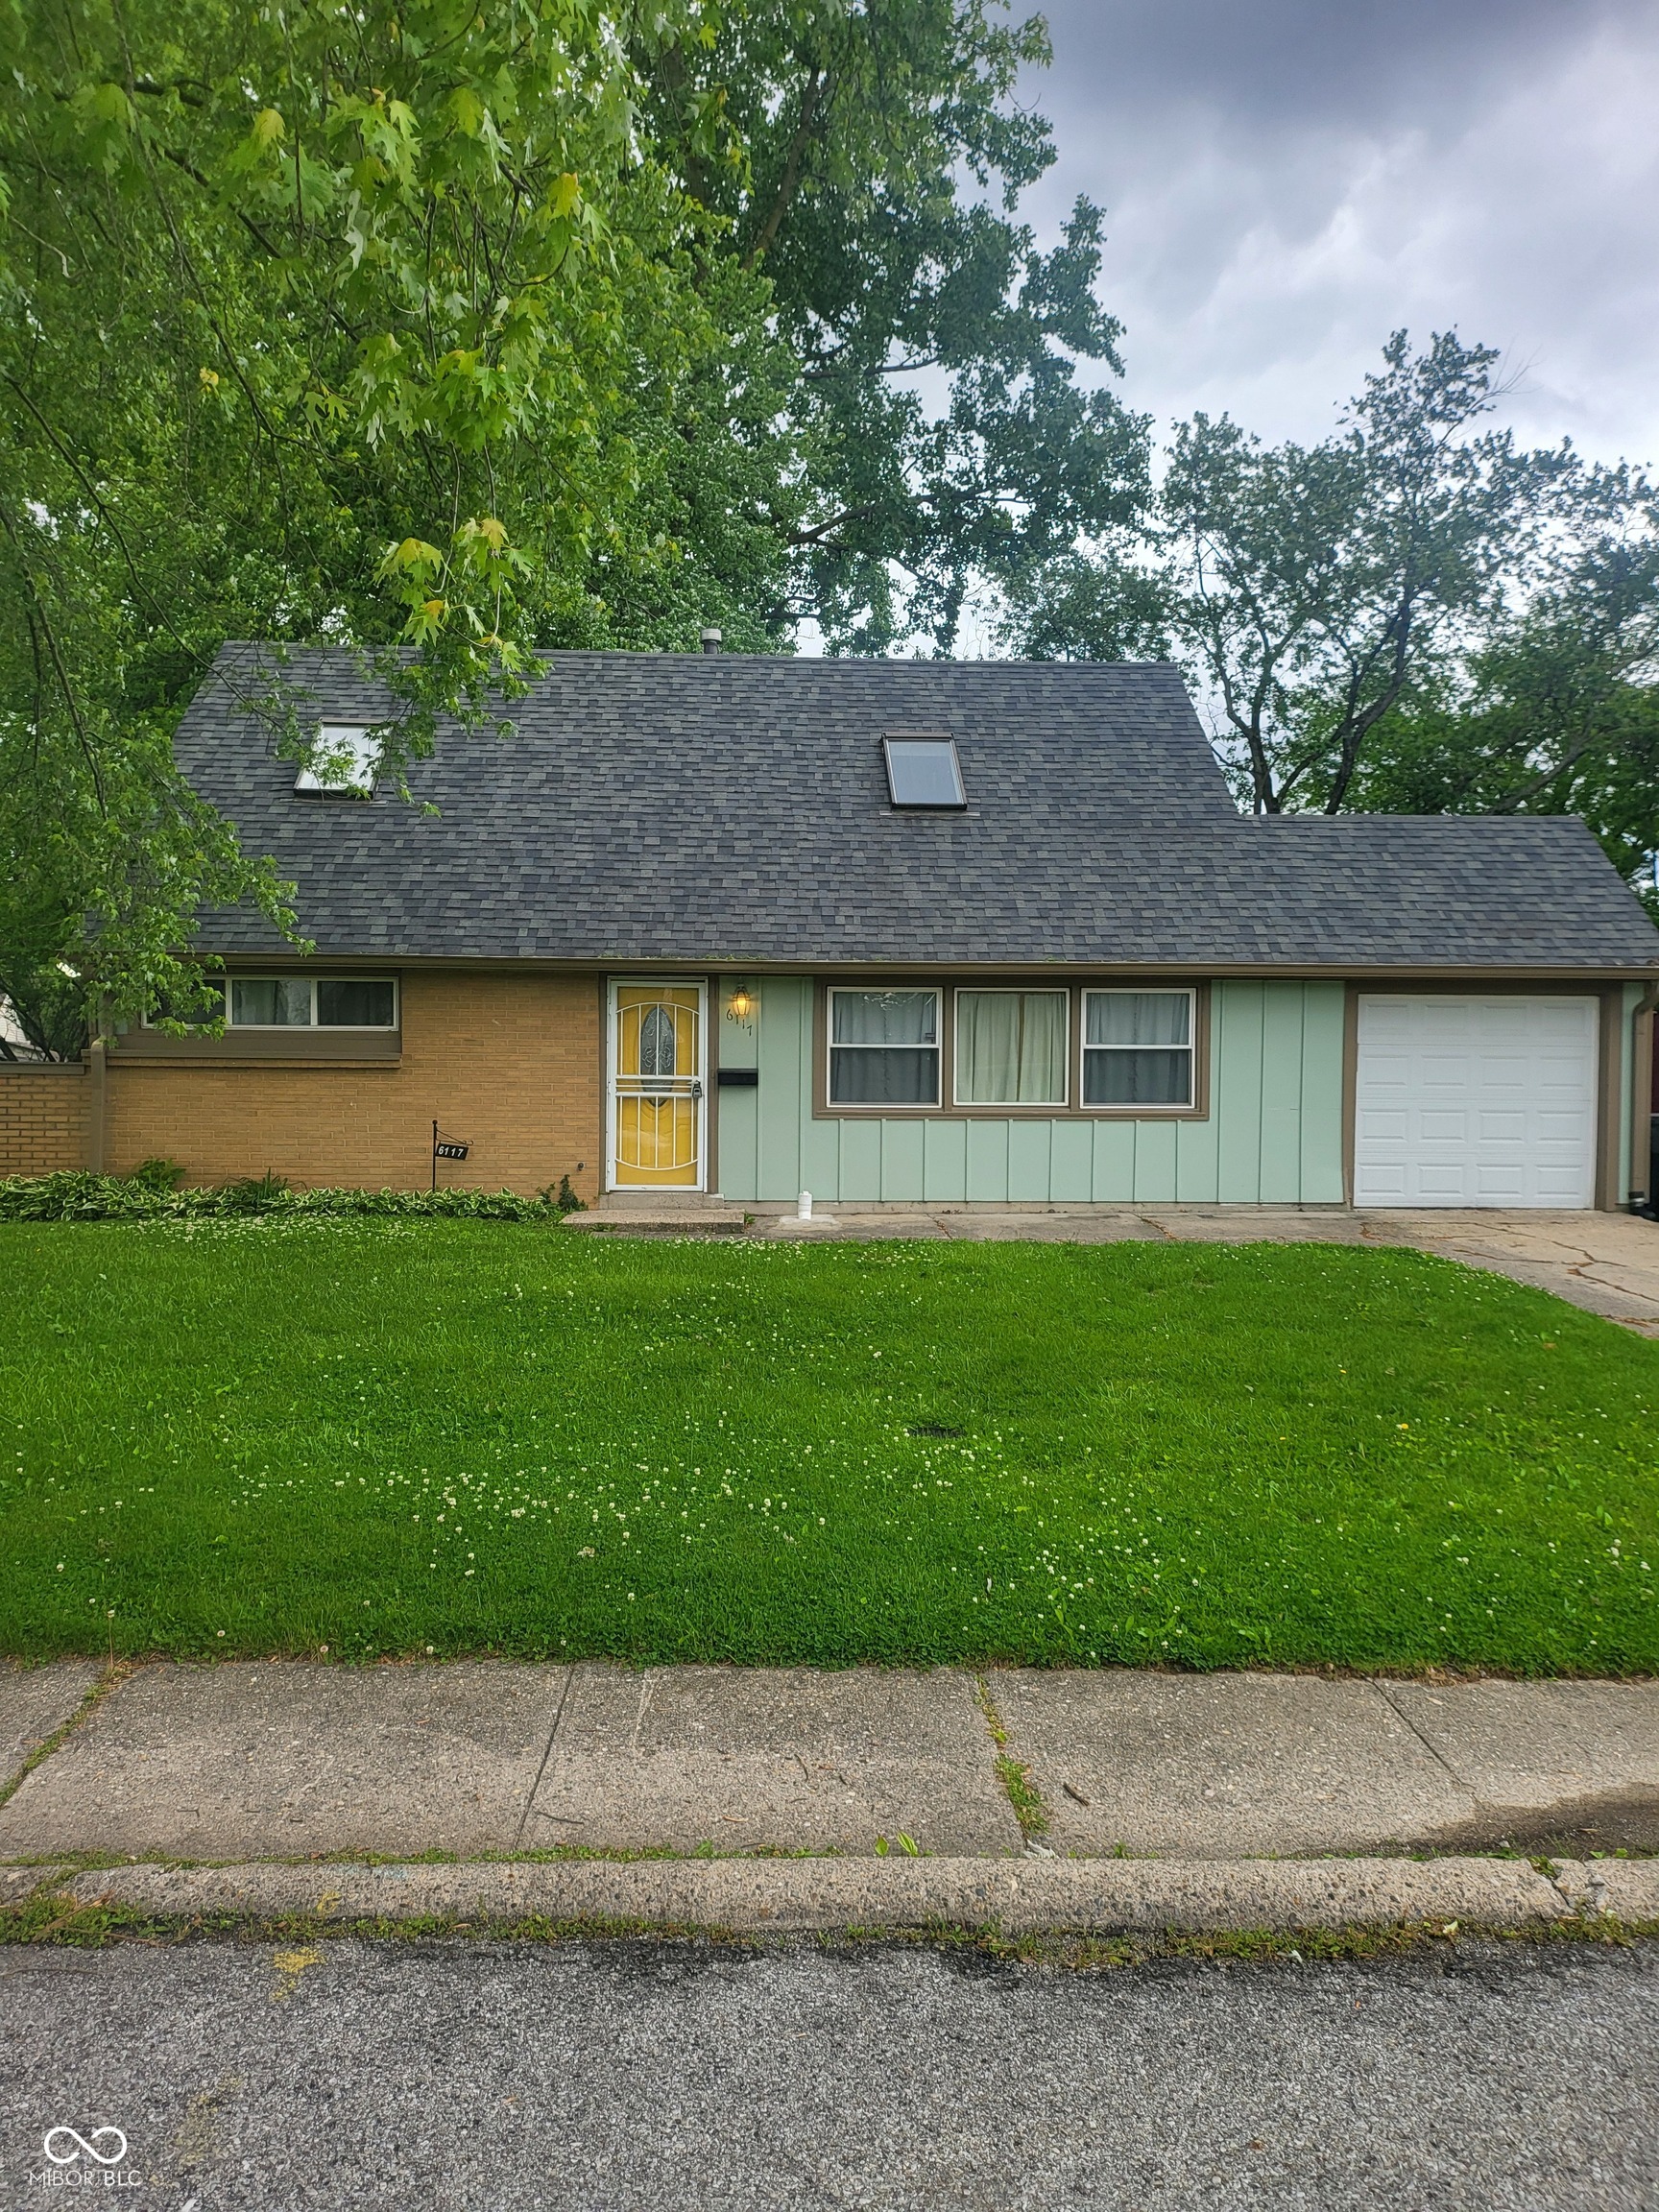
Active
$244,900
4
bds
|
2
ba
|
1,924
sqft
|
built
1957
6117 Marilyn Rd, Indianapolis, IN 46226
$-178
Cash flow
-3.8%
Cash-on-Cash Return
5.4%
Cap rate
0.7%
Rent to Value Ratio
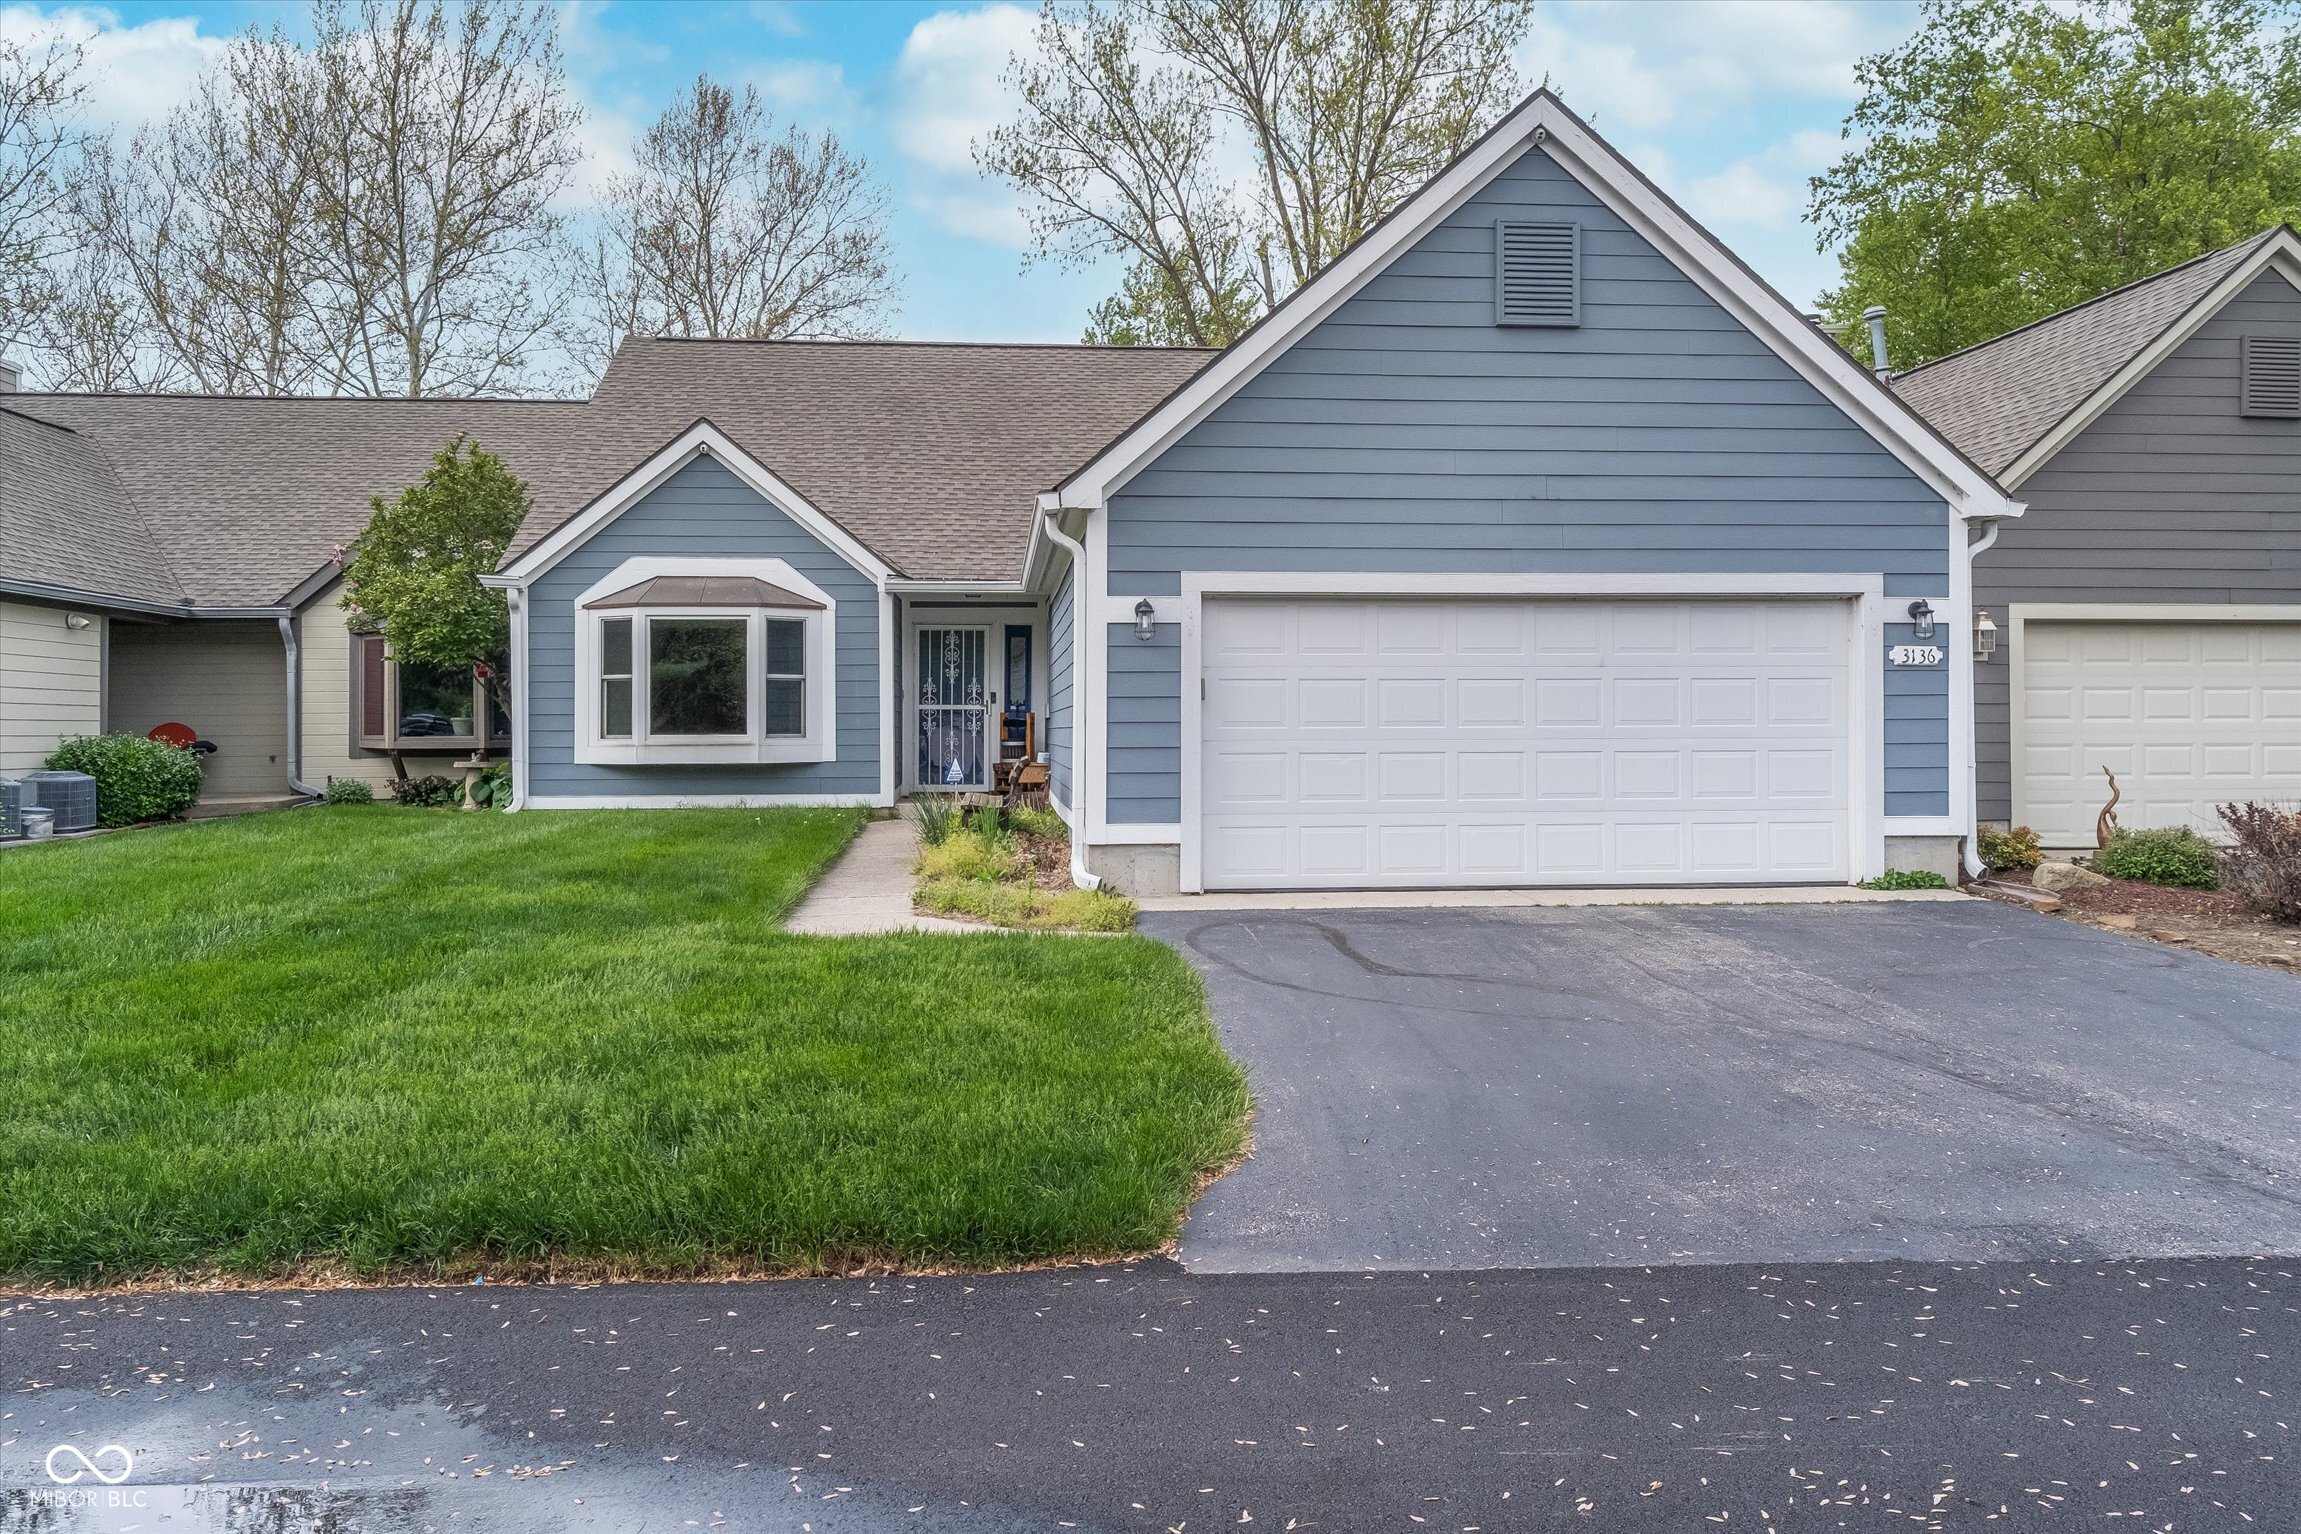
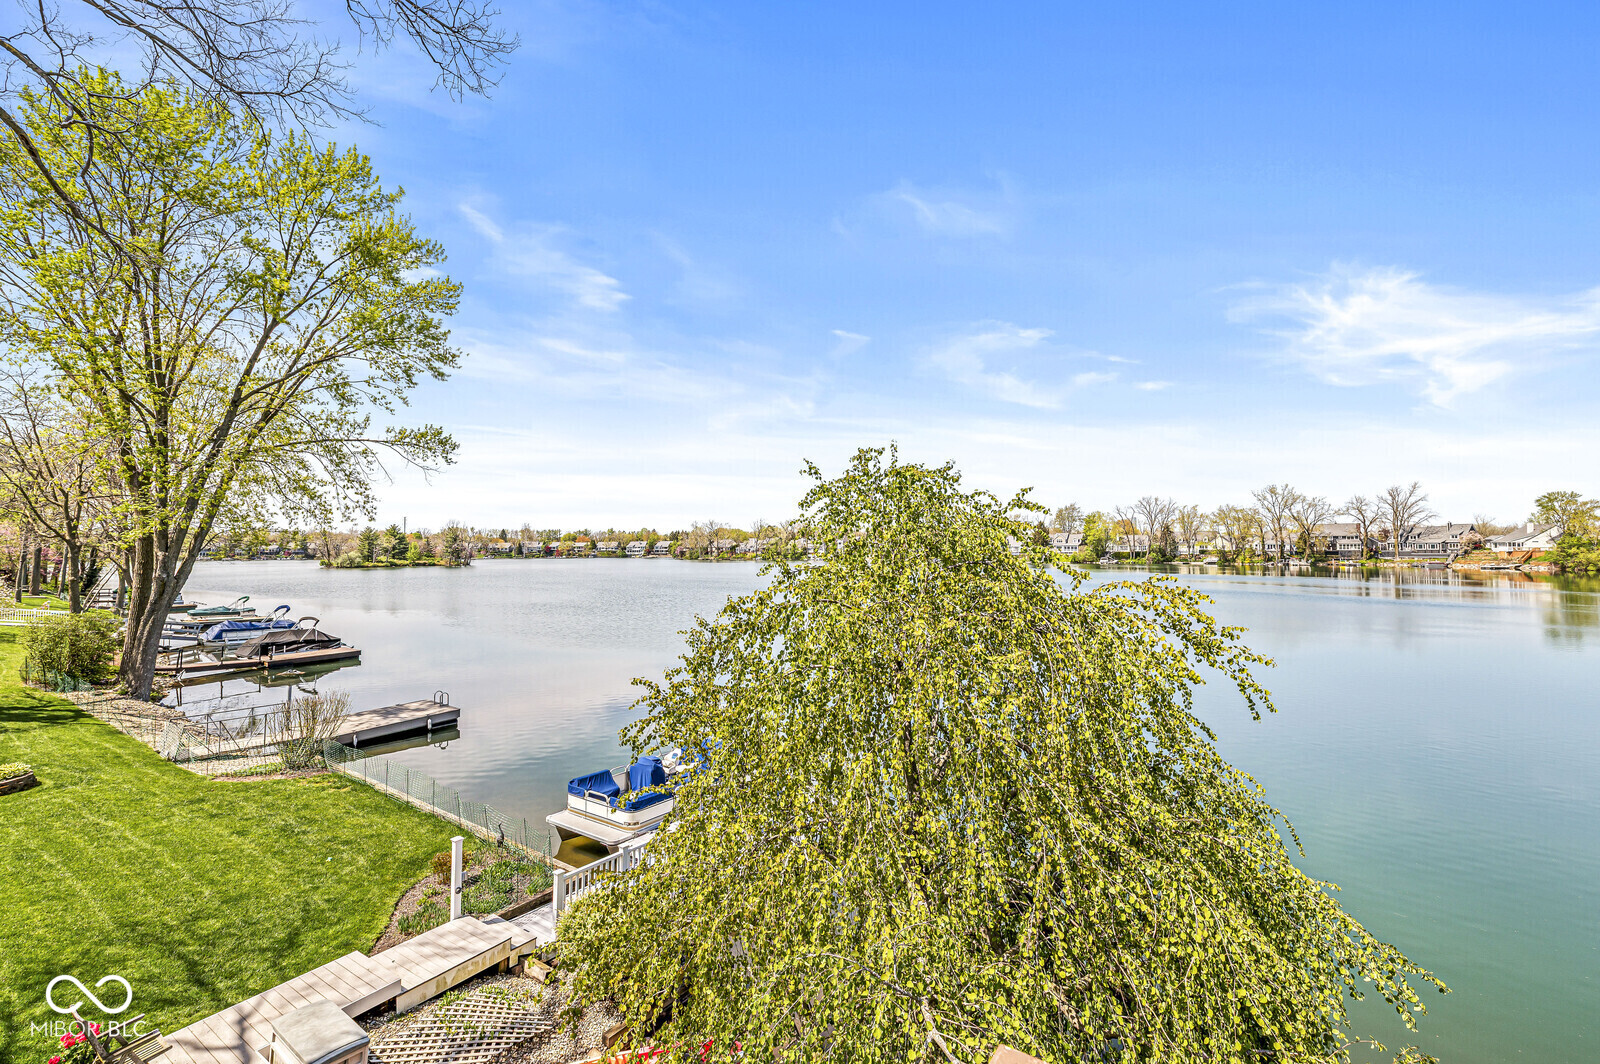
Active
$375,000
2
bds
|
2
ba
|
1,785
sqft
|
built
1984
3136 River Bay Dr N, Indianapolis, IN 46240
$-604
Cash flow
-8.4%
Cash-on-Cash Return
4.4%
Cap rate
0.7%
Rent to Value Ratio
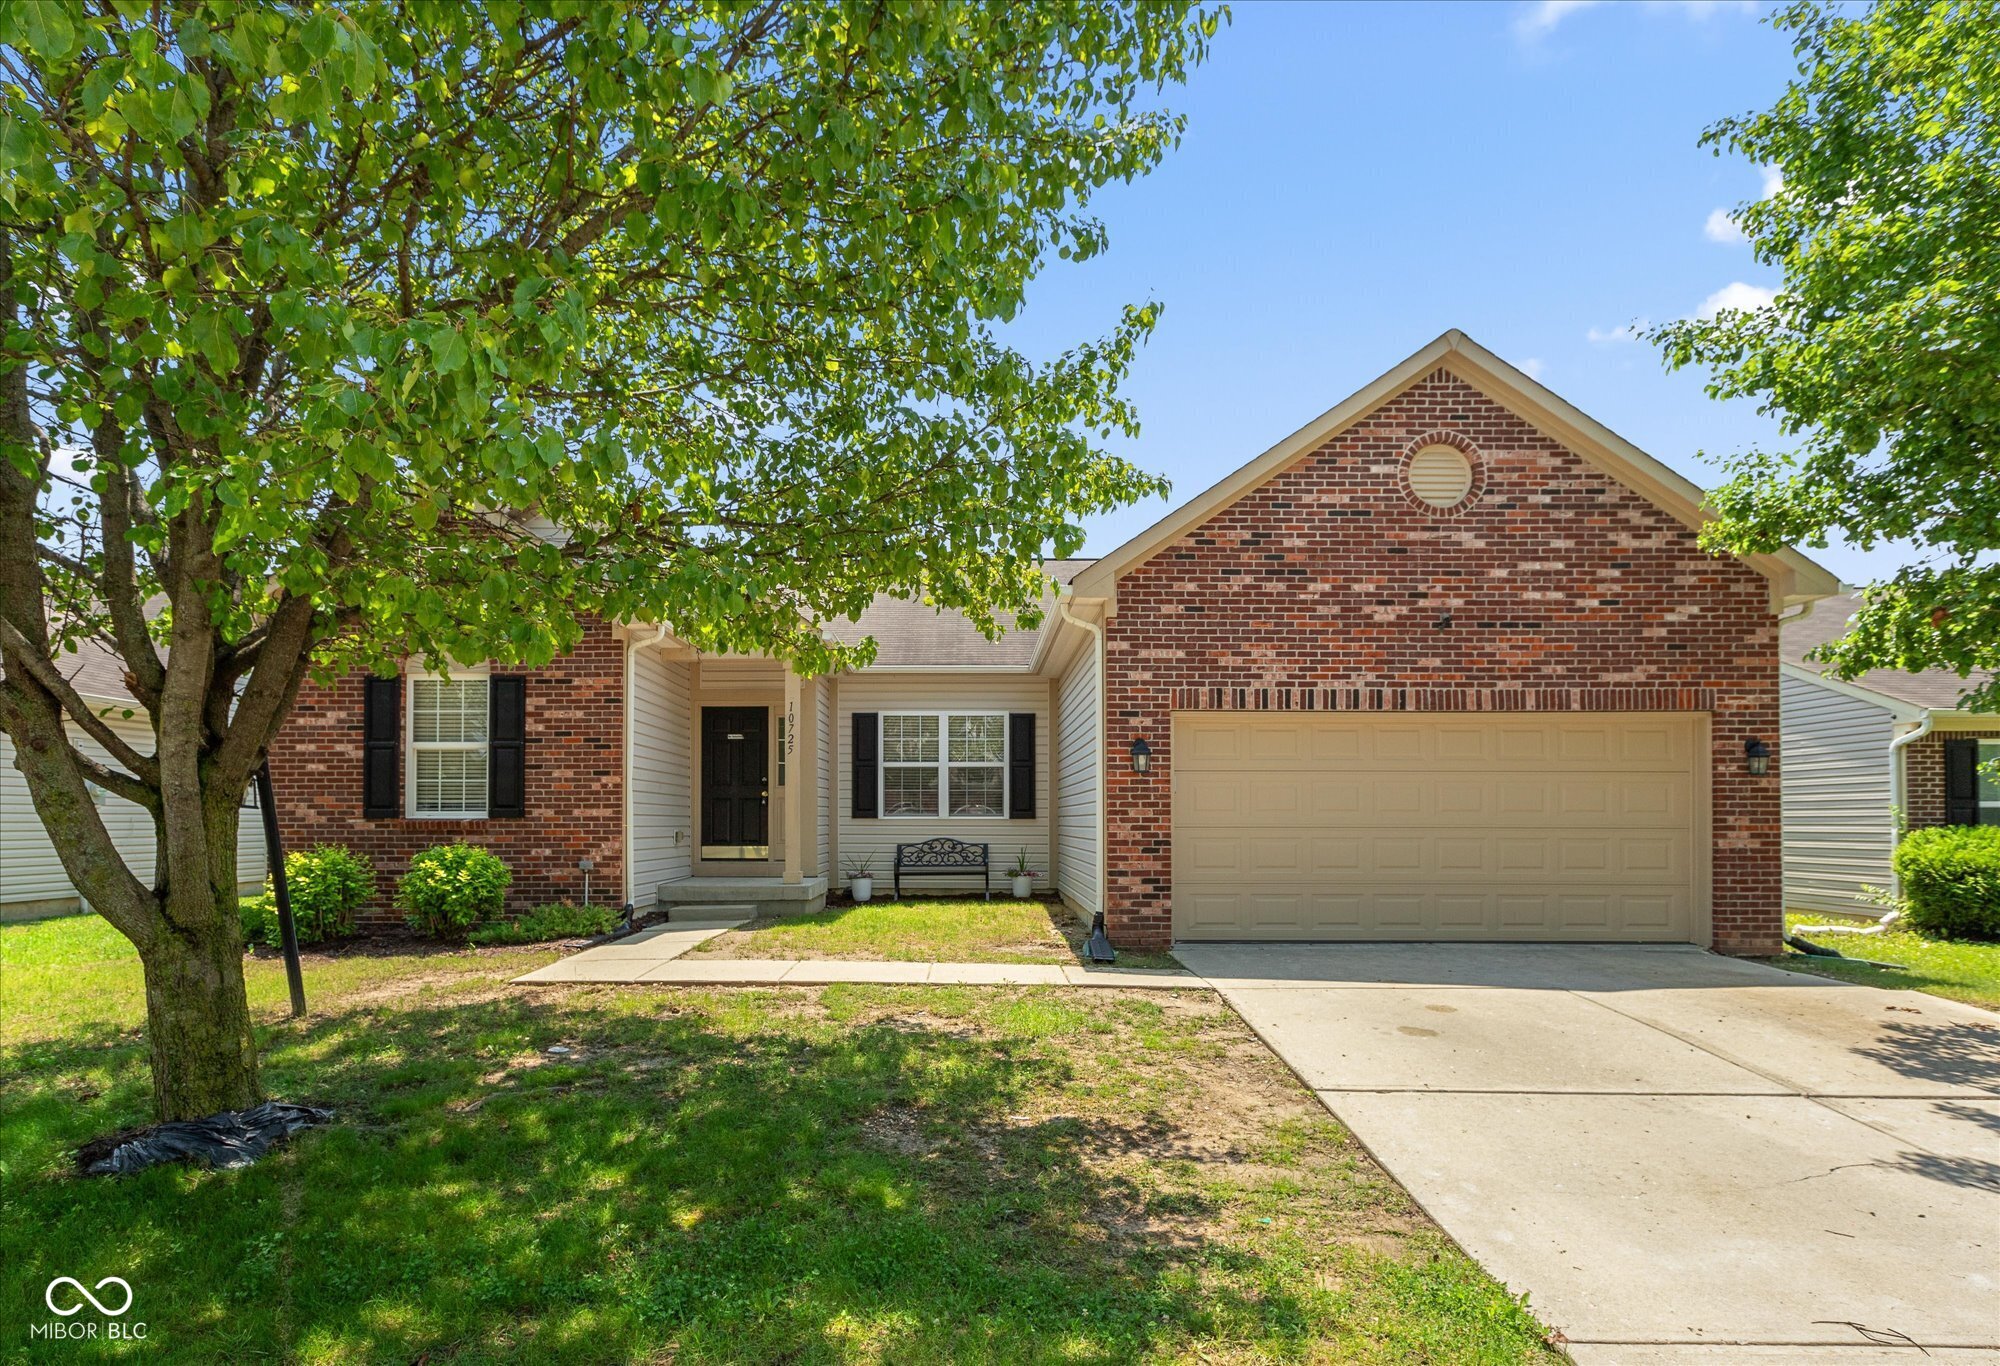
Active
$319,000
3
bds
|
3
ba
|
3,912
sqft
|
built
2007
10725 Tedder Lake Dr, Indianapolis, IN 46239
$-119
Cash flow
-1.9%
Cash-on-Cash Return
5.8%
Cap rate
0.7%
Rent to Value Ratio
Pending
$100,000
2
bds
|
0
ba
|
1,032
sqft
|
built
1900
21 S Warman Ave, Indianapolis, IN 46222
$580
Cash flow
30.3%
Cash-on-Cash Return
13.2%
Cap rate
1.6%
Rent to Value Ratio
Active
$490,000
4
bds
|
3
ba
|
3,115
sqft
|
built
1954
3975 Denwood Dr, Indianapolis, IN 46226
$-1,048
Cash flow
-11.2%
Cash-on-Cash Return
3.7%
Cap rate
0.4%
Rent to Value Ratio
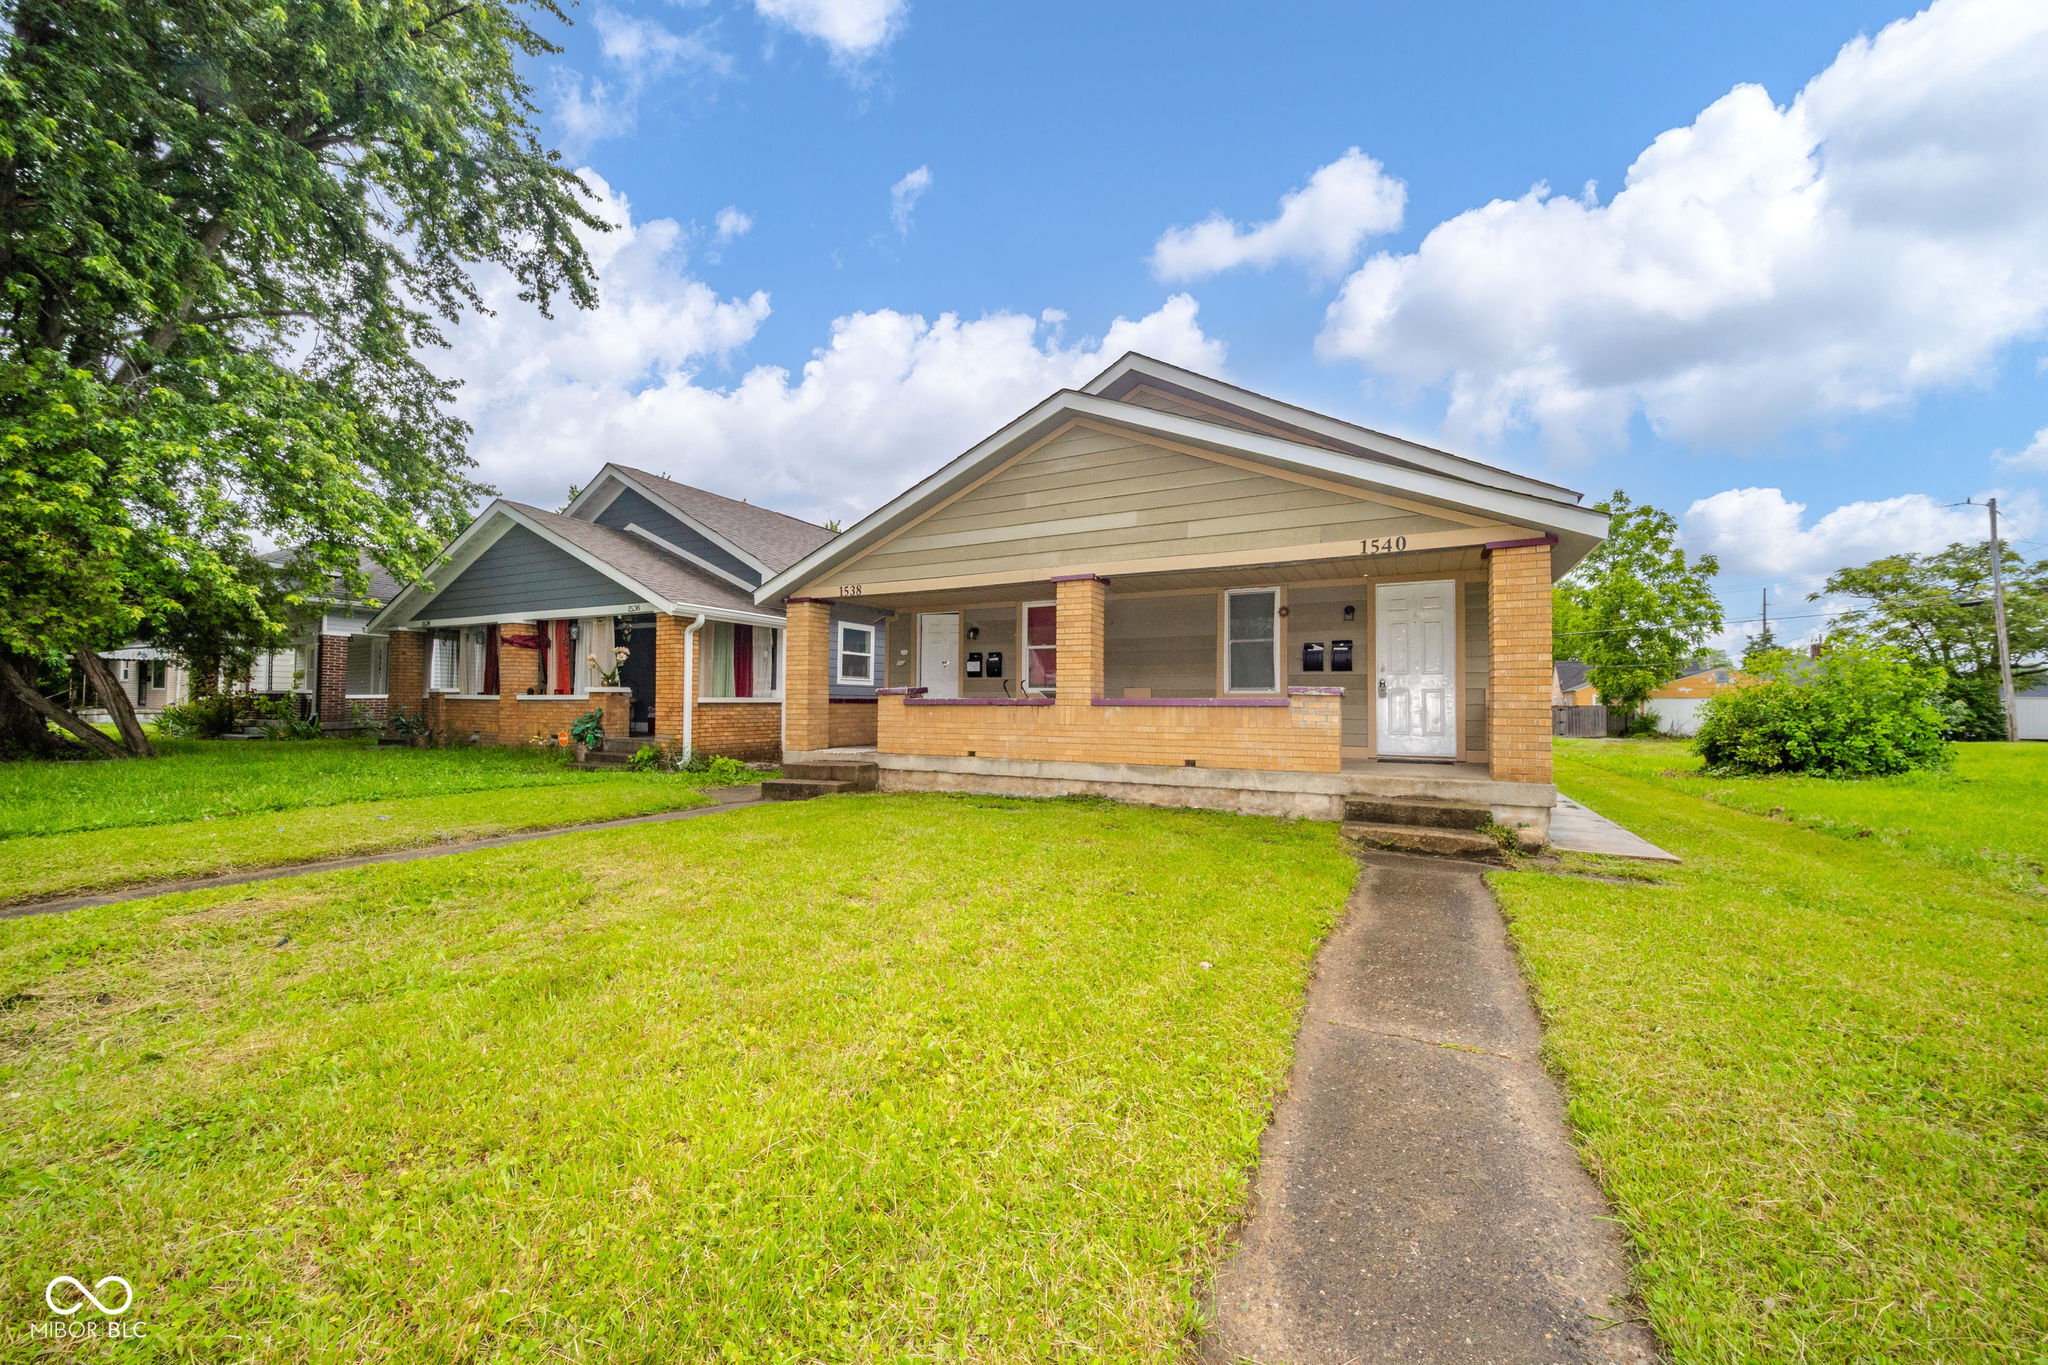
Active
$250,000
1
bds
|
0
ba
|
0
sqft
|
built
1929
1538 N Grant Ave, Indianapolis, IN 46201
$-826
Cash flow
-17.2%
Cash-on-Cash Return
2.3%
Cap rate
0.3%
Rent to Value Ratio
Active
$227,000
3
bds
|
2
ba
|
1,507
sqft
|
built
1945
3602 N Colorado Ave, Indianapolis, IN 46218
$53
Cash flow
1.2%
Cash-on-Cash Return
6.6%
Cap rate
0.8%
Rent to Value Ratio
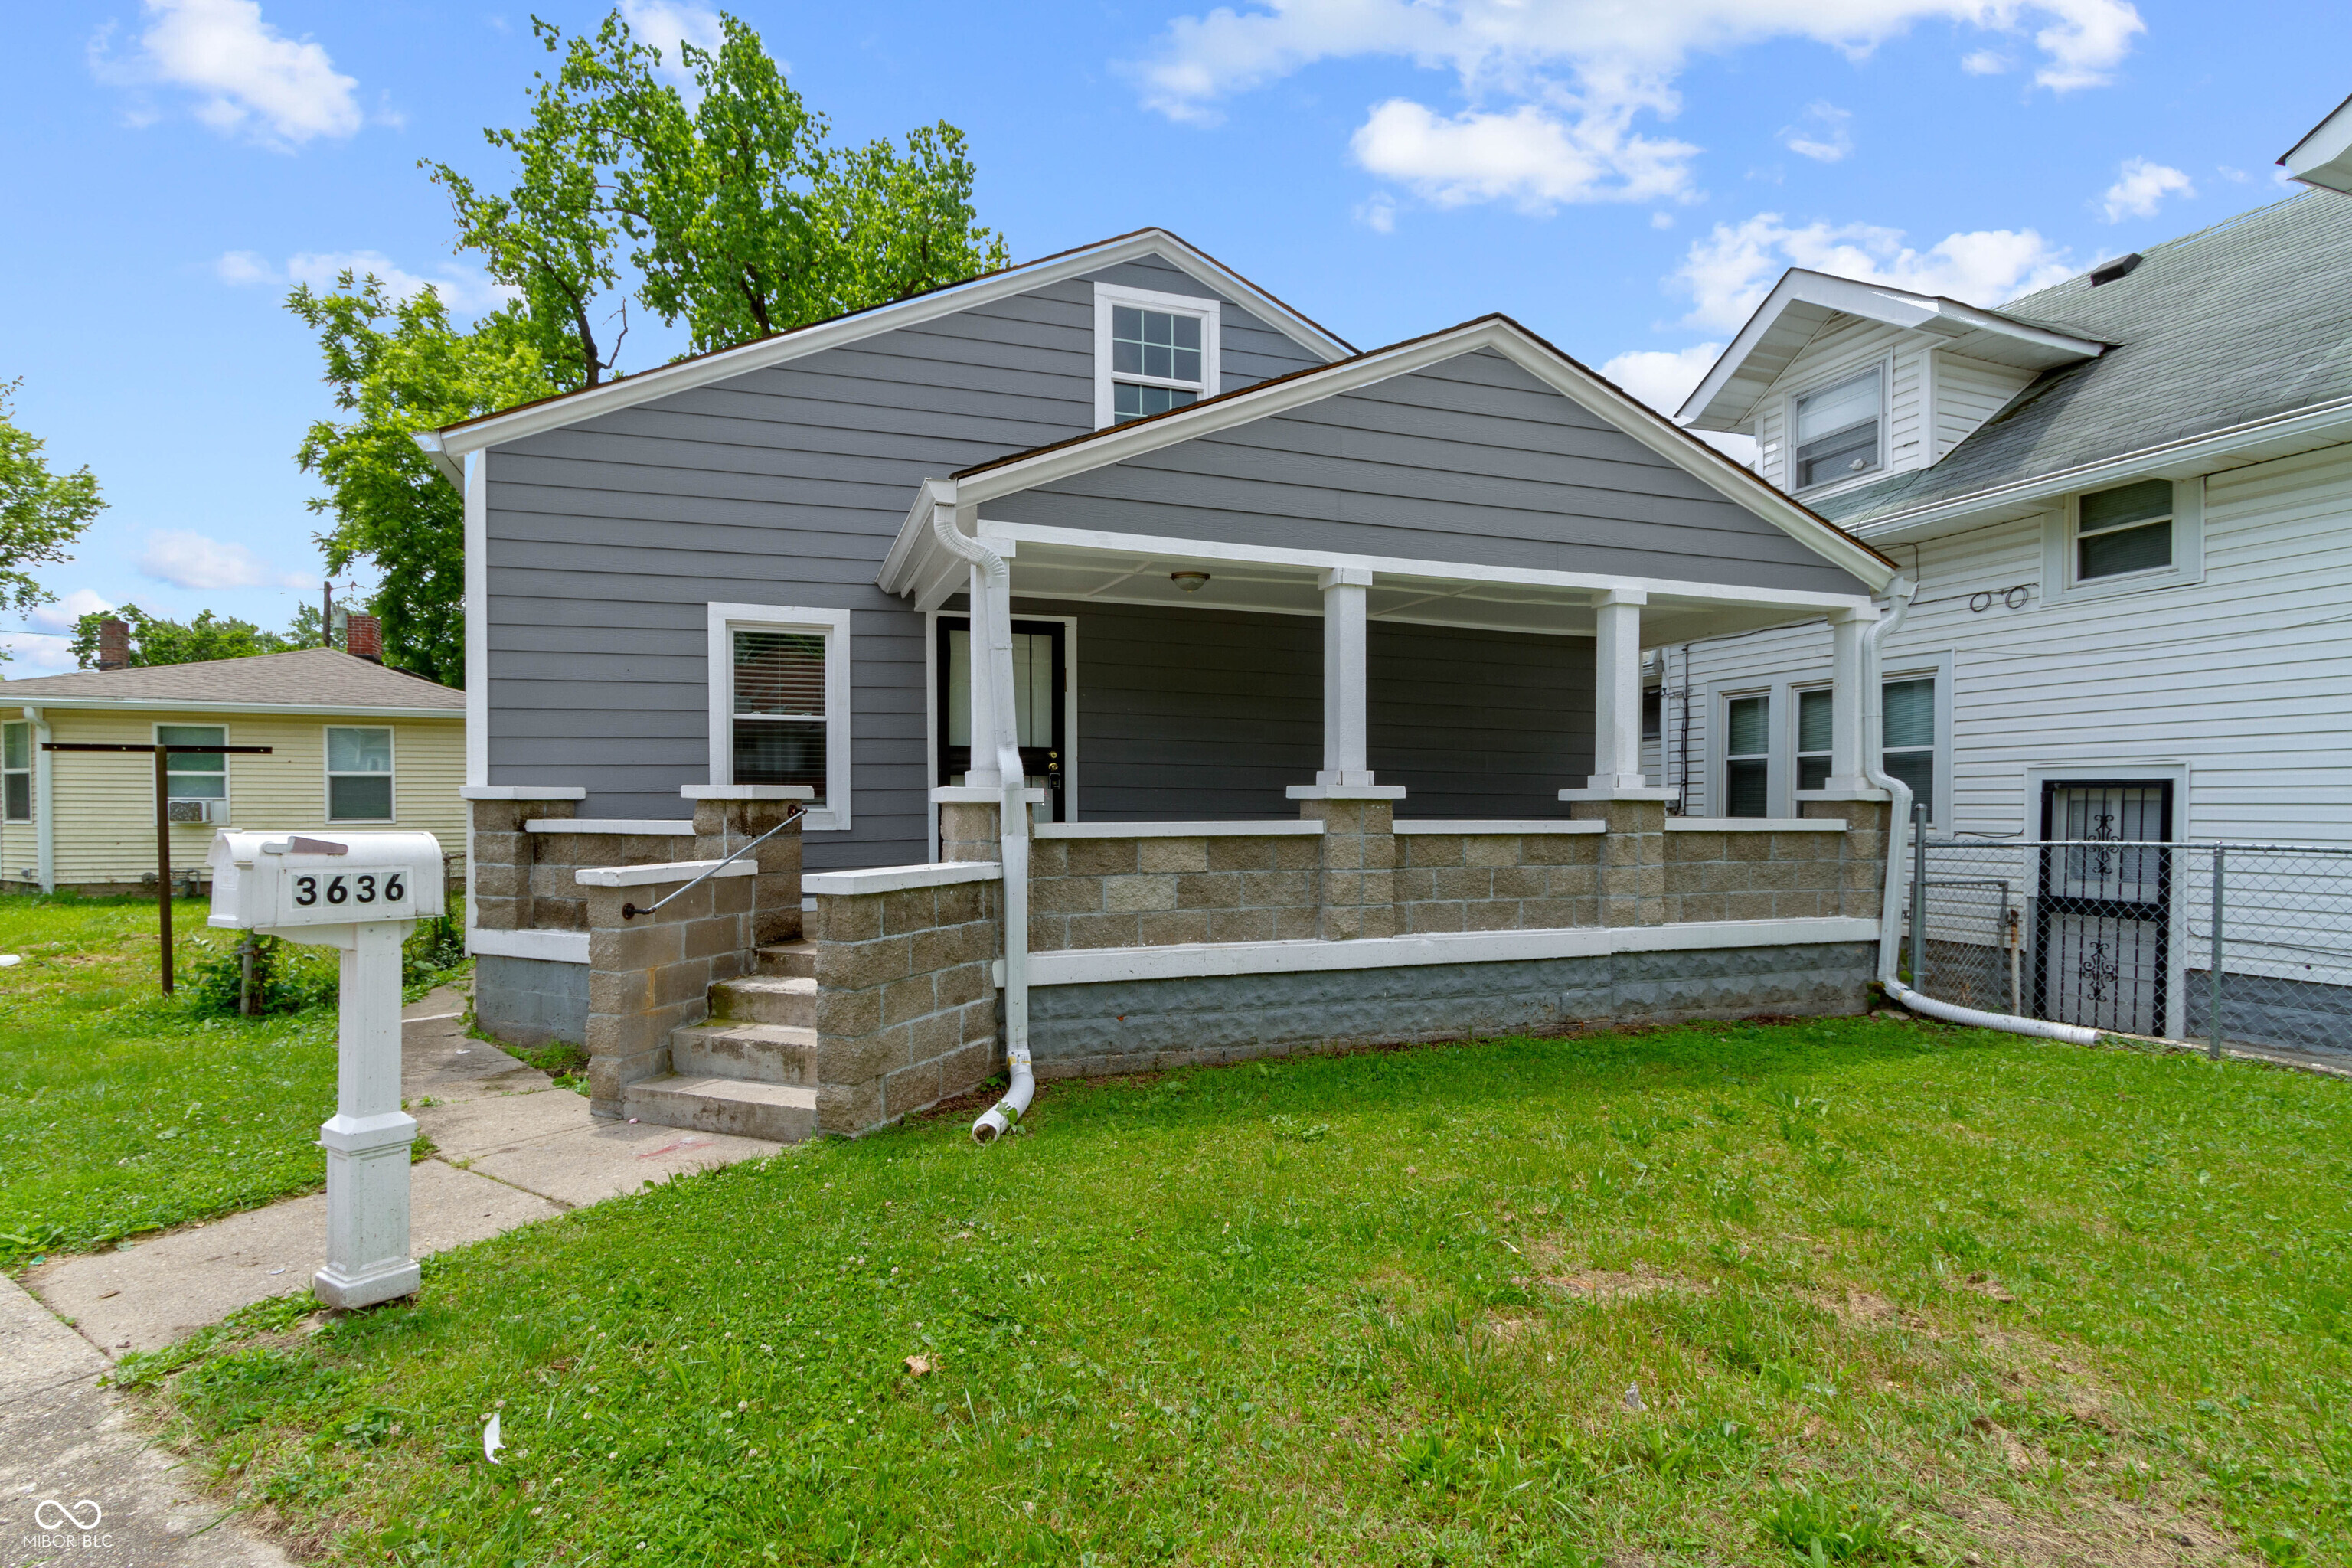
Active
$164,900
3
bds
|
2
ba
|
1,020
sqft
|
built
1920
3636 Crescent Ave, Indianapolis, IN 46208
$102
Cash flow
3.2%
Cash-on-Cash Return
7.0%
Cap rate
0.8%
Rent to Value Ratio
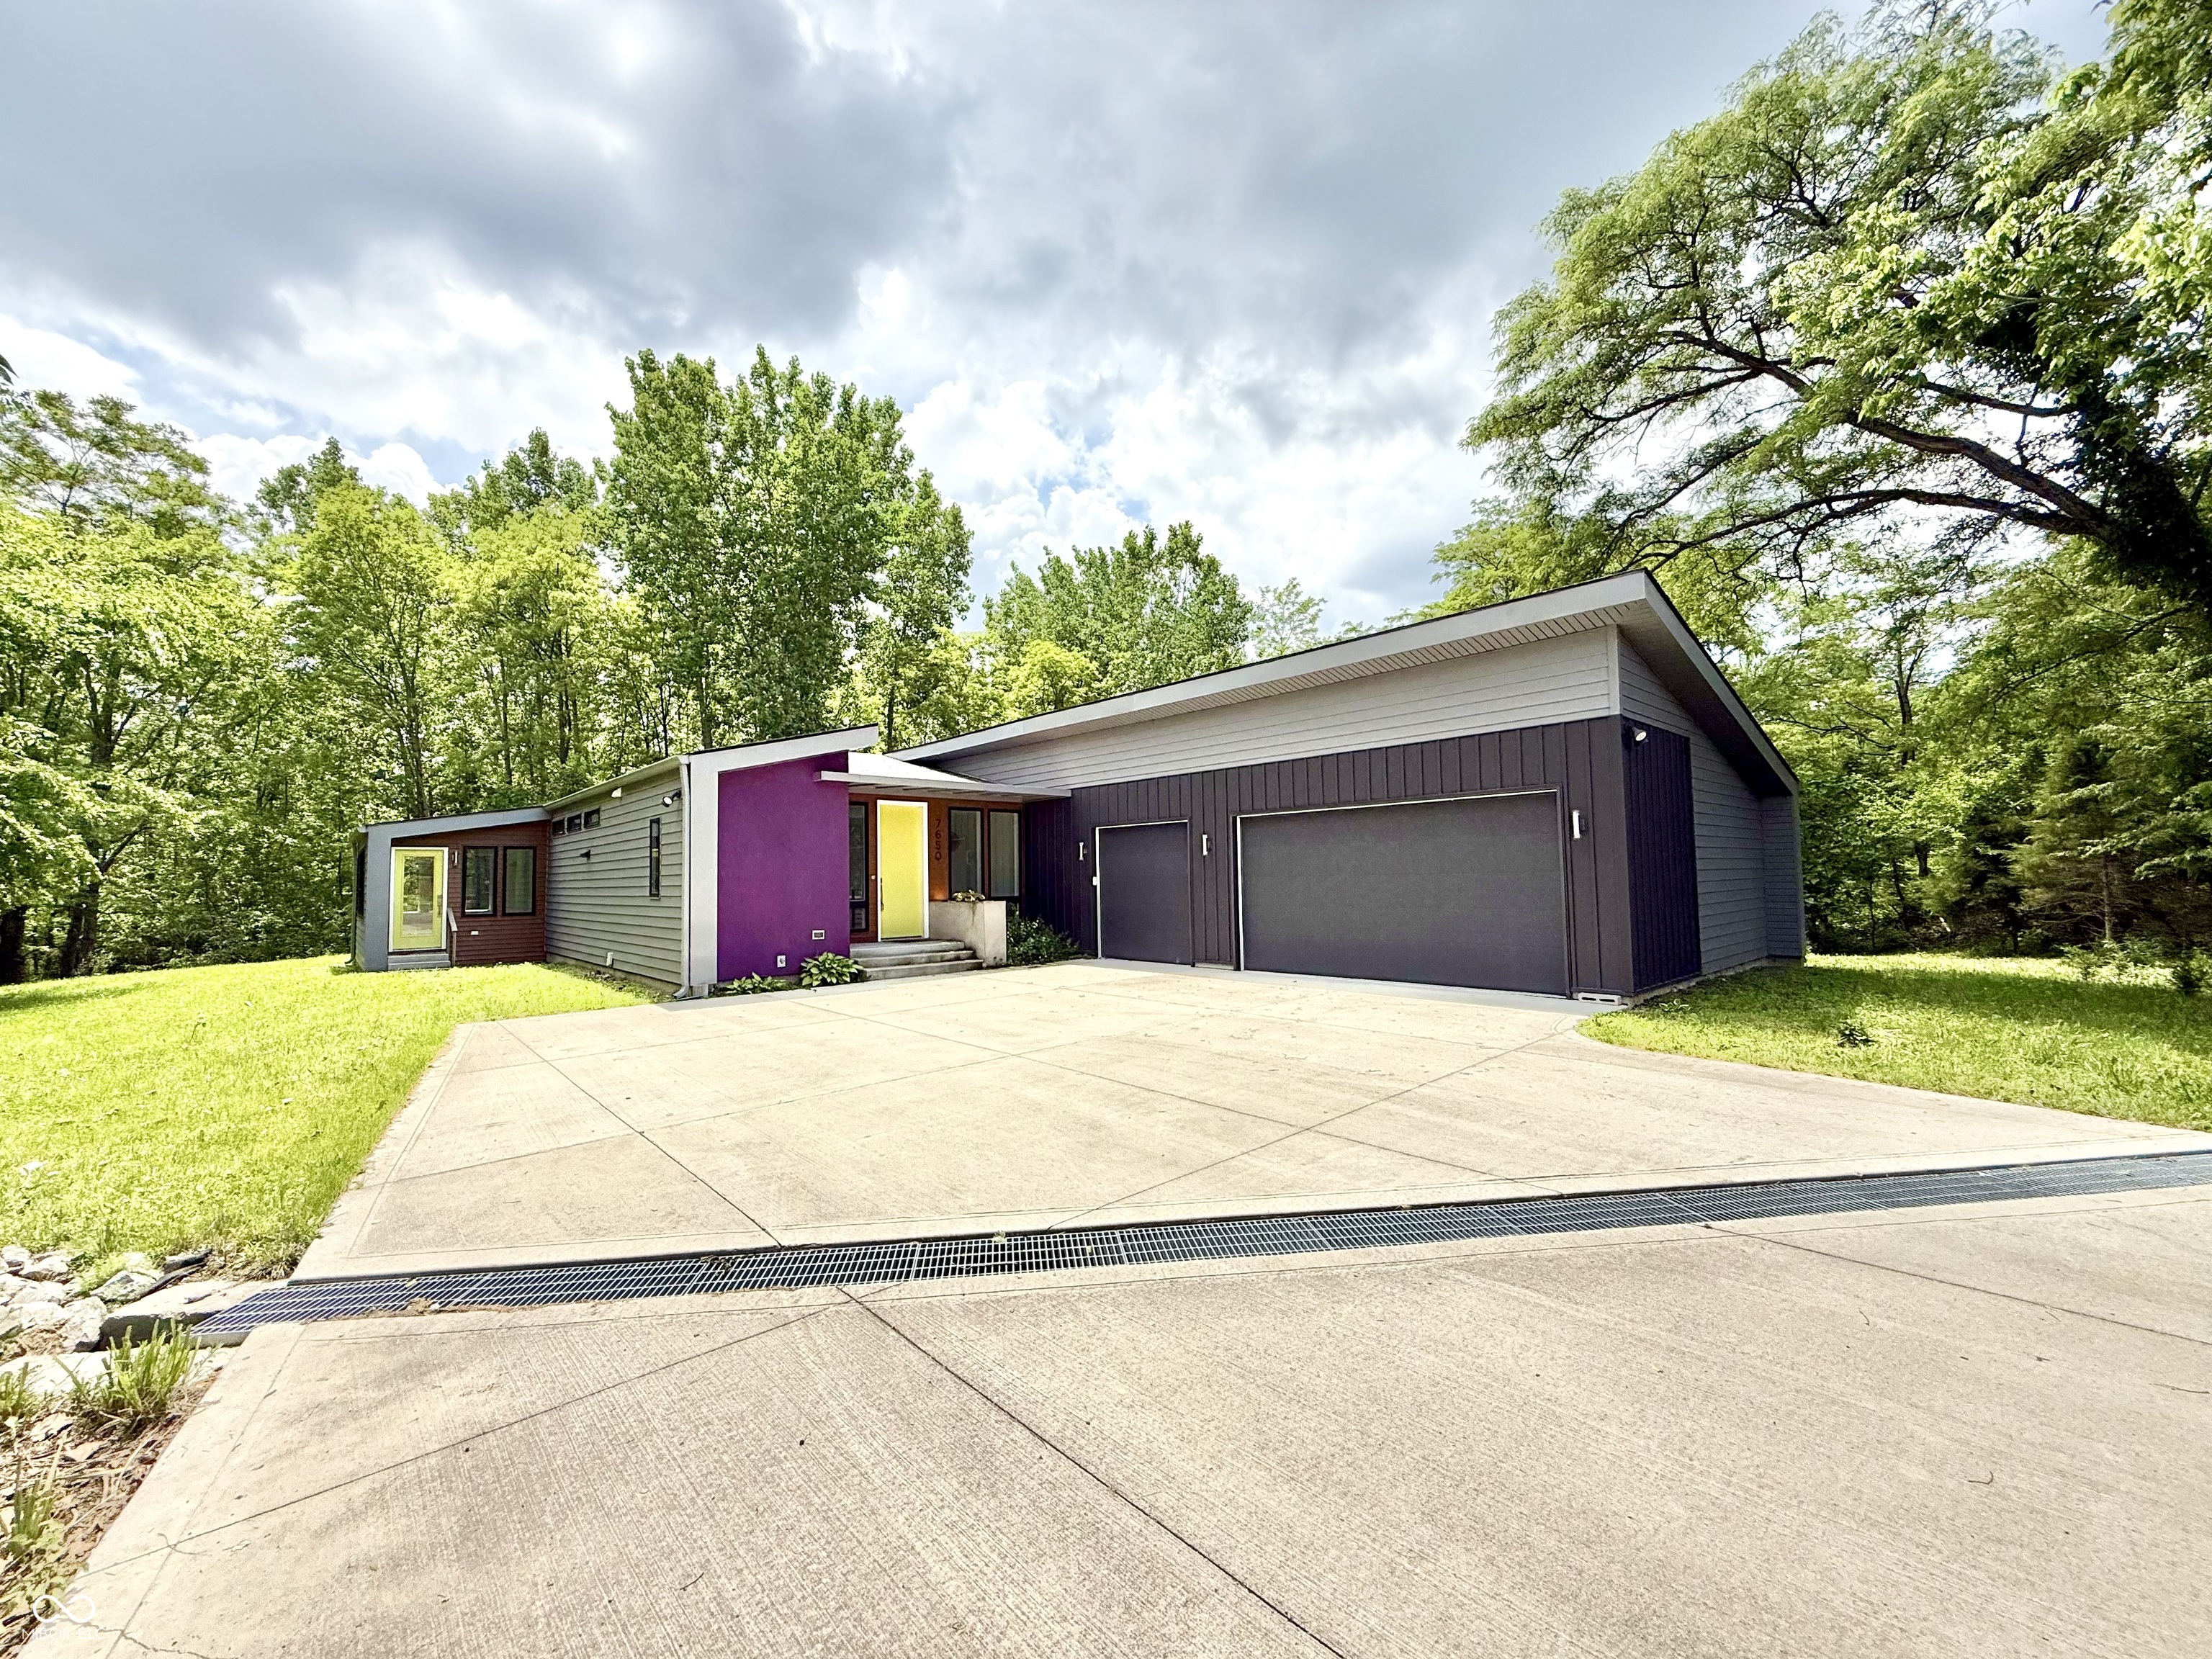
Active
$675,000
3
bds
|
3
ba
|
3,636
sqft
|
built
2020
7650 Clarion Dr, Indianapolis, IN 46236
$-16
Cash flow
-0.1%
Cash-on-Cash Return
6.3%
Cap rate
0.8%
Rent to Value Ratio
Active
$911,102
6
bds
|
6
ba
|
4,739
sqft
|
built
1900
1034 N Tacoma Ave, Indianapolis, IN 46201
$-4,012
Cash flow
-23.0%
Cash-on-Cash Return
1.0%
Cap rate
0.1%
Rent to Value Ratio
Active
$319,000
2
bds
|
2
ba
|
1,615
sqft
|
built
1920
970 Fort Wayne Ave, Indianapolis, IN 46202
$-518
Cash flow
-8.5%
Cash-on-Cash Return
4.3%
Cap rate
0.8%
Rent to Value Ratio
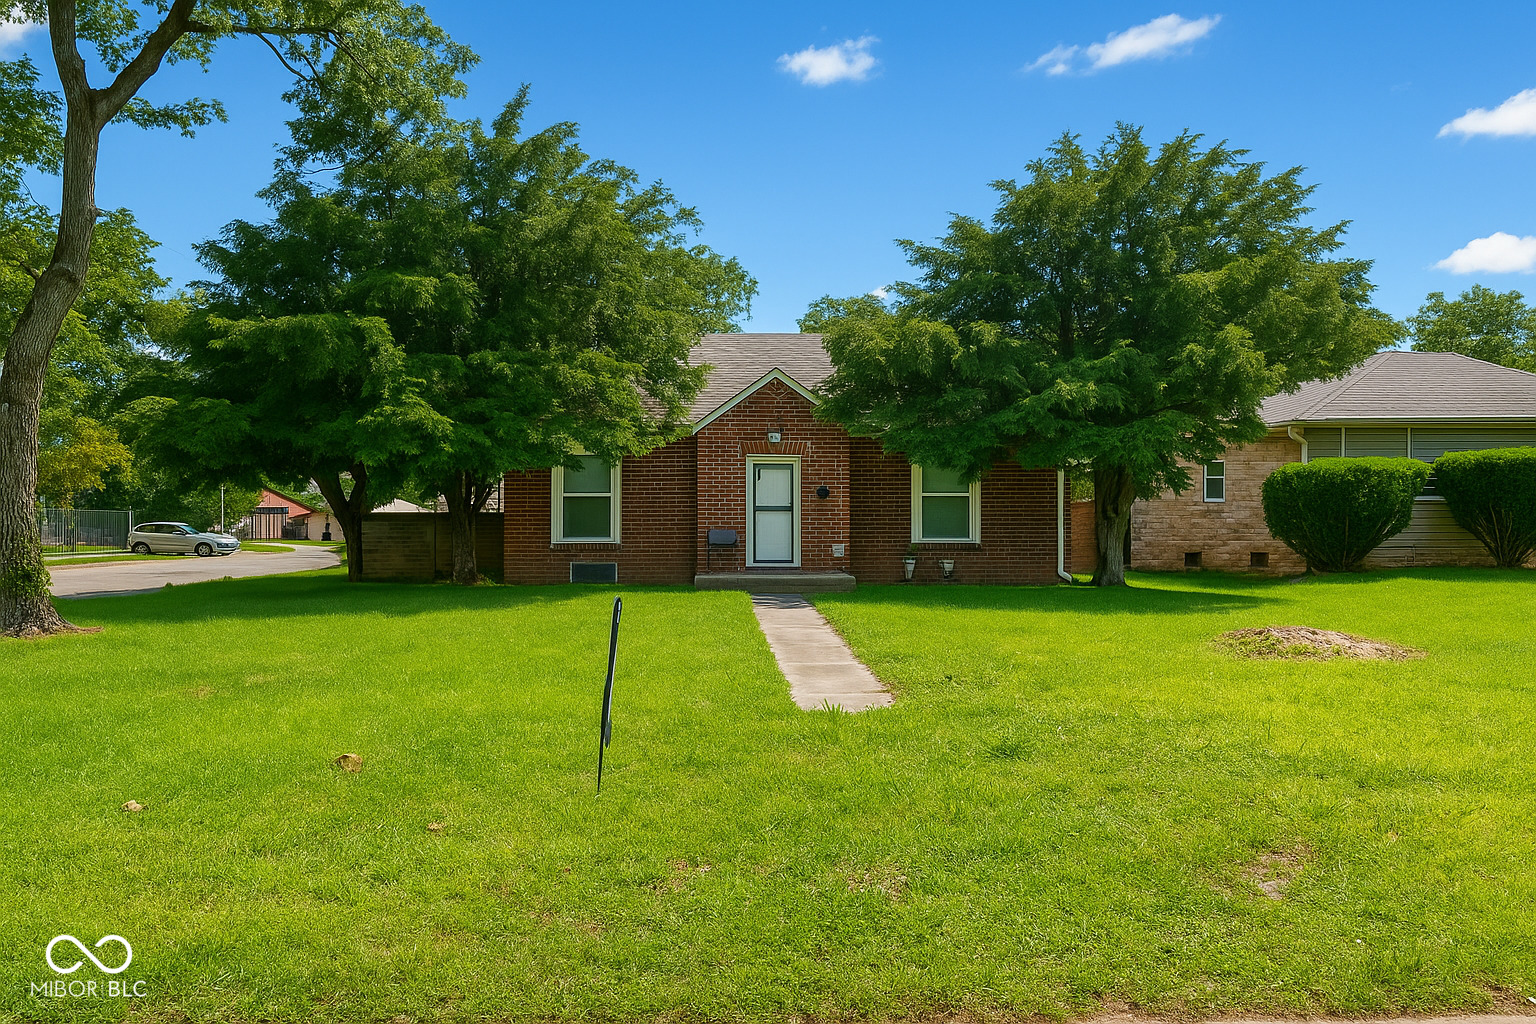
Active
$160,000
2
bds
|
1
ba
|
768
sqft
|
built
1952
1732 N Ritter Ave, Indianapolis, IN 46218
$128
Cash flow
4.2%
Cash-on-Cash Return
7.2%
Cap rate
0.9%
Rent to Value Ratio
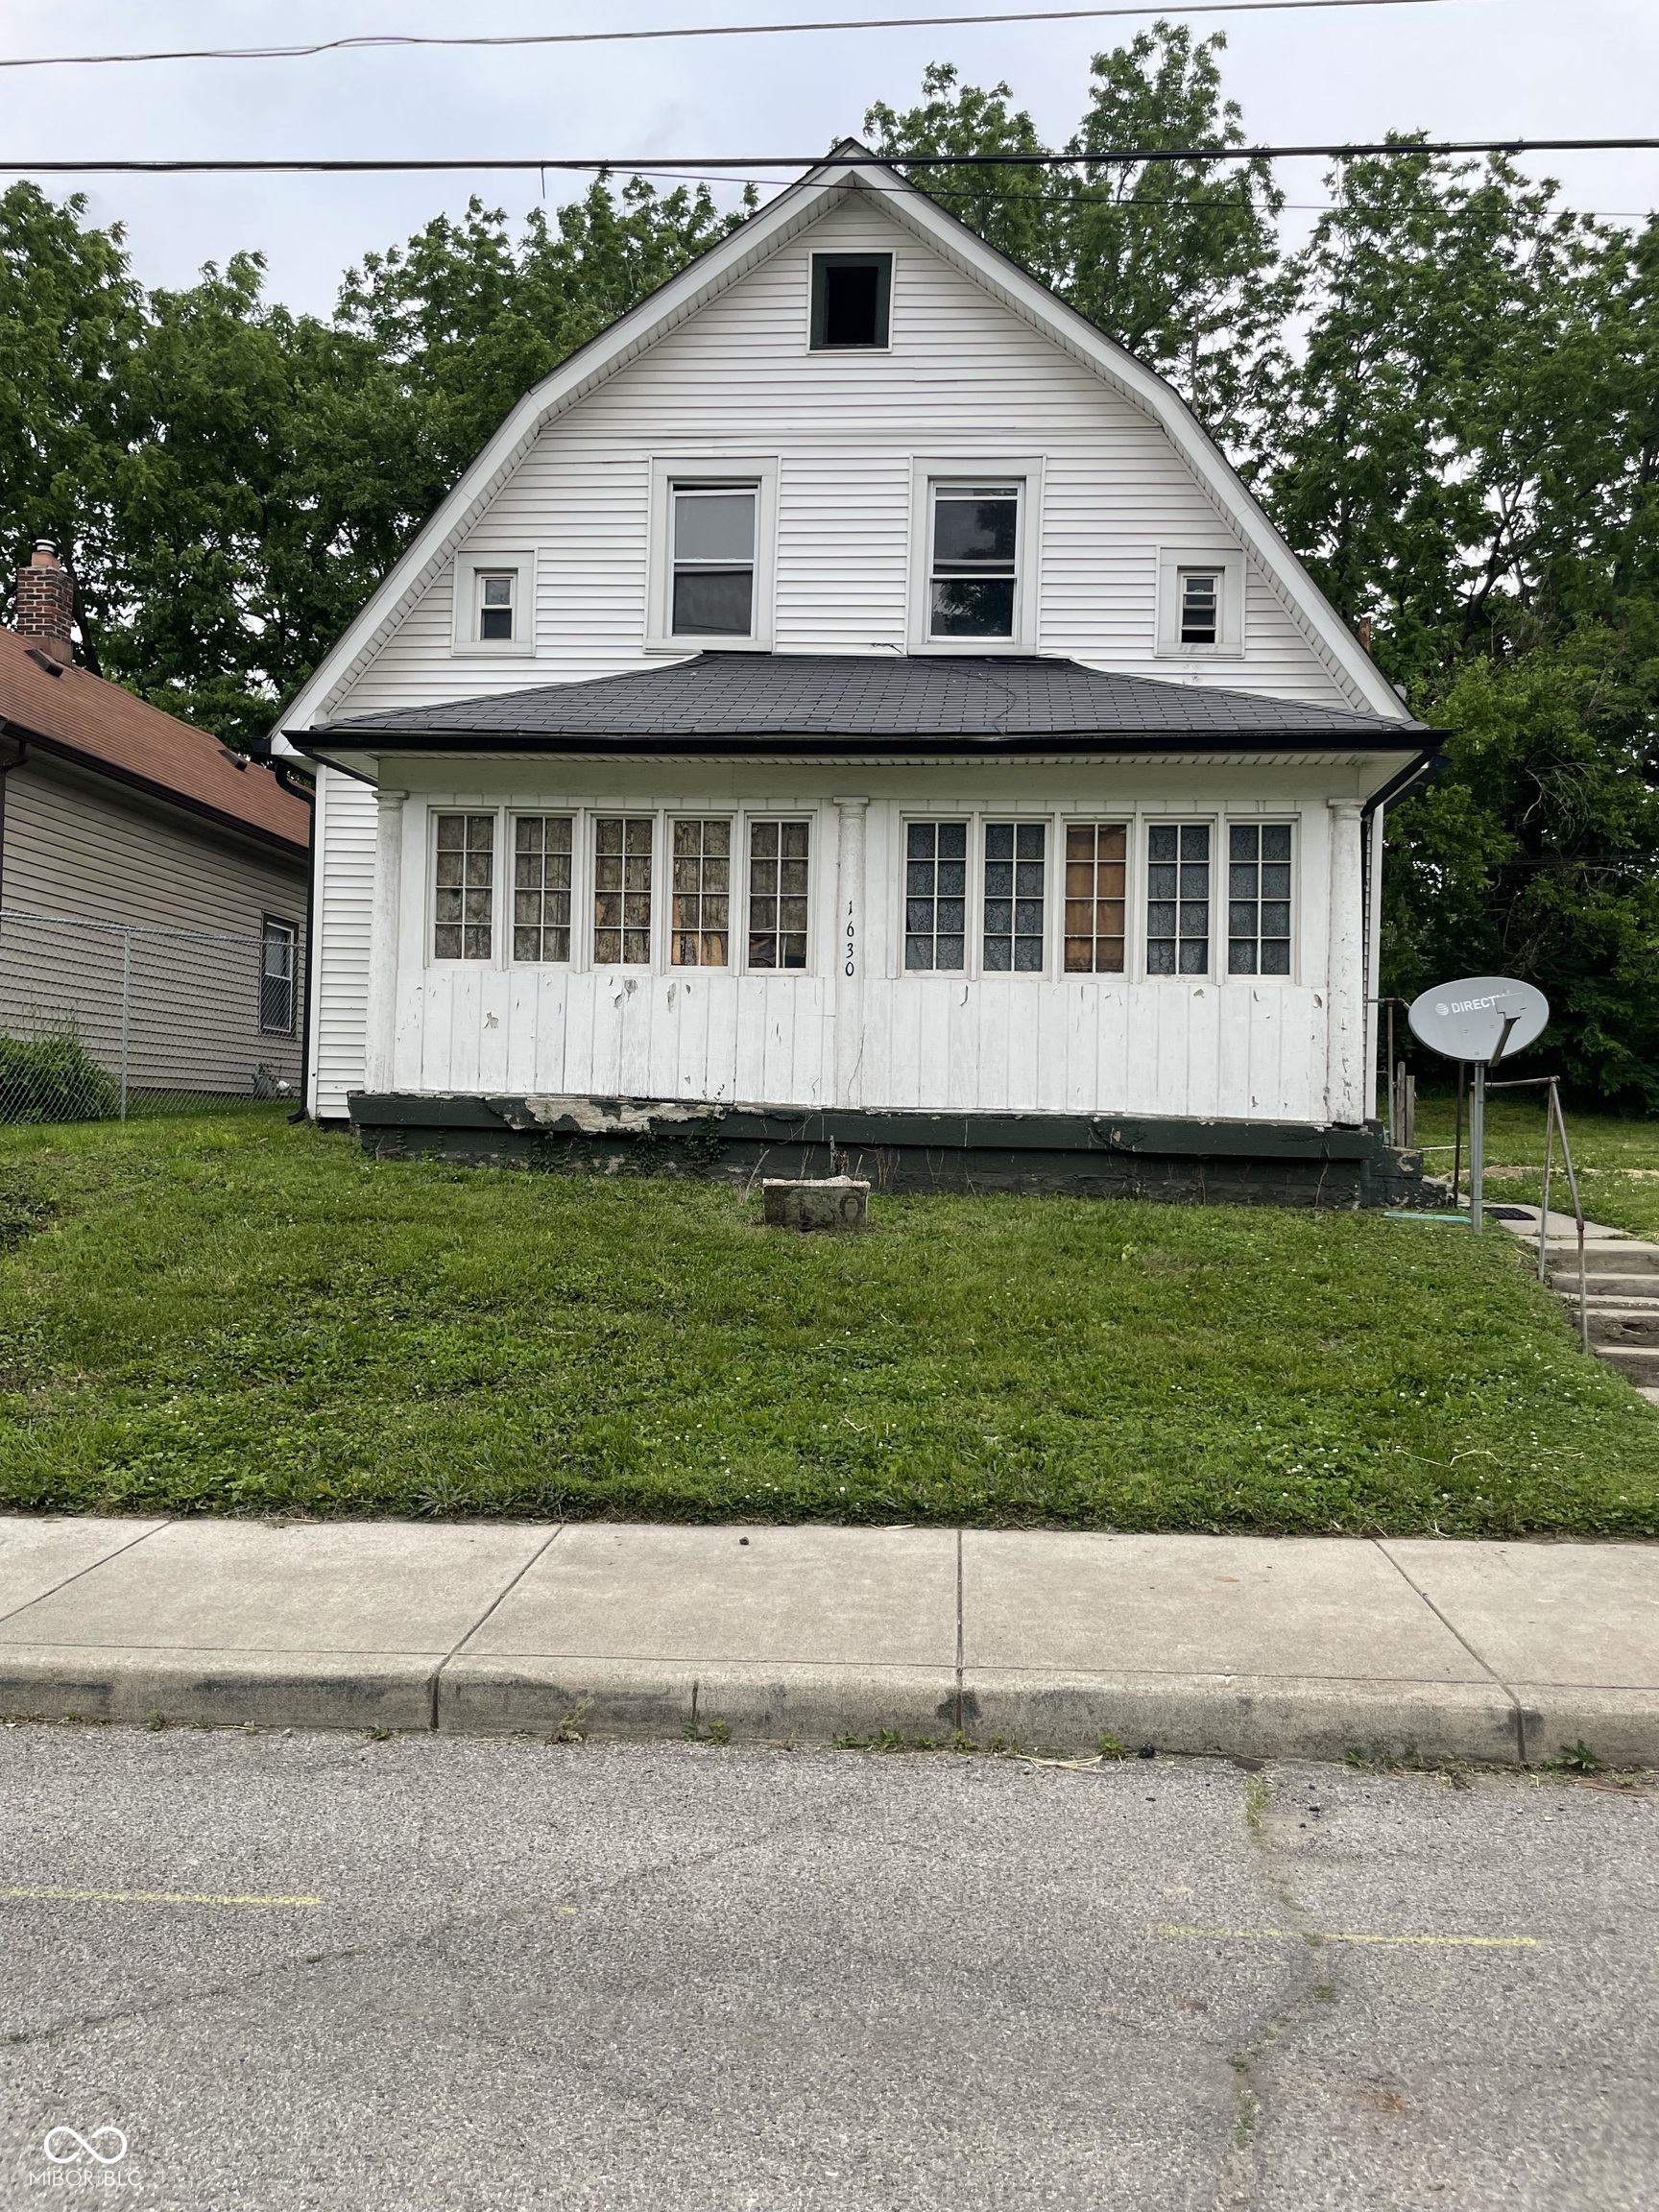
Pending
$112,000
3
bds
|
1
ba
|
1,600
sqft
|
built
1910
1630 E 18th St, Indianapolis, IN 46218
$103
Cash flow
4.8%
Cash-on-Cash Return
7.4%
Cap rate
0.9%
Rent to Value Ratio
Active
$239,000
3
bds
|
0
ba
|
0
sqft
|
built
1910
4114 E Washington St, Indianapolis, IN 46201
$-562
Cash flow
-12.3%
Cash-on-Cash Return
3.5%
Cap rate
0.4%
Rent to Value Ratio
Active
$1,250,000
4
bds
|
5
ba
|
6,882
sqft
|
built
1988
3748 Bay Road South Dr, Indianapolis, IN 46240
$-2,755
Cash flow
-11.5%
Cash-on-Cash Return
3.6%
Cap rate
0.5%
Rent to Value Ratio
Active
$575,000
4
bds
|
4
ba
|
2,240
sqft
|
built
1910
48 N Audubon Rd, Indianapolis, IN 46219
$-1,286
Cash flow
-11.7%
Cash-on-Cash Return
3.6%
Cap rate
0.4%
Rent to Value Ratio
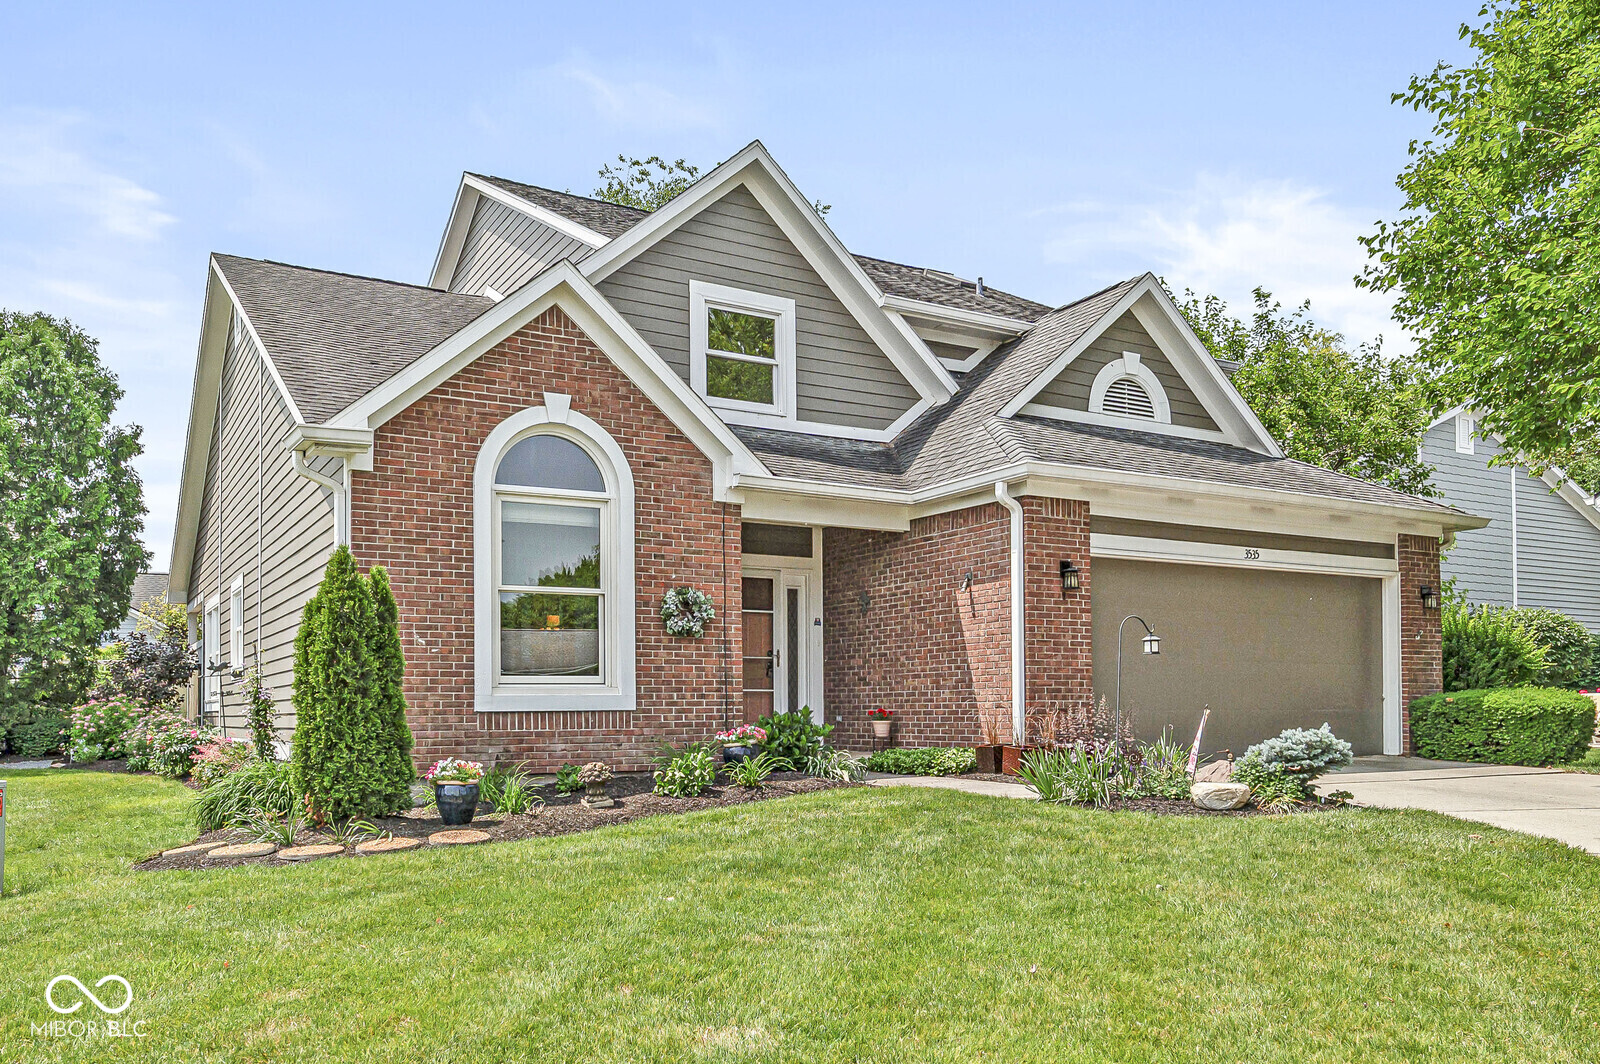
Active
$525,000
3
bds
|
3
ba
|
2,434
sqft
|
built
1992
3535 Clearwater Cir, Indianapolis, IN 46240
$-1,105
Cash flow
-11.0%
Cash-on-Cash Return
3.8%
Cap rate
0.6%
Rent to Value Ratio

Active
$275,000
2
bds
|
0
ba
|
0
sqft
|
built
1915
3707 N Kenwood Ave, Indianapolis, IN 46208
$-336
Cash flow
-6.4%
Cash-on-Cash Return
4.8%
Cap rate
0.6%
Rent to Value Ratio
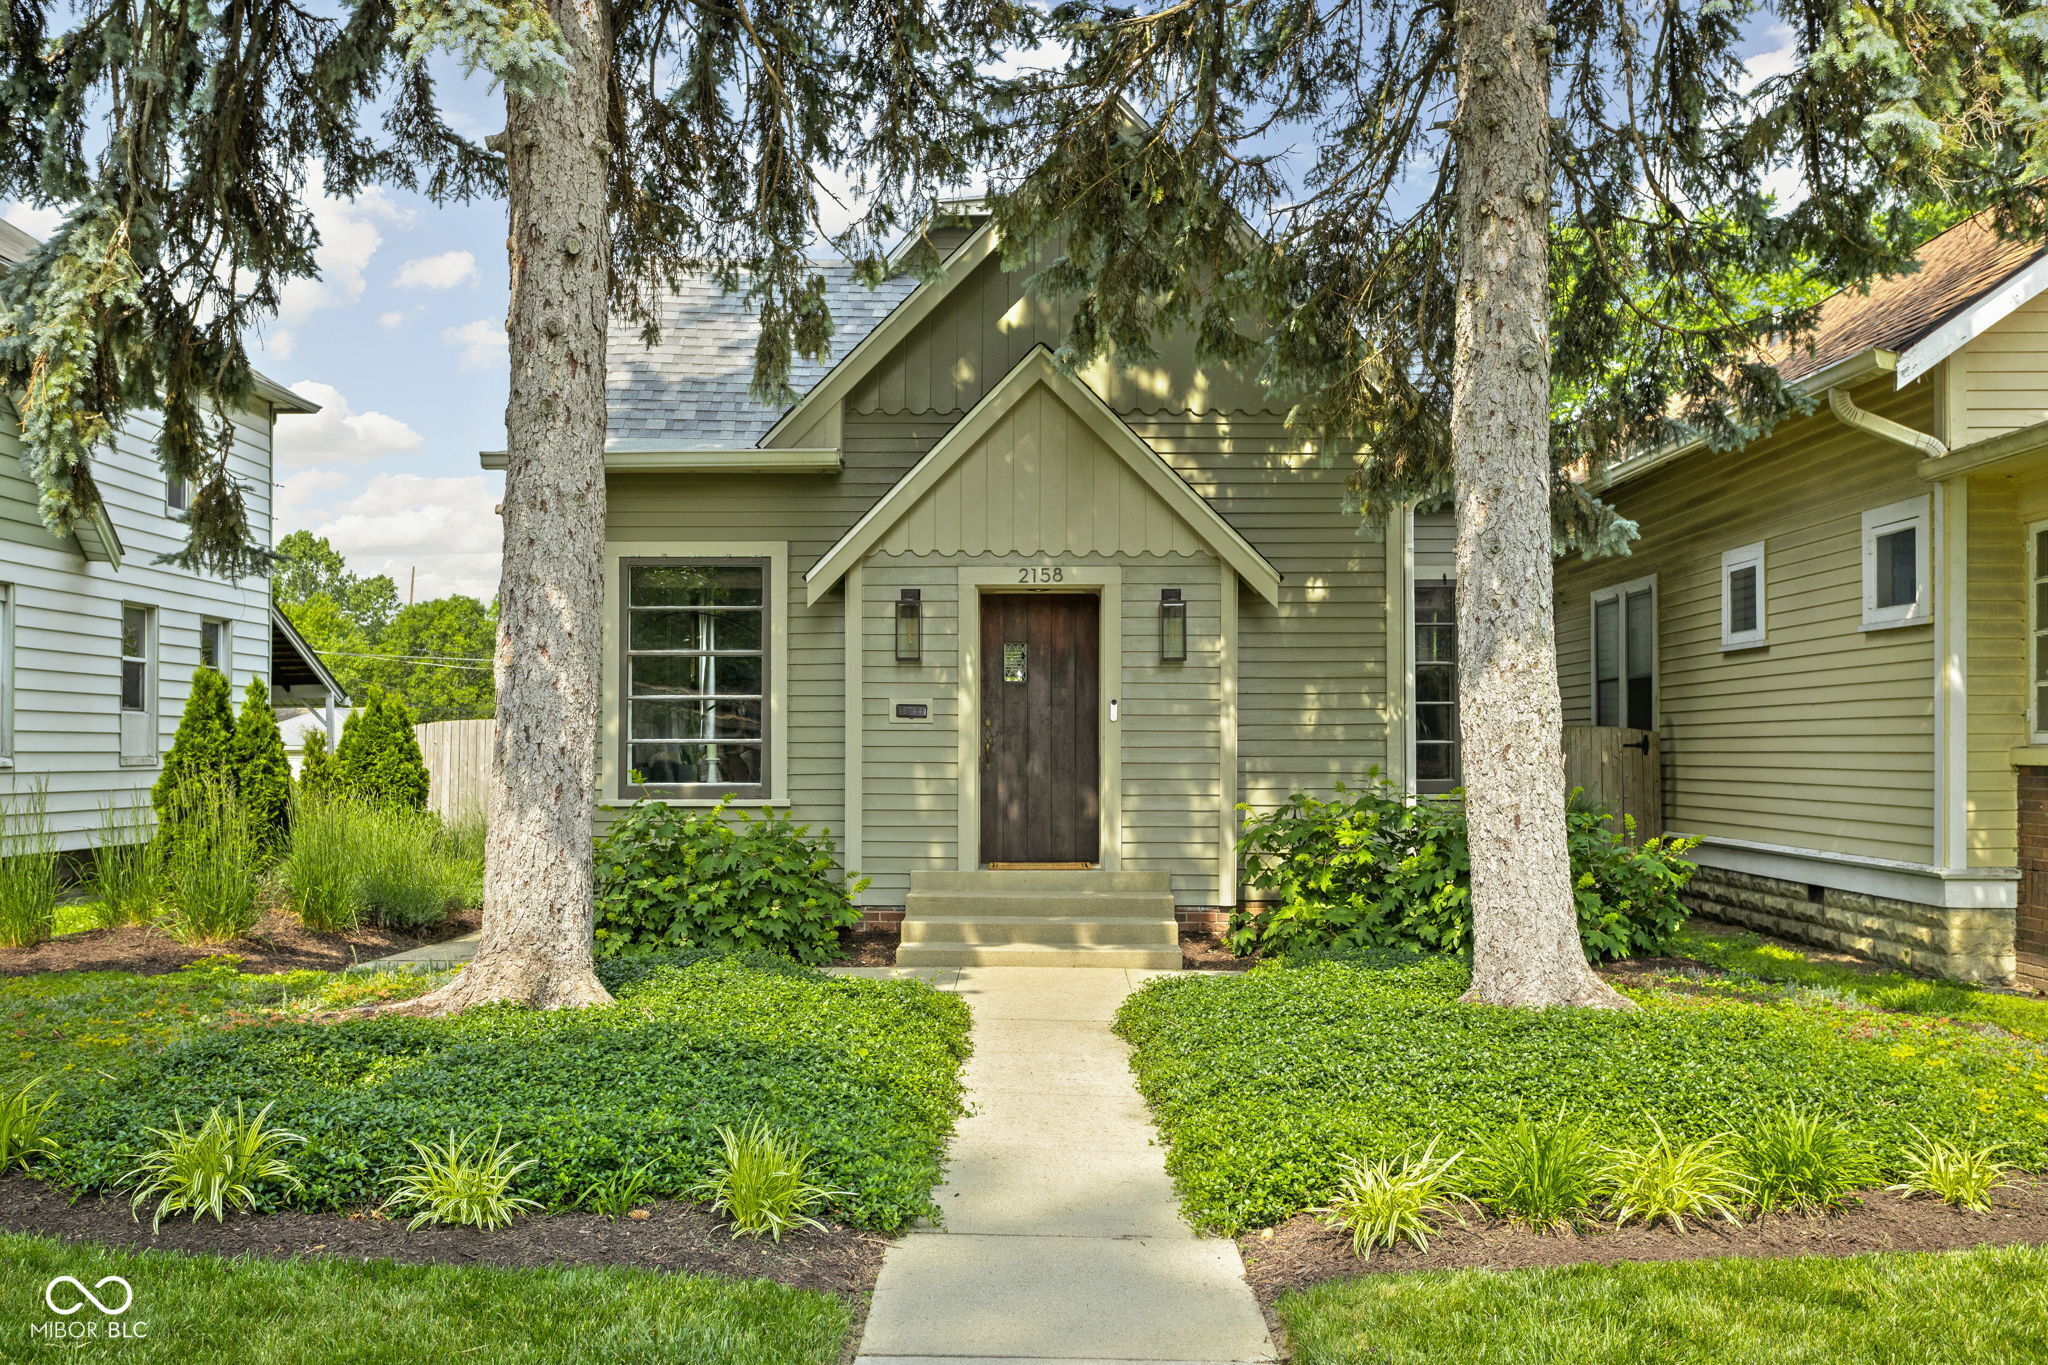
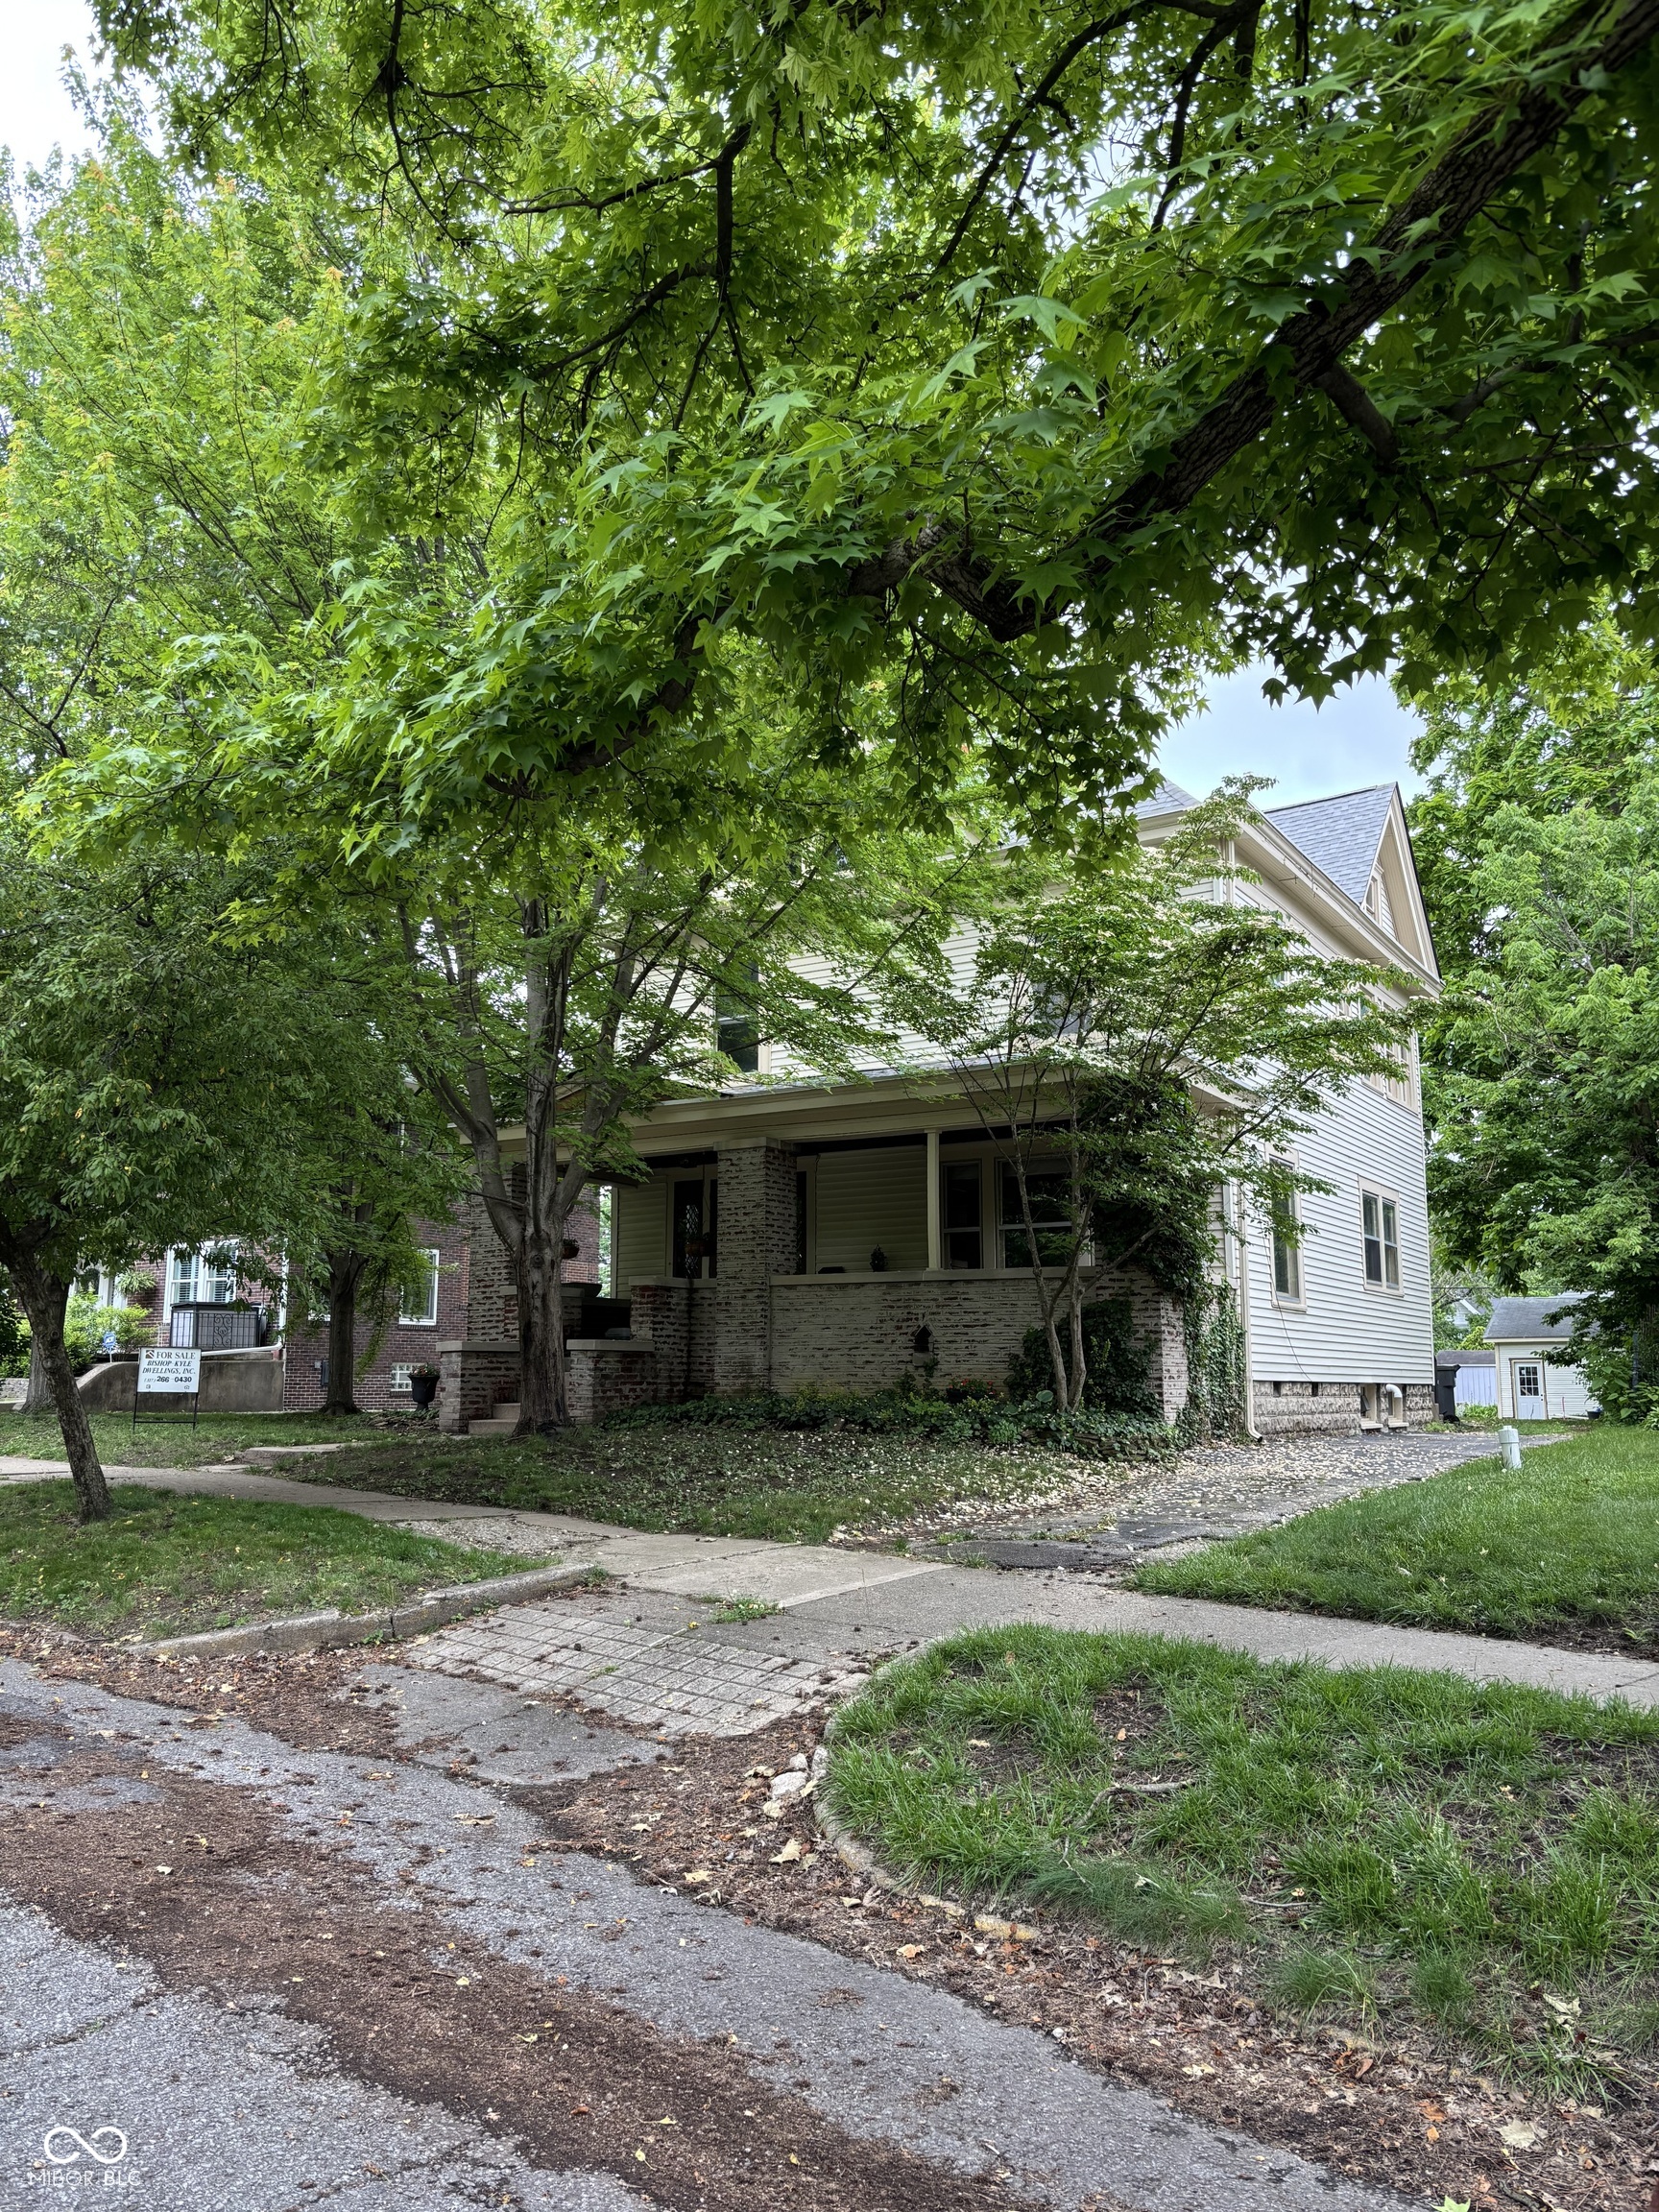
Active
$315,000
3
bds
|
1
ba
|
1,251
sqft
|
built
1906
2158 S Garfield Dr, Indianapolis, IN 46203
$-132
Cash flow
-2.2%
Cash-on-Cash Return
5.8%
Cap rate
0.7%
Rent to Value Ratio
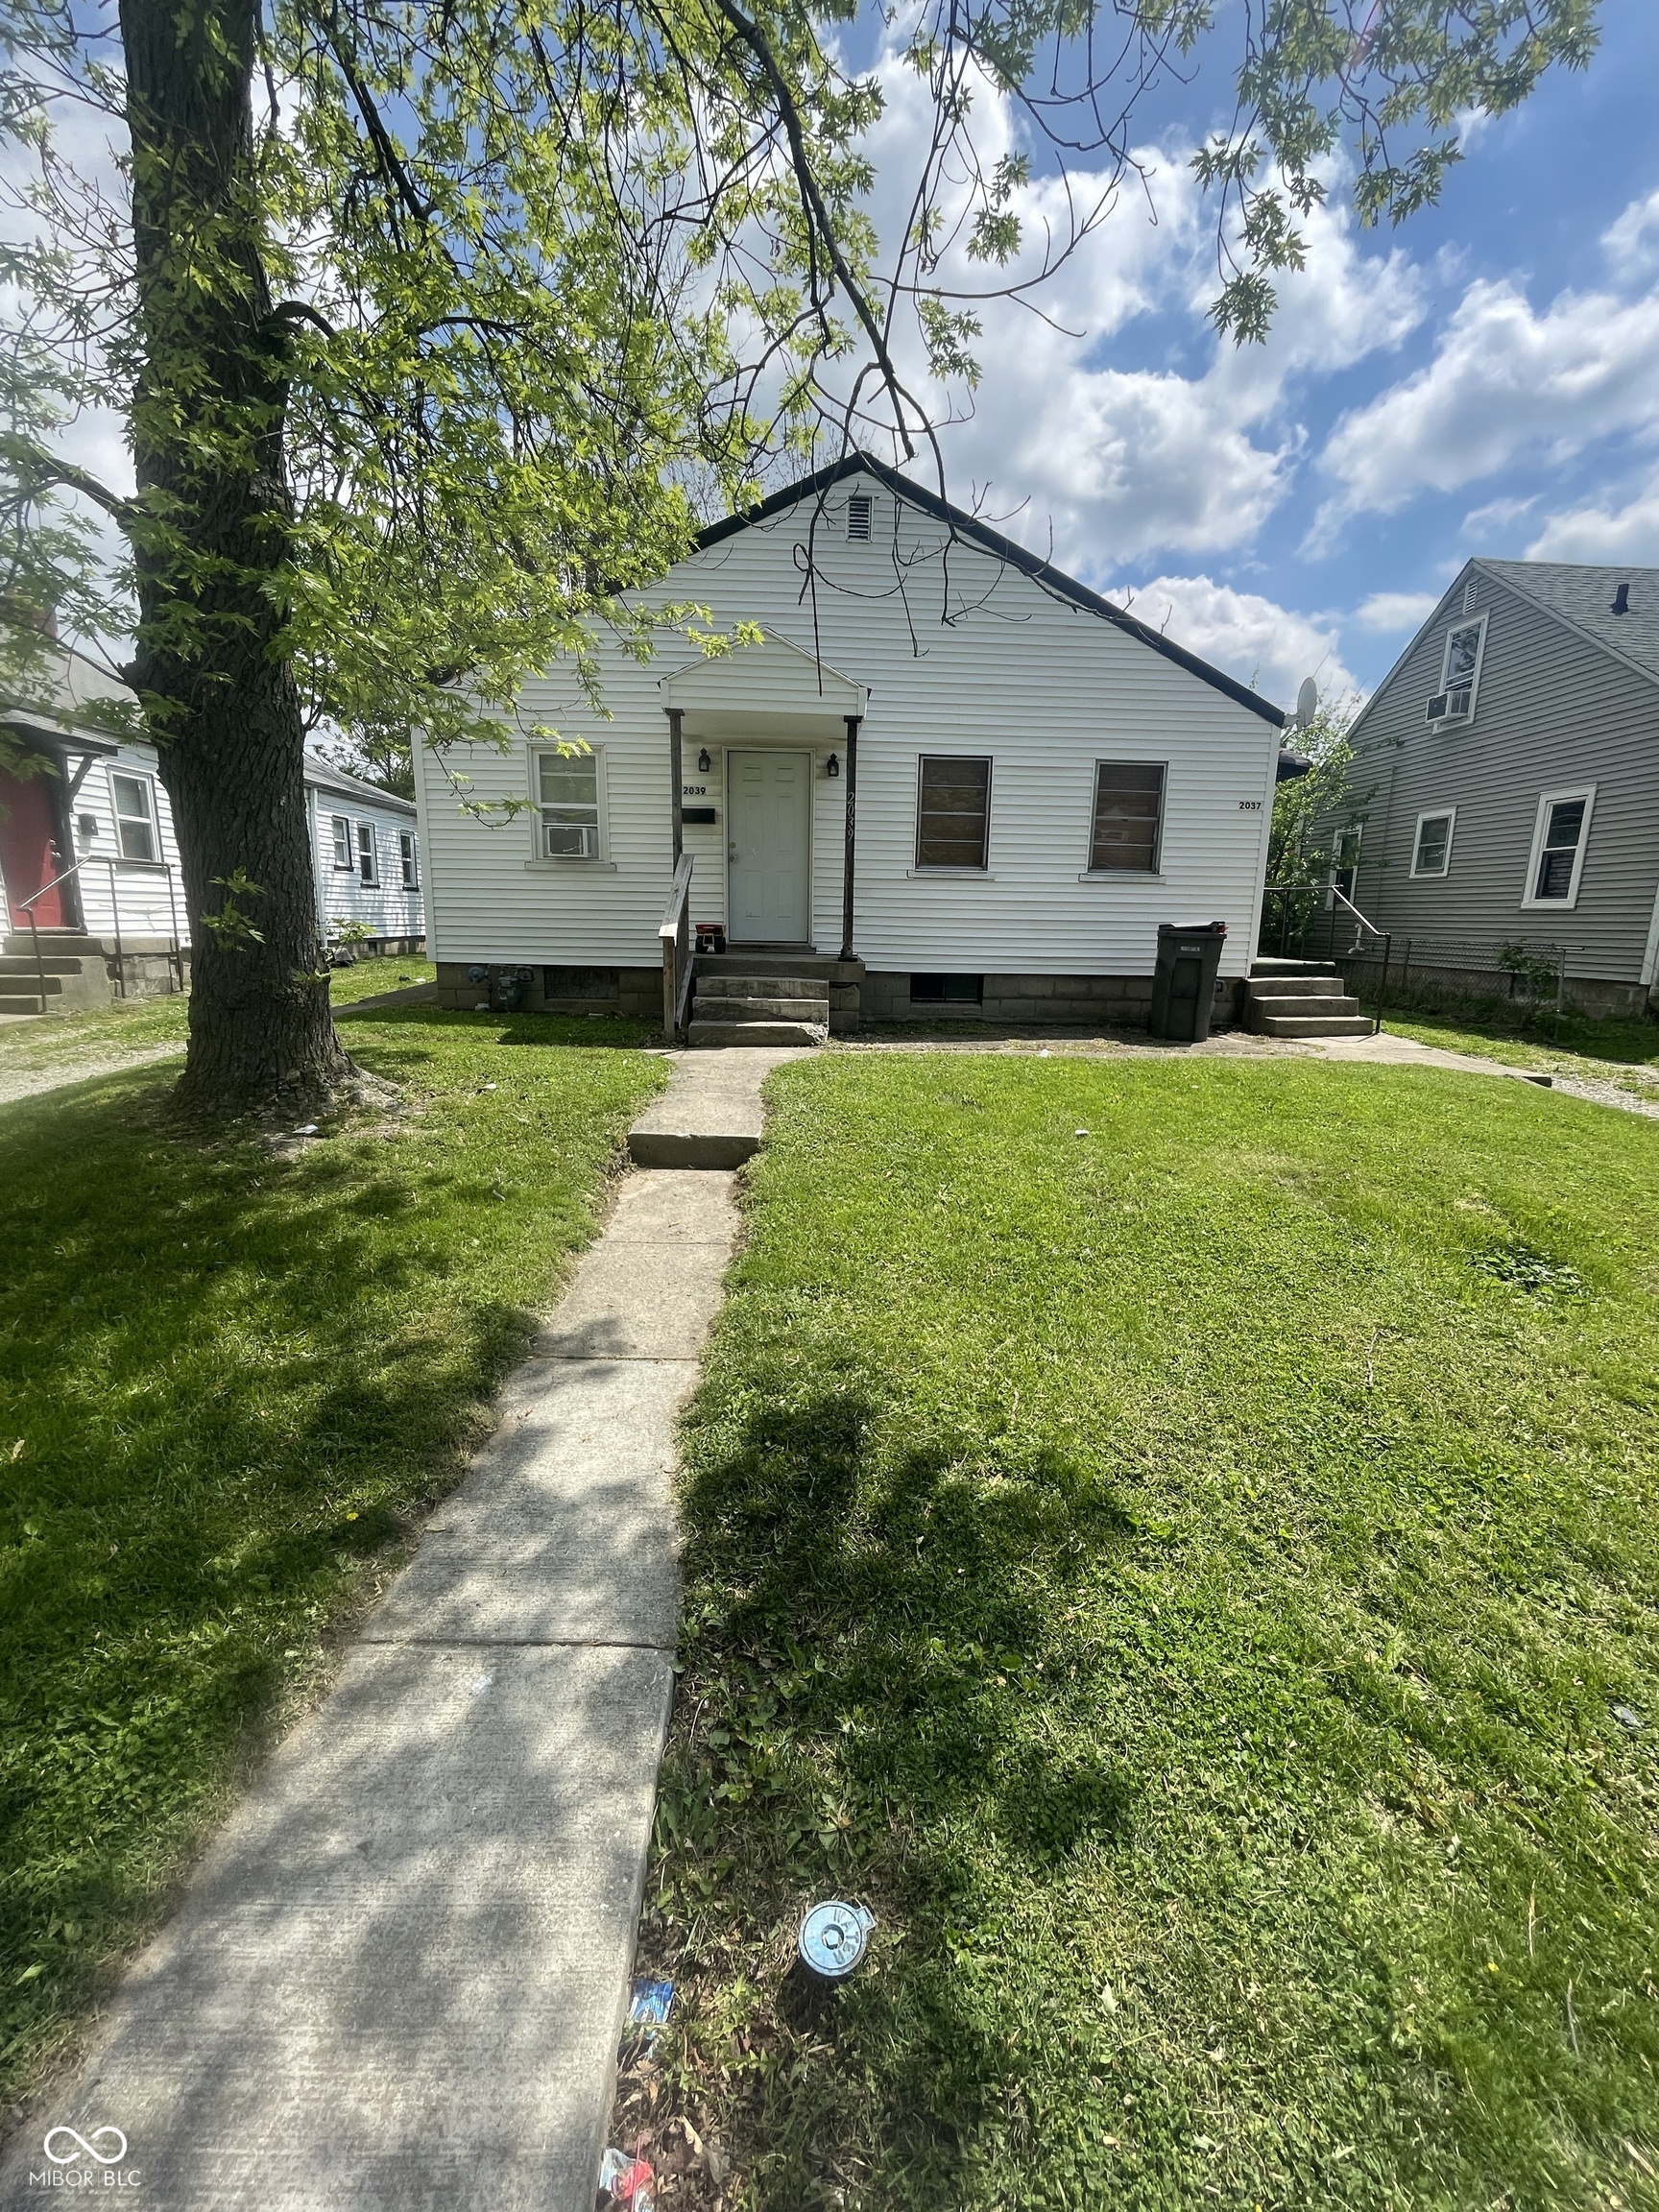
Active
$150,000
2
bds
|
0
ba
|
0
sqft
|
built
1949
2037 Glenridge Dr, Indianapolis, IN 46218
$-165
Cash flow
-5.7%
Cash-on-Cash Return
5.0%
Cap rate
0.6%
Rent to Value Ratio
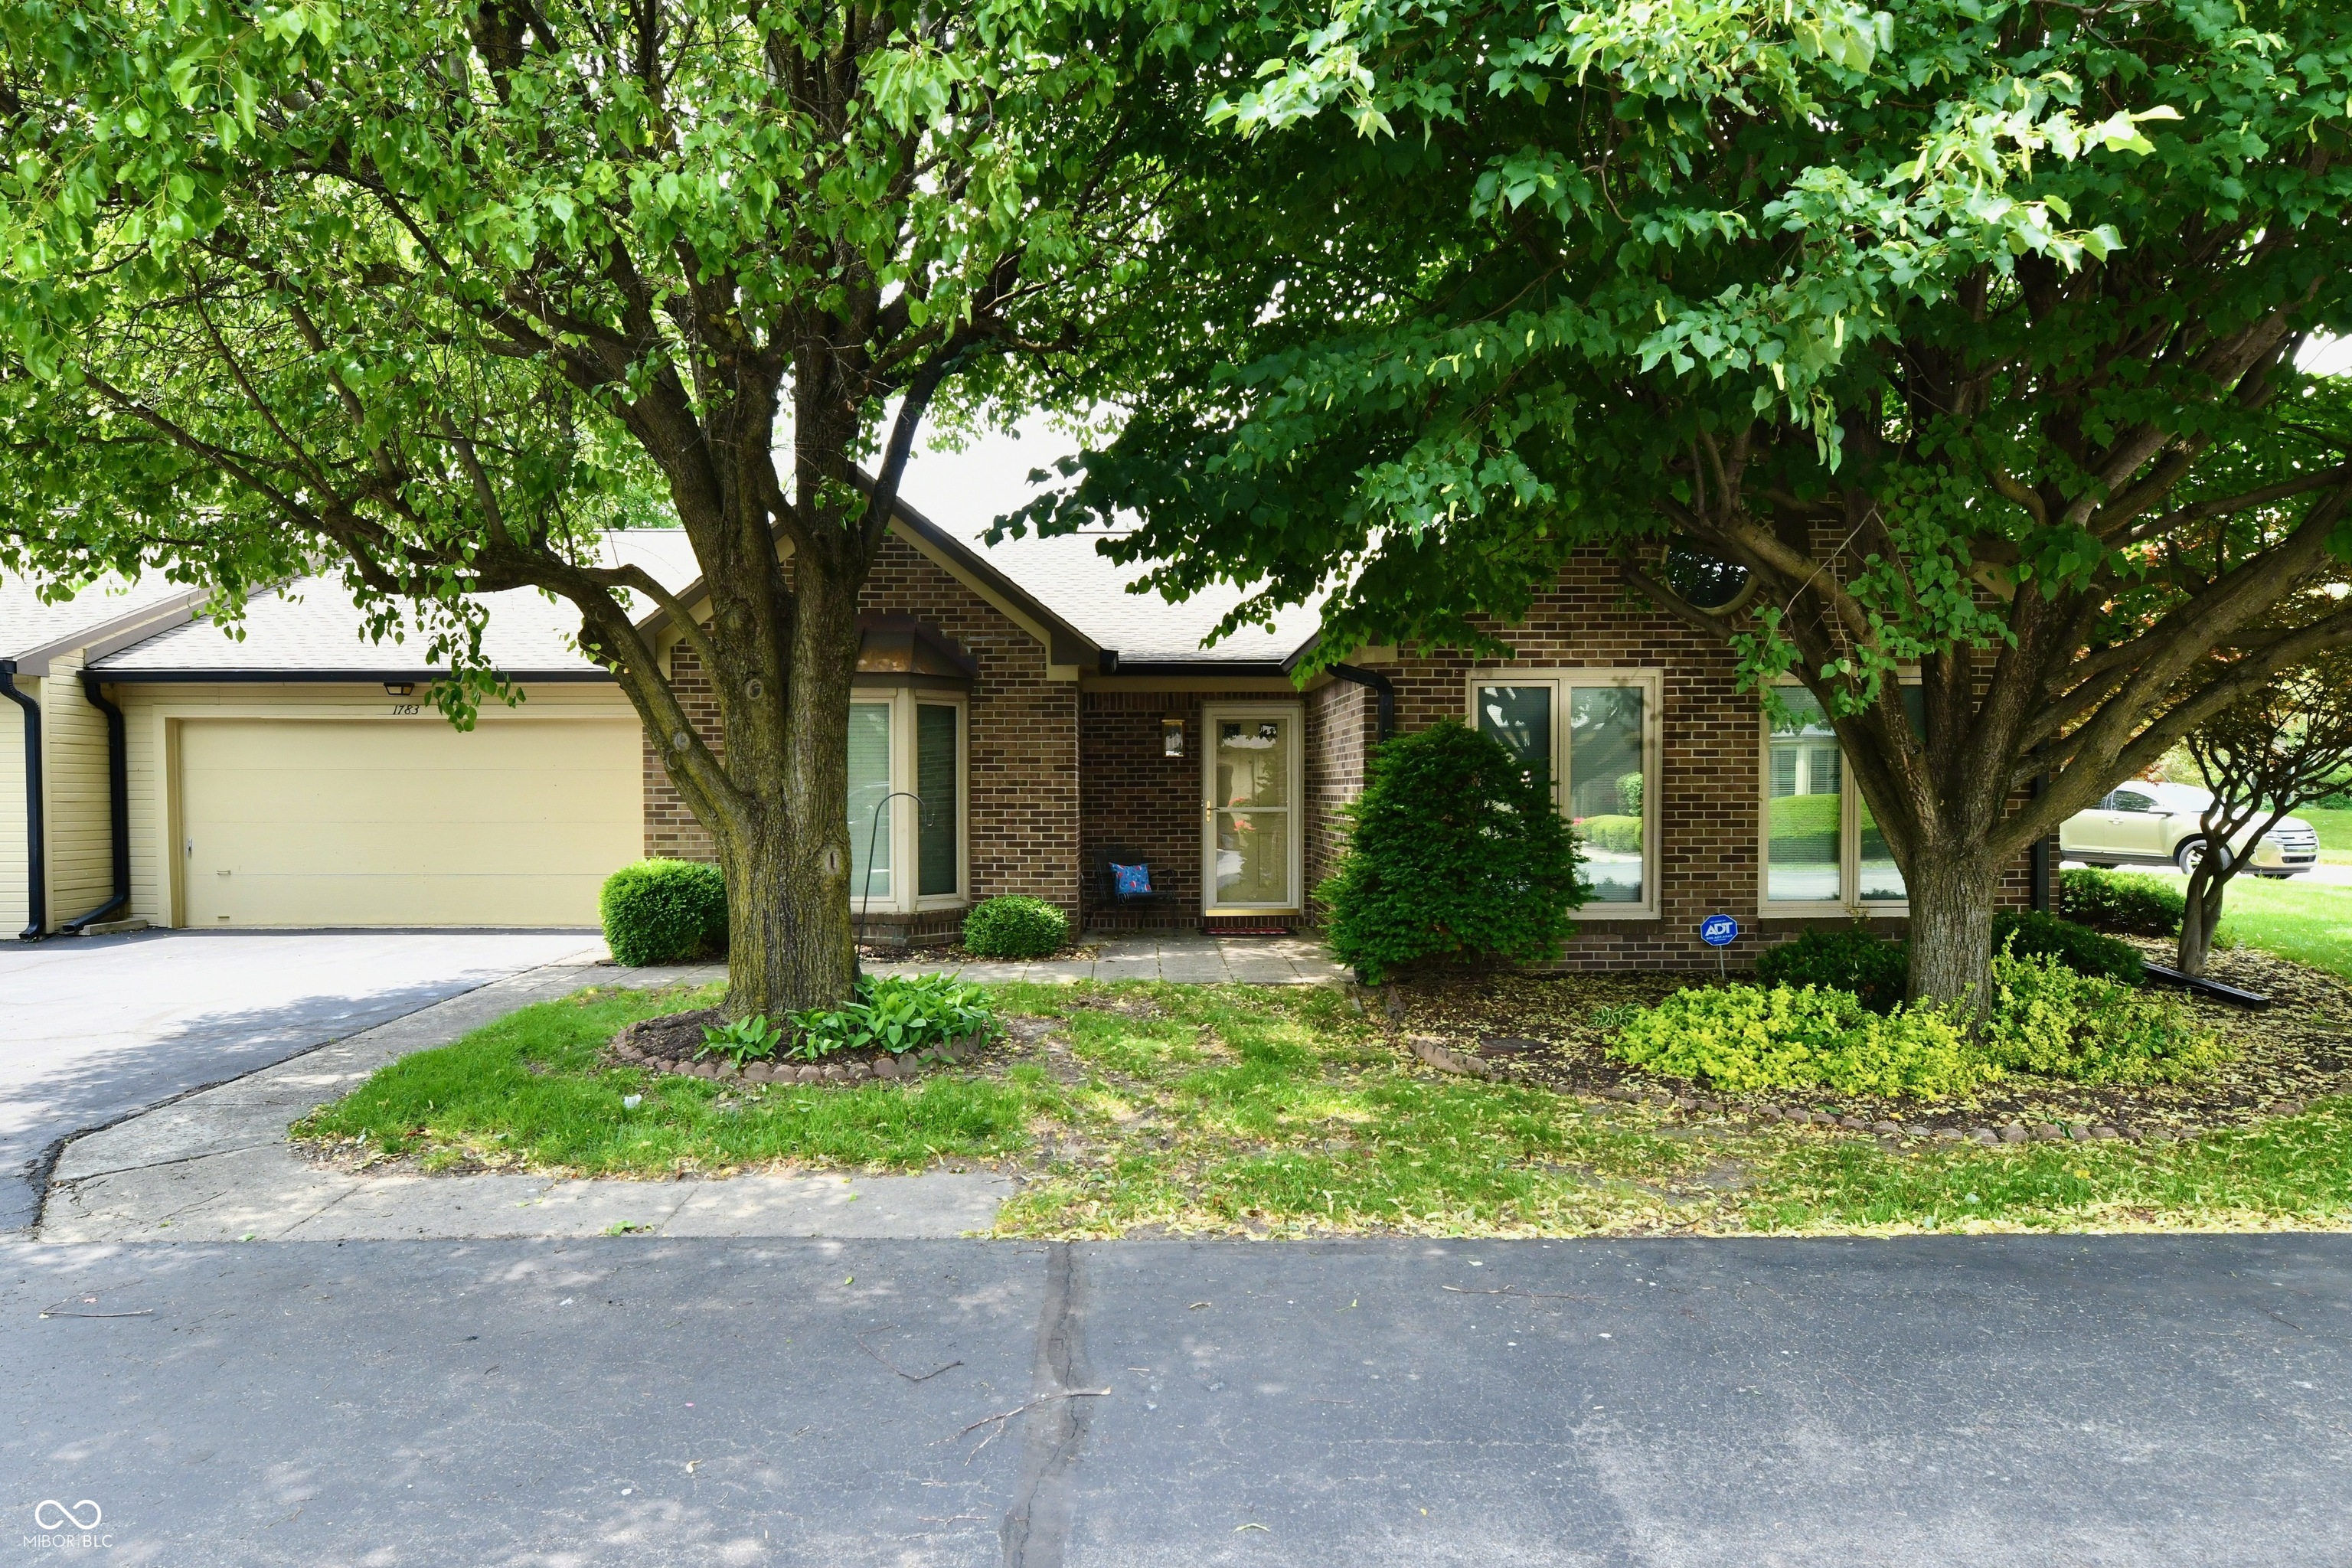
Pending
$295,000
3
bds
|
2
ba
|
2,041
sqft
|
built
1988
1783 Cloister Dr, Indianapolis, IN 46260
$-403
Cash flow
-7.1%
Cash-on-Cash Return
4.6%
Cap rate
0.7%
Rent to Value Ratio
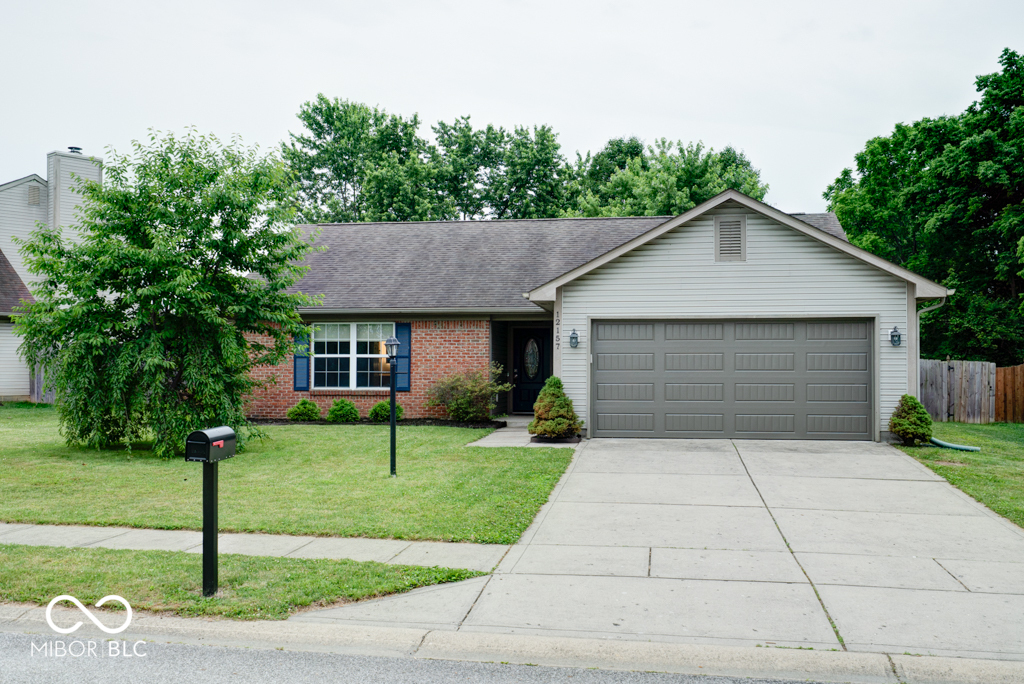
Active
$294,900
3
bds
|
2
ba
|
1,264
sqft
|
built
1994
12157 Longstraw Dr, Indianapolis, IN 46236
$-176
Cash flow
-3.1%
Cash-on-Cash Return
5.6%
Cap rate
0.7%
Rent to Value Ratio
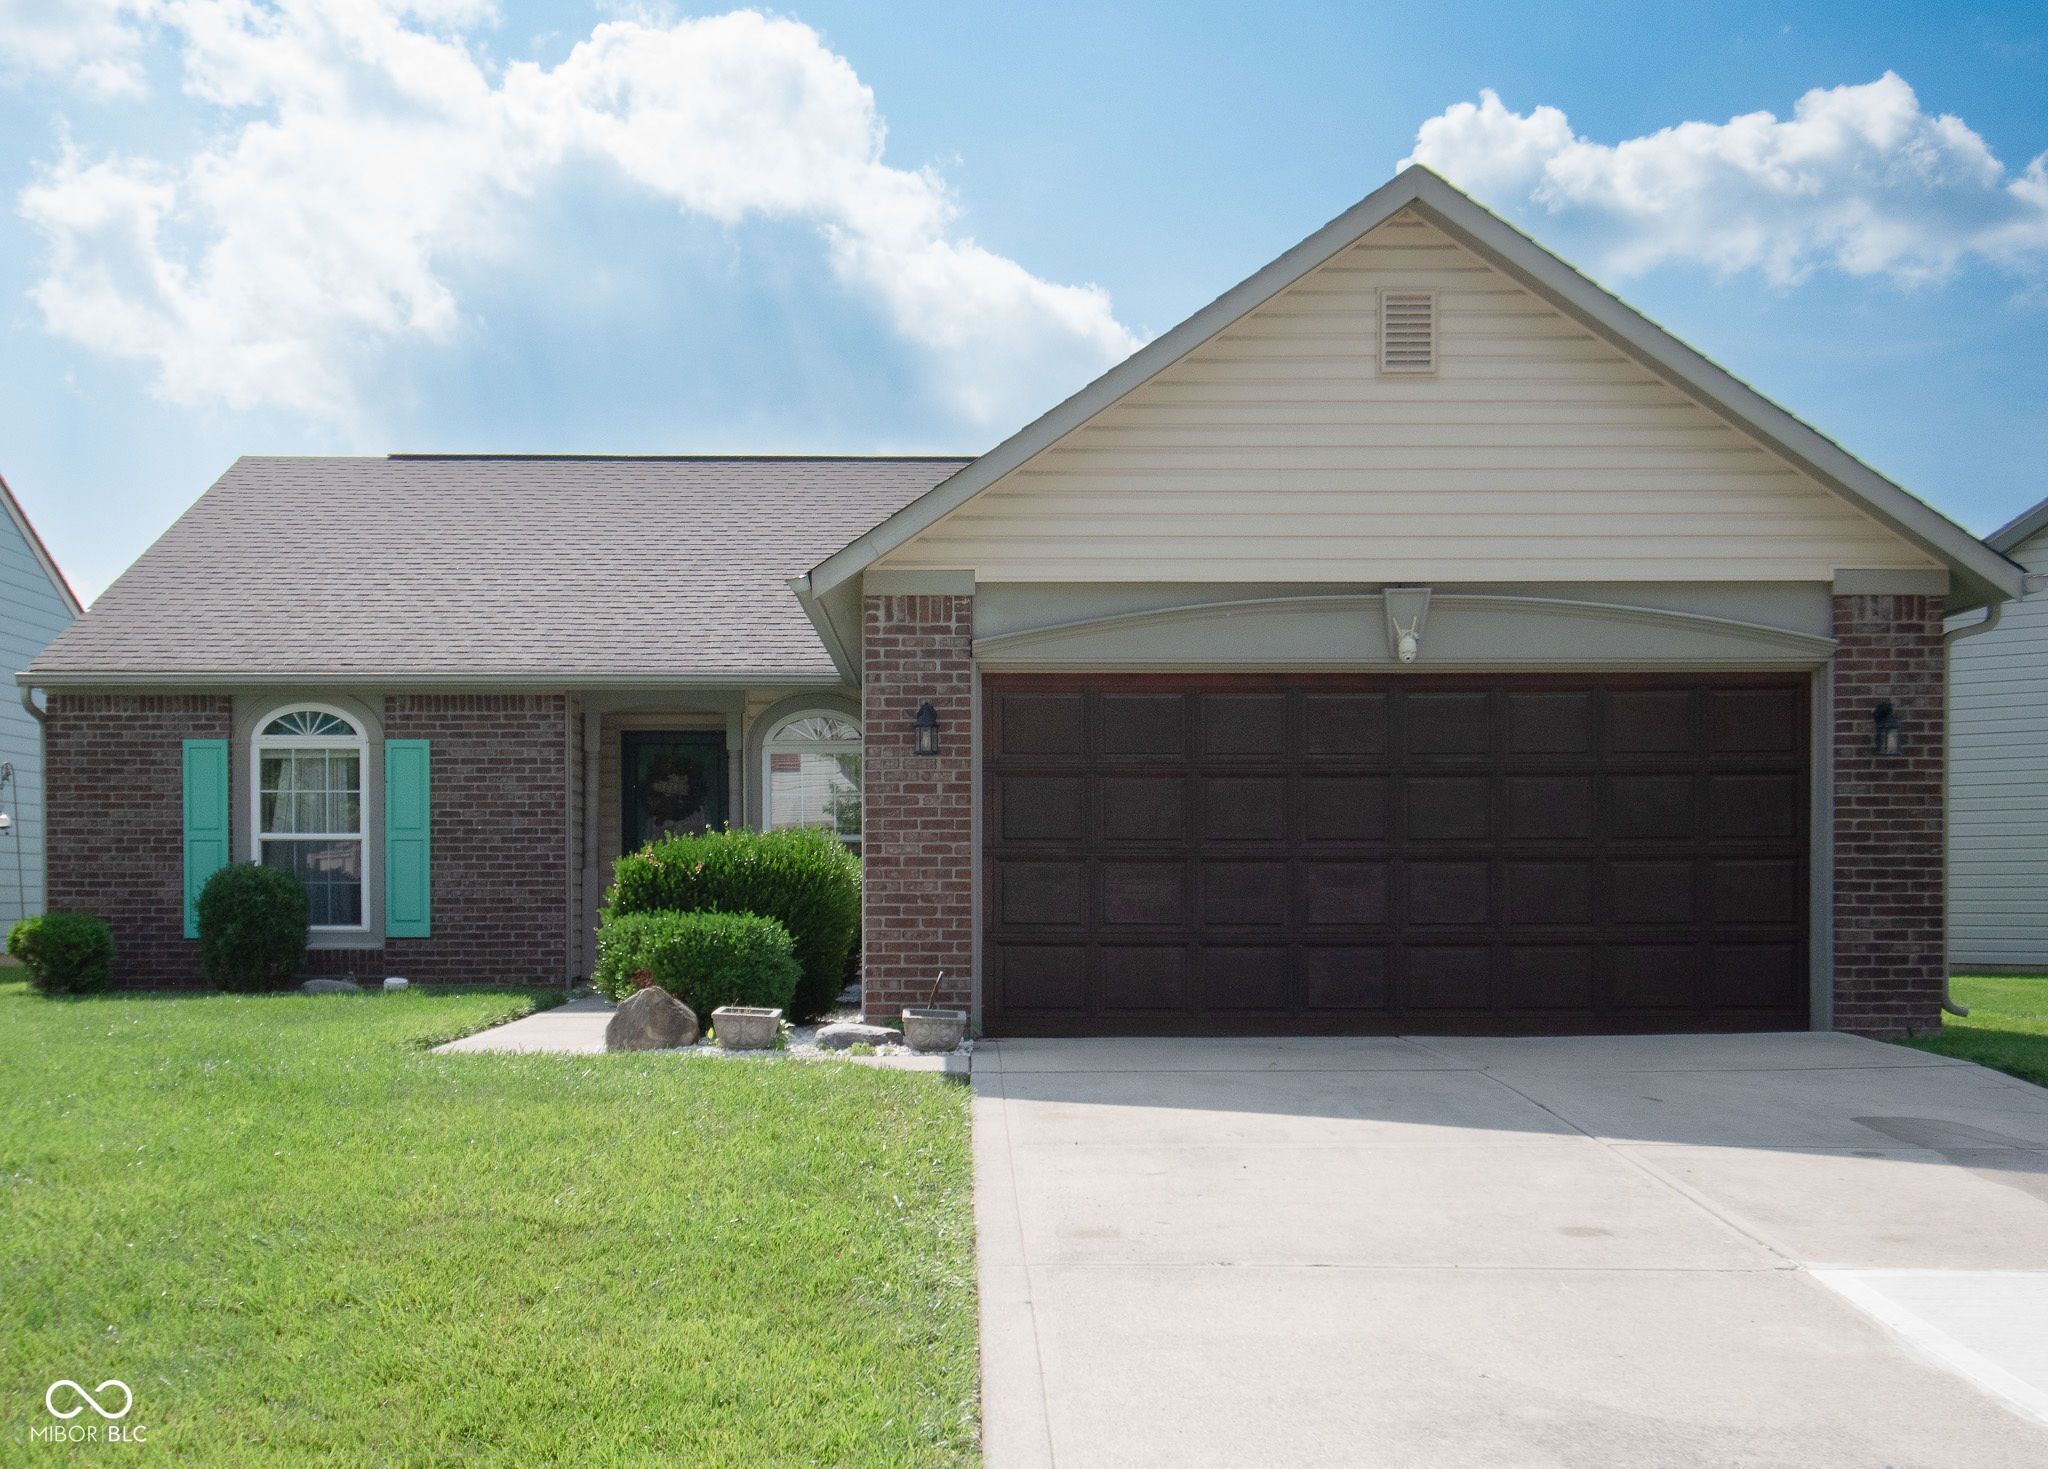
Active
$230,000
3
bds
|
2
ba
|
1,355
sqft
|
built
2000
540 Cahill Ln, Indianapolis, IN 46214
$1
Cash flow
0.0%
Cash-on-Cash Return
6.3%
Cap rate
0.8%
Rent to Value Ratio
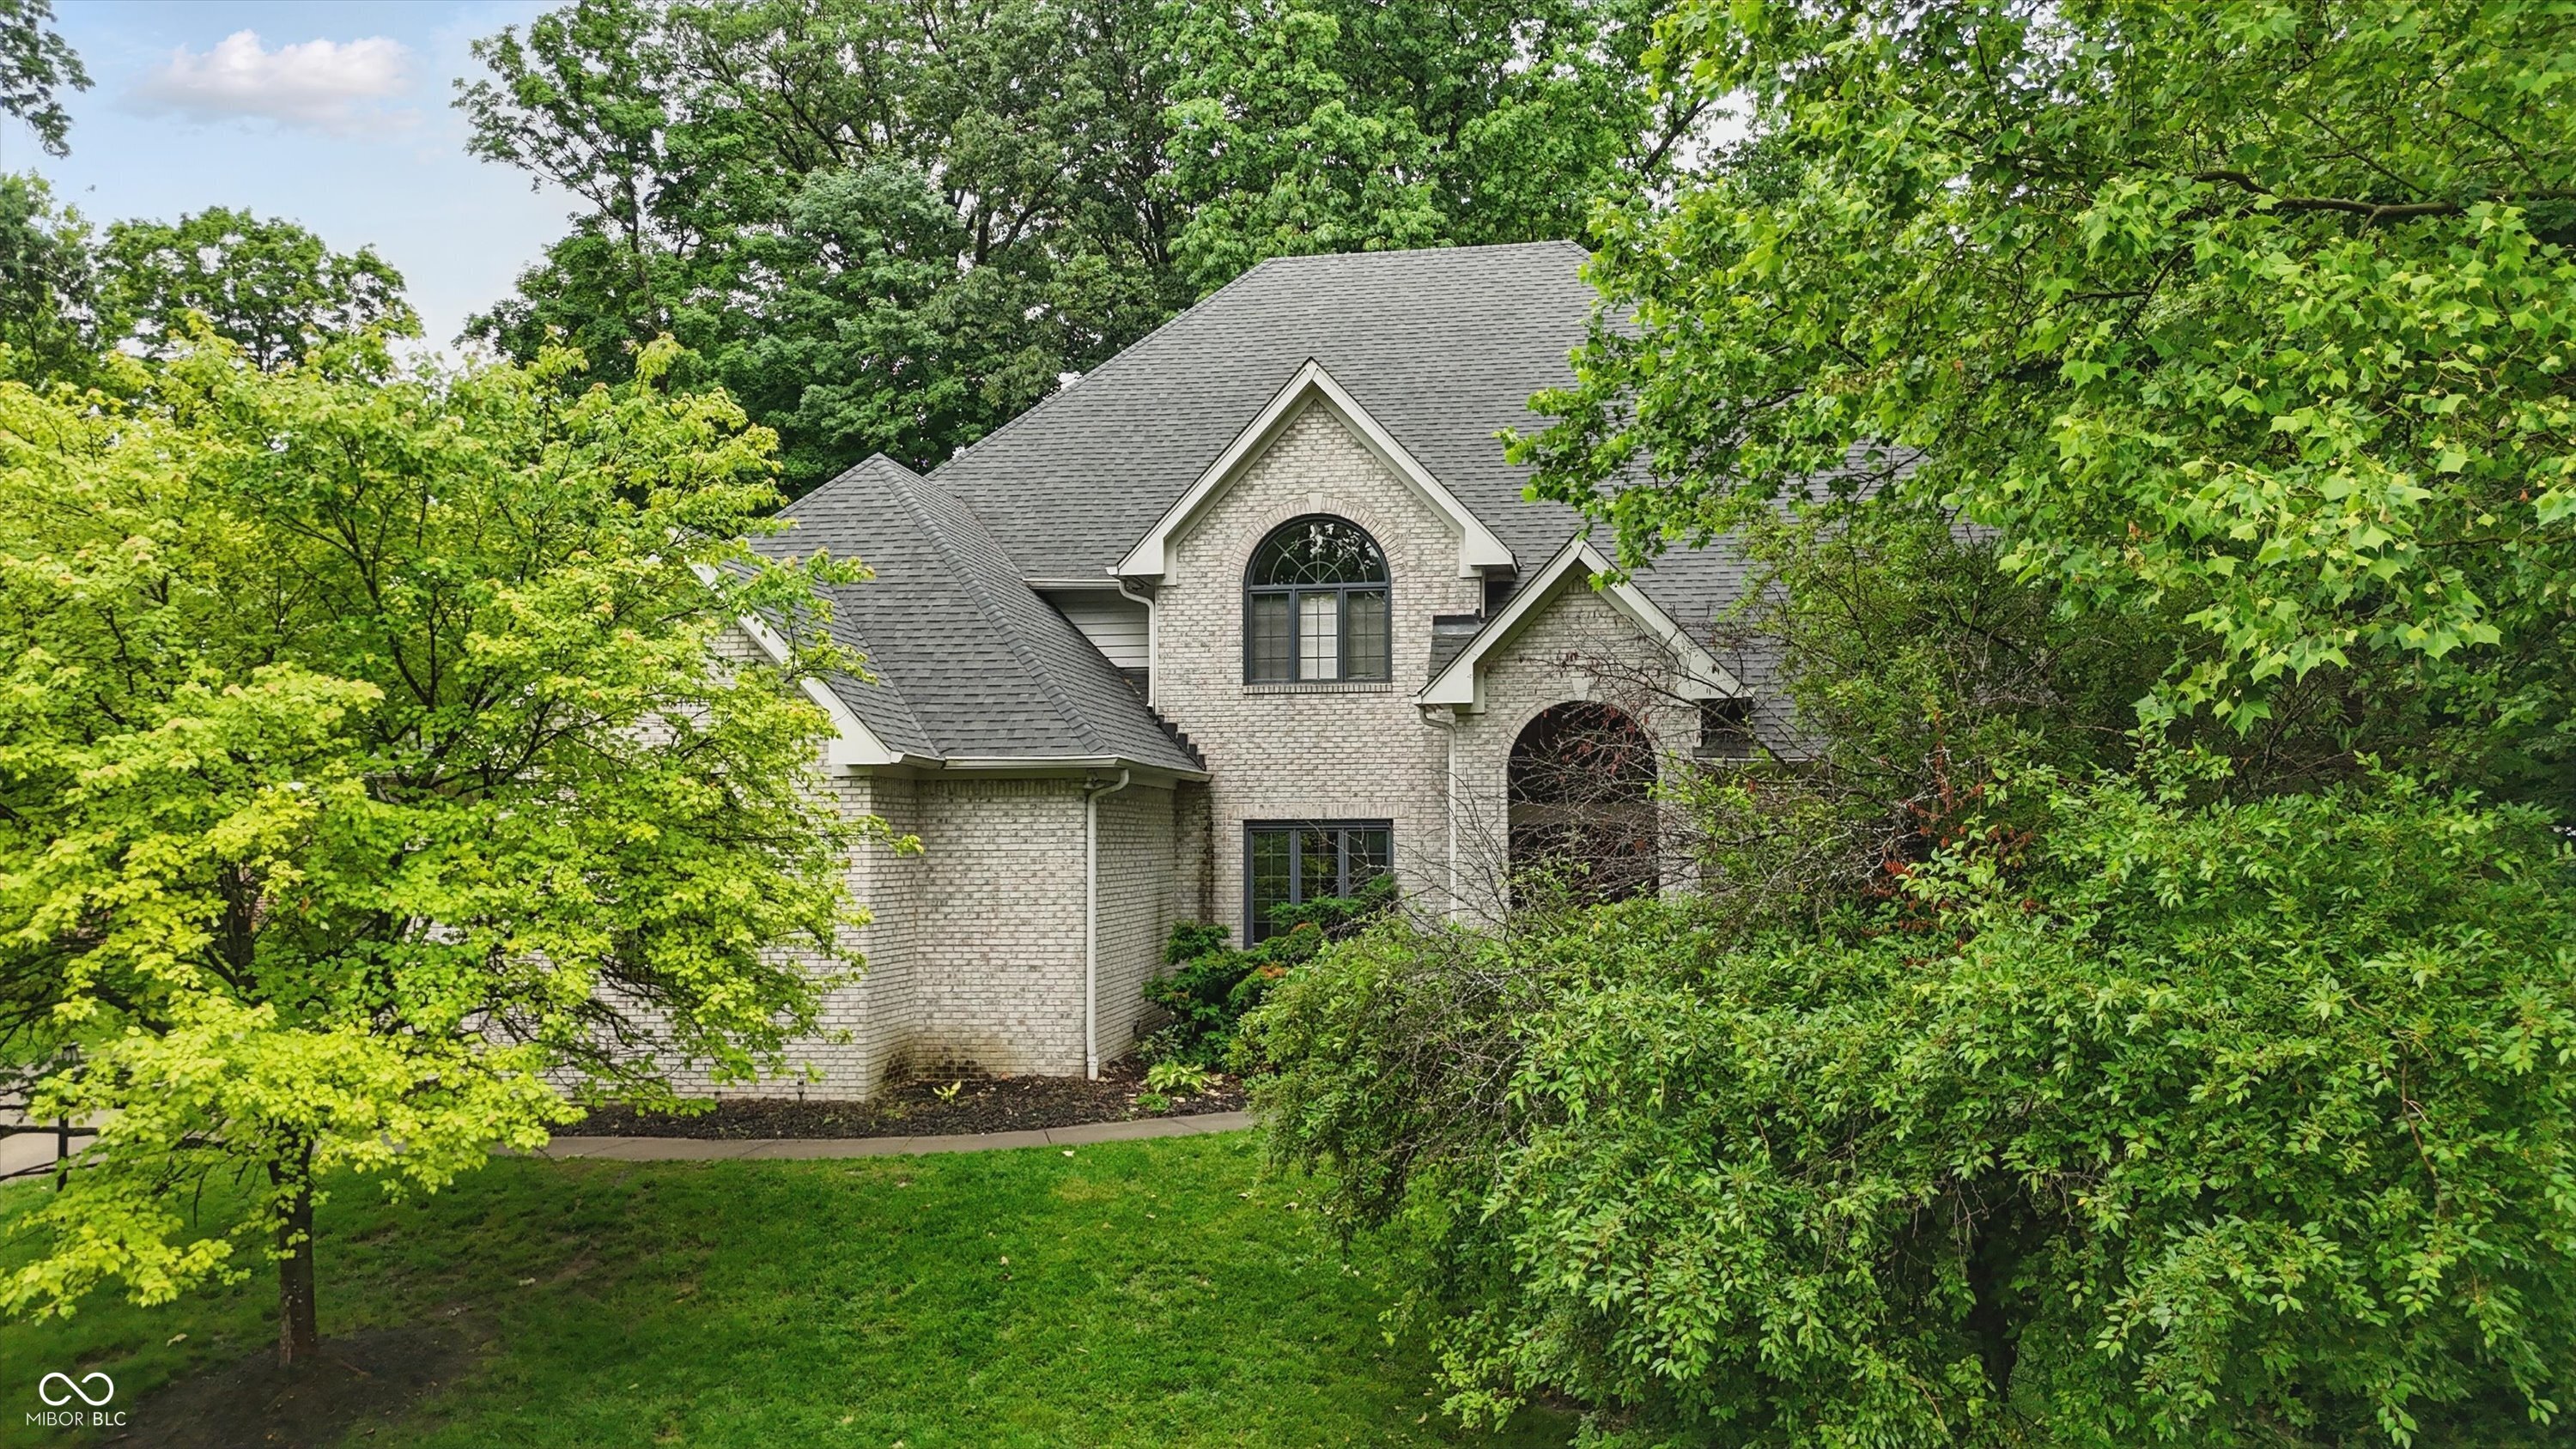
Active
$514,900
7
bds
|
5
ba
|
6,219
sqft
|
built
1996
7138 Nile Ridge Ct, Indianapolis, IN 46236
$-356
Cash flow
-3.6%
Cash-on-Cash Return
5.5%
Cap rate
0.7%
Rent to Value Ratio
Active
$1,500,000
2
bds
|
2
ba
|
12,694
sqft
|
built
1915
3959 Central Ave, Indianapolis, IN 46205
$-6,475
Cash flow
-22.5%
Cash-on-Cash Return
1.1%
Cap rate
0.1%
Rent to Value Ratio
Active
$174,900
2
bds
|
1
ba
|
1,155
sqft
|
built
1910
714 S Keystone Ave, Indianapolis, IN 46203
$-19
Cash flow
-0.6%
Cash-on-Cash Return
6.2%
Cap rate
0.7%
Rent to Value Ratio
Active
$109,900
2
bds
|
1
ba
|
840
sqft
|
built
1958
1140 Mc Dougal St, Indianapolis, IN 46203
$183
Cash flow
8.7%
Cash-on-Cash Return
8.3%
Cap rate
1.0%
Rent to Value Ratio
Active
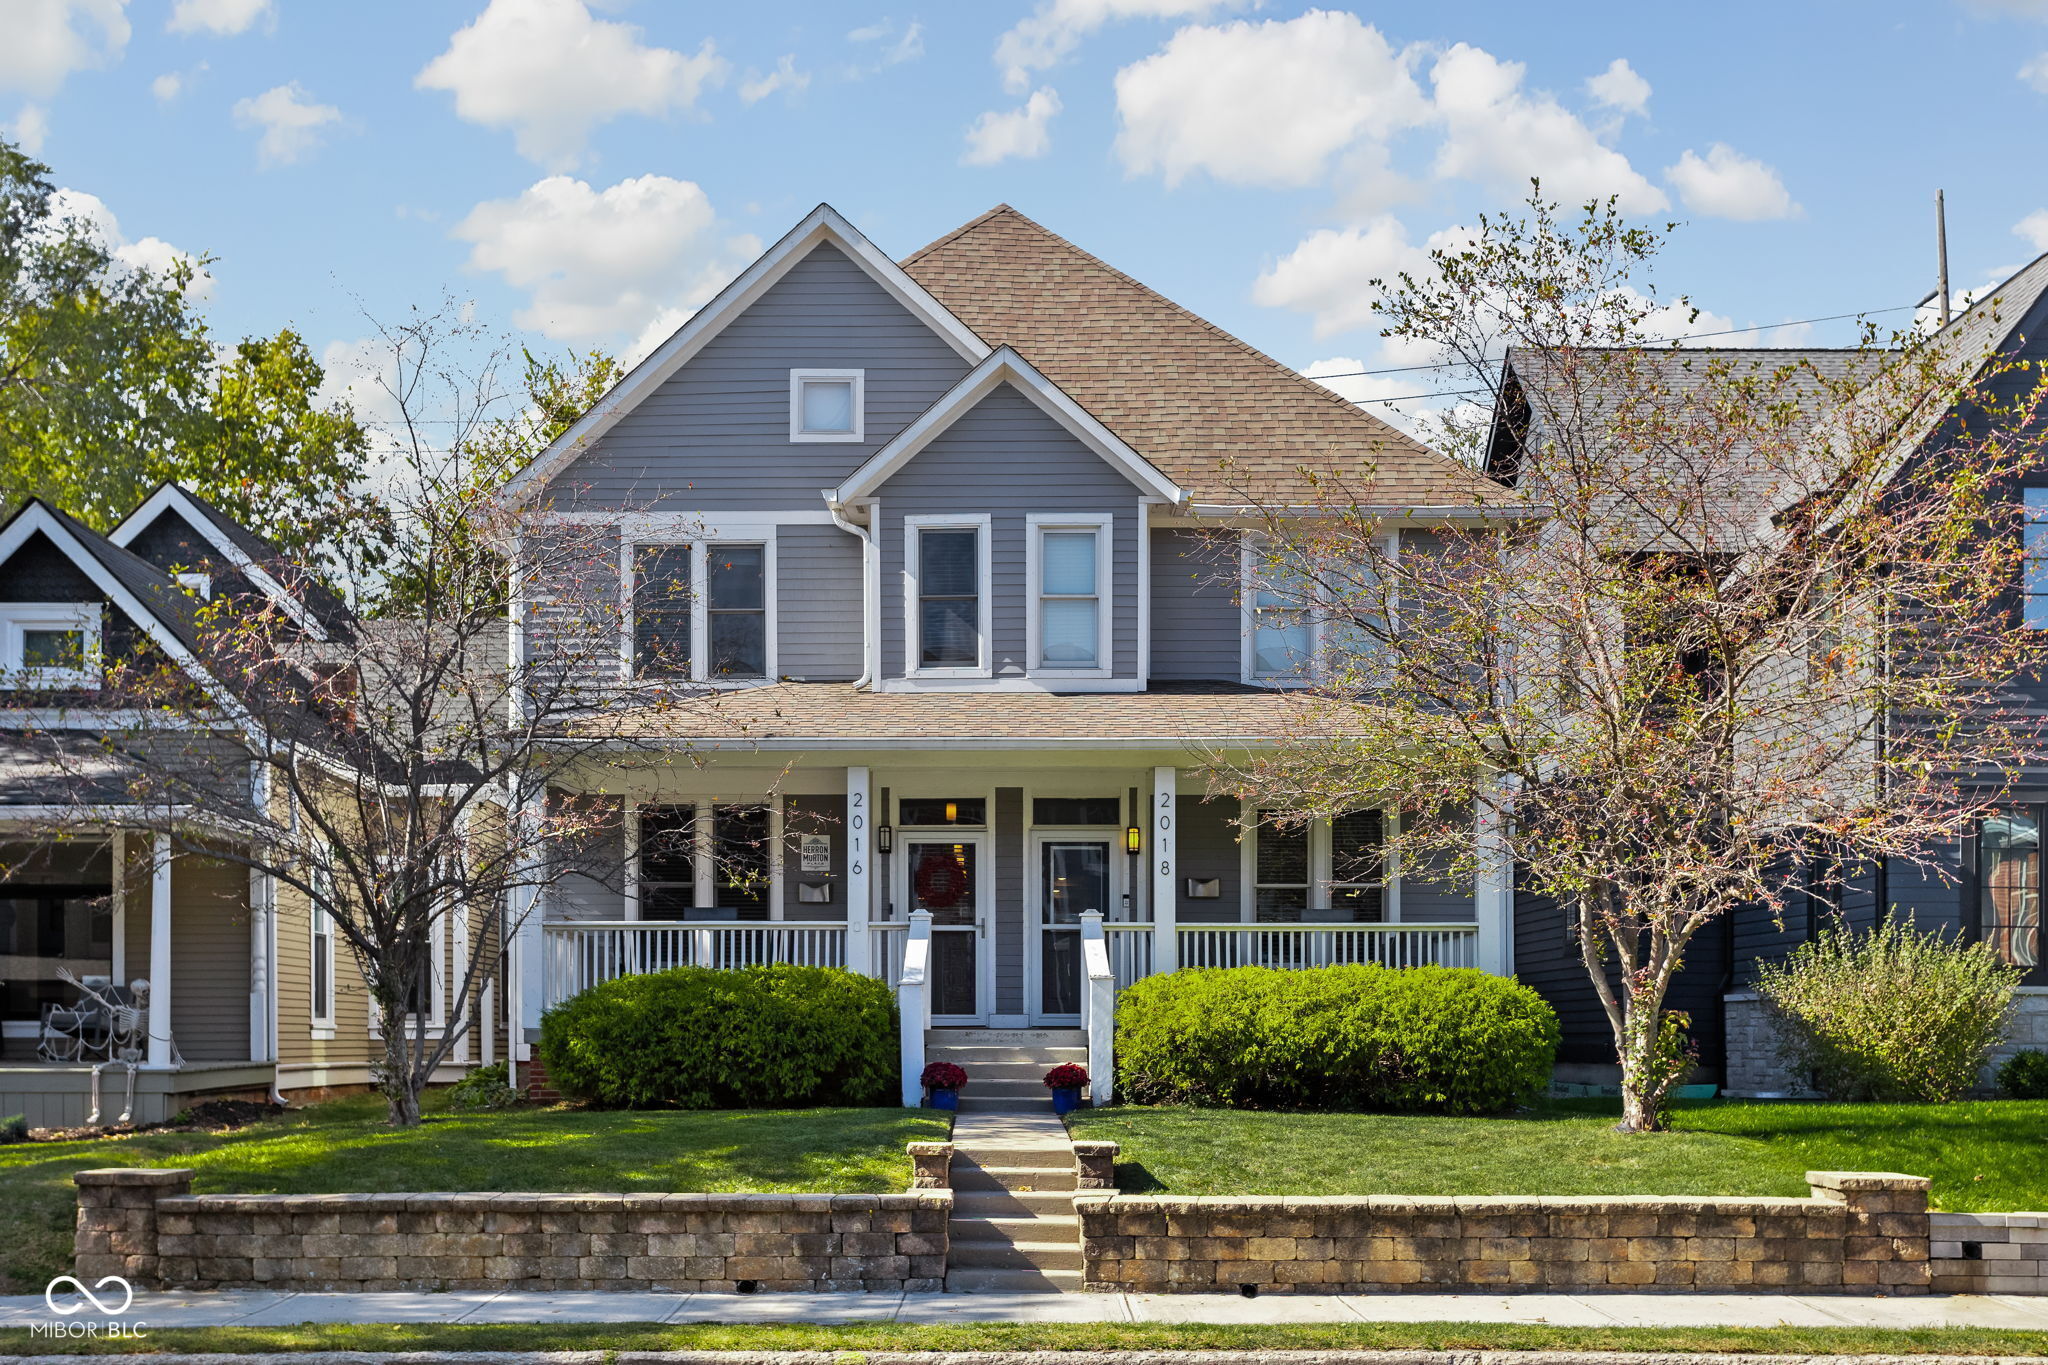
$499,900
3
bds
|
4
ba
|
3,366
sqft
|
built
2008
2016 Central Ave, Indianapolis, IN 46202
$-134
Cash flow
-1.4%
Cash-on-Cash Return
6.0%
Cap rate
0.7%
Rent to Value Ratio
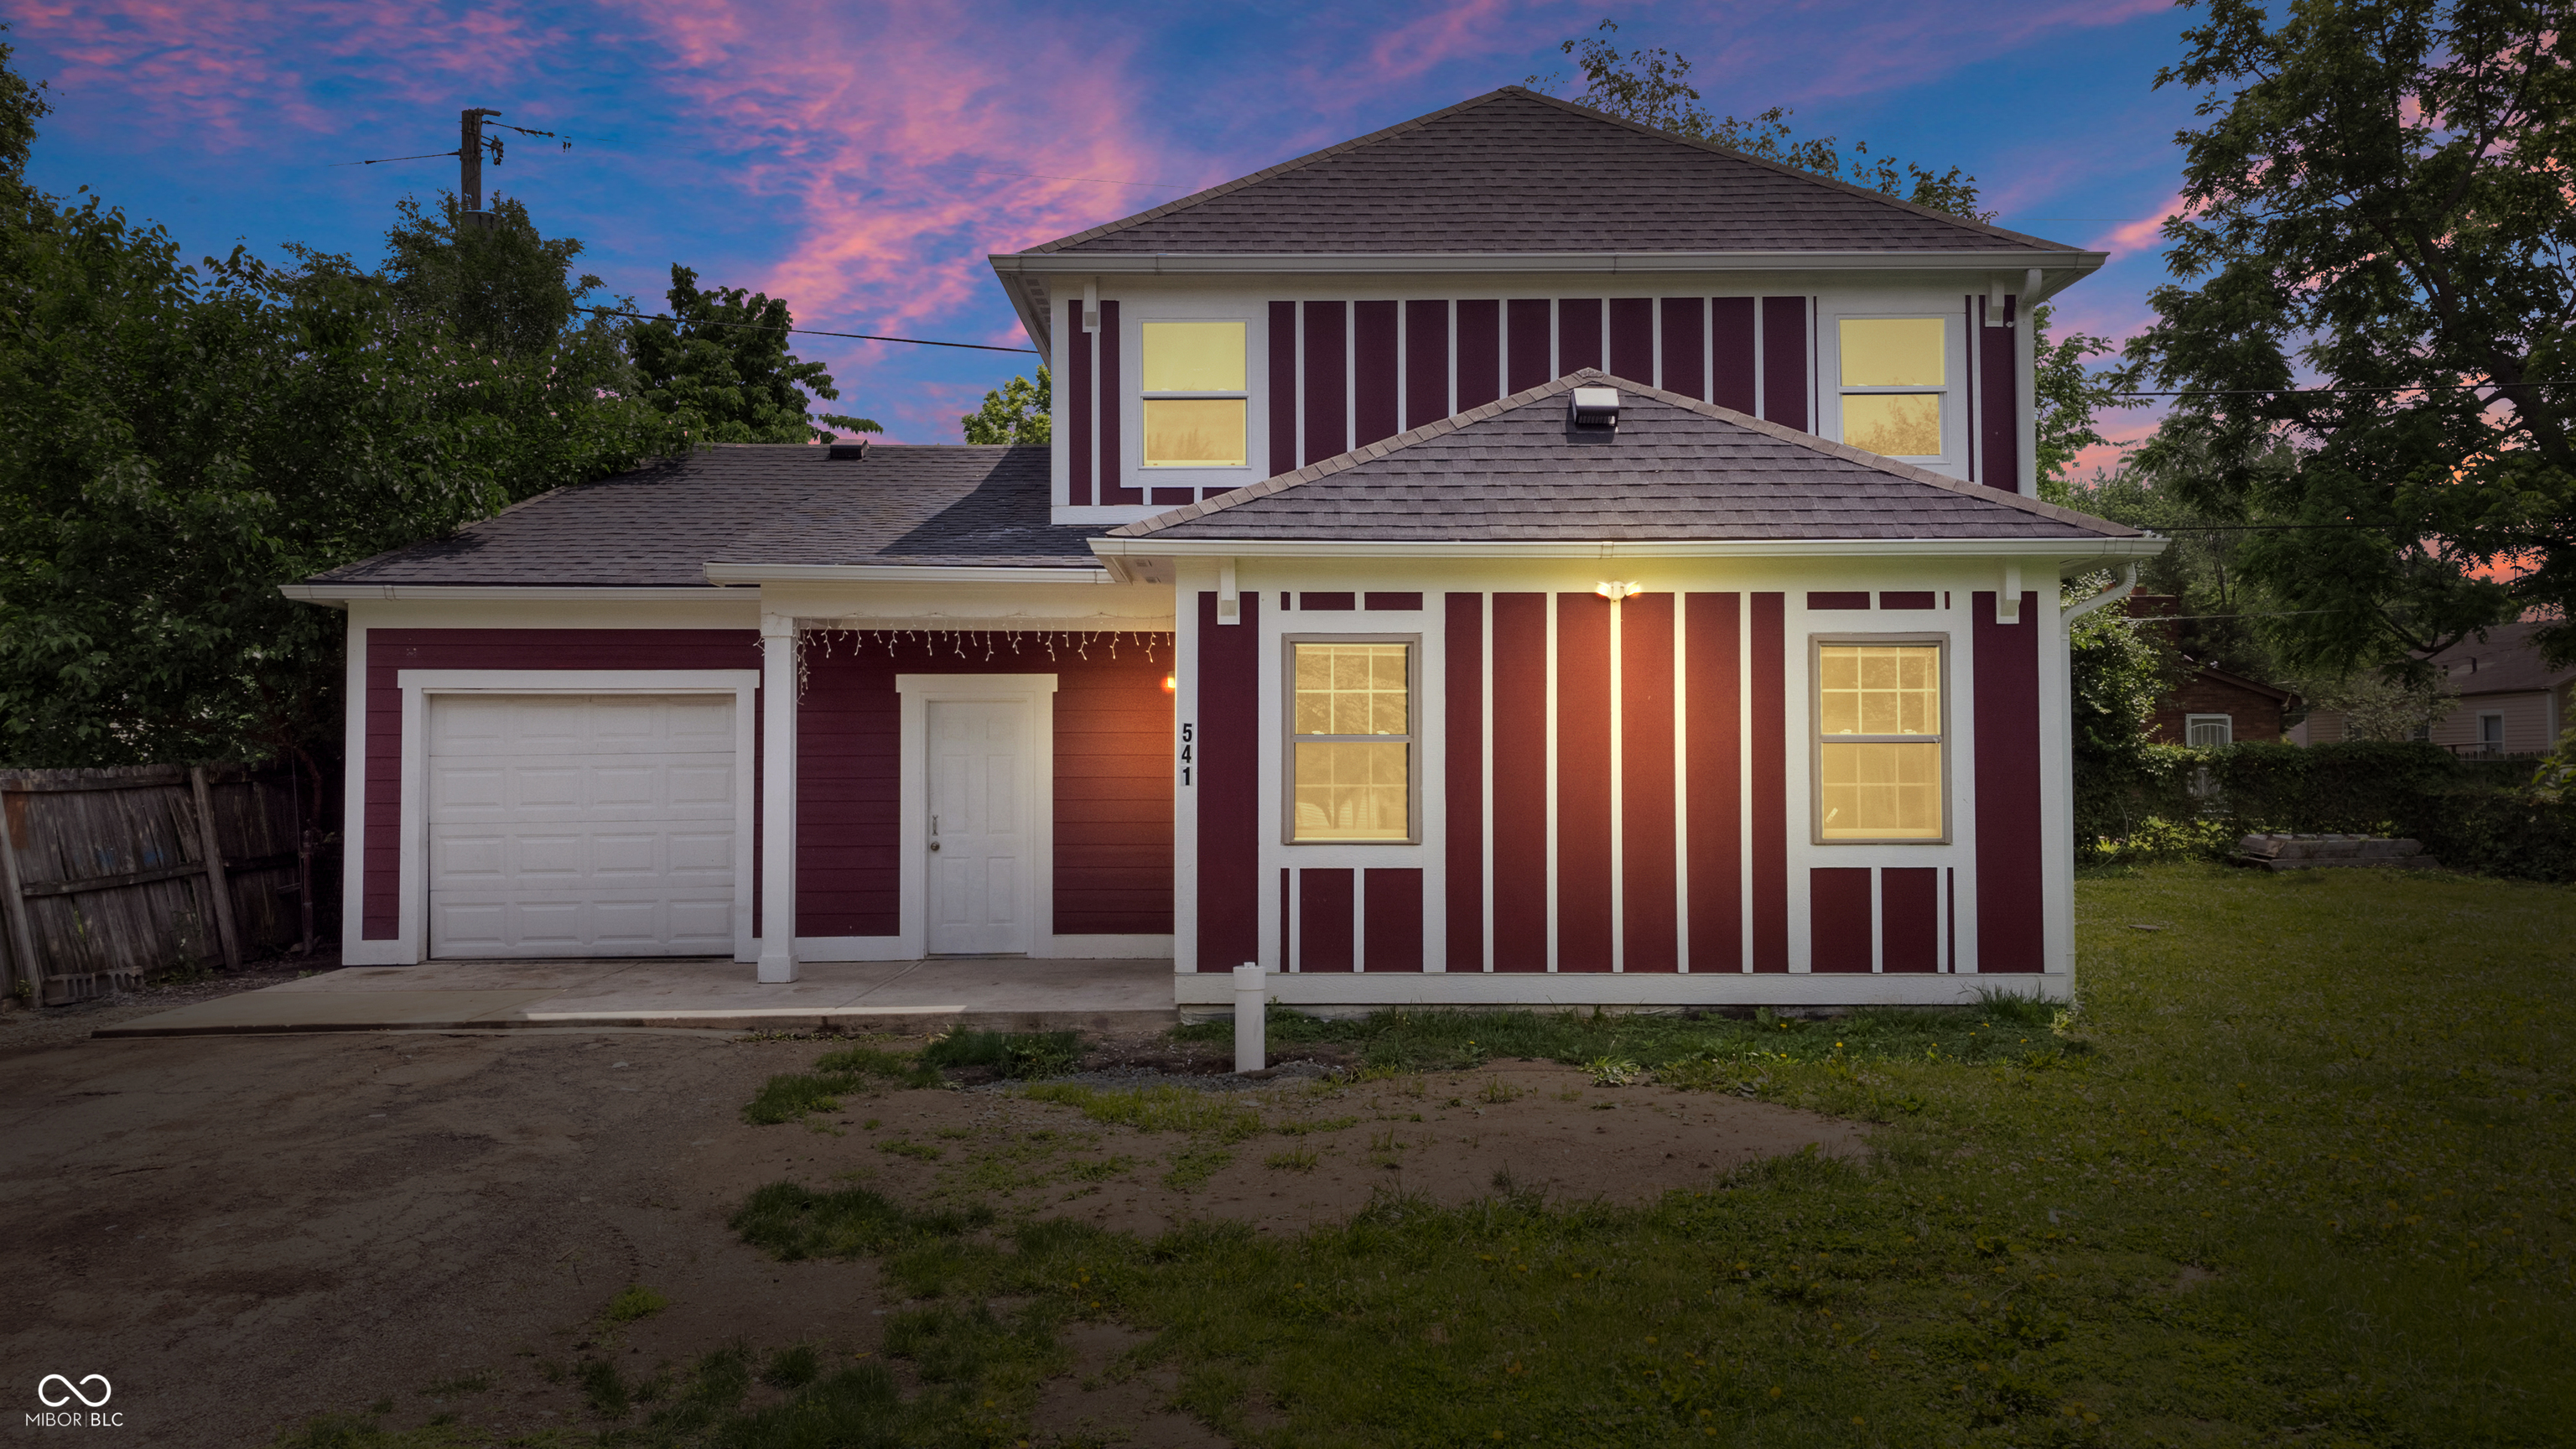
Active
$260,000
4
bds
|
2
ba
|
2,441
sqft
|
built
1948
541 Dayton Ave, Indianapolis, IN 46203
$-120
Cash flow
-2.4%
Cash-on-Cash Return
5.7%
Cap rate
0.7%
Rent to Value Ratio
Active
$215,000
4
bds
|
1
ba
|
1,459
sqft
|
built
1952
409 Parkway Ave, Indianapolis, IN 46225
$-298
Cash flow
-7.2%
Cash-on-Cash Return
4.6%
Cap rate
0.6%
Rent to Value Ratio
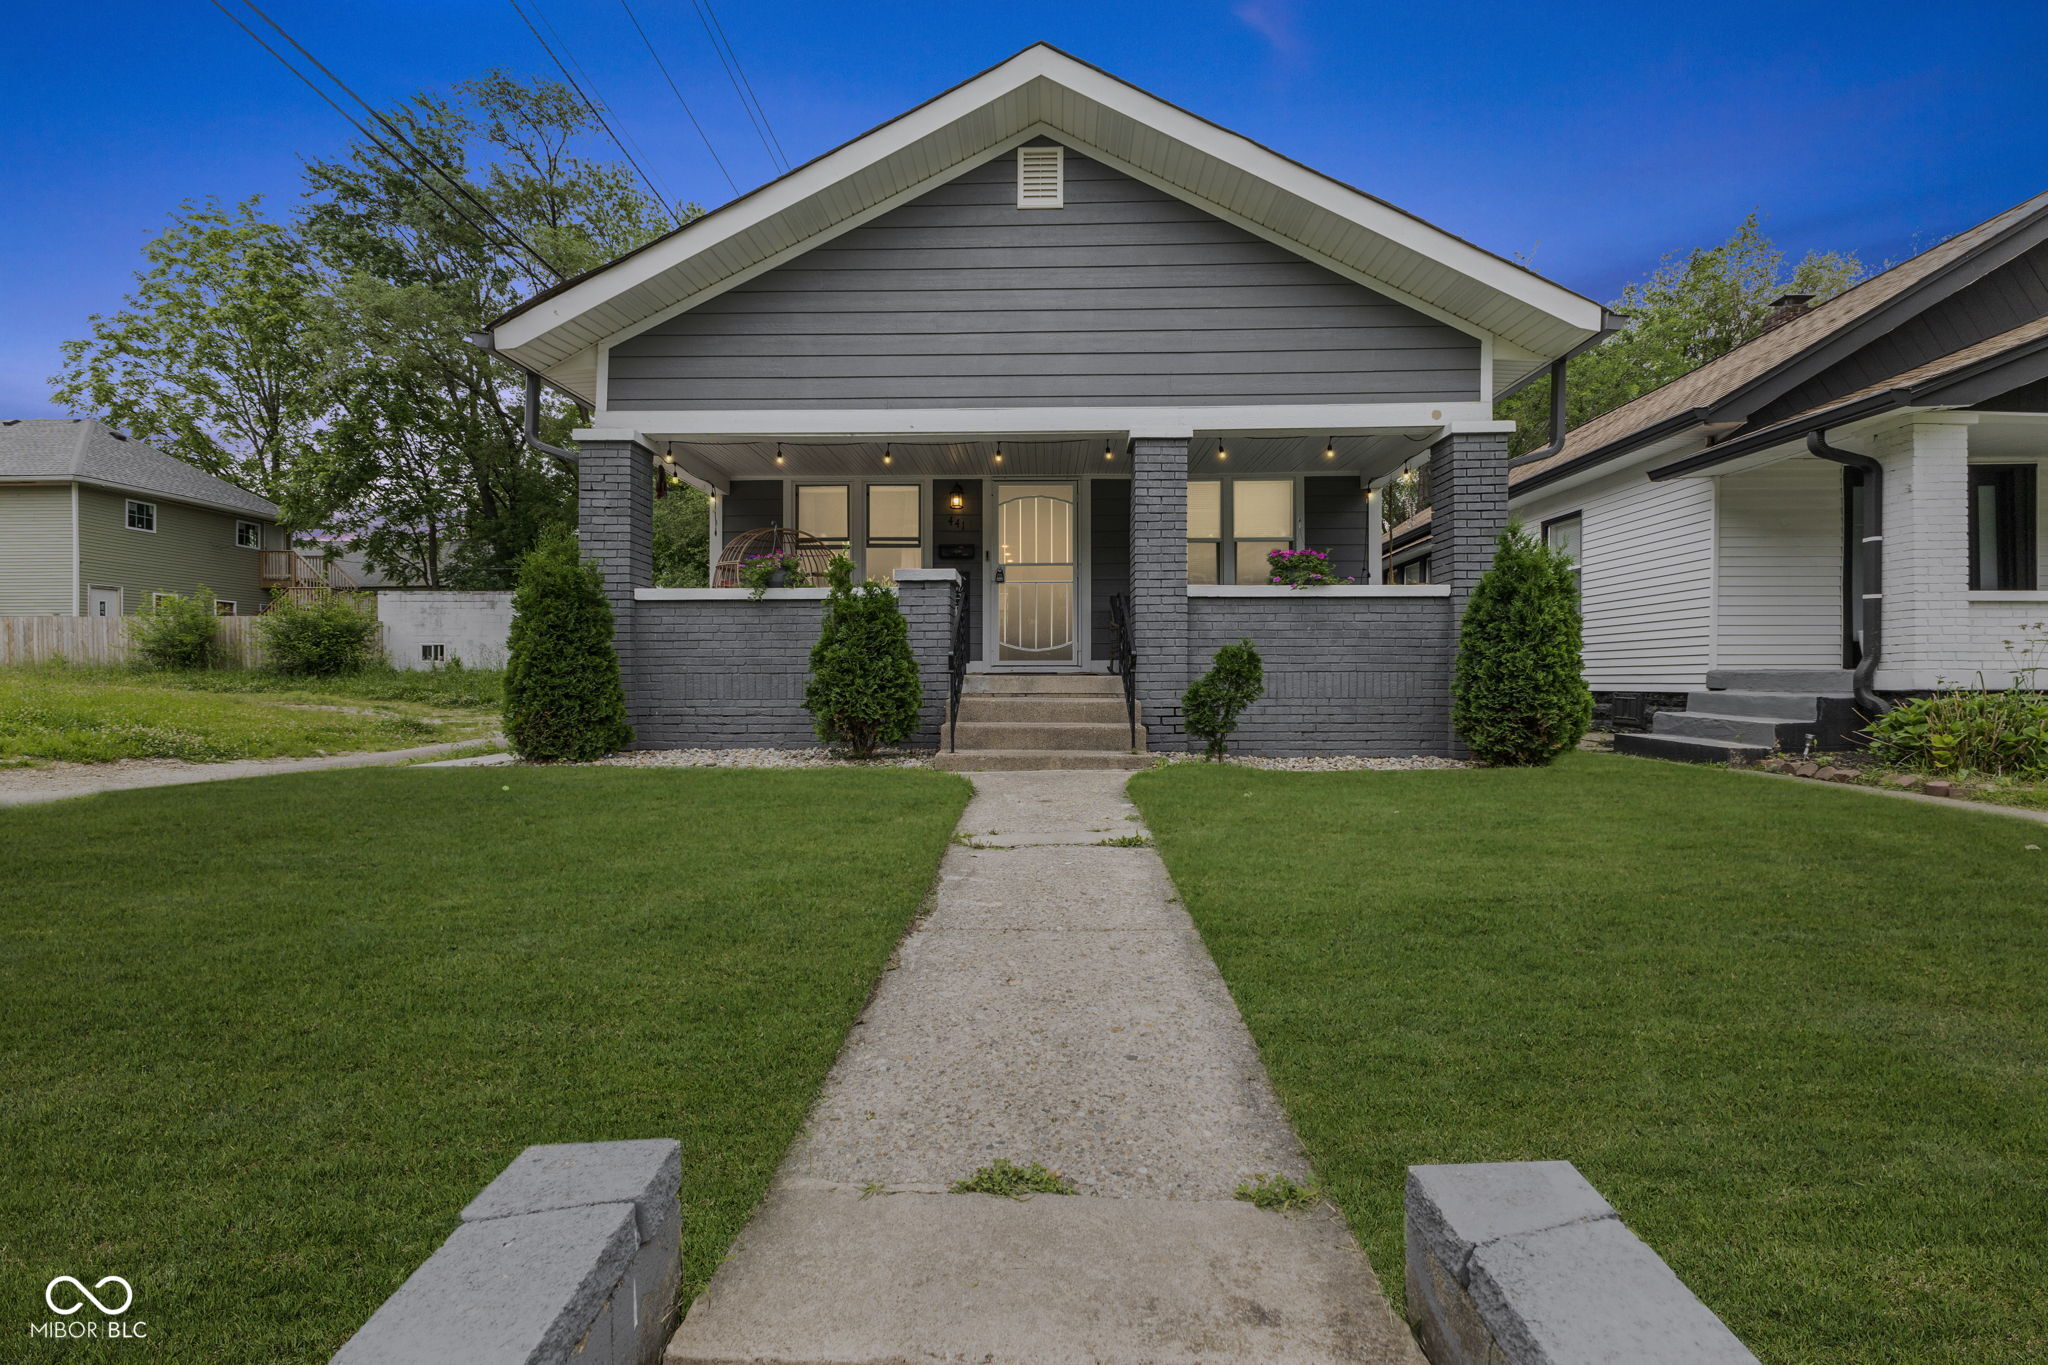
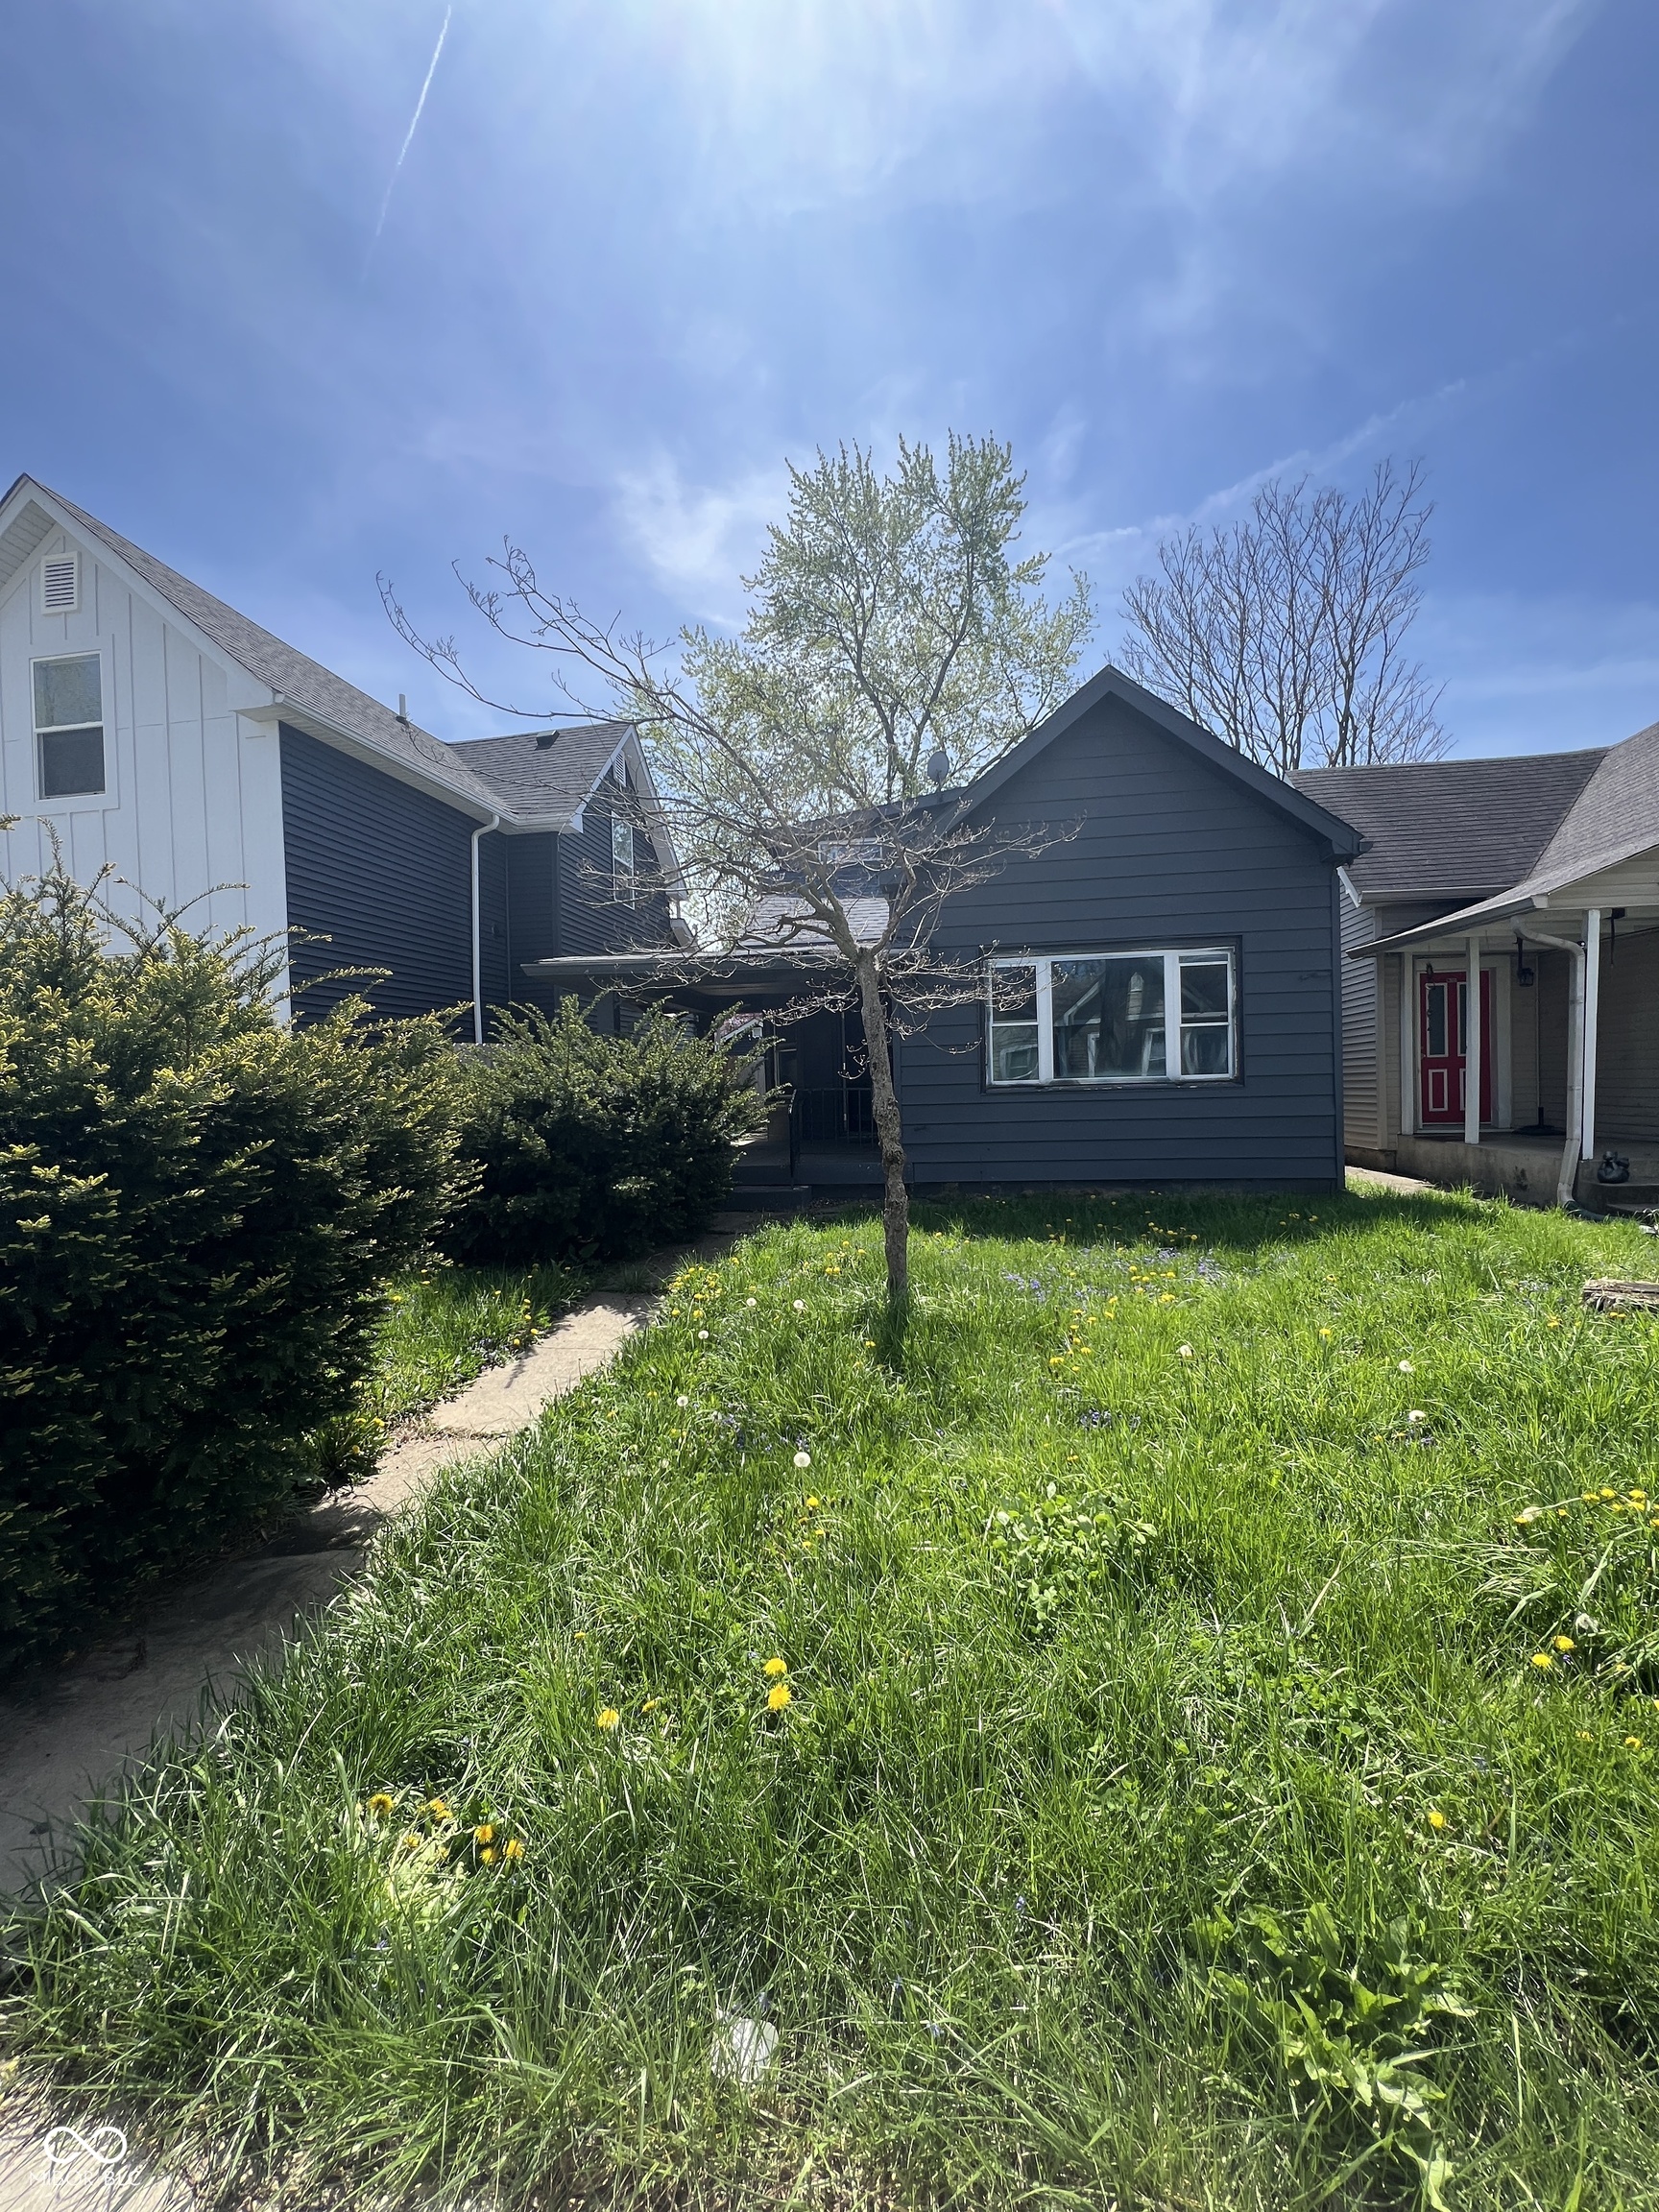
Active
$215,000
3
bds
|
1
ba
|
1,058
sqft
|
built
2018
441 N Temple Ave, Indianapolis, IN 46201
$-160
Cash flow
-3.9%
Cash-on-Cash Return
5.4%
Cap rate
0.7%
Rent to Value Ratio
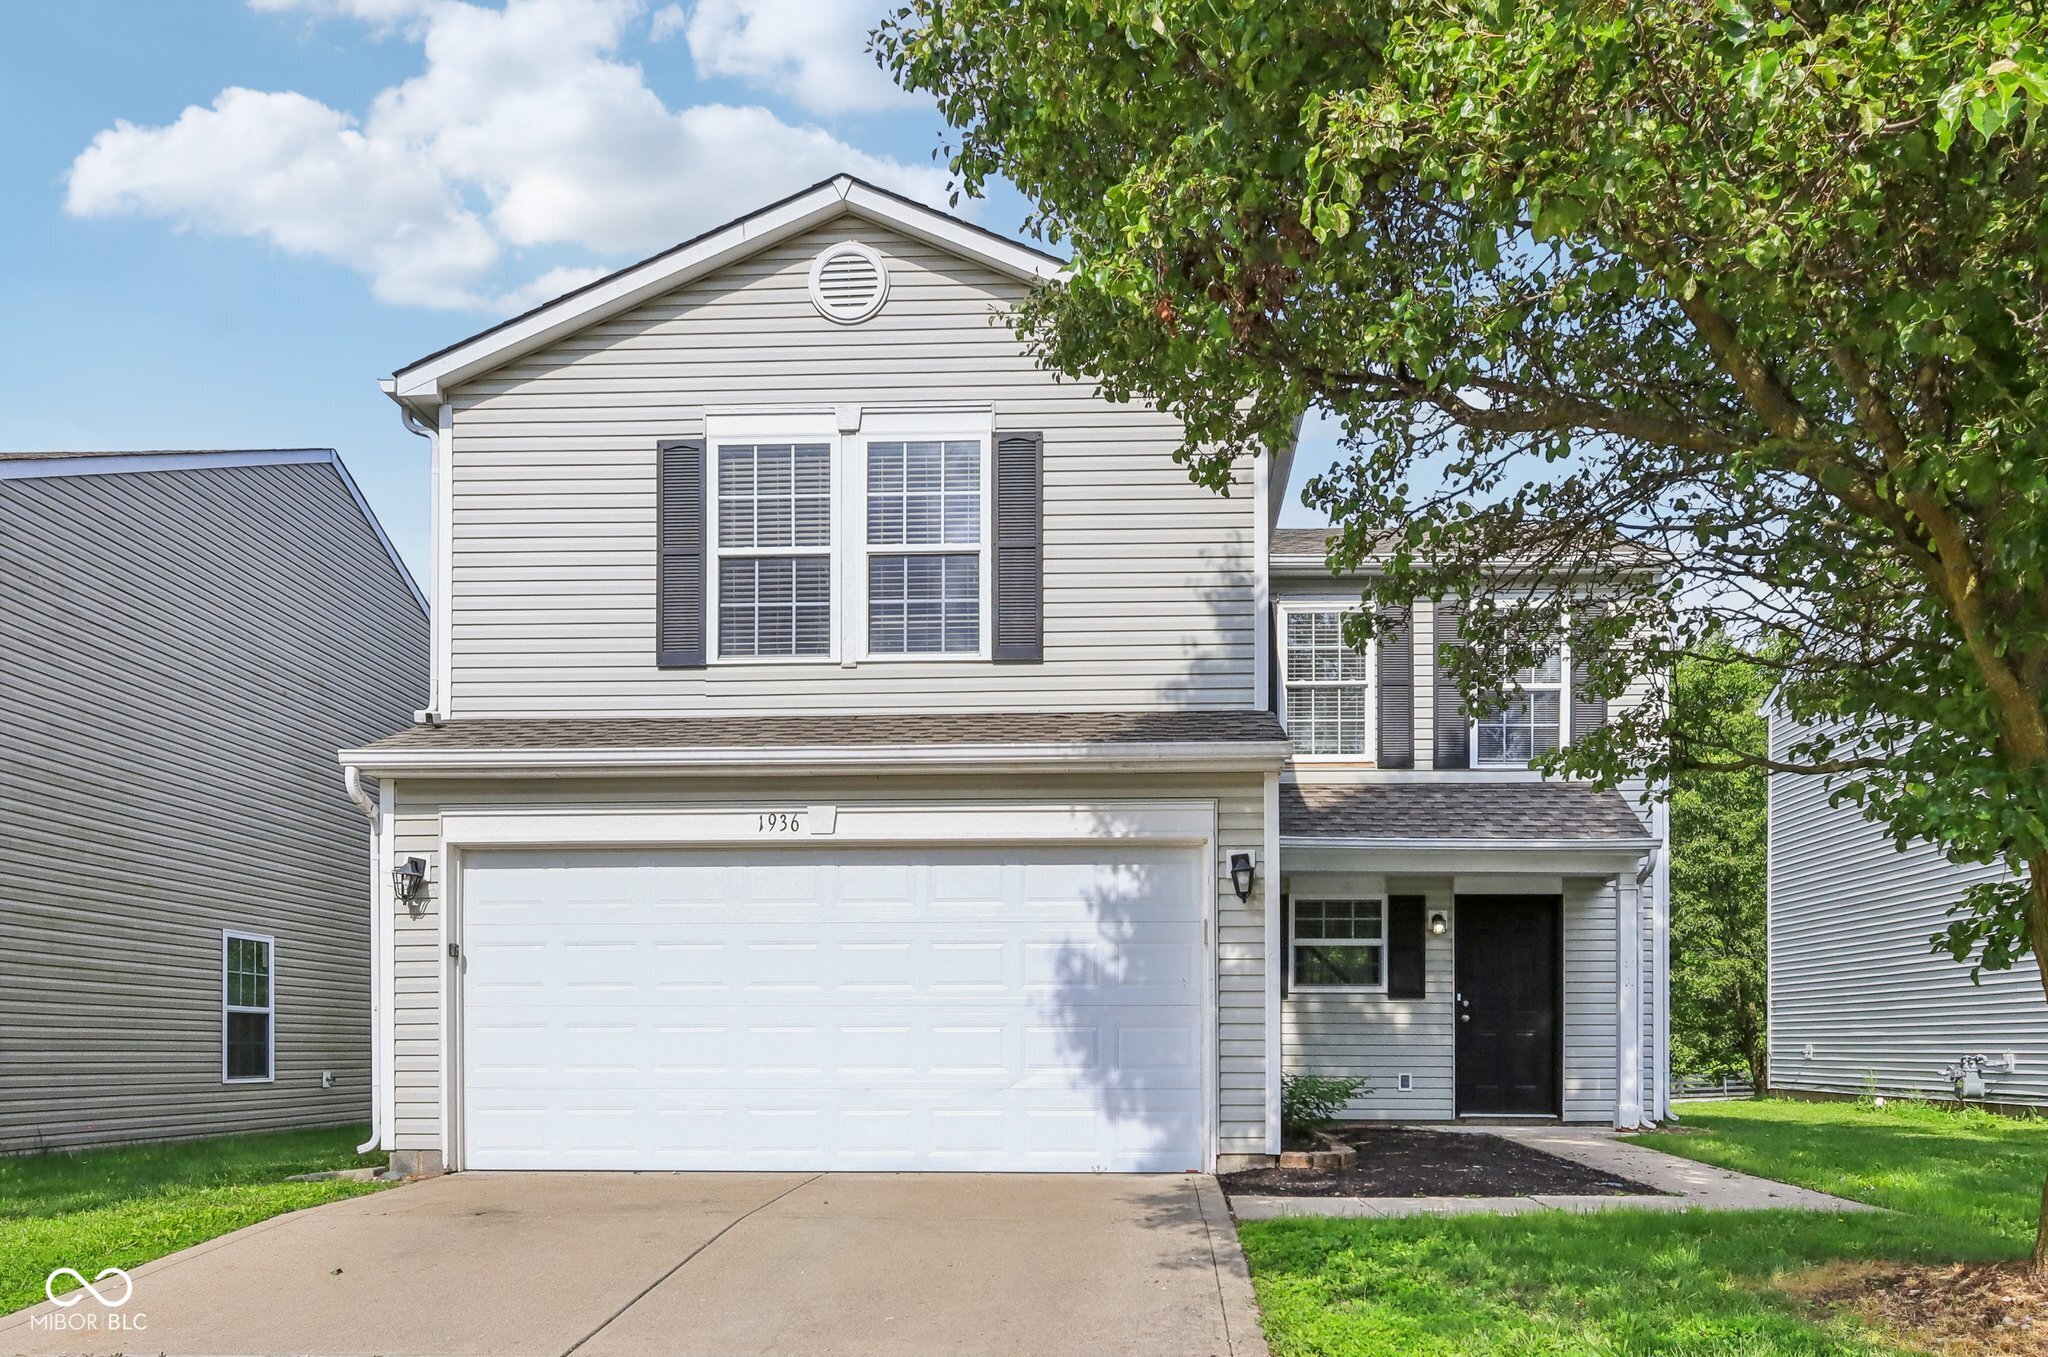
Active
$249,900
3
bds
|
3
ba
|
1,323
sqft
|
built
2002
1936 Southernwood Ln, Indianapolis, IN 46231
$-158
Cash flow
-3.3%
Cash-on-Cash Return
5.5%
Cap rate
0.7%
Rent to Value Ratio
Pending
$258,000
0
bds
|
0
ba
|
0
sqft
|
built
1964
2955 Mars Hill St, Indianapolis, IN 46241
$-661
Cash flow
-13.4%
Cash-on-Cash Return
3.2%
Cap rate
0.4%
Rent to Value Ratio
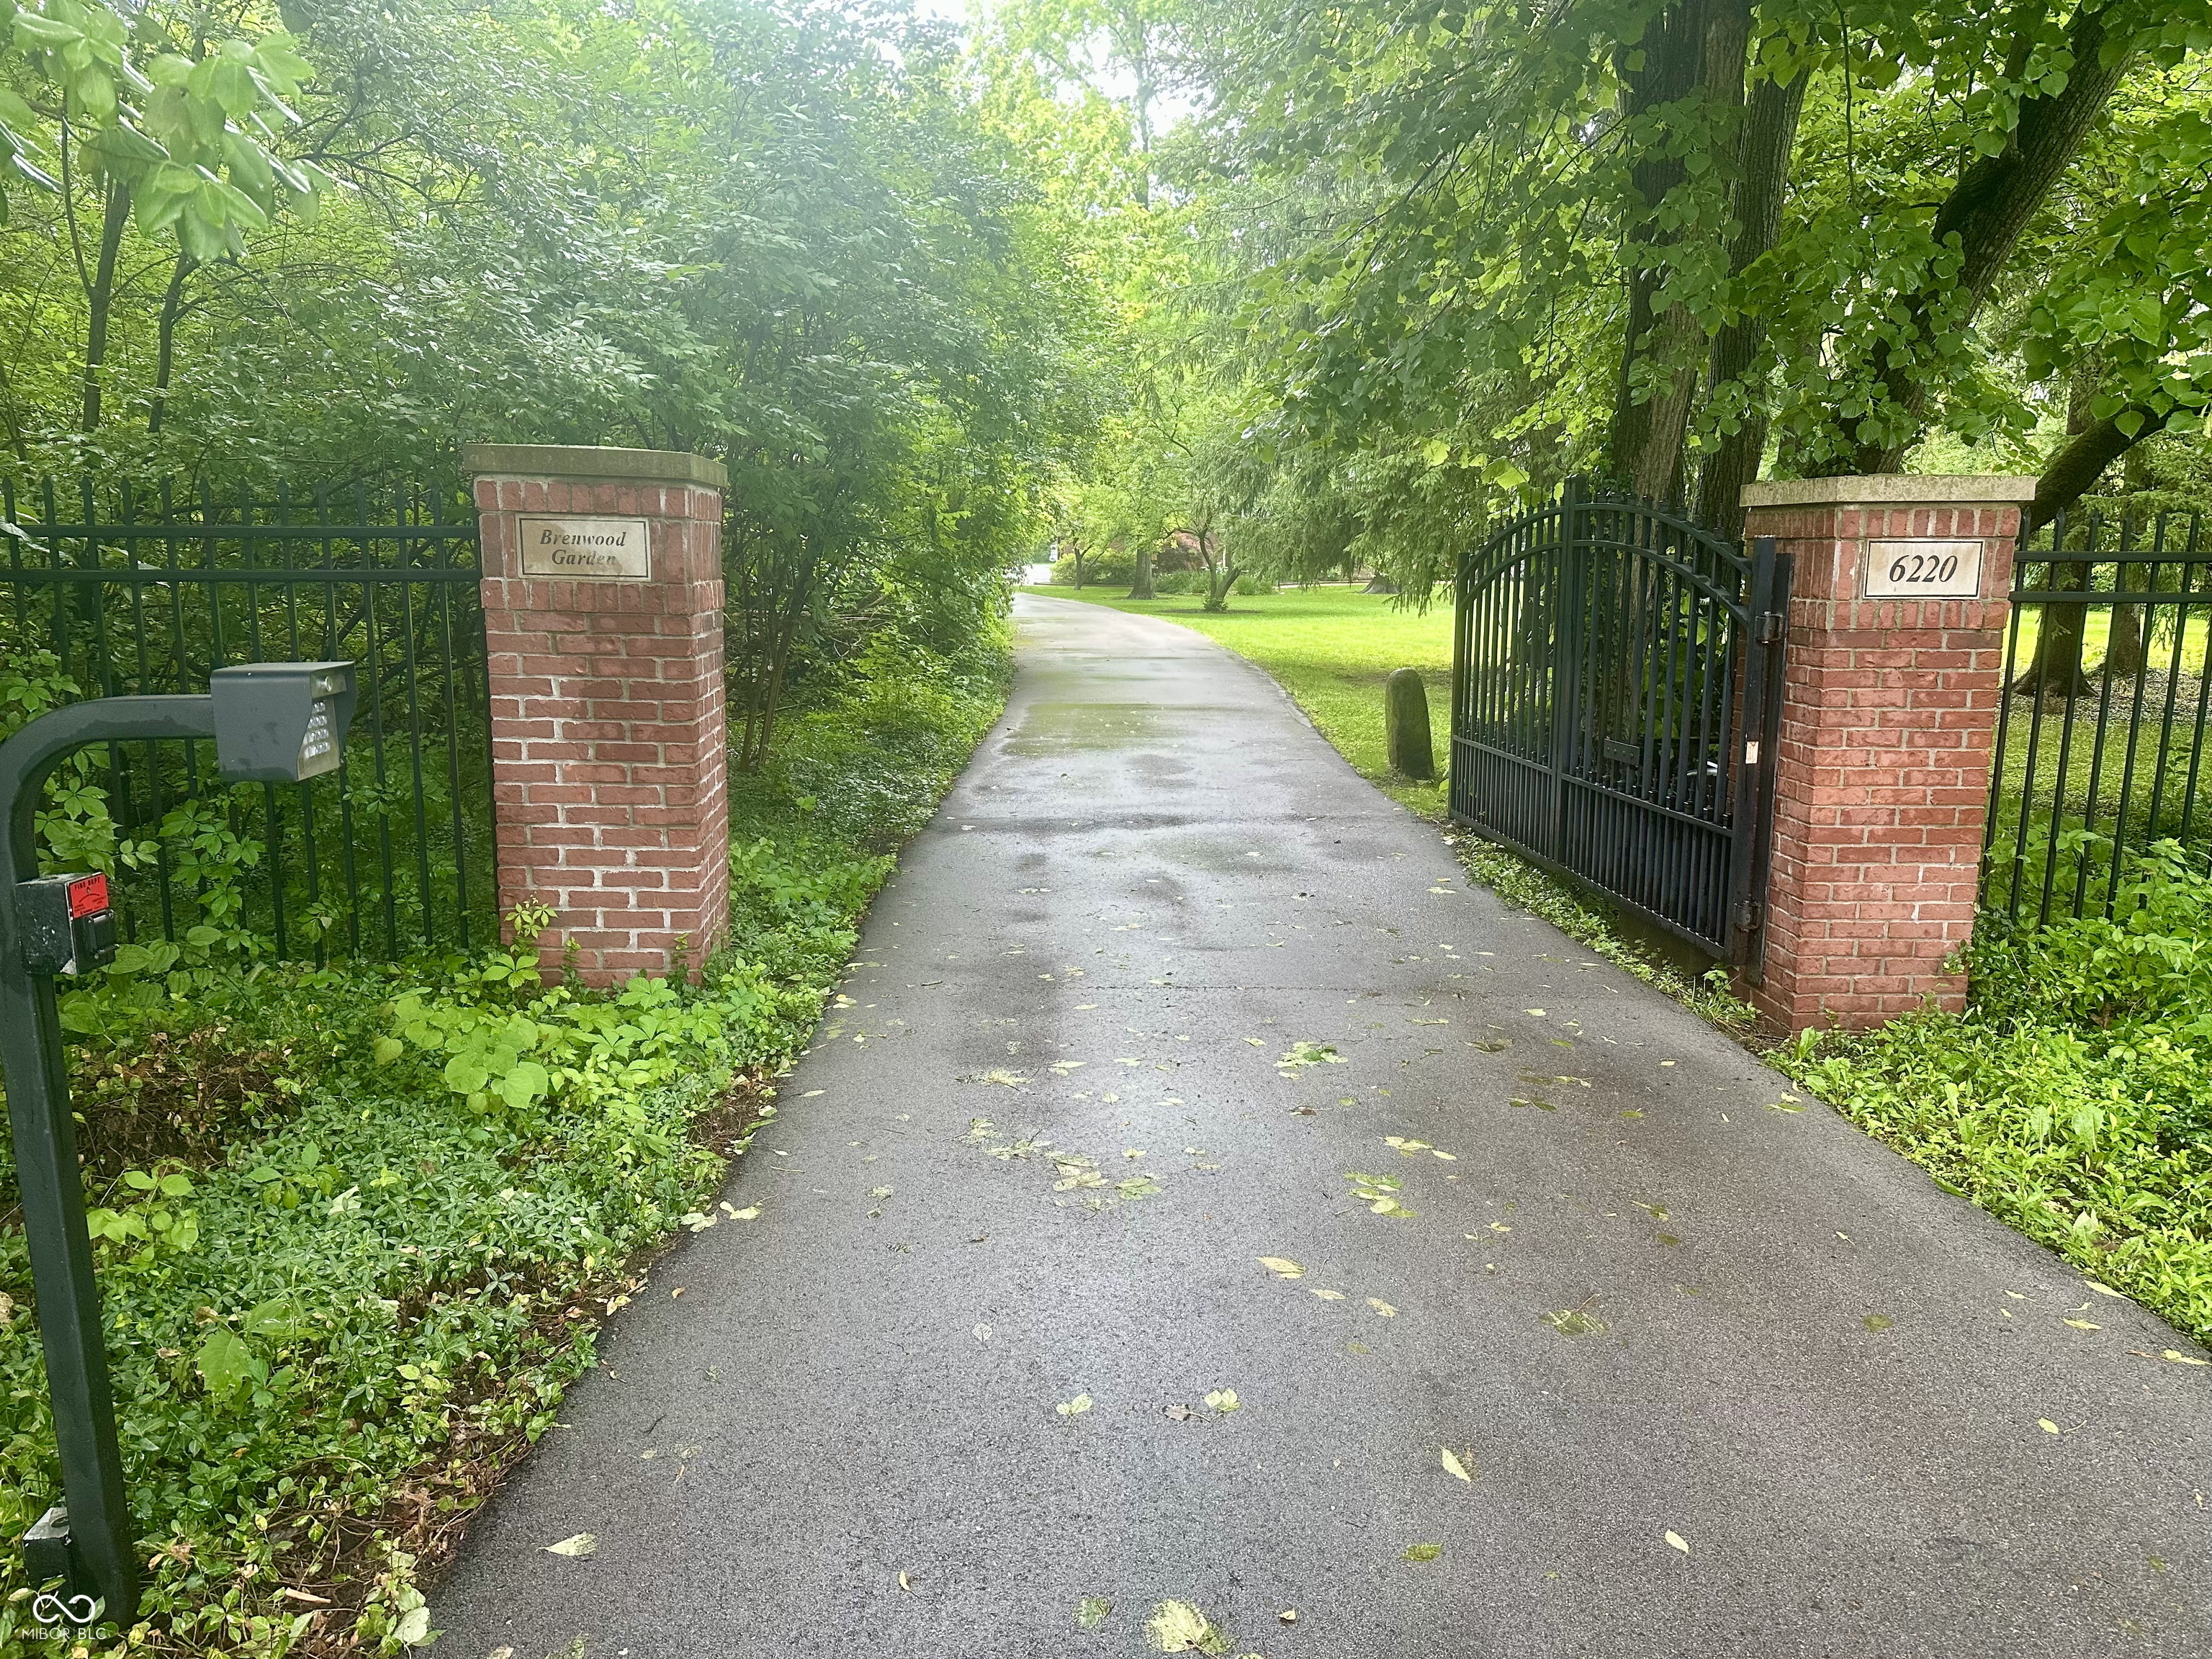
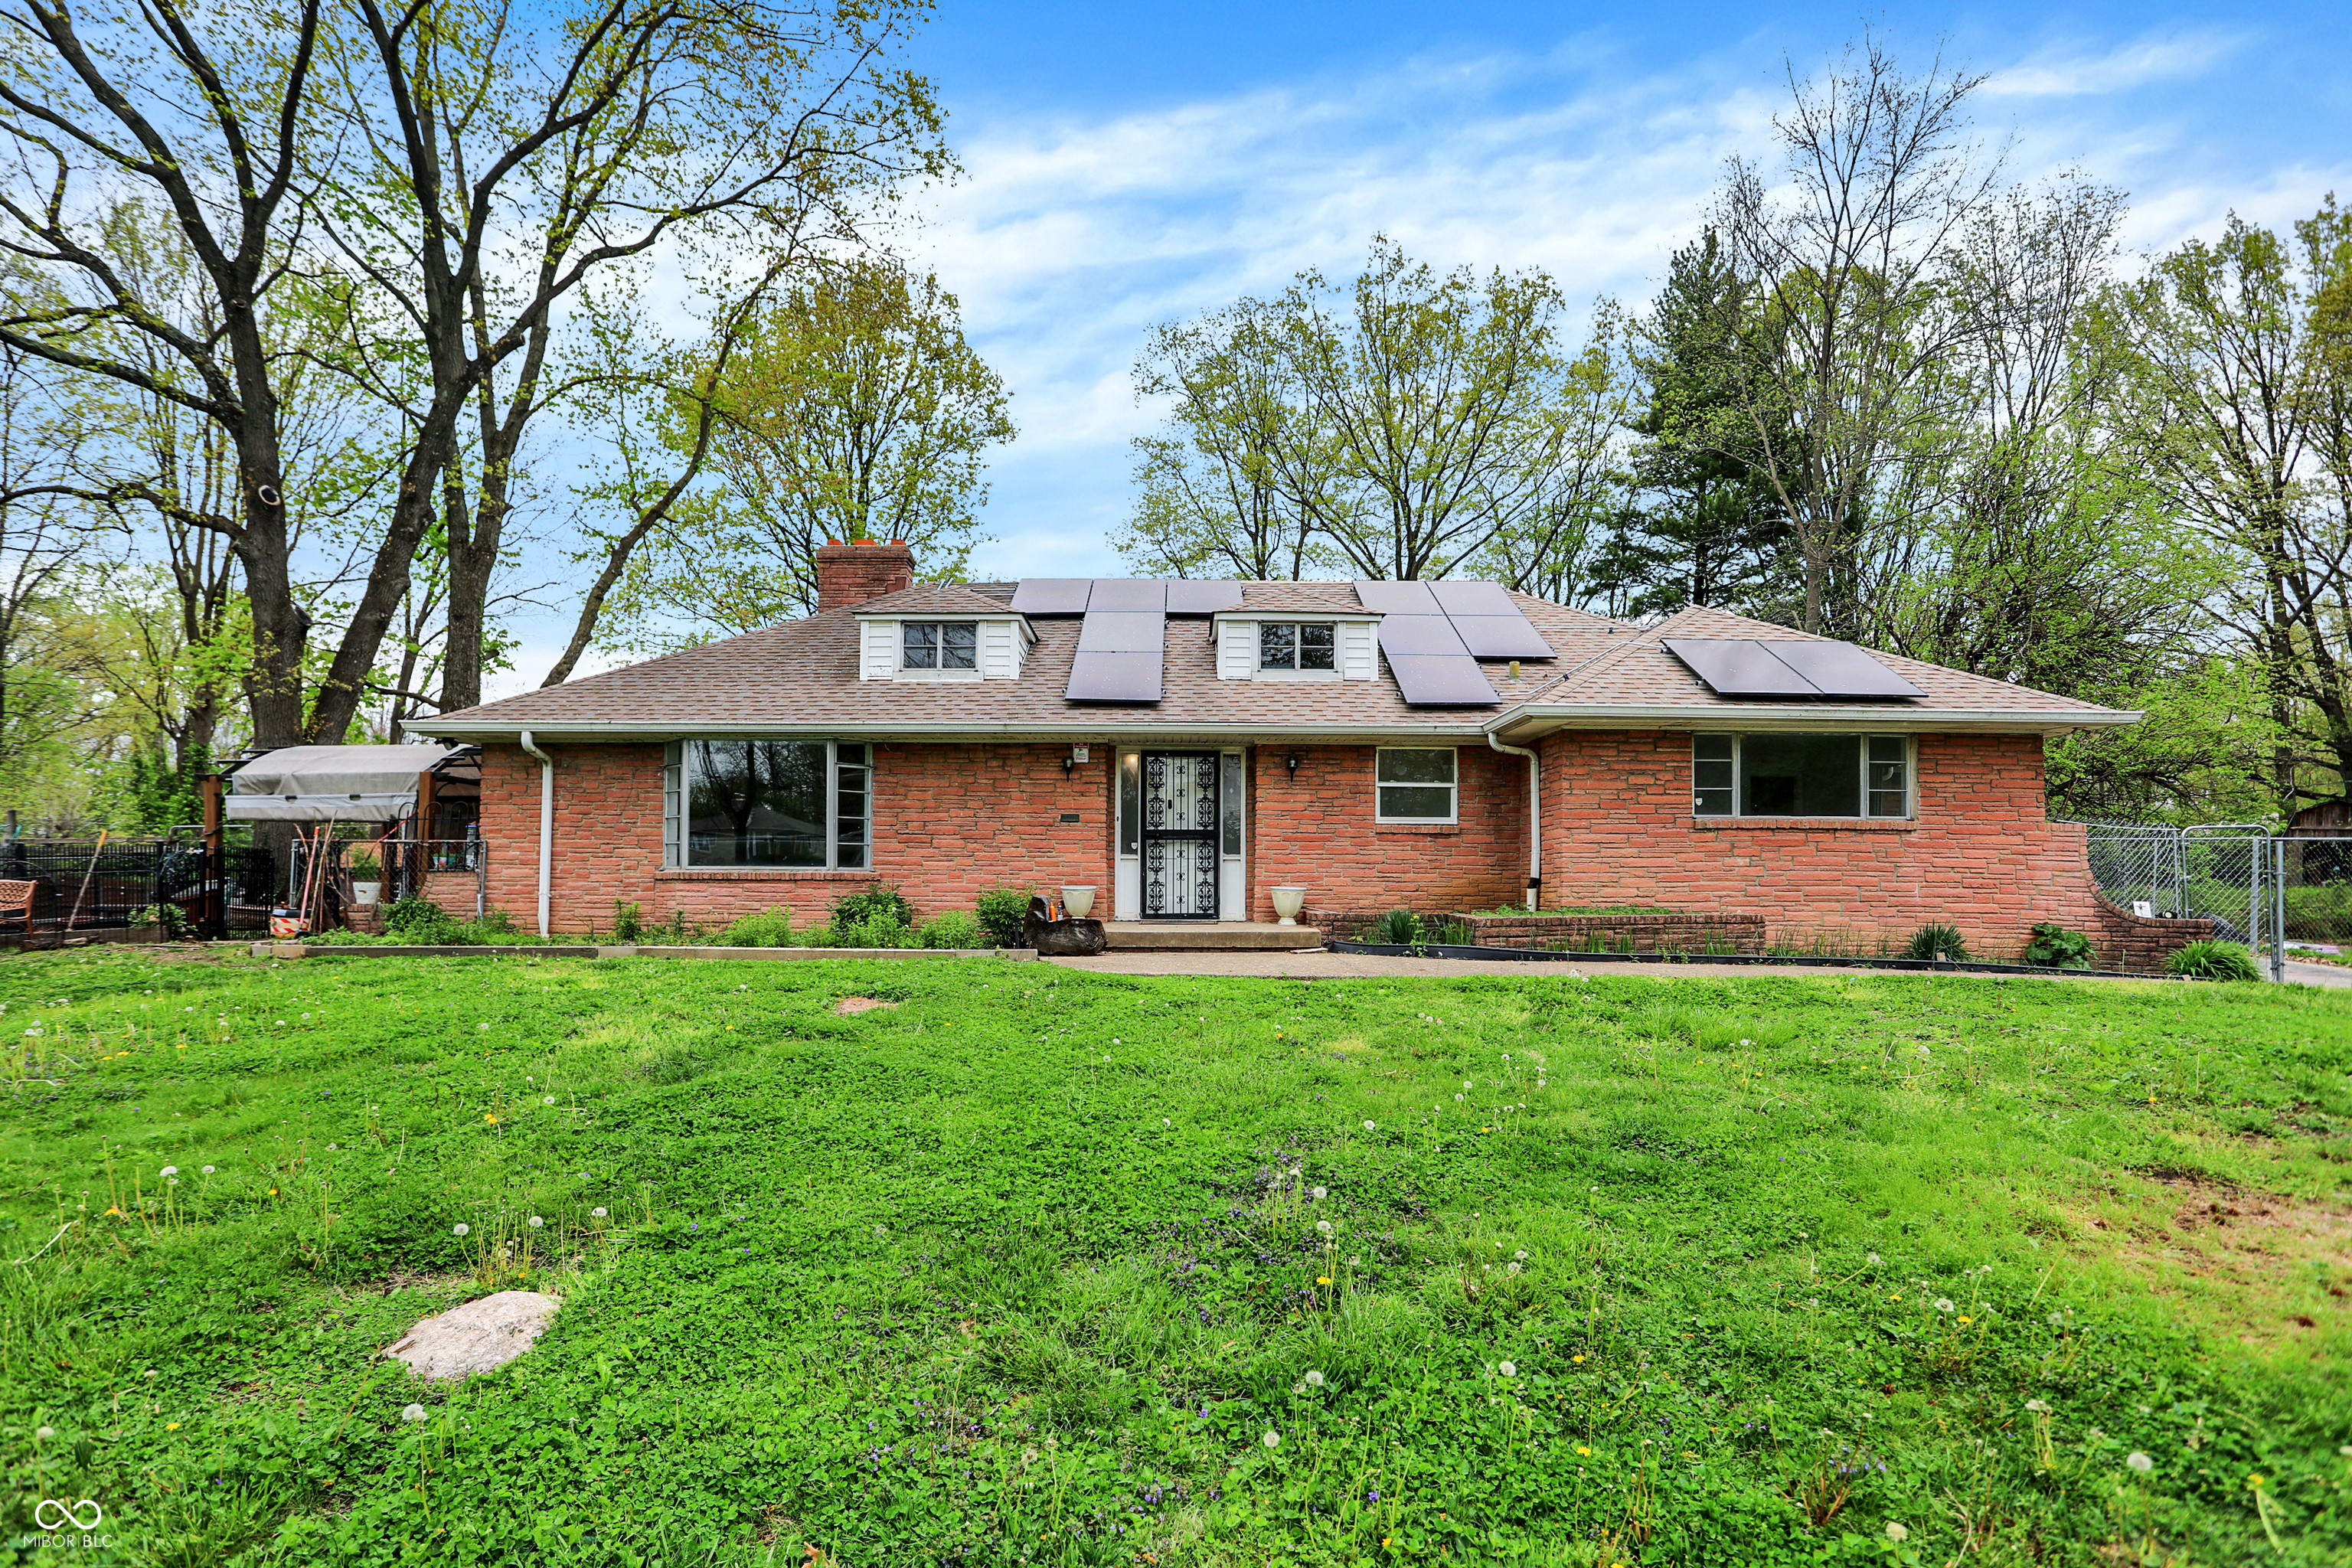
Pending
$875,000
5
bds
|
4
ba
|
4,434
sqft
|
built
1949
6220 E 56th St, Indianapolis, IN 46226
$-2,258
Cash flow
-13.5%
Cash-on-Cash Return
3.2%
Cap rate
0.5%
Rent to Value Ratio
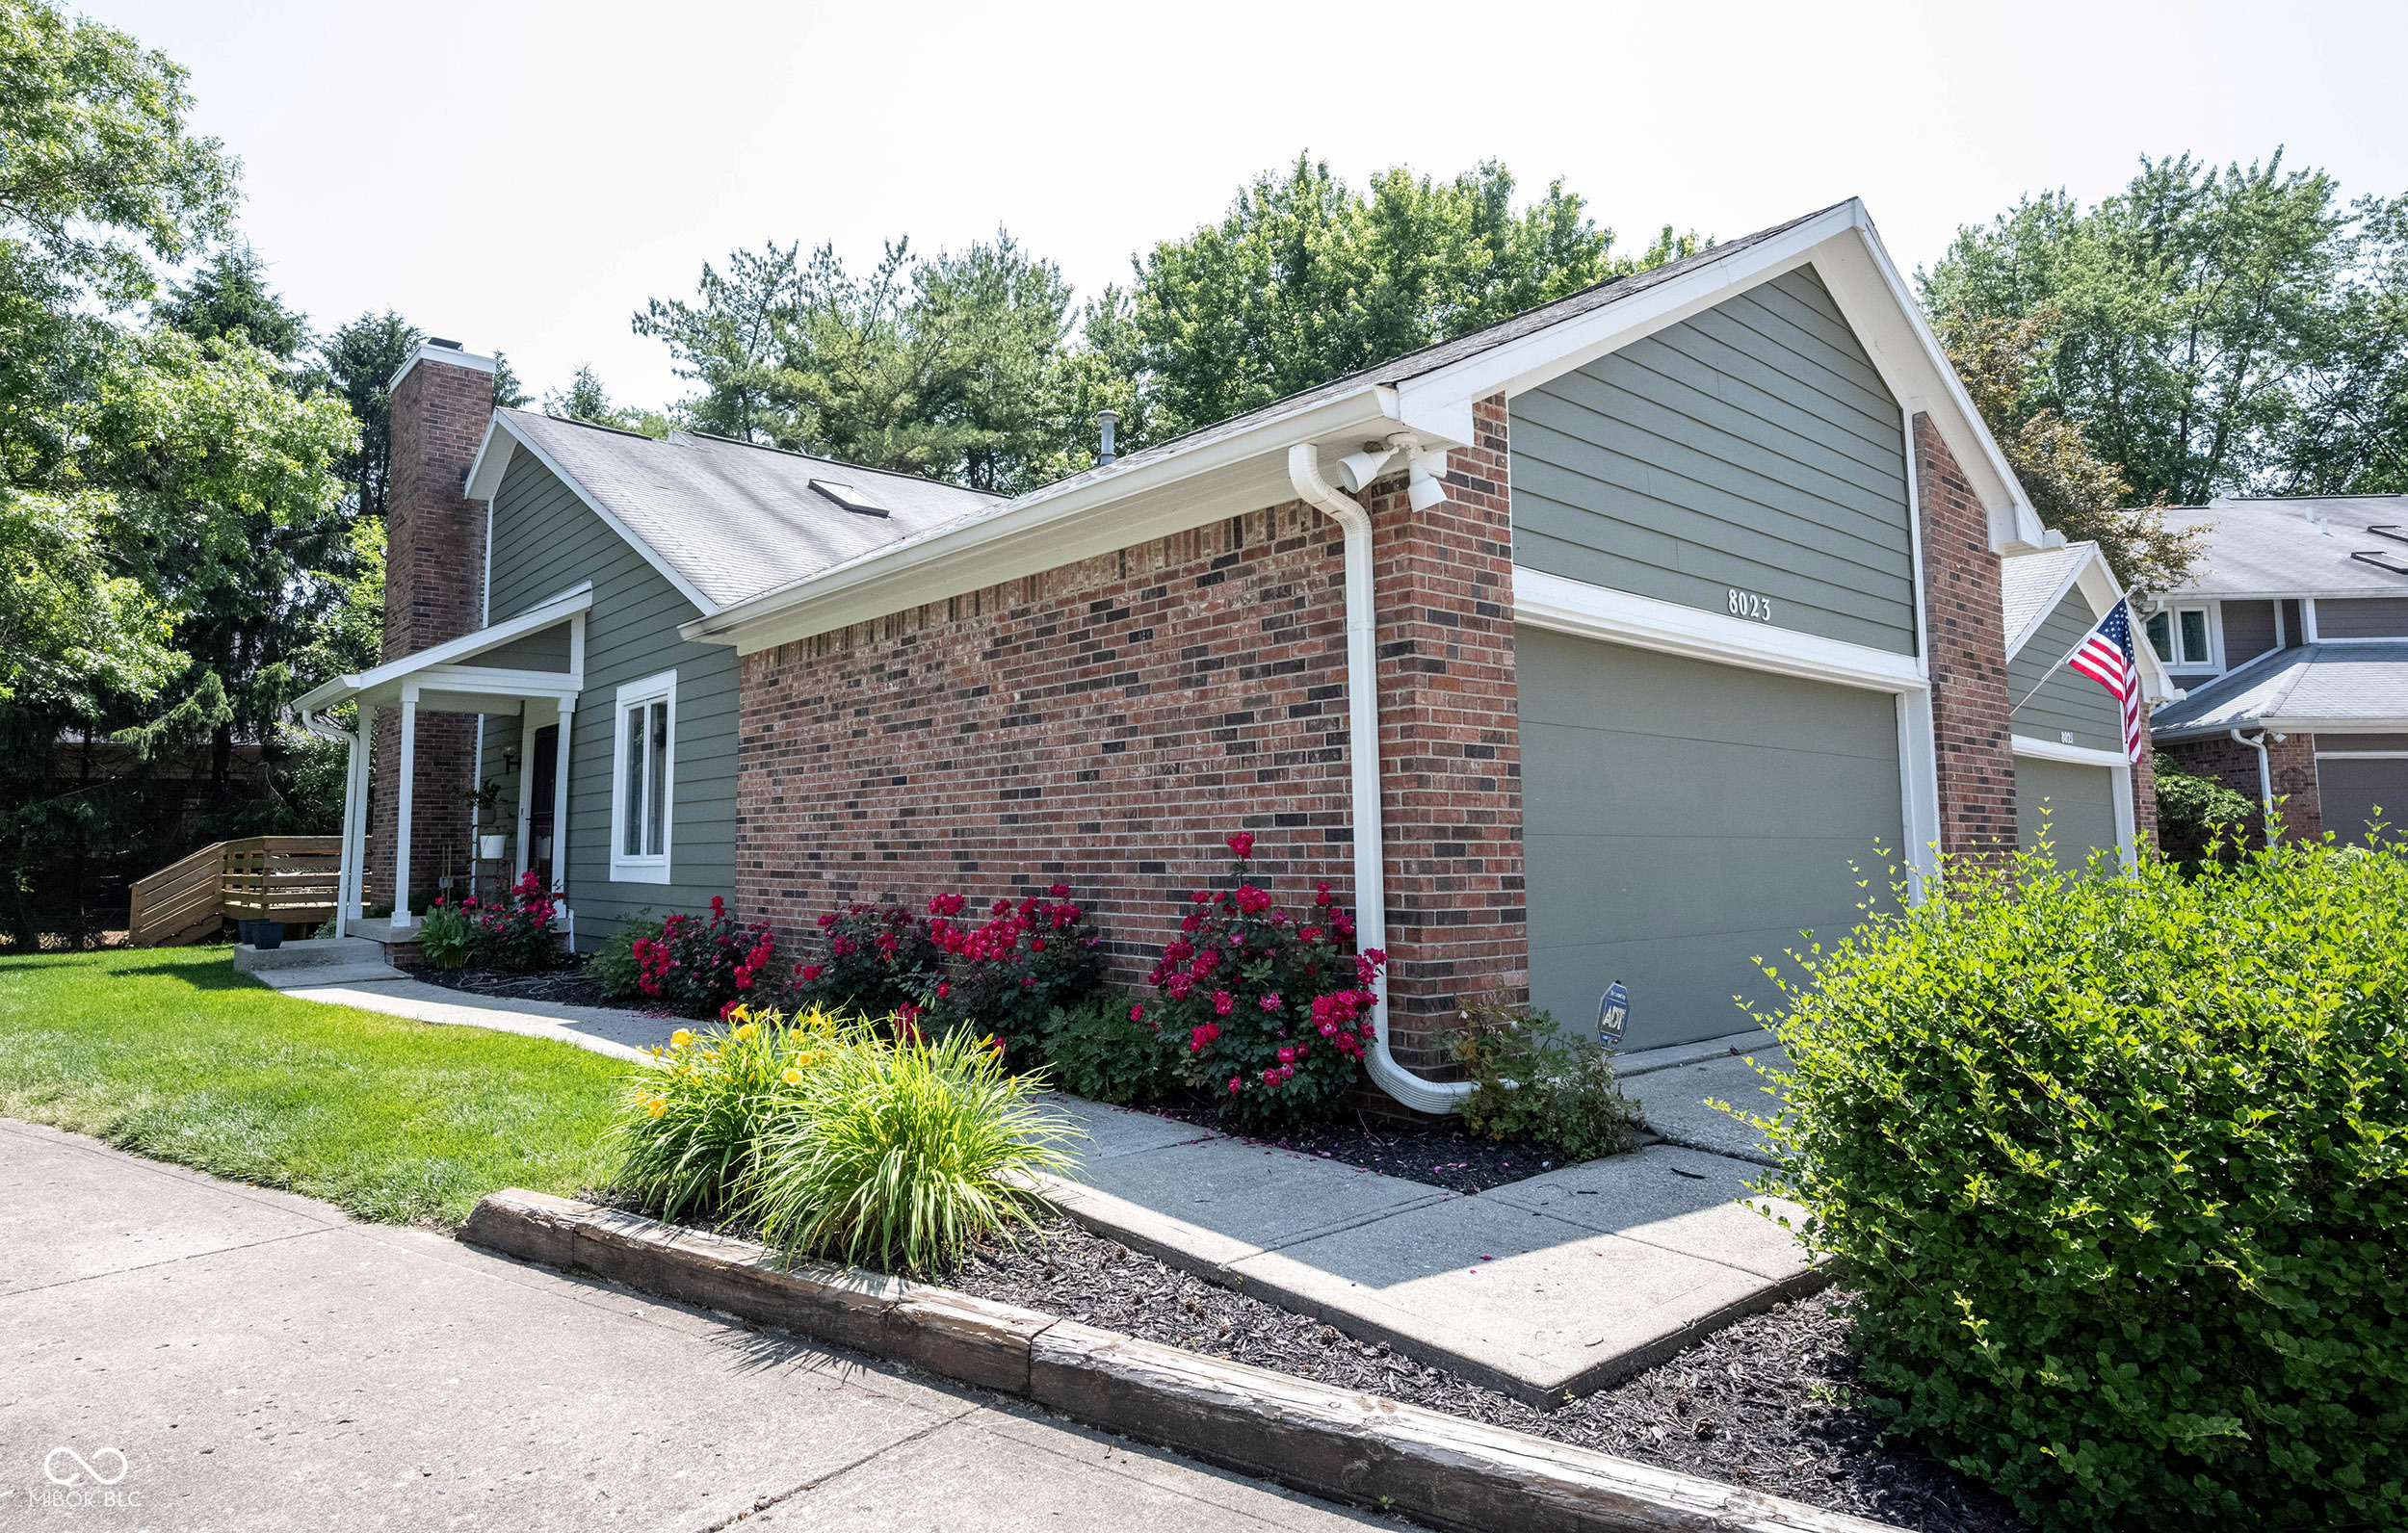
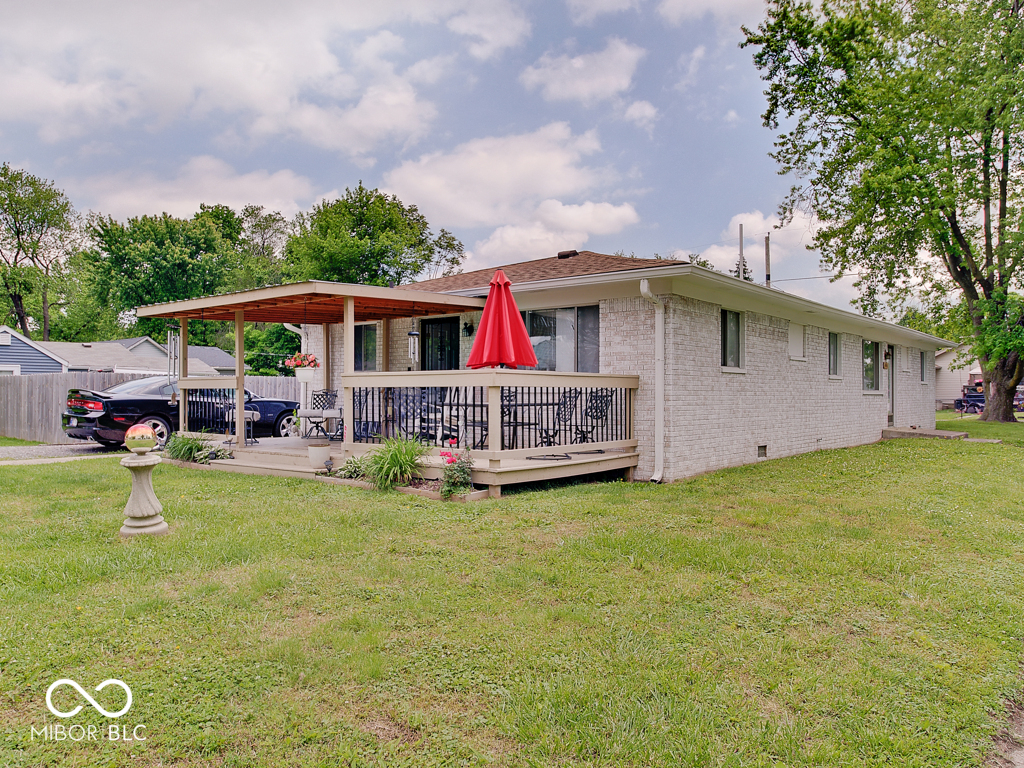
Active
$279,900
2
bds
|
2
ba
|
1,726
sqft
|
built
1985
8023 Talliho Dr, Indianapolis, IN 46256
$-194
Cash flow
-3.6%
Cash-on-Cash Return
5.5%
Cap rate
0.8%
Rent to Value Ratio
Active
$254,900
bds
|
0
ba
|
0
sqft
|
built
1939
3135 Kentucky Ave, Indianapolis, IN 46221
$-369
Cash flow
-7.6%
Cash-on-Cash Return
4.5%
Cap rate
0.5%
Rent to Value Ratio