Indianapolis, IN Investment Properties for Sale
Browse homes for sale and investment properties in Indianapolis, IN. Refine your search by price, property type, or more.
Best cash flowing properties in Indianapolis, IN
Active
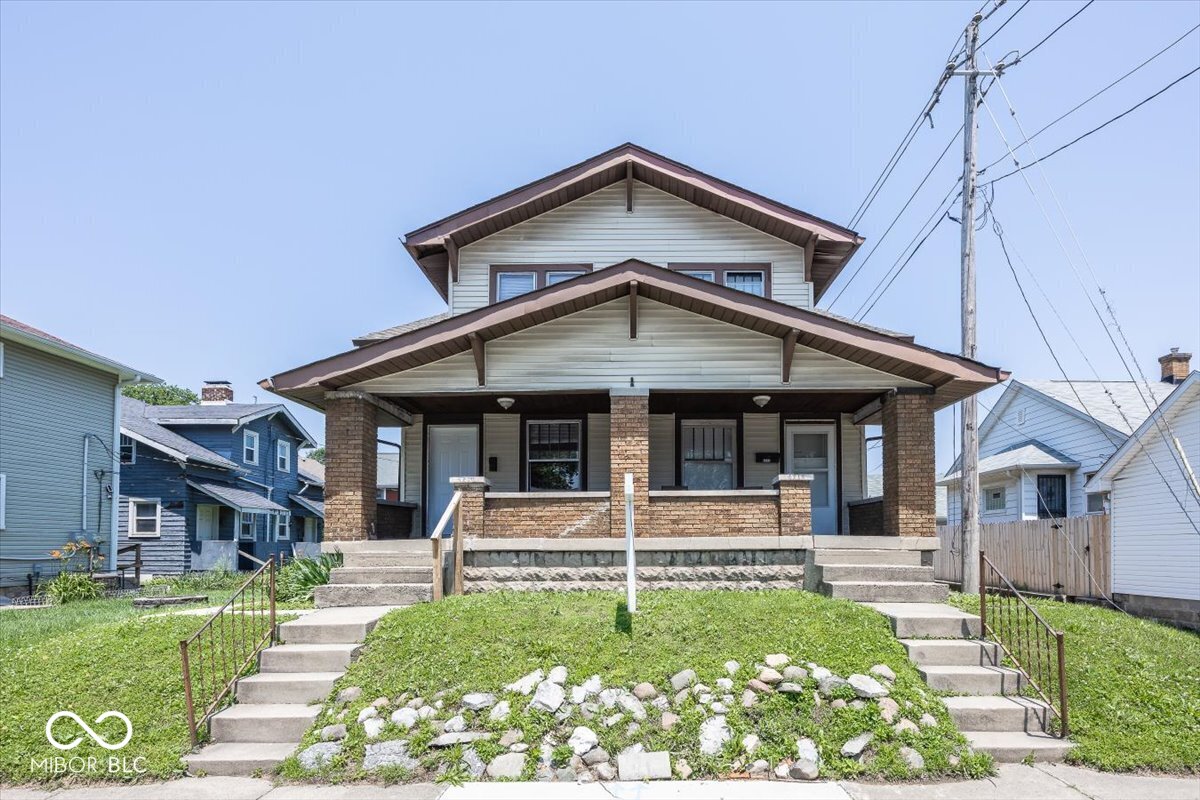
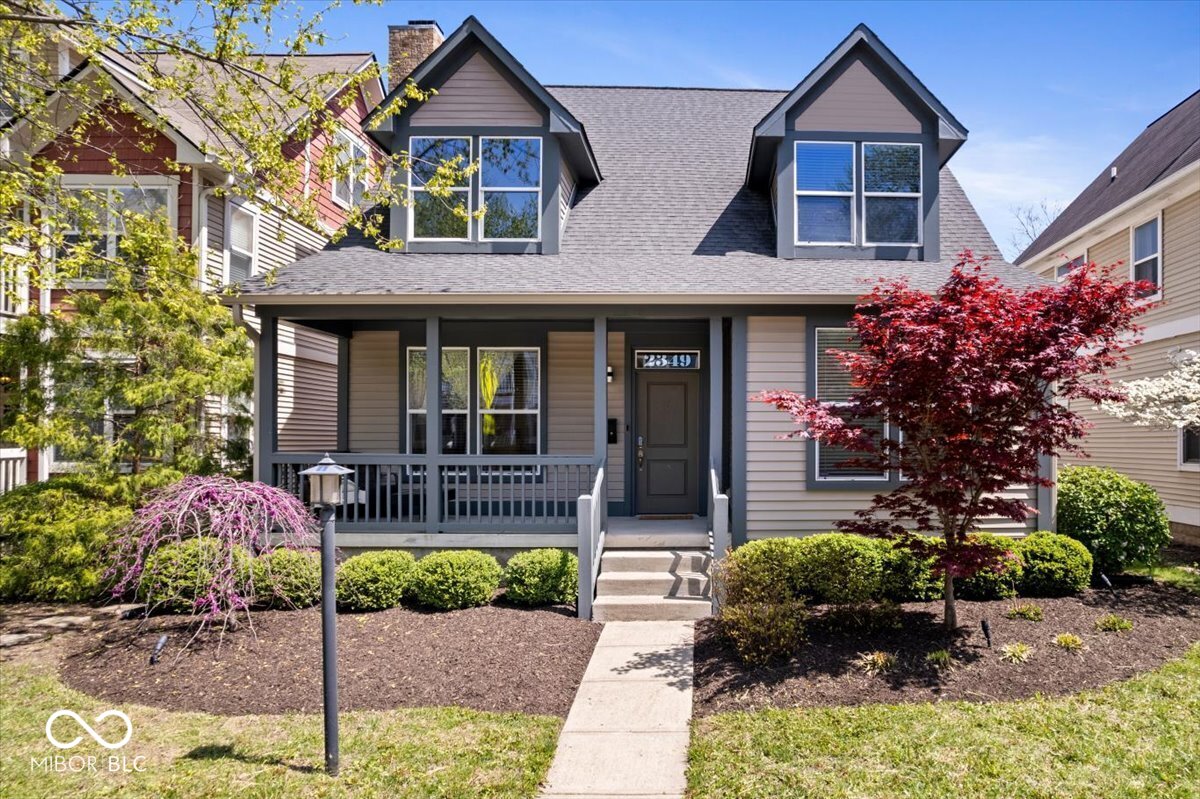
$424,900
4
bds
|
4
ba
|
2,604
sqft
|
built
1920
1620 W New York St, Indianapolis, IN 46222
$535
Cash flow
6.6%
Cash-on-Cash Return
7.8%
Cap rate
0.9%
Rent to Value Ratio
Pending
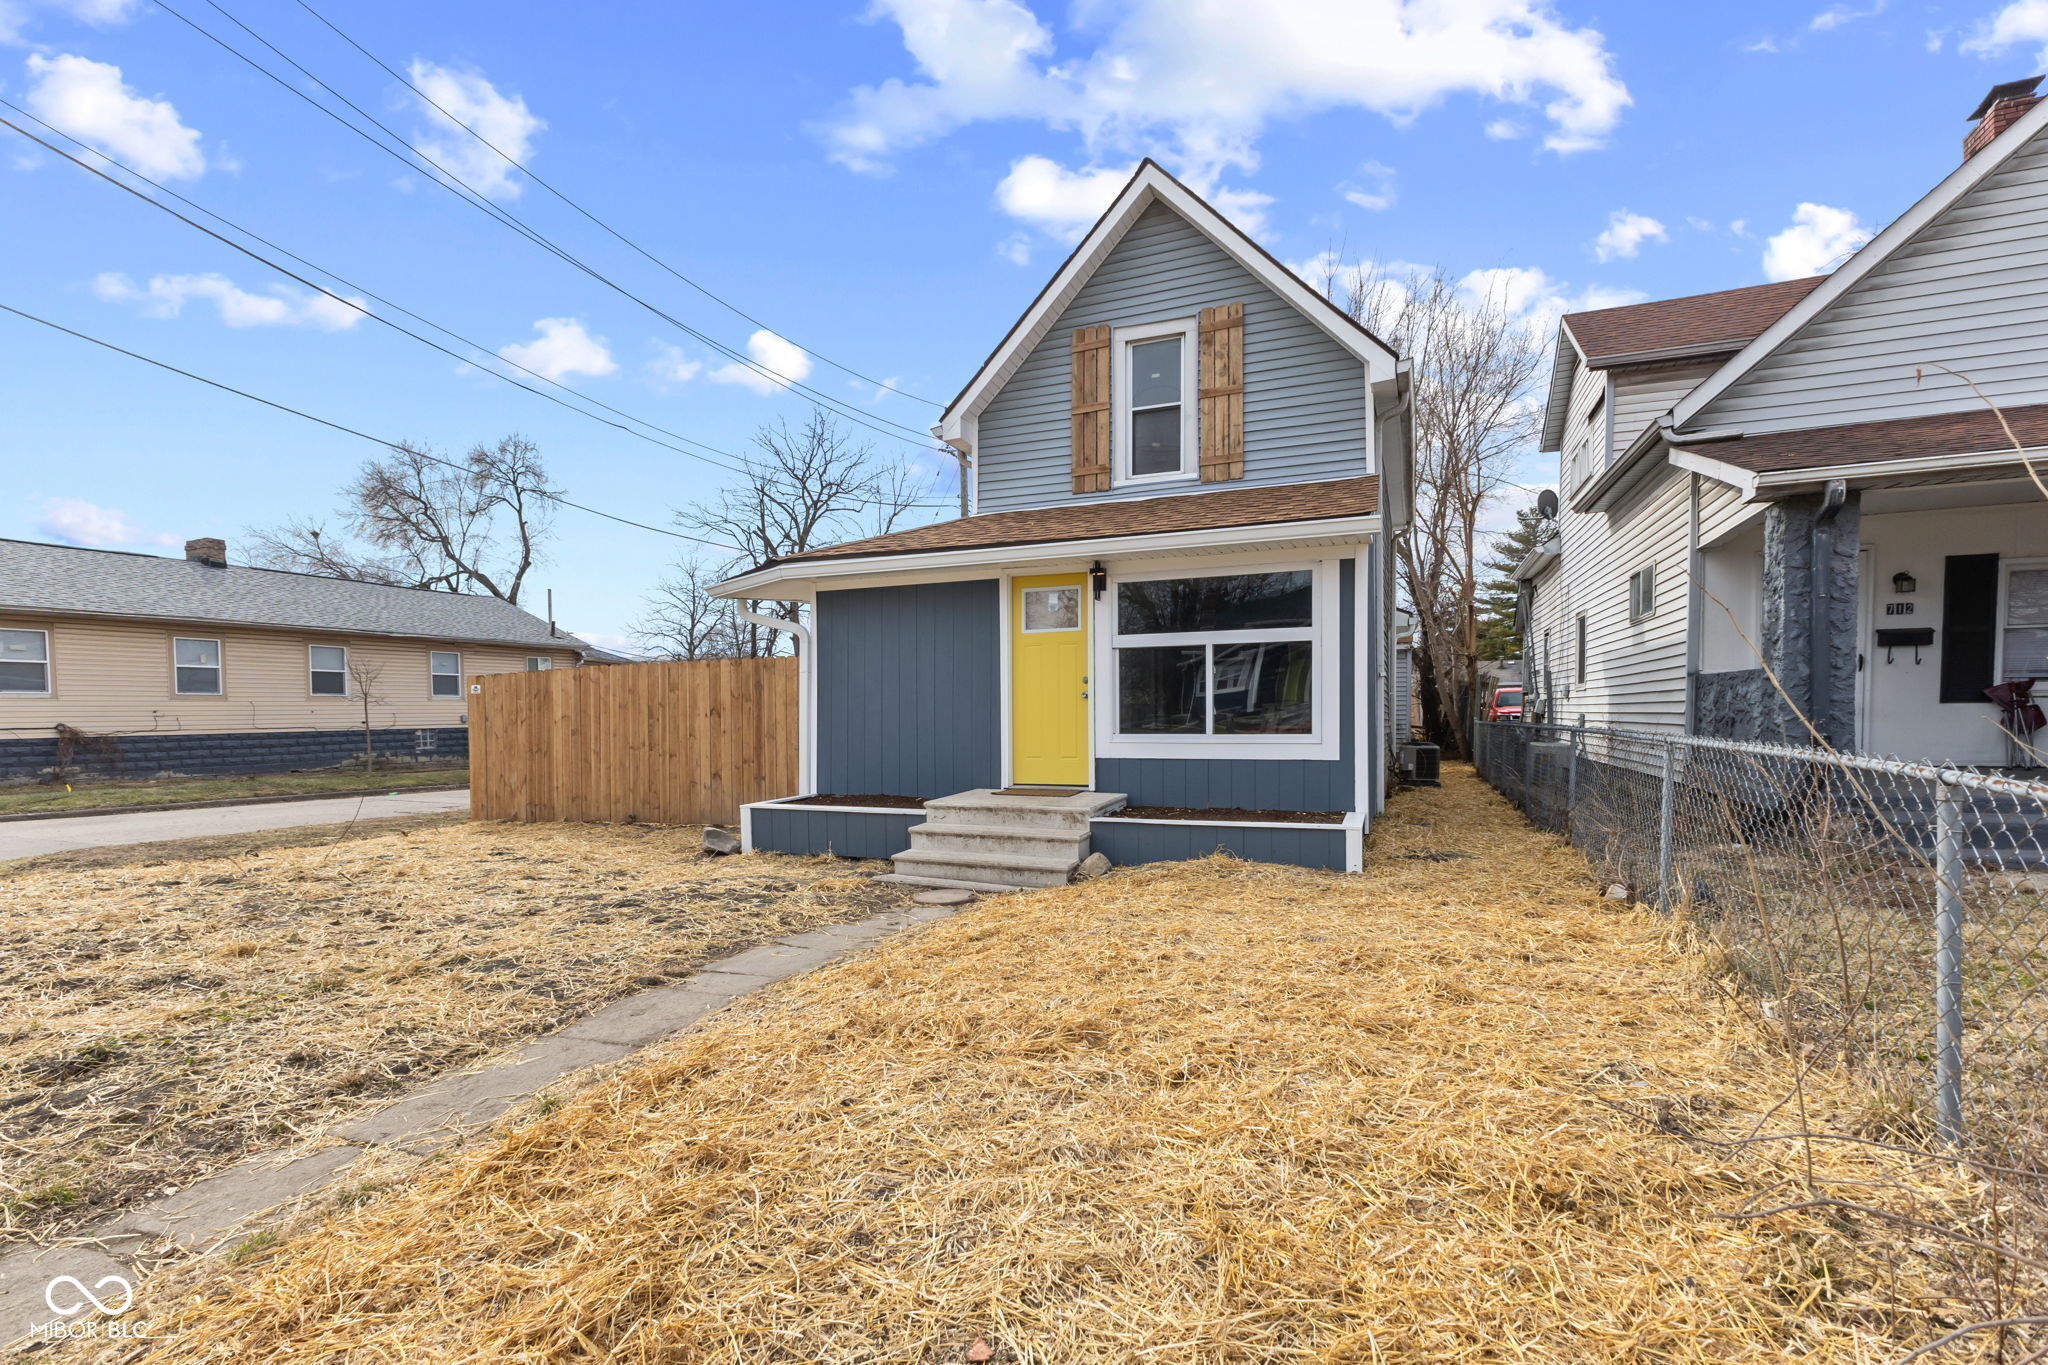
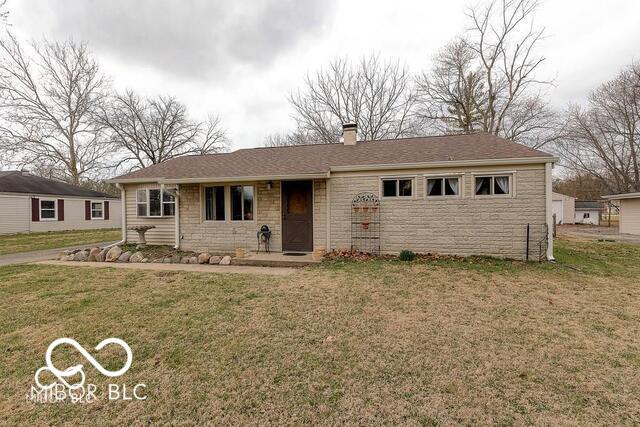
$174,900
3
bds
|
2
ba
|
1,995
sqft
|
built
1960
3570 Decamp Dr, Indianapolis, IN 46226
$326
Cash flow
9.7%
Cash-on-Cash Return
8.5%
Cap rate
1.0%
Rent to Value Ratio
2,000 out of 2,142 properties for sale in Indianapolis, IN
Limited Results Shown
Create a free account, or log in to reveal all property listings and enjoy the complete experience.
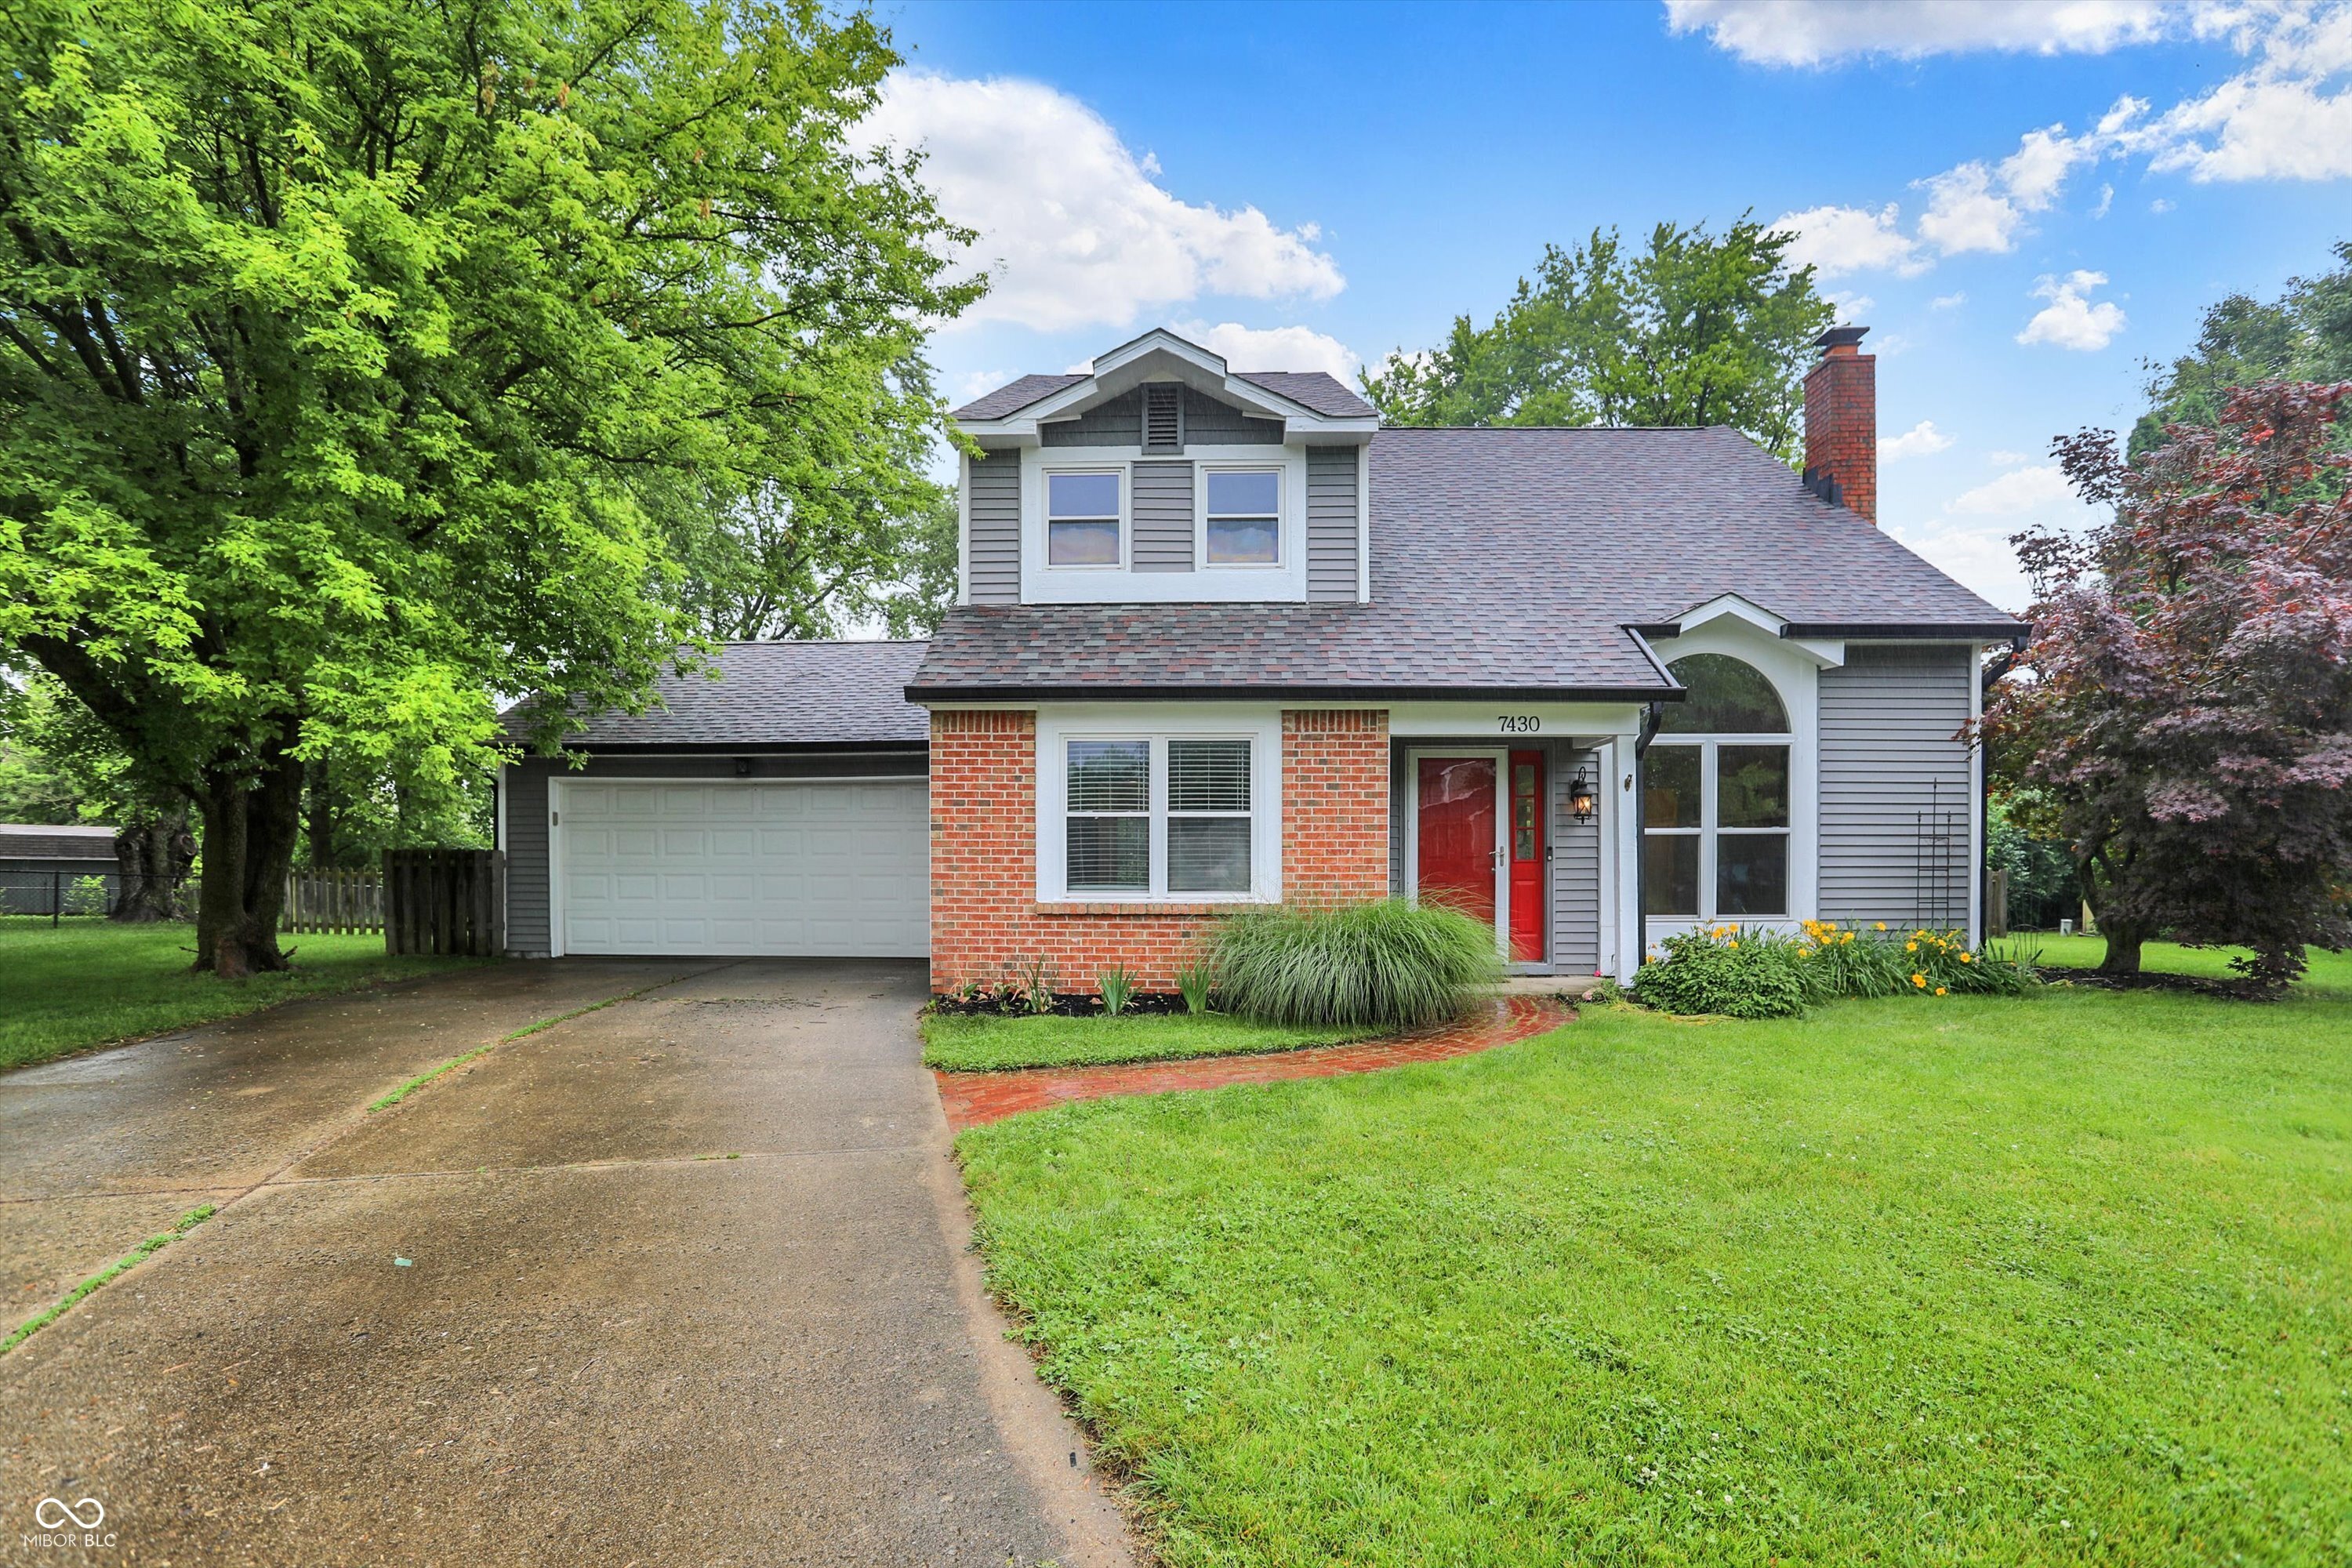
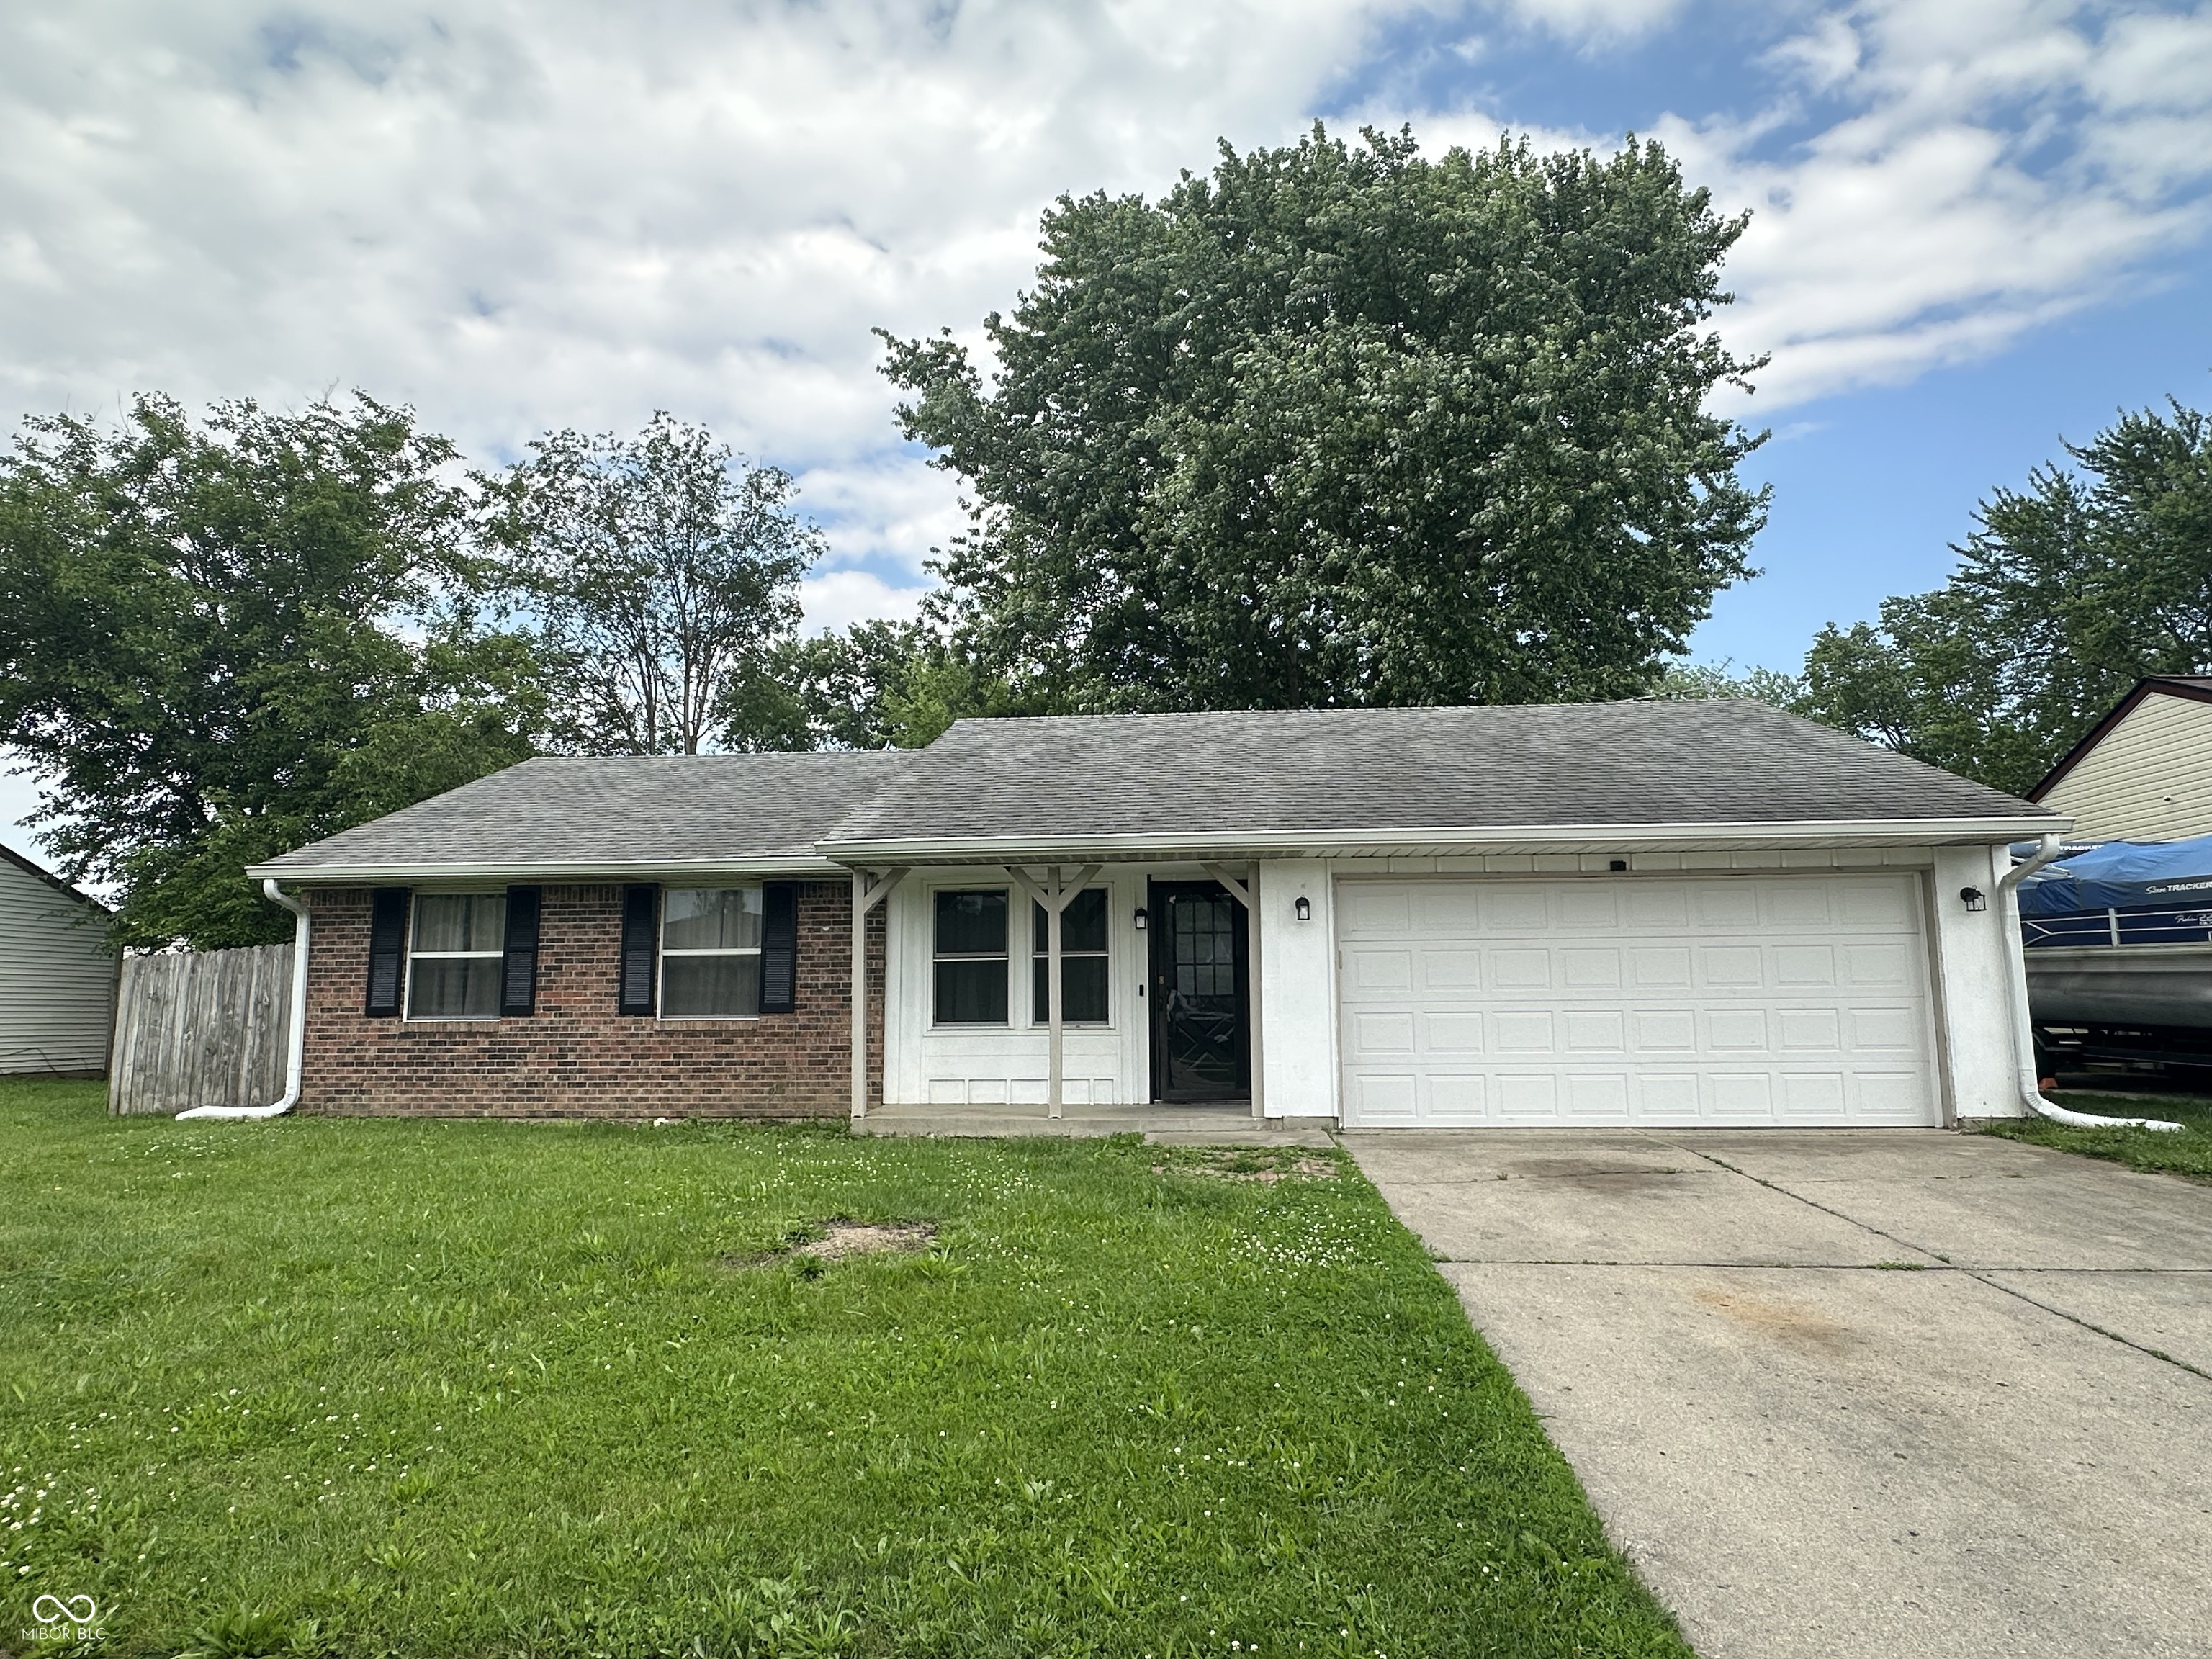
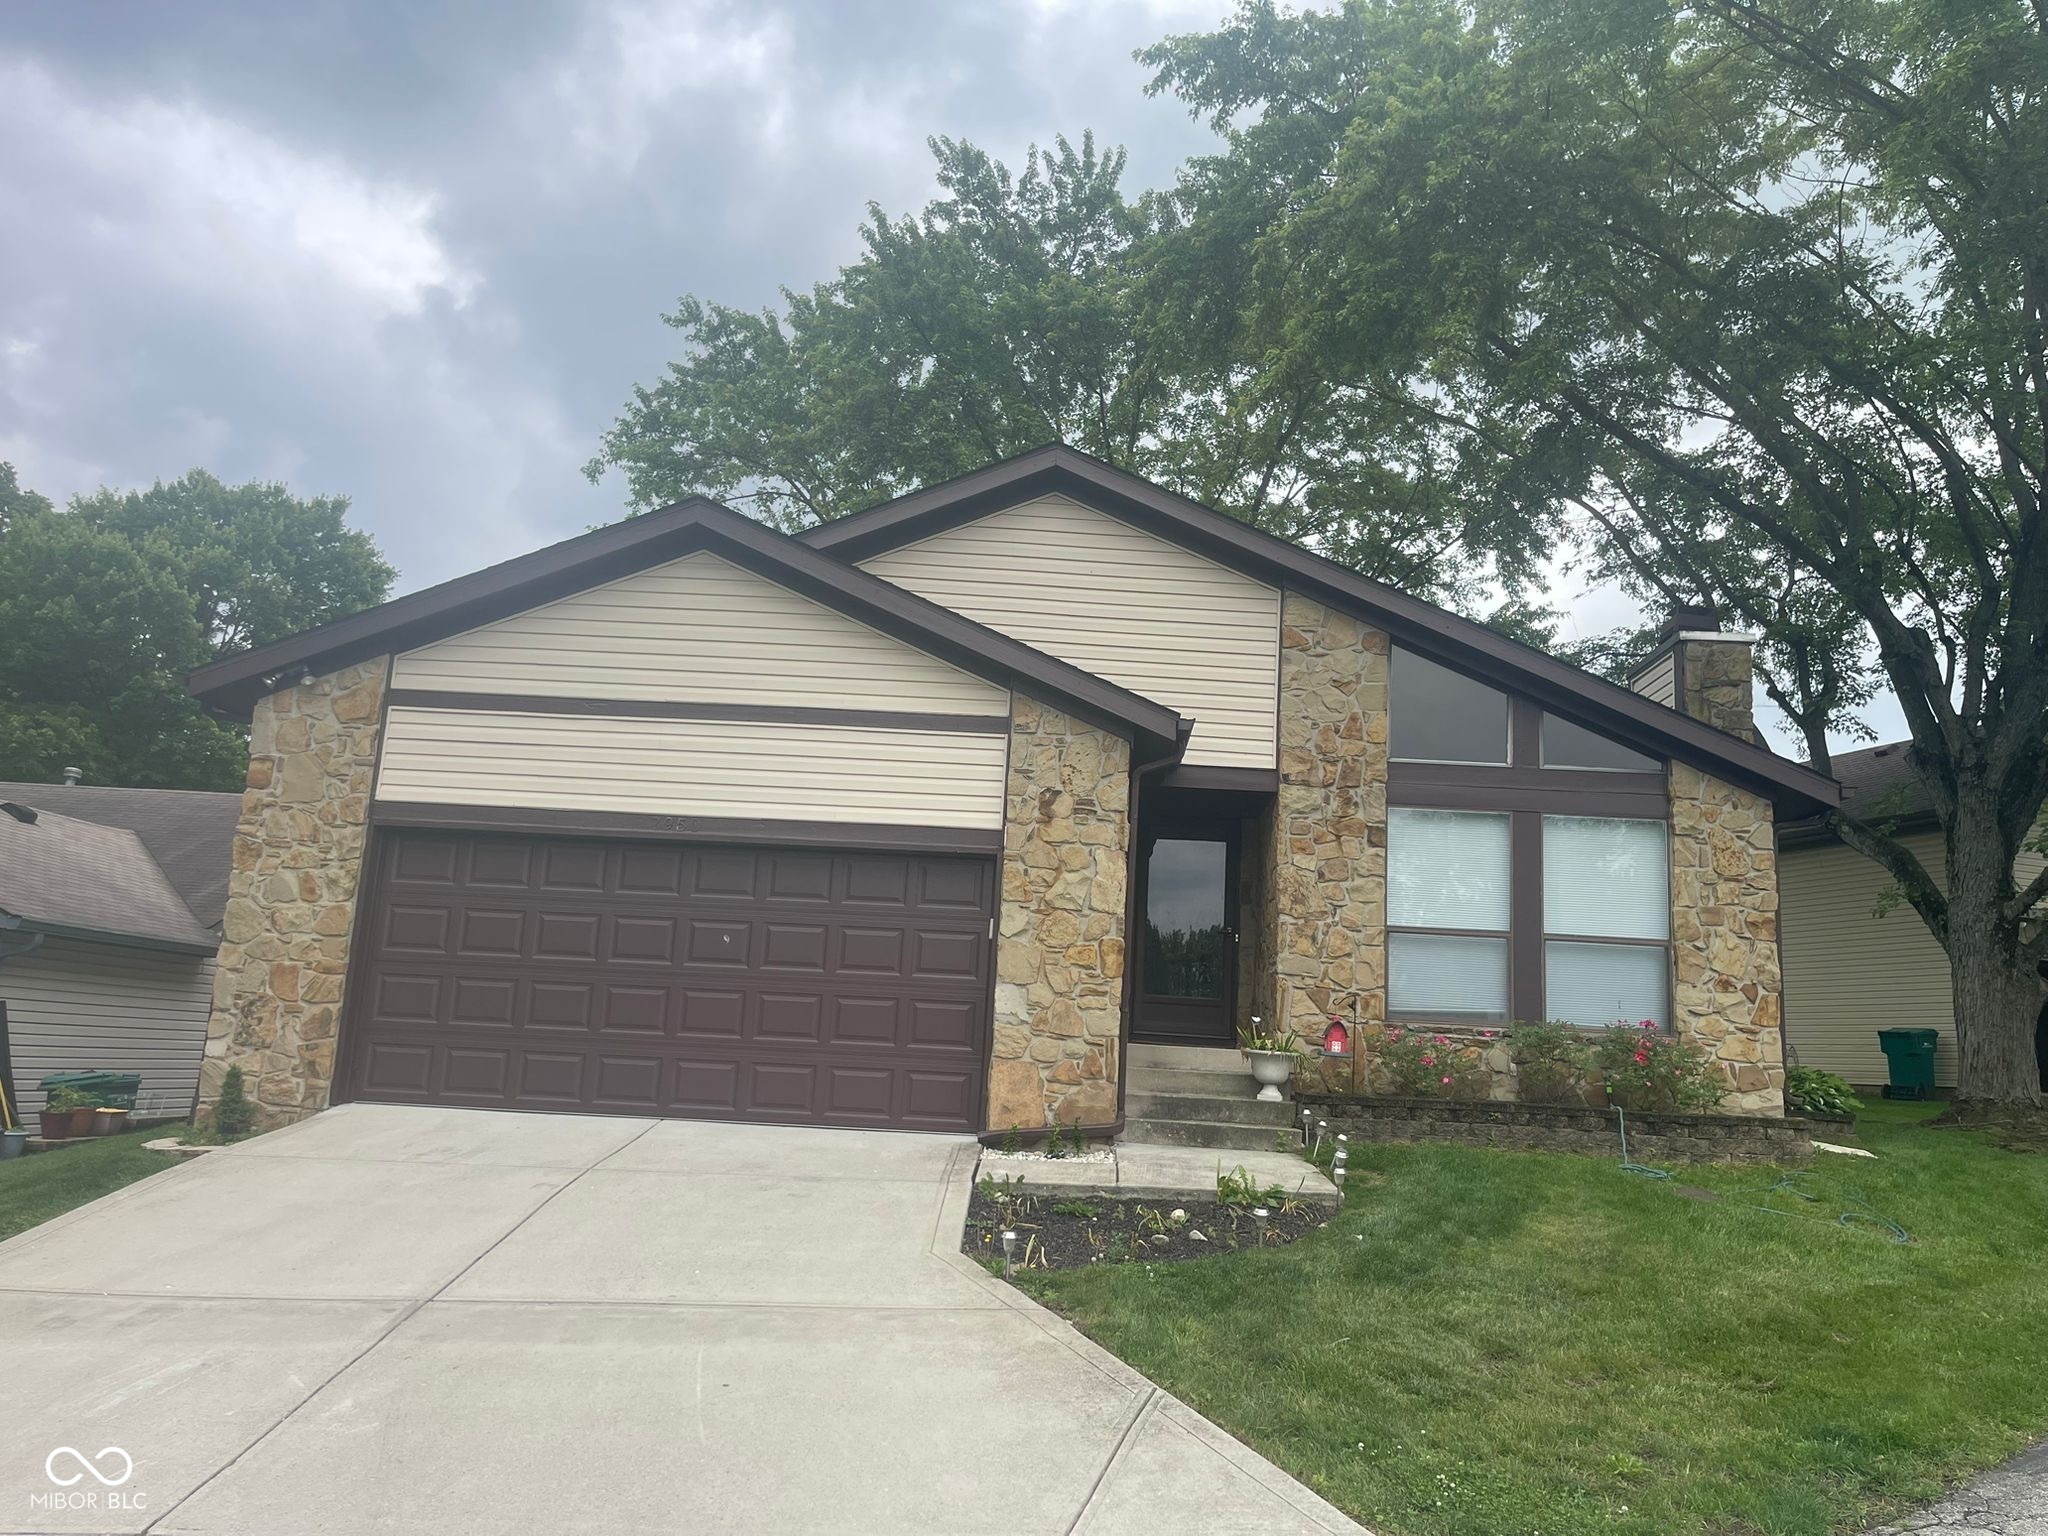
Pending
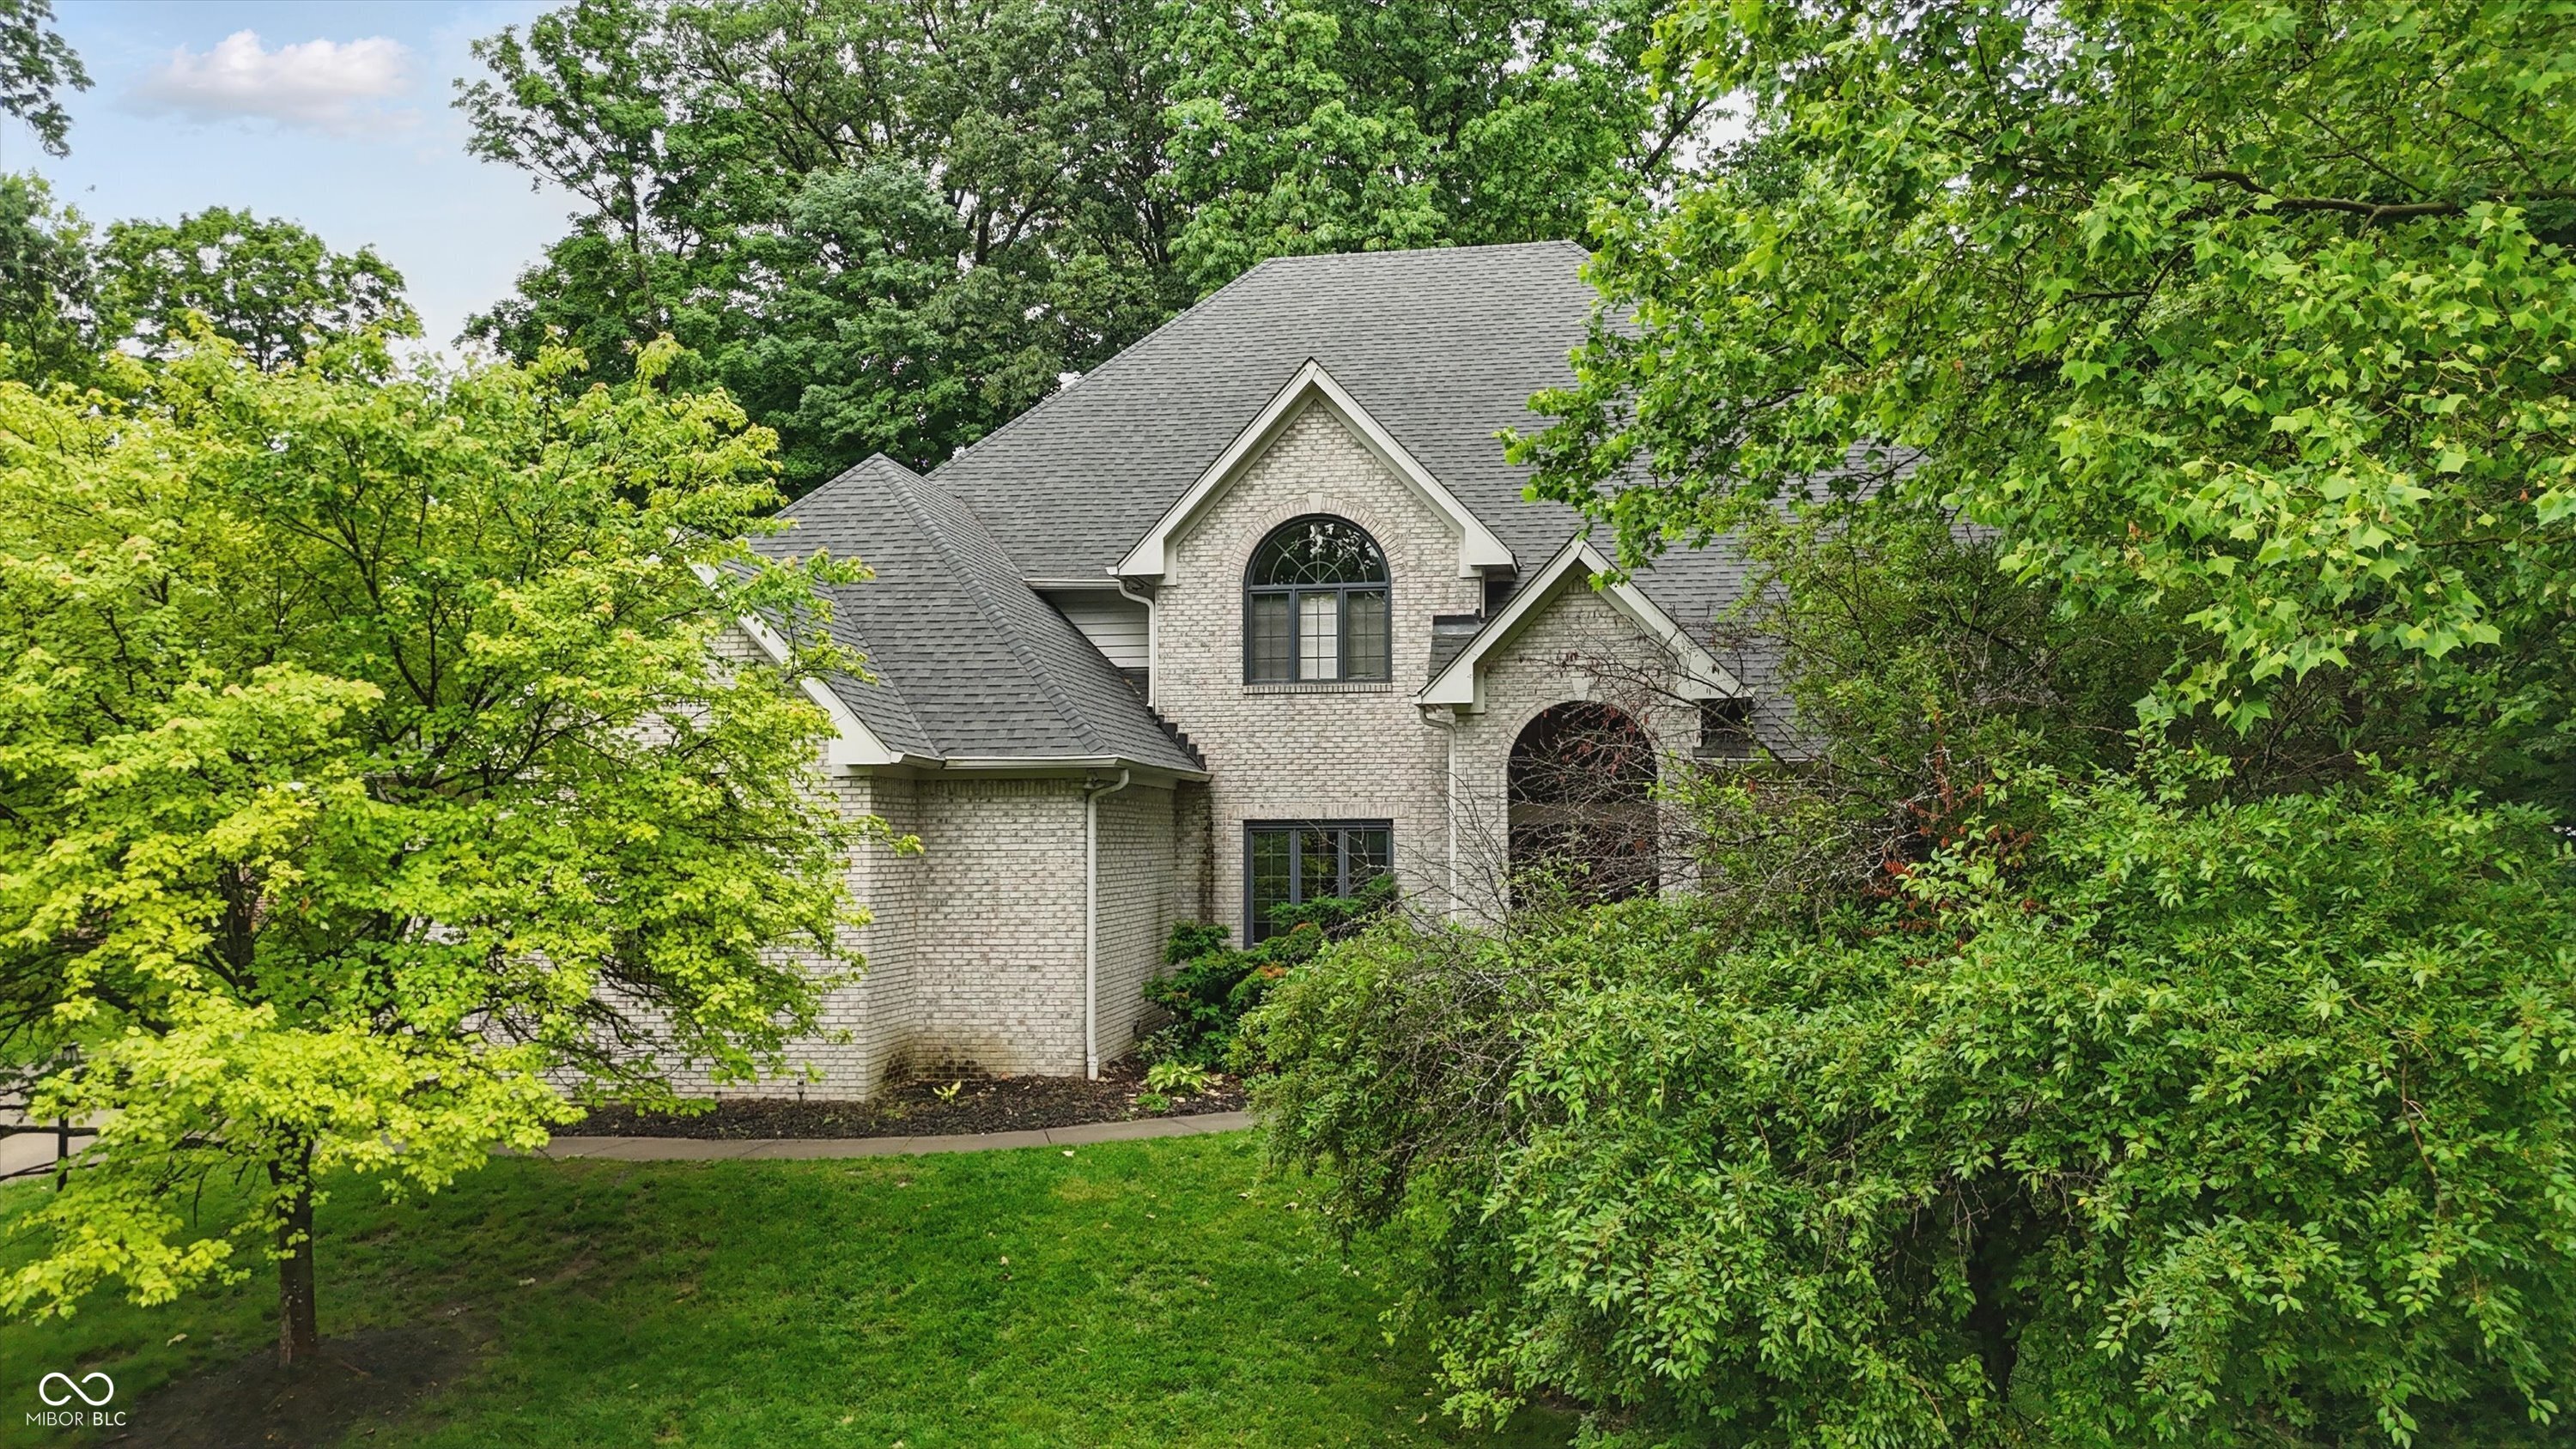
$317,500
3
bds
|
2
ba
|
1,680
sqft
|
built
1985
7430 Railway Ct, Indianapolis, IN 46256
$-286
Cash flow
-4.7%
Cash-on-Cash Return
5.2%
Cap rate
0.6%
Rent to Value Ratio
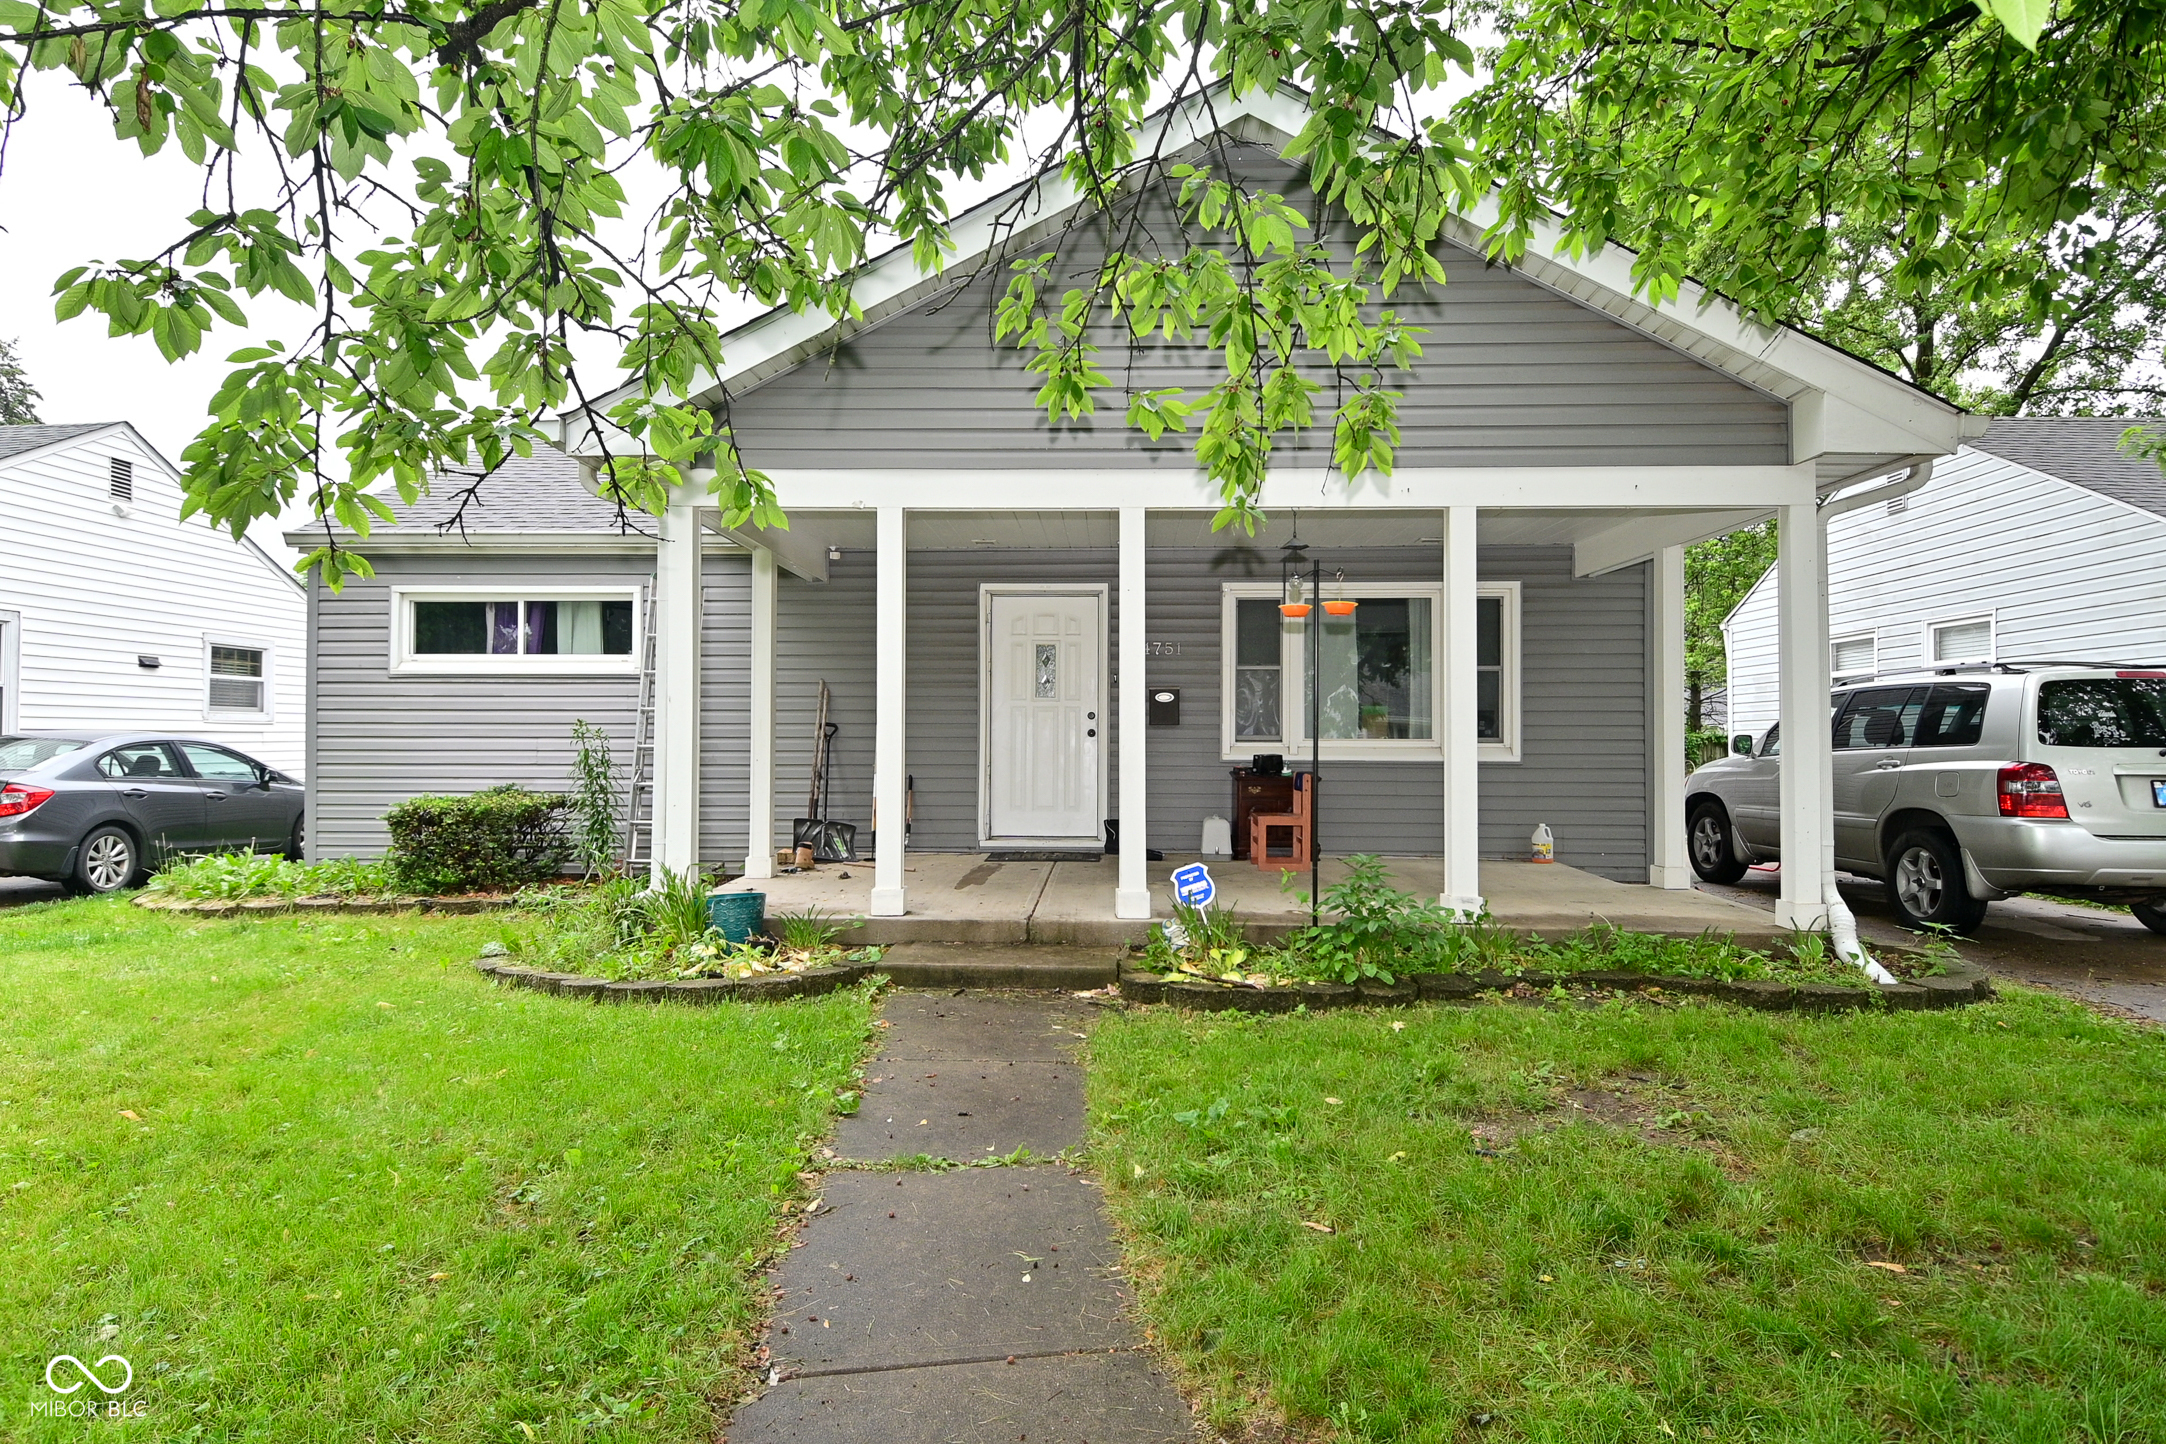
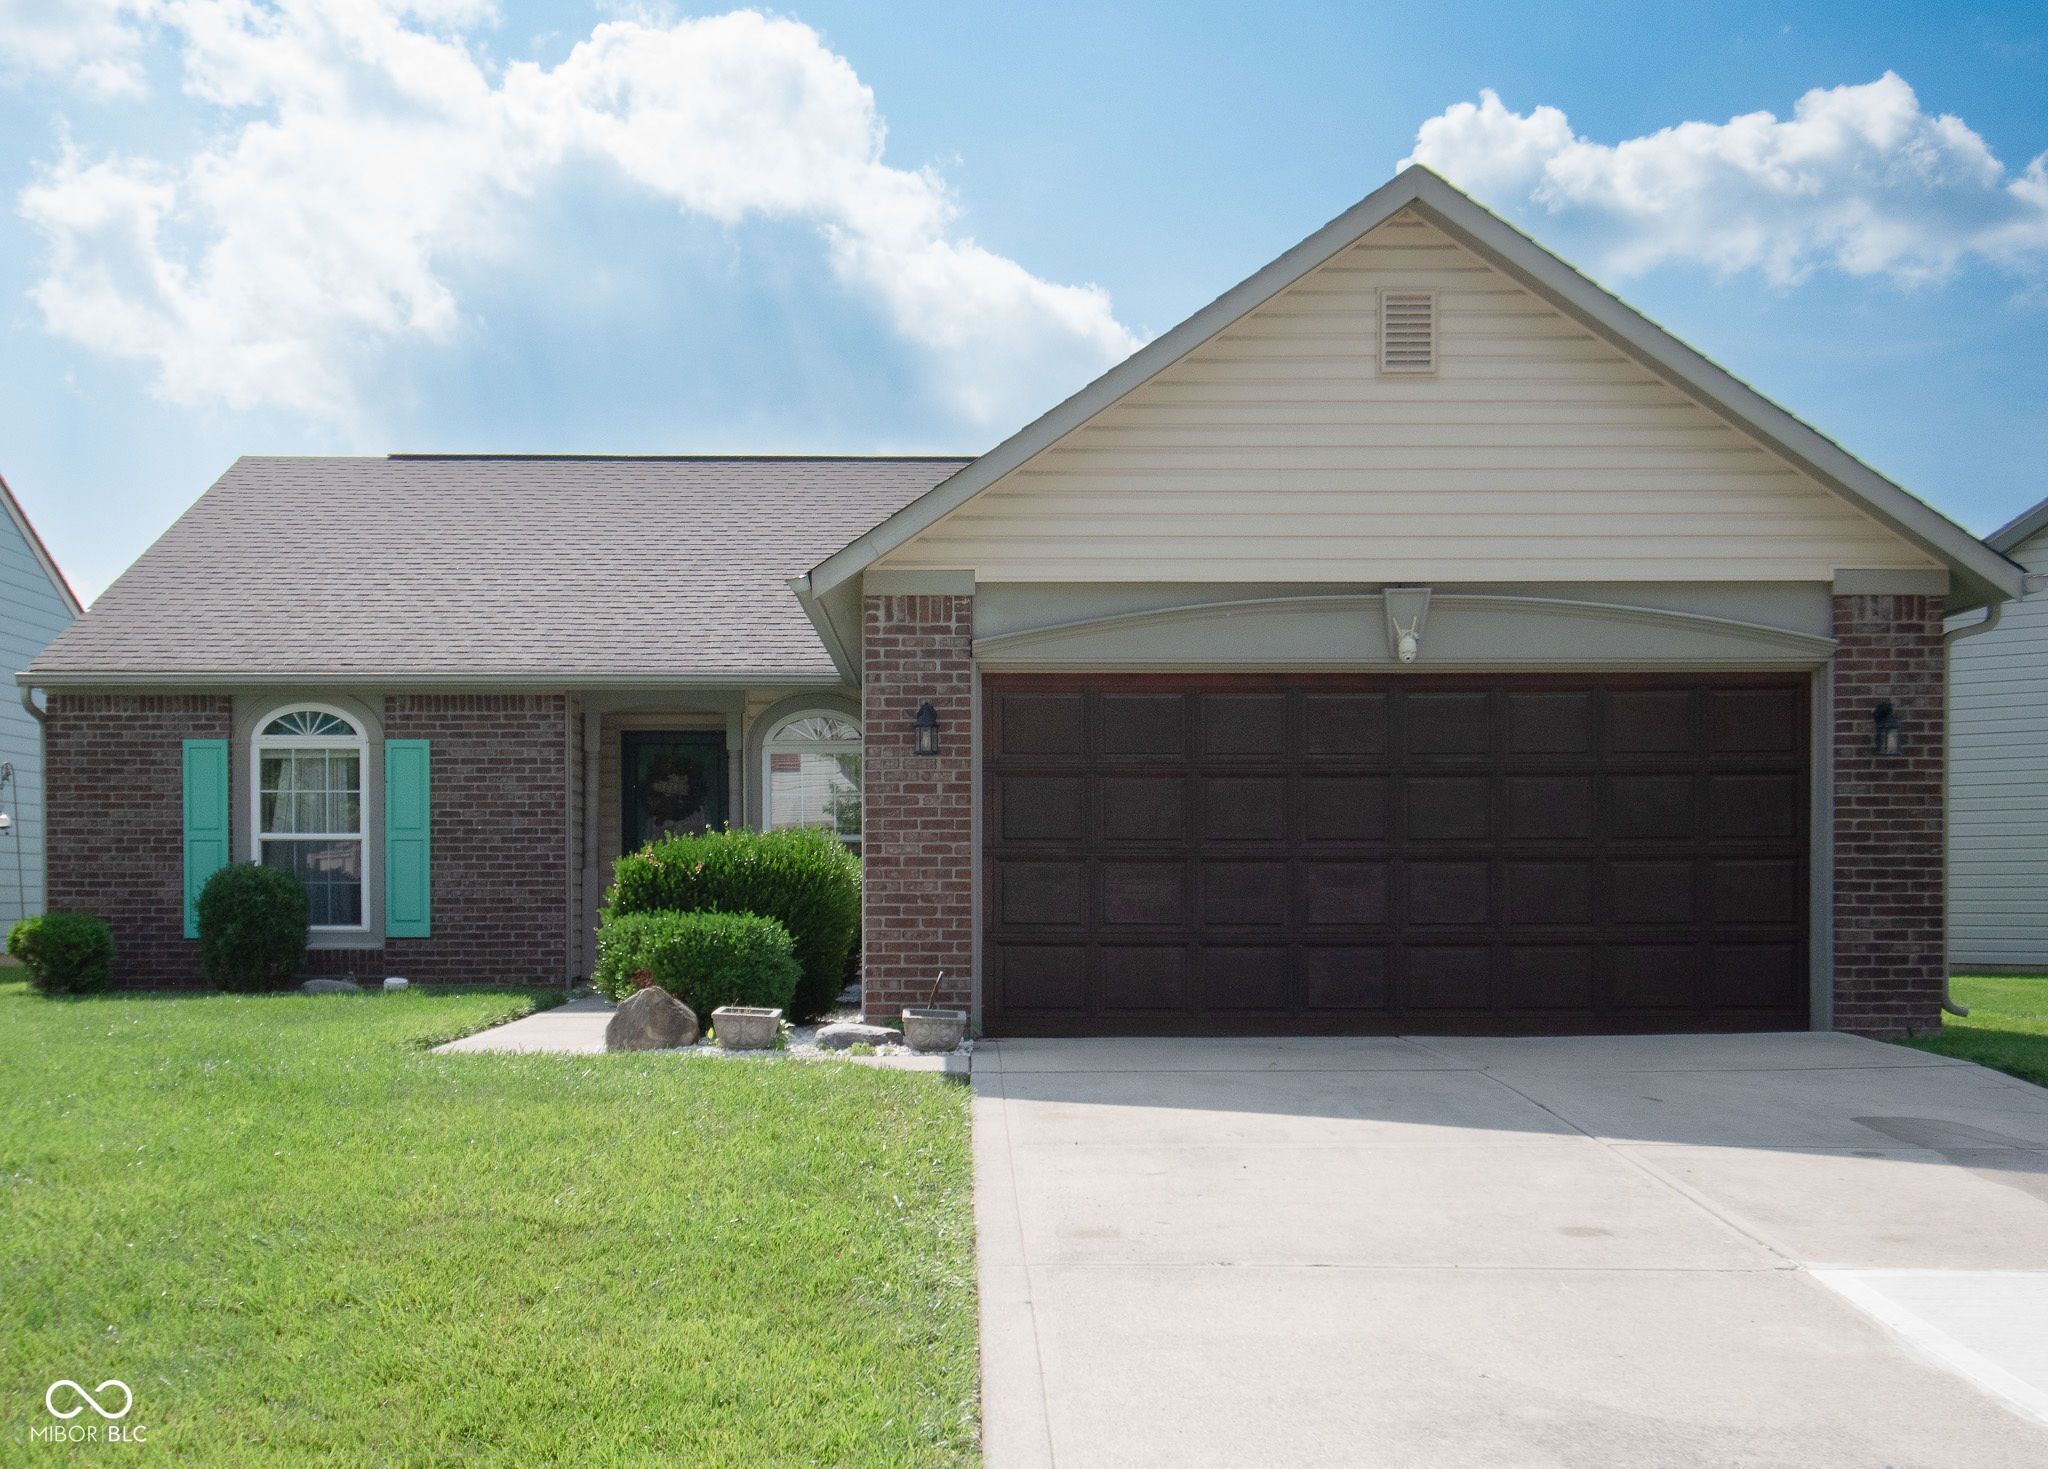
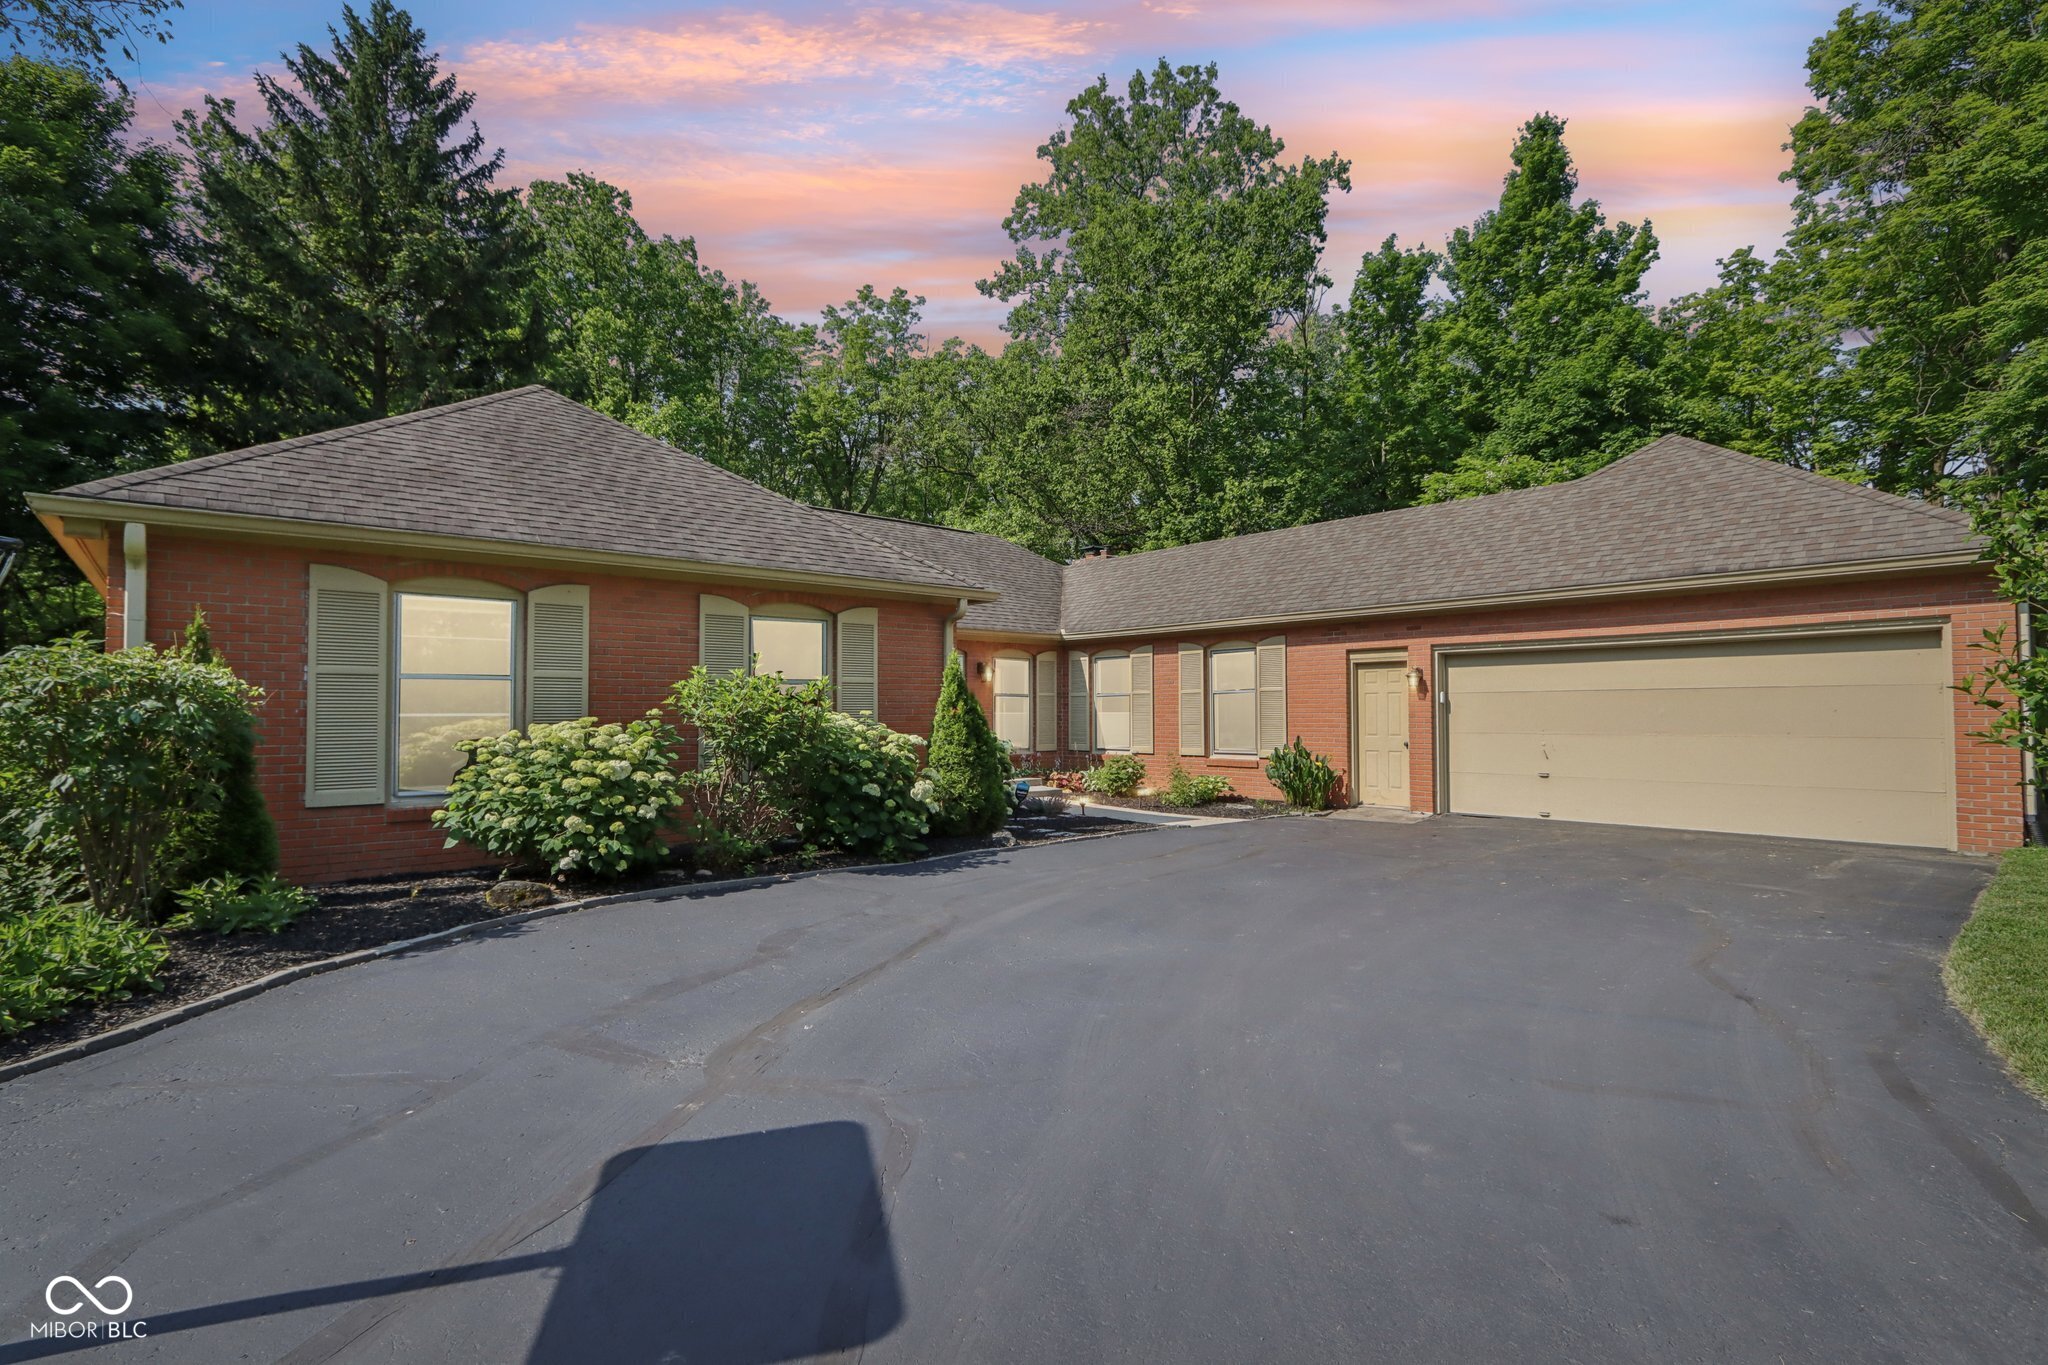
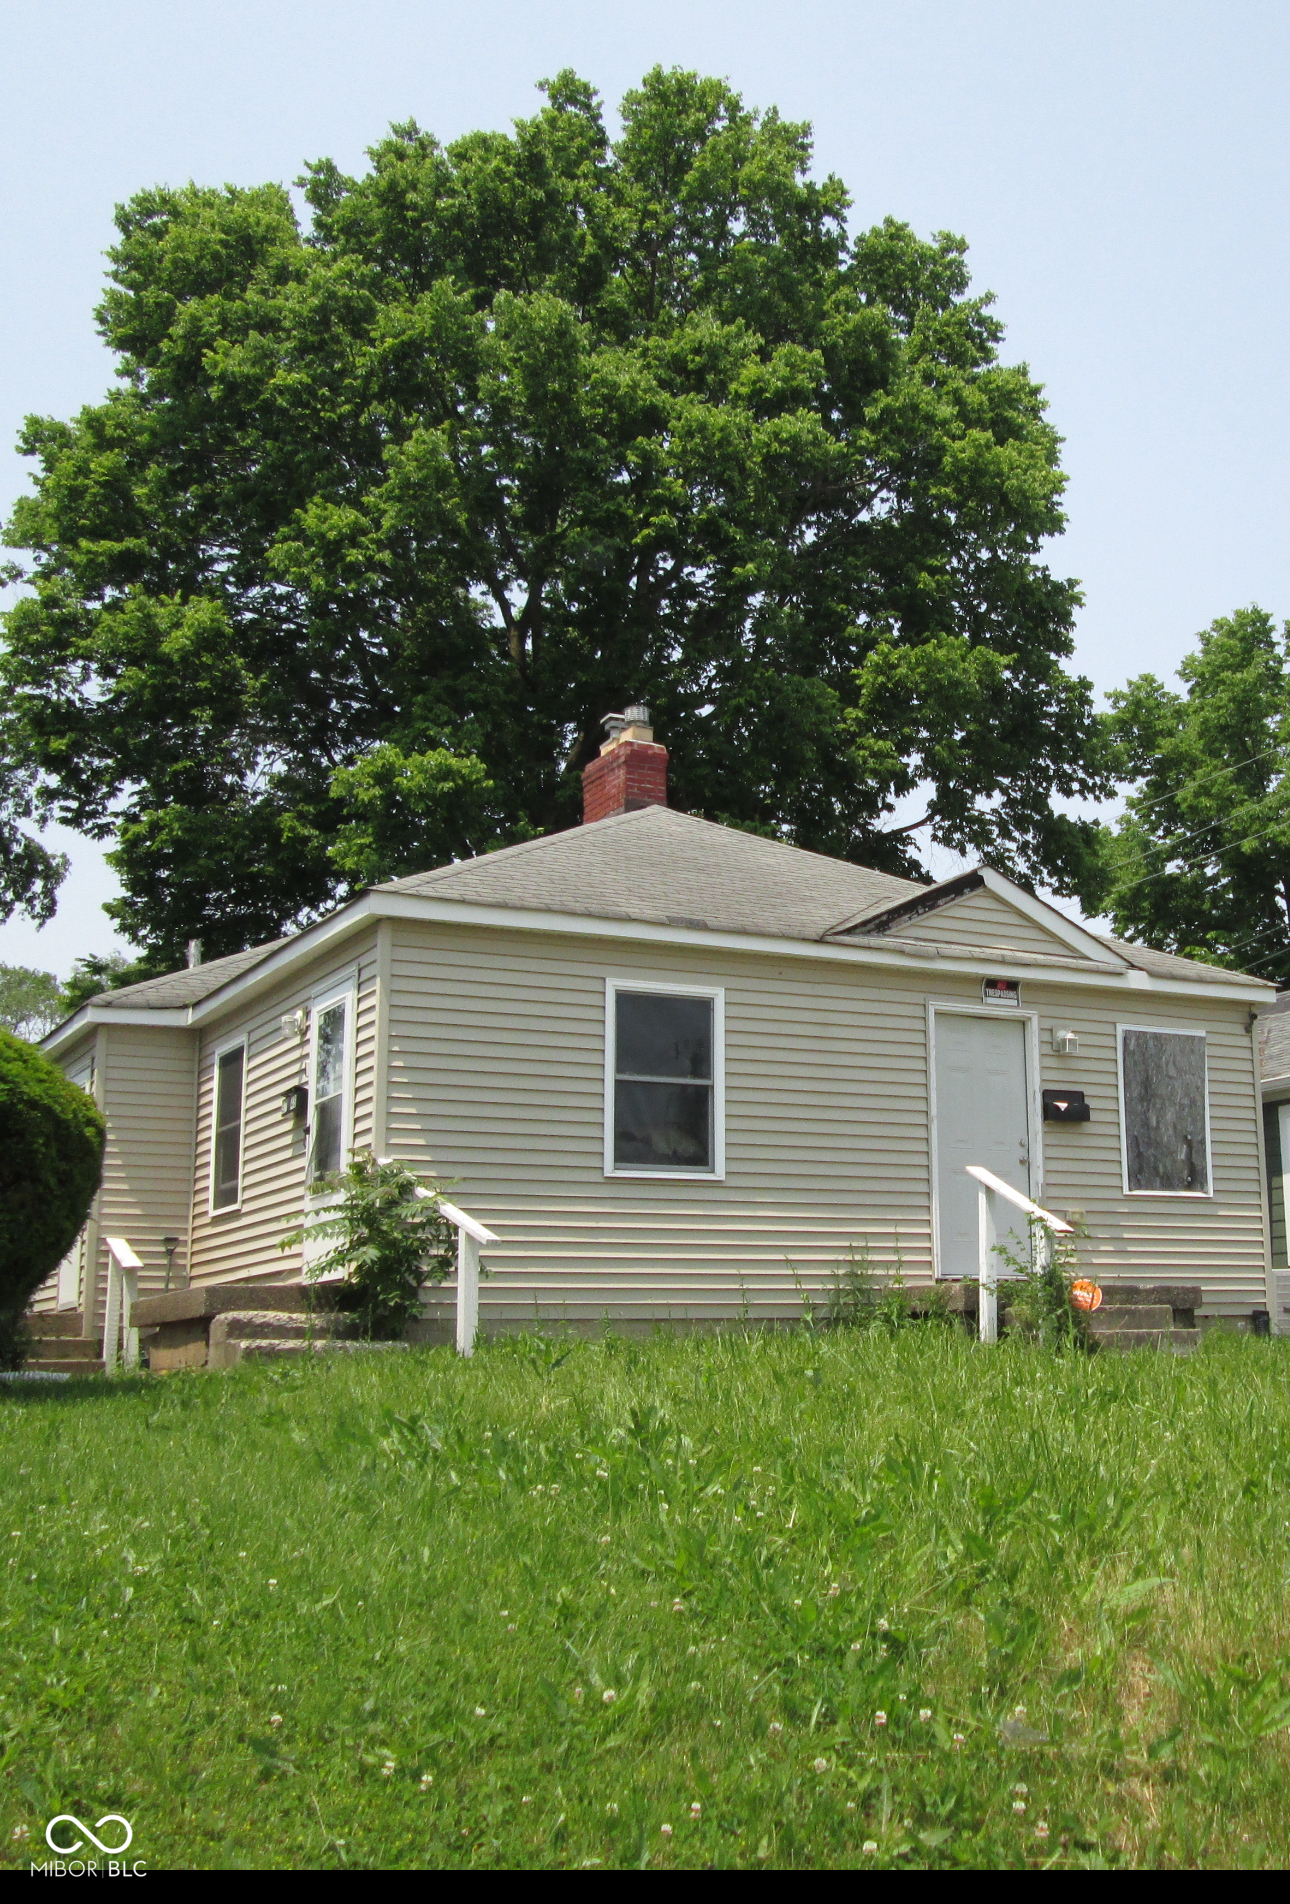
Active
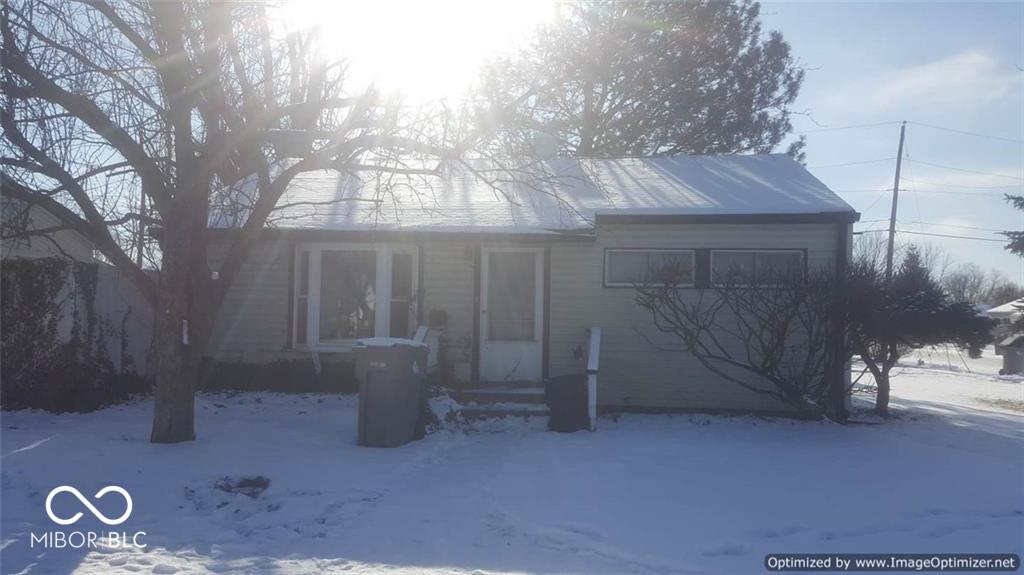
$194,990
3
bds
|
2
ba
|
1,512
sqft
|
built
1954
4751 N Longworth Ave, Indianapolis, IN 46226
$83
Cash flow
2.2%
Cash-on-Cash Return
6.8%
Cap rate
0.8%
Rent to Value Ratio
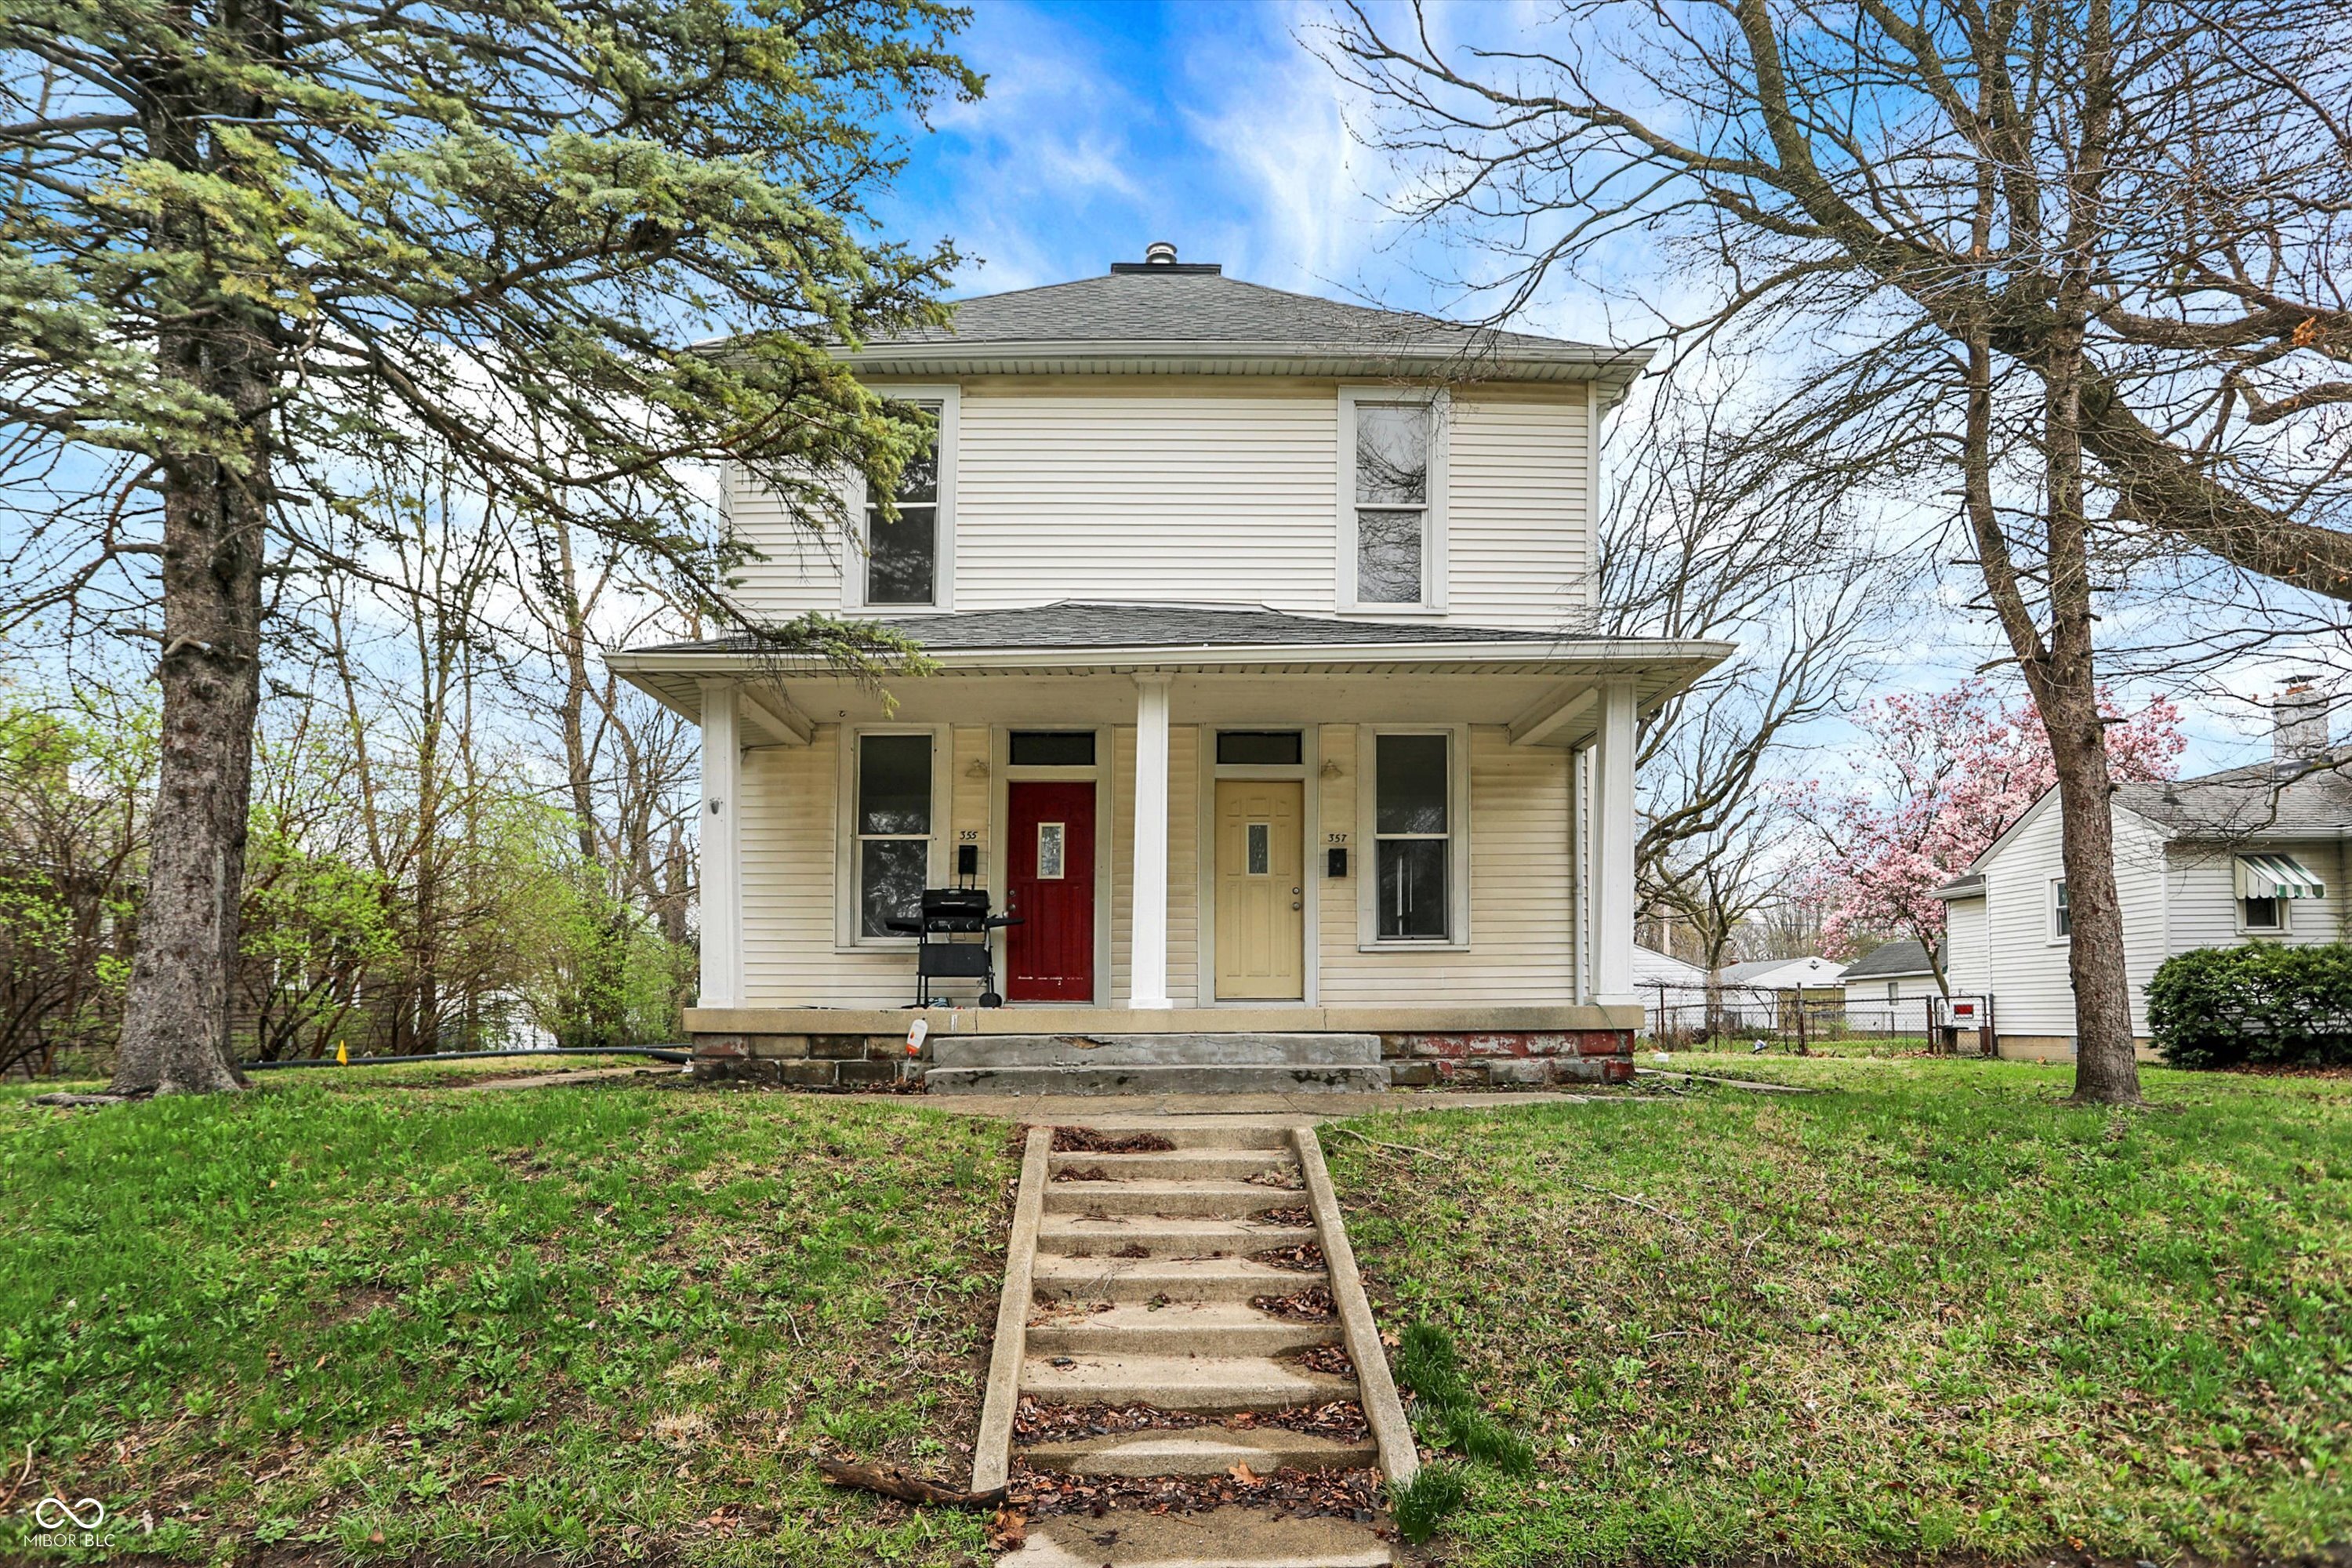
Pending
$239,900
4
bds
|
0
ba
|
0
sqft
|
built
1939
355 S Arlington Ave, Indianapolis, IN 46219
$-566
Cash flow
-12.3%
Cash-on-Cash Return
3.5%
Cap rate
0.4%
Rent to Value Ratio
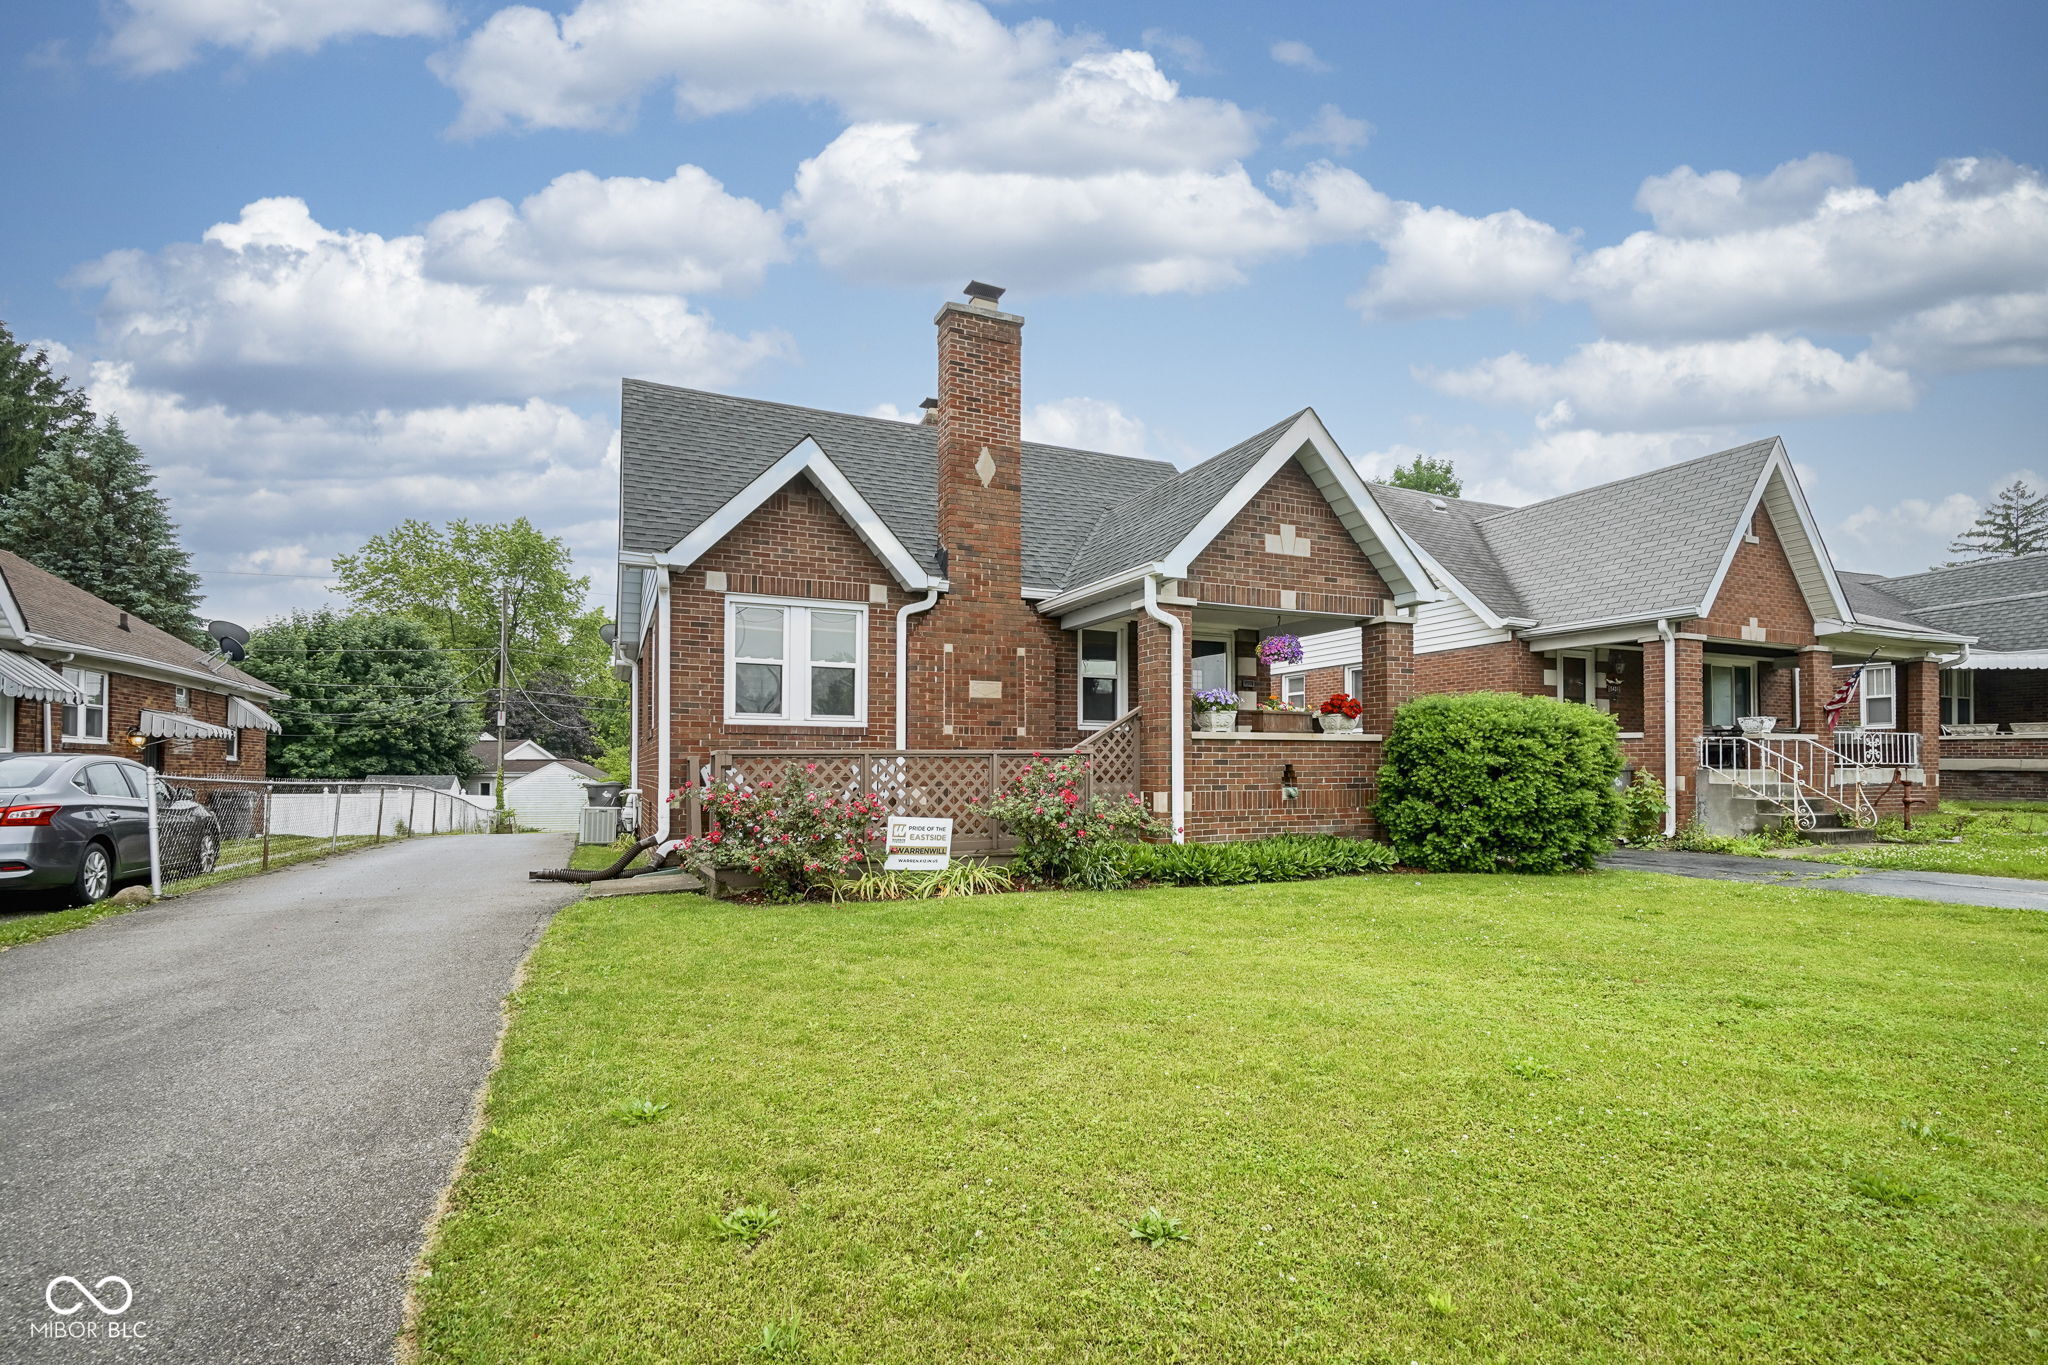
Active
$260,000
2
bds
|
1
ba
|
1,311
sqft
|
built
1937
5435 E 10th St, Indianapolis, IN 46219
$18
Cash flow
0.4%
Cash-on-Cash Return
6.4%
Cap rate
0.8%
Rent to Value Ratio
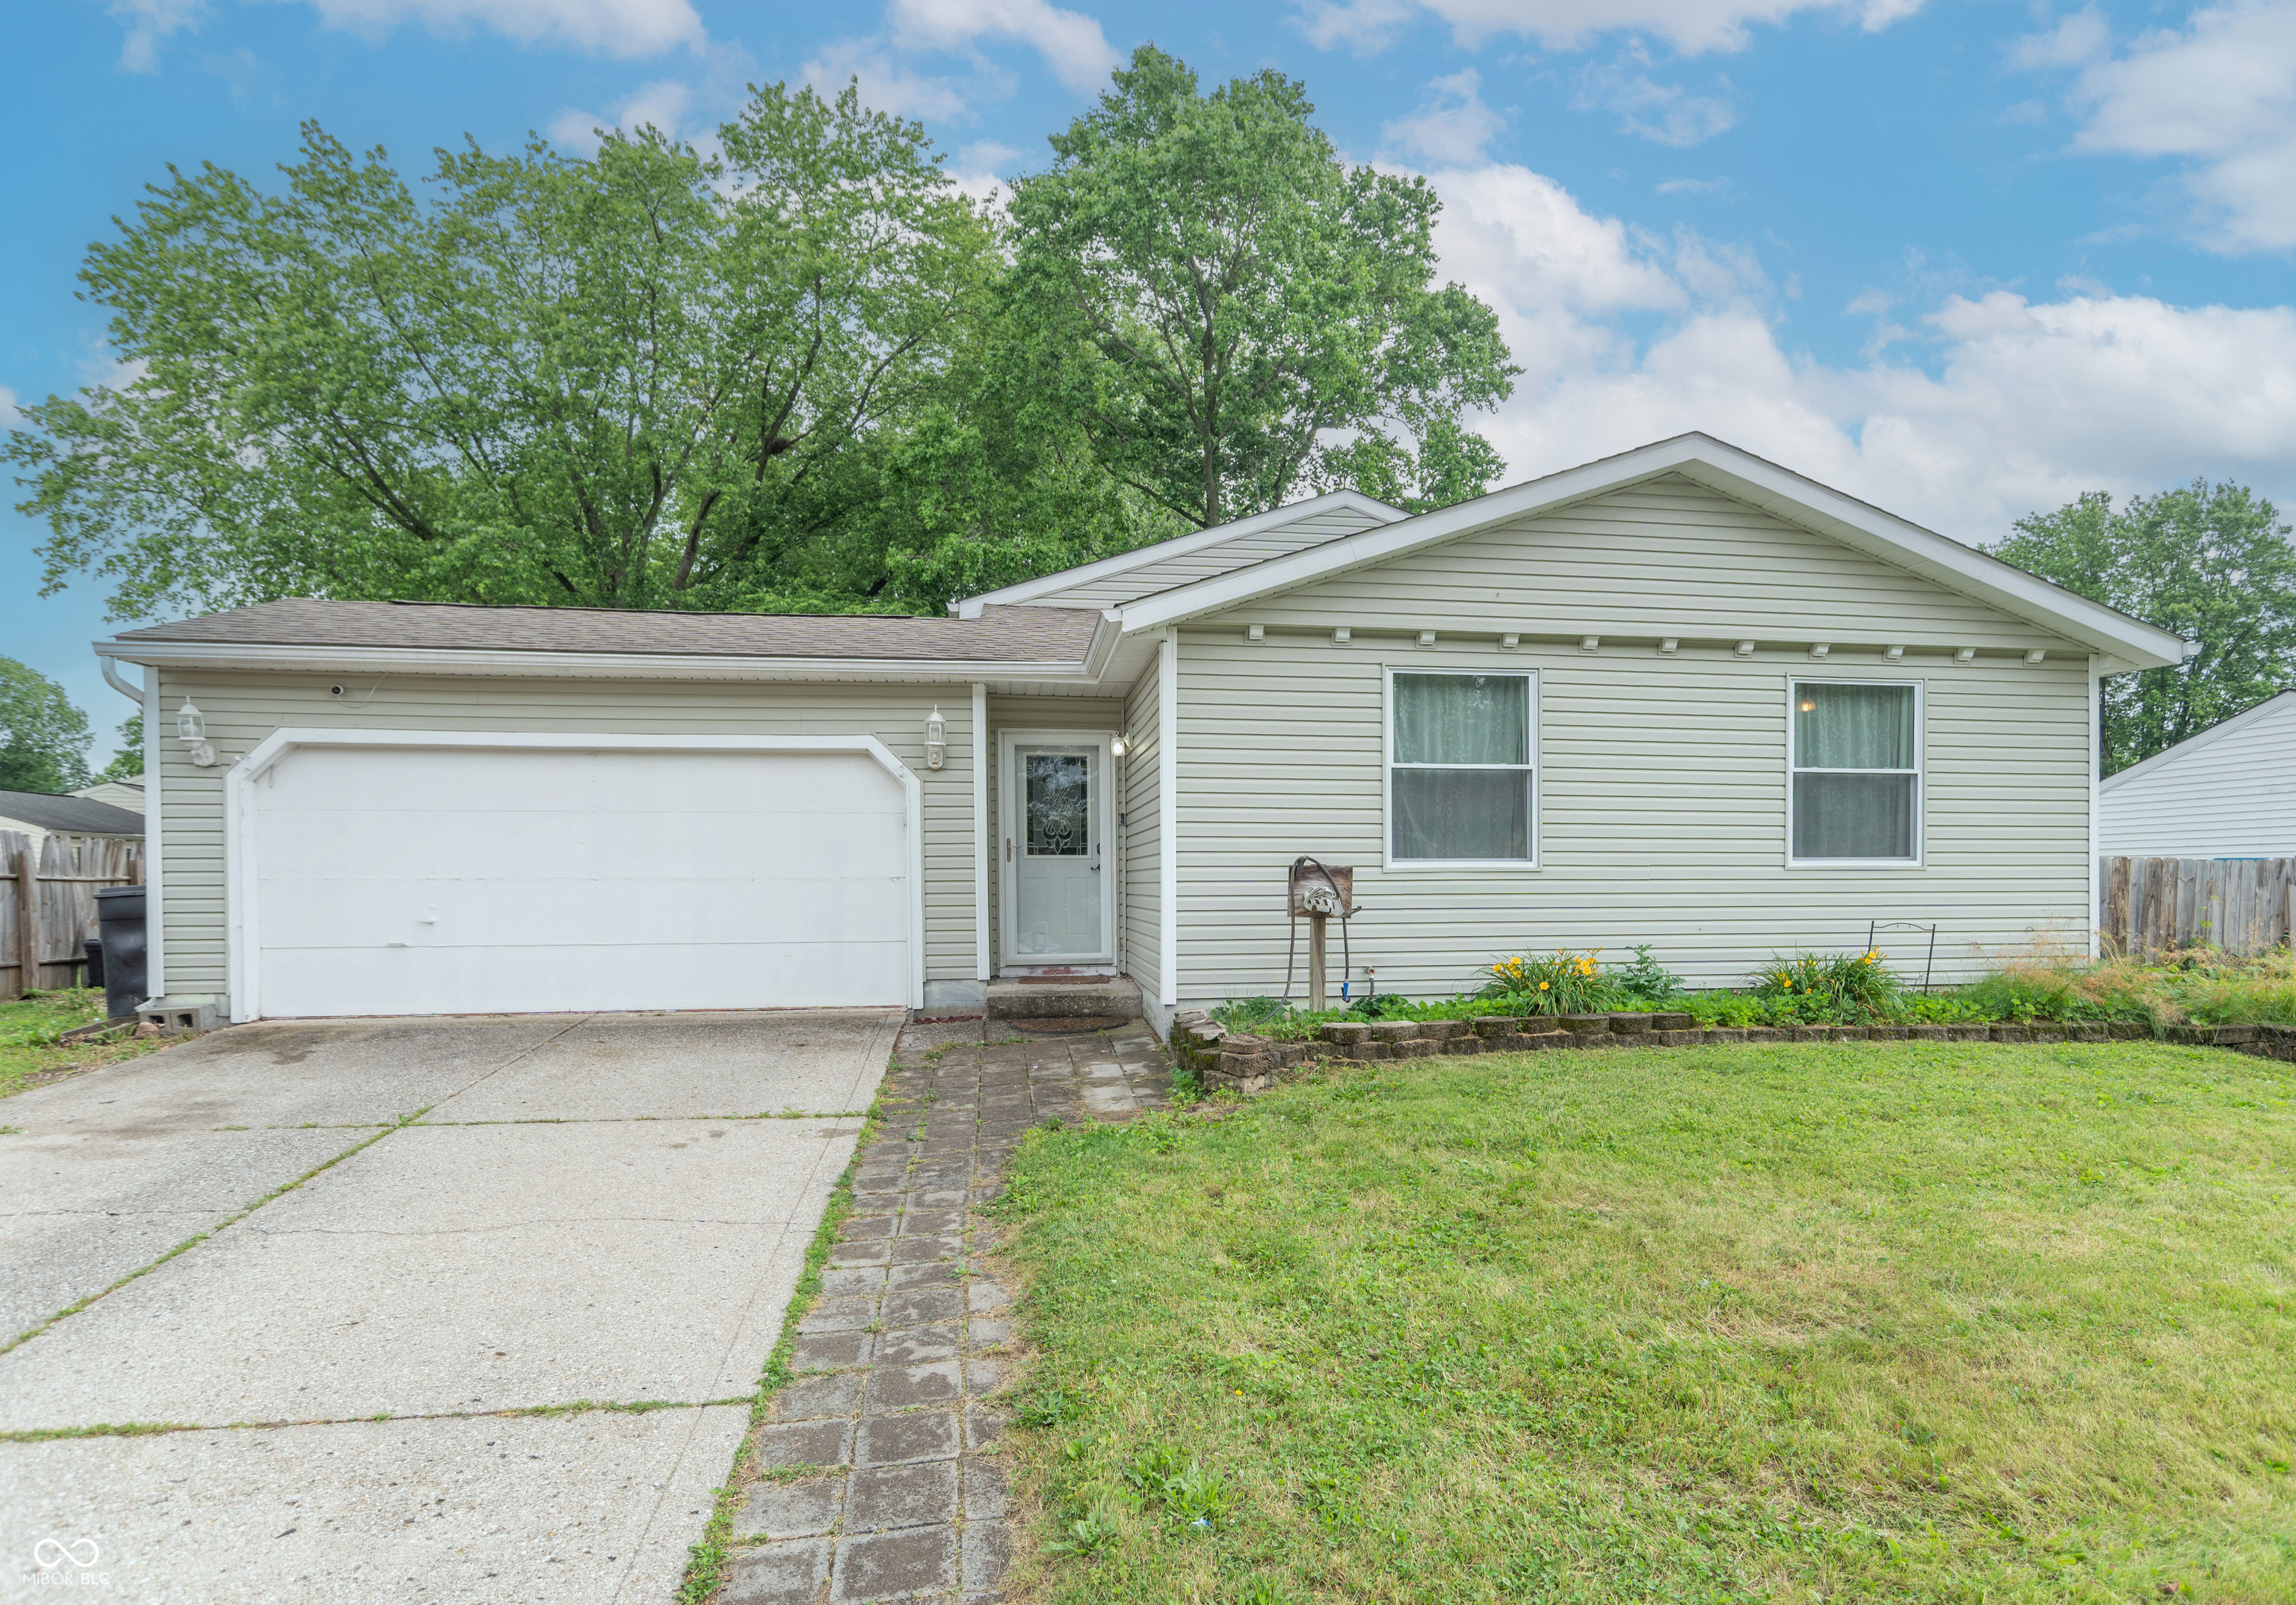
Pending
$232,000
3
bds
|
2
ba
|
1,532
sqft
|
built
1980
6837 Littleton Dr, Indianapolis, IN 46221
$-111
Cash flow
-2.5%
Cash-on-Cash Return
5.7%
Cap rate
0.7%
Rent to Value Ratio
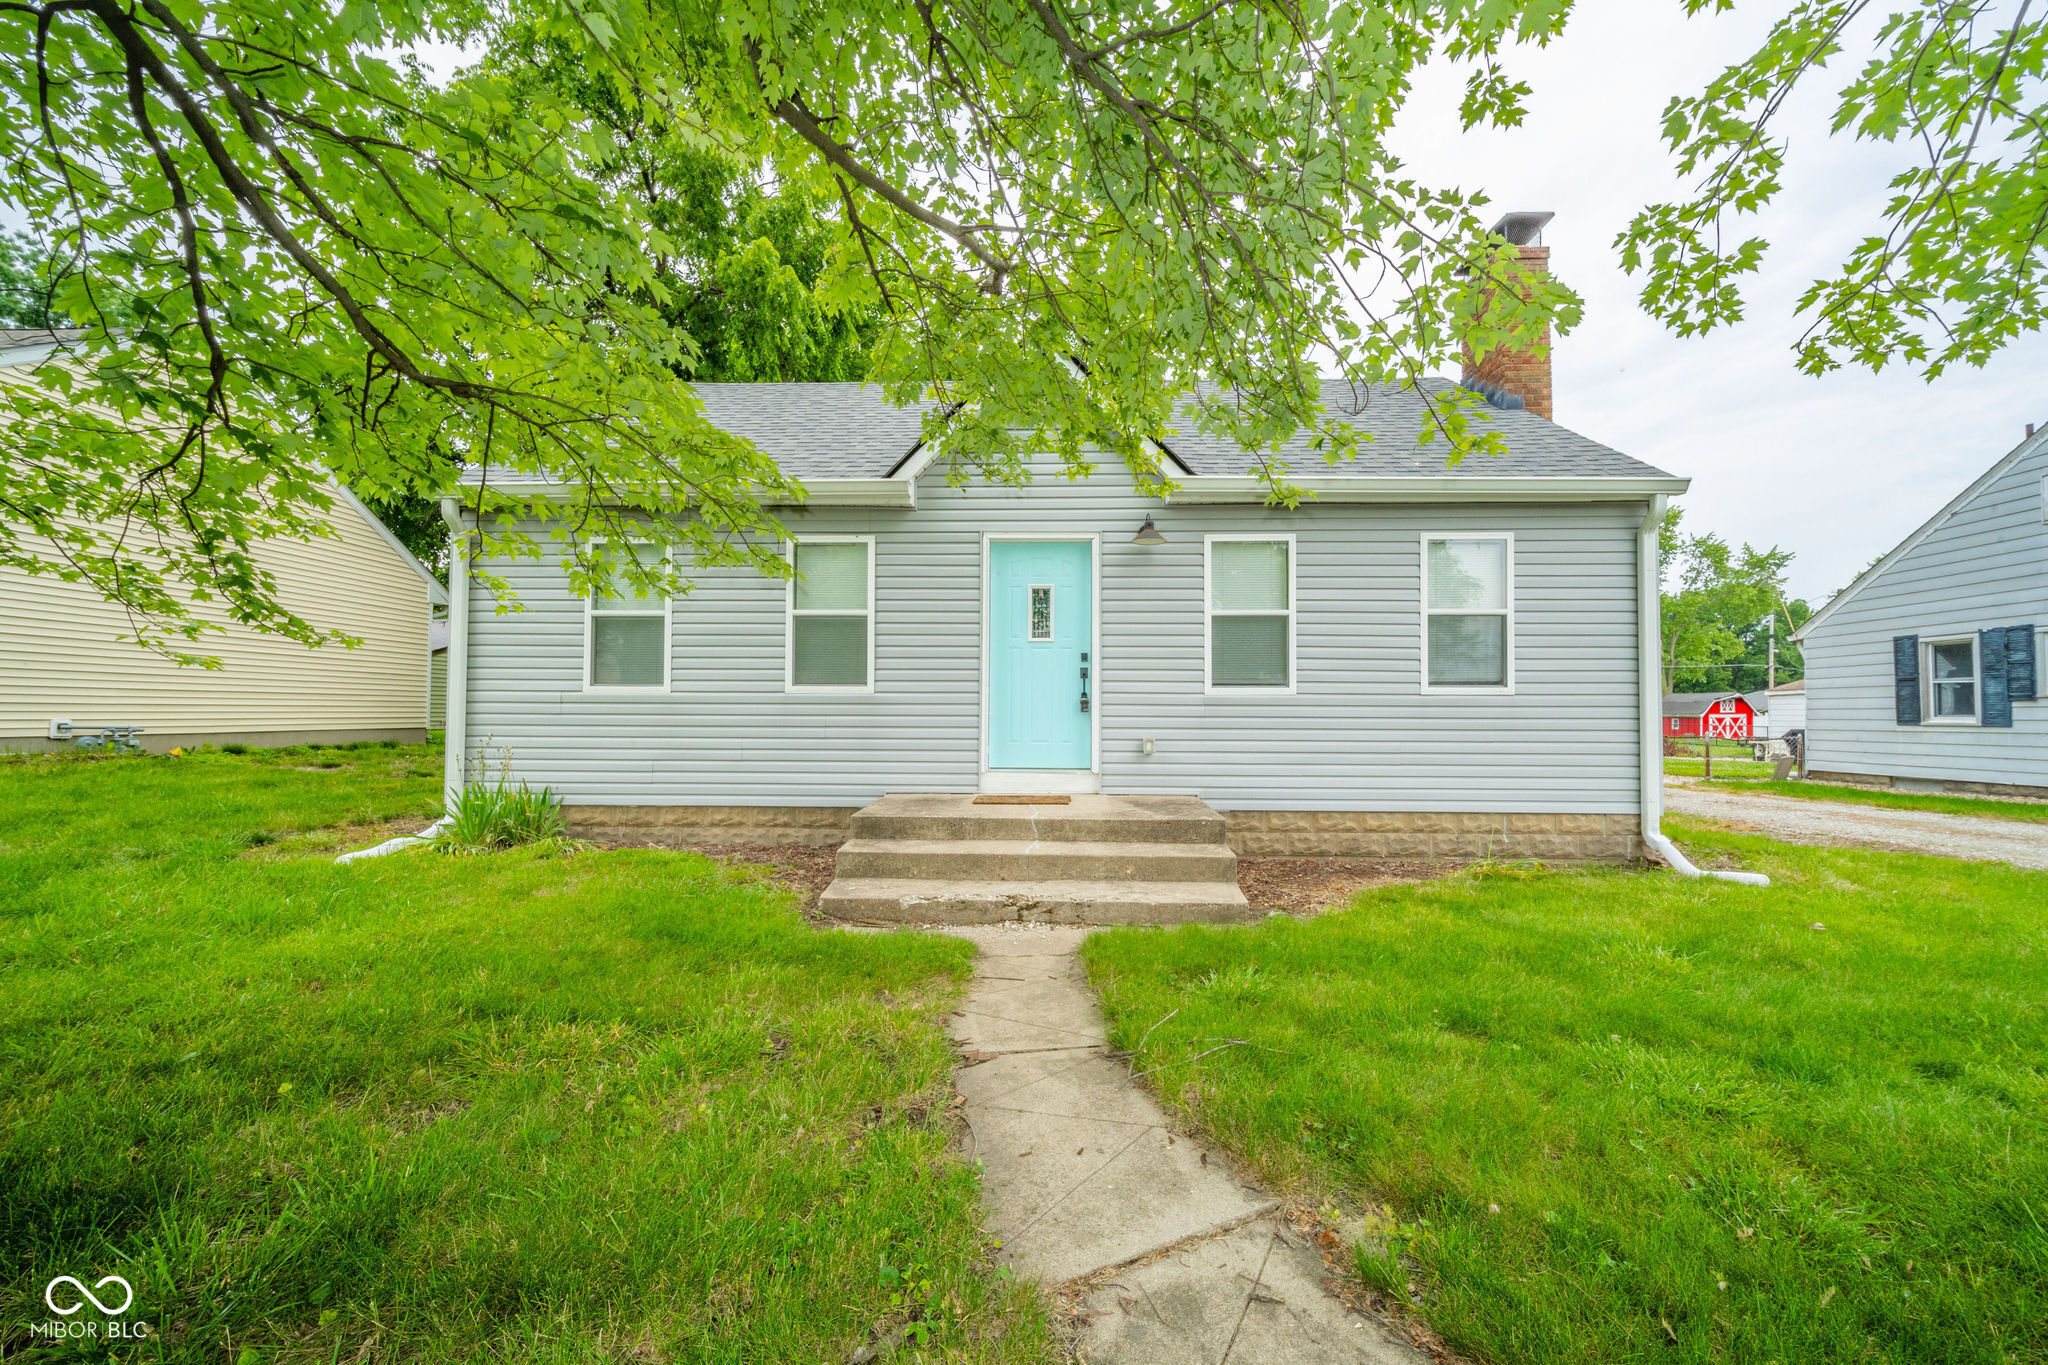
Active
$224,900
3
bds
|
1
ba
|
1,106
sqft
|
built
1940
5516 W Minnesota St, Indianapolis, IN 46241
$-5
Cash flow
-0.1%
Cash-on-Cash Return
6.3%
Cap rate
0.8%
Rent to Value Ratio
Active
$424,900
4
bds
|
4
ba
|
2,604
sqft
|
built
1920
1620 W New York St, Indianapolis, IN 46222
$535
Cash flow
6.6%
Cash-on-Cash Return
7.8%
Cap rate
0.9%
Rent to Value Ratio
Active
$324,900
3
bds
|
2
ba
|
1,762
sqft
|
built
1920
1201 Villa Ave, Indianapolis, IN 46203
$93
Cash flow
1.5%
Cash-on-Cash Return
6.6%
Cap rate
0.8%
Rent to Value Ratio
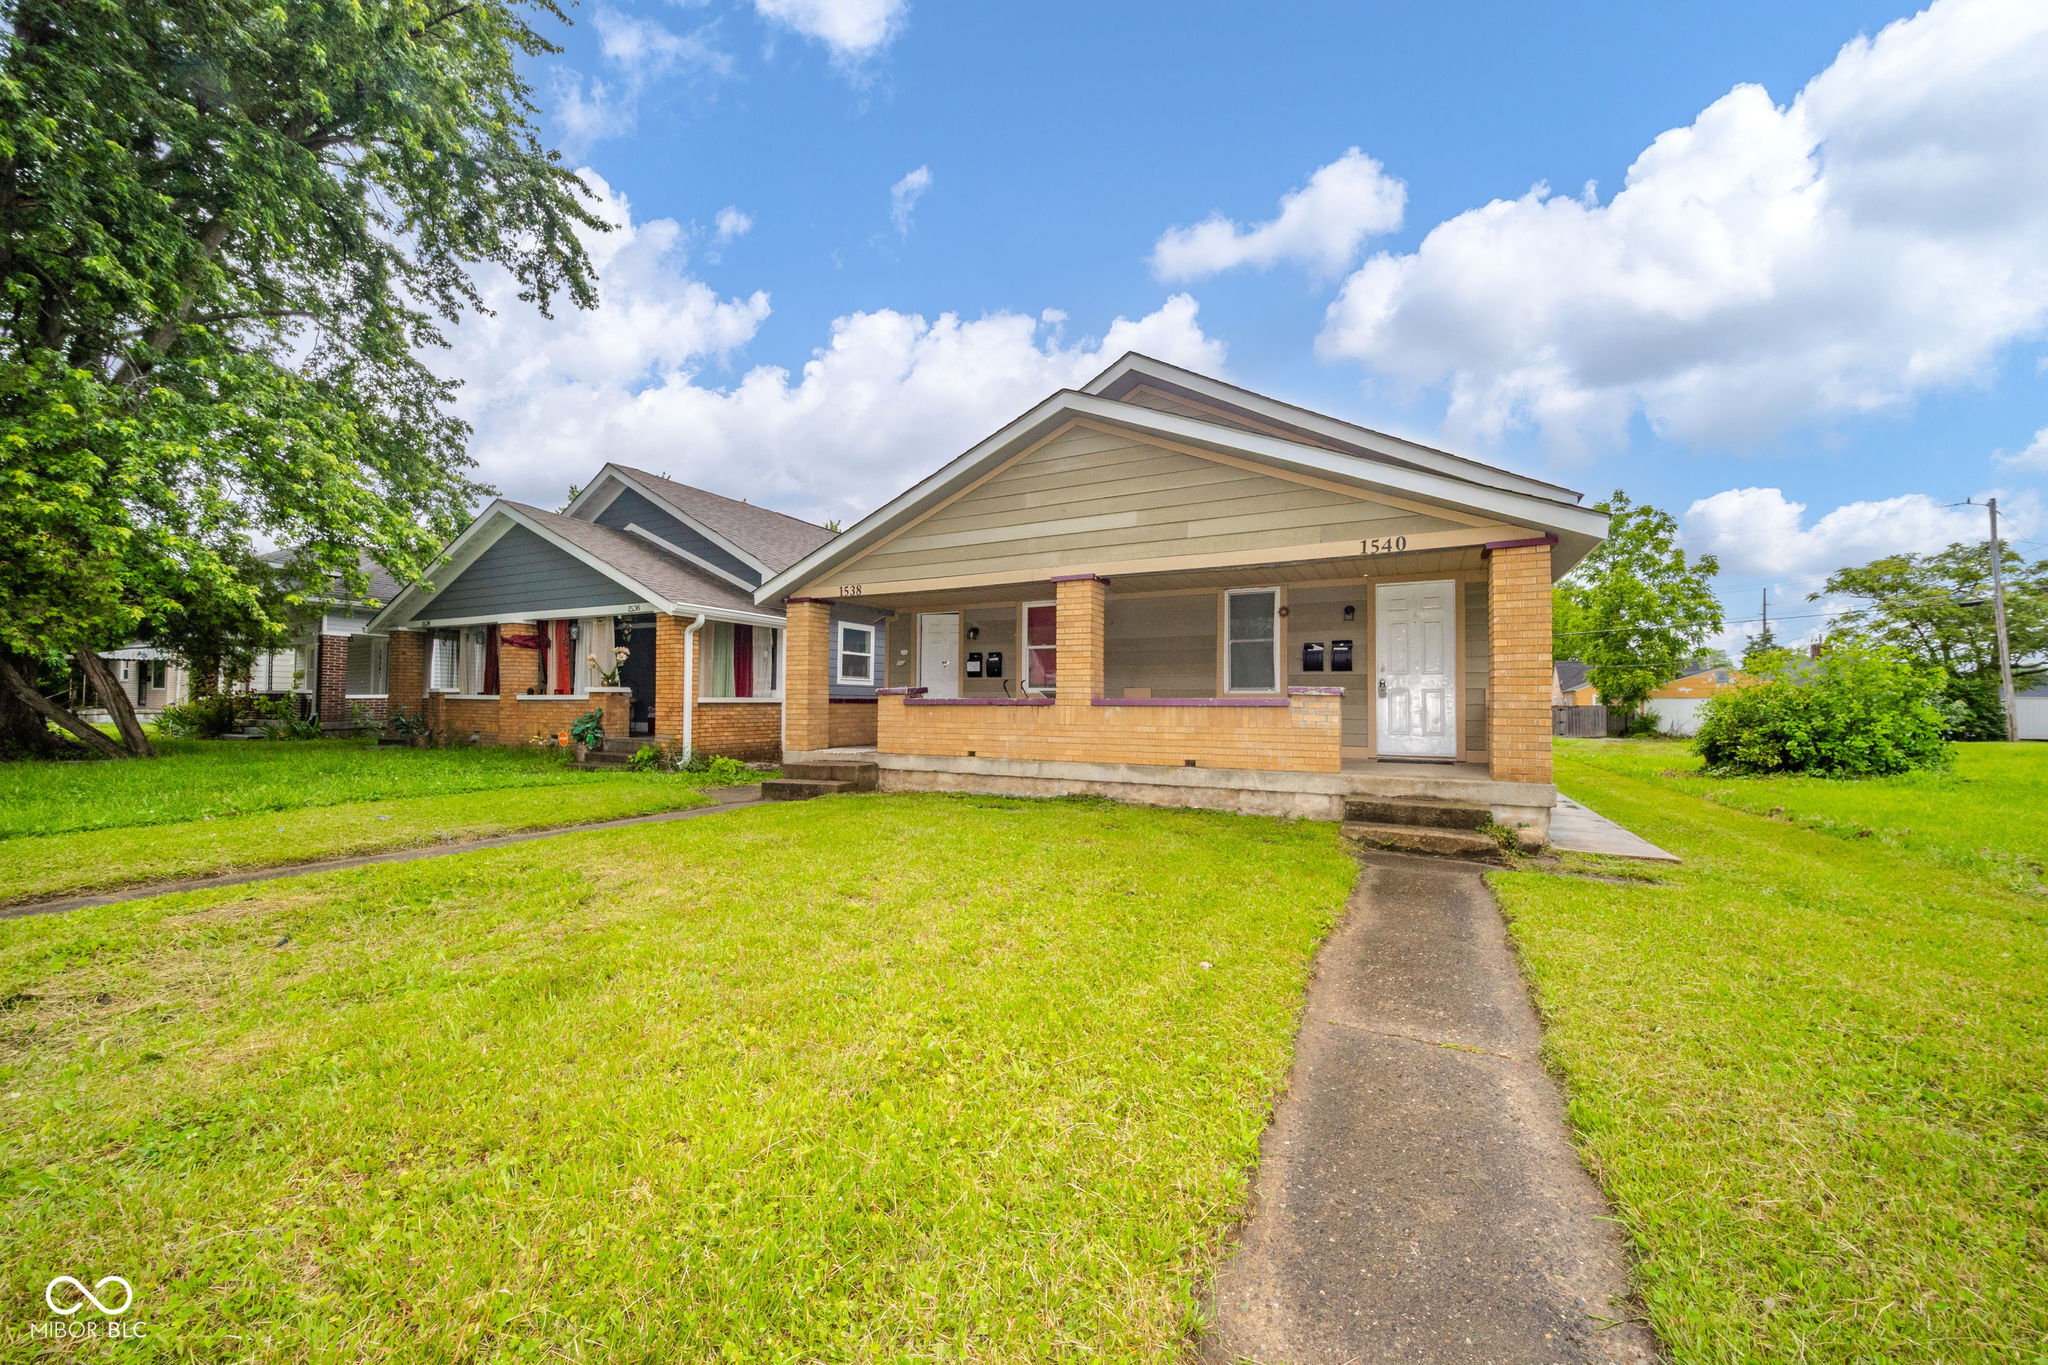
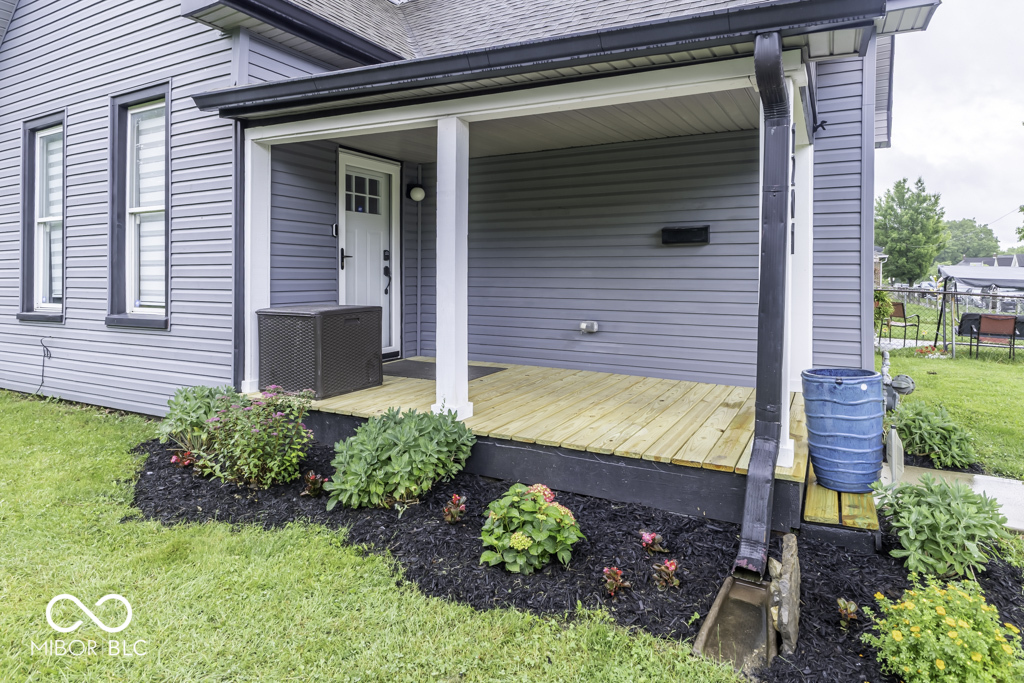
Active
$250,000
1
bds
|
0
ba
|
0
sqft
|
built
1929
1538 N Grant Ave, Indianapolis, IN 46201
$-826
Cash flow
-17.2%
Cash-on-Cash Return
2.3%
Cap rate
0.3%
Rent to Value Ratio
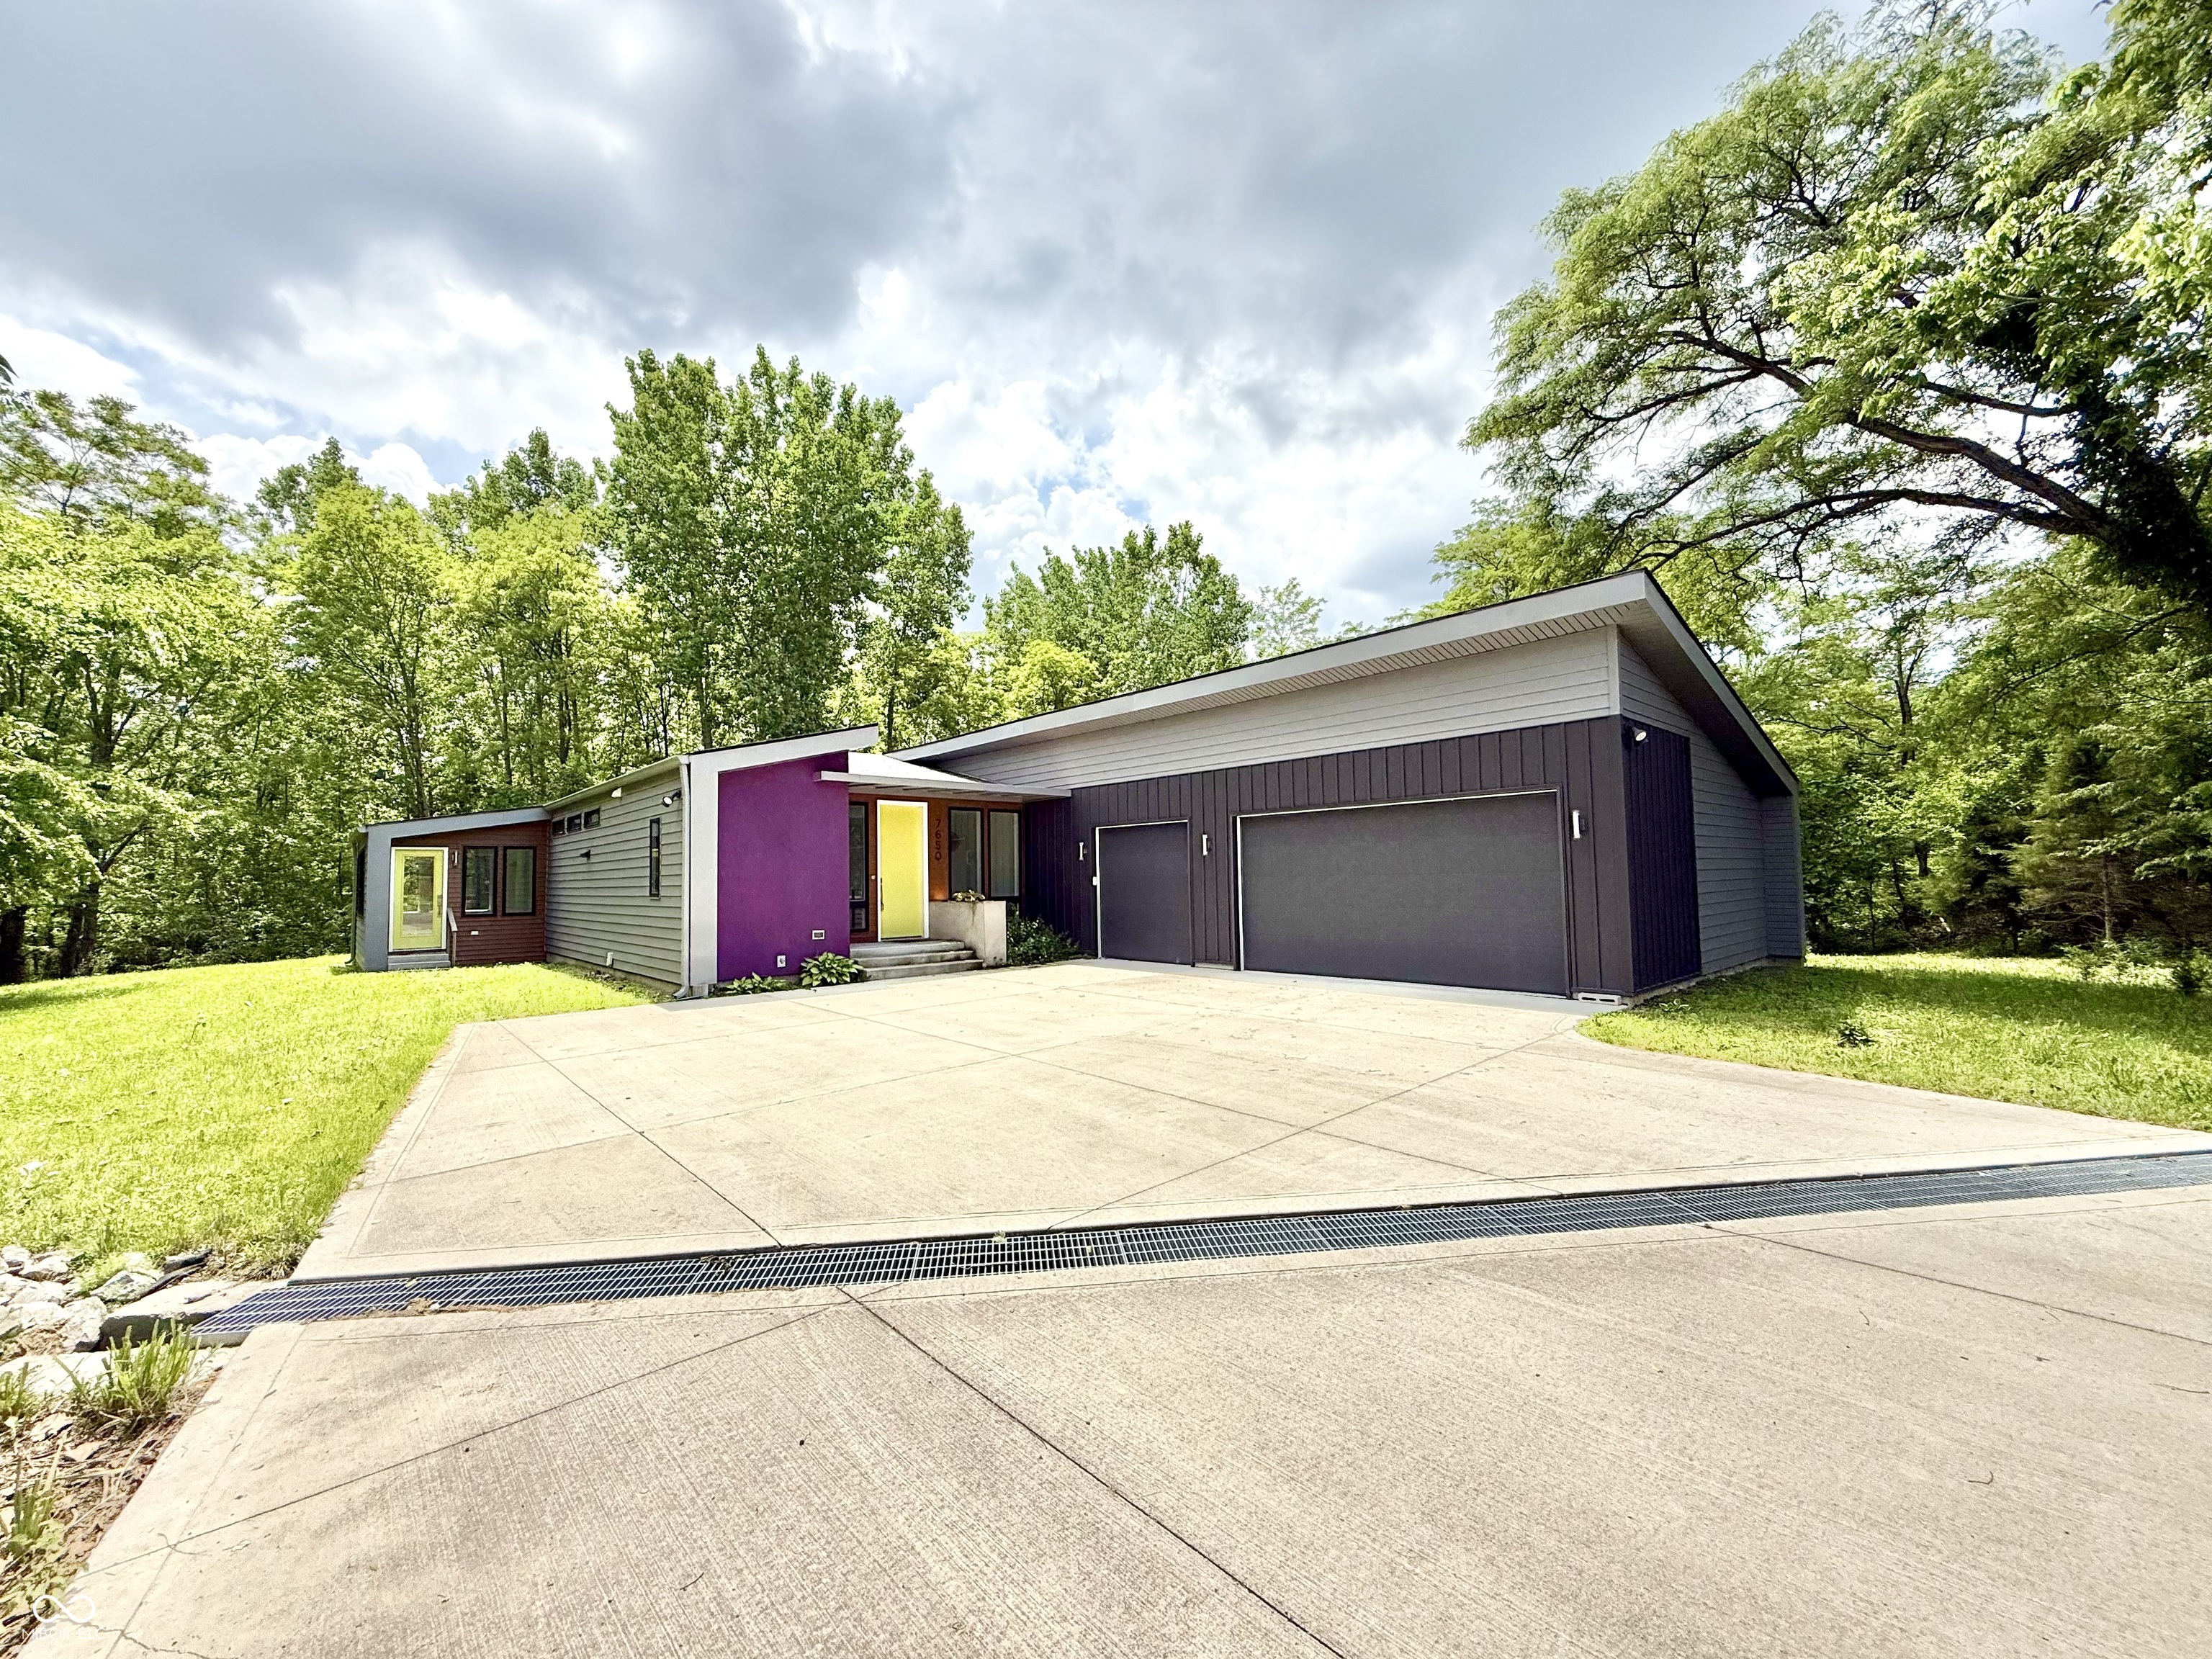
Active
$675,000
3
bds
|
3
ba
|
3,636
sqft
|
built
2020
7650 Clarion Dr, Indianapolis, IN 46236
$-16
Cash flow
-0.1%
Cash-on-Cash Return
6.3%
Cap rate
0.8%
Rent to Value Ratio
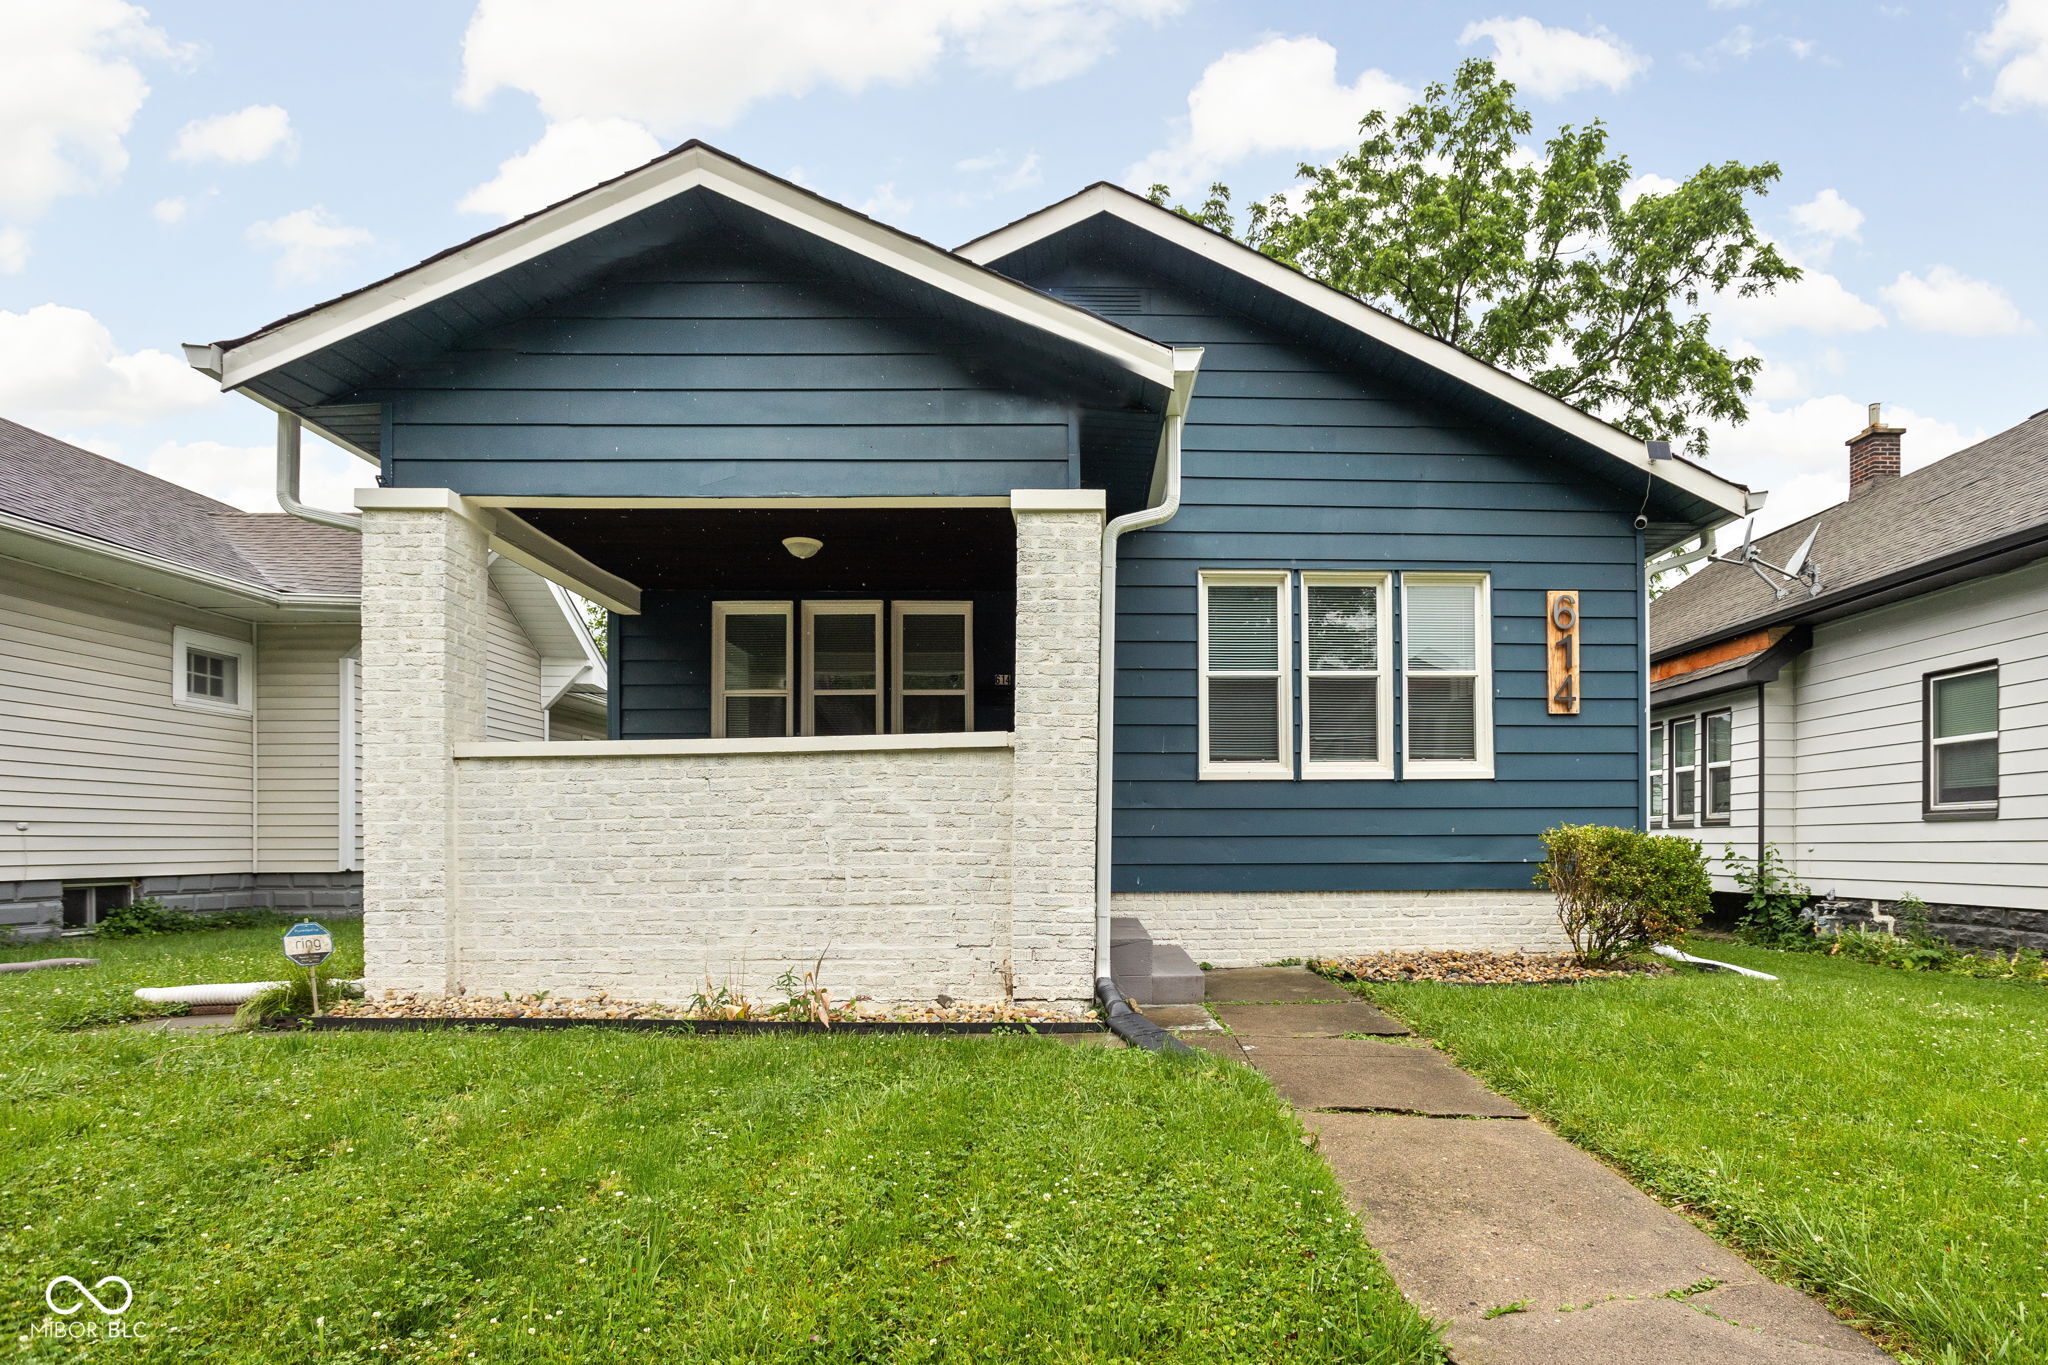
Pending
$180,000
2
bds
|
1
ba
|
945
sqft
|
built
1920
614 N Drexel Ave, Indianapolis, IN 46201
$161
Cash flow
4.7%
Cash-on-Cash Return
7.4%
Cap rate
0.9%
Rent to Value Ratio
Active
$180,000
3
bds
|
2
ba
|
1,750
sqft
|
built
1950
196 Bakemeyer St, Indianapolis, IN 46225
$161
Cash flow
4.7%
Cash-on-Cash Return
7.4%
Cap rate
0.9%
Rent to Value Ratio
Active
$215,000
3
bds
|
2
ba
|
1,176
sqft
|
built
1999
10922 Snowdrop Way, Indianapolis, IN 46235
$87
Cash flow
2.1%
Cash-on-Cash Return
6.8%
Cap rate
0.8%
Rent to Value Ratio
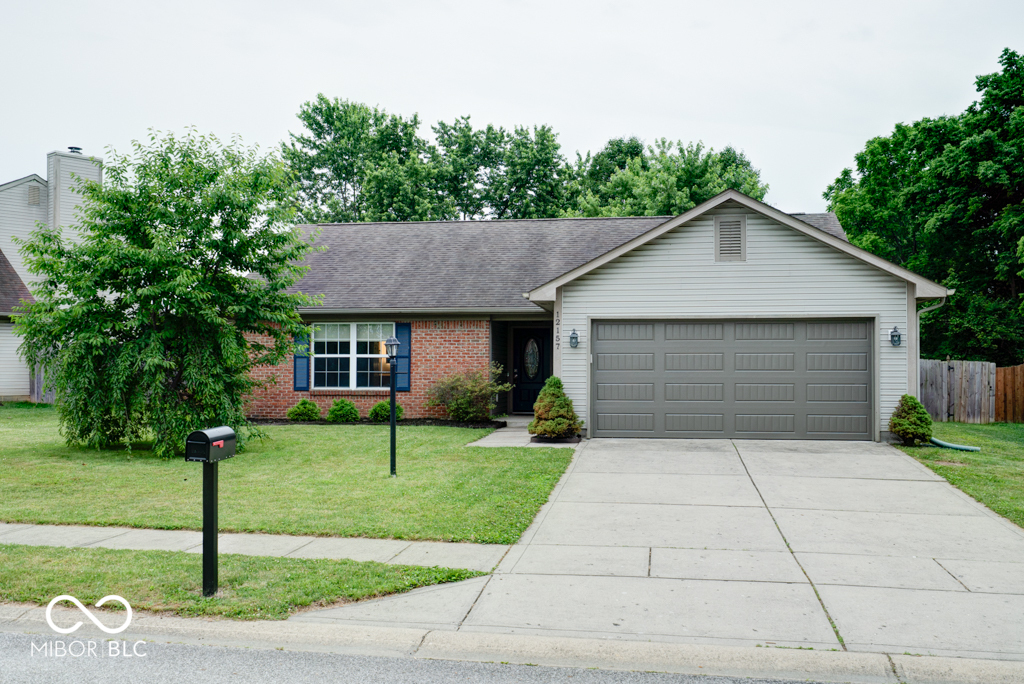
Active
$294,900
3
bds
|
2
ba
|
1,264
sqft
|
built
1994
12157 Longstraw Dr, Indianapolis, IN 46236
$-176
Cash flow
-3.1%
Cash-on-Cash Return
5.6%
Cap rate
0.7%
Rent to Value Ratio
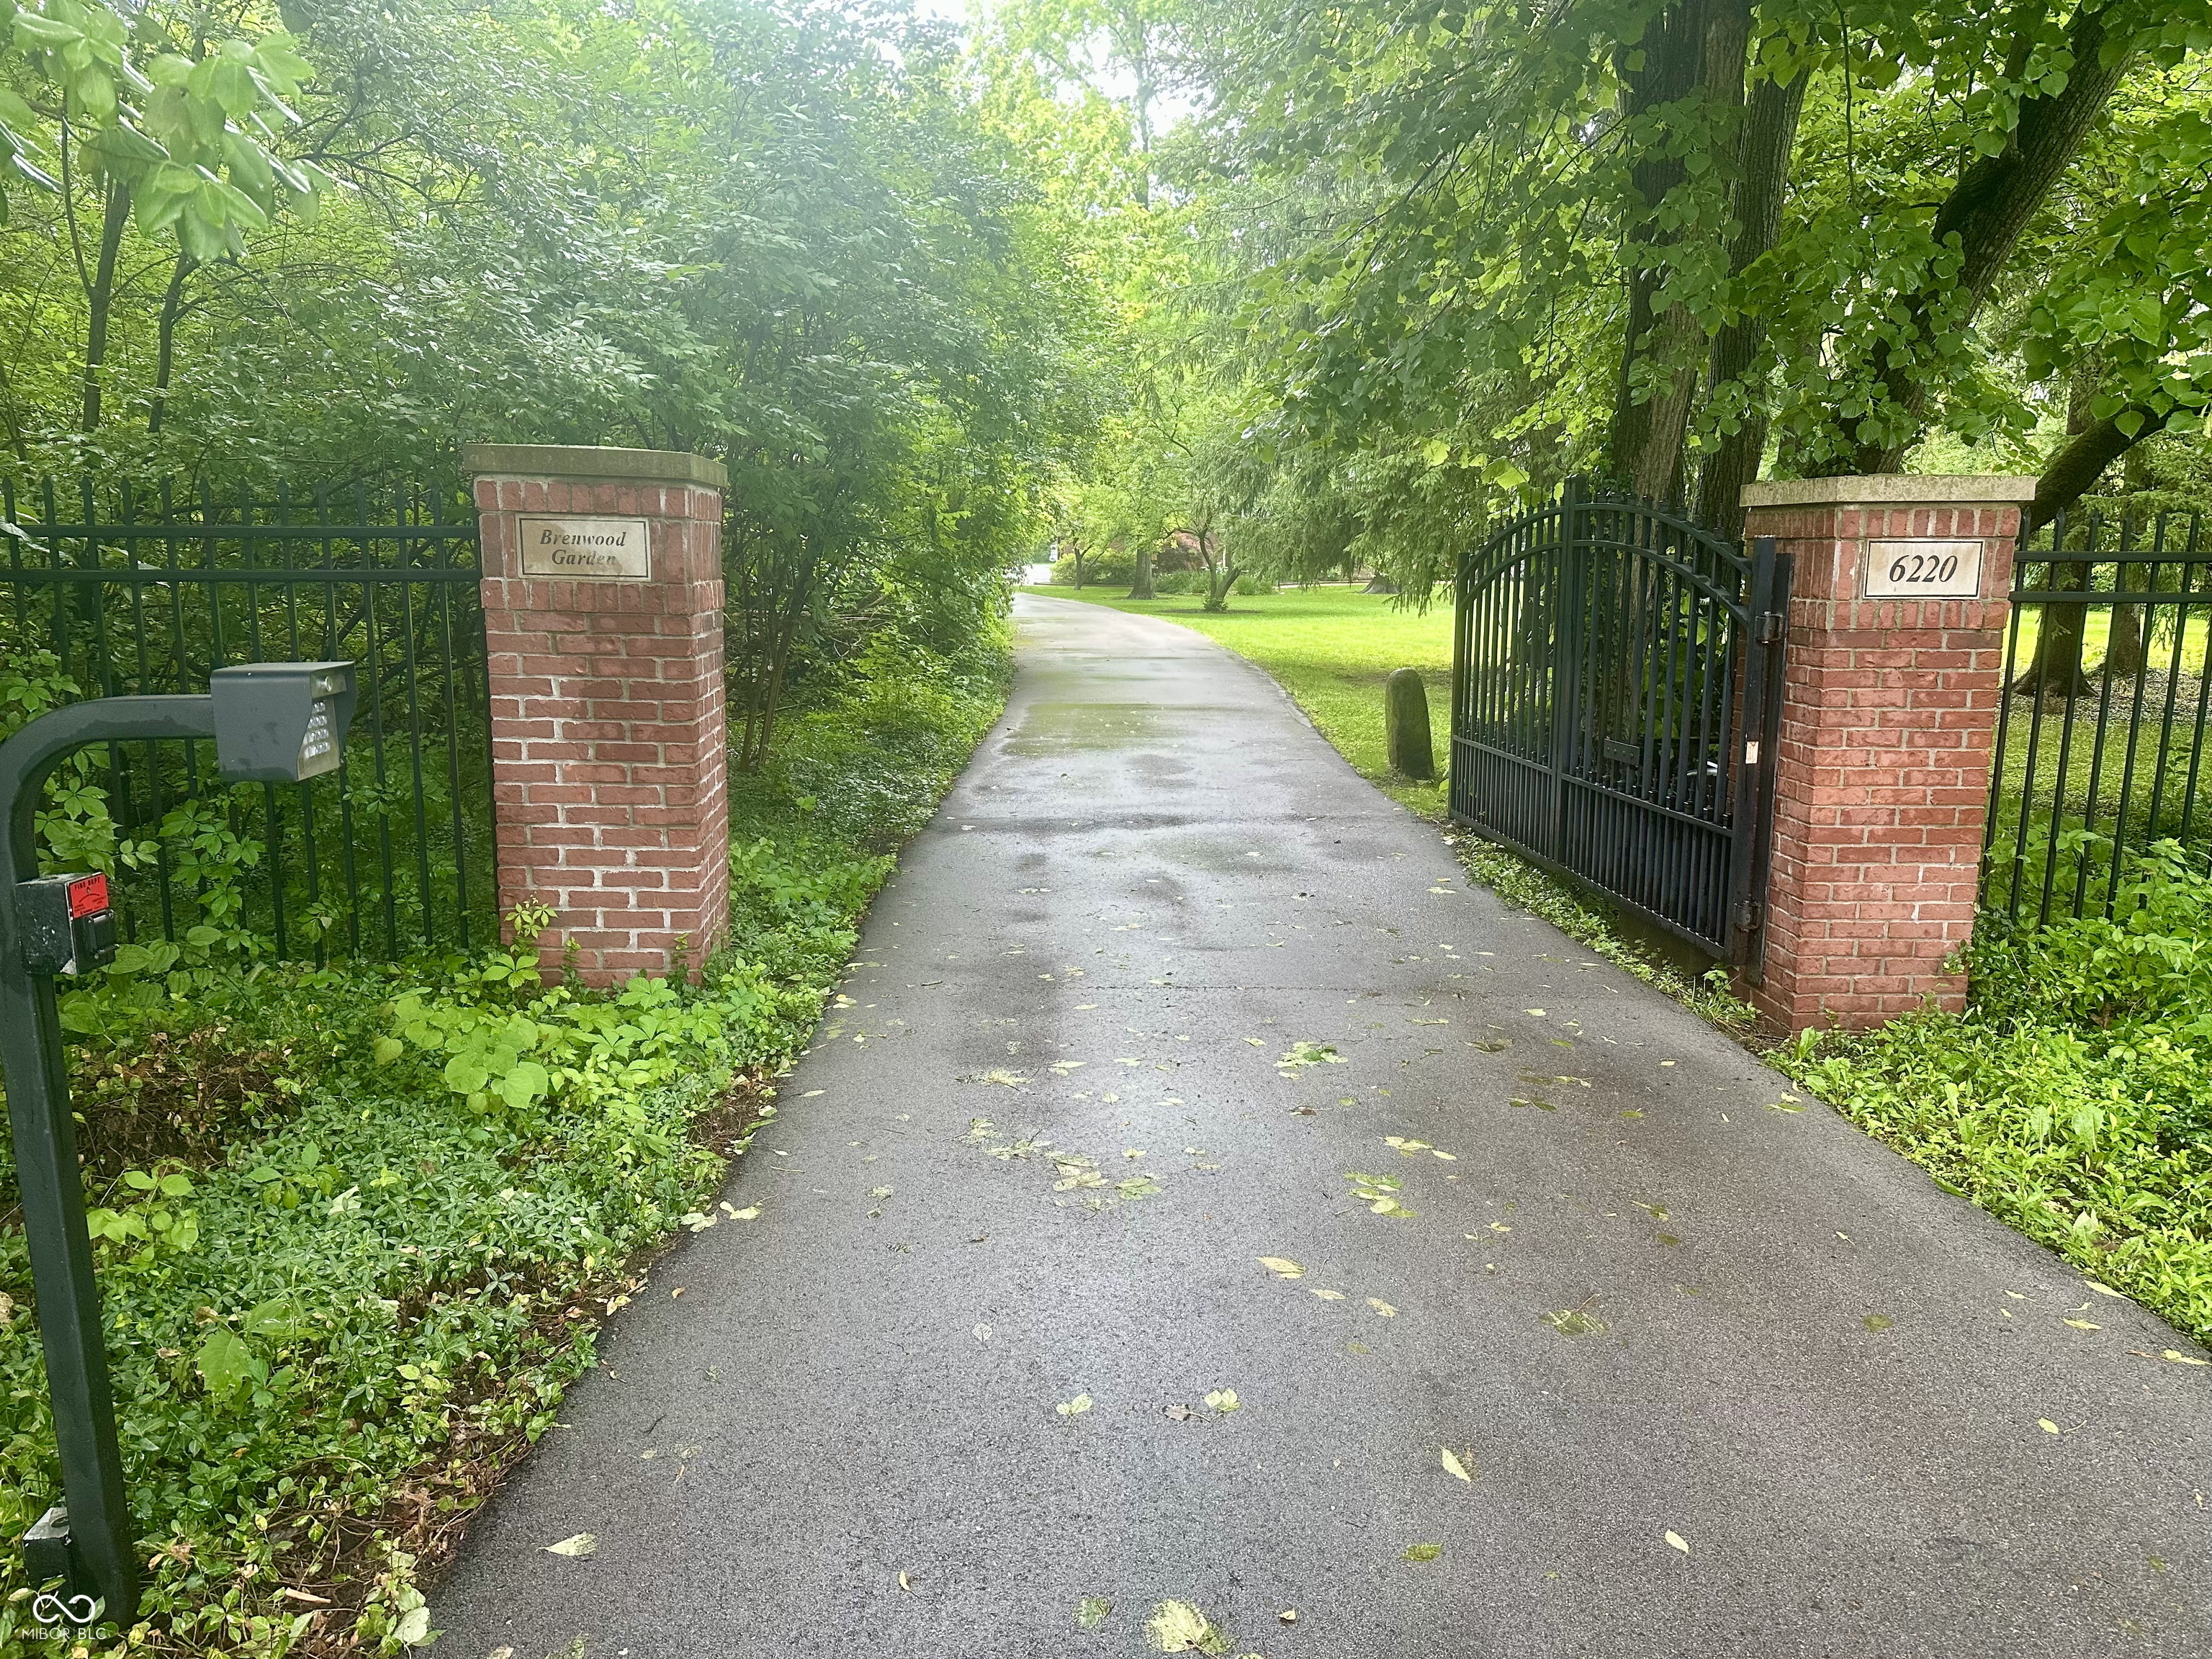
Pending
$875,000
5
bds
|
4
ba
|
4,434
sqft
|
built
1949
6220 E 56th St, Indianapolis, IN 46226
$-2,258
Cash flow
-13.5%
Cash-on-Cash Return
3.2%
Cap rate
0.5%
Rent to Value Ratio
Active
$230,000
3
bds
|
2
ba
|
1,355
sqft
|
built
2000
540 Cahill Ln, Indianapolis, IN 46214
$1
Cash flow
0.0%
Cash-on-Cash Return
6.3%
Cap rate
0.8%
Rent to Value Ratio
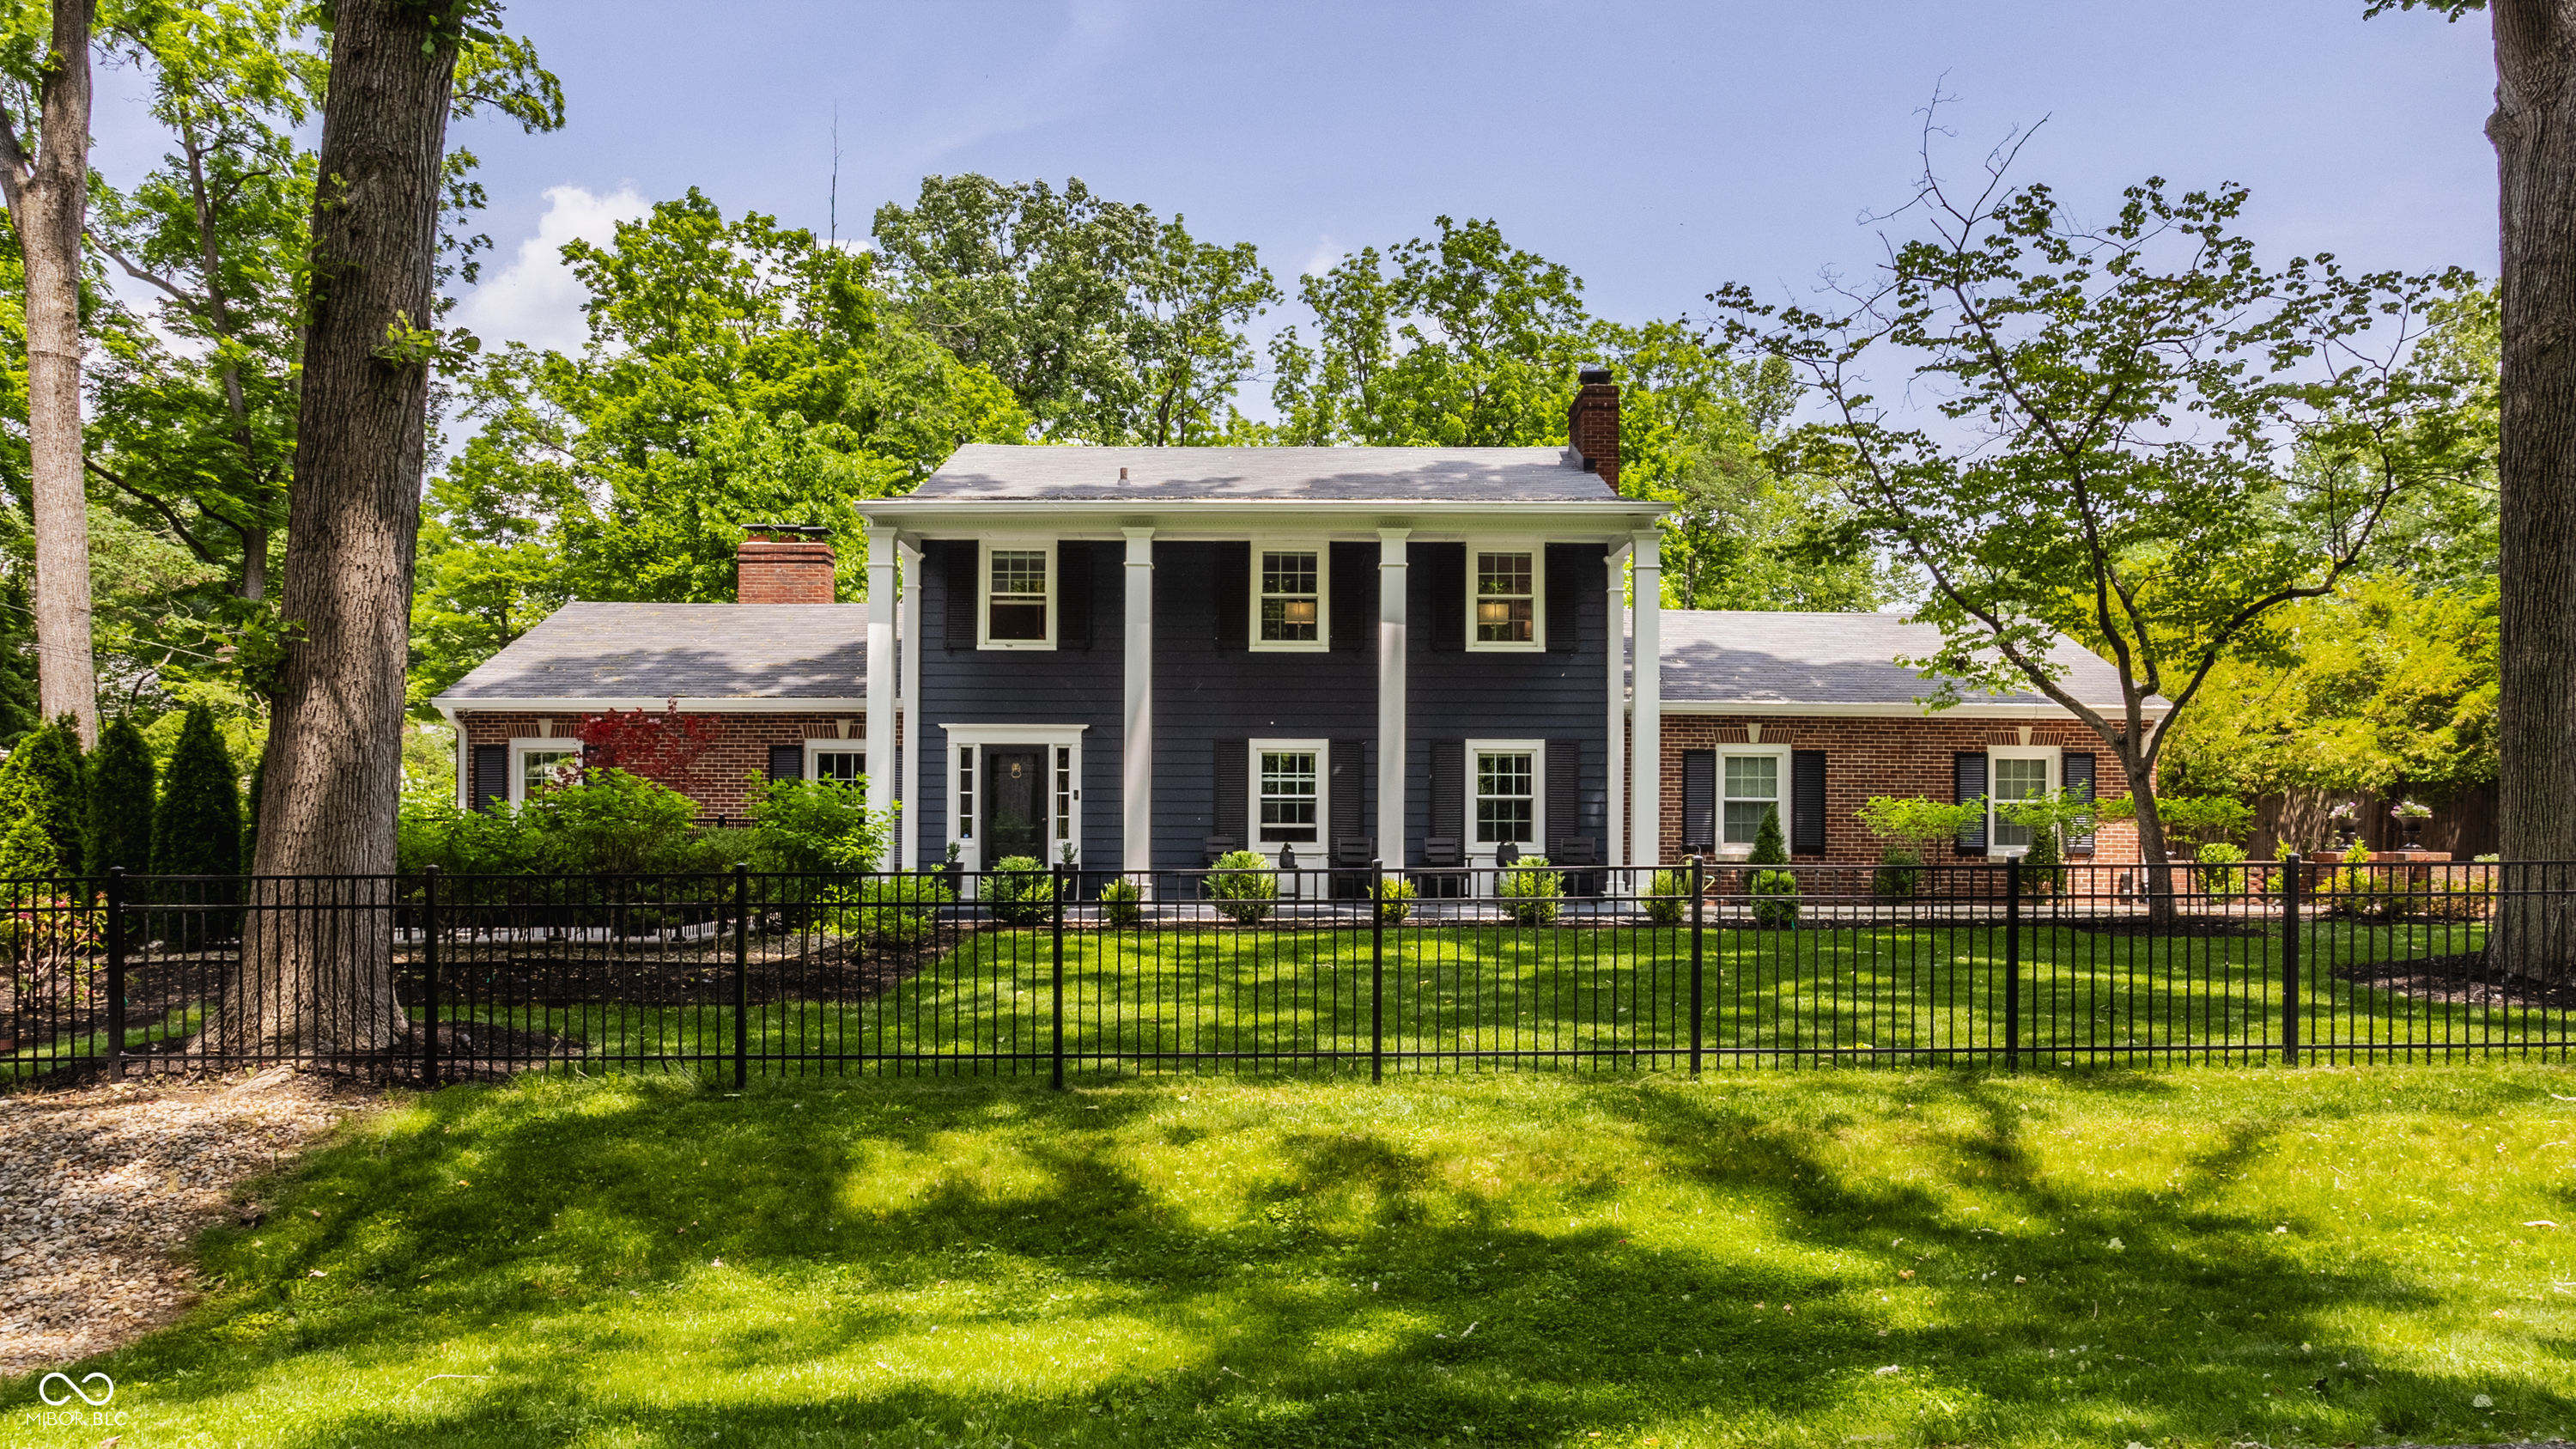
Active
$850,000
4
bds
|
3
ba
|
3,627
sqft
|
built
1956
654 E 79th St, Indianapolis, IN 46240
$-1,277
Cash flow
-7.8%
Cash-on-Cash Return
4.5%
Cap rate
0.5%
Rent to Value Ratio
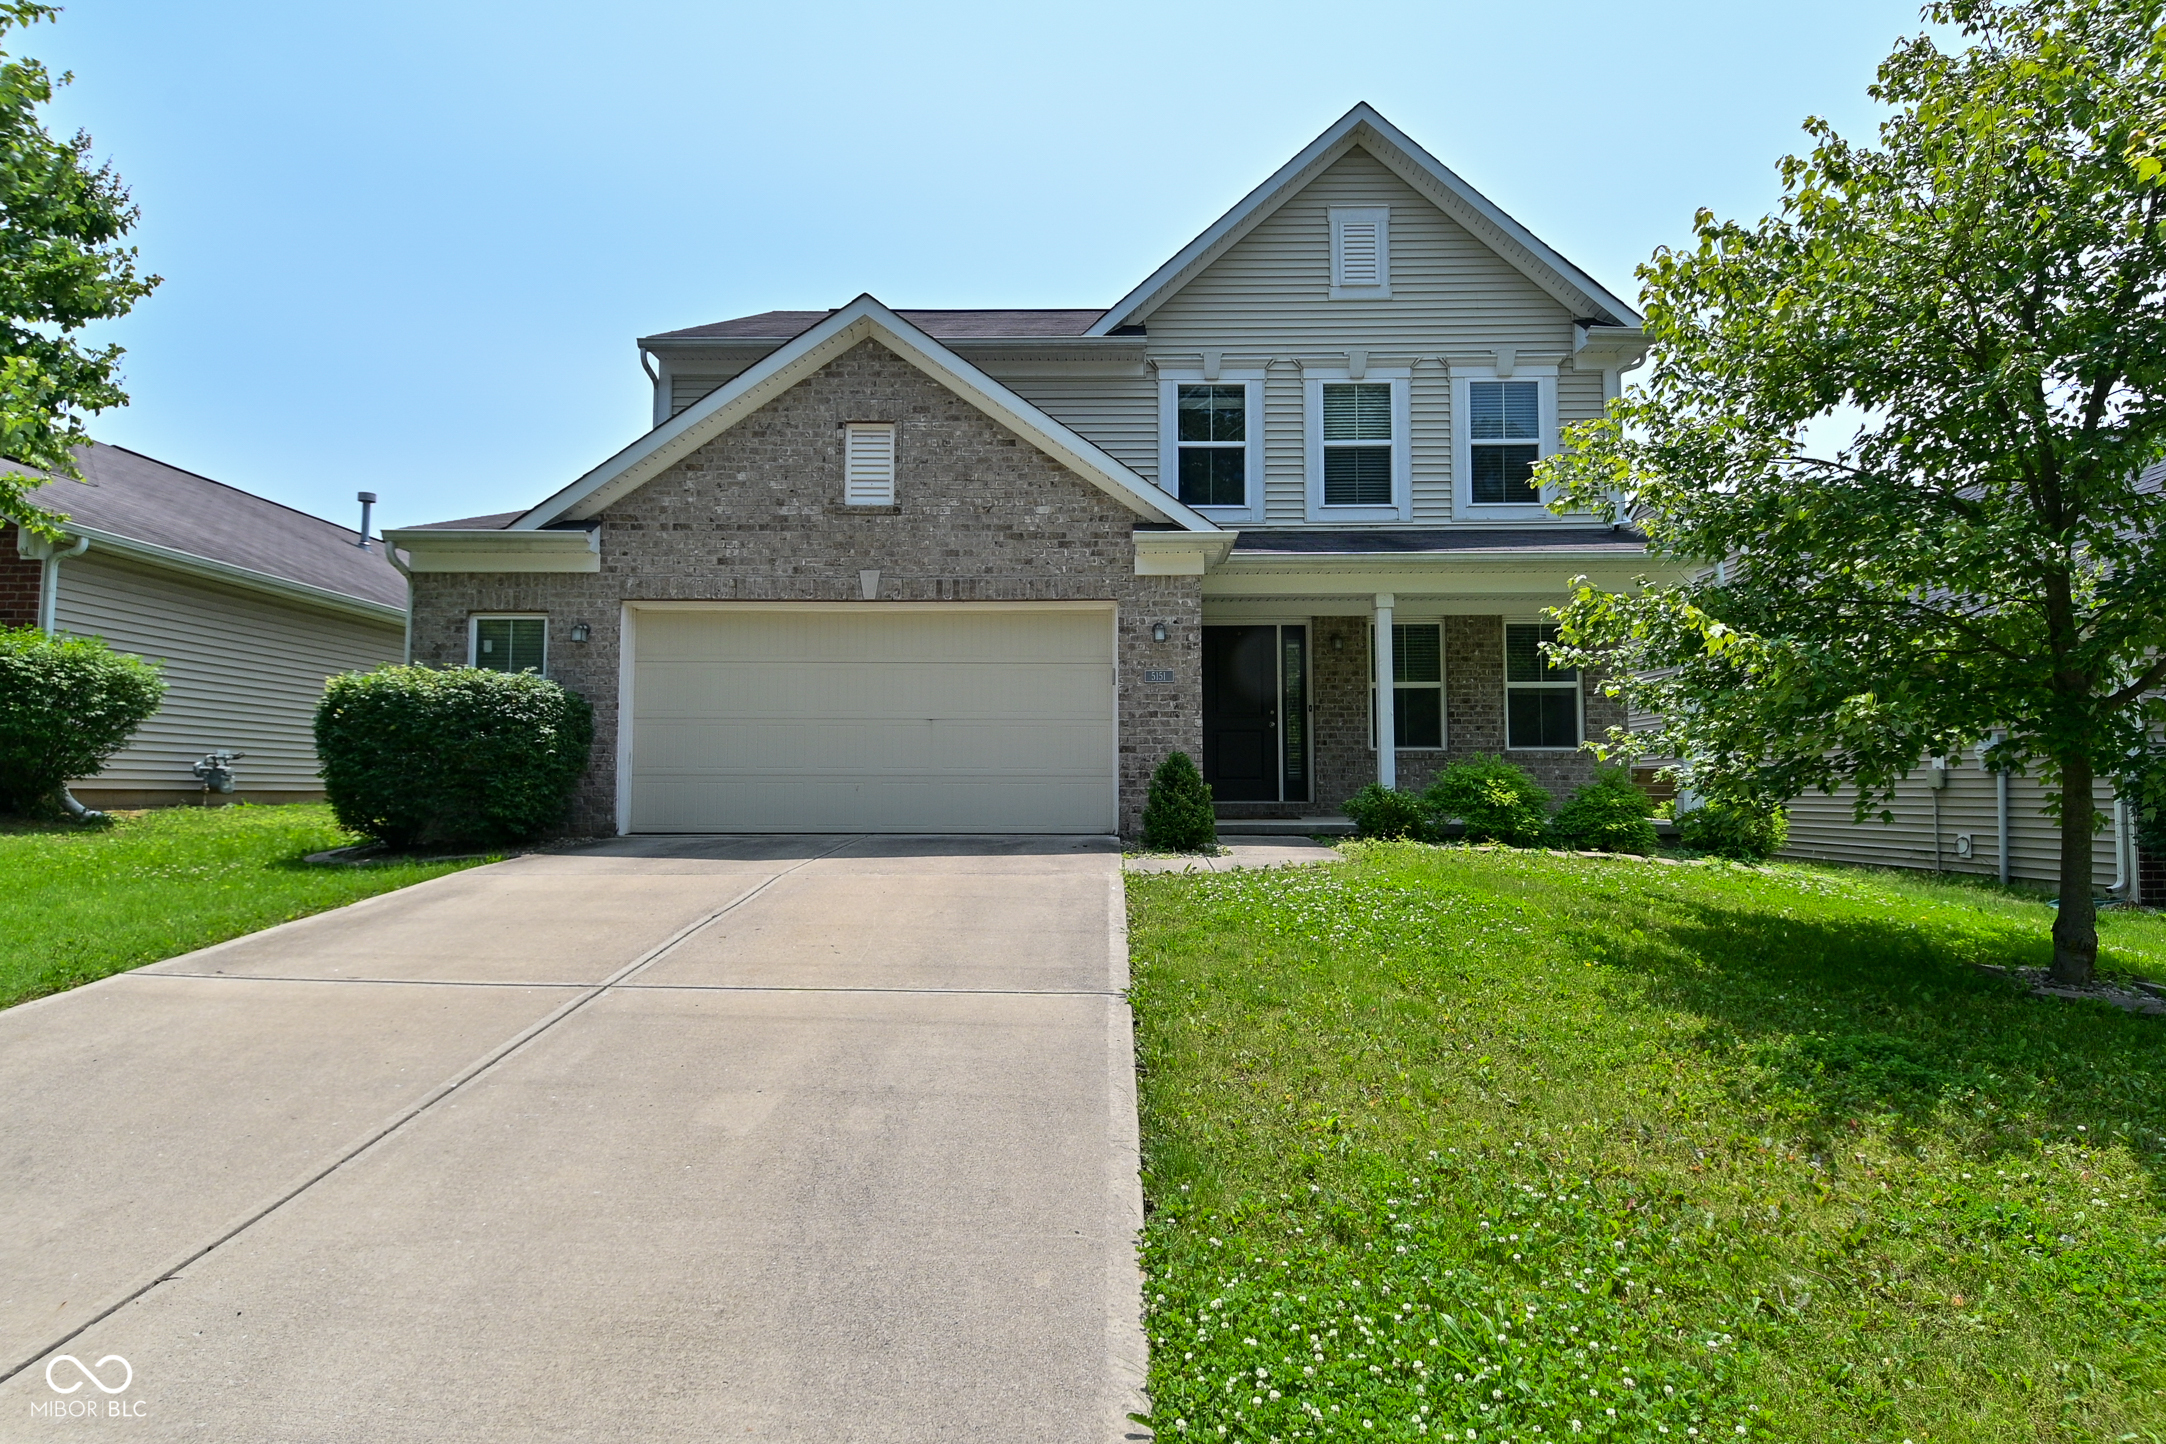
Active
$315,000
3
bds
|
3
ba
|
2,004
sqft
|
built
2011
5151 Climbing Rose Pl, Indianapolis, IN 46254
$-88
Cash flow
-1.5%
Cash-on-Cash Return
6.0%
Cap rate
0.7%
Rent to Value Ratio
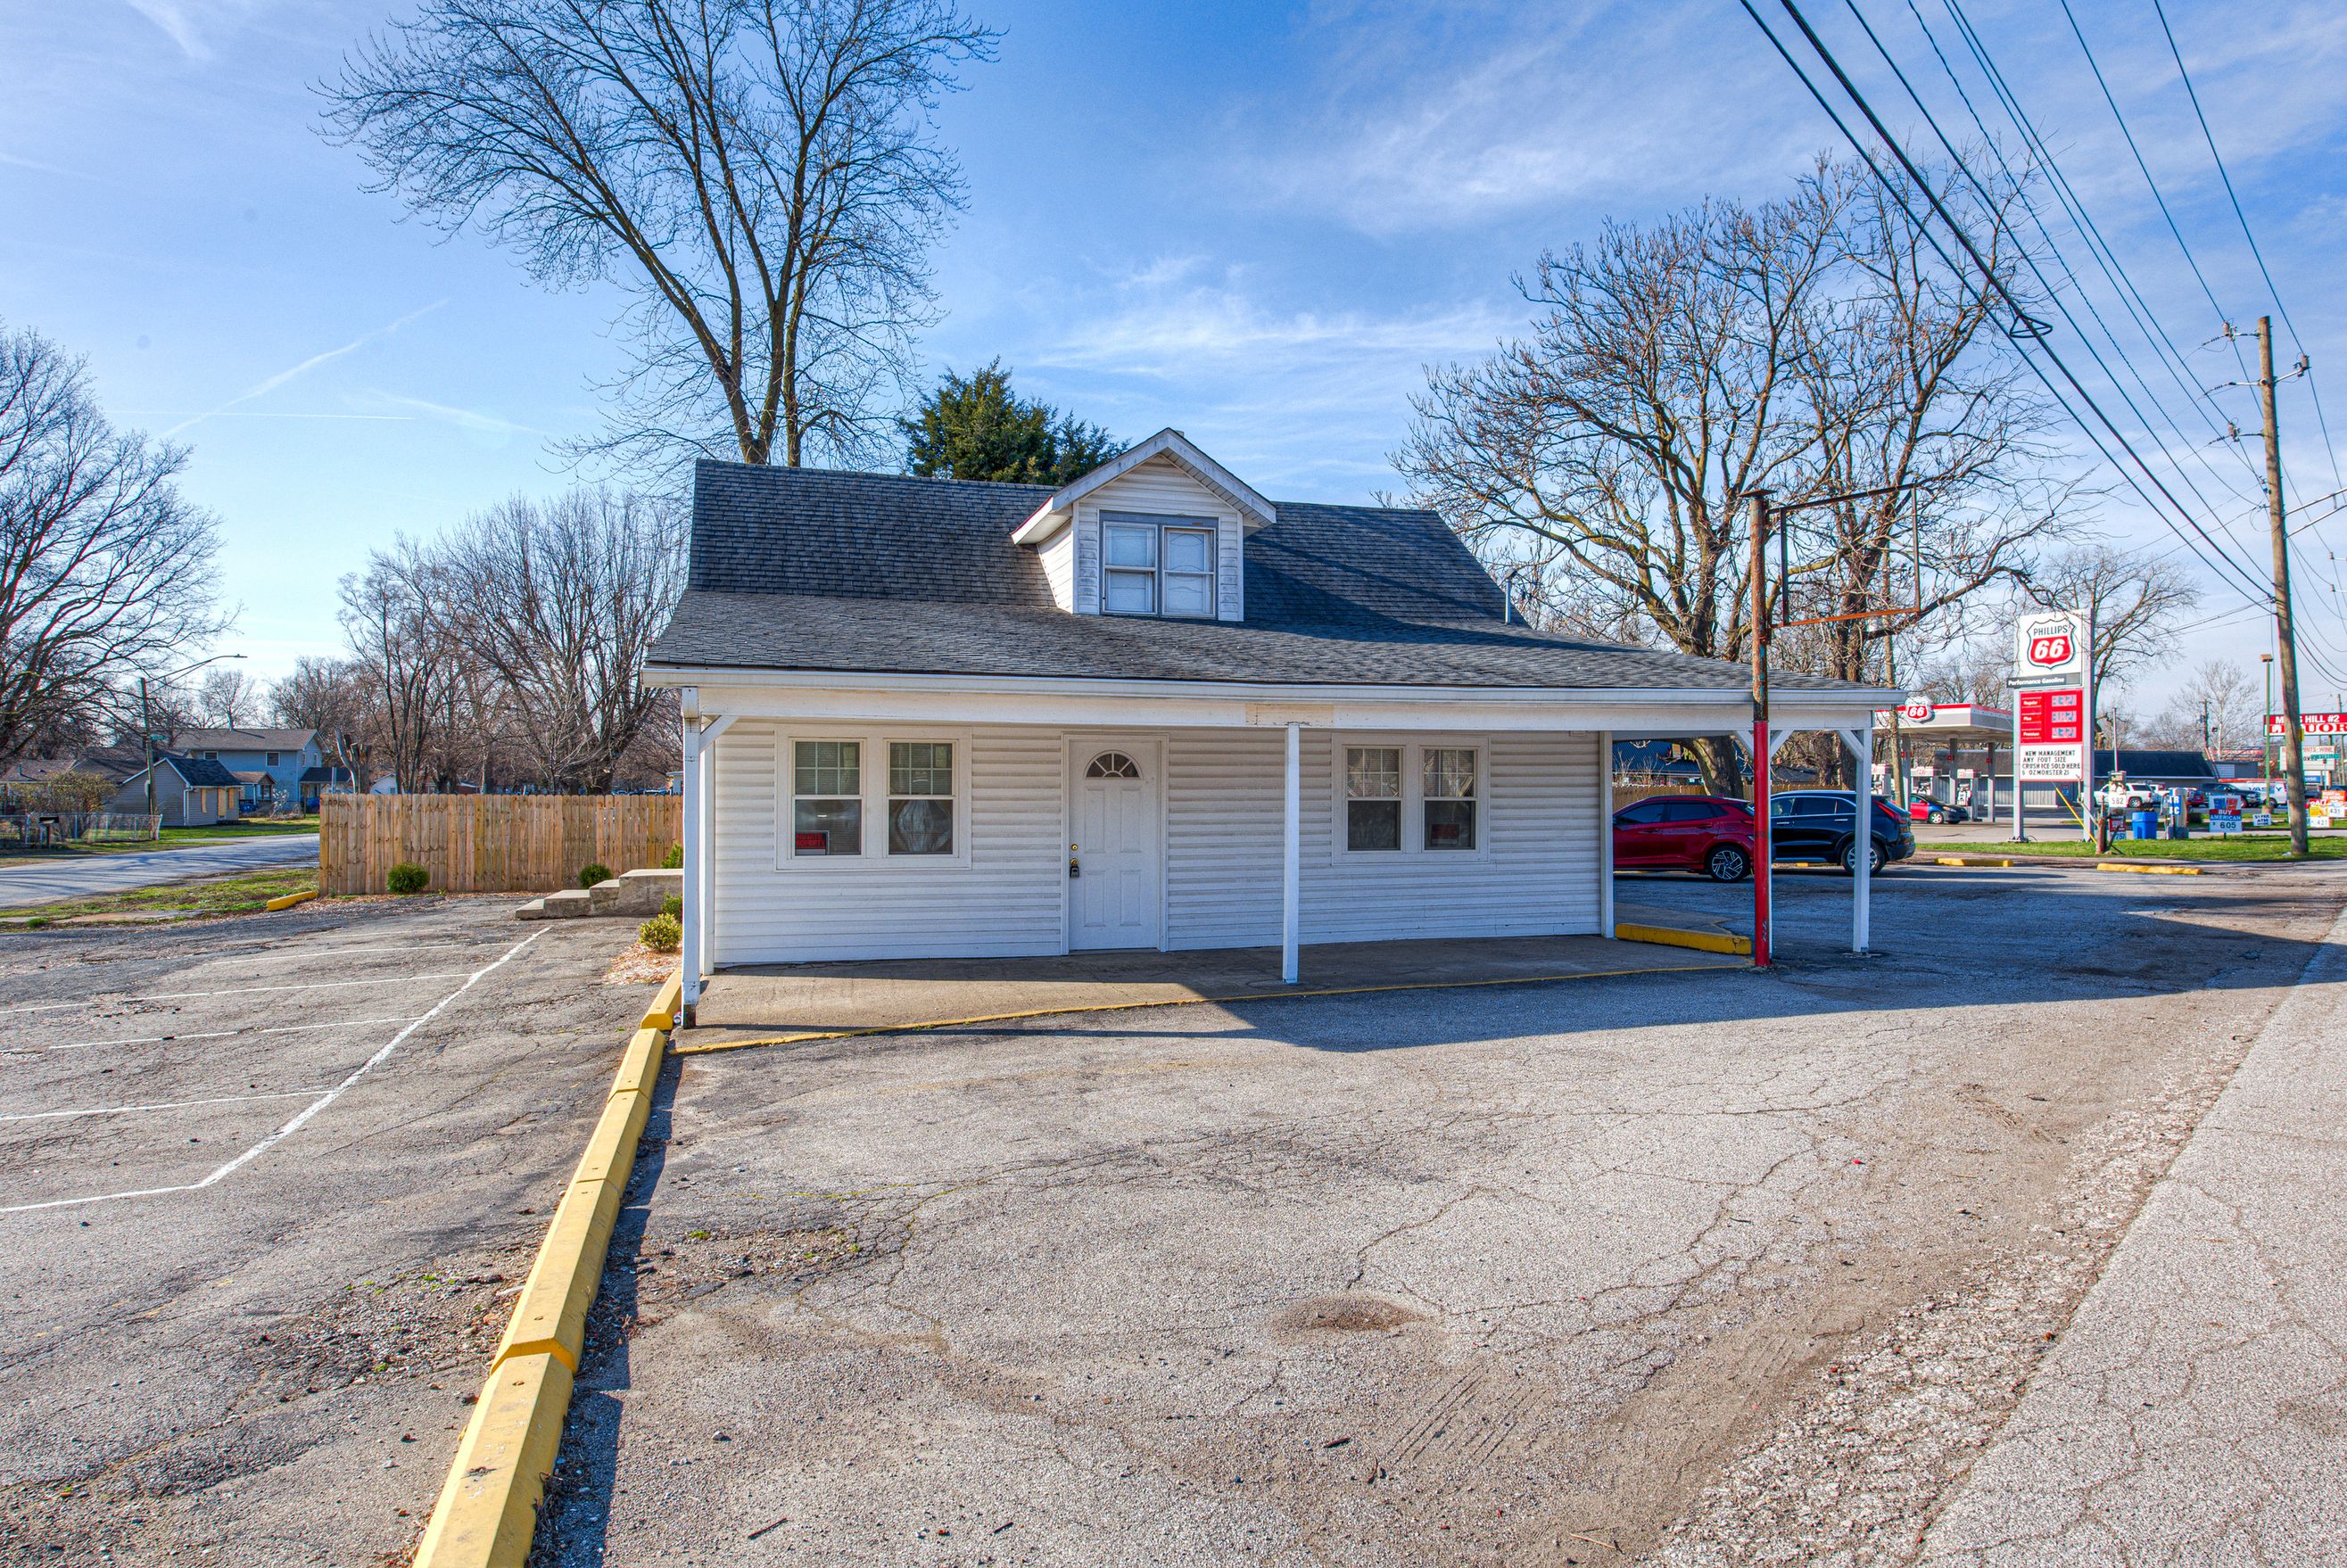
Active
$254,900
bds
|
0
ba
|
0
sqft
|
built
1939
3135 Kentucky Ave, Indianapolis, IN 46221
$-369
Cash flow
-7.6%
Cash-on-Cash Return
4.5%
Cap rate
0.5%
Rent to Value Ratio
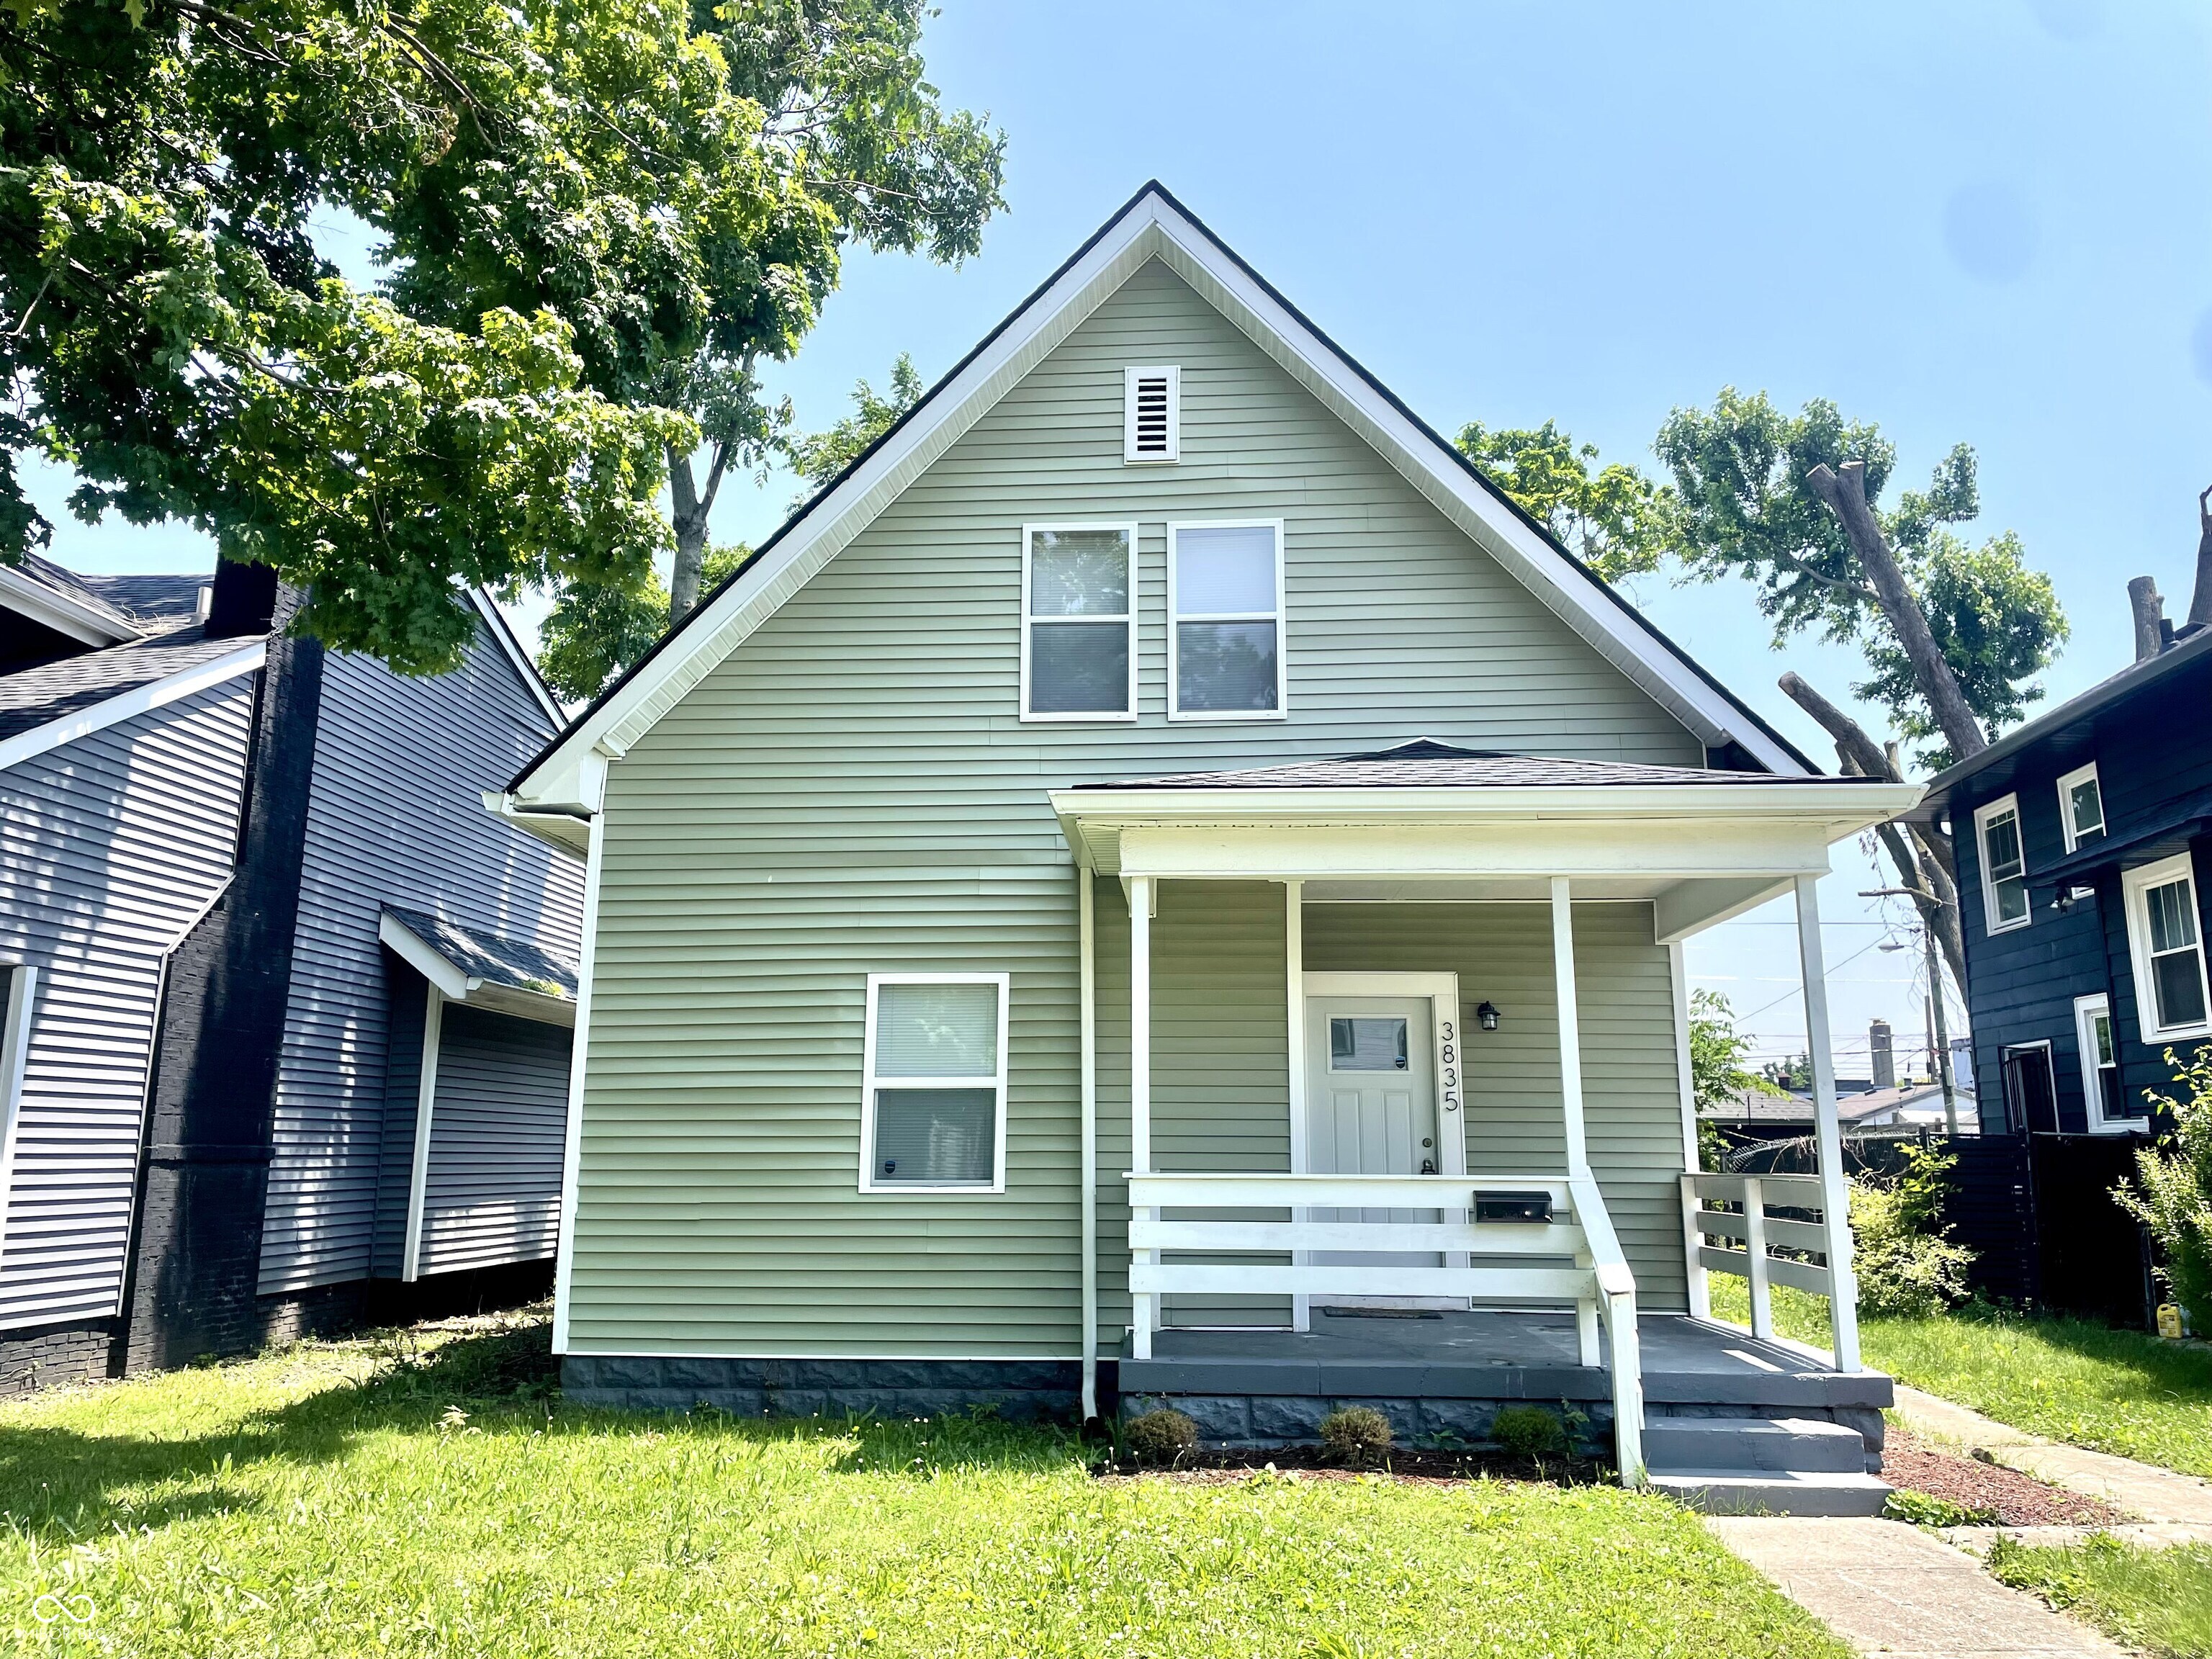
Active
$239,900
3
bds
|
3
ba
|
1,644
sqft
|
built
1906
3835 N Kenwood Ave, Indianapolis, IN 46208
$-497
Cash flow
-10.8%
Cash-on-Cash Return
3.8%
Cap rate
0.5%
Rent to Value Ratio
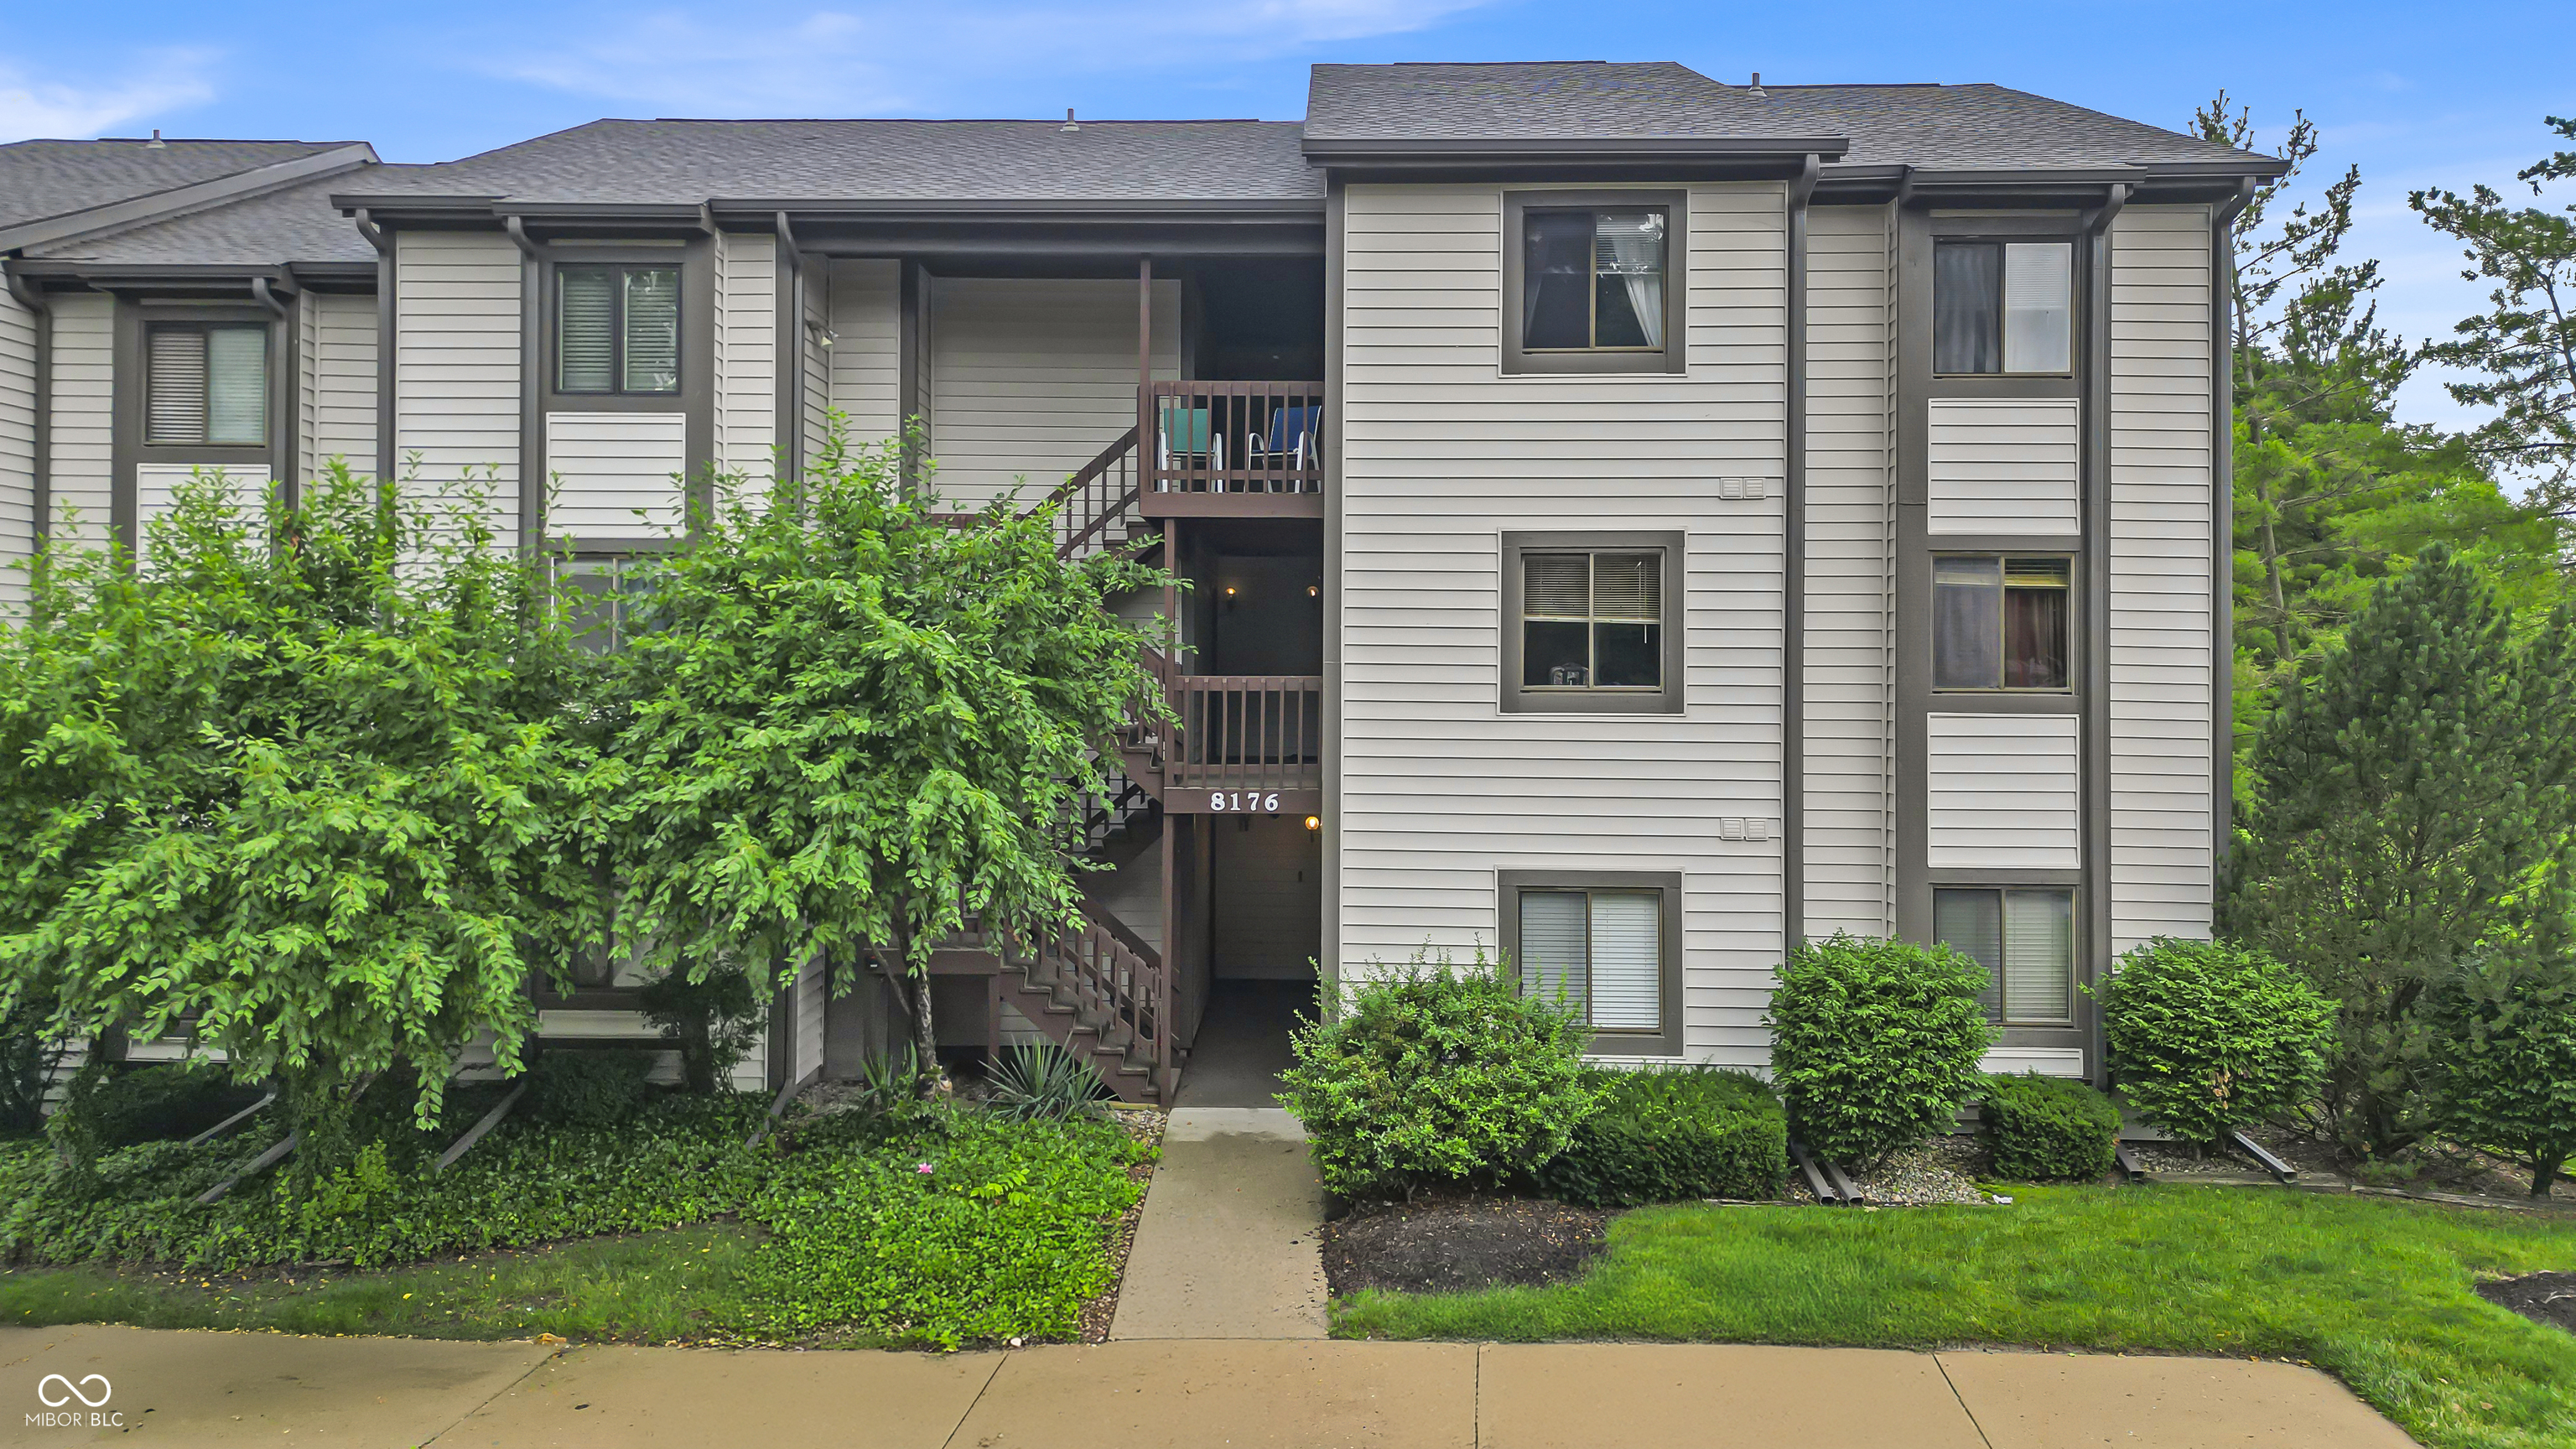
Active
$170,000
1
bds
|
1
ba
|
876
sqft
|
built
1990
8176 Shorewalk Dr, Indianapolis, IN 46236
$-314
Cash flow
-9.6%
Cash-on-Cash Return
4.1%
Cap rate
0.8%
Rent to Value Ratio
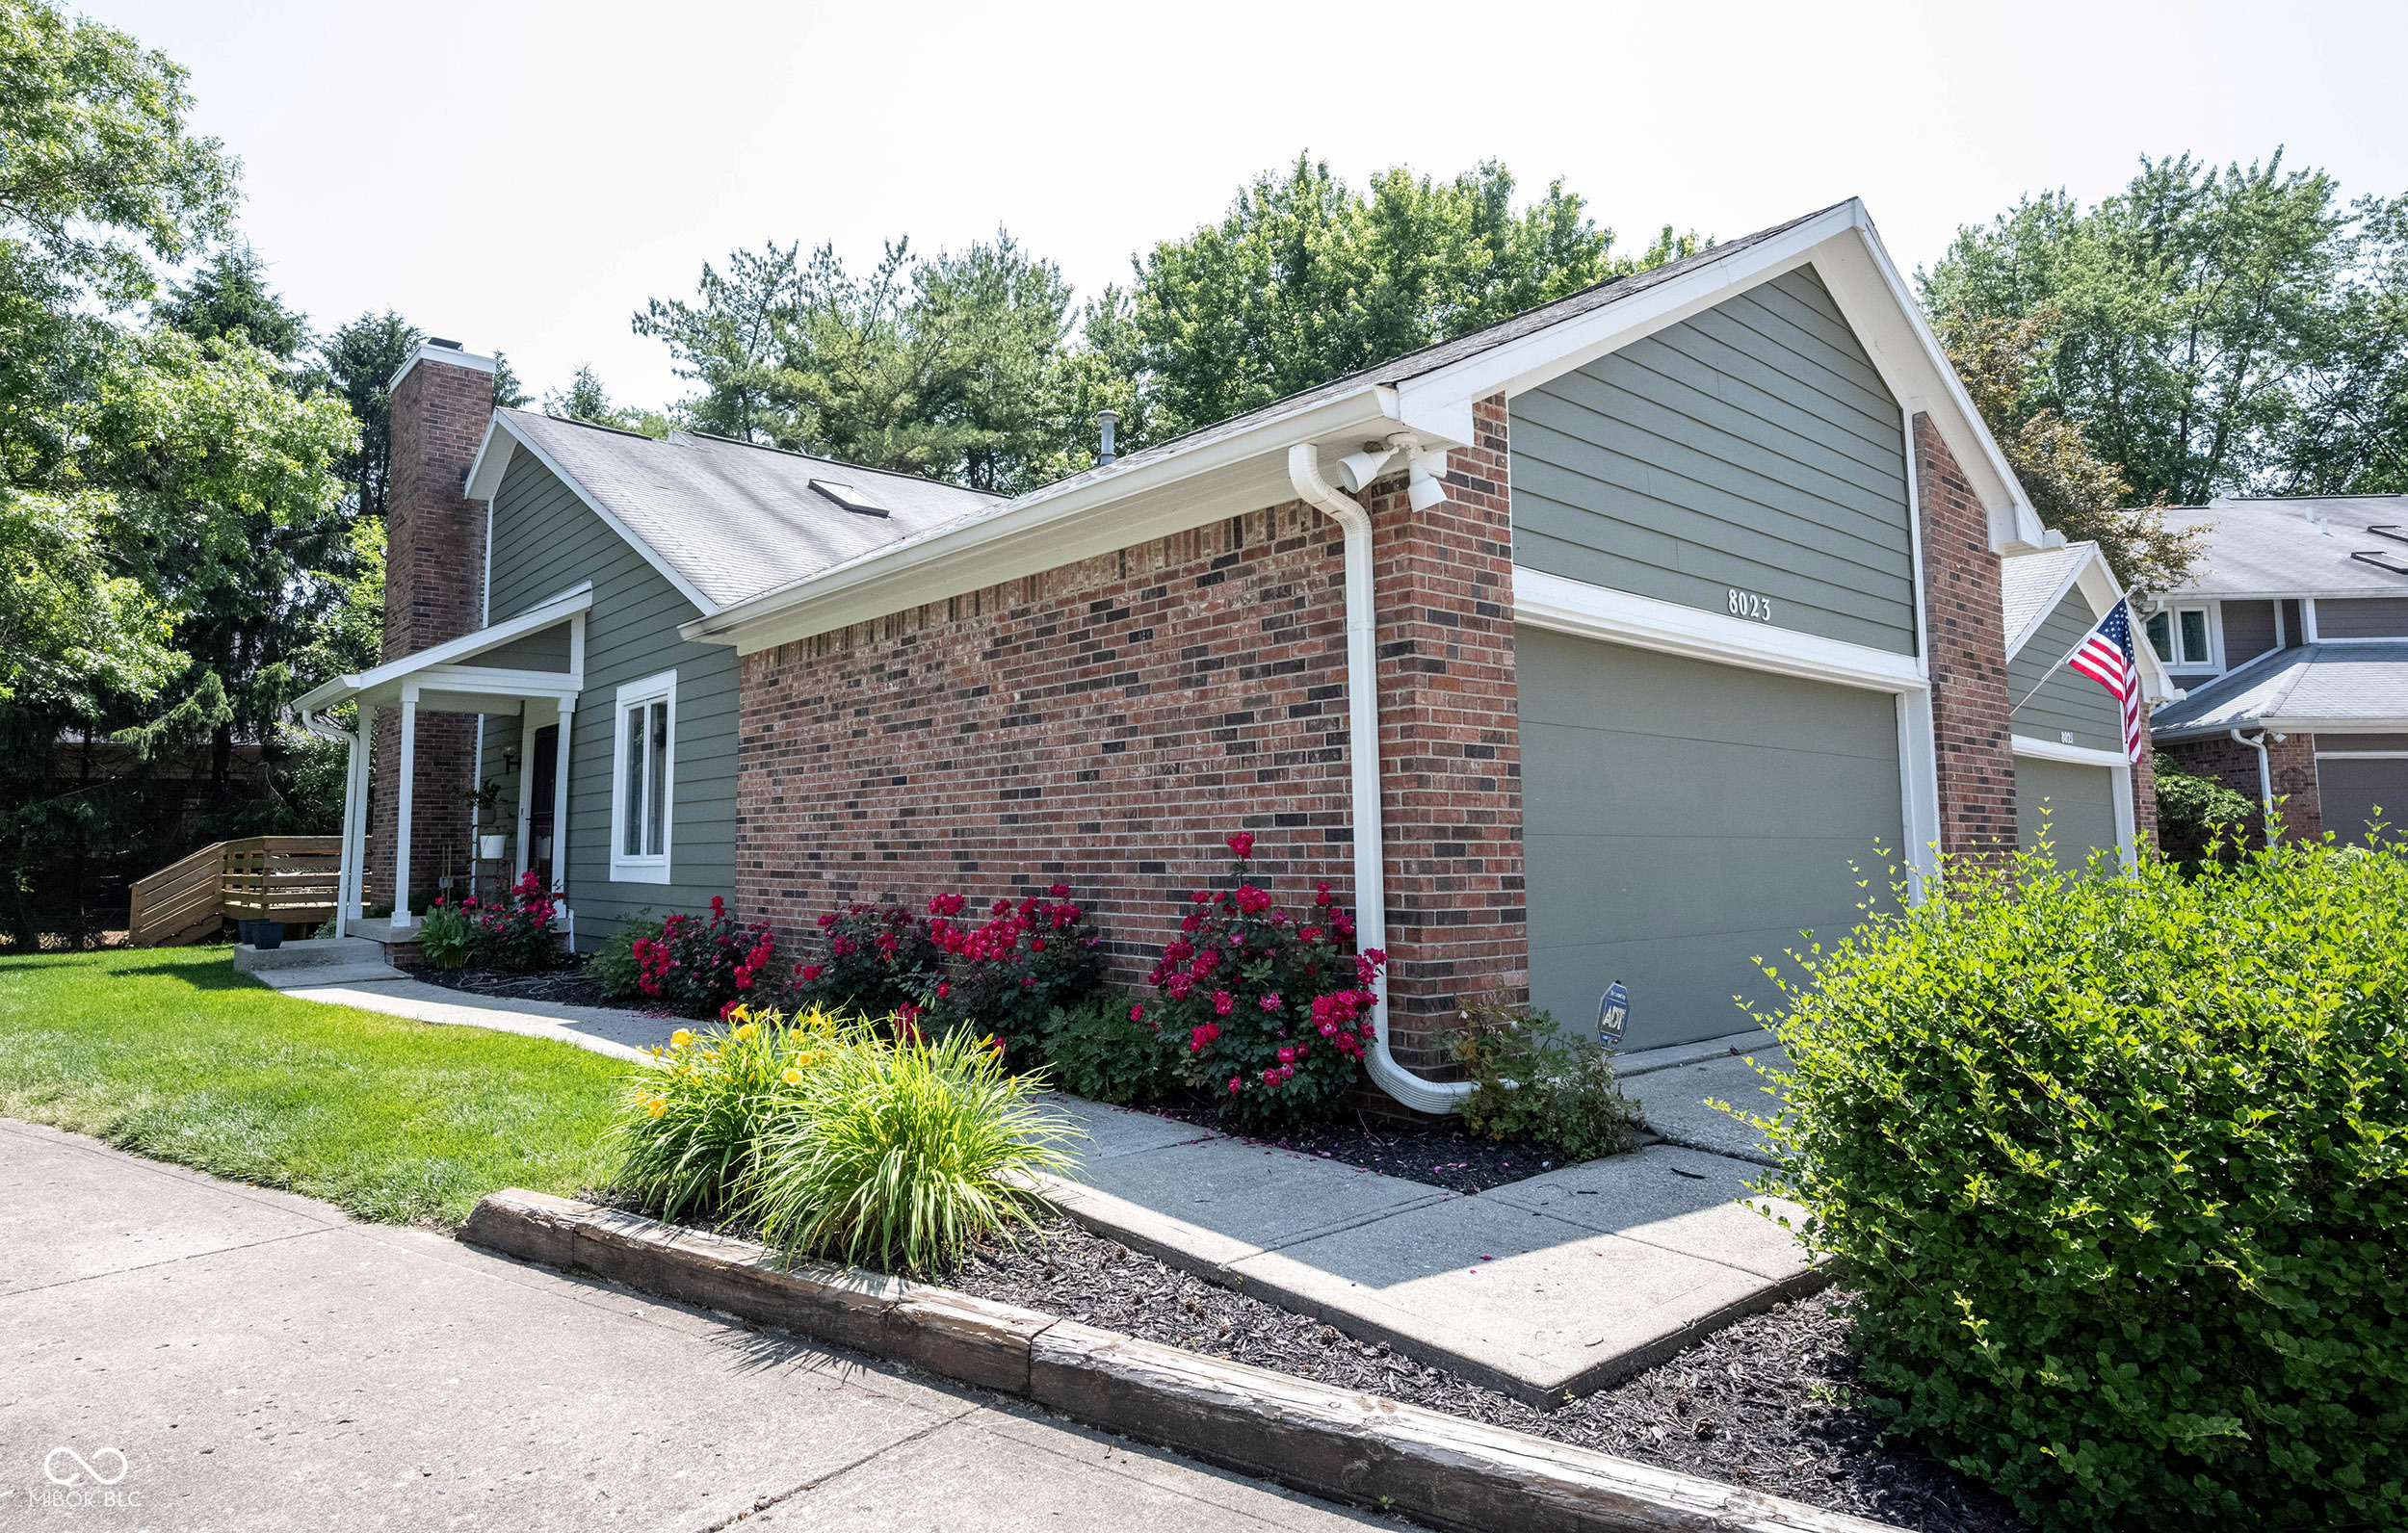
Active
$279,900
2
bds
|
2
ba
|
1,726
sqft
|
built
1985
8023 Talliho Dr, Indianapolis, IN 46256
$-194
Cash flow
-3.6%
Cash-on-Cash Return
5.5%
Cap rate
0.8%
Rent to Value Ratio
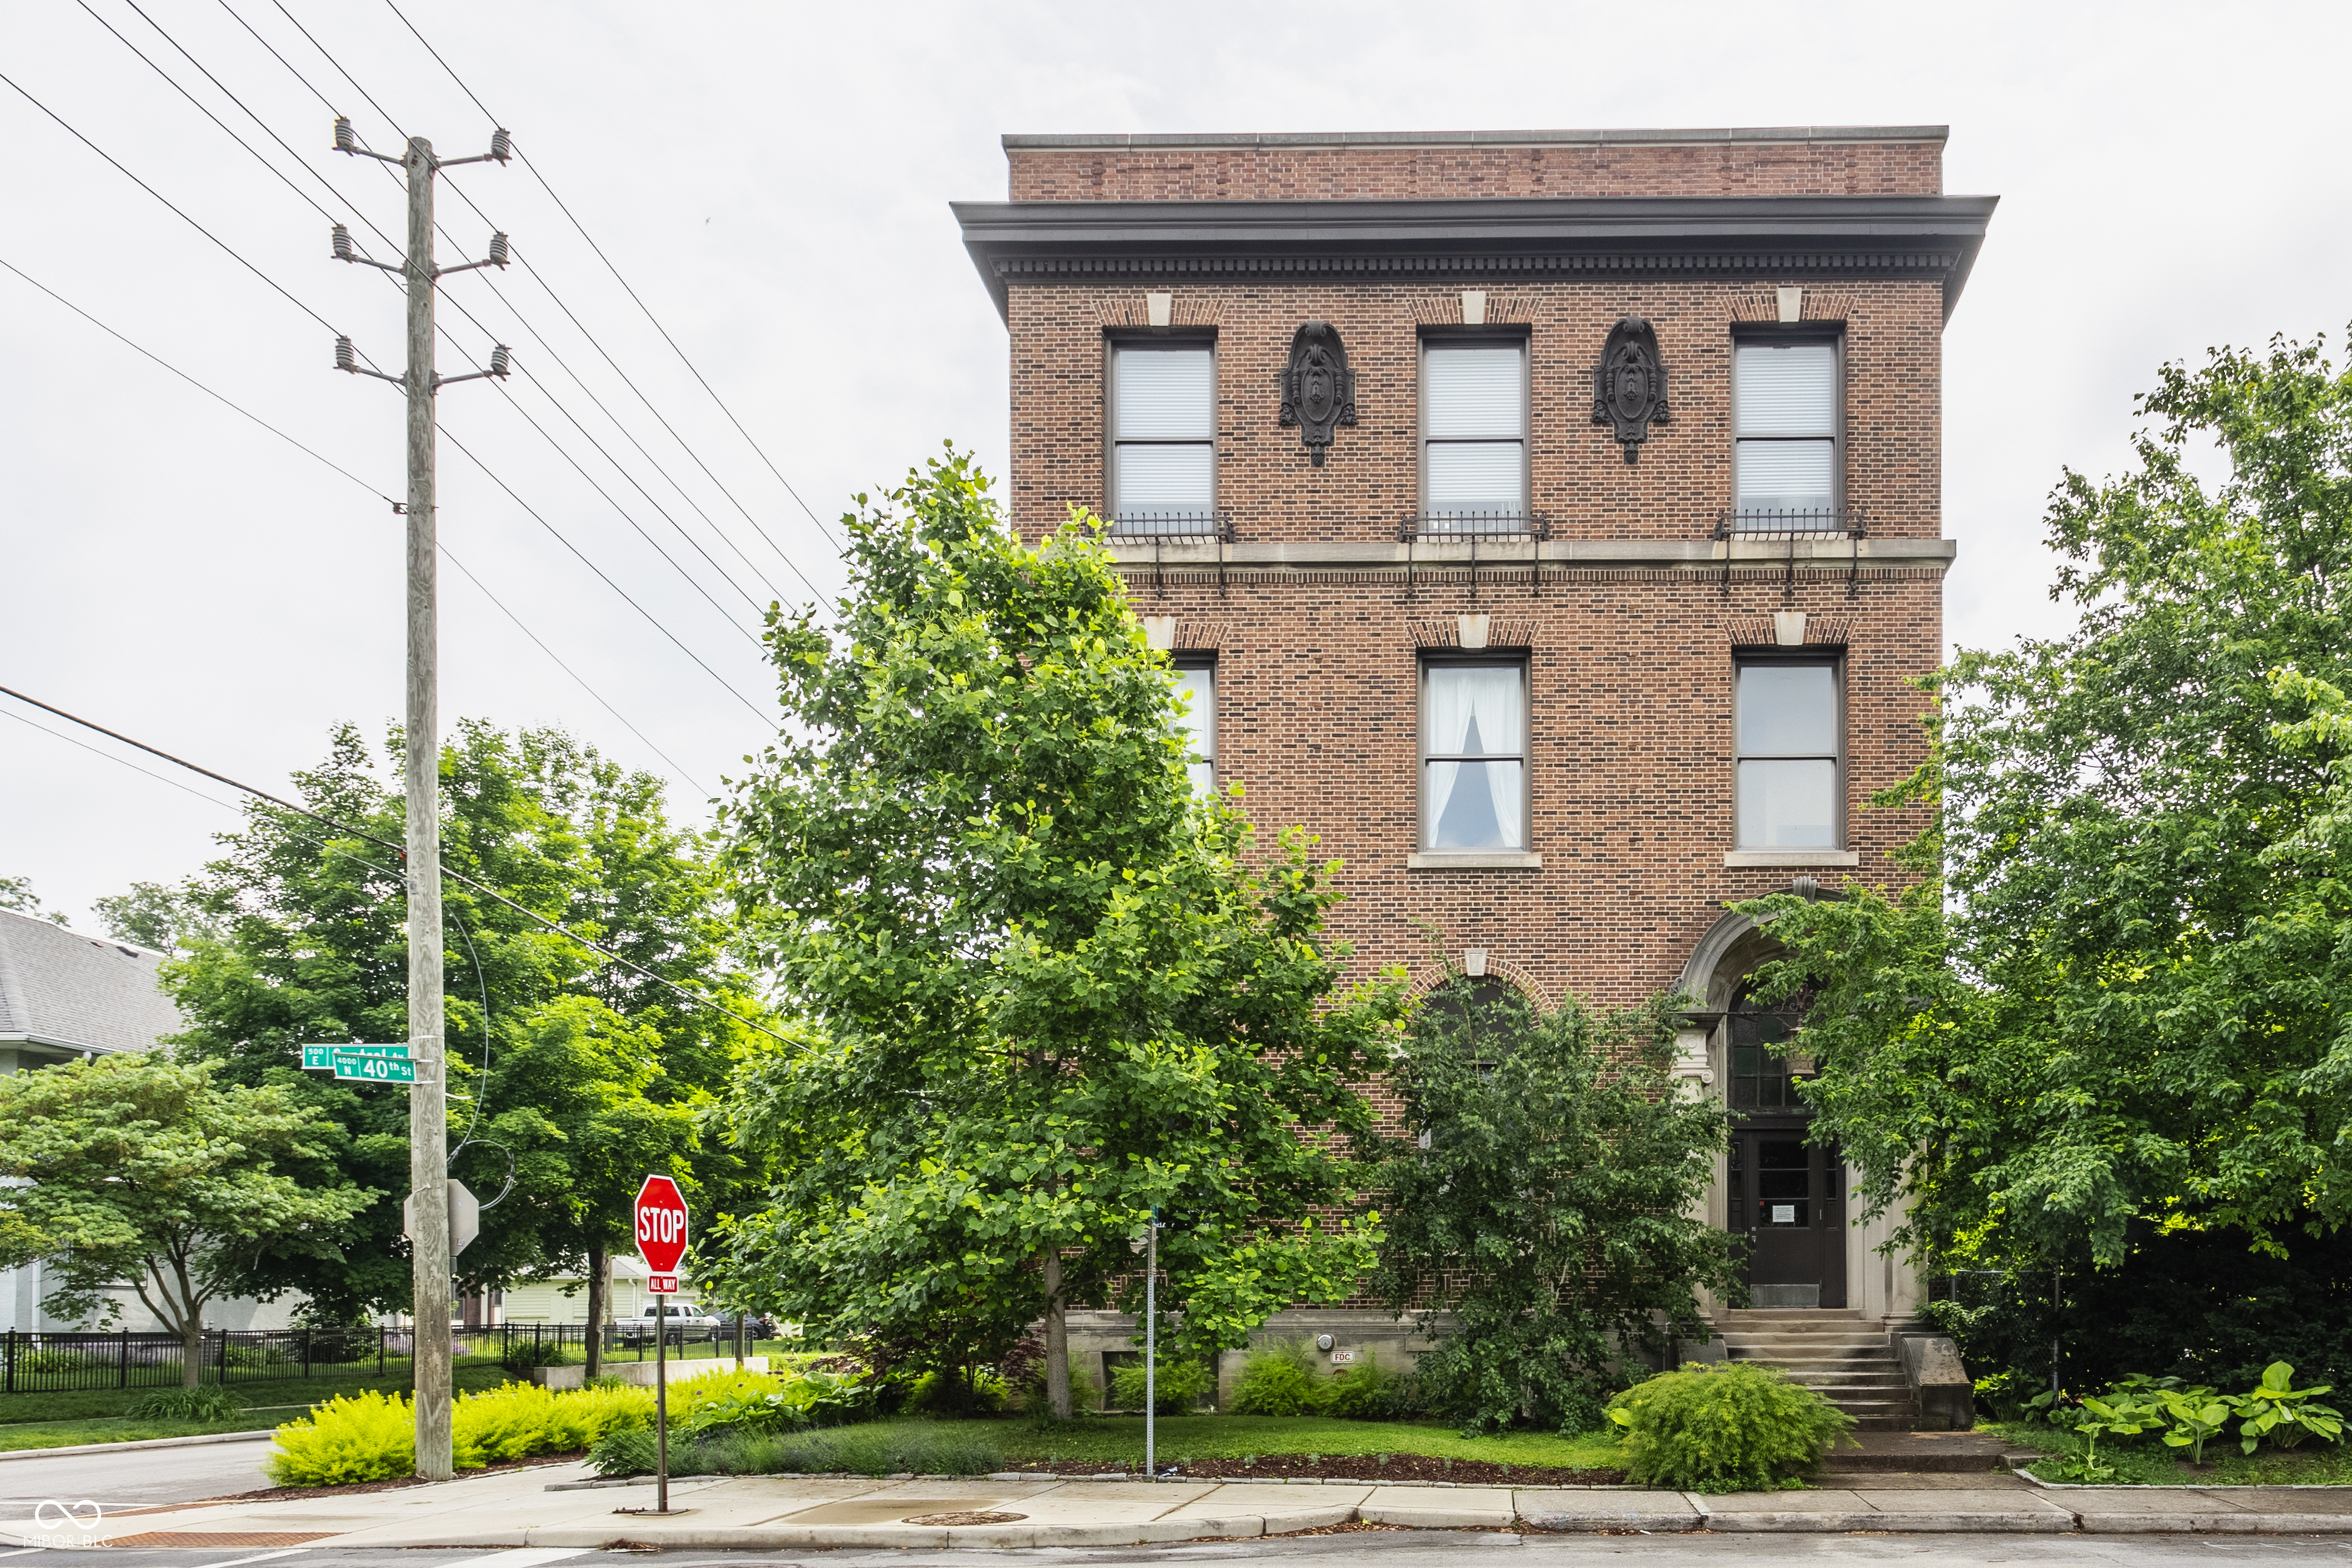
Active
$1,500,000
2
bds
|
2
ba
|
12,694
sqft
|
built
1915
3959 Central Ave, Indianapolis, IN 46205
$-6,475
Cash flow
-22.5%
Cash-on-Cash Return
1.1%
Cap rate
0.1%
Rent to Value Ratio
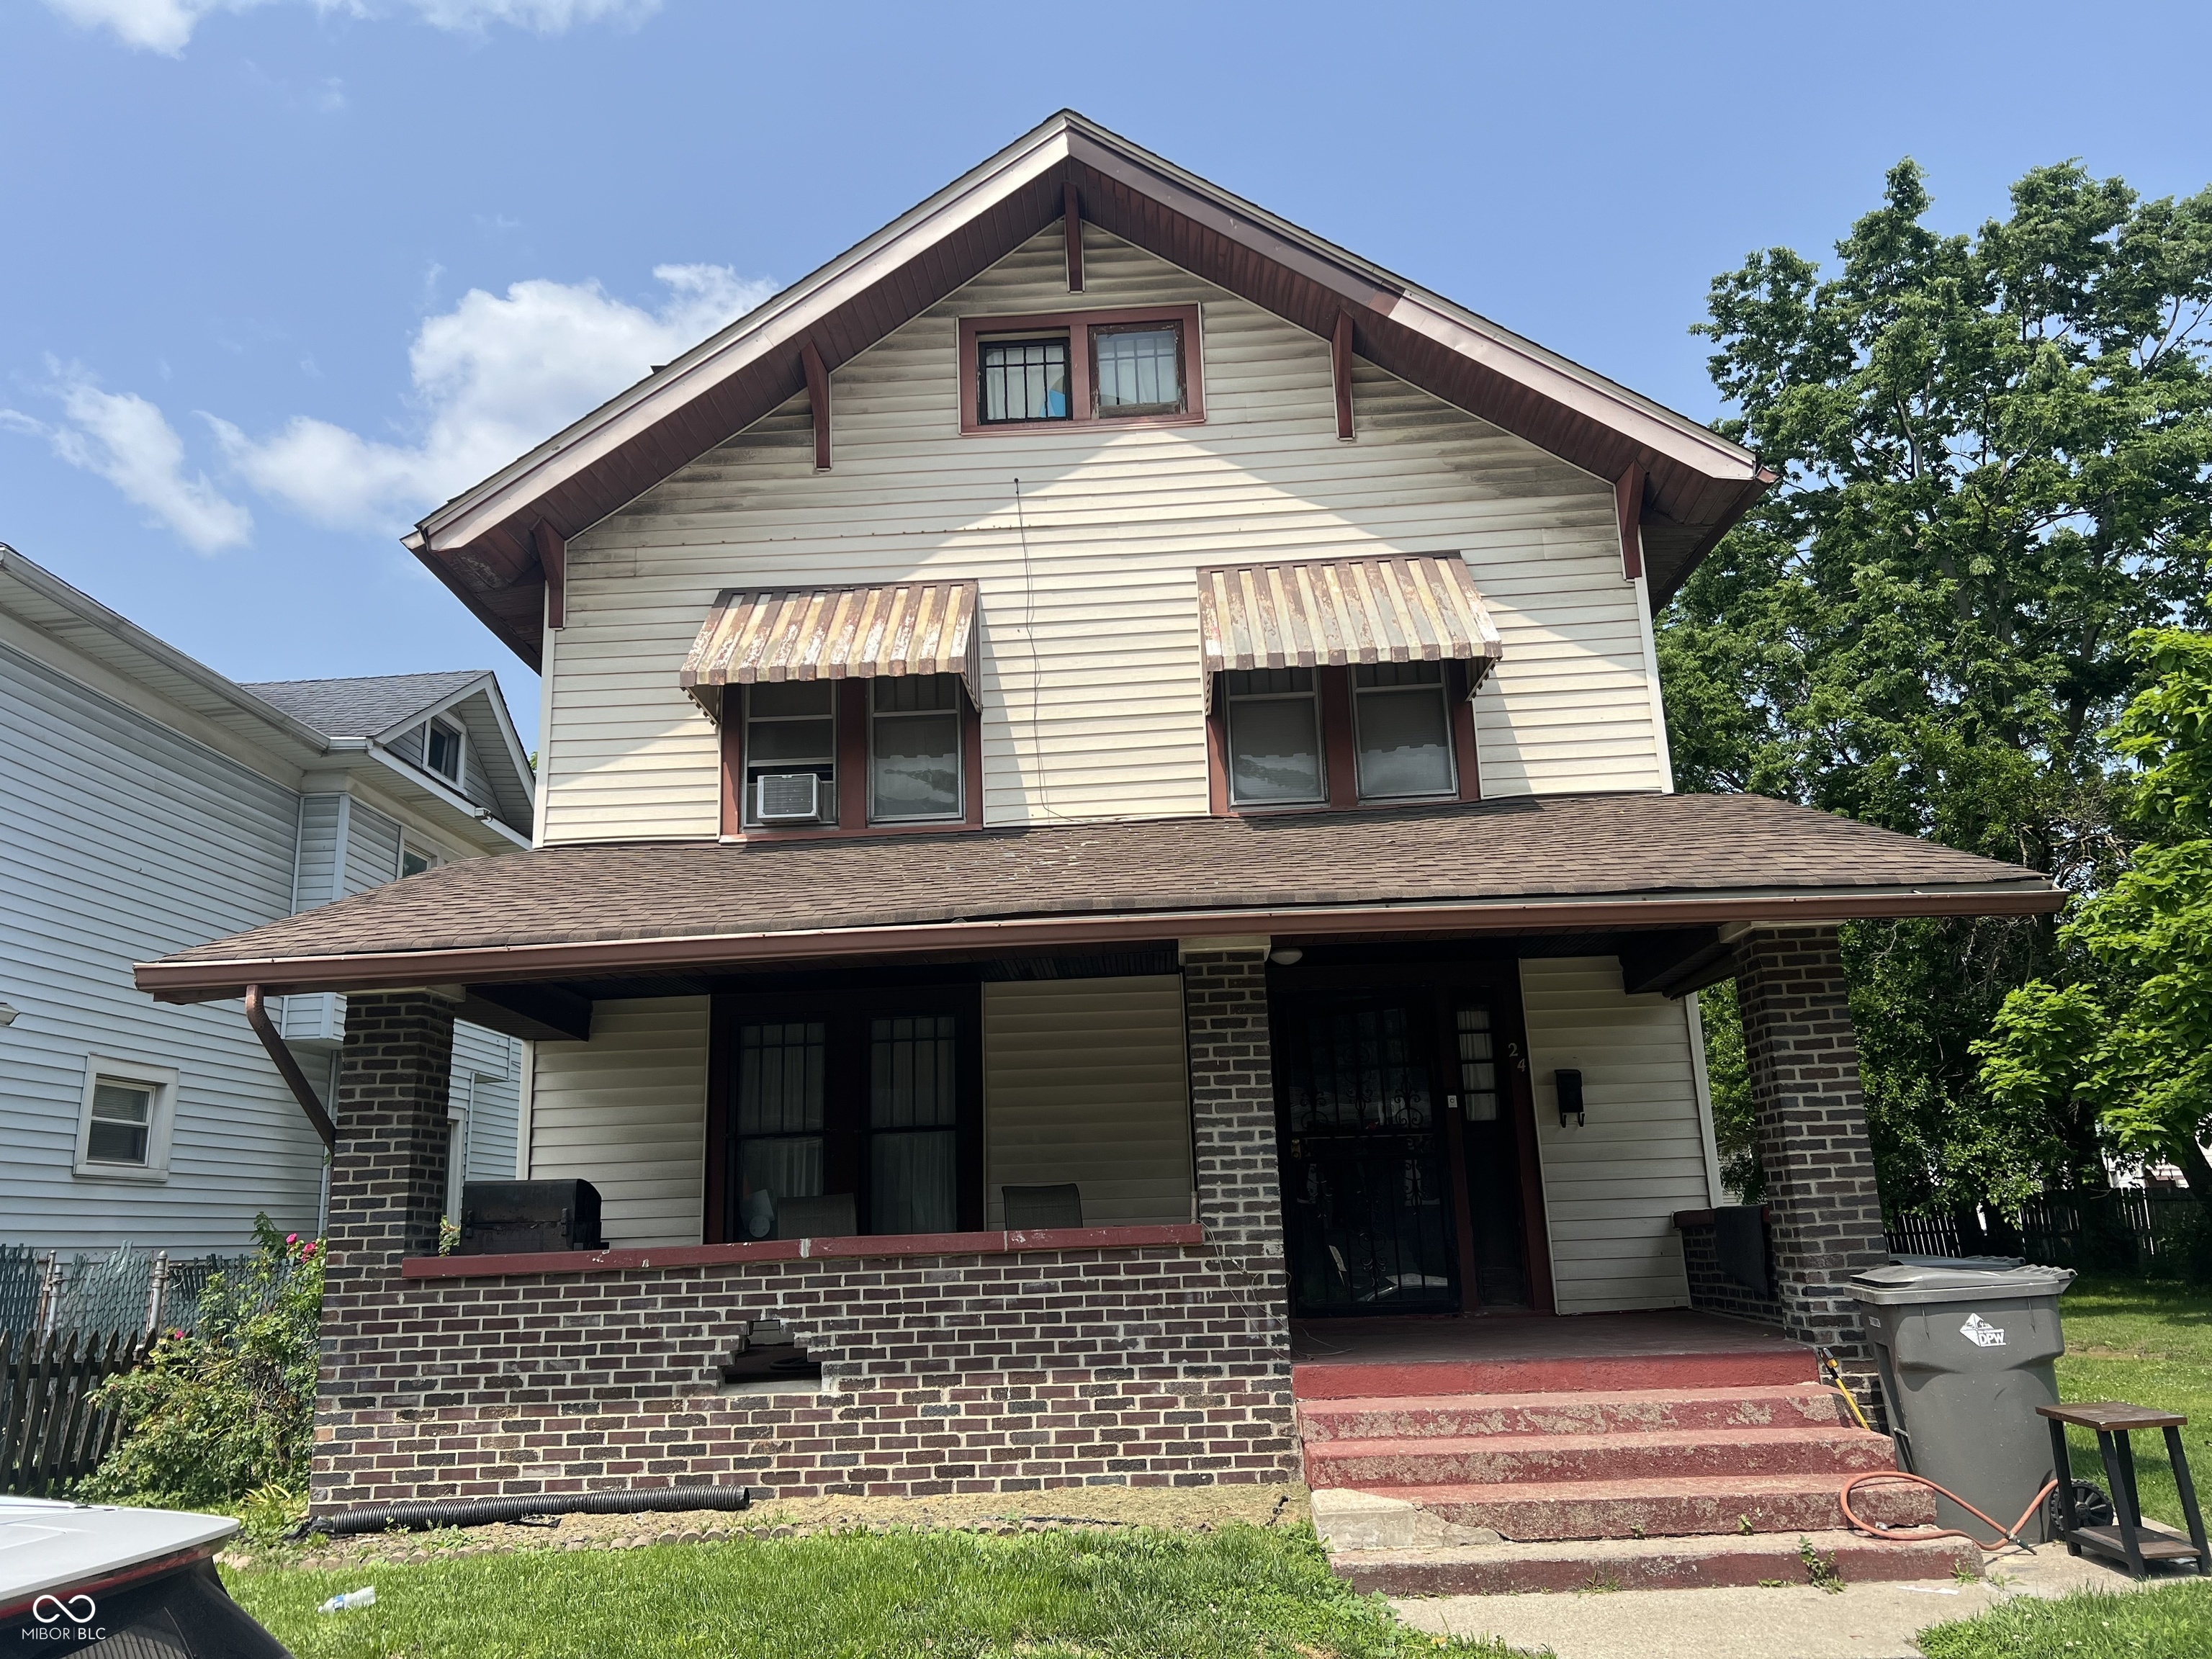
Pending
$170,000
5
bds
|
1
ba
|
1,741
sqft
|
built
1911
24 Hendricks Pl, Indianapolis, IN 46201
$214
Cash flow
6.6%
Cash-on-Cash Return
7.8%
Cap rate
0.9%
Rent to Value Ratio
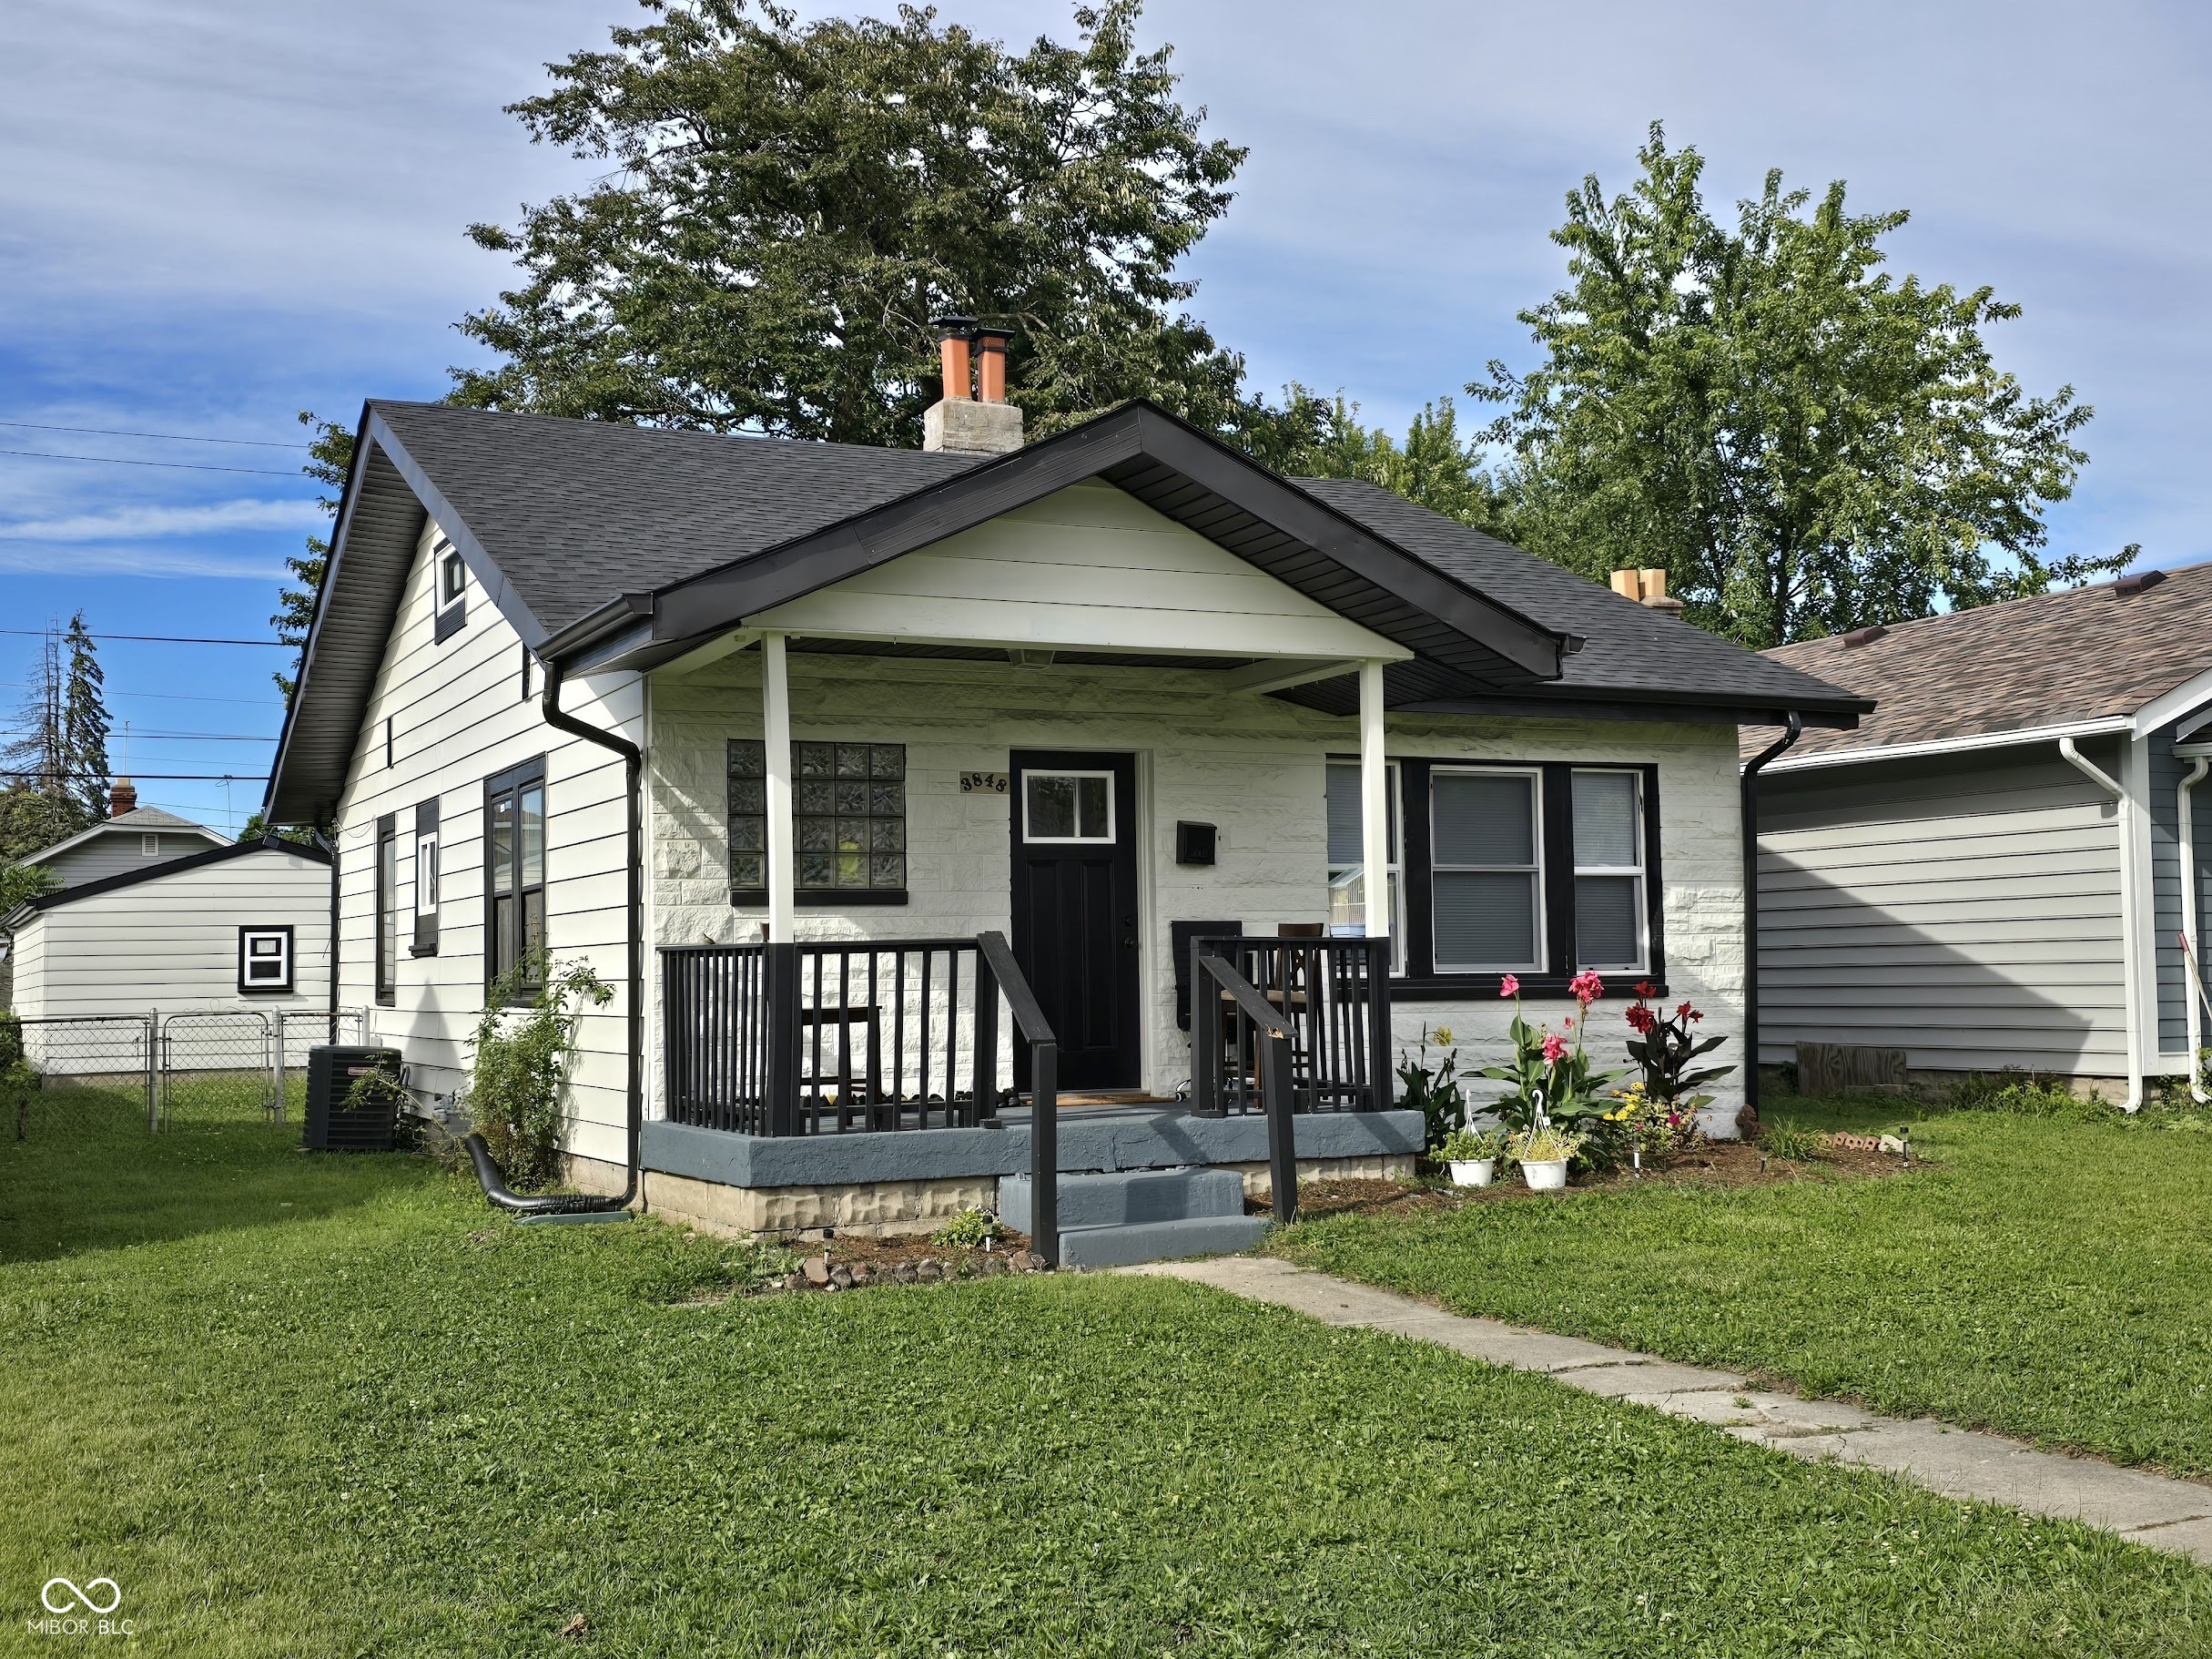
Active
$150,000
2
bds
|
1
ba
|
984
sqft
|
built
1931
3848 Spann Ave, Indianapolis, IN 46203
$318
Cash flow
11.1%
Cash-on-Cash Return
8.8%
Cap rate
1.1%
Rent to Value Ratio
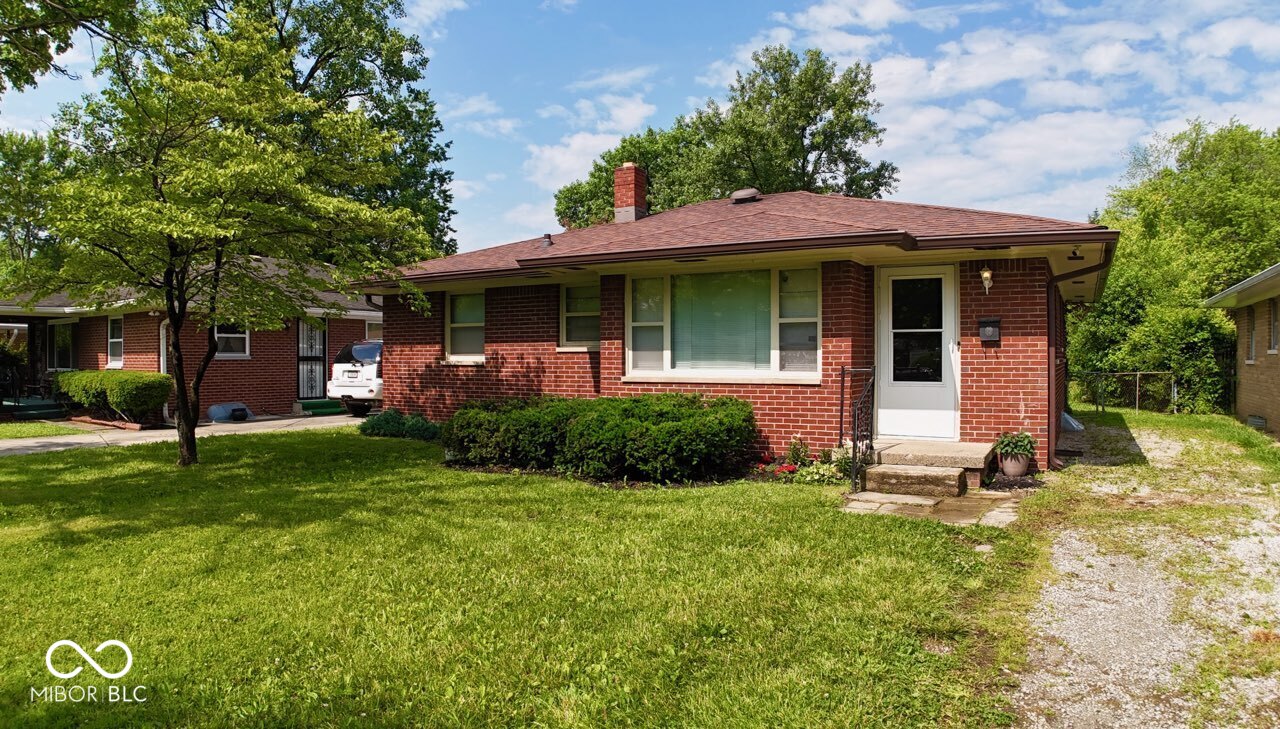
Active
$160,000
3
bds
|
1
ba
|
1,037
sqft
|
built
1957
3922 N Irvington Ave, Indianapolis, IN 46226
$128
Cash flow
4.2%
Cash-on-Cash Return
7.2%
Cap rate
0.9%
Rent to Value Ratio
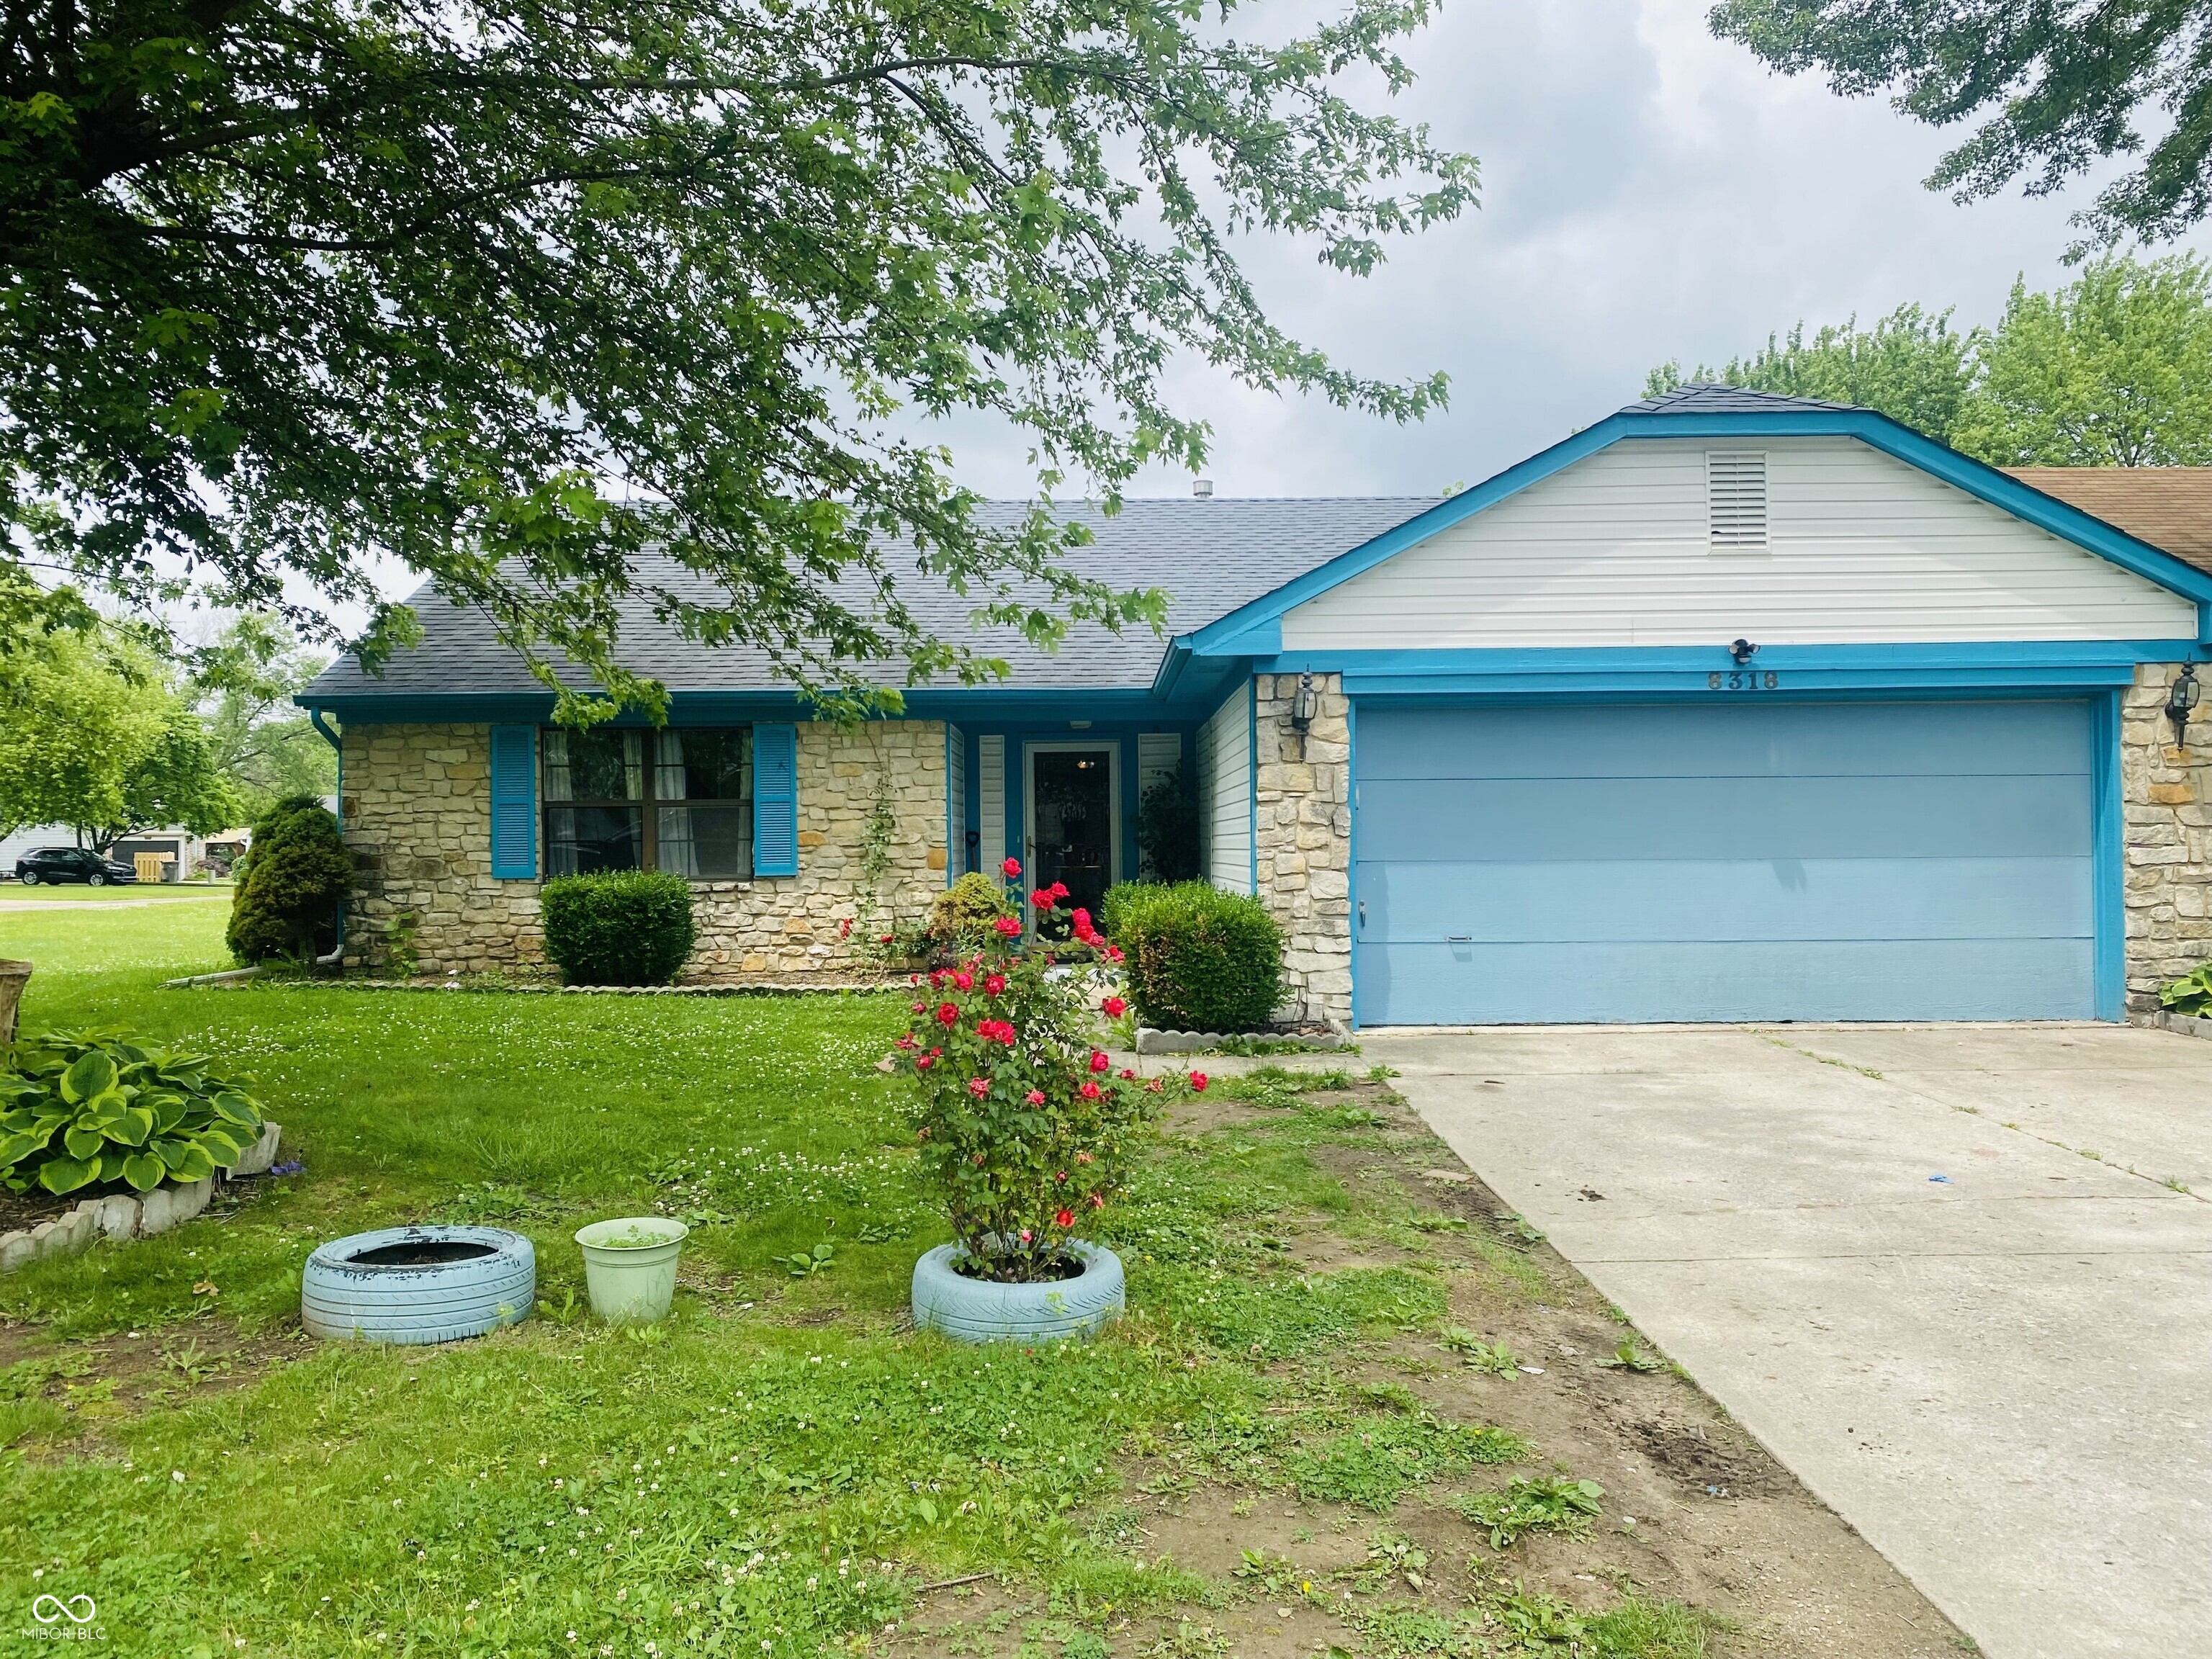
Active
$245,000
3
bds
|
2
ba
|
1,205
sqft
|
built
1989
8318 Rob Ln, Indianapolis, IN 46237
$-41
Cash flow
-0.9%
Cash-on-Cash Return
6.1%
Cap rate
0.7%
Rent to Value Ratio
Active
$189,000
2
bds
|
0
ba
|
0
sqft
|
built
1920
4710 E Michigan St, Indianapolis, IN 46201
$-369
Cash flow
-10.2%
Cash-on-Cash Return
3.9%
Cap rate
0.5%
Rent to Value Ratio
Active
$174,900
2
bds
|
1
ba
|
1,155
sqft
|
built
1910
714 S Keystone Ave, Indianapolis, IN 46203
$-19
Cash flow
-0.6%
Cash-on-Cash Return
6.2%
Cap rate
0.7%
Rent to Value Ratio
Active
$514,900
7
bds
|
5
ba
|
6,219
sqft
|
built
1996
7138 Nile Ridge Ct, Indianapolis, IN 46236
$-356
Cash flow
-3.6%
Cash-on-Cash Return
5.5%
Cap rate
0.7%
Rent to Value Ratio
Pending
$174,900
3
bds
|
2
ba
|
1,995
sqft
|
built
1960
3570 Decamp Dr, Indianapolis, IN 46226
$326
Cash flow
9.7%
Cash-on-Cash Return
8.5%
Cap rate
1.0%
Rent to Value Ratio
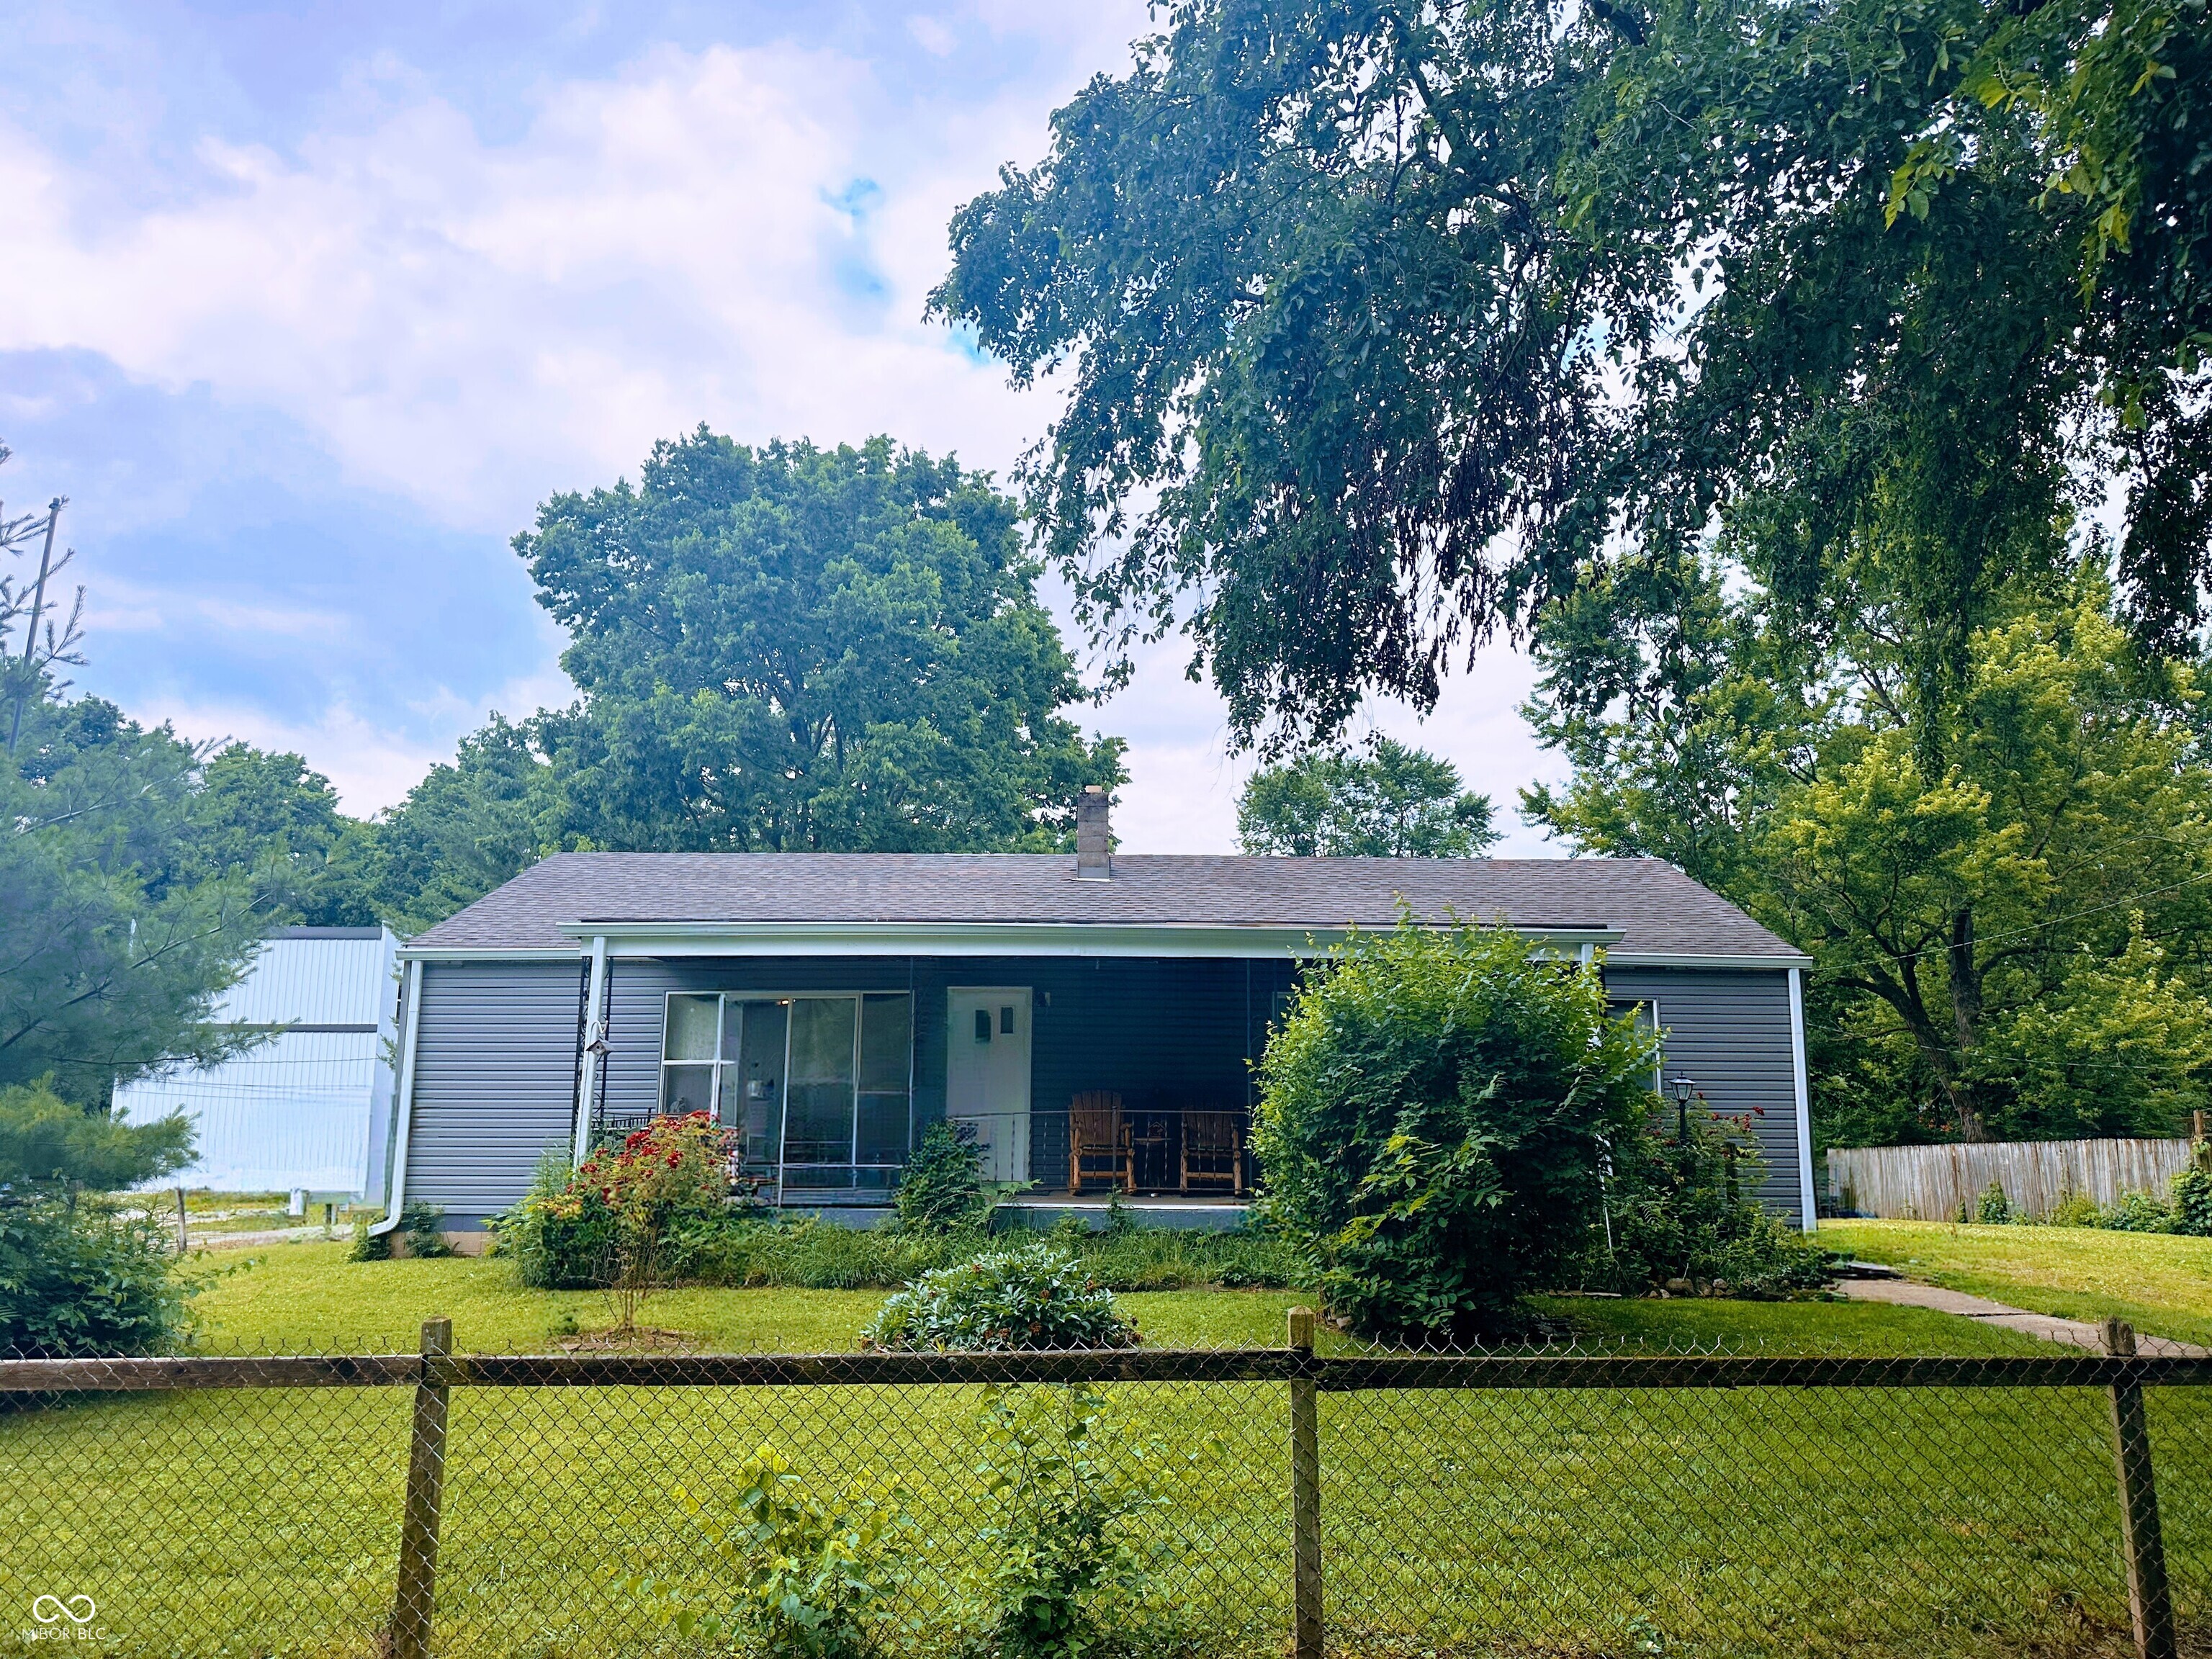
Active
$110,000
2
bds
|
1
ba
|
768
sqft
|
built
1952
5473 E 19th St, Indianapolis, IN 46218
$321
Cash flow
15.2%
Cash-on-Cash Return
9.8%
Cap rate
1.2%
Rent to Value Ratio
Active
$610,000
4
bds
|
4
ba
|
2,505
sqft
|
built
2004
2349 N Delaware St, Indianapolis, IN 46205
$-729
Cash flow
-6.2%
Cash-on-Cash Return
4.8%
Cap rate
0.6%
Rent to Value Ratio
Active
$235,000
3
bds
|
2
ba
|
1,232
sqft
|
built
1952
4904 Betholm Dr, Indianapolis, IN 46239
$-58
Cash flow
-1.3%
Cash-on-Cash Return
6.0%
Cap rate
0.7%
Rent to Value Ratio
Active
$215,000
3
bds
|
2
ba
|
1,096
sqft
|
built
1985
3259 Pawnee Dr, Indianapolis, IN 46235
$-22
Cash flow
-0.5%
Cash-on-Cash Return
6.2%
Cap rate
0.7%
Rent to Value Ratio
Active
$479,000
3
bds
|
3
ba
|
3,424
sqft
|
built
1968
7029 Kingswood Cir, Indianapolis, IN 46256
$-394
Cash flow
-4.3%
Cash-on-Cash Return
5.3%
Cap rate
0.6%
Rent to Value Ratio
Active
$210,000
2
bds
|
2
ba
|
1,214
sqft
|
built
1981
7950 Eagle Valley Pass, Indianapolis, IN 46214
$-335
Cash flow
-8.3%
Cash-on-Cash Return
4.4%
Cap rate
0.7%
Rent to Value Ratio
Active
$124,900
1
bds
|
0
ba
|
0
sqft
|
built
1945
3748 Hillside Ave, Indianapolis, IN 46218
$-171
Cash flow
-7.1%
Cash-on-Cash Return
4.6%
Cap rate
0.6%
Rent to Value Ratio
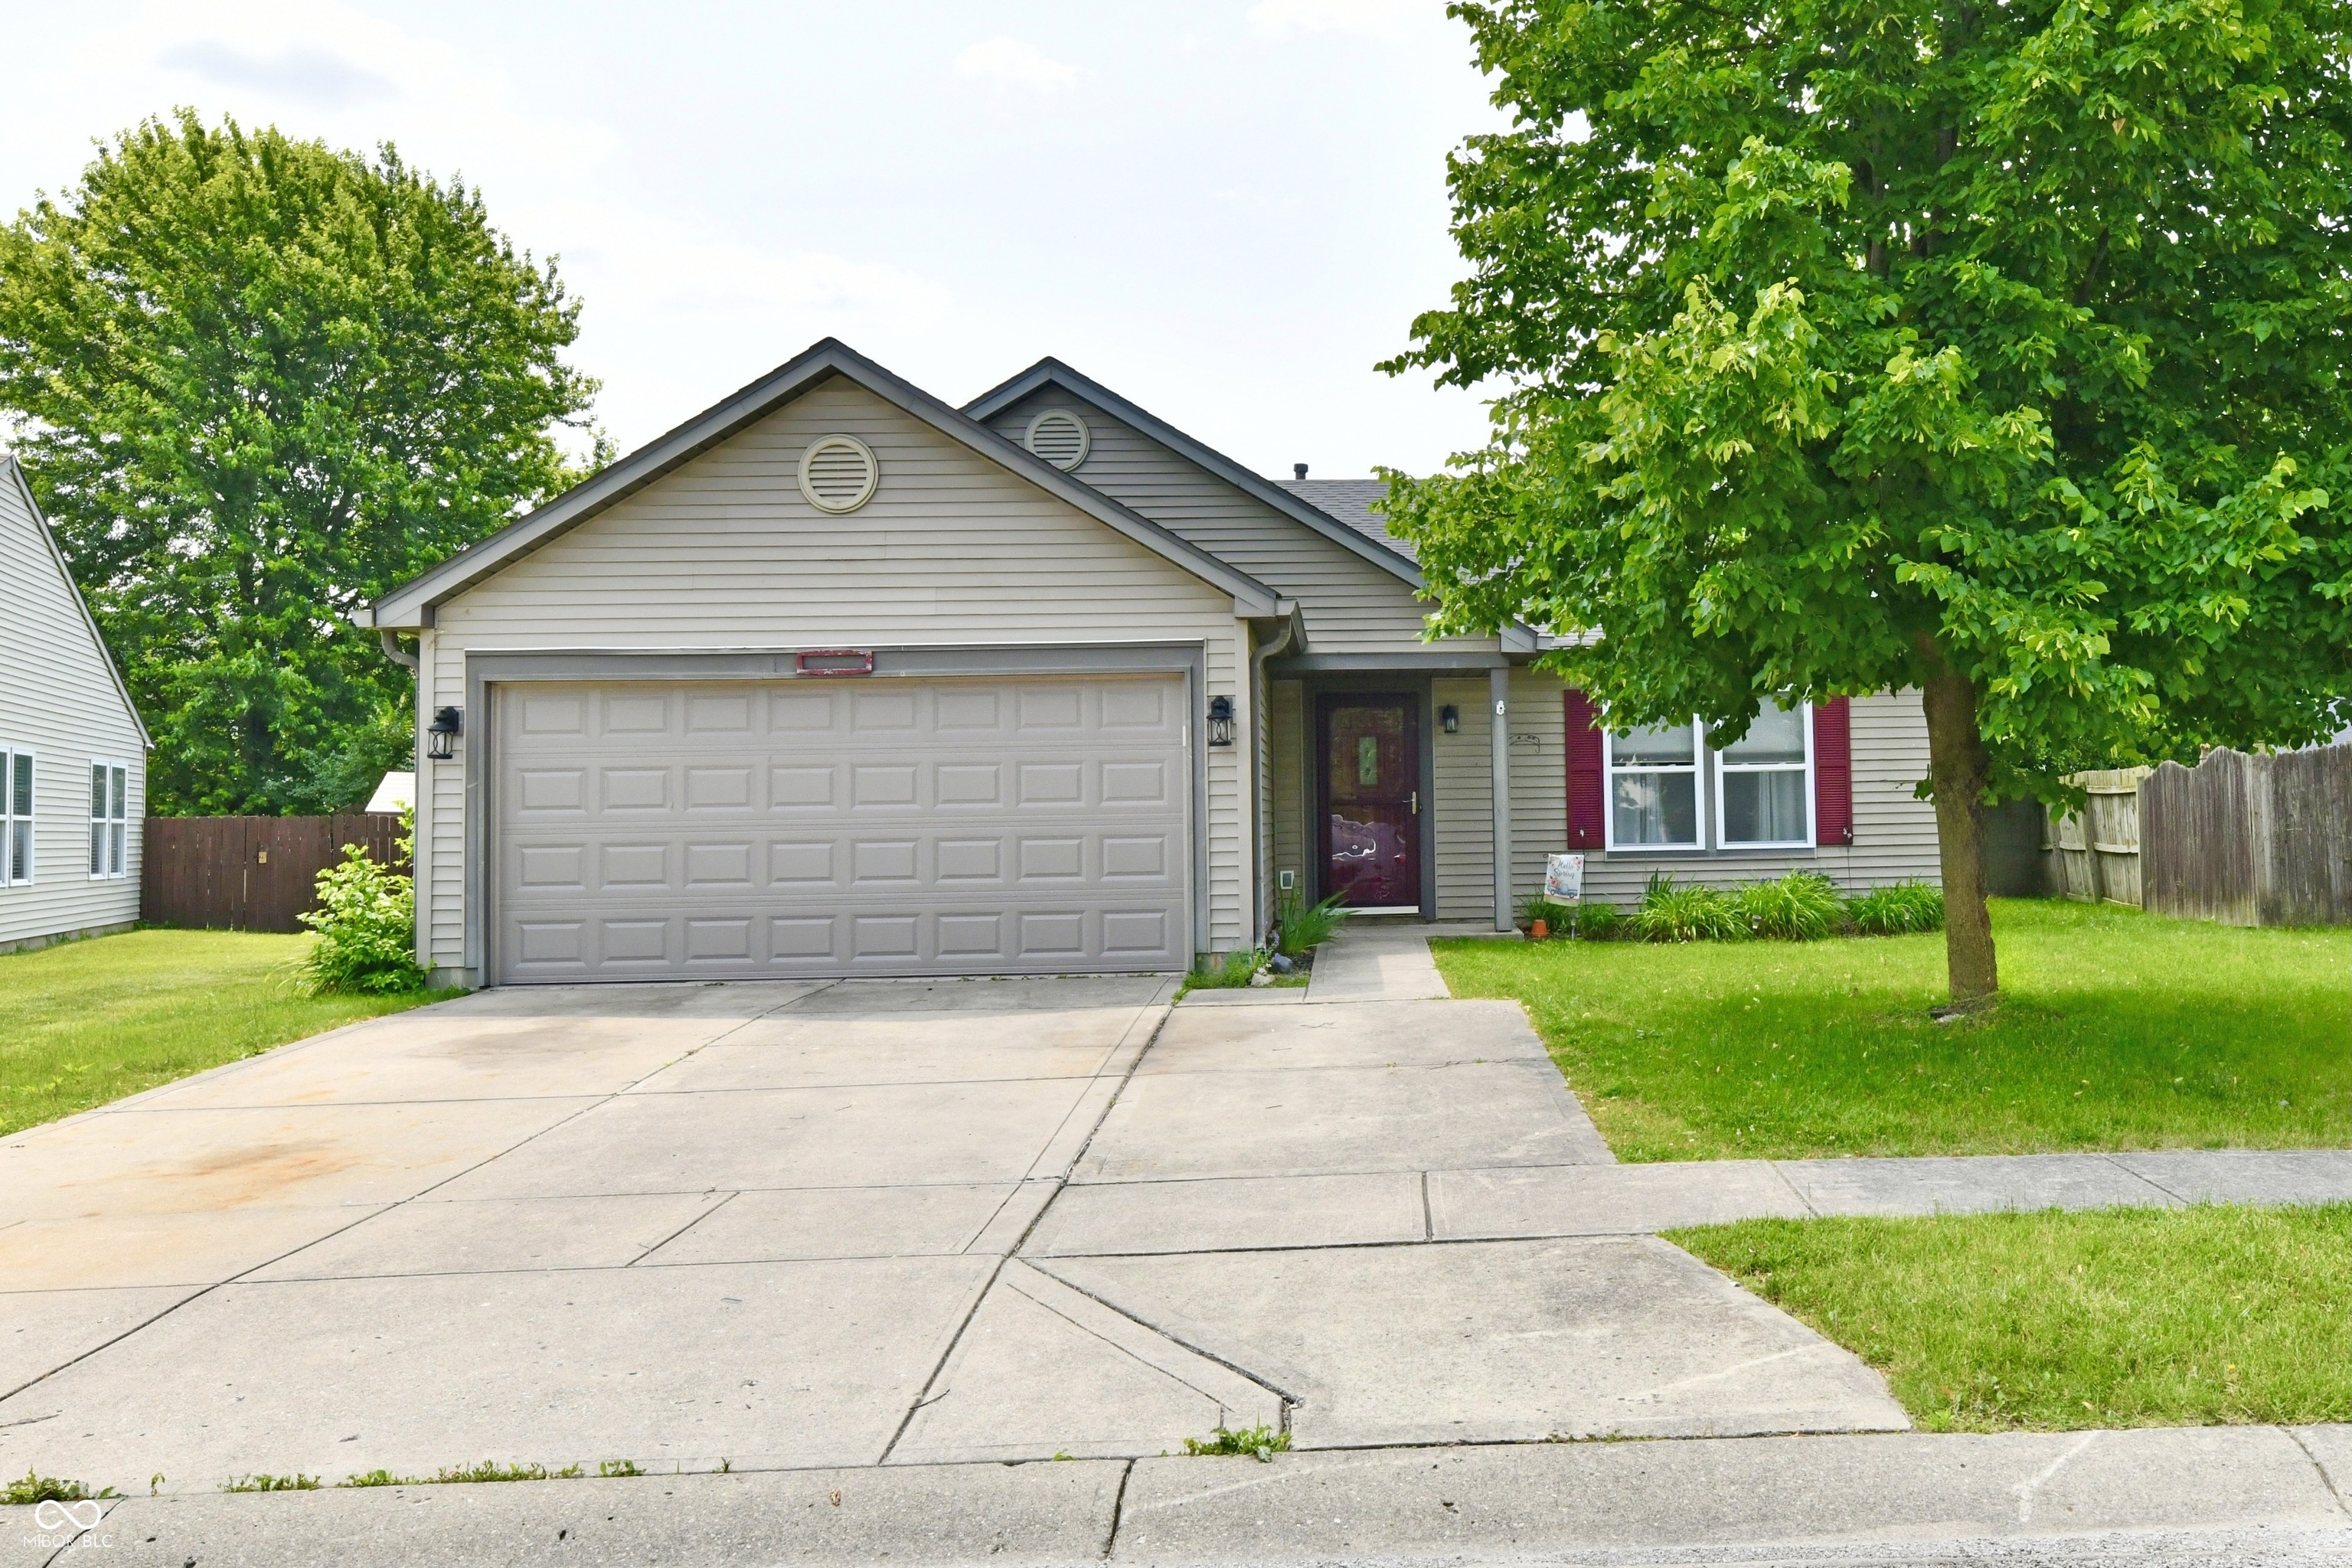
Pending
$225,000
3
bds
|
2
ba
|
1,505
sqft
|
built
2000
3429 Pavetto Ln, Indianapolis, IN 46203
$34
Cash flow
0.8%
Cash-on-Cash Return
6.5%
Cap rate
0.8%
Rent to Value Ratio
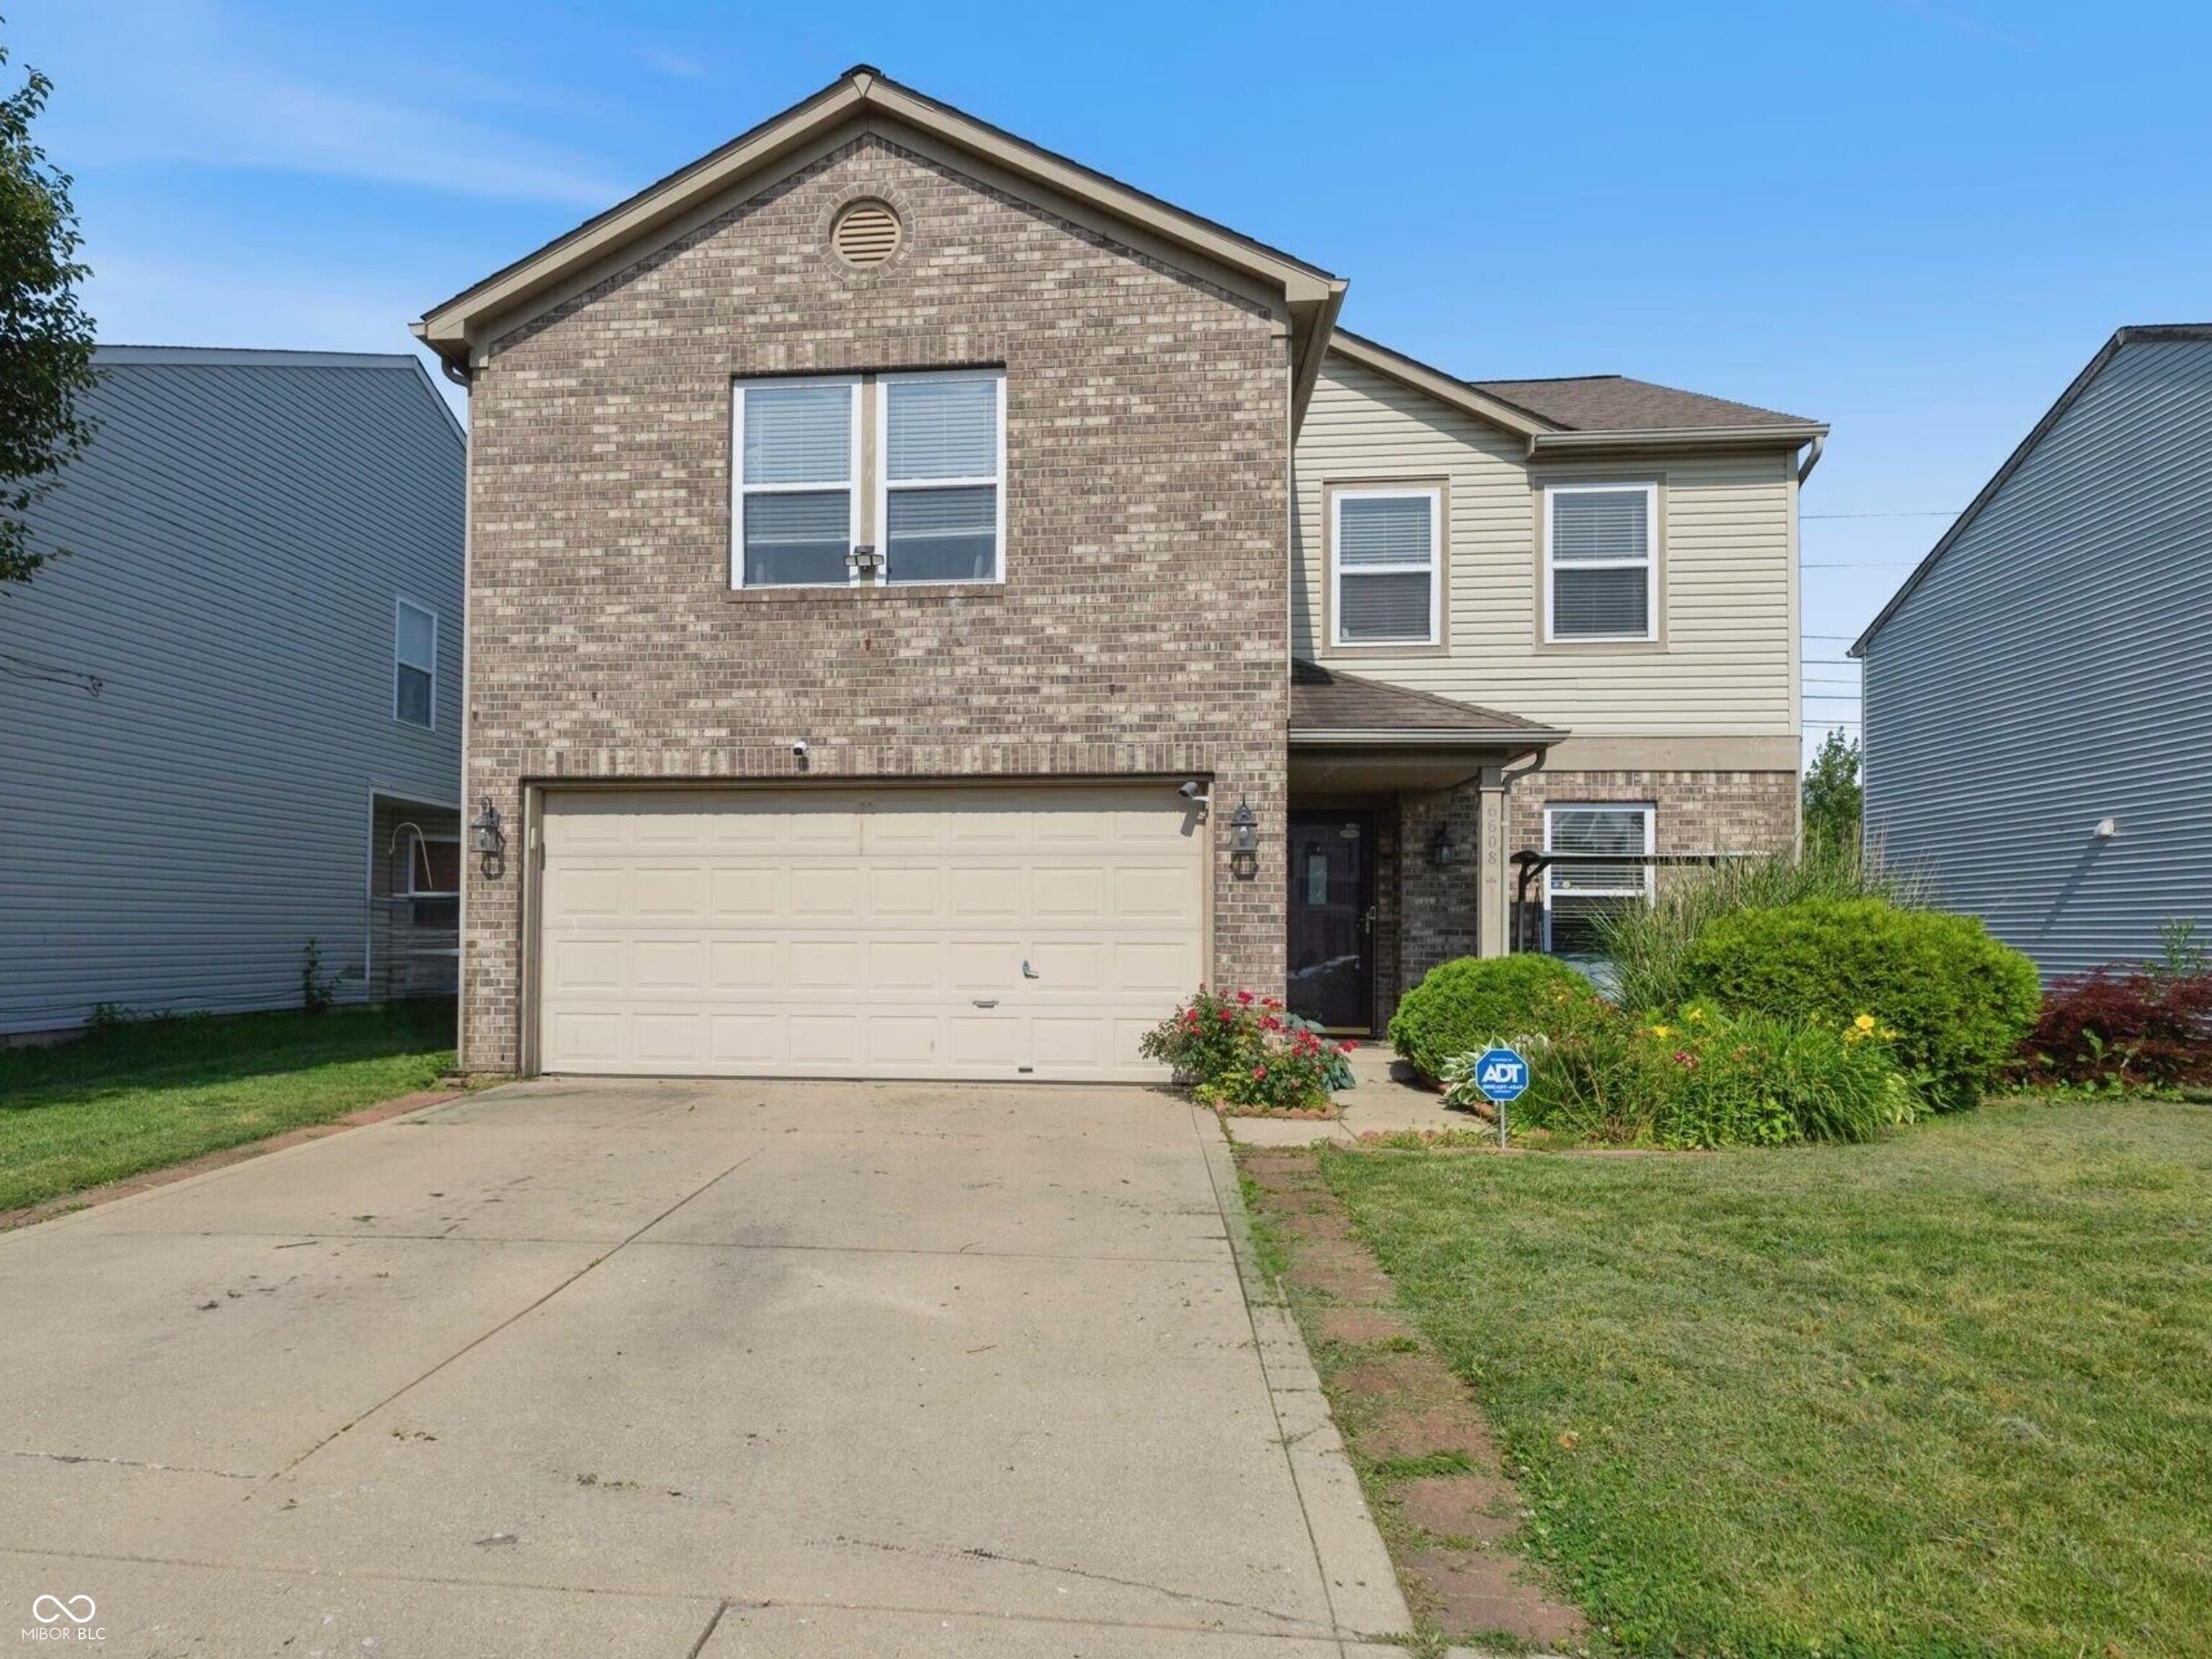
Active
$309,900
3
bds
|
3
ba
|
2,036
sqft
|
built
2000
6608 Sonesta Dr, Indianapolis, IN 46217
$-285
Cash flow
-4.8%
Cash-on-Cash Return
5.2%
Cap rate
0.6%
Rent to Value Ratio