Jackson, MI Investment Properties for Sale
Browse homes for sale and investment properties in Jackson, MI. Refine your search by price, property type, or more.
Best cash flowing properties in Jackson, MI
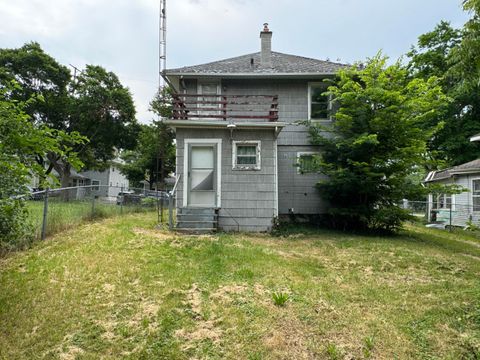
Active
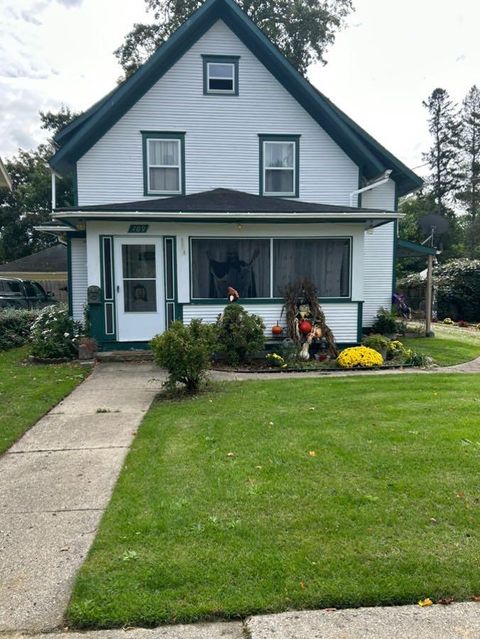
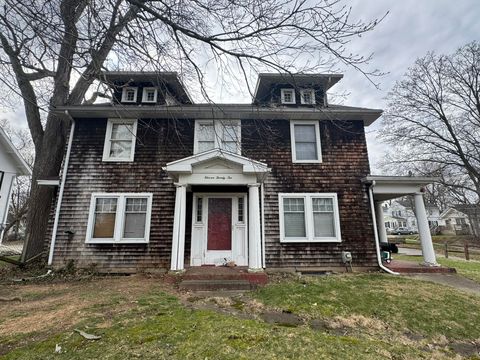
$54,900
3
bds
|
1
ba
|
2,232
sqft
|
built
1920
1232 Maple Ave, Jackson, MI 49203
$929
Cash flow
19.7%
Cash-on-Cash Return
20.3%
Cap rate
2.9%
Rent to Value Ratio

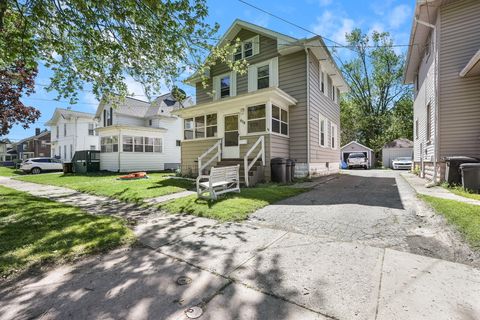
Active
$69,900
3
bds
|
1
ba
|
1,320
sqft
|
built
1930
509 S Gorham St, Jackson, MI 49203
$874
Cash flow
14.6%
Cash-on-Cash Return
15.0%
Cap rate
2.0%
Rent to Value Ratio
84 out of 134 properties for sale in Jackson, MI
Limited Results Shown
Create a free account, or log in to reveal all property listings and enjoy the complete experience.
Active
$155,000
3
bds
|
2
ba
|
1,908
sqft
|
built
1920
618 6th St, Jackson, MI 49203
$267
Cash flow
9.0%
Cash-on-Cash Return
8.3%
Cap rate
1.0%
Rent to Value Ratio

Active under contract
$119,900
3
bds
|
1
ba
|
996
sqft
|
built
1910
1319 Rhodes St, Jackson, MI 49202
$180
Cash flow
7.8%
Cash-on-Cash Return
8.1%
Cap rate
1.1%
Rent to Value Ratio
Active
$139,999
3
bds
|
1
ba
|
1,000
sqft
|
built
1916
206 Mitchell St, Jackson, MI 49203
$62
Cash flow
2.3%
Cash-on-Cash Return
6.8%
Cap rate
0.9%
Rent to Value Ratio

Active
$195,500
2
bds
|
2
ba
|
1,120
sqft
|
built
2003
739 W Barrington Cir, Jackson, MI 49203
$-411
Cash flow
-11.0%
Cash-on-Cash Return
3.7%
Cap rate
0.8%
Rent to Value Ratio

Active
$234,900
4
bds
|
1
ba
|
1,965
sqft
|
built
1955
7400 E Michigan Ave, Jackson, MI 49201
$-104
Cash flow
-2.3%
Cash-on-Cash Return
5.7%
Cap rate
0.8%
Rent to Value Ratio

Active
$175,000
3
bds
|
1
ba
|
1,544
sqft
|
built
1925
1009 S Webster St, Jackson, MI 49203
$-19
Cash flow
-0.6%
Cash-on-Cash Return
6.1%
Cap rate
1.0%
Rent to Value Ratio

Active
$117,900
3
bds
|
1
ba
|
1,114
sqft
|
built
1850
308 N State St, Jackson, MI 49201
$221
Cash flow
9.8%
Cash-on-Cash Return
8.5%
Cap rate
1.2%
Rent to Value Ratio

Active
$239,900
2
bds
|
3
ba
|
1,806
sqft
|
built
1989
1852 Wedgefield, Jackson, MI 49201
$-365
Cash flow
-7.9%
Cash-on-Cash Return
4.4%
Cap rate
0.9%
Rent to Value Ratio

Active
$249,999
3
bds
|
2
ba
|
1,112
sqft
|
built
8353 Cady Rd, Jackson, MI 49201
$-61
Cash flow
-1.3%
Cash-on-Cash Return
6.0%
Cap rate
0.8%
Rent to Value Ratio

Active
$495,000
4
bds
|
3
ba
|
3,045
sqft
|
built
1860
4290 Springbrook Rd, Jackson, MI 49201
$-1,290
Cash flow
-13.6%
Cash-on-Cash Return
3.1%
Cap rate
0.5%
Rent to Value Ratio

Active
$269,000
2
bds
|
2
ba
|
1,988
sqft
|
built
1965
173 Mohawk St, Jackson, MI 49203
$-174
Cash flow
-3.4%
Cash-on-Cash Return
5.5%
Cap rate
0.7%
Rent to Value Ratio

Active
$269,000
4
bds
|
3
ba
|
3,020
sqft
|
built
1965
2250 Saines Manor Dr, Jackson, MI 49201
$-67
Cash flow
-1.3%
Cash-on-Cash Return
6.0%
Cap rate
0.8%
Rent to Value Ratio
Active
$138,900
2
bds
|
1
ba
|
1,020
sqft
|
built
1940
2000 S Jackson St, Jackson, MI 49203
$146
Cash flow
5.5%
Cash-on-Cash Return
7.5%
Cap rate
1.0%
Rent to Value Ratio

Active
$249,000
5
bds
|
3
ba
|
3,232
sqft
|
built
1970
6213 Ackerson Lake Rd, Jackson, MI 49201
$44
Cash flow
0.9%
Cash-on-Cash Return
6.5%
Cap rate
0.9%
Rent to Value Ratio

Active
$124,900
bds
|
0
ba
|
0
sqft
|
built
1920
107 E High St, Jackson, MI 49203
$173
Cash flow
7.2%
Cash-on-Cash Return
7.9%
Cap rate
1.1%
Rent to Value Ratio

Active
$199,999
bds
|
0
ba
|
0
sqft
|
built
1923
1000 S West Ave, Jackson, MI 49203
$-56
Cash flow
-1.5%
Cash-on-Cash Return
5.9%
Cap rate
0.9%
Rent to Value Ratio

Active
$379,000
2
bds
|
1
ba
|
943
sqft
|
built
1970
8033 S Portage Rd, Jackson, MI 49201
$-1,021
Cash flow
-14.1%
Cash-on-Cash Return
3.0%
Cap rate
0.5%
Rent to Value Ratio
Active
$275,000
3
bds
|
3
ba
|
2,350
sqft
|
built
1965
9240 Cady Rd, Jackson, MI 49201
$48
Cash flow
0.9%
Cash-on-Cash Return
6.5%
Cap rate
0.9%
Rent to Value Ratio

Active
$214,400
3
bds
|
2
ba
|
1,440
sqft
|
built
1948
808 Longfellow Ave, Jackson, MI 49202
$-24
Cash flow
-0.6%
Cash-on-Cash Return
6.1%
Cap rate
0.9%
Rent to Value Ratio
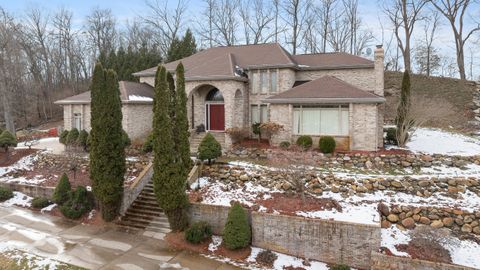
Active
$350,000
4
bds
|
3
ba
|
2,134
sqft
|
built
1992
4175 Springport Rd, Jackson, MI 49201
$-200
Cash flow
-3.0%
Cash-on-Cash Return
5.6%
Cap rate
0.7%
Rent to Value Ratio

Active
$949,900
bds
|
0
ba
|
0
sqft
|
built
1960
6127 Brooklyn Rd, Jackson, MI 49201
$-4,285
Cash flow
-23.5%
Cash-on-Cash Return
0.9%
Cap rate
0.2%
Rent to Value Ratio

Active
$599,900
4
bds
|
4
ba
|
3,093
sqft
|
built
2003
17 Coronado Dr, Jackson, MI 49201
$-1,992
Cash flow
-17.3%
Cash-on-Cash Return
2.3%
Cap rate
0.4%
Rent to Value Ratio
Active
$69,900
3
bds
|
1
ba
|
1,320
sqft
|
built
1930
509 S Gorham St, Jackson, MI 49203
$874
Cash flow
14.6%
Cash-on-Cash Return
15.0%
Cap rate
2.0%
Rent to Value Ratio
Active
$109,900
3
bds
|
1
ba
|
1,396
sqft
|
built
1900
705 Page Ave, Jackson, MI 49203
$307
Cash flow
14.6%
Cash-on-Cash Return
9.6%
Cap rate
1.3%
Rent to Value Ratio

Active
$374,900
2
bds
|
2
ba
|
2,974
sqft
|
built
2002
4284 Fairway Ln, Jackson, MI 49201
$-1,061
Cash flow
-14.8%
Cash-on-Cash Return
2.9%
Cap rate
0.6%
Rent to Value Ratio
Active
$173,500
3
bds
|
2
ba
|
1,457
sqft
|
built
1936
728 Fifth St, Jackson, MI 49203
$115
Cash flow
3.5%
Cash-on-Cash Return
7.1%
Cap rate
1.0%
Rent to Value Ratio
Active
$164,900
3
bds
|
1
ba
|
1,152
sqft
|
built
1910
709 Griswold St, Jackson, MI 49203
$108
Cash flow
3.4%
Cash-on-Cash Return
7.1%
Cap rate
1.0%
Rent to Value Ratio

Active
$1,100,000
4
bds
|
4
ba
|
3,617
sqft
|
built
1992
5527 S Jackson Rd, Jackson, MI 49201
$-4,803
Cash flow
-22.8%
Cash-on-Cash Return
1.0%
Cap rate
0.3%
Rent to Value Ratio

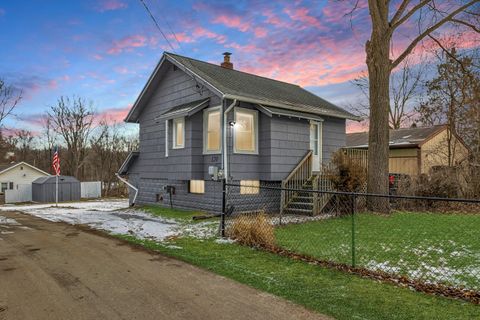
Active
$114,500
2
bds
|
1
ba
|
976
sqft
|
built
1906
711 Randolph St, Jackson, MI 49203
$223
Cash flow
10.2%
Cash-on-Cash Return
8.6%
Cap rate
1.2%
Rent to Value Ratio

Active
$164,000
3
bds
|
0
ba
|
0
sqft
|
built
1920
612 Lansing Ave, Jackson, MI 49202
$113
Cash flow
3.6%
Cash-on-Cash Return
7.1%
Cap rate
1.0%
Rent to Value Ratio
Active
$1,149,000
6
bds
|
5
ba
|
7,784
sqft
|
built
1991
1840 Lexington Rd, Jackson, MI 49201
$-5,207
Cash flow
-23.6%
Cash-on-Cash Return
0.8%
Cap rate
0.2%
Rent to Value Ratio

Active
$275,000
2
bds
|
2
ba
|
2,170
sqft
|
built
2003
8874 Churchill Rd, Jackson, MI 49201
$-116
Cash flow
-2.2%
Cash-on-Cash Return
5.8%
Cap rate
0.8%
Rent to Value Ratio
Active
$115,000
1
bds
|
2
ba
|
942
sqft
|
built
1927
120 Charles St, Jackson, MI 49203
$77
Cash flow
3.5%
Cash-on-Cash Return
7.1%
Cap rate
1.0%
Rent to Value Ratio
Active
$154,900
2
bds
|
1
ba
|
880
sqft
|
built
1930
3424 Sunnyheart Ave, Jackson, MI 49202
$64
Cash flow
2.2%
Cash-on-Cash Return
6.8%
Cap rate
0.9%
Rent to Value Ratio
Active
$160,000
4
bds
|
2
ba
|
2,218
sqft
|
built
1930
1122 4th St, Jackson, MI 49203
$212
Cash flow
6.9%
Cash-on-Cash Return
7.9%
Cap rate
1.1%
Rent to Value Ratio
Active
$54,900
3
bds
|
1
ba
|
2,232
sqft
|
built
1920
1232 Maple Ave, Jackson, MI 49203
$929
Cash flow
19.7%
Cash-on-Cash Return
20.3%
Cap rate
2.9%
Rent to Value Ratio
Active
$123,000
2
bds
|
1
ba
|
1,044
sqft
|
built
1920
626 Orange St, Jackson, MI 49202
$67
Cash flow
2.8%
Cash-on-Cash Return
6.9%
Cap rate
1.1%
Rent to Value Ratio
Active under contract
$149,900
2
bds
|
1
ba
|
945
sqft
|
built
1948
202 Fifth St, Jackson, MI 49203
$-65
Cash flow
-2.3%
Cash-on-Cash Return
5.7%
Cap rate
0.9%
Rent to Value Ratio
Active
$142,900
3
bds
|
2
ba
|
1,218
sqft
|
built
1930
1200 Sheldon St, Jackson, MI 49203
$181
Cash flow
6.6%
Cash-on-Cash Return
7.8%
Cap rate
1.1%
Rent to Value Ratio

Active
$84,600
bds
|
0
ba
|
0
sqft
|
built
1930
601 Fifth St, Jackson, MI 49203
$-8,754
Cash flow
-539.9%
Cash-on-Cash Return
-117.9%
Cap rate
1.7%
Rent to Value Ratio