Ann Arbor, MI Investment Properties for Sale
Browse homes for sale and investment properties in Ann Arbor, MI. Refine your search by price, property type, or more.
Best cash flowing properties in Ann Arbor, MI

Active
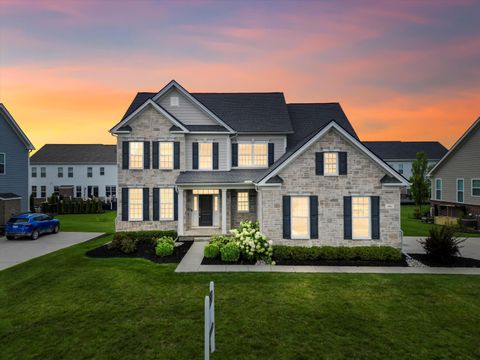
$650,000
4
bds
|
2
ba
|
2,612
sqft
|
built
1988
2250 Peters Rd, Ann Arbor, MI 48103
$-259
Cash flow
-2.1%
Cash-on-Cash Return
5.7%
Cap rate
0.9%
Rent to Value Ratio
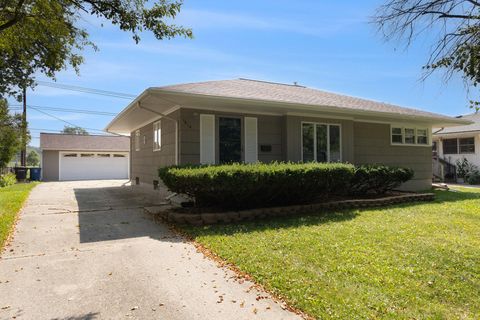
Active
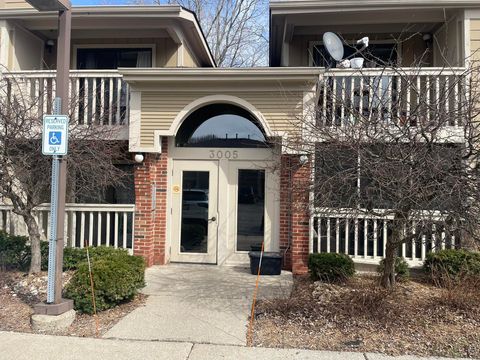
$229,499
2
bds
|
2
ba
|
970
sqft
|
built
1989
3005 Fernwood Ave, Ann Arbor, MI 48108
$-510
Cash flow
-11.6%
Cash-on-Cash Return
3.5%
Cap rate
0.9%
Rent to Value Ratio
76 out of 188 properties for sale in Ann Arbor, MI
Limited Results Shown
Create a free account, or log in to reveal all property listings and enjoy the complete experience.
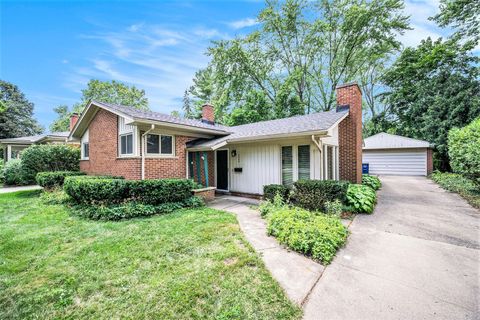
Active
$495,000
4
bds
|
3
ba
|
2,448
sqft
|
built
1947
1236 Kensington Dr, Ann Arbor, MI 48104
$-1,605
Cash flow
-16.9%
Cash-on-Cash Return
2.3%
Cap rate
0.6%
Rent to Value Ratio

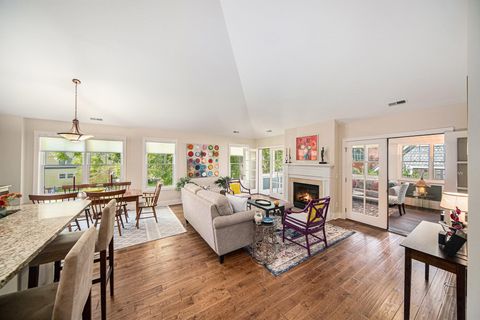
Active
$850,000
5
bds
|
3
ba
|
2,968
sqft
|
built
1969
3586 E Huron River Dr, Ann Arbor, MI 48104
$-2,822
Cash flow
-17.3%
Cash-on-Cash Return
2.2%
Cap rate
0.5%
Rent to Value Ratio
Active
$1,325,000
6
bds
|
5
ba
|
5,726
sqft
|
built
1990
3427 E Dobson Pl, Ann Arbor, MI 48105
$-5,678
Cash flow
-22.4%
Cash-on-Cash Return
1.0%
Cap rate
0.4%
Rent to Value Ratio

Active
$299,000
3
bds
|
3
ba
|
1,920
sqft
|
built
1979
3024 Bolgos Cir, Ann Arbor, MI 48105
$-929
Cash flow
-16.2%
Cash-on-Cash Return
2.4%
Cap rate
0.7%
Rent to Value Ratio

Active
$325,000
2
bds
|
2
ba
|
1,182
sqft
|
built
1966
1050 Wall St, Ann Arbor, MI 48105
$-1,302
Cash flow
-20.9%
Cash-on-Cash Return
1.3%
Cap rate
0.8%
Rent to Value Ratio
Active
$449,000
3
bds
|
4
ba
|
2,208
sqft
|
built
1994
2512 Jade Ct, Ann Arbor, MI 48103
$-1,357
Cash flow
-15.8%
Cash-on-Cash Return
2.5%
Cap rate
0.6%
Rent to Value Ratio
Active
$525,000
3
bds
|
3
ba
|
1,368
sqft
|
built
1941
1215 Prescott Ave, Ann Arbor, MI 48103
$-1,717
Cash flow
-17.1%
Cash-on-Cash Return
2.2%
Cap rate
0.6%
Rent to Value Ratio

Active
$898,000
4
bds
|
4
ba
|
3,784
sqft
|
built
1969
2971 Daleview Dr, Ann Arbor, MI 48105
$-3,326
Cash flow
-19.3%
Cash-on-Cash Return
1.7%
Cap rate
0.3%
Rent to Value Ratio

Active
$629,900
4
bds
|
3
ba
|
4,257
sqft
|
built
2022
331 Honey Tree Way, Ann Arbor, MI 48103
$-1,755
Cash flow
-14.5%
Cash-on-Cash Return
2.8%
Cap rate
0.6%
Rent to Value Ratio

Active
$795,000
4
bds
|
4
ba
|
3,807
sqft
|
built
1974
3949 Waldenwood Dr, Ann Arbor, MI 48105
$-2,635
Cash flow
-17.3%
Cash-on-Cash Return
2.2%
Cap rate
0.5%
Rent to Value Ratio
Active
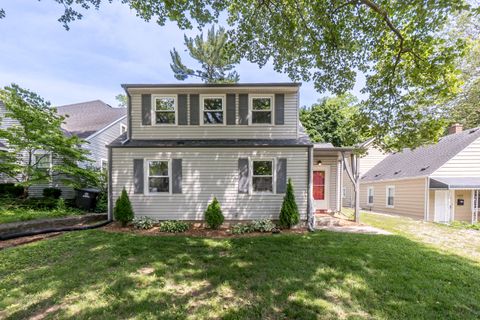
$460,000
3
bds
|
2
ba
|
1,548
sqft
|
built
1927
324 Highlake Ave, Ann Arbor, MI 48103
$-1,205
Cash flow
-13.7%
Cash-on-Cash Return
3.0%
Cap rate
0.6%
Rent to Value Ratio
Active
$869,000
5
bds
|
3
ba
|
2,176
sqft
|
built
1920
721 W Washington St, Ann Arbor, MI 48103
$-2,968
Cash flow
-17.8%
Cash-on-Cash Return
2.0%
Cap rate
0.4%
Rent to Value Ratio
Active
$715,500
4
bds
|
2
ba
|
1,448
sqft
|
built
1924
1117 S Forest Ave, Ann Arbor, MI 48104
$-2,311
Cash flow
-16.9%
Cash-on-Cash Return
2.3%
Cap rate
0.4%
Rent to Value Ratio
Active
$315,000
2
bds
|
2
ba
|
1,560
sqft
|
built
1975
2165 Pauline Ct, Ann Arbor, MI 48103
$-821
Cash flow
-13.6%
Cash-on-Cash Return
3.0%
Cap rate
0.7%
Rent to Value Ratio
Active
$755,000
bds
|
0
ba
|
0
sqft
|
built
1901
508 W Summit St, Ann Arbor, MI 48103
$-3,428
Cash flow
-23.7%
Cash-on-Cash Return
0.7%
Cap rate
0.4%
Rent to Value Ratio
Active
$445,000
3
bds
|
4
ba
|
2,366
sqft
|
built
1979
2174 Overlook Ct, Ann Arbor, MI 48103
$-1,528
Cash flow
-17.9%
Cash-on-Cash Return
2.0%
Cap rate
0.7%
Rent to Value Ratio

Active
$475,000
3
bds
|
2
ba
|
1,419
sqft
|
built
2021
560 Little Lake Dr, Ann Arbor, MI 48103
$-976
Cash flow
-10.7%
Cash-on-Cash Return
3.7%
Cap rate
0.6%
Rent to Value Ratio
Active
$959,900
6
bds
|
5
ba
|
5,218
sqft
|
built
1999
5050 Pleasant Lake Rd, Ann Arbor, MI 48103
$-2,371
Cash flow
-12.9%
Cash-on-Cash Return
3.2%
Cap rate
0.6%
Rent to Value Ratio
Active
$750,000
4
bds
|
3
ba
|
2,874
sqft
|
built
2018
406 Pineway Dr, Ann Arbor, MI 48103
$-2,105
Cash flow
-14.6%
Cash-on-Cash Return
2.8%
Cap rate
0.5%
Rent to Value Ratio
Active
$469,900
3
bds
|
1
ba
|
1,724
sqft
|
built
1958
1610 Saunders Cres, Ann Arbor, MI 48103
$-1,125
Cash flow
-12.5%
Cash-on-Cash Return
3.3%
Cap rate
0.5%
Rent to Value Ratio
Active
$450,000
3
bds
|
2
ba
|
1,214
sqft
|
built
1957
2236 Medford Rd, Ann Arbor, MI 48104
$-1,574
Cash flow
-18.2%
Cash-on-Cash Return
1.9%
Cap rate
0.6%
Rent to Value Ratio
Active
$1,375,000
3
bds
|
2
ba
|
2,507
sqft
|
built
2006
639 N 4th Ave, Ann Arbor, MI 48104
$-6,306
Cash flow
-23.9%
Cash-on-Cash Return
0.6%
Cap rate
0.3%
Rent to Value Ratio

Active
$675,000
4
bds
|
4
ba
|
3,354
sqft
|
built
1996
5521 Lohr Lake Dr, Ann Arbor, MI 48108
$-1,906
Cash flow
-14.7%
Cash-on-Cash Return
2.8%
Cap rate
0.5%
Rent to Value Ratio
Active
$1,725,000
5
bds
|
5
ba
|
4,817
sqft
|
built
1908
1015 Olivia Ave, Ann Arbor, MI 48104
$-7,522
Cash flow
-22.8%
Cash-on-Cash Return
0.9%
Cap rate
0.3%
Rent to Value Ratio
Active
$488,000
3
bds
|
4
ba
|
3,003
sqft
|
built
1991
2782 Maitland Dr, Ann Arbor, MI 48105
$-1,848
Cash flow
-19.8%
Cash-on-Cash Return
1.6%
Cap rate
0.6%
Rent to Value Ratio
Active
$2,285,000
4
bds
|
6
ba
|
6,904
sqft
|
built
1927
2010 Devonshire Rd, Ann Arbor, MI 48104
$-9,831
Cash flow
-22.4%
Cash-on-Cash Return
1.0%
Cap rate
0.4%
Rent to Value Ratio

Active
$1,115,000
5
bds
|
5
ba
|
5,066
sqft
|
built
2006
6577 Heron Ct, Ann Arbor, MI 48103
$-3,728
Cash flow
-17.4%
Cash-on-Cash Return
2.1%
Cap rate
0.4%
Rent to Value Ratio
Active
$544,900
4
bds
|
2
ba
|
2,700
sqft
|
built
1966
3629 Frederick Dr, Ann Arbor, MI 48105
$-1,395
Cash flow
-13.4%
Cash-on-Cash Return
3.1%
Cap rate
0.6%
Rent to Value Ratio

Active
$975,000
3
bds
|
3
ba
|
2,178
sqft
|
built
1961
300 3rd St, Ann Arbor, MI 48103
$-3,562
Cash flow
-19.1%
Cash-on-Cash Return
1.8%
Cap rate
0.3%
Rent to Value Ratio
Active
$297,500
2
bds
|
2
ba
|
926
sqft
|
built
1999
1890 Lindsay Ln, Ann Arbor, MI 48104
$-967
Cash flow
-17.0%
Cash-on-Cash Return
2.2%
Cap rate
0.6%
Rent to Value Ratio
Active
$675,000
5
bds
|
3
ba
|
3,407
sqft
|
built
1976
1775 S Franklin Ct, Ann Arbor, MI 48103
$-2,204
Cash flow
-17.0%
Cash-on-Cash Return
2.2%
Cap rate
0.5%
Rent to Value Ratio
Active
$400,000
3
bds
|
2
ba
|
1,637
sqft
|
built
2004
2950 Hunley Dr, Ann Arbor, MI 48105
$-1,241
Cash flow
-16.2%
Cash-on-Cash Return
2.4%
Cap rate
0.7%
Rent to Value Ratio
Active
$439,000
4
bds
|
2
ba
|
1,578
sqft
|
built
1965
2362 Georgetown Blvd, Ann Arbor, MI 48105
$-1,312
Cash flow
-15.6%
Cash-on-Cash Return
2.6%
Cap rate
0.6%
Rent to Value Ratio
Active
$775,000
3
bds
|
4
ba
|
3,134
sqft
|
built
1996
2724 Aspen Ct, Ann Arbor, MI 48108
$-2,500
Cash flow
-16.8%
Cash-on-Cash Return
2.3%
Cap rate
0.6%
Rent to Value Ratio

Active
$2,570,000
6
bds
|
8
ba
|
8,022
sqft
|
built
1992
4911 Red Fox Run, Ann Arbor, MI 48105
$-13,342
Cash flow
-27.1%
Cash-on-Cash Return
-0.1%
Cap rate
0.2%
Rent to Value Ratio

Active
$475,000
2
bds
|
1
ba
|
1,530
sqft
|
built
1901
1673 Broadway St, Ann Arbor, MI 48105
$-1,119
Cash flow
-12.3%
Cash-on-Cash Return
3.3%
Cap rate
0.6%
Rent to Value Ratio

Active
$2,495,000
5
bds
|
7
ba
|
5,237
sqft
|
built
1926
809 Berkshire Rd, Ann Arbor, MI 48104
$-11,281
Cash flow
-23.6%
Cash-on-Cash Return
0.7%
Cap rate
0.3%
Rent to Value Ratio

Active
$669,900
4
bds
|
4
ba
|
3,631
sqft
|
built
1994
1860 Chicory Rdg, Ann Arbor, MI 48103
$-1,940
Cash flow
-15.1%
Cash-on-Cash Return
2.7%
Cap rate
0.5%
Rent to Value Ratio