Ann Arbor, MI Investment Properties for Sale
Browse homes for sale and investment properties in Ann Arbor, MI. Refine your search by price, property type, or more.
Best cash flowing properties in Ann Arbor, MI
Active
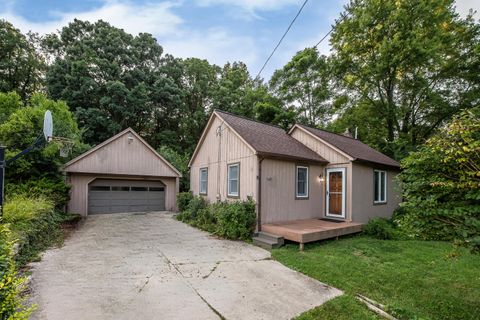
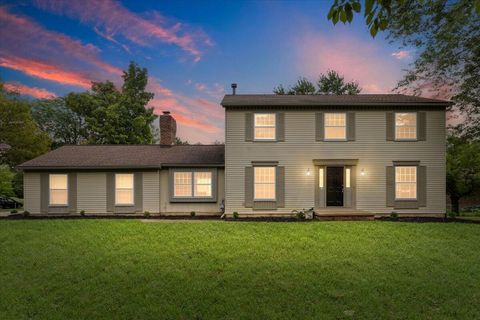
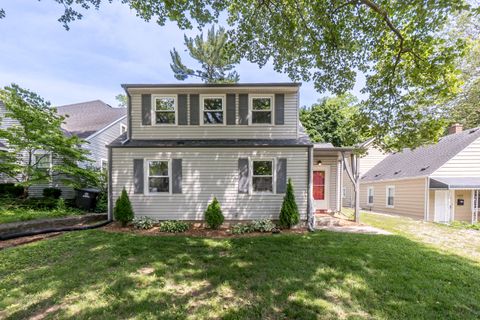
$374,900
3
bds
|
2
ba
|
1,195
sqft
|
built
1949
945 Rose Dr, Ann Arbor, MI 48103
$-447
Cash flow
-6.2%
Cash-on-Cash Return
4.7%
Cap rate
0.7%
Rent to Value Ratio

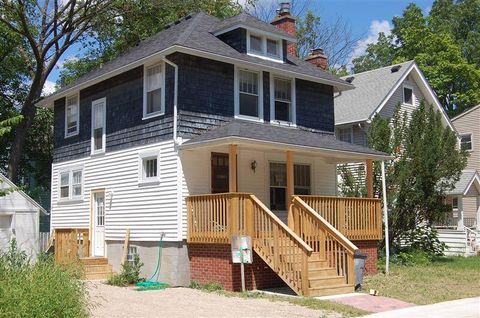
Active
$345,000
3
bds
|
2
ba
|
1,391
sqft
|
built
1966
1050 Wall St, Ann Arbor, MI 48105
$-599
Cash flow
-9.1%
Cash-on-Cash Return
4.1%
Cap rate
0.7%
Rent to Value Ratio
137 out of 151 properties for sale in Ann Arbor, MI
Limited Results Shown
Create a free account, or log in to reveal all property listings and enjoy the complete experience.
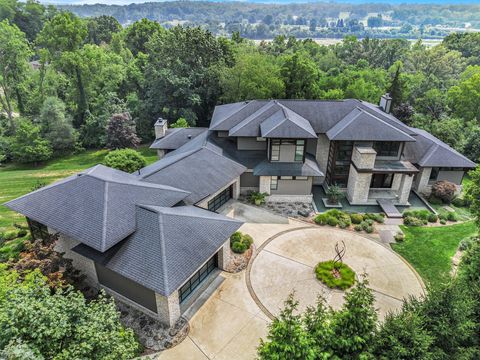
Active
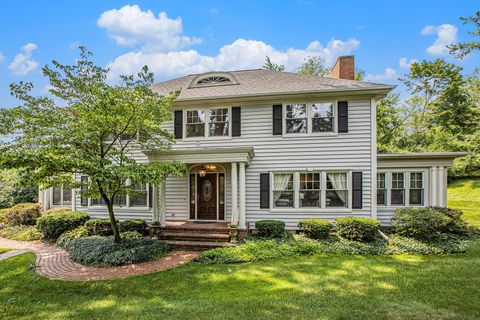
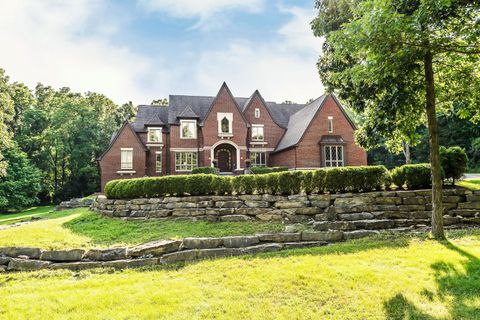
$1,589,000
4
bds
|
3
ba
|
3,477
sqft
|
built
1996
2969 Heather Way, Ann Arbor, MI 48104
$-6,929
Cash flow
-22.8%
Cash-on-Cash Return
0.9%
Cap rate
0.3%
Rent to Value Ratio
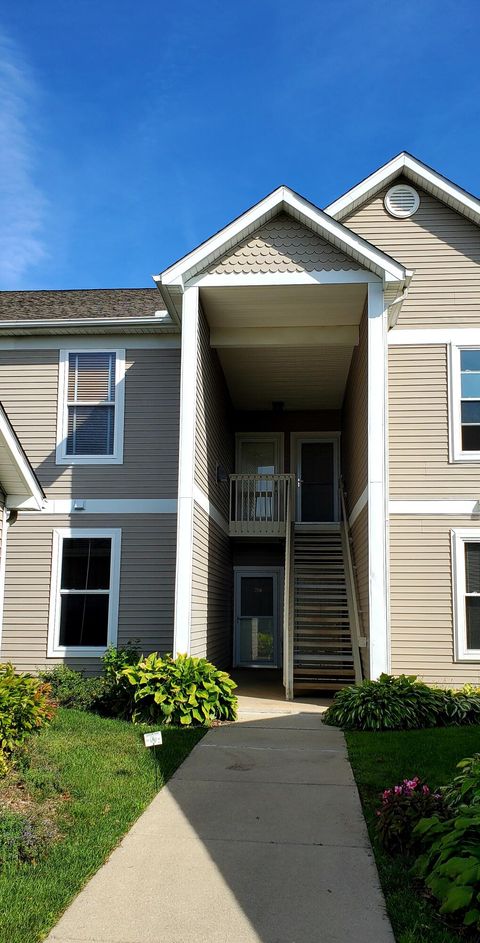
Active
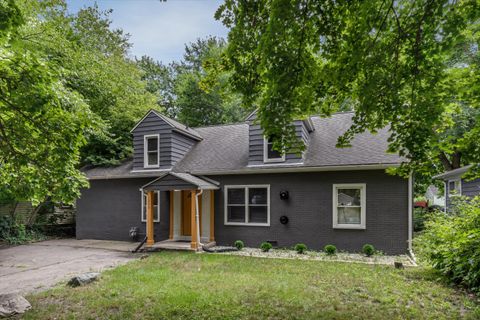
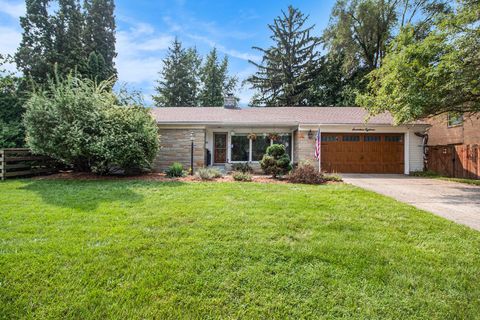
$495,000
4
bds
|
3
ba
|
2,448
sqft
|
built
1947
1236 Kensington Dr, Ann Arbor, MI 48104
$-1,605
Cash flow
-16.9%
Cash-on-Cash Return
2.3%
Cap rate
0.6%
Rent to Value Ratio
Active
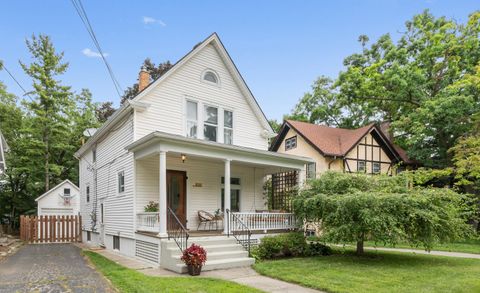
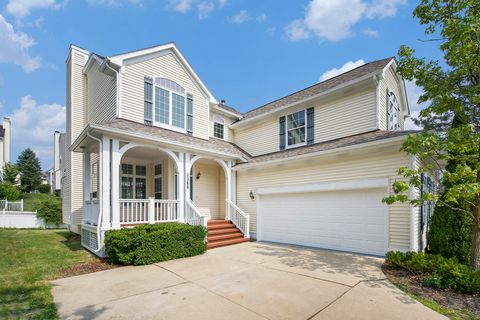
$595,000
3
bds
|
1
ba
|
1,064
sqft
|
built
1914
1022 W Liberty St, Ann Arbor, MI 48103
$-1,532
Cash flow
-13.4%
Cash-on-Cash Return
3.1%
Cap rate
0.6%
Rent to Value Ratio
Active
$335,000
2
bds
|
3
ba
|
1,300
sqft
|
built
2001
3057 Barclay Way, Ann Arbor, MI 48105
$-784
Cash flow
-12.2%
Cash-on-Cash Return
3.3%
Cap rate
0.7%
Rent to Value Ratio
Active
$675,000
4
bds
|
3
ba
|
1,560
sqft
|
built
1927
2509 W Liberty St, Ann Arbor, MI 48103
$-2,227
Cash flow
-17.2%
Cash-on-Cash Return
2.2%
Cap rate
0.4%
Rent to Value Ratio
Active
$390,000
2
bds
|
2
ba
|
1,630
sqft
|
built
2005
222 W Oakbrook Dr, Ann Arbor, MI 48103
$-1,040
Cash flow
-13.9%
Cash-on-Cash Return
2.9%
Cap rate
0.7%
Rent to Value Ratio

Active
$599,800
3
bds
|
4
ba
|
2,519
sqft
|
built
2022
2719 Bristol Ridge Dr, Ann Arbor, MI 48105
$-2,433
Cash flow
-21.2%
Cash-on-Cash Return
1.3%
Cap rate
0.6%
Rent to Value Ratio

Active
$535,000
3
bds
|
3
ba
|
2,069
sqft
|
built
1985
2641 Aspen Rd, Ann Arbor, MI 48108
$-1,762
Cash flow
-17.2%
Cash-on-Cash Return
2.2%
Cap rate
0.6%
Rent to Value Ratio

Active
$850,000
5
bds
|
3
ba
|
2,968
sqft
|
built
1969
3586 E Huron River Dr, Ann Arbor, MI 48104
$-2,822
Cash flow
-17.3%
Cash-on-Cash Return
2.2%
Cap rate
0.5%
Rent to Value Ratio
Active
$370,000
2
bds
|
2
ba
|
1,402
sqft
|
built
1999
1892 Lindsay Ln, Ann Arbor, MI 48104
$-1,515
Cash flow
-21.4%
Cash-on-Cash Return
1.2%
Cap rate
0.7%
Rent to Value Ratio

Active
$1,200,000
3
bds
|
3
ba
|
2,486
sqft
|
built
1979
3595 E Huron River Dr, Ann Arbor, MI 48104
$-5,666
Cash flow
-24.6%
Cash-on-Cash Return
0.5%
Cap rate
0.2%
Rent to Value Ratio
Active
$769,900
5
bds
|
5
ba
|
3,328
sqft
|
built
1977
3600 Windemere Dr, Ann Arbor, MI 48105
$-2,577
Cash flow
-17.5%
Cash-on-Cash Return
2.1%
Cap rate
0.4%
Rent to Value Ratio
Active
$845,000
6
bds
|
2
ba
|
1,194
sqft
|
built
1920
825 Sylvan Ave, Ann Arbor, MI 48104
$-3,266
Cash flow
-20.2%
Cash-on-Cash Return
1.5%
Cap rate
0.3%
Rent to Value Ratio
Active
$4,500,000
5
bds
|
7
ba
|
9,113
sqft
|
built
2014
307 Windycrest Dr, Ann Arbor, MI 48105
$-24,111
Cash flow
-28.0%
Cash-on-Cash Return
-0.3%
Cap rate
0.1%
Rent to Value Ratio
Active
$300,000
2
bds
|
2
ba
|
1,409
sqft
|
built
1999
1354 Fox Pointe Cir, Ann Arbor, MI 48108
$-869
Cash flow
-15.1%
Cash-on-Cash Return
2.7%
Cap rate
0.7%
Rent to Value Ratio
Active
$1,325,000
6
bds
|
5
ba
|
5,726
sqft
|
built
1990
3427 E Dobson Pl, Ann Arbor, MI 48105
$-5,678
Cash flow
-22.4%
Cash-on-Cash Return
1.0%
Cap rate
0.4%
Rent to Value Ratio

Active
$299,000
3
bds
|
3
ba
|
1,920
sqft
|
built
1979
3024 Bolgos Cir, Ann Arbor, MI 48105
$-929
Cash flow
-16.2%
Cash-on-Cash Return
2.4%
Cap rate
0.7%
Rent to Value Ratio
Active
$499,900
1
bds
|
3
ba
|
1,086
sqft
|
built
1957
827 Westwood Ave, Ann Arbor, MI 48103
$-1,154
Cash flow
-12.0%
Cash-on-Cash Return
3.4%
Cap rate
0.6%
Rent to Value Ratio
Active
$600,000
3
bds
|
2
ba
|
2,060
sqft
|
built
1956
1720 Avondale Ave, Ann Arbor, MI 48103
$-1,968
Cash flow
-17.1%
Cash-on-Cash Return
2.2%
Cap rate
0.4%
Rent to Value Ratio
Active
$360,000
3
bds
|
1
ba
|
1,136
sqft
|
built
1955
2828 Packard St, Ann Arbor, MI 48108
$-1,098
Cash flow
-15.9%
Cash-on-Cash Return
2.5%
Cap rate
0.5%
Rent to Value Ratio
Active
$1,699,000
4
bds
|
6
ba
|
8,147
sqft
|
built
2004
2086 Autumn Hill Dr, Ann Arbor, MI 48103
$-8,059
Cash flow
-24.7%
Cash-on-Cash Return
0.5%
Cap rate
0.2%
Rent to Value Ratio
Active
$2,250,000
2
bds
|
3
ba
|
2,205
sqft
|
built
2006
322 E Liberty St, Ann Arbor, MI 48104
$-11,404
Cash flow
-26.4%
Cash-on-Cash Return
0.1%
Cap rate
0.3%
Rent to Value Ratio

Active
$325,000
2
bds
|
2
ba
|
1,182
sqft
|
built
1966
1050 Wall St, Ann Arbor, MI 48105
$-1,302
Cash flow
-20.9%
Cash-on-Cash Return
1.3%
Cap rate
0.8%
Rent to Value Ratio

Active
$339,800
2
bds
|
3
ba
|
1,148
sqft
|
built
2001
3051 Barclay Way, Ann Arbor, MI 48105
$-1,179
Cash flow
-18.1%
Cash-on-Cash Return
2.0%
Cap rate
0.6%
Rent to Value Ratio

Active
$330,000
2
bds
|
2
ba
|
1,120
sqft
|
built
2000
3010 Barclay Way, Ann Arbor, MI 48105
$-1,048
Cash flow
-16.6%
Cash-on-Cash Return
2.3%
Cap rate
0.7%
Rent to Value Ratio

Active
$969,000
5
bds
|
6
ba
|
5,251
sqft
|
built
2005
2570 Andrew Thomas Trl, Ann Arbor, MI 48103
$-3,215
Cash flow
-17.3%
Cash-on-Cash Return
2.2%
Cap rate
0.4%
Rent to Value Ratio
Active
$498,000
4
bds
|
2
ba
|
2,088
sqft
|
built
1965
415 Pinewood St, Ann Arbor, MI 48103
$-1,193
Cash flow
-12.5%
Cash-on-Cash Return
3.3%
Cap rate
0.6%
Rent to Value Ratio
Active
$449,000
3
bds
|
4
ba
|
2,208
sqft
|
built
1994
2512 Jade Ct, Ann Arbor, MI 48103
$-1,357
Cash flow
-15.8%
Cash-on-Cash Return
2.5%
Cap rate
0.6%
Rent to Value Ratio
Active
$525,000
3
bds
|
3
ba
|
1,368
sqft
|
built
1941
1215 Prescott Ave, Ann Arbor, MI 48103
$-1,717
Cash flow
-17.1%
Cash-on-Cash Return
2.2%
Cap rate
0.6%
Rent to Value Ratio

Active
$898,000
4
bds
|
4
ba
|
3,784
sqft
|
built
1969
2971 Daleview Dr, Ann Arbor, MI 48105
$-3,326
Cash flow
-19.3%
Cash-on-Cash Return
1.7%
Cap rate
0.3%
Rent to Value Ratio

Active
$379,900
2
bds
|
3
ba
|
1,478
sqft
|
built
2017
5633 Arbor Chase Dr, Ann Arbor, MI 48103
$-742
Cash flow
-10.2%
Cash-on-Cash Return
3.8%
Cap rate
0.8%
Rent to Value Ratio

Active
$1,250,000
4
bds
|
4
ba
|
3,646
sqft
|
built
1998
588 Green Rd, Ann Arbor, MI 48105
$-5,501
Cash flow
-23.0%
Cash-on-Cash Return
0.9%
Cap rate
0.4%
Rent to Value Ratio
Active
$1,995,000
4
bds
|
6
ba
|
7,170
sqft
|
built
2002
3250 Oak Hollow Dr, Ann Arbor, MI 48103
$-9,267
Cash flow
-24.2%
Cash-on-Cash Return
0.6%
Cap rate
0.2%
Rent to Value Ratio
Active
$565,000
2
bds
|
2
ba
|
1,504
sqft
|
built
1951
1718 E Stadium Blvd, Ann Arbor, MI 48104
$-1,238
Cash flow
-11.4%
Cash-on-Cash Return
3.5%
Cap rate
0.6%
Rent to Value Ratio

Active
$2,499,999
7
bds
|
7
ba
|
8,400
sqft
|
built
1999
2760 N Territorial Rd W, Ann Arbor, MI 48105
$-11,687
Cash flow
-24.4%
Cash-on-Cash Return
0.5%
Cap rate
0.2%
Rent to Value Ratio

Active
$280,000
2
bds
|
2
ba
|
1,376
sqft
|
built
1998
1446 Millbrook Trl, Ann Arbor, MI 48108
$-728
Cash flow
-13.6%
Cash-on-Cash Return
3.0%
Cap rate
0.7%
Rent to Value Ratio

Active
$795,000
4
bds
|
4
ba
|
3,807
sqft
|
built
1974
3949 Waldenwood Dr, Ann Arbor, MI 48105
$-2,635
Cash flow
-17.3%
Cash-on-Cash Return
2.2%
Cap rate
0.5%
Rent to Value Ratio
Active
$499,900
4
bds
|
3
ba
|
1,990
sqft
|
built
2004
1366 N Bay Dr, Ann Arbor, MI 48103
$-1,305
Cash flow
-13.6%
Cash-on-Cash Return
3.0%
Cap rate
0.6%
Rent to Value Ratio