Killeen, TX Investment Properties for Sale
Browse homes for sale and investment properties in Killeen, TX. Refine your search by price, property type, or more.
Best cash flowing properties in Killeen, TX
Active
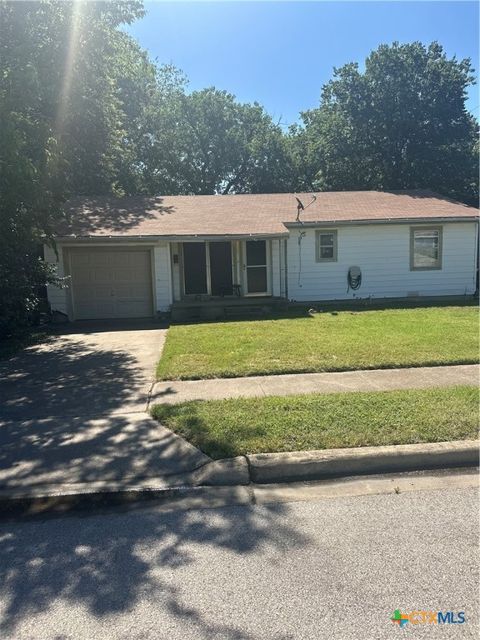
$85,000
3
bds
|
1
ba
|
1,064
sqft
|
built
1958
1004 S 2nd St, Killeen, TX 76541
$137
Cash flow
8.4%
Cash-on-Cash Return
8.2%
Cap rate
1.3%
Rent to Value Ratio
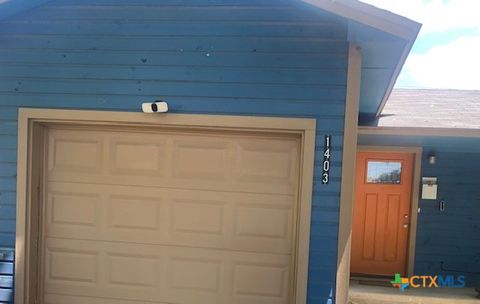
Active
$143,000
3
bds
|
1
ba
|
981
sqft
|
built
1961
1403 Zephyr Rd, Killeen, TX 76541
$-47
Cash flow
-1.7%
Cash-on-Cash Return
5.9%
Cap rate
0.9%
Rent to Value Ratio
543 out of 777 properties for sale in Killeen, TX
Limited Results Shown
Create a free account, or log in to reveal all property listings and enjoy the complete experience.
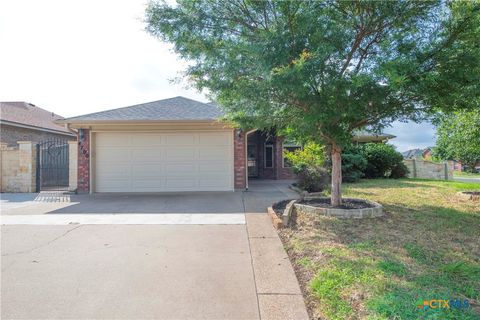
Active
$224,900
3
bds
|
2
ba
|
1,453
sqft
|
built
1998
4700 Aurora Cir, Killeen, TX 76542
$-431
Cash flow
-10.0%
Cash-on-Cash Return
4.0%
Cap rate
0.7%
Rent to Value Ratio
Active
$143,000
3
bds
|
1
ba
|
981
sqft
|
built
1961
1403 Zephyr Rd, Killeen, TX 76541
$-47
Cash flow
-1.7%
Cash-on-Cash Return
5.9%
Cap rate
0.9%
Rent to Value Ratio
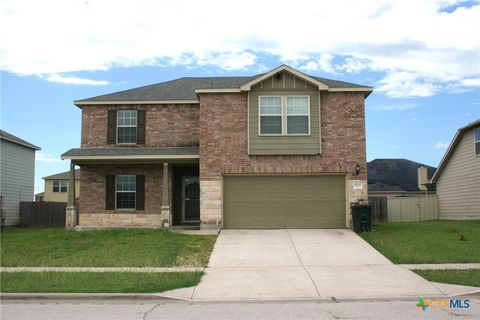
Active
$275,000
4
bds
|
3
ba
|
2,460
sqft
|
built
2014
308 E Vega Ln, Killeen, TX 76542
$-584
Cash flow
-11.1%
Cash-on-Cash Return
3.7%
Cap rate
0.7%
Rent to Value Ratio
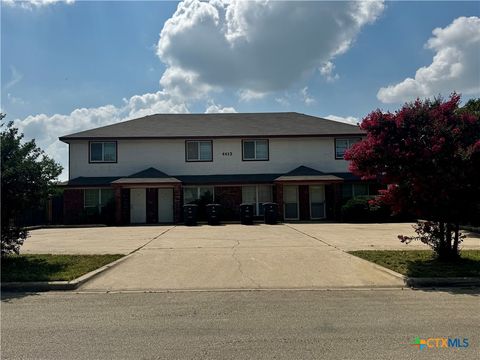
Active
$425,000
bds
|
0
ba
|
4,258
sqft
|
built
2003
4413 Abigail Dr, Killeen, TX 76549
$-2,424
Cash flow
-29.8%
Cash-on-Cash Return
-0.6%
Cap rate
0.2%
Rent to Value Ratio
Active
$219,900
3
bds
|
2
ba
|
1,509
sqft
|
built
1983
1517 Iris Ave, Killeen, TX 76543
$-117
Cash flow
-2.8%
Cash-on-Cash Return
5.6%
Cap rate
0.8%
Rent to Value Ratio
Active
$85,000
3
bds
|
1
ba
|
1,064
sqft
|
built
1958
1004 S 2nd St, Killeen, TX 76541
$137
Cash flow
8.4%
Cash-on-Cash Return
8.2%
Cap rate
1.3%
Rent to Value Ratio
Active
$235,000
4
bds
|
2
ba
|
1,918
sqft
|
built
2007
5202 Holster Dr, Killeen, TX 76549
$-459
Cash flow
-10.2%
Cash-on-Cash Return
3.9%
Cap rate
0.7%
Rent to Value Ratio
Active
$268,500
3
bds
|
2
ba
|
1,476
sqft
|
built
2025
3314 Lake Rd, Killeen, TX 76543
$-762
Cash flow
-14.8%
Cash-on-Cash Return
2.9%
Cap rate
0.4%
Rent to Value Ratio
Active
$305,000
4
bds
|
3
ba
|
2,226
sqft
|
built
2020
901 Marlow Cv, Killeen, TX 76542
$-745
Cash flow
-12.7%
Cash-on-Cash Return
3.3%
Cap rate
0.7%
Rent to Value Ratio
Active
$449,500
4
bds
|
3
ba
|
3,486
sqft
|
built
2005
214 Forest Ridge Dr, Killeen, TX 76543
$-972
Cash flow
-11.3%
Cash-on-Cash Return
3.7%
Cap rate
0.6%
Rent to Value Ratio
Active
$599,900
5
bds
|
4
ba
|
3,681
sqft
|
built
2022
7606 Aluminum Dr, Killeen, TX 76542
$-1,780
Cash flow
-15.5%
Cash-on-Cash Return
2.7%
Cap rate
0.5%
Rent to Value Ratio
Active
$257,000
3
bds
|
3
ba
|
1,851
sqft
|
built
2008
6707 Bayberry Dr, Killeen, TX 76542
$-530
Cash flow
-10.8%
Cash-on-Cash Return
3.8%
Cap rate
0.7%
Rent to Value Ratio
Active
$289,000
3
bds
|
2
ba
|
1,962
sqft
|
built
2014
2507 Inspiration Dr, Killeen, TX 76549
$-726
Cash flow
-13.1%
Cash-on-Cash Return
3.3%
Cap rate
0.6%
Rent to Value Ratio
Active
$220,000
3
bds
|
3
ba
|
1,406
sqft
|
built
2006
4602 Causeway Ct, Killeen, TX 76549
$-530
Cash flow
-12.6%
Cash-on-Cash Return
3.4%
Cap rate
0.6%
Rent to Value Ratio
Active
$140,000
3
bds
|
2
ba
|
1,011
sqft
|
built
1987
2306 Remington Dr, Killeen, TX 76543
$-142
Cash flow
-5.3%
Cash-on-Cash Return
5.0%
Cap rate
0.9%
Rent to Value Ratio
Active
$320,000
bds
|
0
ba
|
2,606
sqft
|
built
2004
4102 Jeff Scott Dr, Killeen, TX 76549
$-1,372
Cash flow
-22.4%
Cash-on-Cash Return
1.1%
Cap rate
0.3%
Rent to Value Ratio
Active
$225,000
4
bds
|
2
ba
|
1,517
sqft
|
built
1996
204 James Loop, Killeen, TX 76542
$-526
Cash flow
-12.2%
Cash-on-Cash Return
3.5%
Cap rate
0.6%
Rent to Value Ratio
Active
$315,000
4
bds
|
3
ba
|
2,350
sqft
|
built
2013
3610 Parkmill Dr, Killeen, TX 76542
$-728
Cash flow
-12.1%
Cash-on-Cash Return
3.5%
Cap rate
0.6%
Rent to Value Ratio
Active
$339,000
5
bds
|
3
ba
|
2,253
sqft
|
built
2019
5101 Hacienda Dr, Killeen, TX 76549
$-793
Cash flow
-12.2%
Cash-on-Cash Return
3.5%
Cap rate
0.6%
Rent to Value Ratio
Active
$365,000
5
bds
|
3
ba
|
3,174
sqft
|
built
2011
4708 Old Homestead St, Killeen, TX 76549
$-973
Cash flow
-13.9%
Cash-on-Cash Return
3.1%
Cap rate
0.6%
Rent to Value Ratio
Active
$269,900
4
bds
|
2
ba
|
1,717
sqft
|
built
2020
6505 Cassidy Ln, Killeen, TX 76542
$-463
Cash flow
-9.0%
Cash-on-Cash Return
4.2%
Cap rate
0.7%
Rent to Value Ratio
Active
$225,000
4
bds
|
2
ba
|
1,587
sqft
|
built
2001
4413 Pete Dr, Killeen, TX 76549
$-355
Cash flow
-8.2%
Cash-on-Cash Return
4.4%
Cap rate
0.8%
Rent to Value Ratio
Active
$295,000
bds
|
0
ba
|
2,600
sqft
|
built
2002
2704 Lucille Dr, Killeen, TX 76549
$-803
Cash flow
-14.2%
Cash-on-Cash Return
3.0%
Cap rate
0.6%
Rent to Value Ratio
Active
$250,000
4
bds
|
2
ba
|
1,918
sqft
|
built
2010
4102 Jack Barnes Ave, Killeen, TX 76549
$-568
Cash flow
-11.9%
Cash-on-Cash Return
3.5%
Cap rate
0.6%
Rent to Value Ratio
Active
$310,000
4
bds
|
3
ba
|
2,266
sqft
|
built
2007
4901 Hammerstone Trl, Killeen, TX 76542
$-762
Cash flow
-12.8%
Cash-on-Cash Return
3.3%
Cap rate
0.6%
Rent to Value Ratio

Active
$375,000
4
bds
|
3
ba
|
3,035
sqft
|
built
2009
5805 Siltstone Loop, Killeen, TX 76542
$-927
Cash flow
-12.9%
Cash-on-Cash Return
3.3%
Cap rate
0.6%
Rent to Value Ratio
Active
$415,000
4
bds
|
2
ba
|
2,264
sqft
|
built
2022
8503 James Herring Way, Killeen, TX 76542
$-1,048
Cash flow
-13.2%
Cash-on-Cash Return
3.2%
Cap rate
0.6%
Rent to Value Ratio
Active
$255,000
4
bds
|
3
ba
|
2,376
sqft
|
built
2007
508 Taurus Dr, Killeen, TX 76542
$-414
Cash flow
-8.5%
Cash-on-Cash Return
4.3%
Cap rate
0.8%
Rent to Value Ratio
Active
$189,000
3
bds
|
2
ba
|
1,465
sqft
|
built
2000
3807 Sunflower Dr, Killeen, TX 76542
$-221
Cash flow
-6.1%
Cash-on-Cash Return
4.9%
Cap rate
0.8%
Rent to Value Ratio
Active
$259,000
3
bds
|
3
ba
|
2,195
sqft
|
built
1992
310 Southbrook Dr, Killeen, TX 76542
$-566
Cash flow
-11.4%
Cash-on-Cash Return
3.6%
Cap rate
0.6%
Rent to Value Ratio
Active
$228,999
3
bds
|
2
ba
|
1,376
sqft
|
built
2014
6409 Katy Creek Ln, Killeen, TX 76549
$-613
Cash flow
-14.0%
Cash-on-Cash Return
3.1%
Cap rate
0.6%
Rent to Value Ratio
Active
$234,900
4
bds
|
2
ba
|
1,811
sqft
|
built
2002
4403 Esta Lee Ave, Killeen, TX 76549
$-457
Cash flow
-10.2%
Cash-on-Cash Return
3.9%
Cap rate
0.7%
Rent to Value Ratio
Active
$255,000
4
bds
|
2
ba
|
1,798
sqft
|
built
2002
4305 Maggie Dr, Killeen, TX 76549
$-540
Cash flow
-11.0%
Cash-on-Cash Return
3.7%
Cap rate
0.7%
Rent to Value Ratio
Active
$268,000
5
bds
|
3
ba
|
2,074
sqft
|
built
2011
2905 Montague County Dr, Killeen, TX 76549
$-488
Cash flow
-9.5%
Cash-on-Cash Return
4.1%
Cap rate
0.7%
Rent to Value Ratio
Active
$239,900
4
bds
|
2
ba
|
1,535
sqft
|
built
1995
3807 Water Oak Dr, Killeen, TX 76542
$-478
Cash flow
-10.4%
Cash-on-Cash Return
3.9%
Cap rate
0.7%
Rent to Value Ratio
Active
$139,900
3
bds
|
2
ba
|
1,039
sqft
|
built
1955
917 Carrie Ave, Killeen, TX 76541
$-124
Cash flow
-4.6%
Cash-on-Cash Return
5.2%
Cap rate
0.9%
Rent to Value Ratio
Active
$210,000
4
bds
|
2
ba
|
1,556
sqft
|
built
2002
3302 Southhill Dr, Killeen, TX 76549
$-359
Cash flow
-8.9%
Cash-on-Cash Return
4.2%
Cap rate
0.8%
Rent to Value Ratio
Active
$225,000
3
bds
|
2
ba
|
1,588
sqft
|
built
2011
308 Constellation Dr, Killeen, TX 76542
$-439
Cash flow
-10.2%
Cash-on-Cash Return
3.9%
Cap rate
0.7%
Rent to Value Ratio
Active
$315,000
bds
|
0
ba
|
2,642
sqft
|
built
2005
1207 Nicholas Cir, Killeen, TX 76542
$-1,417
Cash flow
-23.5%
Cash-on-Cash Return
0.9%
Cap rate
0.3%
Rent to Value Ratio
Active
$280,000
4
bds
|
3
ba
|
2,553
sqft
|
built
2004
2202 Napier Dr, Killeen, TX 76542
$-472
Cash flow
-8.8%
Cash-on-Cash Return
4.2%
Cap rate
0.7%
Rent to Value Ratio