East Baton Rouge Parish County Investment Properties for Sale
Browse homes for sale and investment properties in East Baton Rouge Parish County. Refine your search by price, property type, or more.
Best cash flowing properties in East Baton Rouge Parish County
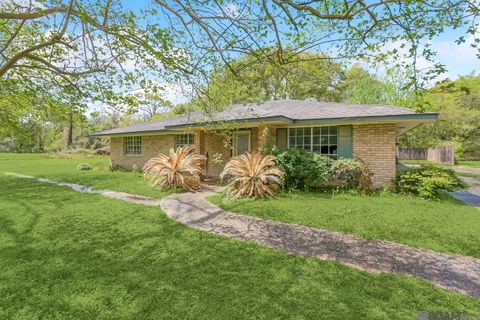
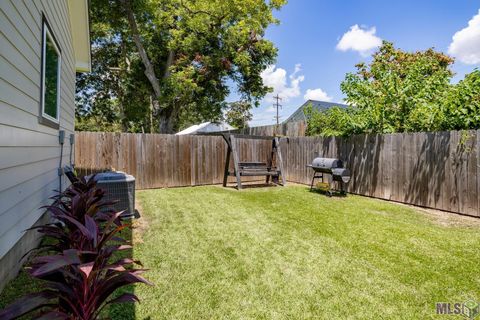
Active
$89,000
3
bds
|
2
ba
|
1,888
sqft
|
built
1975
3783 Lone Oak Dr, Baton Rouge, LA 70814
$821
Cash flow
48.1%
Cash-on-Cash Return
16.7%
Cap rate
2.0%
Rent to Value Ratio
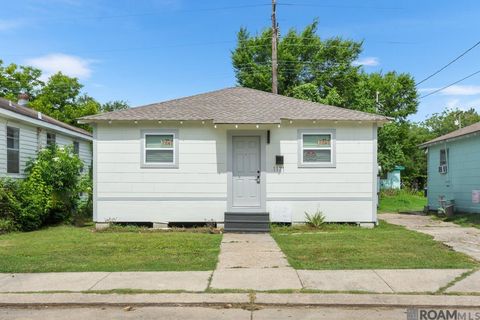
Active
$69,900
2
bds
|
1
ba
|
692
sqft
|
built
1975
1171 N 46th St, Baton Rouge, LA 70802
$759
Cash flow
12.7%
Cash-on-Cash Return
13.0%
Cap rate
1.6%
Rent to Value Ratio
1,014 out of 1,021 properties for sale in East Baton Rouge Parish County
Limited Results Shown
Create a free account, or log in to reveal all property listings and enjoy the complete experience.
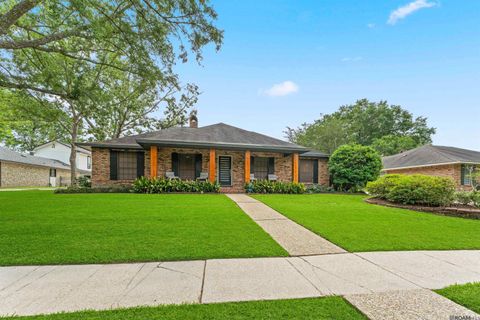
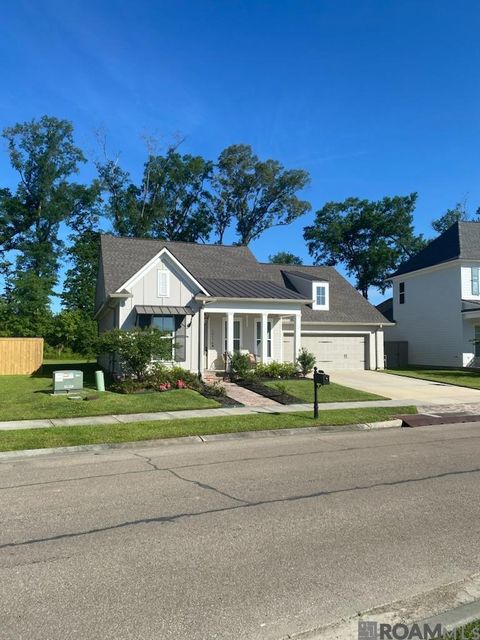
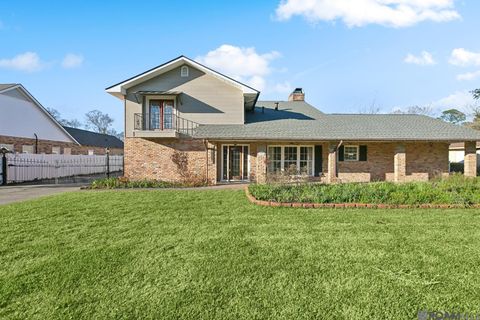
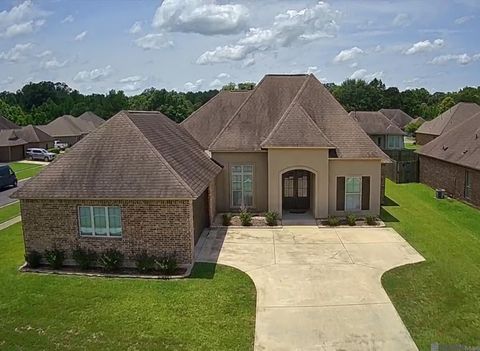
Active
$389,500
4
bds
|
3
ba
|
2,252
sqft
|
built
1985
6017 Hickory Ridge Blvd, Baton Rouge, LA 70817
$-118
Cash flow
-1.6%
Cash-on-Cash Return
5.3%
Cap rate
0.6%
Rent to Value Ratio
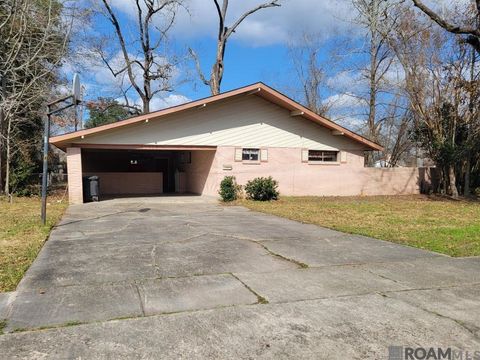
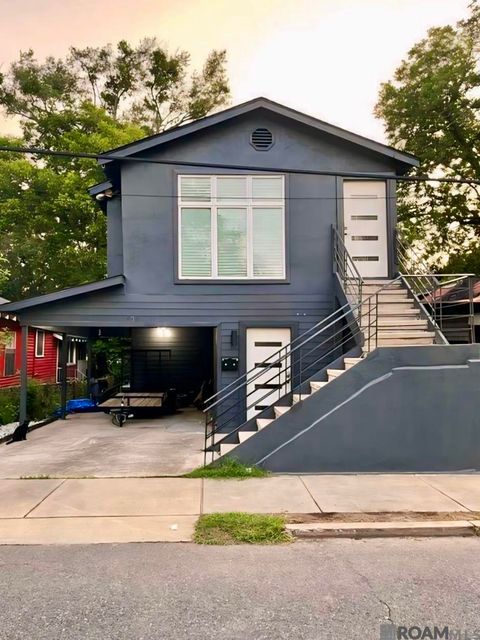
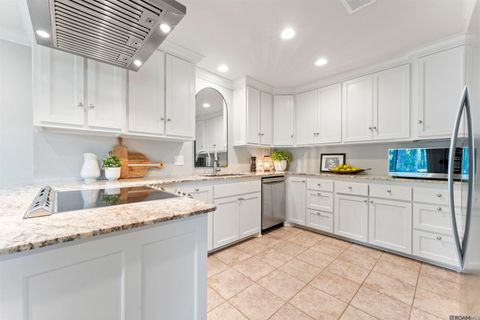
Active
$169,000
3
bds
|
2
ba
|
1,684
sqft
|
built
1966
11775 Parkwood Dr, Baton Rouge, LA 70815
$438
Cash flow
13.5%
Cash-on-Cash Return
8.8%
Cap rate
1.1%
Rent to Value Ratio
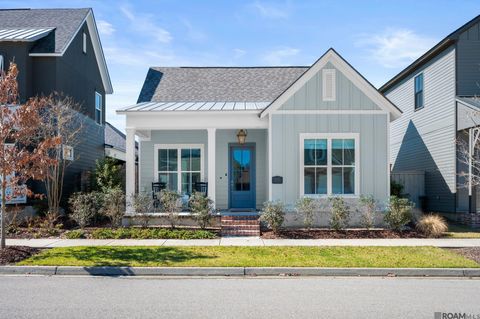
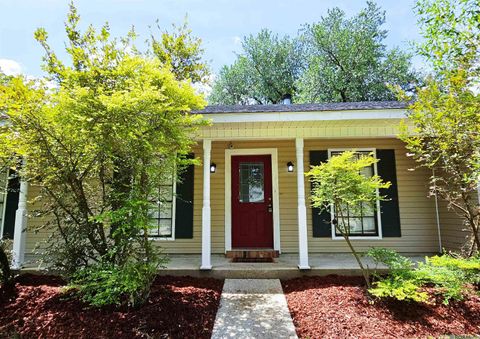
Active
$295,000
2
bds
|
2
ba
|
1,339
sqft
|
built
1950
600 Blanchard St, Baton Rouge, LA 70806
$-154
Cash flow
-2.7%
Cash-on-Cash Return
5.1%
Cap rate
0.6%
Rent to Value Ratio
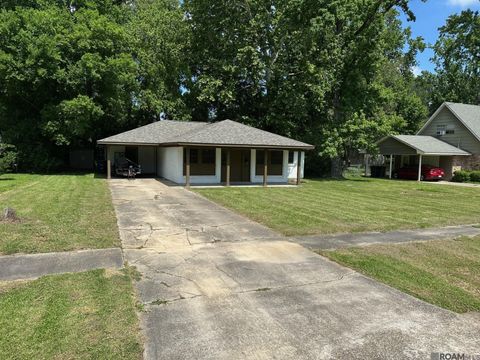
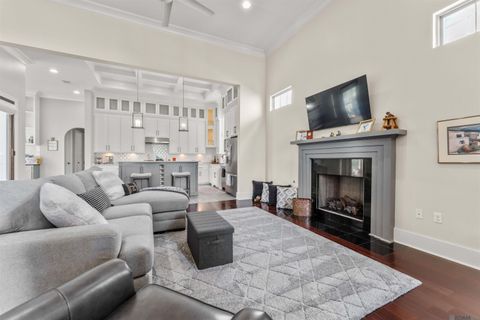
Active
$355,000
3
bds
|
2
ba
|
2,076
sqft
|
built
2005
16632 Highland Club Ave, Baton Rouge, LA 70817
$-122
Cash flow
-1.8%
Cash-on-Cash Return
5.3%
Cap rate
0.6%
Rent to Value Ratio
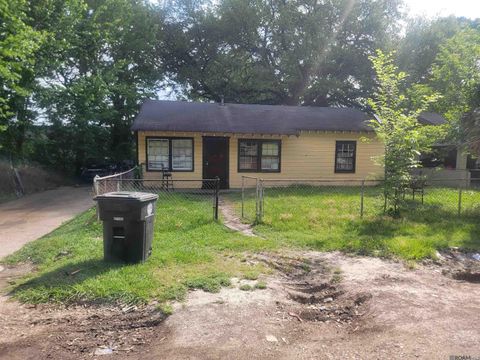
Active
$275,000
3
bds
|
1
ba
|
1,380
sqft
|
built
1952
7769 Lasalle Ave, Baton Rouge, LA 70806
$-61
Cash flow
-1.2%
Cash-on-Cash Return
5.4%
Cap rate
0.7%
Rent to Value Ratio
Active
$530,000
4
bds
|
4
ba
|
3,004
sqft
|
built
1990
14513 N Majestic Oaks Pl, Baton Rouge, LA 70810
$-377
Cash flow
-3.7%
Cash-on-Cash Return
4.8%
Cap rate
0.6%
Rent to Value Ratio
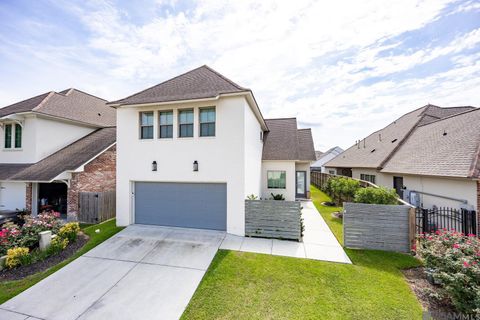
Active
$451,000
4
bds
|
3
ba
|
2,236
sqft
|
built
2022
13174 Elissa Ln, Baton Rouge, LA 70818
$-1,088
Cash flow
-12.6%
Cash-on-Cash Return
2.8%
Cap rate
0.4%
Rent to Value Ratio
Active
$275,000
bds
|
0
ba
|
2,114
sqft
|
built
638 Eddie Robinson Sr Dr, Baton Rouge, LA 70802
$79
Cash flow
1.5%
Cash-on-Cash Return
6.0%
Cap rate
0.7%
Rent to Value Ratio
Active
$430,000
3
bds
|
2
ba
|
1,679
sqft
|
built
2022
14232 Haile Way, Baton Rouge, LA 70817
$-308
Cash flow
-3.7%
Cash-on-Cash Return
4.8%
Cap rate
0.6%
Rent to Value Ratio
Active
$259,500
3
bds
|
2
ba
|
1,446
sqft
|
built
1972
525 Baird Dr, Baton Rouge, LA 70808
$-331
Cash flow
-6.7%
Cash-on-Cash Return
4.1%
Cap rate
0.5%
Rent to Value Ratio
Active
$475,000
4
bds
|
4
ba
|
4,415
sqft
|
built
1965
9555 Goodwood Blvd, Baton Rouge, LA 70815
$-523
Cash flow
-5.7%
Cash-on-Cash Return
4.4%
Cap rate
0.5%
Rent to Value Ratio

Active
$290,900
3
bds
|
2
ba
|
2,416
sqft
|
built
2007
14737 Rhonda Ave, Baton Rouge, LA 70816
$72
Cash flow
1.3%
Cash-on-Cash Return
6.0%
Cap rate
0.7%
Rent to Value Ratio
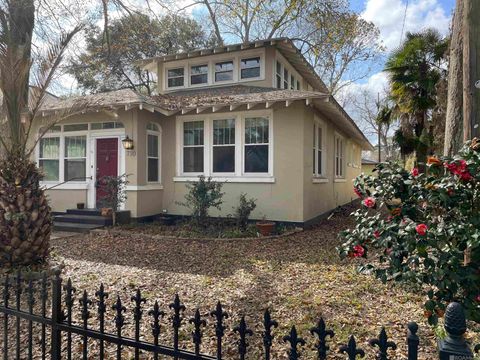
Active
$299,000
3
bds
|
2
ba
|
1,808
sqft
|
built
1930
730 Camelia Ave, Baton Rouge, LA 70806
$-449
Cash flow
-7.8%
Cash-on-Cash Return
3.9%
Cap rate
0.5%
Rent to Value Ratio
Active
$274,000
4
bds
|
3
ba
|
1,975
sqft
|
built
1986
13141 Devall Rd, Baton Rouge, LA 70818
$-193
Cash flow
-3.7%
Cash-on-Cash Return
4.8%
Cap rate
0.6%
Rent to Value Ratio
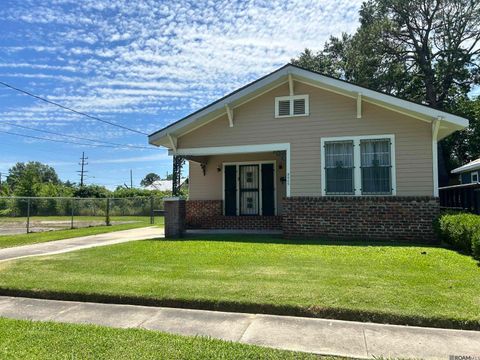
Active
$125,000
2
bds
|
1
ba
|
1,665
sqft
|
built
1975
2060 Hemlock St, Baton Rouge, LA 70802
$167
Cash flow
7.0%
Cash-on-Cash Return
7.3%
Cap rate
0.9%
Rent to Value Ratio
Active
$499,000
5
bds
|
4
ba
|
4,065
sqft
|
built
1983
12024 Lovett Rd, Baton Rouge, LA 70818
$123
Cash flow
1.3%
Cash-on-Cash Return
6.0%
Cap rate
0.7%
Rent to Value Ratio
Active
$295,000
3
bds
|
2
ba
|
1,756
sqft
|
built
1969
7895 Lower Zachary Rd, Zachary, LA 70791
$-16
Cash flow
-0.3%
Cash-on-Cash Return
5.6%
Cap rate
0.7%
Rent to Value Ratio
Active
$499,900
4
bds
|
3
ba
|
3,147
sqft
|
built
2012
11759 Blackwater Rd, Baker, LA 70714
$118
Cash flow
1.2%
Cash-on-Cash Return
6.0%
Cap rate
0.7%
Rent to Value Ratio
Active
$289,000
3
bds
|
3
ba
|
2,023
sqft
|
built
2003
3243 Camelia St, Zachary, LA 70791
$12
Cash flow
0.2%
Cash-on-Cash Return
5.7%
Cap rate
0.7%
Rent to Value Ratio
Active
$314,900
4
bds
|
3
ba
|
2,304
sqft
|
built
2014
6691 Vista Oaks Ct, Zachary, LA 70791
$-137
Cash flow
-2.3%
Cash-on-Cash Return
5.2%
Cap rate
0.6%
Rent to Value Ratio
Active
$248,000
3
bds
|
2
ba
|
1,861
sqft
|
built
1987
15166 Cocodrie Ave, Baton Rouge, LA 70817
$-70
Cash flow
-1.5%
Cash-on-Cash Return
5.3%
Cap rate
0.6%
Rent to Value Ratio
Active
$539,500
3
bds
|
2
ba
|
2,130
sqft
|
built
2014
10726 Preservation Way, Baton Rouge, LA 70810
$-746
Cash flow
-7.2%
Cash-on-Cash Return
4.0%
Cap rate
0.5%
Rent to Value Ratio
Active
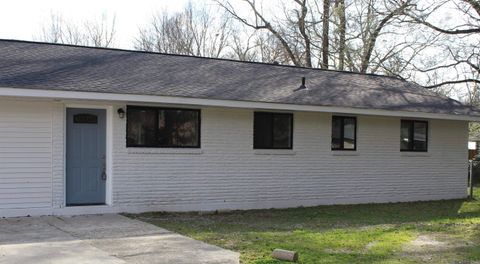
$24,995
3
bds
|
1
ba
|
949
sqft
|
built
1975
5262 E Brookstown Dr, Baton Rouge, LA 70805
$621
Cash flow
28.9%
Cash-on-Cash Return
29.8%
Cap rate
3.6%
Rent to Value Ratio
Active
$329,000
3
bds
|
3
ba
|
1,860
sqft
|
built
2020
2537 Jura St, Baton Rouge, LA 70806
$237
Cash flow
3.8%
Cash-on-Cash Return
6.5%
Cap rate
0.8%
Rent to Value Ratio
Active
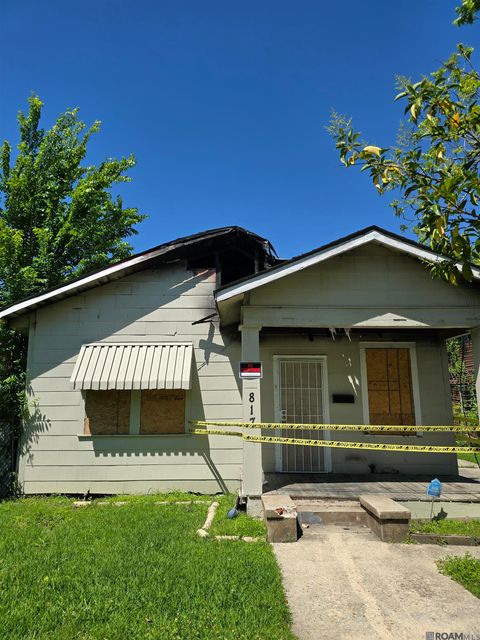
$11,000
2
bds
|
1
ba
|
940
sqft
|
built
1953
817 N 25th St, Baton Rouge, LA 70802
$621
Cash flow
65.8%
Cash-on-Cash Return
67.7%
Cap rate
8.2%
Rent to Value Ratio
Active
$195,000
3
bds
|
2
ba
|
1,730
sqft
|
built
1965
4686 Yvonne Dr, Baker, LA 70714
$112
Cash flow
3.0%
Cash-on-Cash Return
6.4%
Cap rate
0.8%
Rent to Value Ratio
Active
$546,000
4
bds
|
3
ba
|
2,717
sqft
|
built
2018
8543 Landau Dr, Baton Rouge, LA 70817
$49
Cash flow
0.5%
Cash-on-Cash Return
5.8%
Cap rate
0.7%
Rent to Value Ratio
Active
$210,000
4
bds
|
2
ba
|
2,137
sqft
|
built
1975
7108 Colfax Dr, Baker, LA 70714
$248
Cash flow
6.2%
Cash-on-Cash Return
7.1%
Cap rate
0.9%
Rent to Value Ratio
Active
$949,000
5
bds
|
4
ba
|
4,375
sqft
|
built
2003
413 Longmeadow Dr, Baton Rouge, LA 70810
$-608
Cash flow
-3.3%
Cash-on-Cash Return
4.9%
Cap rate
0.6%
Rent to Value Ratio
Active
$389,000
4
bds
|
3
ba
|
2,467
sqft
|
built
1980
15857 Brown Rd, Baker, LA 70714
$-875
Cash flow
-11.7%
Cash-on-Cash Return
3.0%
Cap rate
0.4%
Rent to Value Ratio
Active
$289,000
4
bds
|
3
ba
|
2,419
sqft
|
built
1965
379 Wilton Dr, Baton Rouge, LA 70815
$12
Cash flow
0.2%
Cash-on-Cash Return
5.7%
Cap rate
0.7%
Rent to Value Ratio
Active
$510,000
4
bds
|
3
ba
|
3,031
sqft
|
built
1984
631 W Woodruff Dr, Baton Rouge, LA 70808
$-1,359
Cash flow
-13.9%
Cash-on-Cash Return
2.5%
Cap rate
0.3%
Rent to Value Ratio
Active
$242,000
4
bds
|
2
ba
|
2,086
sqft
|
built
1970
9978 W Tams Dr, Baton Rouge, LA 70815
$166
Cash flow
3.6%
Cash-on-Cash Return
6.5%
Cap rate
0.8%
Rent to Value Ratio
Active
$699,900
3
bds
|
2
ba
|
2,750
sqft
|
built
1932
8262 Highland Rd, Baton Rouge, LA 70808
$-552
Cash flow
-4.1%
Cash-on-Cash Return
4.7%
Cap rate
0.6%
Rent to Value Ratio
Active
$170,000
3
bds
|
3
ba
|
1,920
sqft
|
built
1970
10053 Jefferson Hwy, Baton Rouge, LA 70809
$153
Cash flow
4.7%
Cash-on-Cash Return
6.8%
Cap rate
1.1%
Rent to Value Ratio
Active
$595,000
3
bds
|
4
ba
|
2,724
sqft
|
built
2014
15531 Long Farm Rd, Baton Rouge, LA 70817
$-449
Cash flow
-3.9%
Cash-on-Cash Return
4.8%
Cap rate
0.6%
Rent to Value Ratio
Active
$774,900
4
bds
|
4
ba
|
2,774
sqft
|
built
2015
8624 Billiu St, Baton Rouge, LA 70817
$-1,576
Cash flow
-10.6%
Cash-on-Cash Return
3.2%
Cap rate
0.4%
Rent to Value Ratio
Active
$24,995
3
bds
|
1
ba
|
1,015
sqft
|
built
1975
5348 E Brookstown Dr, Baton Rouge, LA 70805
$621
Cash flow
28.9%
Cash-on-Cash Return
29.8%
Cap rate
3.6%
Rent to Value Ratio