East Baton Rouge Parish County Investment Properties for Sale
Browse homes for sale and investment properties in East Baton Rouge Parish County. Refine your search by price, property type, or more.
Best cash flowing properties in East Baton Rouge Parish County

Active
$12,500
2
bds
|
1
ba
|
700
sqft
|
built
1974
5169 Annette St, Baton Rouge, LA 70805
$759
Cash flow
70.7%
Cash-on-Cash Return
72.9%
Cap rate
8.8%
Rent to Value Ratio
Active
$143,000
3
bds
|
1
ba
|
1,412
sqft
|
built
1954
2635 79th Ave, Baton Rouge, LA 70807
$427
Cash flow
15.6%
Cash-on-Cash Return
9.3%
Cap rate
1.1%
Rent to Value Ratio
878 out of 885 properties for sale in East Baton Rouge Parish County
Limited Results Shown
Create a free account, or log in to reveal all property listings and enjoy the complete experience.
Active
$695,500
5
bds
|
5
ba
|
4,601
sqft
|
built
1990
16510 E Coliseum Ave, Baton Rouge, LA 70816
$-807
Cash flow
-6.1%
Cash-on-Cash Return
4.3%
Cap rate
0.5%
Rent to Value Ratio
Active
$159,000
4
bds
|
2
ba
|
1,470
sqft
|
built
1960
2204 S Brock Pl, Baton Rouge, LA 70807
$145
Cash flow
4.8%
Cash-on-Cash Return
6.8%
Cap rate
0.8%
Rent to Value Ratio

Active
$238,000
3
bds
|
2
ba
|
1,400
sqft
|
built
2006
15070 Cranbrook Ct, Baton Rouge, LA 70819
$105
Cash flow
2.3%
Cash-on-Cash Return
6.2%
Cap rate
0.8%
Rent to Value Ratio
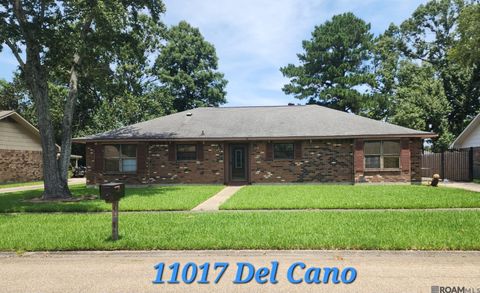
Active
$285,000
4
bds
|
3
ba
|
2,548
sqft
|
built
1978
11017 Del Cano Ave, Baton Rouge, LA 70816
$376
Cash flow
6.9%
Cash-on-Cash Return
7.3%
Cap rate
0.9%
Rent to Value Ratio

Active
$165,000
3
bds
|
2
ba
|
1,515
sqft
|
built
1985
11544 Ellen Dr, Baton Rouge, LA 70811
$323
Cash flow
10.2%
Cash-on-Cash Return
8.0%
Cap rate
1.0%
Rent to Value Ratio
Active
$250,000
3
bds
|
2
ba
|
1,600
sqft
|
built
1986
7151 Dyer Rd, Baker, LA 70714
$-286
Cash flow
-6.0%
Cash-on-Cash Return
4.3%
Cap rate
0.5%
Rent to Value Ratio
Active
$210,000
4
bds
|
2
ba
|
1,832
sqft
|
built
1974
6208 Clermont St, Baker, LA 70714
$-97
Cash flow
-2.4%
Cash-on-Cash Return
5.1%
Cap rate
0.6%
Rent to Value Ratio

Active
$599,900
4
bds
|
3
ba
|
2,679
sqft
|
built
2012
3546 Rue D Orleans, Baton Rouge, LA 70810
$-848
Cash flow
-7.4%
Cash-on-Cash Return
4.0%
Cap rate
0.5%
Rent to Value Ratio

Active
$257,500
3
bds
|
2
ba
|
1,988
sqft
|
built
1979
4426 Lassen Dr, Baton Rouge, LA 70814
$161
Cash flow
3.3%
Cash-on-Cash Return
6.4%
Cap rate
0.8%
Rent to Value Ratio
Active
$194,999
3
bds
|
2
ba
|
1,467
sqft
|
built
2006
809 Summer Breeze Dr, Baton Rouge, LA 70810
$-129
Cash flow
-3.5%
Cash-on-Cash Return
4.9%
Cap rate
0.8%
Rent to Value Ratio
Active
$895,000
6
bds
|
6
ba
|
4,308
sqft
|
built
2010
2555 N Turnberry Ave, Zachary, LA 70791
$-1,876
Cash flow
-10.9%
Cash-on-Cash Return
3.2%
Cap rate
0.4%
Rent to Value Ratio
Active
$304,000
4
bds
|
2
ba
|
1,705
sqft
|
built
1983
2030 W George St, Zachary, LA 70791
$79
Cash flow
1.4%
Cash-on-Cash Return
6.0%
Cap rate
0.7%
Rent to Value Ratio

Active
$139,000
3
bds
|
2
ba
|
850
sqft
|
built
1960
2854 Yazoo St, Baton Rouge, LA 70808
$170
Cash flow
6.4%
Cash-on-Cash Return
7.1%
Cap rate
0.9%
Rent to Value Ratio

Active
$570,500
3
bds
|
4
ba
|
2,690
sqft
|
built
1930
2174 Wisteria St, Baton Rouge, LA 70806
$-492
Cash flow
-4.5%
Cash-on-Cash Return
4.6%
Cap rate
0.6%
Rent to Value Ratio
Active
$584,800
3
bds
|
3
ba
|
2,279
sqft
|
built
2020
1647 Rose Glen Ln, Baton Rouge, LA 70810
$-667
Cash flow
-6.0%
Cash-on-Cash Return
4.3%
Cap rate
0.5%
Rent to Value Ratio

Active
$89,900
2
bds
|
1
ba
|
640
sqft
|
built
1950
1351 W Roosevelt St, Baton Rouge, LA 70802
$196
Cash flow
11.4%
Cash-on-Cash Return
8.3%
Cap rate
1.0%
Rent to Value Ratio
Active
$735,000
3
bds
|
3
ba
|
2,685
sqft
|
built
1999
1650 Cameron Ave, Baton Rouge, LA 70806
$-787
Cash flow
-5.6%
Cash-on-Cash Return
4.4%
Cap rate
0.5%
Rent to Value Ratio

Active
$160,000
4
bds
|
2
ba
|
1,600
sqft
|
built
1989
1915 Tennessee St, Baton Rouge, LA 70802
$2
Cash flow
0.1%
Cash-on-Cash Return
5.7%
Cap rate
0.7%
Rent to Value Ratio

Active
$2,349,000
3
bds
|
3
ba
|
3,186
sqft
|
built
2003
16056 Highland Bluff Ct, Baton Rouge, LA 70810
$-6,790
Cash flow
-15.1%
Cash-on-Cash Return
2.2%
Cap rate
0.3%
Rent to Value Ratio
Active
$500,000
4
bds
|
3
ba
|
2,286
sqft
|
built
2006
15505 Espirit Dr, Baton Rouge, LA 70810
$282
Cash flow
2.9%
Cash-on-Cash Return
6.4%
Cap rate
0.8%
Rent to Value Ratio
Active
$369,500
5
bds
|
3
ba
|
2,950
sqft
|
built
1974
1233 Ashbourne Dr, Baton Rouge, LA 70815
$45
Cash flow
0.6%
Cash-on-Cash Return
5.8%
Cap rate
0.7%
Rent to Value Ratio
Active
$289,900
4
bds
|
3
ba
|
2,502
sqft
|
built
1981
13456 Cedar Ridge Ave, Baton Rouge, LA 70817
$146
Cash flow
2.6%
Cash-on-Cash Return
6.3%
Cap rate
0.8%
Rent to Value Ratio
Active
$725,000
4
bds
|
4
ba
|
3,481
sqft
|
built
2004
3018 Tradition Ave, Baton Rouge, LA 70810
$-468
Cash flow
-3.4%
Cash-on-Cash Return
4.9%
Cap rate
0.6%
Rent to Value Ratio

Active
$280,000
3
bds
|
2
ba
|
1,615
sqft
|
built
1996
3978 Meadow Ridge Dr, Baton Rouge, LA 70817
$-98
Cash flow
-1.8%
Cash-on-Cash Return
5.3%
Cap rate
0.6%
Rent to Value Ratio
Active
$1,075,000
4
bds
|
3
ba
|
3,408
sqft
|
built
1983
17929 Cascades Ave, Baton Rouge, LA 70810
$-1,912
Cash flow
-9.3%
Cash-on-Cash Return
3.5%
Cap rate
0.5%
Rent to Value Ratio

Active
$254,900
3
bds
|
3
ba
|
1,830
sqft
|
built
1978
5943 Tee Dr, Zachary, LA 70791
$381
Cash flow
7.8%
Cash-on-Cash Return
7.5%
Cap rate
0.9%
Rent to Value Ratio
Active
$235,000
3
bds
|
2
ba
|
1,450
sqft
|
built
1990
17725 Nine Oaks Ave, Baton Rouge, LA 70817
$-8
Cash flow
-0.2%
Cash-on-Cash Return
5.6%
Cap rate
0.7%
Rent to Value Ratio
Active
$385,000
4
bds
|
3
ba
|
2,565
sqft
|
built
1980
16723 Buckner Dr, Greenwell Springs, LA 70739
$41
Cash flow
0.6%
Cash-on-Cash Return
5.8%
Cap rate
0.7%
Rent to Value Ratio

Active
$499,900
3
bds
|
2
ba
|
2,027
sqft
|
built
1949
418 Kenwood Ave, Baton Rouge, LA 70806
$-572
Cash flow
-6.0%
Cash-on-Cash Return
4.3%
Cap rate
0.5%
Rent to Value Ratio
Active
$230,000
3
bds
|
2
ba
|
1,550
sqft
|
built
1980
2128 Elkwood Ave, Baton Rouge, LA 70816
$16
Cash flow
0.4%
Cash-on-Cash Return
5.8%
Cap rate
0.7%
Rent to Value Ratio

Active
$279,900
2
bds
|
1
ba
|
1,384
sqft
|
built
1920
614 Europe St, Baton Rouge, LA 70802
$55
Cash flow
1.0%
Cash-on-Cash Return
5.9%
Cap rate
0.7%
Rent to Value Ratio

Active
$995,000
4
bds
|
4
ba
|
4,723
sqft
|
built
1979
8753 W Fairway Dr, Baton Rouge, LA 70809
$-914
Cash flow
-4.8%
Cash-on-Cash Return
4.6%
Cap rate
0.6%
Rent to Value Ratio
Active
$599,900
4
bds
|
4
ba
|
2,773
sqft
|
built
2007
3005 Rue D Orleans, Baton Rouge, LA 70810
$-572
Cash flow
-5.0%
Cash-on-Cash Return
4.5%
Cap rate
0.6%
Rent to Value Ratio
Active
$2,000,000
5
bds
|
4
ba
|
4,386
sqft
|
built
2007
14247 Blackwater Rd, Baker, LA 70714
$-4,497
Cash flow
-11.7%
Cash-on-Cash Return
3.0%
Cap rate
0.4%
Rent to Value Ratio

Active
$1,048,000
4
bds
|
4
ba
|
3,809
sqft
|
built
1991
17627 Masters Pointe Ct, Baton Rouge, LA 70810
$-1,707
Cash flow
-8.5%
Cash-on-Cash Return
3.7%
Cap rate
0.5%
Rent to Value Ratio
Active
$434,900
4
bds
|
3
ba
|
2,488
sqft
|
built
1978
7726 Lew Hoad Ave, Baton Rouge, LA 70810
$-130
Cash flow
-1.6%
Cash-on-Cash Return
5.3%
Cap rate
0.6%
Rent to Value Ratio

Active
$295,000
3
bds
|
2
ba
|
1,876
sqft
|
built
2006
6900 Lakeland Dr, Zachary, LA 70791
$72
Cash flow
1.3%
Cash-on-Cash Return
6.0%
Cap rate
0.7%
Rent to Value Ratio

Active
$1,630,000
5
bds
|
6
ba
|
5,179
sqft
|
built
2005
2611 Cedar Lodge Dr, Baton Rouge, LA 70809
$-3,023
Cash flow
-9.7%
Cash-on-Cash Return
3.5%
Cap rate
0.4%
Rent to Value Ratio