Orleans Parish County Investment Properties for Sale
Browse homes for sale and investment properties in Orleans Parish County. Refine your search by price, property type, or more.
Best cash flowing properties in Orleans Parish County
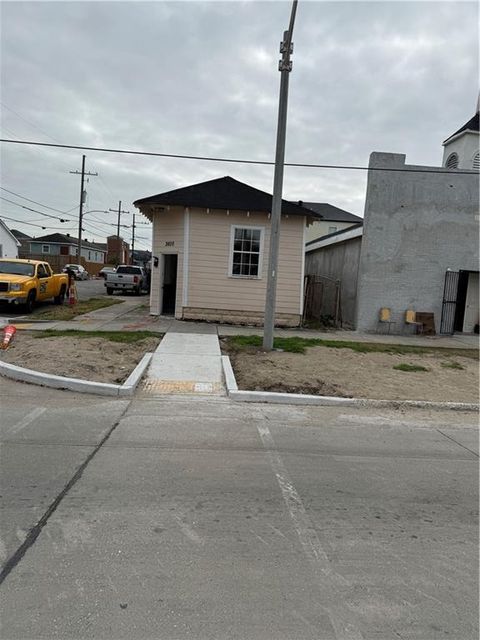
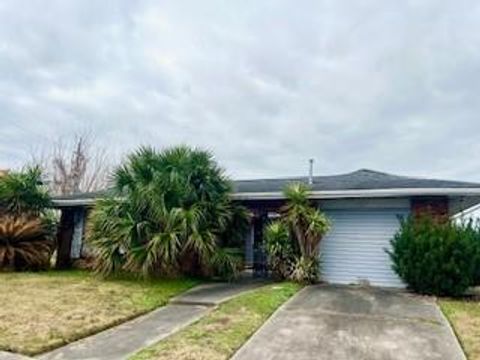
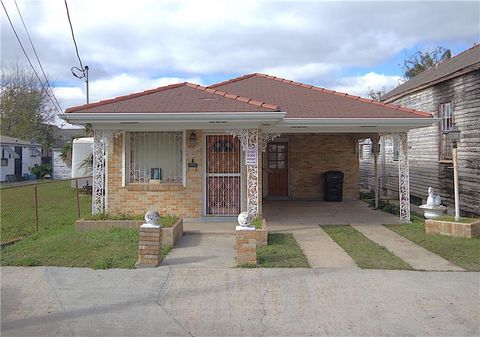
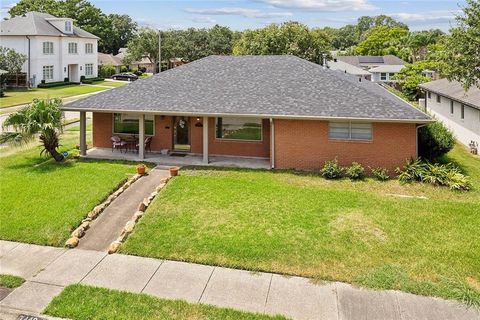
Active
$99,000
3
bds
|
1
ba
|
1,131
sqft
|
built
1975
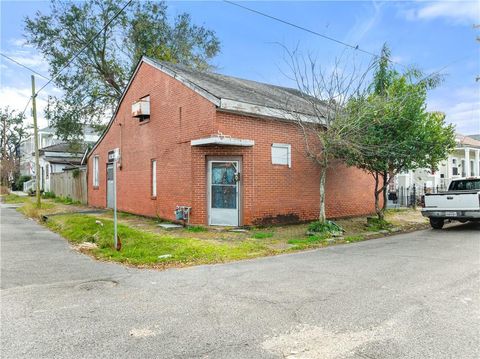
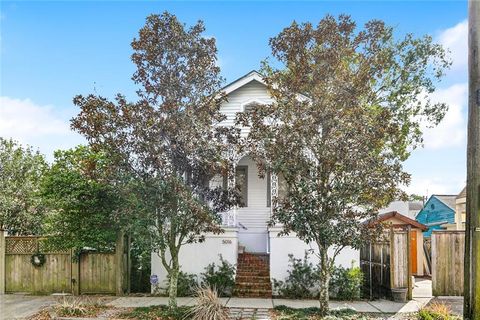
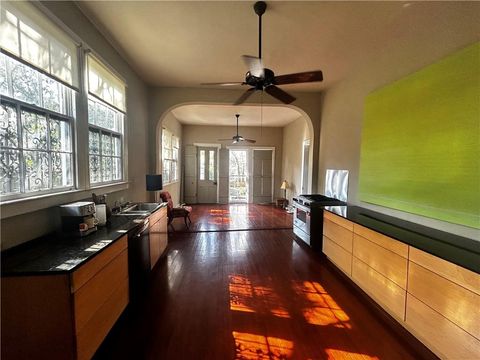
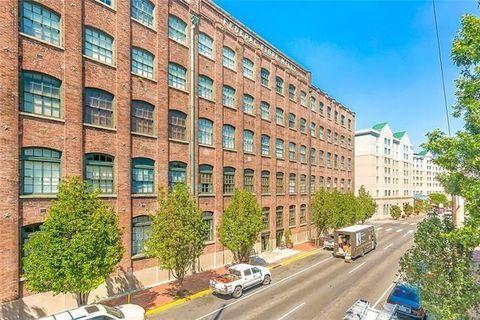
2600 S Galvez St, New Orleans, LA 70125
$911
Cash flow
48.0%
Cash-on-Cash Return
16.7%
Cap rate
2.0%
Rent to Value Ratio
Active
$115,000
4
bds
|
2
ba
|
2,127
sqft
|
built
2005
7825 Vanderkloot Ave, New Orleans, LA 70127
$698
Cash flow
31.7%
Cash-on-Cash Return
13.0%
Cap rate
1.6%
Rent to Value Ratio
1,203 out of 1,209 properties for sale in Orleans Parish County
Limited Results Shown
Create a free account, or log in to reveal all property listings and enjoy the complete experience.
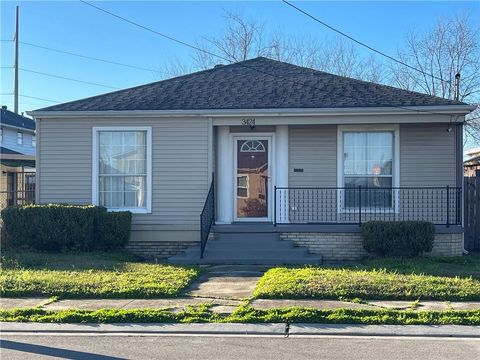
Active
$205,000
2
bds
|
3
ba
|
1,491
sqft
|
built
1952
3424 Camphor St, New Orleans, LA 70118
$272
Cash flow
6.9%
Cash-on-Cash Return
7.3%
Cap rate
0.9%
Rent to Value Ratio
Active
$285,000
4
bds
|
3
ba
|
2,900
sqft
|
built
1993
4236 S Roman St, New Orleans, LA 70125
$169
Cash flow
3.1%
Cash-on-Cash Return
6.4%
Cap rate
0.8%
Rent to Value Ratio
Active
$455,000
4
bds
|
5
ba
|
2,713
sqft
|
built
1940
5116 Franklin Ave, New Orleans, LA 70122
$-428
Cash flow
-4.9%
Cash-on-Cash Return
4.5%
Cap rate
0.5%
Rent to Value Ratio
Active
$125,000
3
bds
|
2
ba
|
1,030
sqft
|
built
1951
3221 N Miro St, New Orleans, LA 70117
$581
Cash flow
24.3%
Cash-on-Cash Return
11.3%
Cap rate
1.4%
Rent to Value Ratio
Active
$335,000
1
bds
|
1
ba
|
951
sqft
|
built
2021
900 Bartholomew St, New Orleans, LA 70117
$-343
Cash flow
-5.3%
Cash-on-Cash Return
4.4%
Cap rate
0.5%
Rent to Value Ratio
Active
$238,000
1
bds
|
1
ba
|
650
sqft
|
built
1958
4007 Saint Charles Ave, New Orleans, LA 70115
$-22
Cash flow
-0.5%
Cash-on-Cash Return
5.6%
Cap rate
0.7%
Rent to Value Ratio
Active
$375,000
2
bds
|
1
ba
|
1,075
sqft
|
built
1945
2500 Saint Thomas St, New Orleans, LA 70130
$-602
Cash flow
-8.4%
Cash-on-Cash Return
3.8%
Cap rate
0.5%
Rent to Value Ratio
Active
$859,000
2
bds
|
3
ba
|
2,114
sqft
|
built
1829
1404 Prytania St, New Orleans, LA 70130
$-1,305
Cash flow
-7.9%
Cash-on-Cash Return
3.9%
Cap rate
0.5%
Rent to Value Ratio
Active
$255,000
3
bds
|
2
ba
|
1,752
sqft
|
built
2004
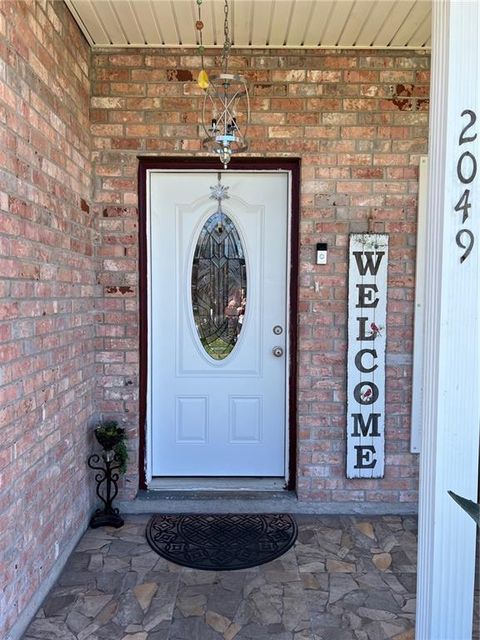
2049 Halsey Ave, New Orleans, LA 70114
$311
Cash flow
6.4%
Cash-on-Cash Return
7.1%
Cap rate
0.9%
Rent to Value Ratio
Active
$1,100,000
7
bds
|
4
ba
|
2,946
sqft
|
built
1941
6021 Tchoupitoulas St, New Orleans, LA 70118
$-3,274
Cash flow
-15.5%
Cash-on-Cash Return
2.1%
Cap rate
0.3%
Rent to Value Ratio
Active
$179,000
3
bds
|
2
ba
|
1,864
sqft
|
built
1972
4510 Read Blvd, New Orleans, LA 70127
$395
Cash flow
11.5%
Cash-on-Cash Return
8.3%
Cap rate
1.0%
Rent to Value Ratio
Active
$289,000
6
bds
|
0
ba
|
2,016
sqft
|
built
1970
3016 Hamilton St, New Orleans, LA 70118
$150
Cash flow
2.7%
Cash-on-Cash Return
6.3%
Cap rate
0.8%
Rent to Value Ratio
Active
$1,150,000
12
bds
|
10
ba
|
7,092
sqft
|
built
1920
1722 Esplanade Ave, New Orleans, LA 70116
$-3,924
Cash flow
-17.8%
Cash-on-Cash Return
1.6%
Cap rate
0.2%
Rent to Value Ratio
Active
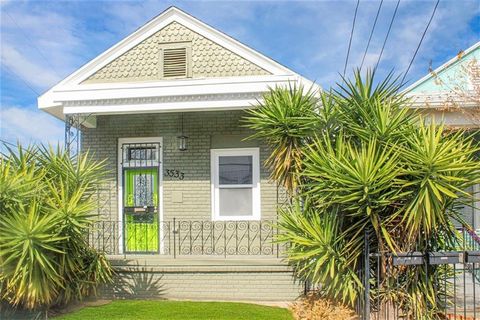
$99,000
3
bds
|
3
ba
|
1,090
sqft
|
built
1985
3411 Vespasian Blvd, New Orleans, LA 70114
$635
Cash flow
33.5%
Cash-on-Cash Return
13.4%
Cap rate
1.6%
Rent to Value Ratio
Active
$4,875,000
3
bds
|
6
ba
|
9,962
sqft
|
built
1957
5 Bamboo Rd, New Orleans, LA 70124
$-20,586
Cash flow
-22.0%
Cash-on-Cash Return
0.6%
Cap rate
0.1%
Rent to Value Ratio
Active
$325,000
3
bds
|
2
ba
|
1,666
sqft
|
built
1941
3533 S Liberty St, New Orleans, LA 70115
$187
Cash flow
3.0%
Cash-on-Cash Return
6.4%
Cap rate
0.8%
Rent to Value Ratio
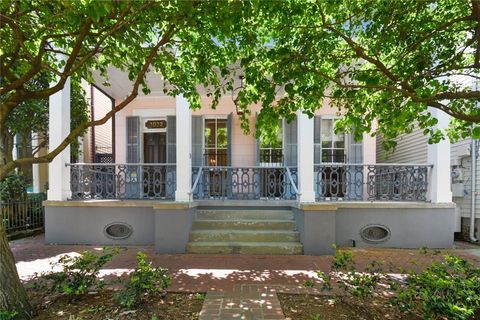
Active
$315,000
2
bds
|
1
ba
|
851
sqft
|
built
1831
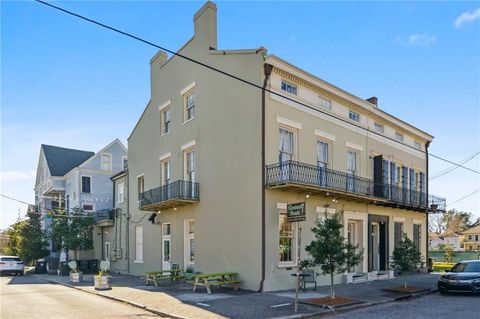
1224 Bourbon St, New Orleans, LA 70116
$27
Cash flow
0.4%
Cash-on-Cash Return
5.8%
Cap rate
0.7%
Rent to Value Ratio
Active
$249,999
3
bds
|
2
ba
|
1,853
sqft
|
built
1966
1751 Holiday Dr, New Orleans, LA 70114
$59
Cash flow
1.2%
Cash-on-Cash Return
6.0%
Cap rate
0.7%
Rent to Value Ratio
Active
$222,499
1
bds
|
1
ba
|
545
sqft
|
built
1940
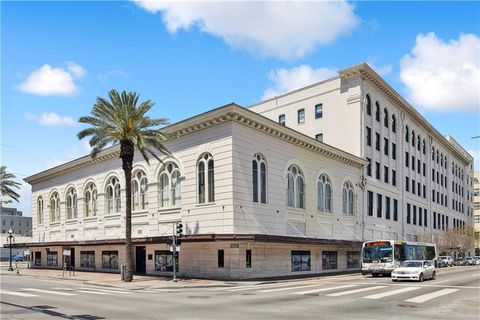
1201 Canal St, New Orleans, LA 70112
$189
Cash flow
4.4%
Cash-on-Cash Return
6.7%
Cap rate
0.8%
Rent to Value Ratio

Active
$165,000
2
bds
|
2
ba
|
1,686
sqft
|
built
1943
8124 Forshey St, New Orleans, LA 70118
$461
Cash flow
14.6%
Cash-on-Cash Return
9.0%
Cap rate
1.1%
Rent to Value Ratio
Active
$525,000
3
bds
|
4
ba
|
1,800
sqft
|
built
1923
5016 Camp St, New Orleans, LA 70115
$-69
Cash flow
-0.7%
Cash-on-Cash Return
5.5%
Cap rate
0.7%
Rent to Value Ratio
Active
$375,000
2
bds
|
2
ba
|
1,487
sqft
|
built
1940
8118 Birch St, New Orleans, LA 70118
$88
Cash flow
1.2%
Cash-on-Cash Return
6.0%
Cap rate
0.7%
Rent to Value Ratio
Active
$500,000
3
bds
|
0
ba
|
3,616
sqft
|
built
1913
137 S Scott St, New Orleans, LA 70119
$-1,262
Cash flow
-13.2%
Cash-on-Cash Return
2.6%
Cap rate
0.3%
Rent to Value Ratio
Active
$199,000
3
bds
|
1
ba
|
810
sqft
|
built
1960
1330 Independence St, New Orleans, LA 70117
$162
Cash flow
4.2%
Cash-on-Cash Return
6.7%
Cap rate
0.8%
Rent to Value Ratio
Active
$790,000
5
bds
|
4
ba
|
3,186
sqft
|
built
2007
132 Pine Valley Dr, New Orleans, LA 70131
$-445
Cash flow
-2.9%
Cash-on-Cash Return
5.0%
Cap rate
0.6%
Rent to Value Ratio
Active
$138,000
6
bds
|
1
ba
|
1,601
sqft
|
built
1932
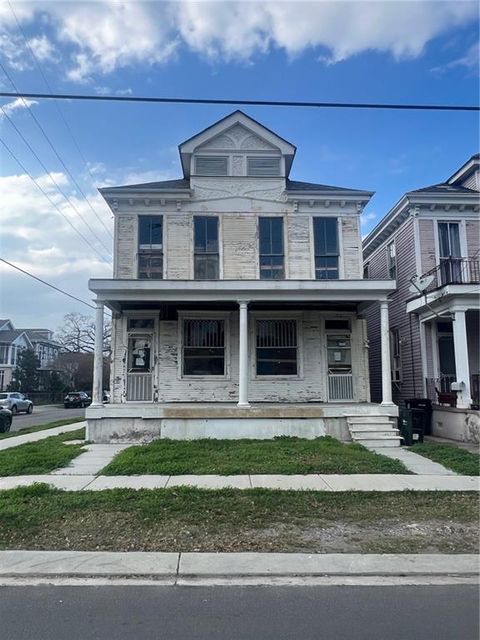
1561 N Roman St, New Orleans, LA 70116
$37
Cash flow
1.4%
Cash-on-Cash Return
6.0%
Cap rate
0.7%
Rent to Value Ratio
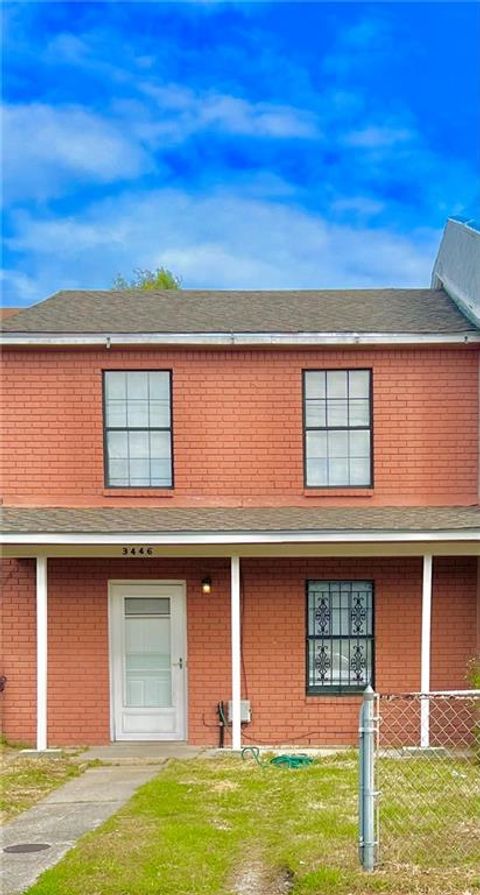
Active
$119,000
3
bds
|
0
ba
|
1,165
sqft
|
built
1992
3446 Vespasian Blvd, New Orleans, LA 70114
$541
Cash flow
23.7%
Cash-on-Cash Return
11.1%
Cap rate
1.3%
Rent to Value Ratio
Active
$439,000
3
bds
|
2
ba
|
2,043
sqft
|
built
1960
7440 Onyx St, New Orleans, LA 70124
$62
Cash flow
0.7%
Cash-on-Cash Return
5.8%
Cap rate
0.7%
Rent to Value Ratio
Active
$1,100,000
3
bds
|
2
ba
|
2,333
sqft
|
built
1897
1032 Esplanade Ave, New Orleans, LA 70116
$-1,411
Cash flow
-6.7%
Cash-on-Cash Return
4.1%
Cap rate
0.5%
Rent to Value Ratio
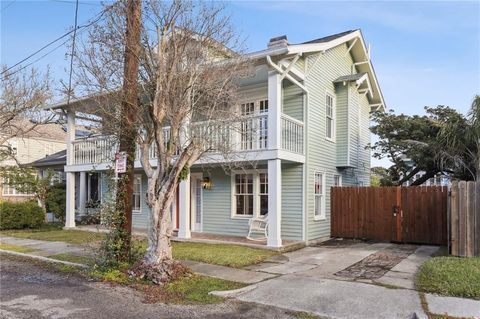
Active
$550,000
3
bds
|
4
ba
|
2,586
sqft
|
built
1830
833 Burgundy St, New Orleans, LA 70116
$-1,361
Cash flow
-12.9%
Cash-on-Cash Return
2.7%
Cap rate
0.3%
Rent to Value Ratio
Active
$599,900
3
bds
|
3
ba
|
1,806
sqft
|
built
1935
5817 Magnolia St, New Orleans, LA 70115
$-286
Cash flow
-2.5%
Cash-on-Cash Return
5.1%
Cap rate
0.6%
Rent to Value Ratio
Active
$799,000
3
bds
|
2
ba
|
2,248
sqft
|
built
1983
170 Walnut St, New Orleans, LA 70118
$-331
Cash flow
-2.2%
Cash-on-Cash Return
5.2%
Cap rate
0.6%
Rent to Value Ratio
Active
$230,000
3
bds
|
1
ba
|
1,358
sqft
|
built
1923
719 S Salcedo St, New Orleans, LA 70119
$154
Cash flow
3.5%
Cash-on-Cash Return
6.5%
Cap rate
0.8%
Rent to Value Ratio
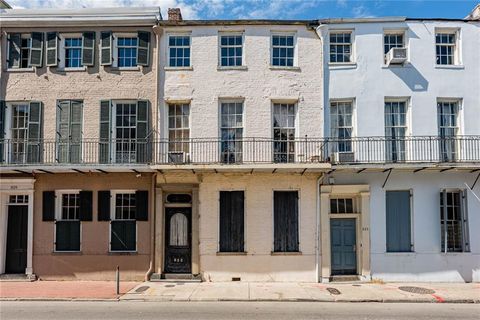
Active
$415,000
1
bds
|
1
ba
|
719
sqft
|
built
1823
538 Madison St, New Orleans, LA 70116
$-584
Cash flow
-7.3%
Cash-on-Cash Return
4.0%
Cap rate
0.5%
Rent to Value Ratio
Active
$2,950,000
27
bds
|
27
ba
|
15,054
sqft
|
built
1975
3135 Dauphine St, New Orleans, LA 70117
$-12,856
Cash flow
-22.7%
Cash-on-Cash Return
0.4%
Cap rate
0.1%
Rent to Value Ratio
Active
$279,000
1
bds
|
2
ba
|
984
sqft
|
built
1904
1107 S Peters St, New Orleans, LA 70130
$267
Cash flow
5.0%
Cash-on-Cash Return
6.8%
Cap rate
0.8%
Rent to Value Ratio
Active
$230,000
4
bds
|
2
ba
|
1,483
sqft
|
built
1955
3278 Desaix Blvd, New Orleans, LA 70119
$154
Cash flow
3.5%
Cash-on-Cash Return
6.5%
Cap rate
0.8%
Rent to Value Ratio
Active
$195,000
1
bds
|
1
ba
|
528
sqft
|
built
1844
2707 Chartres St, New Orleans, LA 70117
$43
Cash flow
1.2%
Cash-on-Cash Return
5.9%
Cap rate
0.7%
Rent to Value Ratio